Embed Size (px)
Citation preview
APPROVED: Shahla Alai-Rosales, Major Professor Jesus Rosales-Ruiz, Committee Member Traci M. Cihon, Committee Member Richard Smith, Chair of the Department of
Behavior Analysis Thomas Everson, Dean of the College of Public
Affairs and Community Service Mark Wardell, Dean of the Toulouse Graduate
School
A SCHOOLWIDE TIERED INTERVENTION FOR INCREASING FRUIT
AND VEGETABLE CONSUMPTION
Blanca L. Mendoza, B.A
Thesis Prepared for the Degree of
MASTER OF SCIENCE
UNIVERSITY OF NORTH TEXAS
December 2012
Mendoza, Blanca L., A Schoolwide Tiered Intervention for Increasing Fruit and
Vegetable Consumption. Master of Science (Behavior Analysis), December 2012, 50 pp., 6
figures, references, 27 titles.
Childhood obesity rates in the U.S. are increasing. Increasing intake of fruits and
vegetables is one method to combat obesity. The purpose of this study was to examine a tiered
approach to fruit and vegetable consumption with 26 children in an inclusive preschool. The
first tier included ongoing availability and opportunity to eat fruits and vegetables (exposure).
The second tier included programmed consequences (a reward system). A multiple baseline
across children and classrooms was used to evaluate the effect of the interventions. The tier one
intervention was effective for nine children and tier two was effective for six children. Eleven
children, however, did not respond to either condition. Results are discussed in the context of
previous research and tertiary interventions.

ii
Copyright 2012
By
Blanca L. Mendoza
iii
ACKNOWLEDGEMENTS
I would like to thank my advisor, Dr. Shahla Ala’i-Rosales, whose guidance, patience,
and support allowed me to complete this work. I would like to thank the entire faculty at the
Department of Behavior Analysis, especially Dr. Jesus Rosales-Ruiz and Dr. Traci Cihon for
their invaluable input and feedback in this process. In addition, I would like to thank Tammy
Cline-Soza and the Grace of a Miracle Scholarship. This study would not have been possible
without their generous financial support. Finally, I would like to thank my family for their love
and support throughout this process.

iv
TABLE OF CONTENTS
Page ACKNOWLEDGEMENTS ........................................................................................................... iii
LIST OF FIGURES .........................................................................................................................v
INTRODUCTION ...........................................................................................................................1
METHOD ........................................................................................................................................6
RESULTS ......................................................................................................................................10
DISCUSSION ................................................................................................................................18
APPENDICES ...............................................................................................................................32
REFERENCES ..............................................................................................................................47
v
LIST OF FIGURES
Page
1. Percentage of children who consumed combined fruits and vegetables ..................................26
2. Percentage of children who consumed fruits and vegetables ..................................................27
3. Number of children who responded to exposure, rewards, and number of children for whom there were no effects .....................................................................................................32
4. Portions of combined fruits and vegetables consumed for two participants in Classroom 1 ..................................................................................................................................................29
5. Portions of combined fruits and vegetables consumed for thee participants in Classroom 2 ..................................................................................................................................................30
6. Portions of combined fruits and vegetables consumed for three participants in Classroom 3 ..................................................................................................................................................31
1
INTRODUCTION
Over the past 20 years there has been an increase in obesity rates in the United States.
Currently, more than one-third of adults in the United States are obese. The problem, however, is
not simply with adults. Approximately 17% or 12.5 million children and adolescents in the U.S.
are obese. These rates have almost tripled since 1980 (Ogden, & Carroll, 2010). There are many
health risks associated with obesity and being overweight, including chronic diseases like high
blood pressure, high cholesterol and Type 2 diabetes (Ogden & Carroll, 2010; Blanchette &
Brug, 2005; Ebbeling, Pawlak, & Ludwig, 2002; Dehghan, Akhtar-Danesh, & Merchant, 2005).
These health risks can begin in childhood and develop into more serious problems like heart
disease, stroke, and certain types of cancer (Centers for Disease Control and Prevention [CDC],
2012).
Increasing the intake of low calorie foods like fruits and vegetables can be an effective
way to reduce the number of overweight and obese children and adults. This can be beneficial in
our society as children and adults in the U.S. do not consume the recommended amounts of fruits
and vegetables (United States Department of Agriculture [USDA], 2011). The suggested daily
amounts of fruits and vegetables differ depending on age and sex. The USDA through their
Choose My Plate program, provides charts with the recommended amounts for all food groups
(USDA, 2011). According to these charts children between the ages of two and eight should
consume one to one and a half cups of fruit and vegetables every day. Adult recommendations
range from two to three cups of both fruits and vegetables a day. Statistics of daily intake of
fruits and vegetables are variable. Some sources estimate that only 40% of the U.S. population
ate the daily recommended amount of fruits and vegetables each day between 1996 and 2000
(Guenther, Dodd, Reedy, & Krebs-Smith, 2006). The USDA and the U. S. Department of Health
2
and Human Services (HHS) estimate that in 2009 only 32.5% of the adult population ate fruit
two or more times a day and only 26.3% ate vegetables. These numbers have not changed since
2000 and vary by state (USDA & HHS, 2010). The USDA and HHS state in the current dietary
guidelines that many children and adults have a regular dietary intake that exceeds the
recommended daily amount of calories. Many children and adults also eat less fruits and
vegetables than recommended to maintain a healthy body weight (USDA & HHS, 2010). In fact,
almost all Americans eat less than the recommended amount of fruits and vegetables and more
than half of the fruit consumed in the U.S. is in the form of juice (USDA & HHS, 2010).
The USDA and the HHS (2010) provide three reasons for the importance of increasing
the intake of fruits and vegetables. First, fruits and vegetables are a major source of nutrients
(i.e., folate, magnesium, potassium, dietary fiber, and vitamins A, C, and K) that are
underconsumed in the United States. Second, intake of fruits and vegetables is associated with
reduced risks of chronic diseases like cardiovascular disease and cancer. Third, fruits and
vegetables are low in calories and therefore their intake can help achieve and maintain a healthy
body weight (USDA & HHS, 2010). Because eating fruits and vegetables is essential to healthy
living, it is important to increase their intake at an early age.
We can achieve an increase in consumption of fruits and vegetables using different
interventions. These interventions should focus on the differences of the individuals who will be
part of the intervention. For some individuals the intake of fruits and vegetables may be
influenced by access or availability (Blanchette & Brug, 2005). Access and availability affect the
chances of contacting and eating the foods. If individuals are not able to contact the food they
will also not be able to contact possible reinforcers associated with eating the foods. For other
individuals the intake of fruits and vegetables may be influenced socially by peers and parents
3
(Rasmussen et al., 2006). Social influences can create histories of reinforcement that may affect
the amount and variety of fruits and vegetables a child will eat. For some children food
selectivity may also affect whether or not they eat fruits and vegetables. Food selectivity is
characterized by the consumption of a limited variety of foods and the rejection of novel foods
(Levin & Carr, 2001). This is especially problematic for children with developmental disabilities
(Munk & Repp, 1994). Although food selectivity may be common in young children, it is more
common in children with developmental disabilities and it can become a problem when it begins
to affect food intake and nutrition (Levin & Carr, 2001). Different variables may affect what a
child eats. Because of this, the interventions used must be flexible.
Because children will respond differently to different interventions, we must look at
interventions that can be modified to change behavior in more children. We can follow some of
the guidelines provided by the response to intervention (RTI) model. RTI is a tiered model that
has been used in educational systems and allows for the adjustment of interventions based on the
individual (Phaneuf & McIntyre, 2011). Individuals who need little intervention to make
improvement receive the first level of intervention, which is usually less intensive than the next
levels. This may allow for resources to be used on individuals who need a more intensive or
individualized intervention (Phaneuf & McIntyre, 2011). In this model, individuals first receive
an intervention that is “generally effective.” Those who do not respond to this general
intervention receive a more individualized intervention. Finally, those who still do not respond
are evaluated and receive further help in more intensive ways (Fuchs, Mock, Morgan, & Young,
2003). Individual progress is monitored in every phase to determine which individuals require
more help. This tiered model may be used to develop interventions to increase consumption of
fruits and vegetables. Some children will only need the first level of intervention, but some
4
children may need second and third levels, characterized by more individualized and intensive
intervention.
Some interventions have been developed in an effort to increase the intake of fruits and
vegetables with young children. One of these interventions is the opportunity to contact the food
(exposure). Wardle, Herrera, Cooke, and Gibson (2003) combined the opportunity to contact
unfamiliar vegetables with the presentation of programmed consequences (a reward) in an
attempt to increase the intake of fruits and vegetables. Their results showed that the opportunity
to contact unfamiliar vegetables was enough to produce increases in intake of unfamiliar
vegetables. Their results also showed that programmed consequences produced an increase in
intake of the unfamiliar vegetables, but that programmed consequences were not as effective as
opportunity alone. These results suggest that the food alone may have been a reinforcer and all
that was needed was the opportunity to contact the food. Wardle, Herrera, et al. (2003) explained
that although the rewards may not have been as effective as the presentation of the food alone
they did have two advantages. The programmed consequences increased initial consumption
which allowed the children to come into contact with the potentially reinforcing taste of the food.
In another study, Wardle, Cooke, et al. (2003) also used the opportunity to contact the
food as an intervention. They compared a group in which parents presented their children with
the opportunity to contact new vegetables for 14 days with two other groups. One group received
information about fruits and vegetables and their benefits and the other was a control group who
received no intervention. Wardle, Cooke, et al. reported increases in intake of the target
vegetables from the children who had the opportunity to contact the vegetables. These results
suggest that food alone can be a reinforcer and no additional programmed consequences may be
needed to increase consumption of new vegetables.

5
Although Wardle, Herrera, et al. (2003) and Wardle, Cooke, et al. (2003), published
results showing that opportunity to contact new foods could be an effective intervention to
increase the intake of fruits and vegetables, others have shown different results. A group of
researchers in the United Kingdom (Lowe, Horne, Tapper, Bowdery, & Egerton, 2004; Horne et
al., 2004; Horne et al., 2011) used a combination of peer modeling, programmed consequences
(rewards), and the opportunity to contact the foods to increase the intake of fruits and vegetables.
Their results showed that programmed consequences and peer modeling were the variables that
produced changes in the consumption of fruits and vegetables. The opportunity to contact the
fruits and vegetables did not increase consumption which may mean that the fruits and
vegetables alone were not reinforcing. In these studies the authors also discussed that the
opportunity to contact the foods actually decreased the intake of fruits and vegetables during
baseline. These conclusions suggest that the foods were not a reinforcer and that the foods may
have in some way punished the consumption of fruits and vegetables during baseline.
The literature shows conflicting results about whether or not the opportunity to contact
food alone can increase the consumption of new or less preferred foods. The purpose of this
study was to use a tiered model to evaluate if an intervention based on giving the opportunity to
contact fresh fruits and vegetables in isolation would be generally effective in increasing their
intake. This study also evaluated whether a second tier intervention based on programmed
consequences would produce an increase in consumption of fresh fruits and vegetables with
those children for whom the opportunity was not enough to create a change in responding.

6
METHOD
Setting
The study was conducted at the Texas Star Academy (TSA), a replication of the Walden
Early Childhood Center. It is an inclusive preschool for children with and without developmental
disabilities. Three of the four classrooms participated in the study; Classroom 1 (5-6 years),
Classroom 2 (4-5 years), and Classroom 3 (2 ½-4 years). The study was conducted Monday
through Friday during morning snack which lasted 15 minutes for each classroom. Teachers
served the snacks upon request to the students in Classroom 3. The students in Classrooms 1 and
2 served themselves from containers on the table.
Participants
The experimenter distributed parental consent forms to 33 children and their families at
TSA. Of the 33 children, 29 received parental consent to participate in the study. The children
were aged between 2½ and 6 years and included children with and without developmental
disabilities. Six of the participants showed some form of food selectivity. This information was
displayed in each classroom in a sheet with participant’s initials. The sheet contained information
about specific diets, allergies, and lists of foods each child would eat.
Materials
A flyer (Appendix A) with information about the study was placed near the student sign-
in sheet in the front lobby of the preschool. The flyer provided information about the study and
gave the dates when the experimenter would be in the preschool to discuss the study and
distribute parent consent forms (Appendix B). A consent form and a flyer were sent home with
the children who were not present the day the experimenter met with the parents. Other materials
included data collection sheets (Appendix C), fresh fruits (Appendix D) and vegetables

7
(Appendix E), portion cups, and rewards for the students (Appendix F). The experimenter
purchased the fruits and vegetables for the study. The fruits used for the study were fresh
oranges, grapes, bananas, and apples. The vegetables used for the study were fresh carrots,
broccoli, green beans, cucumbers, and tomatoes. The experimenter purchased and brought them
to the center every other day and prepared them according to the preschool guidelines for snack.
The programmed consequences (rewards) for the children included stickers in the shapes of
fruits and vegetables and silly bands in various fruit shapes. In addition, each classroom
included two tables with 4-8 chairs each (Appendix G). Each table was arranged before snack
with a paper towel for each student, snack containers with various snacks, and water. For snack,
the preschool provided one or two crunchy foods (e.g., chips, graham crackers, rice cakes, etc.)
and either a fruit or a vegetable. The vegetable usually consisted of fresh carrots and the fruit
usually consisted of canned fruit.
Measurement and Interobserver Reliability
In this study we measured consumption of fruits and vegetables. Consumption was
defined as the intake of any amount of fruit and vegetable. Consumption was measured on a 3
point scale of volume (0%, 50%, or 100%) similar to the one used in previous studies (Lowe et
al., 2004; Horne et al., 2004; Horne et al., 2011). In this scale 0% represented no intake, and
100% represented intake of a whole portion of fruits or vegetables. According to the USDA,
children between the ages of 2 and 8 should eat between 1 cup and 1½ cups of fruits and
vegetables a day (USDA, 2011). In this study 100% intake or 1 portion was equal to a quarter of
a cup of fruit or vegetable or a quarter of the daily recommended amount. Intake was recorded
only for children who ate half or more of their portion of fruits and vegetables. Recording was
done by graduate level student observers and TSA teachers. The observers used paper and pencil
8
procedures to record how much each child ate. Data collection was done throughout morning
snack time, between 9:45 am and 10:45 am. Each observer was briefed and trained on data
collection methods before data collection began. Interobserver agreement was calculated for 25%
of the data sets and was 97.67 %.
Procedures
Baseline
During baseline, the preschool provided daily snacks which usually consisted of two
crunchy foods and either a fruit or a vegetable. The teachers placed the snacks in the center of
each table in separate containers along with portion cups. Each child received a portion cup to
serve or be served their fruit or vegetable. The participants could consume as much or as little as
they wanted of these snacks. During baseline there were no programmed consequences for eating
fruits and vegetables.
Phase 1
Phase 1 was similar to baseline, the preschool provided a daily snack which usually
consisted of two crunchy foods and either a fruit or a vegetable. The teachers placed the snacks
in the center of each table in separate containers along with portion cups. In addition, the
experimenter provided each classroom with containers of fresh fruits and vegetables. The
containers of fresh fruits and vegetables were also placed in the center of the table. The
participants could consume as much or as little as they wanted of both the snacks provided by the
school and the fruits and vegetables provided by the experimenter. During Phase 1 there were no
programmed consequences for consuming fruits and vegetables.

9
Phase 2
The procedures in Phase 2 were the same as in Phase 1 with the addition of programmed
consequences. The teachers and observers monitored the participants and provided praise for
touching the fresh fruits and vegetables. The teachers and observers also provided praise and
stickers for consuming any amount of fruits and vegetables. The teachers and experimenters gave
each child a sticker when they took their first bite of the fresh fruits and vegetables. Each
participant received one sticker for consuming any amount of fruit and one sticker for consuming
any amount of vegetable. Those participants who consumed both fruits and vegetables also
received a silly band in the shape of a fruit. After the children received their second sticker they
were then given the choice of silly band. Participants who did not wish to eat fruits and
vegetables were not prompted to consume them and there were no other programmed
consequences for not eating the fruits and vegetables. They continued to have free access to all
of the snacks provided by both the preschool and the experimenter.
Experimental Design
A multiple baseline design across classrooms was used to examine the effects of the
opportunity to contact the fruits and vegetables and the programmed consequences on
consumption of fruits and vegetables. The data was summarized across classrooms and
conditions.

10
RESULTS
Two of the 29 children from Classroom 3 were absent for more than half of the
observation days and their data were not used for the overall results and one participant left the
school before the study began.
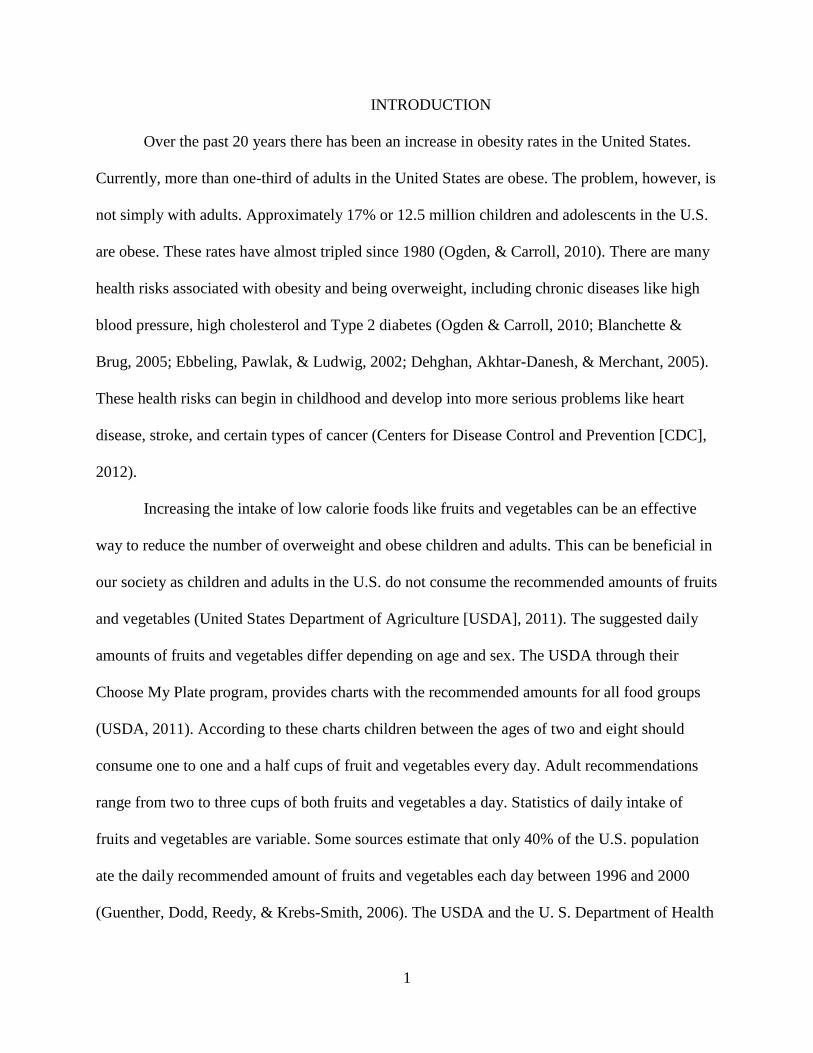
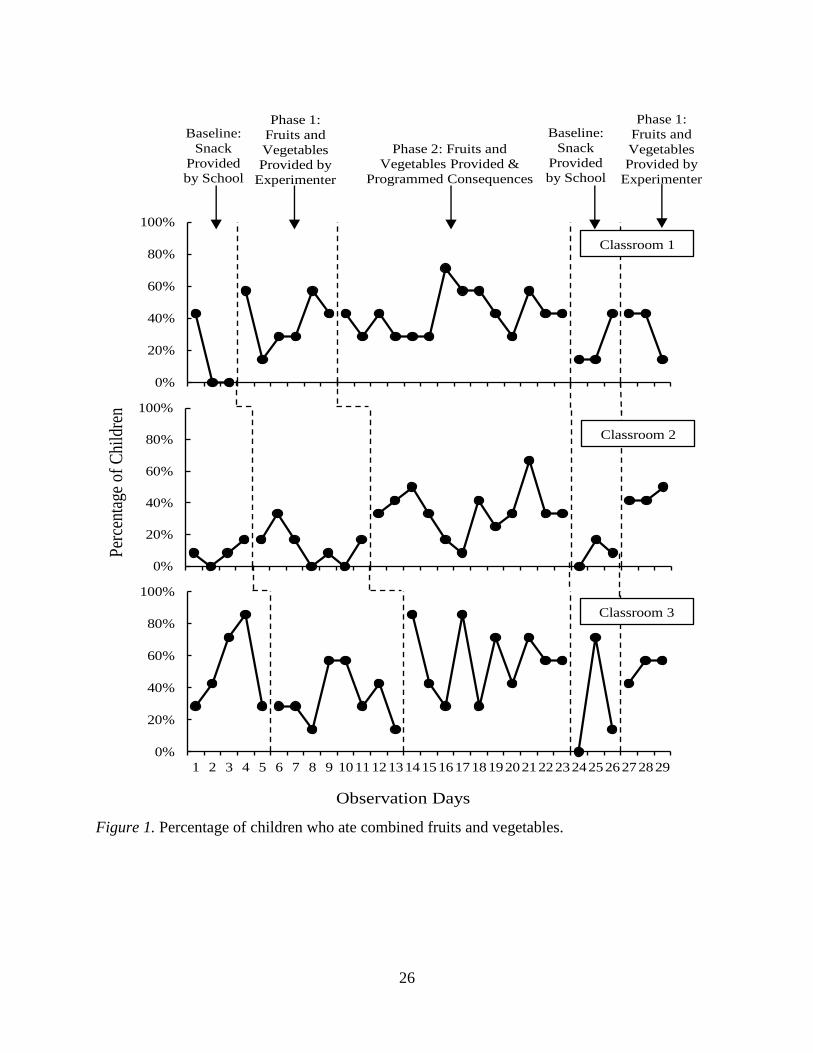
Figure 1 shows the overall results of the intervention across the three classrooms. It
displays the percentage of children in each classroom who ate fruits and vegetables. Intake of
fruits and vegetables is combined in this figure. The top graph in Figure 1 shows the results for
Classroom 1. On the first day of baseline when all the snack foods were provided by the
preschool over 42% of the children in Classroom 1 ate combined fruits and vegetables. On the
last two days of baseline the percentage of children eating combined fruits and vegetables
decreased and no children in this classroom ate fruits and vegetables. On the first day of Phase 1
there was an increase in consumption and 57% of children ate combined fruits and vegetables.
The percentage of children consuming fruits and vegetables decreased again in the second day of
Phase 1. After the second day of Phase 1 there was an increasing trend in the percentage of
children consuming fruits and vegetables for Classroom 1 and on the fifth day of Phase 1 57% of
children ate combined fruits and vegetables. After the introduction of Phase 2 there was a steady
state in the percentage of children eating fruits and vegetables for the first six days. On Day 7 of
Phase 2 there was an increase and about 72% of the children ate combined fruits and vegetables.
On Day 12 of Phase 2 the percentage of children eating fruits and vegetables increased again and
for the last two days of Phase 2 about 43% of children were eating combined fruits and
vegetables. After the introduction of baseline there was a decrease in the percentage of children
eating fruits and vegetables for the first two days of baseline. On the third day of baseline the
percentage of children eating fruits and vegetables increased again to about 43%. There were no
11
changes in the percentage of children eating fruits and vegetables during the first two days of
returning to Phase 1 and a decrease on the last day.
The middle graph in Figure 1 shows the results for Classroom 2. During baseline the
percentage of children consuming fruits and vegetables in Classroom 2 was steady with less than
10% of children eating combined fruits and vegetables during the first three days of baseline.
The percentage of children eating fruits and vegetables remained steady with the introduction of
Phase 1 with the exception of the second day when about 33% of children consumed fruits and
vegetables. After the introduction of Phase 2 there was an increase with about 33% of children
consuming combined fruits and vegetables. On the third day of Phase 2 about 50% of children
consumed combined fruits and vegetables. After the third day of Phase 2 there was a decreasing
trend in the percentage of children eating combined fruits and vegetables and on Day 6 about 8%
of children ate fruits and vegetables. The percentage of children consuming combined fruits and
vegetables increased after the sixth day of Phase 2 and on Day 10 about 67% of children
consumed combined fruits and vegetables. After the introduction of Baseline the percentage of
children who consumed combined fruits and vegetables decreased and remained below 20%.
After the reintroduction of Phase 1 there was an increase in the percentage of children eating
fruits and vegetables. On the first two days of the second Phase 1 about 42% of children ate
combined fruits and vegetables and on the third day this number increased to 50%.
The bottom graph in Figure 1 shows the results for Classroom 3. On the first day of
baseline about 28% of children ate fruits. On the third day there was an increasing trend and on
the fourth day of baseline about 86% of children ate combined fruits and vegetables. This
percentage decreased on the last day of baseline. The percentage of children consuming
combined fruits and vegetables remained steady for the first three days of Phase 1. There was an
12
increase in the percentage of children eating fruits and vegetables on days four and five of Phase
1. There was variability in the percentage of children eating fruits and vegetables after that. The
data for Phase 2 shows variability in the percentage of children eating fruits and vegetables.
There was an increase in the percentage of children eating fruits and vegetables in Phase 1 and
on the first day about 86% of children ate combined fruits and vegetables. The percentage of
children eating fruits and vegetables continued to be variable for most of Phase 2. The
percentage of children eating fruits and vegetables decreased to zero after baseline was
reintroduced and increased again on the second day to about 72% and decreased to about 14% on
the third day. The percentage of children eating fruits and vegetables increased to about 43%
after the reintroduction of Phase 1 of children eating fruits and vegetables. On the last two days
of the study the percentage of children eating fruits and vegetables remained at about 57%.
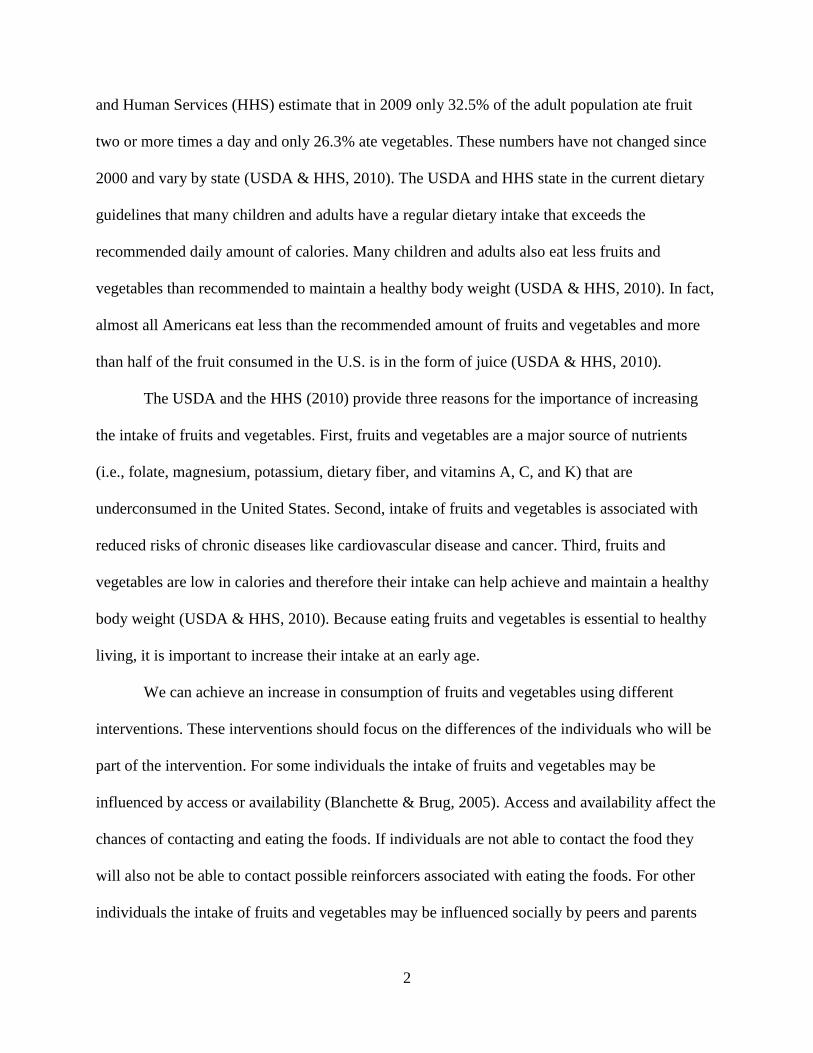
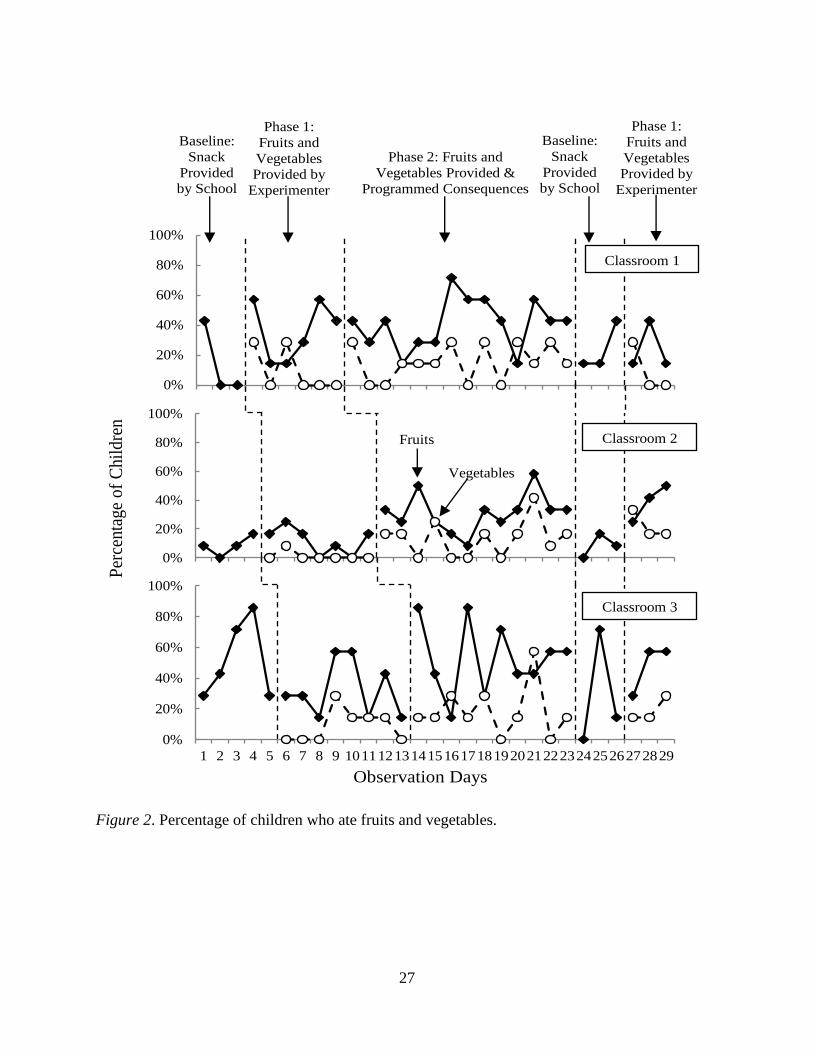
Figure 2 shows the overall results of the intervention across the three classrooms by
displaying the percentage of children in each classroom who ate fruits and vegetables. The top
graph in Figure 2 shows the results from Classroom 1. During baseline only fruits were
available. There was an increase in the percentage of children eating fruits after the introduction
of Phase 1. Also, about 29% of children ate vegetables the first time they were presented. On the
second day of Phase 1 there was a decrease in the percentage of children eating both fruits and
vegetables. There was an increasing trend in the percentage of children eating fruits for the
remainder of Phase 1. The percentage of children eating vegetables varied on the first three days
of Phase 1 but decreased to zero for the remainder of Phase 1. The percentage of children eating
fruits remained relatively steady after the introduction of Phase 2. On Day 7 of Phase 2 there was
an increase in the percentage of children eating fruits followed by a decreasing trend. The
percentage of children eating fruits increased on Day 12 of Phase 2 and remained at above 42%.

13
The percentage of children eating vegetables increased to 29% when Phase 2 was introduced but
decreased again during the next two days. After the fourth day of Phase 2 the percentage of
children eating vegetables remained between 14% and 29% on most days with the exception of
two days when it decreased to zero. The percentage of children eating fruits decreased when
baseline was reintroduced but increased to about 43% on the last day of baseline. There was a
decrease in the percentage of children eating fruits again when we reintroduced Phase 1.
The middle graph in Figure 2 shows the results of Classroom 2. The percentage of
children eating fruits was about 8% on days one and three and increased to 17% on the last day
of baseline. Vegetables were not offered during baseline. The percentage of children eating both
fruits and vegetables remained steady during Phase 1 with more variability on the intake of
fruits. Intake of vegetables remained at zero most of Phase 1. There was an increase in the
percentage of children eating fruits and vegetables after the introduction of Phase 2. About 33%
of children ate fruits and about 17% ate vegetables during the first day of Phase 2. The
percentage of children eating fruits was variable during Phase 2 with only 8% of children eating
fruits on Day 6 and 59% on Day 10. The percentage of children eating vegetables increased
during Phase 2, but was variable with the highest percentage on the tenth day when 42% of
children ate vegetables. The percentage of children eating fruits decreased when we reintroduced
baseline but showed an increasing trend when we reintroduced Phase 1. Vegetables were not
available during the second baseline. The percentage of children eating fruits and vegetables
increased to 25% of children eating fruits and 34% eating vegetables when Phase 1 was
introduced. The percentage of children eating fruits increased during the next two days, and the
percentage of children eating vegetables decreased.
14
The bottom graph in Figure 2 shows the results for Classroom 3. The percentage of
children eating fruits showed an increasing trend for the first four days. The percentage of
children eating fruits decreased for the last day of baseline. Vegetables were not available during
baseline. After the introduction of Phase 1 the percentage of children eating fruits remained
steady. After the third day of Phase 1 there was an increase in the percentage of children eating
fruits. The percentage of children eating vegetables also increased after Day 3 and was steady for
the next four days. When Phase 2 was introduced there was an increase in the percentage of
children eating fruit. The percentage of children eating fruit was variable at the beginning of
Phase 2 with more steady responses at the end. After the introduction of Phase 2 the percentage
of children eating vegetables increased and remained above 15% for the first five days of Phase
2. The percentage of children eating vegetables decreased on the sixth day of Phase 2 to zero and
increased to 57% on Day 8. The percentage of children eating vegetables decreased to zero on
Day 9 of Phase 2.
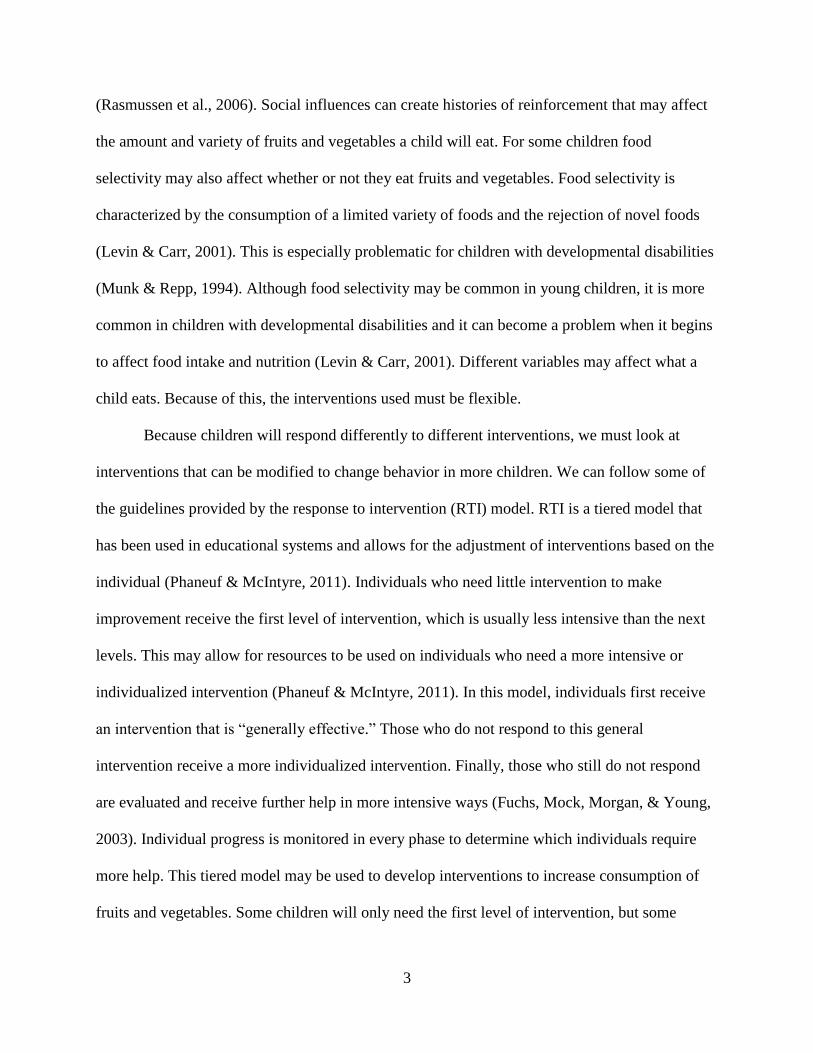
Figure 3 shows the number of children who showed increases in eating when exposure
and rewards were introduced. It also shows the number of children who did not respond to either
intervention. The first bar in the graph shows that nine children had increases in eating during the
exposure condition. The second bar shows that six children had increases in eating during the
rewards condition. The third bar shows no effects of either intervention for eleven children.
Figures 4, 5, and 6 show individual data sets that were representative of different patterns
of responding in each classroom. Figure 4 shows examples of the two patterns for responding for
Classroom 1. The top graph shows Example 1. In Example 1 the participant ate no fruits or
vegetables throughout the study. Intake remained at zero portions when each phase was
introduced and for the duration of each phase. The second graph shows Example 2. During

15
baseline this participant ate no fruits, and vegetables were not available. During Phase
1consumption increased to one and a half servings of fruits and vegetables. Consumption then
decreased back to zero portions on the second and fourth days of Phase 1. There was an increase
in consumption on Day 5 of Phase 2. Consumption decreased to half a portion on Day 8 of Phase
2 and increased to one and a half portions Day 9. Consumption of combined fruits and
vegetables remained the same during the reintroduction of baseline as in the last day of Phase 1.
The participant was not available for data collection during the reintroduction of Phase 1.
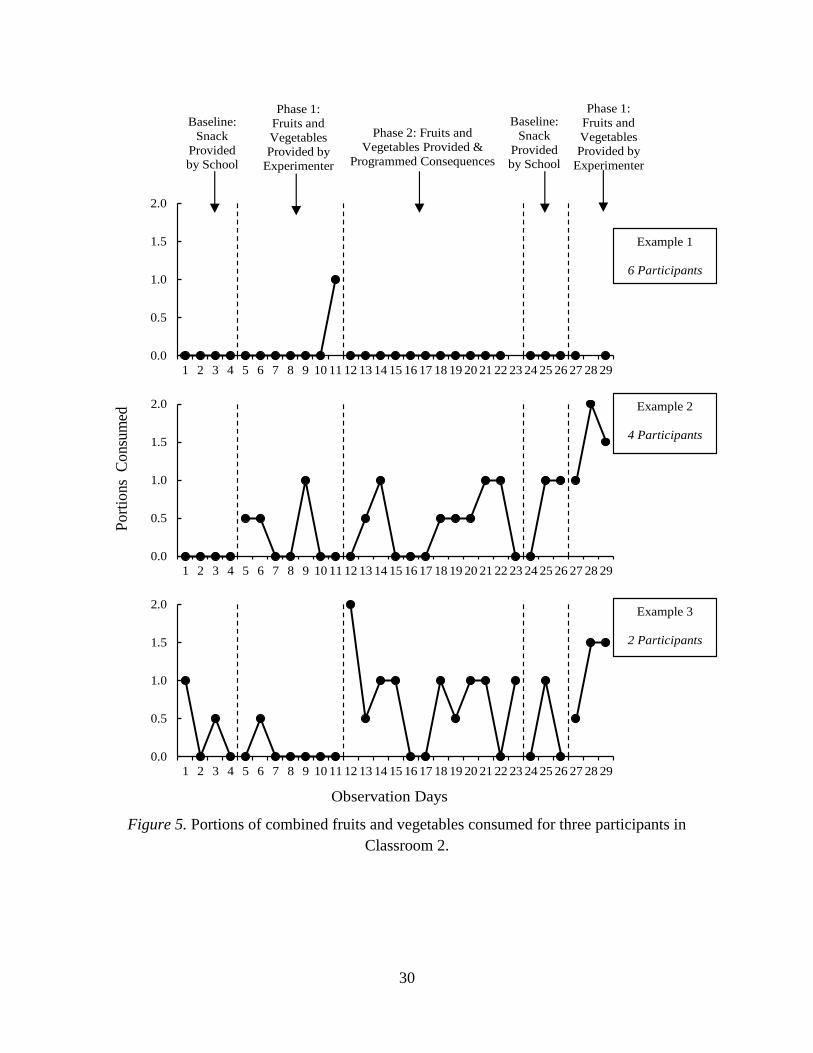
Figure 5 shows three examples of the patterns of responding that were representative for
Classroom 2. The top graph shows the Example 1. The participant in Example 1 ate combined
fruits and vegetables on only one of the observation days. There were no changes in consumption
with the phases changed or baseline reintroduced. The middle graph shows Example 2. The
participant in Example 2 ate zero fruits during baseline. After the introduction of Phase 1
consumption increased to half a portion then decreased on the third and fourth day of Phase 1.
Consumption increased to one portion on the fifth day of Phase 1. There was no change in
consumption in the first day of Phase 2. Consumption increased on Day 2 of Phase 2 and on the
third day of intervention this participant ate one portion. After the sixth day of Phase 2 there was
an increase in eating and this participant ate half of one portion for the next four days of this
phase. Consumption decreased to zero on the first day of reintroduction of baseline but increased
to one portion for the next two days of baseline. During Phase 1 the consumption of fruits and
vegetables remained the same for the first day but increased for the last two days of intervention.
The bottom graph shows Example 3. The participant in Example 3 ate one portion of fruit the
first day of baseline, consumption decreased for the next three days of baseline. During Phase 1
there was no change in the amount of fruits and vegetables consumed. During Phase 2 there was

16
an increase in eating and this participant ate two portions of combined fruits and vegetables.
Consumption remained steady for the remainder of Phase 2 and this participant ate an average of
one portion of combined fruits and vegetables a day. Consumption decreased to zero portions on
two of the three days of the return to baseline phase. After the reintroduction of Phase 1 there
was an increase in eating of combined fruits and vegetables and this participant ate one and a
half portions on the last two days of intervention.
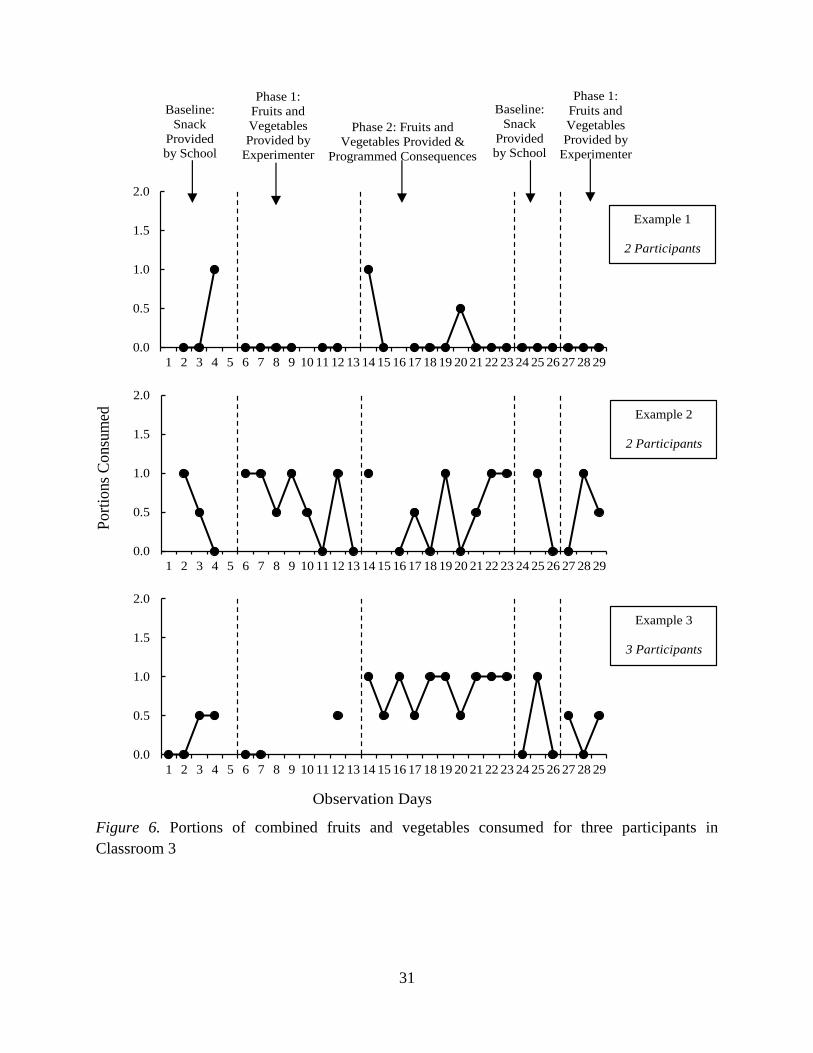
Figure 6 shows three examples of the patterns of responding that were representative for
Classroom 3. The top graph shows Example 1. The participant in Example 1 ate fruits and
vegetables on three observation days. There was an increase in consumption when we introduced
Phase 2. Consumption then decreased to zero portions and remained at zero portions for the
remainder of observations days with the exception of Day 20 when this participant ate half a
serving of combined fruits and vegetables. The middle graph shows Example 2. The participant
in Example 2 ate one portion on the first day of baseline. Eating decreased on the second and
third days of baseline. After the introduction of Phase 1 there was an increase in eating to one
portion. Consumption remained between half and one portion for the first five days of Phase 1.
Consumption decreased to zero on Days 6 and 8 of Phase 1. Consumption increased after the
introduction of Phase 2 to one portion but decreased on the next three days. Consumption
increased to one portion on Days 6, 9, and 10 of Phase 2. There was no change in the pattern of
responding after the reintroduction of baseline and Phase 1. The bottom graph shows Example 3.
The participant in Example 3 ate zero portions of fruits on the first two days of baseline and
eating increased to half a serving for the rest of baseline. There was no change in consumption
during Phase 1. After the introduction of Phase 2 there was an increase in consumption to one
portion. Consumption remained steady between half and one portion for the duration of Phase 2.

17
After the reintroduction of baseline there was a decrease in consumption for two of the three
days of baseline. During Phase 1 consumption remained below half a serving a day.

18
DISCUSSION
This study investigated two tiers of intervention in an inclusive preschool. Tier 1
involved the opportunity to contact a potentially reinforcing stimulus (exposure). Tier 2 involved
programmed consequences (rewards). Both tiers were effective interventions for increasing the
consumption of fruits and vegetables with preschoolers. There were, however, a substantial
number of children who did not respond to either intervention.
The daily suggested amounts of fruits and vegetables for children between two and six
years of age is between one and one and a half cups a day (USDA, 2011). These amounts are
usually consumed throughout the day and not in one meal. If we take this into consideration, we
can deduct that a child should eat about a quarter of a cup of fruits and vegetables during snack
times and the rest during regular meals. The participants in this study had two snacks at school; if
they ate a quarter of a cup of fruits and vegetables during each snack they would have consumed
almost half of their daily recommended amounts. About half of the participants in the study ate
at least a quarter of either fruit or vegetable and in some cases of both during snack during
Phases 1 and 2.
The baselines for the three classrooms were different. In Classrooms 1 and 2 the number
of children eating fruits was very low or zero during the last days of baseline. These numbers
suggest different things. First, it suggests that the canned fruits offered by the preschool probably
were not preferred by the children and therefore did not serve as reinforcers for eating. Second, it
suggests that even if the children preferred the fruit, there may have been other snacks that were
more highly preferred than the fruit. The alternative snacks may have in fact decreased the
likelihood of the children eating fruits. Finally, it is likely that some children never tried the
fruits and therefore never came into contact with the potential reinforcers associated with eating

19
the canned fruits. In Classroom 3 more children ate fruits and vegetables during baseline. In this
classroom the canned fruits did seem to be reinforces for eating but only for some children. The
preschool did not serve vegetables during baseline.
The present study introduced the opportunity to contact the fruits and vegetables
(exposure) as the first level of intervention. During exposure there was an increase in eating of
fruits and vegetables for nine of the 26 children. As shown in Figure 1, Classroom 1 had the
highest percentage of children eating combined fruits and vegetables during this phase. The
percentage of children eating vegetables was lower than the percentage of children eating fruits
during this phase. However, comparisons between the results and the baseline are difficult
because the school did not offer vegetables during baseline. The results of Phase 1 provide
support for the use of exposure as an intervention and also for the findings of Wardle, Herrera, et
al. (2003) and Wardle, Cooke, et al. (2003). In the present study there was an increase in the
consumption of fruits and vegetables in over a quarter of the participants with opportunity alone.
These results show that for some children the only intervention needed is exposure; a simple and
economic intervention. For these children it is not necessary to introduce a more comprehensive
or individualized intervention because the food alone may be reinforcing.
There may also be other reinforcers associated with eating fresh fruits and vegetables
besides the foods alone. Consuming fresh fruits and vegetables may have been followed by
social attention from peers. Children in Classroom 1 usually talked to their peers about what they
were eating. Some of the children offered the fresh fruits and vegetables to peers and made
comments about how good they were or which ones were their favorites. When the fresh diced
tomatoes were offered, two children in Classroom 1 exclaimed that they “loved tomatoes.” After
a few minutes they had convinced two other peers to try them. These social interactions may

20
have been reinforcing and increased the likelihood that the children would try new foods. The
increases in the number of children eating fruits and vegetables seems to contradict the
suggestion that opportunity alone does not increase the consumption of fruits and vegetables
(Horne, et al., 2011; Lowe et al., 2004; and Horne et al., 2004). This level of intervention did not
result in increases in the consumption of fruits and vegetables for all the participants, but the
present study shows that this level of intervention alone can increase consumption with a number
of children.
Eighteen participants did not respond to the first level of intervention. For these children
a second level of intervention was introduced. After the introduction of Phase 2 there were
increases in the percentage of children eating combined fruits and vegetables. As shown in
Figure 3, six children responded to the addition of the rewards. Figure 1 also shows increases in
the percentages of children eating combined fruits and vegetables. The results of Phase 2 provide
support for the suggestion that programmed consequences can increase eating of fruits and
vegetables (Horne, et al., 2011; Lowe et al., 2004; and Horne et al., 2004). The increases when
the rewards were introduced show that programmed consequences can be effective at increasing
the consumption of fruits and vegetables. For a number of children, opportunity alone was not
enough to change consumption. For these children it was necessary to introduce a second level of
intervention and add programmed consequences. Once they consumed the fruits and vegetables
they received the rewards which may have been reinforcing. The rewards also allowed the
children to come in contact with other reinforcers. Some of these reinforcers were in the form of
social praise and attention from teachers and parents. The stickers and silly bands showed others
that they had eaten fruits and vegetables which could have resulted in praise from teachers and
parents. Many of the teachers would see a child with a sticker on his or her shirt and immediately
21
exclaim how wonderful it was that they had eaten fruits and vegetables. This then may have
increased the likelihood of them trying other fruits and vegetables in the future.
During the reversal to baseline the percentage of children eating fruits decreased in the
three classrooms and vegetables were not offered. These results could mean that exposure and
rewards were the variables responsible for the increases in the percentages of children eating
fruits and vegetables. The decreases may be due to the fact that the fresh fruits and vegetables
were not available and the children did not have the opportunity to eat them. The decreases could
also mean that eating did not generalize to canned fruits. In this study rewards were never
offered for eating the canned fruits and this could have affected eating of the canned fruits.
In the present study the fresh fruits and vegetables were reintroduced on day 27 without
the rewards. The last three data points in in Figures 1 and 2 show that the percentage of children
eating fruits and vegetables returned to similar levels to those in Phase 1 or Phase 2. These
results suggest that opportunity was one of the variables that increased the percentage of children
eating fruits and vegetables. The fresh fruits and vegetables alone were reinforcing. The results
of the reintroduction of Phase 2 could also mean that the rewards were effective and that their
effects did maintain as long as fresh fruits and vegetables were available.
Neither exposure nor rewards produced increases in consumption for a group of children.
Six of the children that showed no effects had a disability and several of these children showed
selective responses to food that were documented by the preschool and posted in each classroom.
Furthermore the parents of each of these participants commented when filling out the parental
consent forms that their child only ate certain things. For example, the parent of one child
informed the experimenter that his child only ate salty snacks at school and that if he ate any fruit
at all it was usually freeze dried bananas. The pattern of responding for these children can be

22
seen in the top graphs of Figures 4, 5, and 6. These children had the same opportunity as the
other children to touch and consume the fresh fruits and vegetables. However, when the fruits
and vegetables were introduced there were no changes in these children’s pattern of responding
which meant that the foods alone were likely not reinforcing. When we introduced the
programmed consequences there were no changes in their behavior, which meant that the
rewards were likely not reinforcing for these children. This pattern of responding was not
exclusive to children with documented food selectivity or with developmental disabilities. Four
children without school documented food selectivity did not respond to either intervention. The
parents of these children however, also informed the experimenter about how “picky” their
children were when they filled out the parent consent form. For example, one parent informed
the experimenter that her child only ate crunchy foods and that any time she tried fruits or
vegetables she gagged. For these children it would be necessary to implement a third tier
intervention that would be more individualized and intensive. For example, texture fading
(Shore, Babbitt, Williams, Coe, & Snider, 1998; Luiselli, Ricciaardi, & Gilliam, 2005), food
presentation sequence (Piazza, Patel, Santana, Goh, Delia, & Lancaster, 2002; Penrod, Gardella,
& Fernant, 2012; Ahearn, 2003; VanDalen & Penrod, 2010), or positive reinforcement based
interventions (Kern & Marder, 1996; Allison et al., 2012).
There are several limitations to this study. First, this study did not implement preference
assessments with the children to determine what the programmed consequences would be. The
programmed consequences used in this study may not have served as reinforcers for some of the
children. The preference of programmed consequences in this type of intervention needs further
evaluation.

23
A second limitation was that the children had free access to alternative snacks. These
alternative choices may have affected how the children responded the intervention. Even if the
fresh fruits and vegetables or the stickers were desirable, they may not have been as highly
preferred as the alternative snacks. The alternative snacks may have been more reinforcing than
the stickers and silly bands.
Third, in this study there were no set amount specifications on consumption for the
children to receive a reward. They received a reward for simply taking a bite. This could have
affected the amounts consumed for each child and the percentage of children consuming fruits
and vegetables since we only recorded consumption for children who consumed half a portion or
more. It may be necessary to set expectations of consumption before beginning any intervention
aimed at increasing consumption of any food.
Finally, after the reintroduction of baseline consumption decreased for the three
classrooms and increased after the reintroduction of Phase 2. The experimenter reviewed the
results with the preschool. The director of the preschool expressed interest in continuing to
provide the fresh fruits and vegetables; however she was unsure about their ability to continue
providing them. Fresh fruits and vegetables are expensive when compared to canned ones.
Canned fruits can be purchased months in advanced and stored for long periods of time without
the fear of spoilage. Canned fruits also take only a few seconds to open and serve. Fresh fruits
and vegetables however must be purchased the day of consumption or a few days before. They
cannot be stored for long periods of time and require refrigeration in order to keep fresh. They
must also be washed, cut, and sometimes peeled before they are served. Taking these factors into
consideration, it is not difficult to conclude that it may be easier and cheaper to provided canned
fruits as opposed to fresh ones. The school was unable to continue serving fresh fruits and
24
vegetables after the experimenter could no longer provide them. It is likely that consumption
decreased again once the fresh fruits and vegetables were not available. If schools, or parents, do
not continue providing fresh fruits and vegetables, it is likely the children will not consume them
and may be less likely to consume them in the future.
For parents and schools, economy can play a factor in deciding which form of fruit or
vegetable to use. Parents may buy fresh fruits and vegetables, but if their children do not eat
them then this is money that is wasted. The parents may be less likely to buy those foods and the
children will have less exposure to them. The same thing can happen in schools where fruits and
vegetables may be thrown away, which may cause schools to buy them less. Also, parents and
schools must take prices and storage into consideration. If they buy fruits and vegetables that
spoil fast they may be less likely to buy those in the future which again causes children to be
exposed to those same foods less. These and other factors that affect parental and institutional
abilities to even expose, let alone reward, fruits and vegetables is an area of needed investigation.
A tiered model can provide a good starting point for creating and implementing
interventions to increase intake of fruits and vegetables. An intervention can begin with
something that is easy to implement and may be generally effective. After evaluation the
investigators can decide if this general intervention was effective and for whom. Investigators
can then develop more intensive and individualized interventions for those individuals for whom
the general intervention was not effective. Antecedent manipulations like providing the
opportunity to contact new or novel foods can produce increases in the eating of fruits and
vegetables. It may be that once the foods are available the foods alone act as a reinforcer that
increases eating of fruits and vegetables. These interventions are easy to implement and may end
up being the most economical alternative. Once the children who need more are identified a
25
second tier intervention like programmed consequences can be introduced. Programmed
consequences can produce increases in consumption of fruits and vegetables. These can be
effective if the food alone was not enough to produce changes in eating. With a tiered model as a
guide, an intervention can focus on the individual contingencies that produced variability in
responding by changing only for the children who need change.
26
0%
20%
40%
60%
80%
100%
0%
20%
40%
60%
80%
100%
0%
20%
40%
60%
80%
100%
1 2 3 4 5 6 7 8 9 1011121314151617181920212223242526272829
Per
cent
age
of C
hild
ren
Observation Days
Classroom 3
Classroom 1
Classroom 2
Baseline:
Snack
Provided
by School
Phase 2: Fruits and
Vegetables Provided &
Programmed Consequences
Phase 1:
Fruits and
Vegetables Provided by
Experimenter
Baseline:
Snack
Provided by School
Phase 1:
Fruits and
Vegetables Provided by
Experimenter
Figure 1. Percentage of children who ate combined fruits and vegetables.
27
Per
centa
ge
of
Chil
dre
n
0%
20%
40%
60%
80%
100%
0%
20%
40%
60%
80%
100%
0%
20%
40%
60%
80%
100%
1 2 3 4 5 6 7 8 9 1011121314151617181920212223242526272829
Observation Days
Classroom 3
Classroom 1
Classroom 2
Baseline:
Snack
Provided by School
Phase 2: Fruits and
Vegetables Provided &
Programmed Consequences
Phase 1:
Fruits and
Vegetables Provided by
Experimenter
Baseline:
Snack
Provided by School
Phase 1:
Fruits and
Vegetables Provided by
Experimenter
Fruits
Vegetables
Figure 2. Percentage of children who ate fruits and vegetables.

28
0
2
4
6
8
10
Exposure Rewards No effect
Nu
mb
er o
f C
hil
dre
n
Type of Intervention
Figure 3. Number of children who responded to the exposure, rewards, and number of children
for whom there were no effects.

29
0.0
0.5
1.0
1.5
2.0
1 2 3 4 5 6 7 8 9 10 11 12 13 14 15 16 17 18 19 20 21 22 23 24 25 26 27 28 29
0.0
0.5
1.0
1.5
2.0
1 2 3 4 5 6 7 8 9 10 11 12 13 14 15 16 17 18 19 20 21 22 23 24 25 26 27 28 29
Observation Days
Po
rtio
ns
Eat
en
Example 2
2 Participants
Baseline:
Snack
Provided by School
Phase 2: Fruits and
Vegetables Provided &
Programmed Consequences
Phase 1:
Fruits and
Vegetables Provided by
Experimenter
Baseline:
Snack
Provided by School
Phase 1:
Fruits and
Vegetables Provided by
Experimenter
Example 2
5 Participants
Figure 4. Portions of combined fruits and vegetables consumed for two participants in
Classroom 1.
30
0.0
0.5
1.0
1.5
2.0
1 2 3 4 5 6 7 8 9 10 11 12 13 14 15 16 17 18 19 20 21 22 23 24 25 26 27 28 29
0.0
0.5
1.0
1.5
2.0
1 2 3 4 5 6 7 8 9 10 11 12 13 14 15 16 17 18 19 20 21 22 23 24 25 26 27 28 29
0.0
0.5
1.0
1.5
2.0
1 2 3 4 5 6 7 8 9 10 11 12 13 14 15 16 17 18 19 20 21 22 23 24 25 26 27 28 29
Po
rtio
ns
Co
nsu
med
Observation Days
Baseline:
Snack
Provided by School
Phase 2: Fruits and
Vegetables Provided &
Programmed Consequences
Phase 1:
Fruits and
Vegetables Provided by
Experimenter
Baseline:
Snack
Provided by School
Phase 1:
Fruits and
Vegetables Provided by
Experimenter
Example 1
6 Participants
Example 2
4 Participants
Example 3
2 Participants
Figure 5. Portions of combined fruits and vegetables consumed for three participants in
Classroom 2.
31
0.0
0.5
1.0
1.5
2.0
1 2 3 4 5 6 7 8 9 10 11 12 13 14 15 16 17 18 19 20 21 22 23 24 25 26 27 28 29
0.0
0.5
1.0
1.5
2.0
1 2 3 4 5 6 7 8 9 10 11 12 13 14 15 16 17 18 19 20 21 22 23 24 25 26 27 28 29
0.0
0.5
1.0
1.5
2.0
1 2 3 4 5 6 7 8 9 10 11 12 13 14 15 16 17 18 19 20 21 22 23 24 25 26 27 28 29
Po
rtio
ns
Co
nsu
med
Observation Days
Baseline:
Snack
Provided by School
Phase 2: Fruits and
Vegetables Provided &
Programmed Consequences
Phase 1:
Fruits and
Vegetables Provided by
Experimenter
Baseline:
Snack
Provided by School
Phase 1:
Fruits and
Vegetables Provided by
Experimenter
Example 1
2 Participants
Example 2
2 Participants
Example 3
3 Participants
Figure 6. Portions of combined fruits and vegetables consumed for three participants in
Classroom 3
32
APPENDIX A
FLYER

33
Eating more fruits and vegetables is an essential part of a healthy diet, especially for young
children. Many children do not consume the necessary amounts of fruits and vegetables. We would
like to see this change. We would like to see children that not only eat their fruits and vegetables,
but enjoy them and feel proud of what they eat. To accomplish this goal we have developed a
program focused on increasing consumption of fruits and vegetables in young children.
We are the Junk Busters and our main goal is to see children enjoying their fruits and
vegetables. We want show your child that fruits and vegetables are delicious and that they are an
essential part of growing up strong and healthy. We plan to accomplish this goal by presenting fruits
and vegetables to your child and providing small rewards for any interaction with the foods. Your
child will receive small reward that will be faded out as the program progresses. This will be done so
that eventually your child will eat the fruits and vegetables simply because they taste good and are
a healthy snack.
As part of the project we will provide fresh fruits and vegetables for your child’s
consumption. All the fruits and vegetables will be washed and prepared according to school
standards. Your child will be asked to eat the fruits and vegetables. However, if your child does not
wish to eat any of the provided foods, he/she may decline to participate and the foods will be
promptly removed. Participation in this study is completely voluntary and will be evaluated on a
daily basis for those children whose parents give permission to participate.
The experimenter will be in at TSA on June 29, 2012 from 2:00 to 5:00 p. m. and July 2, 2012
from 7:30 to 9:00 a.m. to discuss the project and distribute parent consent forms.

34
APPENDIX B
PARENT CONSENT FORM

35
University of North Texas Institutional Review Board
Informed Consent Form
Before agreeing to your child’s participation in this research study, it is important that you read
and understand the following explanation of the purpose, benefits and risks of the study and how
it will be conducted.
Title of Study: Junk Busters: Increasing Fruit and Vegetable Consumption in Preschoolers
Investigator: Blanca Mendoza, Graduate Student, University of North Texas (UNT)
Department of Behavior Analysis. Supervising Investigator: Shahla Ala’i-Rosales, Ph.D.,
BCBA-D, Associate Professor, University of North Texas (UNT) Department of Behavior
Analysis.
Purpose of the Study: You are being asked to allow your child to participate in a research study
that involves fruit and vegetable consumption during school snacks. There are multiple health
benefits associated with the increased consumption of fruits and vegetables. Increased fruit and
vegetable consumption can help maintain a healthy weight and reduce obesity.
Study Procedures: A survey will be sent home with every potential participant before the start
of any data collection or observation in the classroom. You will have the opportunity to provide
the investigator with information about your child’s consumption of fruits and vegetables. This
survey will be used to collect information about your interest in participating in this study. Your
child will have the opportunity to consume fruits and vegetables that we will provide during
morning snack. The fruits and vegetables will be prepared (washed and cut) according to school
snack guidelines for preparation and safe food handling. The fruits and vegetables will be
presented to your child in individual serving dishes. Your child can refuse the fruits and
vegetables provided at any time during any snack period. If you child does eat any amount of the
foods provided, teachers will provide small recognition for eating the fruits and vegetables. The
recognition will be in the form of stickers (“I’m a junk buster!”, “I’m a fruit fanatic”) and small
trinkets related to healthy eating. Observers will record and monitor consumption during snack
periods. The study will take place over a two month period.
Foreseeable Risks: We don't foresee any risks to your child. However, if your child experiences
any discomfort or distress, he/she will be allowed to discontinue participation in the study.
Choice to or not to participate will not affect your child’s participation in snack and lunch times.
Benefits to the Subjects or Others: We expect the project to benefit your child by increasing
their daily consumption of fruits and vegetables. We also expect to increase your child’s
favorable attitude towards the consumption of fruits and vegetables.
Compensation for Participants: Your child will receive small rewards for fruit and vegetable
consumption; these include stickers, pencils, erasers, and trinkets. No other compensation will be
provided for participation.

36
Procedures for Maintaining Confidentiality of Research Records: The results of your child’s
participation will be confidential, and will not be released in any individually identifiable form
without the prior consent from you. The confidentiality of your child’s individual information
will be maintained in any publications or presentations regarding this study. Your child will be
identified with a coded number during the recording process.
Questions about the Study: If you have any questions about the study, you may contact Shahla
Ala’i-Rosales at [email protected].
Review for the Protection of Participants: This research study has been reviewed and
approved by the UNT Institutional Review Board (IRB). The UNT IRB can be contacted at (940)
565-3940 with any questions regarding the rights of research subjects.
Research Participants’ Rights: Your signature below indicates that you have
read or have had read to you all of the above and that you confirm all of the
following:
Shahla Ala’i-Rosales or a designated individual has explained the study to
you and answered all of your questions. You have been told the possible
benefits and the potential risks and/or discomforts of the study.
You understand that you do not have to allow your child to take part in
this study, and your refusal to allow your child to participate or your
decision to withdraw him/her from the study will involve no penalty or
loss of rights or benefits. The study personnel may choose to stop your
child’s participation at any time.
You understand why the study is being conducted and how it will be
performed.
You understand your rights as the parent/guardian of a research participant
and you voluntarily consent to your child’s participation in this study.
You have been told you will receive a copy of this form.
________________________________
Printed Name of Parent or Guardian
________________________________ ____________
Signature of Parent or Guardian Date
For the Student Investigator or Designee: I certify that I have reviewed the
contents of this form with the parent or guardian signing above. I have explained
the possible benefits and the potential risks and/or discomforts of the study. It is
my opinion that the parent or guardian understood the explanation.
______________________________________ _______
Signature of Student Investigator Date

37
APPENDIX C
DATA COLLECTION SHEET

38
Classroom: ____________________ Date: ________________________
Observer: ________________ 2nd Observer: ________________
Mark Y (Yes) or N (No) on whether or not the participant requested/consumed a second serving
A1 0% 50% 100% Y N Y N 0% 50% 100% Y N Y N
A2 0% 50% 100% Y N Y N 0% 50% 100% Y N Y N
A3 0% 50% 100% Y N Y N 0% 50% 100% Y N Y N
A4 0% 50% 100% Y N Y N 0% 50% 100% Y N Y N
A5 0% 50% 100% Y N Y N 0% 50% 100% Y N Y N
A6 0% 50% 100% Y N Y N 0% 50% 100% Y N Y N
A7 0% 50% 100% Y N Y N 0% 50% 100% Y N Y N
A8 0% 50% 100% Y N Y N 0% 50% 100% Y N Y N
A9 0% 50% 100% Y N Y N 0% 50% 100% Y N Y N
A10 0% 50% 100% Y N Y N 0% 50% 100% Y N Y N
A11 0% 50% 100% Y N Y N 0% 50% 100% Y N Y N
A12 0% 50% 100% Y N Y N 0% 50% 100% Y N Y N
A13 0% 50% 100% Y N Y N 0% 50% 100% Y N Y N
A14 0% 50% 100% Y N Y N 0% 50% 100% Y N Y N
A15 0% 50% 100% Y N Y N 0% 50% 100% Y N Y N
A16 0% 50% 100% Y N Y N 0% 50% 100% Y N Y N
IOA
Total =
For each participant record the amount of frui ts and vegetables consumed during snack.
Student FruitRequest 2nd
serving?
Consumed
2nd serving?Vegetables
Request 2nd
serving?
Consumed
2nd serving?
Agreements =
Agreements + Disagreements =

39
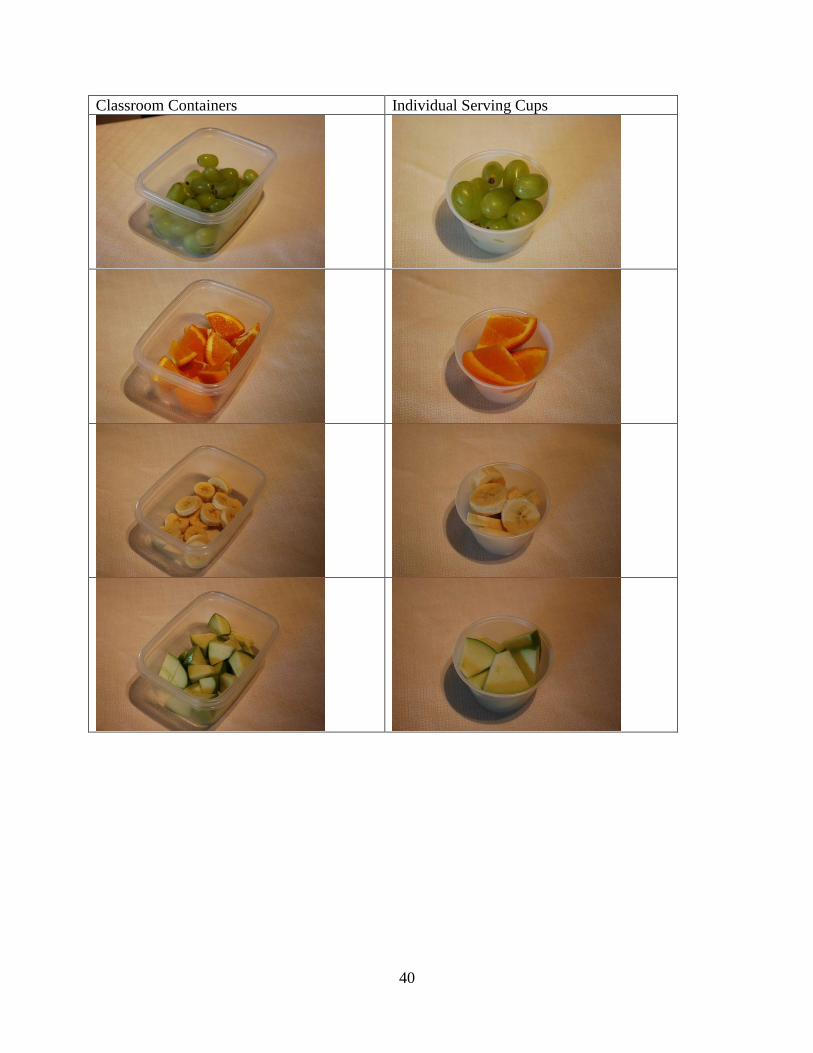
APPENDIX D
FRUITS
40
Classroom Containers Individual Serving Cups

41
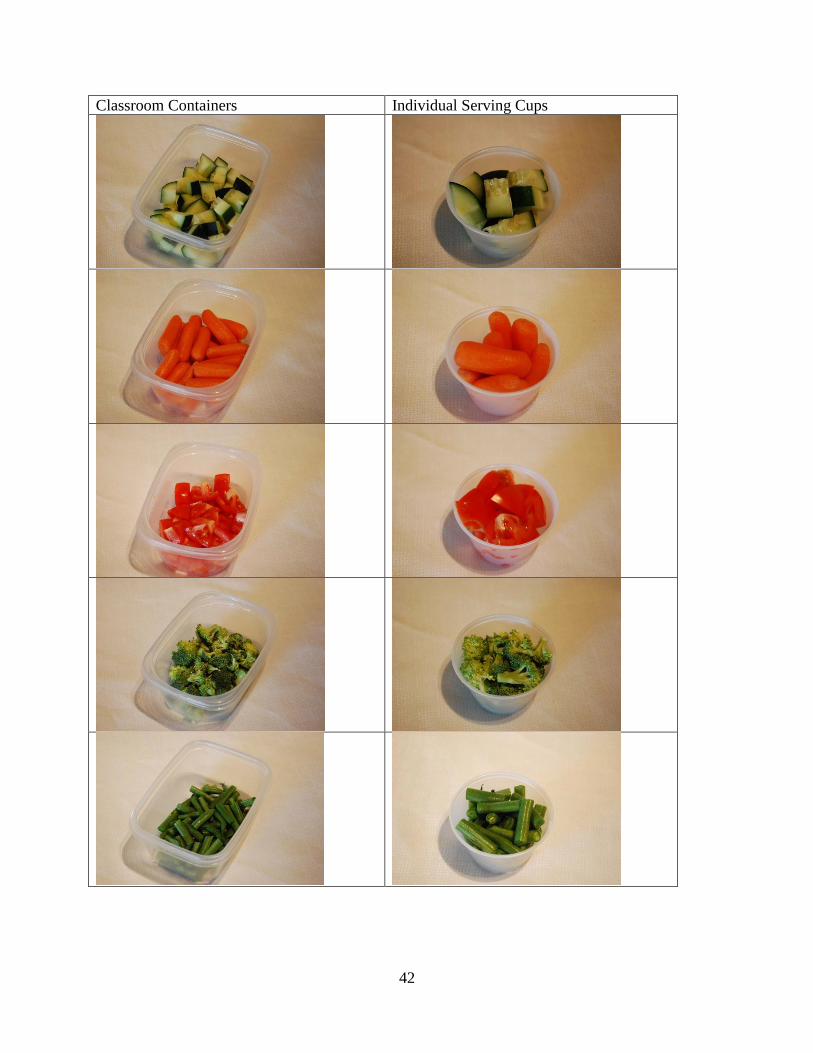
APPENDIX E
VEGETABLES
42
Classroom Containers Individual Serving Cups
43
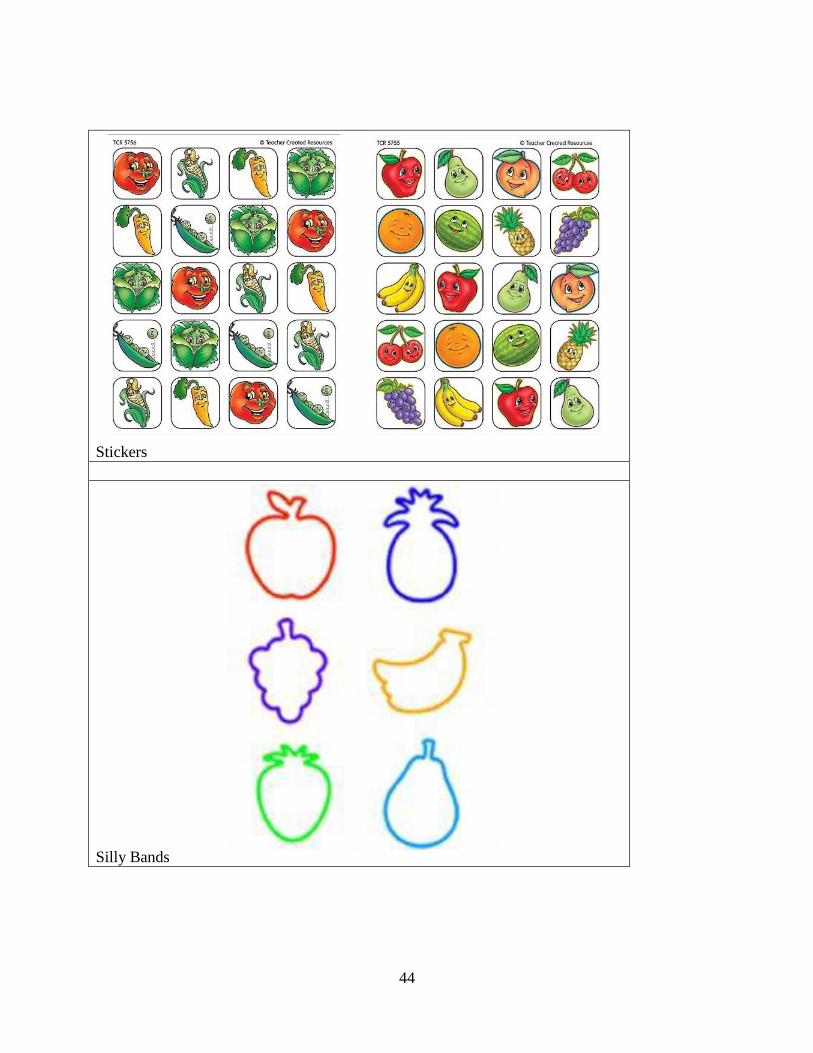
APPENDIX F
REWARDS
44
Stickers
Silly Bands

45
APPENDIX G
CLASSROOMS
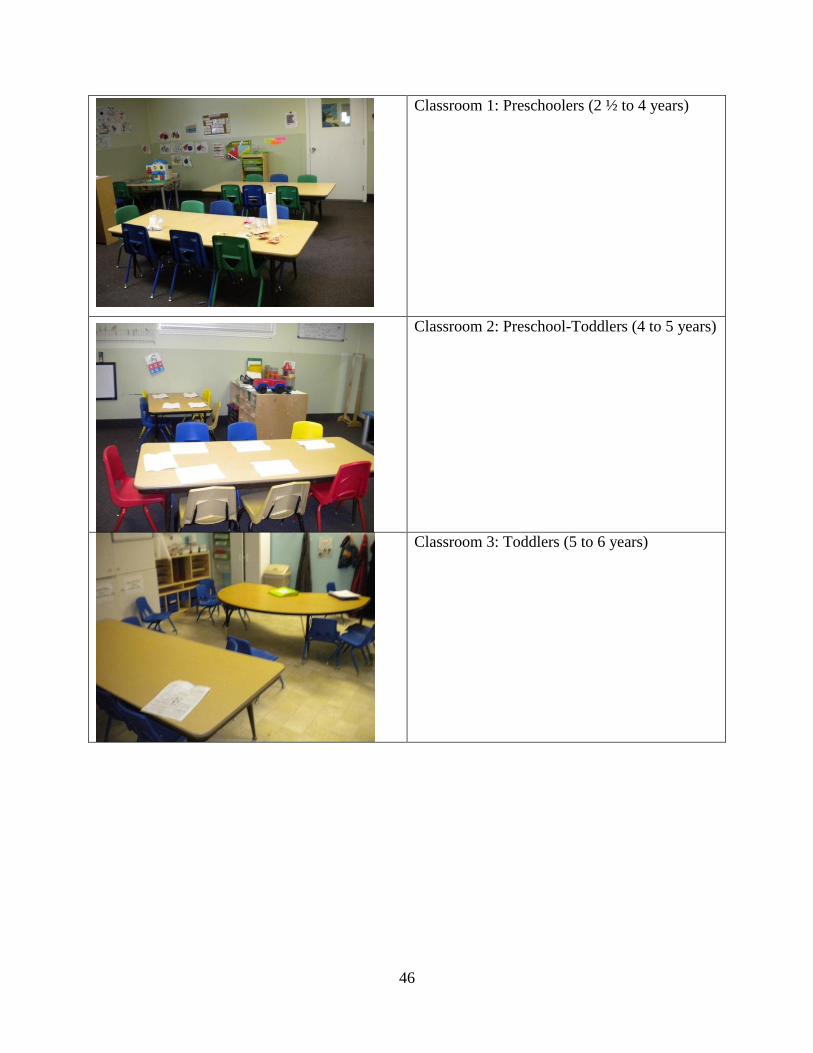
46
Classroom 1: Preschoolers (2 ½ to 4 years)
Classroom 2: Preschool-Toddlers (4 to 5 years)
Classroom 3: Toddlers (5 to 6 years)
47
REFERENCES
Ahearn, W. H. (2003). Using simultaneous presentation to increase vegetable consumption in a
mildly selective child with autism. Journal of Applied Behavior Analysis, 36, 361-365
Allison, J., Wilder, D. A., Chong, I., Lugo, A., Pike, J., & Ruddy, N. (2012). A comparison of
differential reinforcement and noncontingent reinforcement to treat food selectivity in a
child with autism. Journal of Applied Behavior Analysis, 45, 613-617.
Blanchette, L., & Brug, J. (2005). Determinants of fruit and vegetable consumption among 6-12-
year-old children and effective interventions to increase consumption. Journal of Human
Nutrition and Dietetics, 18m, 431-443.
Centers for Disease Control and Prevention. (2012). Adult obesity facts. Retrieved from
http://www.cdc.gov/obesity/data/adult.html
Dehghan, M., Akhtar-Danesh, N., & Merchant, A. T. (2005). Childhood obesity, prevalence and
prevention. Nutrition Journal, 4, 1-8.
Ebbeling, C. B., Pawlak, D. B., & Ludwig, D. S. (2002). Childhood obesity: public-health crisis,
common sense cure. The Lancet, 360, 473-782.
Fuchs, D., Mock, D., Morgan, P. L., & Young, C. L. (2003). Responsiveness-to-intervention:
definitions, evidence, and implications for the learning disabilities construct. Learning
Disabilities Research & Practice, 18, 157-171.
Guenther, P. M., Dodd, K. W., Reedy, J., Krebs-Smith, S. M. (2006). Most Americans eat much
less than recommended amounts of fruits and vegetables. Journal of the American
Dietetic Association, 106, 1371-1379.
48
Horne, P. J., Greenhalgh, J., Erjavec, M., Lowe, C. F., Viktor, S., & Whitaker, C. J. (2011).
Increasing pre-school children’s consumption of fruit and vegetables: a modeling and
rewards intervention. Appetite, 56, 375-385.
Horne, P. J., Tapper, K., Lowe, C. F., Hardman, C. A., Jackson, M. C., & Woolner, J. (2004).
Increasing children’s fruit and vegetable consumption: a peer-modeling and rewards-
based intervention. European Journal of Clinical Nutrition, 1-12.
Kern, L., & Marder, T. J. (1996). A comparison of simultaneous and delayed reinforcement as
tretments for food selectivity. Journal of Applied Behavior Analysis, 29, 243-246.
Knai, C., Pomerleau, J., Lock, K., & McKee, M. (2006). Getting children to eat more fruit and
vegetables: a systematic review. Preventive Medicine, 42, 85-95.
Levin, L., & Carr, E. G. (2001). Food selectivity and problem behavior in children with
developmental disabilities. Behavior Modification, 25, 443–470.
Liuselli, J. K., Ricciardi, J. N., & Gilligan, K. (2005). Liquid fading to establish milk
consumption by a child with autism. Behavioral Interventions, 20, 155-163.
Lowe, C. F., Horne, P. J., Tapper, K., Bowdery, M., & Egerton, C. (2004). Effects of a peer
modeling and rewards-based intervention to increase fruit and vegetable consumption in
children. European Journal of Clinical Nutrition, 58, 510-522.
Munk, D. D., & Repp, A. C. (1994). Behavioral assessment of feeding problems of individuals
with severe disabilities. Journal of Applied Behavior Analysis, 27, 241–250.
Ogden, C., & Carroll, M. (2010). Prevalence of obesity among children and adolescents: United
States, Trends 1963-1965 through 2007-2008. Retrieved from Centers for Disease
Control and Prevention:
http://www.cdc.gov/nchs/data/hestat/obesity_child_07_08/obesity_child_07_08.htm
49
Penrod, B., Gardella, L., & Fernand, J. (2012). An evaluation of a progressive high-probability
instructional sequence combined with low-probability demand fading in the treatment of
food selectivity. Journal of Applied Behavior Analysis, 45, 527-537
Phaneuf, L., & McIntyre, L. L. (2011). The application of a three-tier model of intervention to
parent training. Journal of Positive Behavior Interventions, 13, 198-207.
Piazza, C. C., Patel, M. R., Santana, C. M., Goh, H., Delia, M. D., & Lancaster, B. M. (2002).
An evaluation of simultaneous and sequential presentation of preferred and nonpreferred
food to treat food selectivity. Journal of Applied Behavior Analysis, 35, 259-270.
Rasmussen, M., Krølner, R., Klepp, K. I., Lytle, L., Brug, J., Bere, E., & Due, P. (2006).
Determinants of fruit and vegetable consumption among children and adolescents: A
review of the literature. Part I:Qualitative studies. International Journal of Behavioral
Nutrition, 3, 1-19.
Shore, B. A., Babbitt, R. L., Williams, K. E., Coe, D. A. and Snyder, A. (1998). Use of texture
fading in the treatment of food selectivity. Journal of Applied Behavior Analysis, 31, 621-
633.
U.S. Department of Agriculture and U.S. Department of Health and Human Services. (2010).
Dietary guidelines for Americans (7th ed.). Washington, DC: U.S. Government Printing
Office, December 2010.
U.S. Department of Agriculture, Choose My Plate. (2011). Food groups. Retrieved from
http://www.choosemyplate.gov/food-groups/.
VanDalen, K. H., & Penrod, B. (2010). A comparison of simultaneous versus sequential
presentation of novel foods in the treatment of food selectivity. Behavioral Interventions,
25, 191-206.
50
Wardle, J., Cooke, L. J., Gibson, E. L., Sapochnick, M., Sheiham, A., & Lawson, M. (2003).
Increasing children’s acceptance of vegetables; a randomized trial of parent-led exposure.
Appetite, 40, 155-162.
Wardle, J., Herrera, M. L., Cooke, L. J., & Gibson, E. L. (2003). Modifying children’s food
preferences: the effects of exposure and reward on acceptance of an unfamiliar vegetable.
European Journal of Clinical Nutrition, 57, 341-348.


![Schoolwide Consolidation Consolidation Legislation and Guidance Title I Schoolwide Fiscal Guidance issued February, 2008 [Section E] Designing Schoolwide](https://img.pdfslide.net/doc/110x75/56649f575503460f94c7b8a0/schoolwide-consolidation-consolidation-legislation-and-guidance-title-i-schoolwide.jpg)