Embed Size (px)
Citation preview

A Short Introduction to
Microsoft Office
Volume
1


2
G Y Ö N G Y I B U J D O S Ó
A Short Introduction to
Microsoft Office
Copyright 2012 Gyöngyi Bujdosó
Handbooks for Computer Science Trainings
Volume 1
Supported by
Technical Editor:
Chapter 1 – Chapter 3 written by Gyöngyi Bujdosó
Chapter 4 by Gyöngyi Bujdosó and Edéné Rutkovszky
Last Update: January 2013
First Edition: January 2013
Published by University of Debrecen Centre of Arts, Humanities and Sciences
Notice of Rights All rights reserved. No part of this handbook may be reproduced, stored in a retrieval system or
transmitted in any form or by any means, without the prior written permission of the author.

Summary
Chapter 1. Microsoft Word ..................................................................... 7
Chapter 2. Microsoft PowerPoint ........................................................... 22
Chapter 3. Microsoft Excel ....................................................................... 39
Chapter 4. Microsoft Project ................................................................... 59

4
Table of Contents
1. Microsoft Word 7
Basics of using Microsoft Word ......................................................................................... 7 Running the Microsoft Word .................................................................................................................7 Creating a new document .......................................................................................................................8 Parts of the Word document window .................................................................................................9 Prerequisites ...............................................................................................................................................9 Hidden marks for text formatting .........................................................................................................9 Your first document............................................................................................................................... 10
Enter the text ............................................................................................................................. 10 Save the document .................................................................................................................... 10 Print the document ................................................................................................................... 11 Close the document ................................................................................................................. 11
Open a document ................................................................................................................................... 11
Character formatting ......................................................................................................... 12 Typefaces and Fonts ............................................................................................................................... 12
Purposes....................................................................................................................................... 12 Changing fonts ............................................................................................................................ 12
Font sizes .................................................................................................................................................. 13 Font shapes (bold, italic) ....................................................................................................................... 13 Colors ........................................................................................................................................................ 13
Paragraph formatting .......................................................................................................... 14 What is a paragraph in Word? ............................................................................................................ 14 Alignment .................................................................................................................................................. 14 Indentation ............................................................................................................................................... 15 Lists ............................................................................................................................................................ 16
Unordered or Bulleted list ...................................................................................................... 16 Ordered or Numbered list ..................................................................................................... 16
Pictures .................................................................................................................................. 17
Tables ..................................................................................................................................... 18
Page layout ............................................................................................................................ 19
Keys, key combinations and their functions ................................................................. 20
Quick Access Toolbar ....................................................................................................... 21
2. PowerPoint 22
Basics of the use .................................................................................................................. 22 Running Microsoft PowerPoint ........................................................................................................... 22 Creating a new presentation ............................................................................................................... 23 Parts of the window ............................................................................................................................... 24 Prerequisites ............................................................................................................................................ 25

Your first presentation .......................................................................................................................... 25 Enter the text ............................................................................................................................. 25 Save the presentation ............................................................................................................... 26 Close the presentation ............................................................................................................. 26
Open a presentation .............................................................................................................................. 27
Design the layout ................................................................................................................ 27 Design templates ..................................................................................................................................... 27
Chose a theme ........................................................................................................................... 28 Choose a color scheme ........................................................................................................... 29
Slide layout ............................................................................................................................................... 30
Text ........................................................................................................................................ 31 Title slide................................................................................................................................................... 31 Content slides .......................................................................................................................................... 31
Pictures .................................................................................................................................. 32
Animations ............................................................................................................................ 34 Transitions ................................................................................................................................................ 34
Direction ...................................................................................................................................... 35 Timing ........................................................................................................................................... 35
Animations ................................................................................................................................................ 35 Types of animation .................................................................................................................... 35 Managing animations ................................................................................................................. 35
Viewing the slide show ...................................................................................................... 36
Considerations .................................................................................................................... 37 Choosing designs and colors ............................................................................................................... 37 Creating effective presentations ......................................................................................................... 38
3. Microsoft Excel 39
Basics of the use .................................................................................................................. 39 Run the Microsoft Excel ....................................................................................................................... 39 Creating a new workbook ................................................................................................................... 40 Parts of the window ............................................................................................................................... 41 Data ............................................................................................................................................................ 42 Prerequisites ............................................................................................................................................ 42 Denotations.............................................................................................................................................. 42 Mouse pointer (or cursor) shapes and functions in Excel ........................................................... 43
Your first workbook .......................................................................................................... 44 Names and areas ..................................................................................................................................... 44 Entering data ............................................................................................................................................ 45 Save the workbook ................................................................................................................................ 45 Print the workbook................................................................................................................................ 46 Close the document .............................................................................................................................. 47
Basics of calculations .......................................................................................................... 47 Data types ................................................................................................................................................. 47 Simple data and simple formulas ......................................................................................................... 48
Functions ............................................................................................................................... 50 Often used functions – An exercise .................................................................................................. 52
Absolute and relative cell references ............................................................................. 54 Relative references ................................................................................................................................. 54 Absolute references ............................................................................................................................... 56
Charts .................................................................................................................................... 58

6
4. Microsoft Project 59
Project Management ........................................................................................................... 59 What is a project? .................................................................................................................................. 59 How to plan a project? .......................................................................................................................... 60
Scope and goal management ................................................................................................... 60 Task, activity management ...................................................................................................... 60 Resource management ............................................................................................................. 60 Risk management ....................................................................................................................... 61 Communication management ................................................................................................. 62
Running the Microsoft Office Project ............................................................................ 62 Prerequisites ............................................................................................................................................ 62 Parts of the window ............................................................................................................................... 63
Developing a project .......................................................................................................... 64 Create a new project............................................................................................................................. 64
Project settings .................................................................................................................... 65 Start date .................................................................................................................................................. 65 Calendars .................................................................................................................................................. 65 Rates .......................................................................................................................................................... 68
Tasks ...................................................................................................................................... 68 Simple tasks .............................................................................................................................................. 69 Milestones ................................................................................................................................................. 69 Recurring tasks ........................................................................................................................................ 70 Summarizing tasks ................................................................................................................................... 70 Inserting, deleting tasks, changing task level and options ............................................................. 71
Duration ................................................................................................................................ 72
Scheduling tasks ................................................................................................................... 72 Links ........................................................................................................................................................... 72 Predecessors ............................................................................................................................................ 73
Managing resources ............................................................................................................ 75
Views...................................................................................................................................... 77 Gantt Charts ............................................................................................................................................ 77 PERT diagram – Network Diagram ................................................................................................... 77 Critical path – Tracking Gantt............................................................................................................. 78

7
Microsoft Word
This chapter will help you to get to know the basics of Microsoft Word
as a part of introduction to computer science. You can learn the basic
functionalities of the software and how to create, open,
save and close Microsoft Word documents.
Microsoft Word is a multipurpose word processing software: it can create a simple letter as well as
large documents with hundreds of pages containing texts, tables, figures and charts; it has tools for
designing invitation cards as well as designing and creating web pages. From this chapter you can
learn the basics of text editing with Microsoft Word (later referred to as “Word” or “the program”
only).
Those files that the Microsoft Word can create are called documents.
We refer to the name of the menus or menu items, buttons, ribbons or keys on the keyboard with bold
face font shape, such as “File menu”, “Shading button”, “Home ribbon”, or “press Enter”.
“Click” means clicking with the left mouse button. We indicate by “right click” if you need to use the
right button of the mouse. Let’s start now!
Basics of using Microsoft Word
Running the Microsoft Word
When you Run the
Microsoft Word, choose the
Windows’ Start menu;
from Programs choose
Microsoft Office and then
Microsoft Word 2010, then
you get an empty
document.
Chapter
1

A SHORT I NTRODUCTION TO MICRO SOFT OFFICE
8
Creating a new document
When the Microsoft Word is running and you need a new document:
1. Click on the File tab
2. Select the New menu item
3. Select the Blank document from the Available Templates group
4. Click on the Create button
Then you will get a blank Microsoft Word document.

MICROSOFT WORD
9
Parts of the Word document window
On the picture you can see some important parts of the Word window:
1. File menu
2. Ribbons’ Name Tags
3. Ribbon (Home ribbon)
4. Quick Access Toolbar
5. Name of the document
6. Rulers
7. Insertion point: a blinking
vertical line (cursor in text
editing mode) that shows the place where you can enter/write in or edit the text.
If you do not see the rulers in the Word window, click on the View ribbon name, and mark
the Ruler check box ( Ruler) in the Show part of the View ribbon. Rulers and the format
indicators on them can be very useful during text formatting.
Prerequisites
We cannot deal with all parts of computer use. We assume that you can use computers and you
have some knowledge about computers, keyboards and Windows. We assume that you have
knowledge about parts of computer science, for example you know what file and folder mean,
and you can find them on the computer. You can find a small table on page 20 with some
important key commands that you should know if you want to work with Microsoft Word.
Hidden marks for text formatting
Show/Hide button on the Home ribbon (P): If the button is on, you can see the hidden marks
which control the format of the text. You can turn off this function by clicking on it again.
Paragraph mark ( ): This ends a
paragraph and opens a new one. By
pressing the Enter key, you insert a
paragraph mark that closes the given
paragraph.
You can see two paragraph marks in
the red circle (E) that have to be
deleted.
A space (S) is represented by a dot ()
when the Show/Hide button is on.
It can be inserted by pressing the
spacebar.
P
E S

A SHORT I NTRODUCTION TO MICRO SOFT OFFICE
10
Your first document
Enter the text
You have already created a document by running the Microsoft Word program. Now you have
a blank document. Please, turn on the Show/Hidden button in the Paragraph part of the Home
ribbon (see above). You can see an empty paragraph: one paragraph mark and the blinking
cursor to the left. Type the following text into the document:
A windmill is a machine which converts wind energy into rotational energy
by means of vanes called sails or blades.
Please, do not press Enter at the end of the lines, just at the end of a paragraph. The Word
recognizes if a word does not fit into a line. In this case Word puts that word into the next line. If
you press Enter at the end of a line, it will be impossible or very difficult to format the
paragraphs. (There are some exceptions, we deal with them later.)
Do not use
Enter inside paragraphs to get a new line inside the paragraph;
more than one Enter between paragraphs;
spaces inside words;
more than one space between words.
Save the document
In Word more tools are available for saving documents:
You can simply click on the small disk ( ) on the Quick
Access Toolbar. You can choose the Save command from the
File menu. The third way: hold down the Ctrl key while
pressing S on the keyboard. If you save a document the first
time, you will get the Save As dialog box when you choose
the Save item. The files need to be saved in a proper folder,
with a meaningful name. In the File name field, give the
“Windmill_1” name to the document now. Create and open
a Windmills folder in the My Documents folder.
Save the file there.
The default file extension of a Word
2010 document is docx.
So there will be saved a
Windmill_1.docx file in the My
Documents/Windmills folder.
Save icon

MICROSOFT WORD
11
Print the document
Before you print a document, it is worth checking
the final layout of the document on the screen.
Click on the Print Preview and Print button (A) on
the Quick Access Toolbar. Check the pages by using
the scroll bar. If changes are required, return to the
document editing mode by pressing the Esc key on
the keyboard, make the changes and come back to
the print preview. On the left side of the window
you can see the options of the Print menu. You can
get the same menu if you choose the Print
command from the File menu. Choose the
appropriate printer, make the settings, and click on
the Print button (B).
Close the document
You can close the document by choosing the Close
command from the File menu, or by clicking the
button at the upper-right corner of the window. You can close the Microsoft Word program
by choosing the Exit command from the File menu.
Open a document
If you want to open an existing (already saved) document, the easiest way is to double click
on the name or the icon of the given document in an explorer window. It launches the
Word program and loads the document.
You can open a document from the Word program, too. If you run the Word, choose Open
from the File menu. In the Open dialog box, you have to find and select the file you want to
open. Double click on the file name, or click on the file name and the Open button below.
A
B

A SHORT I NTRODUCTION TO MICRO SOFT OFFICE
12
Character formatting
Typefaces and Fonts
Purposes
There are many typefaces that you can use in Word. These
typefaces were designed for various purposes. Here I list some
typefaces you can choose for special purposes:
Long printed documents – such as books, dissertations and
essays – the following typefaces are proposed:
Garamond, Palatino Linotype, Book Antiqua. These
typefaces are perfect for reading hundreds of pages.
Newspapers: There are some typefaces for typesetting
newspapers, such as Times New Roman or Times. These
were designed for reading only some pages at a time.
Screen: Because many documents are read on computer screen
or tablets, etc., some typefaces were optimized for
reading on screen. Such typefaces are, for example,
Georgia and Verdana or Cambria and Calibri. You can
also use Palatino here – it is easy to read.
The most important factors that we have to keep in mind
when choosing fonts for a document:
purpose of the document,
target group,
media (screen or paper, what kind of paper?),
legibility.
Changing fonts
More fonts belong to a typeface, such
as Gill Sans MT, Gill sans MT
Condensed, etc. There is a default
font in every Word document that
you can change from a drop-down
menu on the Font part of the Home
menu. Select the text you want to
change. Click inside the Font field.
Scroll through the list until you have
found the font, then click on it.
Garamond
Palatino Linotype
Century Schoolbook
Book Antiqua
Times New Roman
Times
Georgia
Elephant
Verdana
Cambria
Calibri
Egyptian 505 BT
Oregon LDO Medium
Bradley Hand ITC
English 111 BT
AvantGarde
Helvetica
Arial
Gill Sans MT
Gill Sans MT Condensed
Humanist UBlk BT
MICROSOFT WORD
13
Font sizes
We have to define the size of the fonts we need for the text. The size we have to choose depends
on the font we use, and on the purpose of the document (essay or invitation card).
For a dissertation or an essay printed on A4 or legal papers (see later), we can use
10 pt, 11 pt or 12 pt for Palatino Linotype
12pt, 13 pt, 14 pt for Garamond
10 pt, 11 pt or 12 pt for Book Antiqua
9 pt, 10 pt, 11 pt or 12 pt for Times New Roman
To change the font size, first select (highlight) the text you want to
change. Click on the drop-down arrow next to the Font field. Select
the font size you need. If the number you want to select is not on the
list, you can enter it into the Font Size field, then press Enter. The
size must be between 1 and 1638 pt.
Font shapes (bold, italic)
To emphasize the part of the text we use various font
shapes. In a printed text, emphasized texts are in italics,
in electronic documents it is more often in bold.
1. Highlight the text
2. Click on the B icon for getting boldface letters,
or
3. Click on the I icon for making the text in italics
There are more possibilities for character foormatting in Word. Some of them can be used
from the Font part of the Home ribbon. You can find the other options if you click on the
small arrow on the lower right corner of the Font part.
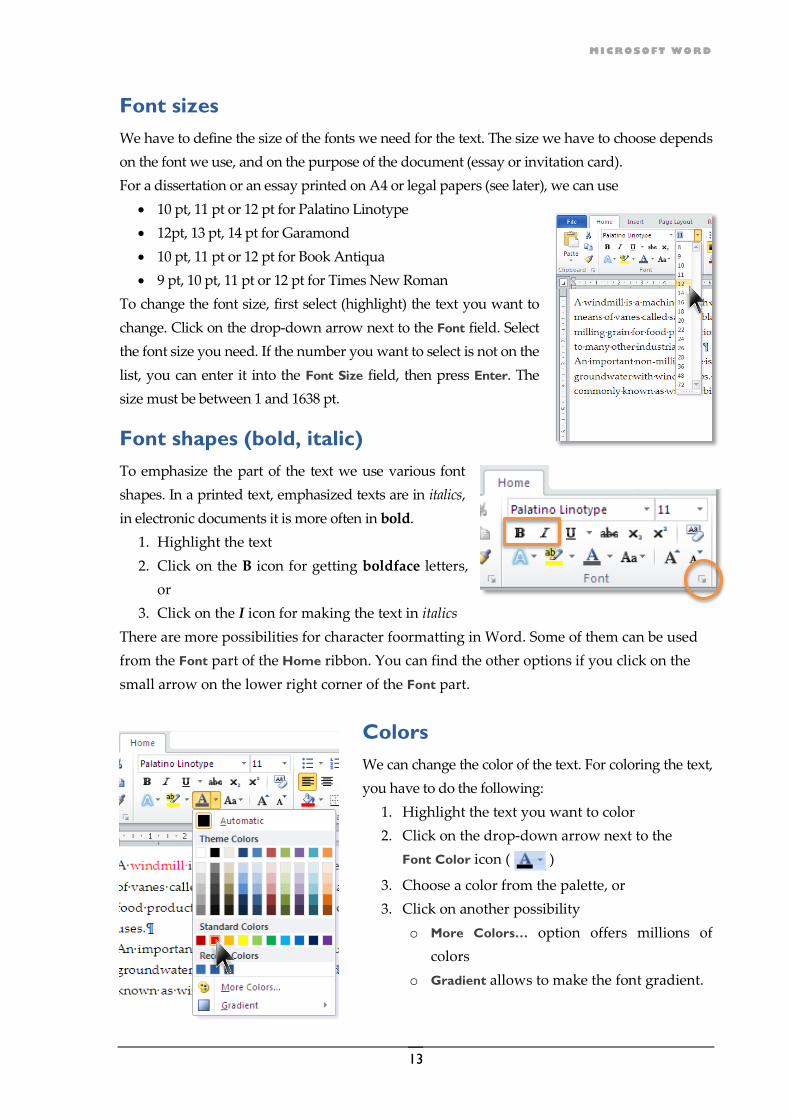
Colors
We can change the color of the text. For coloring the text,
you have to do the following:
1. Highlight the text you want to color
2. Click on the drop-down arrow next to the
Font Color icon ( )
3. Choose a color from the palette, or
3. Click on another possibility
o More Colors… option offers millions of
colors
o Gradient allows to make the font gradient.
A SHORT I NTRODUCTION TO MICRO SOFT OFFICE
14
Paragraph formatting
What is a paragraph in Word?
There are paragraphs which are paragraphs in a grammatical sense. In this case you have to
type the text of the paragraph continuously. You have to press Enter only at the end of the
paragraph.
There is another type of “paragraph” that the Word uses for text formatting. You can see such
“technical paragraphs” in a list, where you have to press Enter at the end of the list item.
A grammatical paragraph Technical paragraphs
According to the point of view of the Word, a paragraph is all text between two
occurrences of the paragraph mark (or Enter, ).
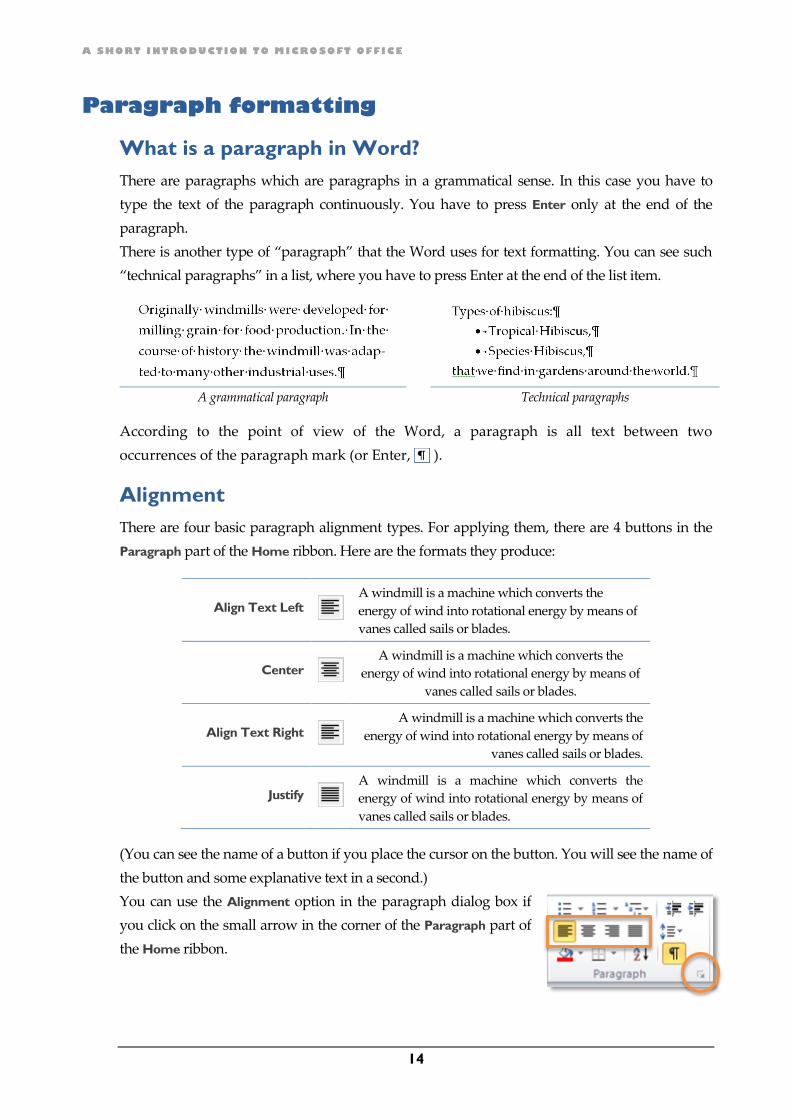
Alignment
There are four basic paragraph alignment types. For applying them, there are 4 buttons in the
Paragraph part of the Home ribbon. Here are the formats they produce:
Align Text Left
A windmill is a machine which converts the
energy of wind into rotational energy by means of
vanes called sails or blades.
Center
A windmill is a machine which converts the
energy of wind into rotational energy by means of
vanes called sails or blades.
Align Text Right
A windmill is a machine which converts the
energy of wind into rotational energy by means of
vanes called sails or blades.
Justify
A windmill is a machine which converts the
energy of wind into rotational energy by means of
vanes called sails or blades.
(You can see the name of a button if you place the cursor on the button. You will see the name of
the button and some explanative text in a second.)
You can use the Alignment option in the paragraph dialog box if
you click on the small arrow in the corner of the Paragraph part of
the Home ribbon.

MICROSOFT WORD
15
Indentation
Indentation belongs to paragraphs.
Types of indentation:
1. First line indentation
2. Left side indentation of a
whole paragraph
3. Right side indentation of a
whole paragraph
4. Hanging indentation
5. Spacing above and/or below a
paragraph
Click on the small arrow at the
lower right corner of the Paragraph
part of the Home ribbon and you
get the Paragraph dialog box.
1. First line indentation: you can choose
it from the Special drop-down
menu. Set the size of the indentation
in the By field
2. Left side indentation of paragraphs: The
Left in the Indentation part. It is zero
by default. Here you can give
another measure of the indentation.
3. Right side indentation: The Right field
of the Indentation part. Similar to the
Left one.
4. Hanging paragraph: You can
choose this shape from the Special
menu, and can give its size in the By
field.
5. You can control the distance of
paragraphs here. In the Spacing part,
the Before can create spacing above,
the After below the paragraph.
6. Line spacing: distance of baselines
inside a paragraph.

A SHORT I NTRODUCTION TO MICRO SOFT OFFICE
16
Lists
We use lists where we want to emphasize a number of things,
tasks, etc. A list gives a structure to the message. There are two
types of lists: Unordered (or Bulleted), and Ordered (or
Numbered). In the paragraph group of the Home ribbon, there are
three buttons and three drop-down arrow next to them for
applying these formats:
Bullets, Numbering and Multilevel list. (You can see the name of the button if you place the cursor
on it. You will see the name of the button and some explanative text right away.)
Unordered or Bulleted list
Unordered lists are sometimes called bulleted list. We use
this type of list if the order of the items is not important,
they do not have a required order. For example:
Computer peripherals:
computer printers
image scanners
microphones
Final, printed layout of a bulleted list
For formatting a bullet list, a paragraph mark has to be
placed at the end of each list item. Put the cursor into a paragraph or select the paragraphs you
want to format as bulleted list items, and then click on the Bullets button on the Home ribbon.
Ordered or Numbered list
We used numbered list when the order of the items is important, because they have a natural
order, or they have a specific ranking. The writer wants to give an order for the listed items, or
they have an obligatory order. For example:
The first three project steps:
1. Define the scope
2. Determine available resources
3. Check the timeline
Final, printed layout of a numbered list
For expressing the order, we can use
Arabic numbers (1, 2, 3, etc.), uppercase letters (A, B, C, etc.) lowercase letters (a, b, c, etc.) or
uppercase Roman numerals (I, II, III, etc.), or lowercase Roman numerals (i, ii, iii, etc.).
There is a paragraph mark at the end of each list item. Put the cursor into a paragraph or select
the paragraphs you want to format as numbered list items, then click on the Numbering button.

MICROSOFT WORD
17
Pictures
Often you need images, illustrations in your document. For inserting an illustration you have to
choose the Insert ribbon. Place the insertion point where you want to insert the illustration, then
follow the instructions below:
1. Click on the Picture
button in the Illustration
group.
2. Select the picture
(click on it).
3. Click on the Insert
button at the
bottom
of the dialog box.
If you have inserted a picture into a document, you can use the Format ribbon. Click on the
picture you want to format, click on the Format tab on the right of the standard ribbon tags, then
you will see the Format ribbon. (If the window is wide enough, you can see the name of all
buttons.)
The functions of the Adjust group of the ribbon provide tools for modifying the pictures. For
example you can change the brightness, the color of the picture. You can give an artistic effect to
it, and restore ( ) the picture if you need its original form. In the Picture style group,
you can find tools to ensure the displaying effect. The Arrange part is for arranging and placing
the picture. In the Size group you can modify the size of the picture by giving new vertical and
horizontal sizes for the picture, and – with the cropping tool – you can cut off those parts that
you do not need.
A SHORT I NTRODUCTION TO MICRO SOFT OFFICE
18
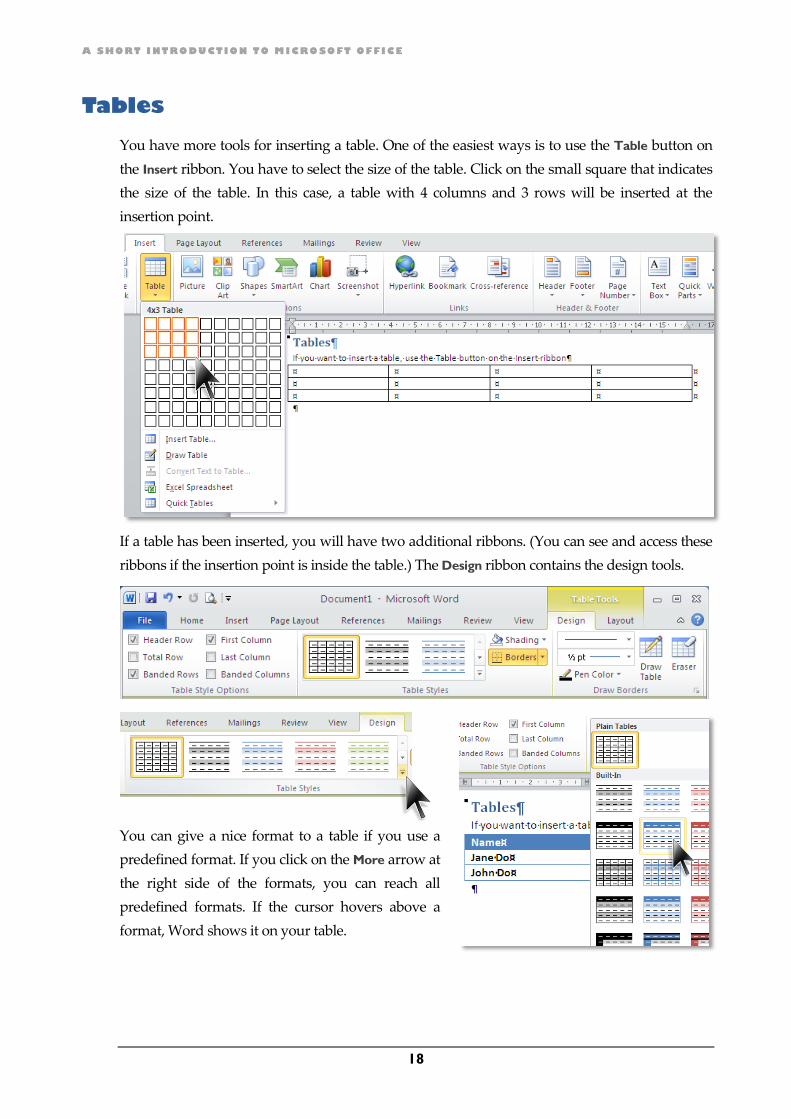
Tables
You have more tools for inserting a table. One of the easiest ways is to use the Table button on
the Insert ribbon. You have to select the size of the table. Click on the small square that indicates
the size of the table. In this case, a table with 4 columns and 3 rows will be inserted at the
insertion point.
If a table has been inserted, you will have two additional ribbons. (You can see and access these
ribbons if the insertion point is inside the table.) The Design ribbon contains the design tools.
You can give a nice format to a table if you use a
predefined format. If you click on the More arrow at
the right side of the formats, you can reach all
predefined formats. If the cursor hovers above a
format, Word shows it on your table.

MICROSOFT WORD
19
The Layout ribbon contains those commands that you can use to modify the structure of the
table. For example, you can insert or delete rows and columns; split or merge cells; set the height
of a row or the width of a column; define the alignment of the texts in cells.
Page layout
If you want to print a document, you have to know the size of the sheet of paper you would like
to print on. In our country, the A4 is the common paper size. Click on the Size drop-down menu
in the Page Setup group, select the A4 size. After choosing the proper paper size, you can choose
the margin sizes by opening the Margins
drop-down menu. A margin is the distance
of the text and the edge of the sheet. Select
the last option from the menu: Custom
Margins. Here you can set the size of the
margins.

A SHORT I NTRODUCTION TO MICRO SOFT OFFICE
20
Keys, key combinations and their functions
Key or
Key combinations Functions If nothing is selected If something is selected
[Enter] Paragraph
Close the given paragraph
and open a new paragraph.
Use it only at the end of a
paragraph
Replace what has been selected
with an “end of paragraph”
[Del] Delete
Delete the character or other
object that is to the right of
the cursor
Delete what has been selected
[Backspace] Delete
Delete the character or other
object that is to the left of the
cursor
Delete what has been selected
[Ctrl] + A Select All Select the whole document same
[Ctrl] + S Save Save the file same
[Ctrl] + C Copy Copy what has been selected onto
the clipboard
[Ctrl] + X Cut Delete what has been selected and
put it on the clipboard
[Ctrl] + V Paste
Paste the texts or objects from
the clipboard into the
document
Delete the selected text and paste
the texts or objects from the
clipboard into the document.
[Ctrl] + Z Undo Undo the action that has
been performed last
[Ctrl] + Y Redo Redo the action which was revoked by “Undo”
[Ctrl] + [Enter] New page Open a new page at the insertion
point
Delete the selected text and
open a new page
[Shift] + [Enter] New line Open a new line in a paragraph Delete the selected text and
open a new line

MICROSOFT WORD
21
Quick Access Toolbar
We have to mention the Quick Access Toolbar that can be found on the program window of
almost each software of Microsoft Office. This toolbar contains the frequently used commands,
and can contain any command that you use often. By default, it is on the upper left corner of the
window, and contains the Save, the Undo and the Redo commands.
Save: Saves the file.
Undo: Revokes the last performed operation. If you
want to revoke more than one operation, click
the drop-down arrow next to the Undo button.
You will get the list of some performed
operations. Click that one from then you want to
revoke every operation.
Redo: If you undo some operations, you can redo them by clicking the Redo button. If
you want to redo more than one revoked operation, click the drop-down arrow
next to the Redo button, then click the required operation in the list.
This menu is independent from the ribbons you can see.
Those commands that you use often can be put here. Some of the commonly used commands
are listed in the Customize Quick Access Toolbar drop-down menu that you can find on the right
side of this toolbar.
If you want to assign more commands to the Quick Access
Toolbar you have two possibilities:
Click the More Commands option in the Customize
Quick Access Toolbar drop-down menu and choose
the command that you want to put into the small
menu.
Click on the button/icon of the command on any
ribbon, then – in the shortcut menu that appears –
choose the Add to the Quick Access Toolbar option.
22
PowerPoint
This chapter will help you to get to know the basics of Microsoft PowerPoint
as a part of introduction to computer science. You can learn how to create,
open, save and close Microsoft PowerPoint presentations and
how to format objects, how to design and make presentations and how to assign
animations to objects.
In Microsoft PowerPoint you can design and create presentations that contain various design
elements, texts, charts and tables, or pictures, movies and animations. You can use a number of
templates to make presentations easier and faster. You can save your file as an editable presentation or
a slide show.
These presentations are projected generally by a projector. It means that you have to keep in mind that
you will have an audience that would like to see the contents of your slides. You have to pay attention
to the motivational techniques, too. When you give a lecture, the slideshow you are projecting has to
move along with your oral presentation. The oral presentation and the projected slide show will give
an impression to your audience. You have to pay attention to this during the design process.
Basics of the use
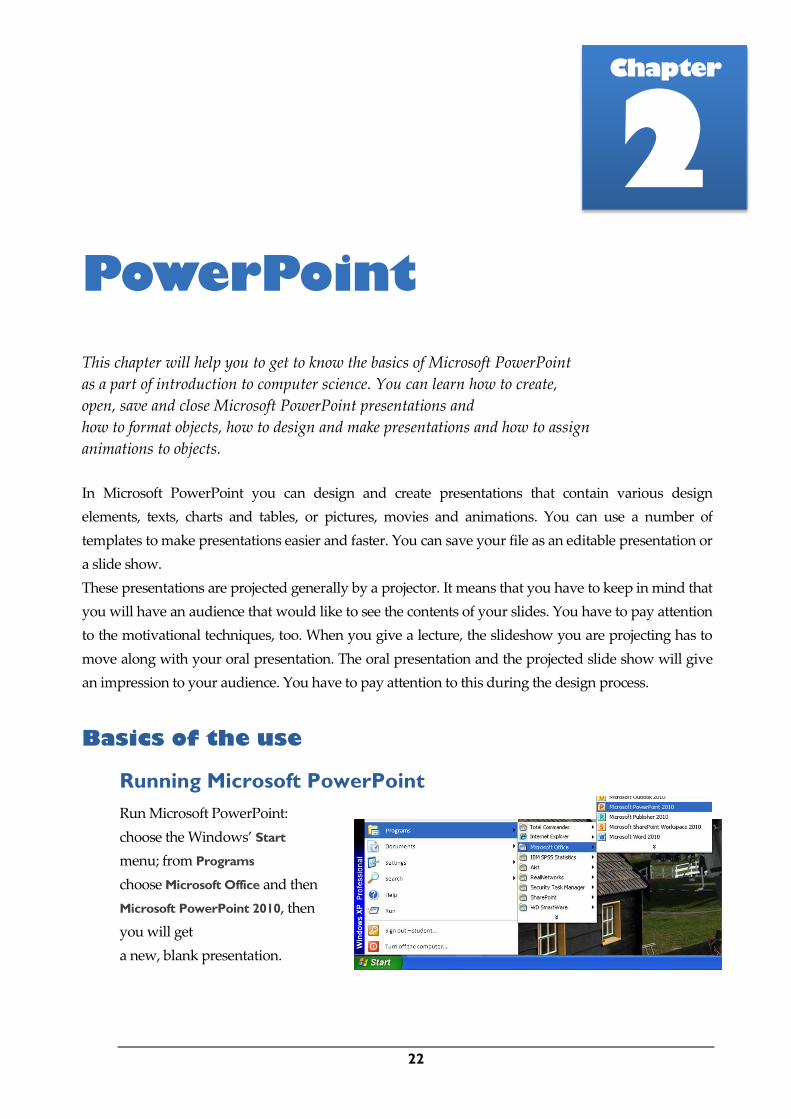
Running Microsoft PowerPoint
Run Microsoft PowerPoint:
choose the Windows’ Start
menu; from Programs
choose Microsoft Office and then
Microsoft PowerPoint 2010, then
you will get
a new, blank presentation.
Chapter
2
MICROSOFT POWERPOINT
23
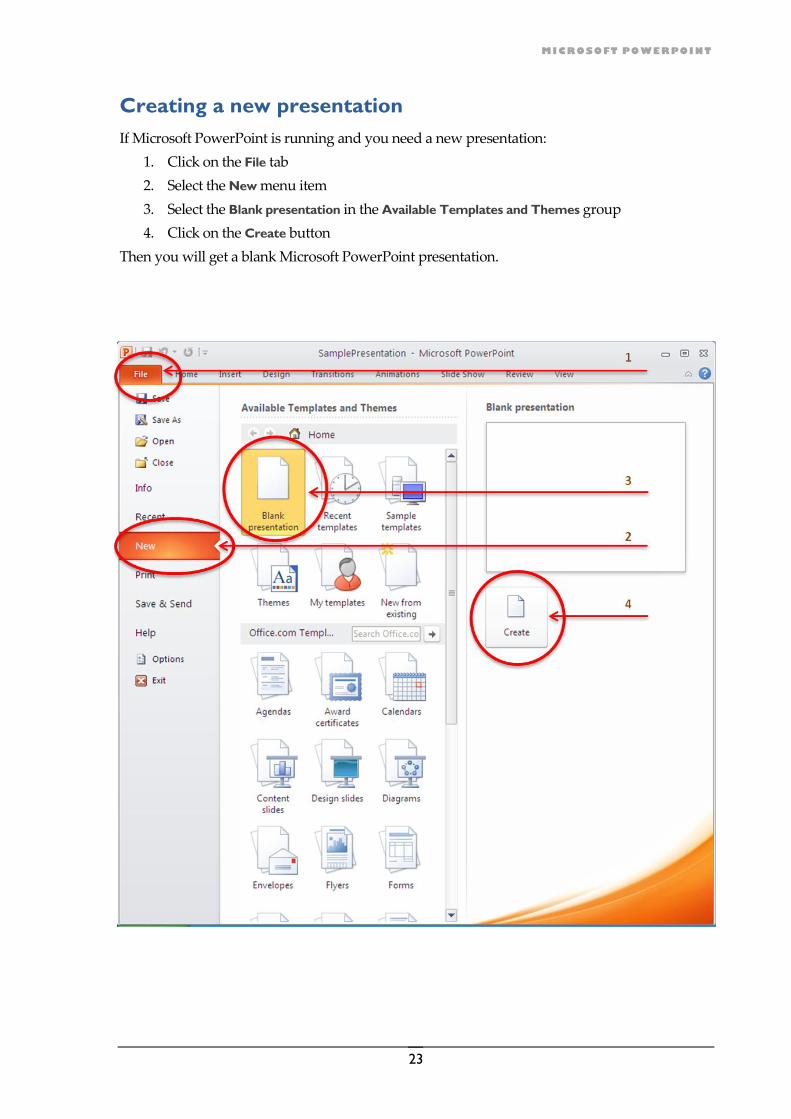
Creating a new presentation
If Microsoft PowerPoint is running and you need a new presentation:
1. Click on the File tab
2. Select the New menu item
3. Select the Blank presentation in the Available Templates and Themes group
4. Click on the Create button
Then you will get a blank Microsoft PowerPoint presentation.

A SHORT INTRODUCTION TO MICROSOFT OFFICE
24
Parts of the window
The PowerPoint window is divided into three useful parts that we use in editing presentations:
Slides View, Normal View and Notes Pages.
The Normal View is for editing the slides. In the Notes Pages you can write notes for each slide.
In the Slide View you can control the order of the slides and can change the slide in the Normal
View.
1. File tab
2. Ribbons’ names/tags
3. Ribbon groups
4. Ribbon commands
5. Quick Access Toolbar
6. Name of the presentation
7. Rulers
8. View buttons
9. Zoom slider
MICROSOFT POWERPOINT
25
Prerequisites
We cannot deal with all parts of computer use. We suppose that you can use computers or you
have some knowledge about computers, keyboards and Windows. We assume that you have
knowledge about certain parts of computer science, for example you know what a file or folder
mean, and you can find them on the computer. You can find a small table on page 20 with some
important key commands that it is good to know if you want to work with Microsoft
PowerPoint.
Your first presentation
Enter the text
You have already created a presentation by running the Microsoft PowerPoint program, or by
creating a new, blank presentation from the File menu of PowerPoint. So you have a blank
presentation.
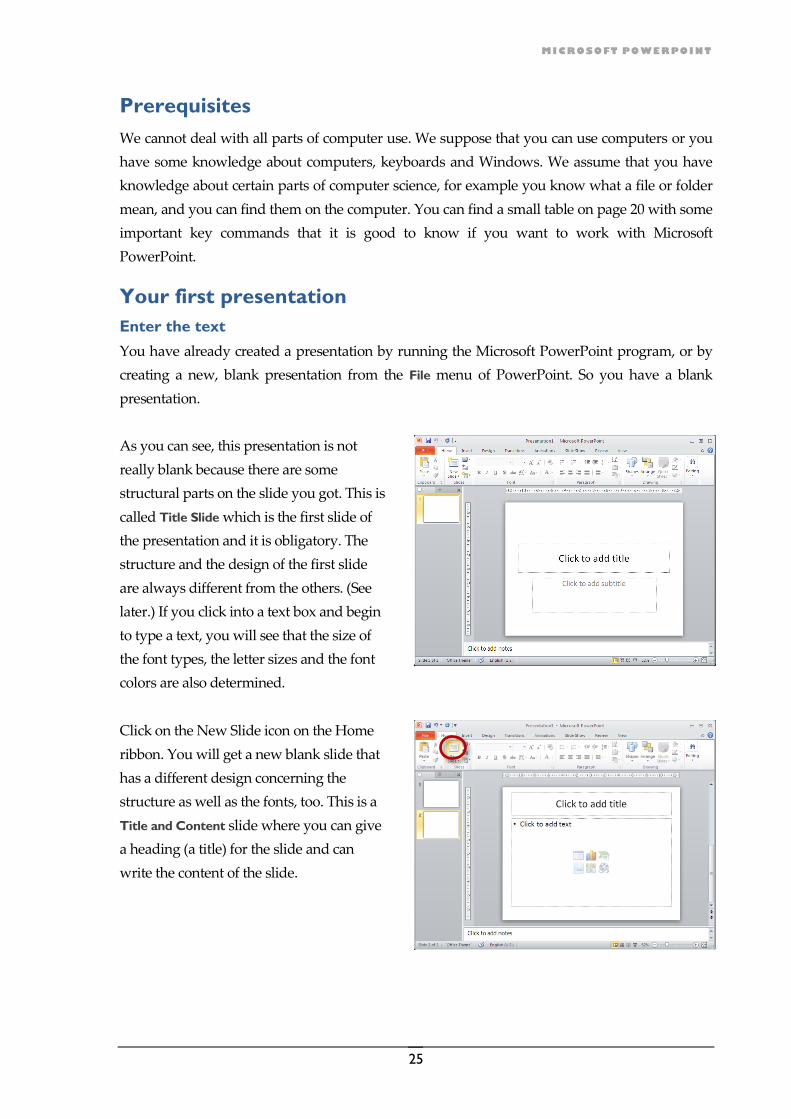
As you can see, this presentation is not
really blank because there are some
structural parts on the slide you got. This is
called Title Slide which is the first slide of
the presentation and it is obligatory. The
structure and the design of the first slide
are always different from the others. (See
later.) If you click into a text box and begin
to type a text, you will see that the size of
the font types, the letter sizes and the font
colors are also determined.
Click on the New Slide icon on the Home
ribbon. You will get a new blank slide that
has a different design concerning the
structure as well as the fonts, too. This is a
Title and Content slide where you can give
a heading (a title) for the slide and can
write the content of the slide.

A SHORT INTRODUCTION TO MICROSOFT OFFICE
26
Save the presentation
More tools are available in the PowerPoint for saving
a document:
You can simply click on the small disk
( ) on the Quick Access Toolbar.
You can choose the Save command from
the File menu.
The third way: hold down the Ctrl key
while pressing S on the keyboard
(Ctrl + S).
If you have used any of these three possibilities,
and if you save this presentation for the first time,
you will get the Save As dialog box (see below).
The files must be saved in a proper folder, with a meaningful file name.
Open the Windmills folder in the My Documents folder if you have got it.
If you do not have this folder, create it with the Create New Folder button ( ) and
then open a Windmills folder. In the File name field, write the
“Windmill_presentation” that will be the name of the presentation file.
Click on the Save button.
The default file extension of a Word 2010 presentation is pptx.
So you will have a Windmill_presentation.pptx file in the My Documents/Windmills folder.
Close the presentation
You can close the document by choosing the Close command from the File menu, or by
clicking the button at the upper-right corner of the window. You can close the Microsoft
Word program by choosing the Exit command from the File menu.
Save icon

MICROSOFT POWERPOINT
27
Open a presentation
If you want to open an existing (already saved) presentation, the easiest way is to double
click on the name or the icon of the given presentation in an explorer window or on the
desktop. It launches the PowerPoint program and loads the presentation.
You can open a presentation from
the PowerPoint program, too. If
the PowerPoint is running, choose
Open from the File menu. In the
Open dialog box, you have to find
and select the file you want to
open:
Double click on the file name,
or
Select the file you want to
open in the dialog box click
on the Open button below.
Design the layout
Design templates
When you have created a new, blank presentation, it is good to apply a design template for your
slide show. If you are familiar with graphical design and desktop publishing, you can design
your own presentation layout. If not, you can use a number of designed PowerPoint templates.
A design template must coordinate the whole layout of the slide show. You can see here some
important elements of a design template:
It provides background to the slides.
Defines the structure of the title slide and the other slides, as well.
Defines the typefaces, as well as the letter sizes and colors.
Usually there are many graphical design elements in a template, such as bullets, rules or
buttons for ameliorating the visual effect of the slide show.
Sets the language of the slides.
There are many design templates installed on your computer, but the Microsoft’s web site also
offers a lot, and many other places can be found on the web that offer free templates or sales
many others. Here we use only some installed templates.
Thee default template is the Normal template that you use if you do not choose any other
template.

A SHORT INTRODUCTION TO MICROSOFT OFFICE
28
Chose a theme
When you have created a presentation, first you have to choose a Theme that determines the
overall layout of the slide show.
Click on the tab of the Design ribbon. On the Design ribbon you can find several settings which
are related to the appearance of the slides. Here we deal with the themes represented by
templates.
First in the Themes group of the Design ribbon, choose a theme by clicking on the sample
picture.
You can see the layout of the title slide of six themes on the next figure.

MICROSOFT POWERPOINT
29
Choose a color scheme
If you do not like the color set of a
theme, you can change it to another
color set. Most themes contain built in
color sets as you can see on this
figure.
Click on the drop-down arrow
of the Color option in the
Themes group of the Design
ribbon.
Choose a color set.
Click on that one you want to
apply for this presentation
The color set defines the colors of the
background, the letters, the applied
graphical design elements, etc.
Here you can see some samples on the effects of choosing different color schemes on a theme.
A SHORT INTRODUCTION TO MICROSOFT OFFICE
30
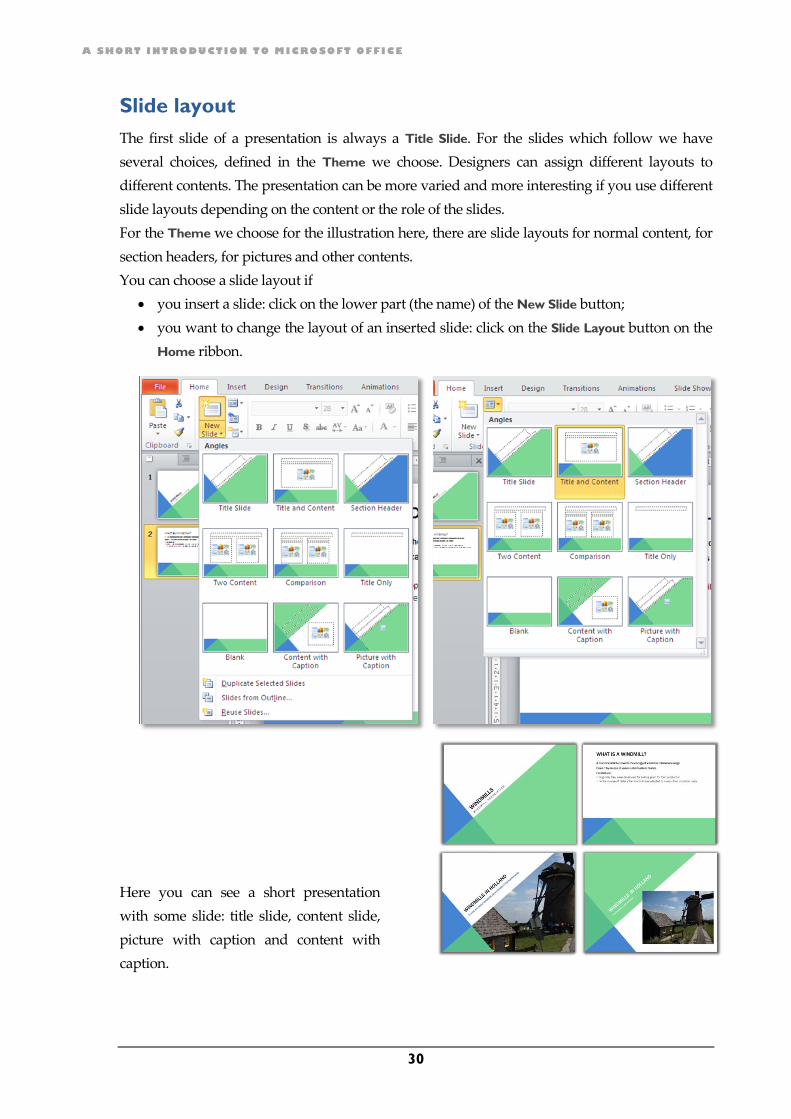
Slide layout
The first slide of a presentation is always a Title Slide. For the slides which follow we have
several choices, defined in the Theme we choose. Designers can assign different layouts to
different contents. The presentation can be more varied and more interesting if you use different
slide layouts depending on the content or the role of the slides.
For the Theme we choose for the illustration here, there are slide layouts for normal content, for
section headers, for pictures and other contents.
You can choose a slide layout if
you insert a slide: click on the lower part (the name) of the New Slide button;
you want to change the layout of an inserted slide: click on the Slide Layout button on the
Home ribbon.
Here you can see a short presentation
with some slide: title slide, content slide,
picture with caption and content with
caption.

MICROSOFT POWERPOINT
31
Text
In the previous section you saw how you could choose a design template or a color scheme.
If you have chosen a layout, you can begin to edit the presentation. The placeholders of the
slides will help you to organize the content and to design your whole oral presentation.
Title slide
As default, the first slide has a Title Slide layout in a new presentation.
Here you can enter the title of the presentation into the proper placeholder (Click to add title);
and the subtitle and your name into the placeholder of the subtitle. The layout is determined by
the selected theme.
Content slides
For the content you can choose several layouts. Here you can see a Title and Content layout.
Add a title for the slide. You can enter the text into the big placeholder. The text usually appears
in multilevel bulleted list by default. You can change the list levels by using the Increase List
Level and Decrease List Level buttons which are in the Paragraph group of the Home ribbon.
A SHORT INTRODUCTION TO MICROSOFT OFFICE
32
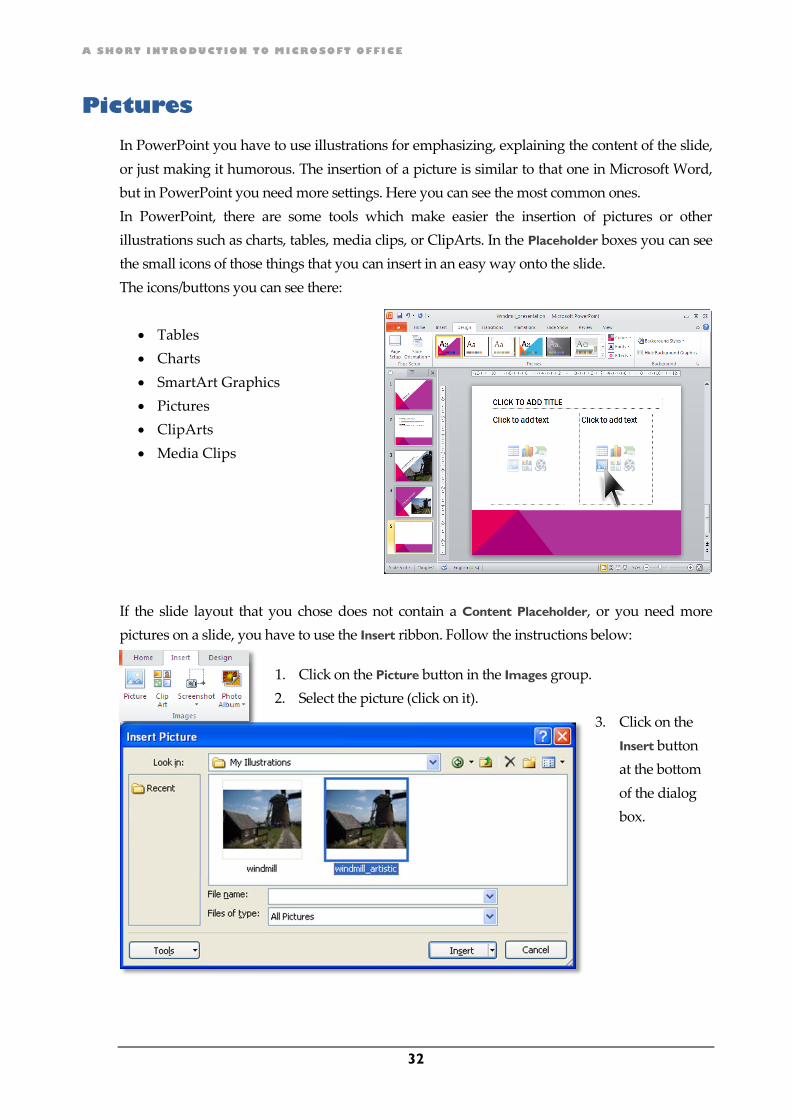
Pictures
In PowerPoint you have to use illustrations for emphasizing, explaining the content of the slide,
or just making it humorous. The insertion of a picture is similar to that one in Microsoft Word,
but in PowerPoint you need more settings. Here you can see the most common ones.
In PowerPoint, there are some tools which make easier the insertion of pictures or other
illustrations such as charts, tables, media clips, or ClipArts. In the Placeholder boxes you can see
the small icons of those things that you can insert in an easy way onto the slide.
The icons/buttons you can see there:
Tables
Charts
SmartArt Graphics
Pictures
ClipArts
Media Clips
If the slide layout that you chose does not contain a Content Placeholder, or you need more
pictures on a slide, you have to use the Insert ribbon. Follow the instructions below:
1. Click on the Picture button in the Images group.
2. Select the picture (click on it).
3. Click on the
Insert button
at the bottom
of the dialog
box.

MICROSOFT POWERPOINT
33
If you have inserted a picture into a document, you can use the Format ribbon. Click on the
picture you want to format, click on the Format tab on the right of the standard ribbon tags, then
you will see the Format ribbon. (If the window is wide enough, you can see the name of all
buttons.)
The functions of the Adjust group of the ribbon give tools for modifying the pictures. For
example you can change the brightness, the color of the picture. You can give an artistic effect on
it, and restore ( ) the picture if you need its original form. In the Picture style group,
you can find tools for giving displaying effect. The Arrange part is for arranging and placing the
picture. In the Size group you can modify the size of the picture by giving new vertical and
horizontal sizes for the picture, and – with the cropping tool – you can cut off those parts that
you do not need.
If you insert a picture onto a slide, you can add special effects to it. Here there are two slide
designs with two different and built-in 3D effects

A SHORT INTRODUCTION TO MICROSOFT OFFICE
34
Animations
There are two kinds of animation in PowerPoint:
animated slide transitions – called Transitions
animations of objects such as pictures, texts, etc. on slides and called Custom Animations
or just Animations
Transitions
Slide transition is an animated transition of a slide from the previous one. It determines how the
given slide appears. You can reach them from the Transition ribbon. The transitions that we
demonstrate on these two slides are set on the second slide.
There are many types of transitions. You can use simple transitions that need less power from
the computer. For example, Push is such transition. It pushes the previous slide out from bottom
to top as default, from top to bottom, from left to right or from right to left. On the next figure
you can see the effects of the following transitions with their default settings: Push, Shape, and
Dissolve.
There are some complicated, which are more attractive, but needs more effort from the
hardware.
Here we demonstrated the effects of three Exciting transitions: Cube, Shred, and Vortex.

MICROSOFT POWERPOINT
35
You have some possibilities for modifying some default settings of the transitions:
Direction
Some transitions give possibilities for modifying the direction of the transition. For example, the
direction at the Push transition can be modified From bottom to top to From left to right.
Timing
In the Timing group of the Transition ribbon mainly you can set the timing options of the
transitions, such as Duration. You can set here if you do not need mouse click for appearing the
next slide. If not, you can set after how any time should the slide disappear. You can make a
movie with the help of this option. In the Sound field of this group, you can assign sound effect
or music to the transition.
Animations
PowerPoint allows you to assign animations to any object of a slide, or make new effects by
giving the paths of motions. For accessing the possibilities, click on the Animations tab. On the
Animation ribbon you can use the settings if an object is selected. (Many themes include the
animations of the objects inserted in the predefined placeholders. If you want to modify them or
there are more objects on the slide, you can use the ribbon of custom Animations.)
Types of animation
First, select a picture on this slide, and then you can see the animation types on the Animations
ribbon. There are three groups of animations:
Entrance animations: The object appears on the projected slide. (Color: Green)
Emphasis animations: The object is emphasized on the projected slide. (Color: Yellow)
Exit animations: The object disappears from the projected slide. (Color: Red)
Managing animations
Pictures and texts have different animations. First, select a picture or any other object on the
slide, and then you can see the types of animations in the Animation group of the Animations
ribbon. If you click on the More drop-down arrow next to the animation types, you can see all of
the animations. The green stars denote the Entrance animations, the yellow stars the Emphasis,
the red stars the Exit animations. If you turn on the Animation Pane button, you will see a pane
that contains all the setting of the animations have been set on the given slide. The animations of
a selected object are highlighted on this pane. Here you can change the order of the animations.
You can modify or add any setting to the animations.

A SHORT INTRODUCTION TO MICROSOFT OFFICE
36
For viewing the preview, click on the Preview button, or use the [Shift]+[F5] key combination.
For getting back to the edit mode, use the [Esc] key.
Viewing the slide show
If you are giving your lecture, or you are you are editing the presentation, you need to project
the slide show. For getting the tools of running the slide show, select the Slide Show ribbon. You
can start the slide show from the first slide – than choose From Beginning, or from the currents
slide, in this case click on the From Current Slide button.
You can use the [Esc] key for returning the editing mode.
MICROSOFT POWERPOINT
37
Considerations
Choosing designs and colors
Which are the most important facts that you have to take into account when choosing a theme
or a color scheme for a presentation? Some of them:
Topic of the lecture ◦
Topic: You have to match the style of the slides with the topic of your presentation.
It means that it is better to choose a theme with modern appearance if you speak
about a new project or investment in a new type of mobile phone.
A theme with classical style fits better if you speak about the poems of Shakespeare.
Message: If you have long messages in your presentation, it is better to choose such
templates that have large space for the messages (for example the graphical
elements do not occupy too much space on the slides). If you have short messages,
you can choose a theme that leave small spaces for the message on a slide, or you
can use very simple theme, and put extremely large images onto the slides.
Audience ◦ You have to fit the layout of the slides to the audience. A cheerful theme
sounds better for a young audience or for a birthday party, but a solid theme is
better for a team meeting at your workplace.
Lecture hall
Light: If the place where you will give the lecture is dark, it is better to choose a
theme with lower contrast. You can see such themes in the third row of the previous
picture. If there is sunshine in the hall where you will speak, higher contrast is
advised.
Size: If the lecture hall is big, i.e. there are people in it who will be far from you, it is
better to use larger letters on the slides, even if the projected slides are also large.
Hardware
Projector: If you have a chance, project the presentation with the same projector that
you will use during your speech, because some projectors have low resolution that
can “destroy” or “modify” the design, or simply cannot project those colors which
have been chosen correctly.
Computer: Some designs need more effort from the computers. It is worth to make
sure that you will have a computer with resources enough for your presentation.

A SHORT INTRODUCTION TO MICROSOFT OFFICE
38
Creating effective presentations
The requirements of presentations are changing quickly as the taste of people changing fast.
Internet is a good place for getting information about the new trends.
A good lecturer has to know the actual common taste. If a lecturer suits the elements of the
presentation to it, he or she can send the message easier to the audience, and she or he can have
better chance to take effect on the audience.
There are much different estimations about the new trends of oral presentations, but there are
some common points of them, such us
A presentation has to have a main message. People have to know what you speak about.
A slide has to contain one clear message.
A slide must contain small amount of text. Too much text can hide your message. For this,
you have to delete the unnecessary and redundant information from the text you want to
say.
A slide with many bullets is not trendy in 2012.
Design is not a functionless decoration. It has to help the transmission of the message.
If you have practice in design, you can design and save your own presentation themes. If not, it
is better to use the predesigned themes and color schemes with keeping mind the considerations
written above.

39
Microsoft Excel
This chapter will help you get know the basics of Microsoft Excel
as a part of the introduction to computer science. You can learn how to
create, open and save Microsoft Excel workbooks. You will know how to use
numbers, functions and formulas, how to us absolute and relative
references, and how
to insert charts and pictures.
In Microsoft Excel you can do with numbers that you would like to – almost without any limitation.
You can add, subtract, multiply and divide them; or raising them to a power. You can use simple
functions such as summa or maximum; or you can make complicated calculations such as
approximations. You can use the numbers as simple numerals or dates. You can make sequences; and
you can count interests or trends. In Excel workbooks you can store not just numbers but any other
types of data.
If you want to demonstrate data in a presentation or in a document, you can insert charts that
ameliorate the level of visualization. Graphing is another good tool for visualizing in an effective way.
Thousands of data can be stored in a workbook, and a number of workbooks can be assigned to each
other. It means that you can manage or control millions of data from a single Excel workbook.
Basics of the use
Run the Microsoft Excel
Choose the Windows’ Start
menu; from Programs
choose Microsoft Office and
then
Microsoft Excel 2010, than
you will get
a new, blank Excel workbook.
Chapter
3
A SHORT INTRODUCTION TO MICROSOFT OFFICE
40
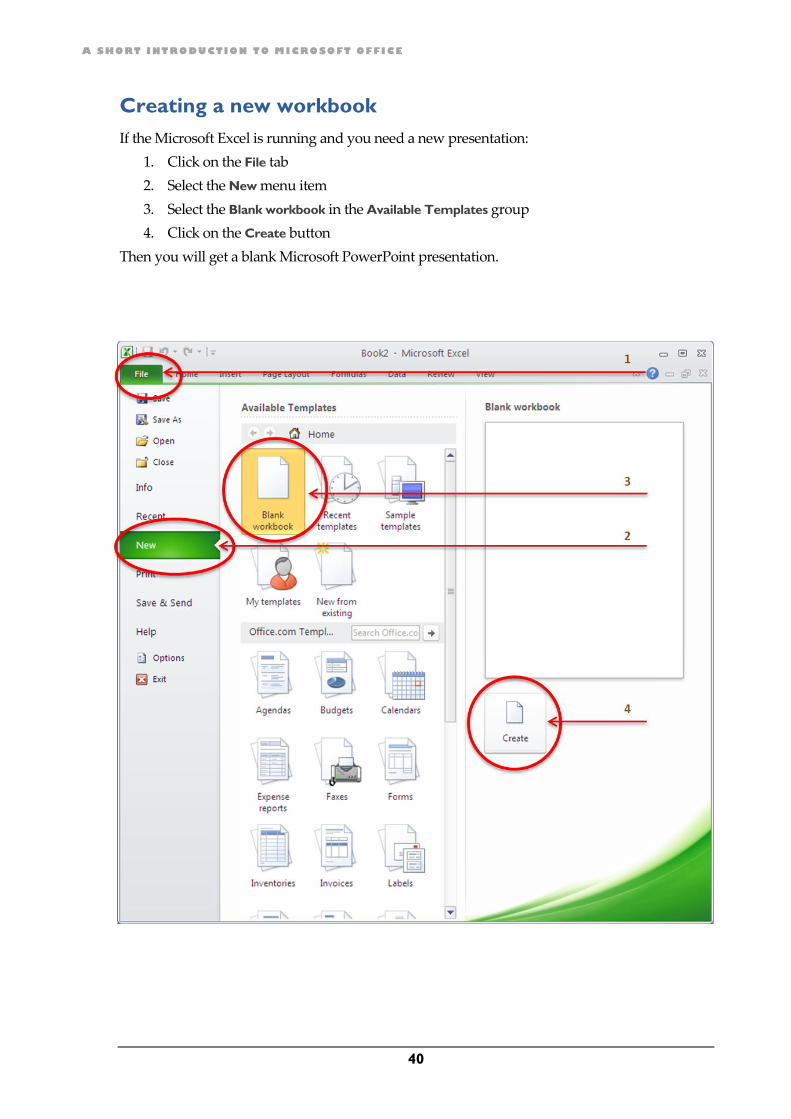
Creating a new workbook
If the Microsoft Excel is running and you need a new presentation:
1. Click on the File tab
2. Select the New menu item
3. Select the Blank workbook in the Available Templates group
4. Click on the Create button
Then you will get a blank Microsoft PowerPoint presentation.
CHAPTER 3. MICROSOFT EXCEL
41
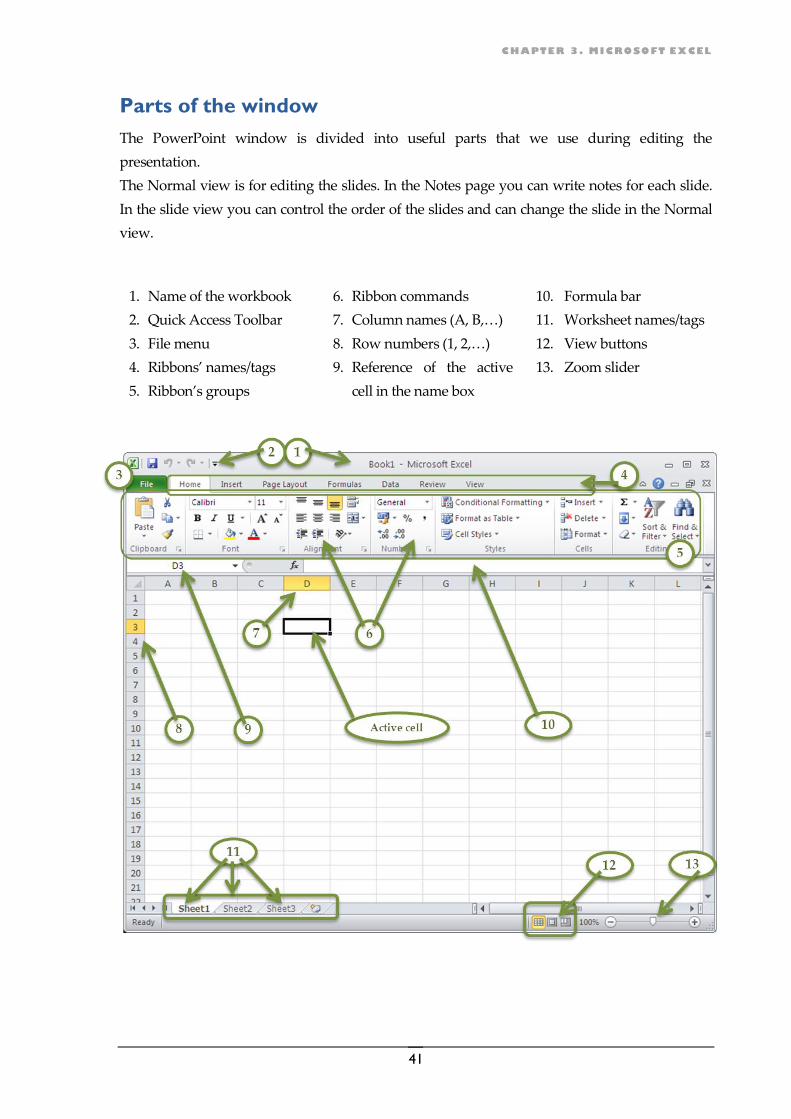
Parts of the window
The PowerPoint window is divided into useful parts that we use during editing the
presentation.
The Normal view is for editing the slides. In the Notes page you can write notes for each slide.
In the slide view you can control the order of the slides and can change the slide in the Normal
view.
1. Name of the workbook
2. Quick Access Toolbar
3. File menu
4. Ribbons’ names/tags
5. Ribbon’s groups
6. Ribbon commands
7. Column names (A, B,…)
8. Row numbers (1, 2,…)
9. Reference of the active
cell in the name box
10. Formula bar
11. Worksheet names/tags
12. View buttons
13. Zoom slider

A SHORT INTRODUCTION TO MICROSOFT OFFICE
42
Data
The data you can find in this handbook are fictive; they do not consider any real data of any database.
Prerequisites
We cannot deal with all the parts of computer use. We suppose that you can use computers and
you have some knowledge about computers, keyboards and Windows. We assume that you
have knowledge on some parts of computer science, for example you know what the file and
folder mean, and you can find them on the computer.
In addition we presume that you know the basics of mathematics, for example what the summa
means; what does the arithmetical sequence mean; why does a zero divisor cause a problem.
Here we have no chance to give a full explanation of the mathematical background of each
formula, but we aim to do it.
Denotations
In the title bar you can see the name of the file (see 1 on the previous figure). Here, in Excel, we
call it as a workbook. In one workbook there can be many sheets – called worksheets (11) – where
we can store the data. By default, an Excel workbook contains three worksheets, but we can
insert many other. The name of a worksheet appears on its sheet tab. The names (or titles or
labels) of the sheets are Sheet1, Sheet2, etc. by default. You can (and should) rename them.
You can rename the active worksheet (whose content can be seen in the window, and whose tab
is white):
1. Click with the right button of the mouse (right-click) on the worksheet name,
2. From the format menu choose the Rename option; and
3. Enter a new name.
In Excel, we have to use often both the left and the right button of the mouse. If we write simply
“click”, it means always that you have to click withy the left button of the mouse. If you want to
use a content sensitive shortcut menu, you have to “right-click” – it means that you have to click
once with the right button of the mouse.
There is another nomination that we have to speak about here, this is the spreadsheet. It is
another name for these types of files. Although, the use of this word can cause some confusion,
because a spreadsheet could denote a whole file, i.e. a workbook, or it could denote a worksheet
in a workbook, too. So that can make difficult to understand the instructions. In this handbook
we use the nomination workbook for an excel file, and the worksheet for a sheet in a workbook.

CHAPTER 3. MICROSOFT EXCEL
43
Mouse pointer (or cursor) shapes and functions in Excel
In Excel we have to know the different shapes of the mouse pointer (cursor) because they have
functions that you have to use during your work.
Shape Name and Function
Arrow Pointer: Used for making a cell active
Used for moving selected cell ranges
Cross Pointer: Used for selecting cells
Editing Cursor: Indicates the cursor position when editing a cell content in the cell
or in the Formula Bar
Fill Handle: Used for copying formula or extending a data series
Selecting Arrow: Used for selecting a whole row when positioned on the row
number
Selecting Arrow: Used for selecting a whole column when positioned on the
column letter
Resizing Arrows: This cursor shape appears at the border of the column letters
Drag to widen or narrow the width of a column
Resizing Arrows: This cursor shape appears at the border of the row numbers
Drag to increase or decrease the height of a row
Dragging Tool: Used for moving a selected range of cells or shape
Denotes that you are moving a selected range of cells or shape
Denotes that you can move / you are moving the selected range of cells or shape
while holding down the Ctrl key
Pointer Finger: Link can be chosen with it

A SHORT INTRODUCTION TO MICROSOFT OFFICE
44
Your first workbook
Names and areas
You have already created a workbook by running the Microsoft Excel, or by creating a new,
blank workbook from the File/New menu of the Excel. So now you have a blank workbook with
three worksheets in it, and you can see the worksheet that has the name Sheet1.
The working area is divided into rows and columns. You can see the column names (A, B, C,
etc.) above the cells; and the row numbers (1, 2, 3, etc.) on the left of the cells.
There is one cell that has a thick black
border – this is the “active cell”. The
column name (D), and the row number
(3) of the active cell are highlighted by
an orange background. Each cell is
identified by an address. If it is in a
formula, we call it a reference. In this
case, the reference of our active cell is
D3 that you can see in the name box.
You can enter data only into the active
cell. The content of the active cell is
displayed in the formula bar; the value
of the active cell can be seen in the
active cell.
In Excel, several features are assigned to each cell. Look at the next figure.
Address/Reference: The address or the reference of the active cell is B3 on this figure. That you can
see in the Name Box. The name of the column and
the row are highlighted.
Content: The content of the active cell is a formula that you
can see in the Formula Bar: = 4 + 5. As you can see,
the cell does not contain the euro (€) character.
Value: The value of the active cell is 9 that you can see in
the active cell.
Format: The number is displayed with two decimals and a
currency is displayed. The background of the cell is
blue, the letters are in black. (About formatting the
cells and of its content, see later.)

CHAPTER 3. MICROSOFT EXCEL
45
Entering data
If you type anything in Excel, it will be the content of the active cell. You can enter many types
of data, for example numbers, texts, dates (see later).
Validation ◦ For validating the content that you have typed, you have to press Enter, or one of
the arrow keys, or click on another cell.
Escape ◦ Unless you validate the data you have typed, you can press the Esc key to cancel the
data input. In this case you will get back the original data in the cell.
Warning! You can rewrite very easy the data in Excel. If a cell with content is the active cell, and
you type something than press Enter or click another cell, the previous content of the cell will
disappear and replaced by the new data. If you do not want to replace the data in the active cell,
you can press Esc to cancel the input before validating the data.
Save the workbook
More tools are available in the Excel for saving documents:
You can simply click on the small disk ( ) on the
Quick Access Toolbar.
You can choose the Save command from the File
menu.
Or hold down the Ctrl key while pressing S on the
keyboard.
If you save this document first time, you will get the Save As
dialog box. The files have to be saved into a proper folder,
with a meaningful name.
Now create and open a Data folder in the My Documents
folder. In the File name field, enter the “Frames” name for the
workbook.
Save the file by clicking the Save button in the Save As
window.
The default file extension of an Excel 2010 workbook is xlsx.
So now a workbook with the Frames.xlsx file name has been
saved in the My Documents/Data folder.
Save icon

A SHORT INTRODUCTION TO MICROSOFT OFFICE
46
Print the workbook
Before you print the content of a worksheet, it is worth checking the layout.
From the File menu choose the Print option. Here you can see a print preview of the worksheet
and many options that you should check before printing.
On the right side of the window, check that the data you want to print can be seen on the
page(s).
In the middle part, choose the printer you want to use. Set the number of copies you need.
In the Settings part, select that you want to print. (The Print Active Sheets is the default setting.)
Give the range of pages that you want to print.
If you need more copies, you have to choose how they should be collated.
Choose an orientation. The default is Portrait. Maybe the Landscape would fit better to your
table.
Choose a paper size, than set the margins for that.
Return to the editing mode – if some changes are needed – by pressing Esc, make the changes
and come back into the Print menu.
If you have made all necessary settings, click on the Print button in the Print menu window.

CHAPTER 3. MICROSOFT EXCEL
47
Close the document
If you have finished the work with a workbook, you can close it by choosing the Close
command from the File menu, or by clicking the button at the upper-right corner of the
window. You can close the Microsoft Excel program by choosing the Exit command from the
File menu.
Basics of calculations
Data types
You can use several types of data in Excel. The are some of them:
Text – such as “Price”. It can contain any character that you can type from the keyboard.
Number – such as “123” or “–345” (without the quotation marks). A number can contain a plus
or a minus sign, digits, and a decimal sign. The decimal sign that you have to use is
declared in the Regional Settings of the Windows. It can be a dot (.) or a comma (,).
English language use points for decimals.
Date – such us 11/22/2012. The standard appearance of the dates are given in the Regional
Settings of the Windows, but you can change the format in each cell.
Formula – such as “= 4 + 5” (without the quotation marks).
A formula has to begin with the equal sign (=).
It can contain for example
◦ Numbers: 1, 298, etc. If you want to store a phone number such as 00608877 in
a cell, you have to enter a single quotation mark before the numbers, for
keeping the leading zeros: '00608877
◦ Operators: +, -, etc.
◦ Functions: SUM, AVG, etc.
◦ Parentheses: (, )
◦ Cell addresses or references: B3, H8, etc.
◦ Range references: B2:D7, etc.
(A range contains all cells within a
rectangle that is determined by the
two cell addresses as its two opposite
corners; in this case by B2 and D7.)
It has to fulfill the mathematical requirements, e.g., you cannot divide anything by
zero, or you have to use the parentheses in the right way in the mathematical
sense.

A SHORT INTRODUCTION TO MICROSOFT OFFICE
48
Simple data and simple formulas
Create a new, blank workbook. On Sheet1, now we create a simple document for getting the
quantity of the material for framing the picture, i.e. the length of the listel and the surface of the
glass pane.
On Sheet1, select the cells from A2 to C8:
Click on the cell A2, hold down the left
mouse button, and select the cells until C8.
Click on the menu arrow of the Borders
menu in the Font group of the Home menu.
Click the Thick Box Border in the Borders
menu.
Enter the data into the cells you see on the
next figure. As you can see, the numbers 70
and 90 are in separate cell. This is important
if we want to use the numbers in
mathematical formulas.
The height of the frame is in the cell E2, and the width is in the cell B9.
Into the cell E7 enter the following formula: =2*E2 + 2*B9
Into the cell E8 enter the following formula: = E2 * B9
The formula in E7 multiplies by 2 the content of E2 and also the content of B9, and then
summarizes these two products. The formula in E8 multiplies the content of E2 by the content
of B9.

CHAPTER 3. MICROSOFT EXCEL
49
After entering the two formulas, you can see
the result values: 320 in E7 and 6300 in E8.
Click on the cell B7, than you can see the
formula in the Formula Bar.
If you change any of the values in E2 and B9,
you will get the proper values in E7 and E8.
By default, the Excel calculates all formulas in
the workbook after every change in the
workbook. It means that if you change any
value or formula in this workbook, all
formulas will be recalculated.
Changing the background of the cells can
make the worksheet well-arranged:
Select the cells D7, E7 and F7.
Click on the Fill Color drop-down menu
arrow.
Choose a light color.
Select the cells D8, E8 and F8.
Click on the Fill Color drop-down
arrow.
Choose a different light color.
If you want to make it nicer, you can insert a
picture in the same way as you learned in the
chapter PowePoint on page 32.
After coloring some cells, the worksheet looks
like an application.

A SHORT INTRODUCTION TO MICROSOFT OFFICE
50
Functions
Many functions are there in Excel. You can reach the functions in many ways:
You can get all functions if you click on the Insert Function icon ( ) at the left of the Formula
Bar. By default, you can see the most recently used functions in the list on the dialog box. Here
you can see SUM, AVERAGE, IF, HYPERLINK, COUNT, MAX and SIN. If you need other functions, you
can open the drop-down menu where you can select a category of functions that you want to
browse. You can get the whole list of functions by choosing the All option from the category list.
Click on the name of the function that you want to use.
On our example we clicked of the AVERAGE function. Below the list of function list, you can see
the syntax of the function and some explanation what this function does whit its argument(s).
If this is the function that you want to
use, click OK. You get a dialog box
with the settings of the function.
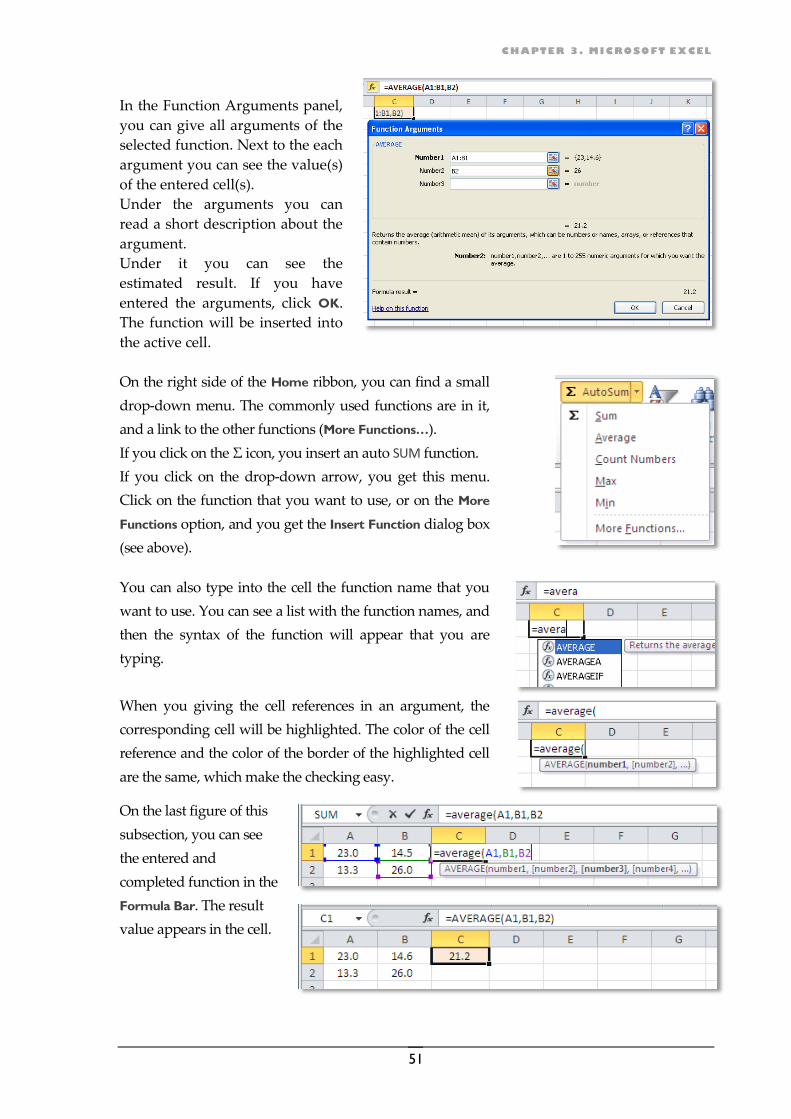
CHAPTER 3. MICROSOFT EXCEL
51
In the Function Arguments panel,
you can give all arguments of the
selected function. Next to the each
argument you can see the value(s)
of the entered cell(s).
Under the arguments you can
read a short description about the
argument.
Under it you can see the
estimated result. If you have
entered the arguments, click OK.
The function will be inserted into
the active cell.
On the right side of the Home ribbon, you can find a small
drop-down menu. The commonly used functions are in it,
and a link to the other functions (More Functions…).
If you click on the Σ icon, you insert an auto SUM function.
If you click on the drop-down arrow, you get this menu.
Click on the function that you want to use, or on the More
Functions option, and you get the Insert Function dialog box
(see above).
You can also type into the cell the function name that you
want to use. You can see a list with the function names, and
then the syntax of the function will appear that you are
typing.
When you giving the cell references in an argument, the
corresponding cell will be highlighted. The color of the cell
reference and the color of the border of the highlighted cell
are the same, which make the checking easy.
On the last figure of this
subsection, you can see
the entered and
completed function in the
Formula Bar. The result
value appears in the cell.

A SHORT INTRODUCTION TO MICROSOFT OFFICE
52
Often used functions – An exercise
We have data on sugar producing countries, and we want to know how much sugar the
countries need, the totals, the averages, the biggest and the smallest amounts.
For this, we can use the often used functions.
Click on D14, now this is the active cell. From the small drop-down menu of the Home ribbon,
select the SUM function. The Excel selects a range of cells that it estimates the concerning cell
range. If it is the range you want to use, press Enter, and the function will appear in D14. The
offered range can be modified by using the cross pointer – if it is needed.
The process is similar in the cell
D15, where an average function
is needed.
Click on D15.
Choose the AVERAGE function.
Select the cell range that have to
be in the function argument.
Press Enter.
In D15 you will get the average
of those numbers which are in
the cell range D4:D13.

CHAPTER 3. MICROSOFT EXCEL
53
The process is similar in the case of the MIN and MAX functions, too. If you entered all of the four
functions into the “Production” column, you have to have the following functions and results:
In column E you have to have similar functions.
And the results:

A SHORT INTRODUCTION TO MICROSOFT OFFICE
54
Absolute and relative cell references
Relative references
Continuing the previous exercise, we can see that the cell references in the function arguments
in the two columns differ only in the names of columns. For example, the formulas in the 14th
row:
SUM(D4:D13) in column D and
SUM(E4:E13) in column E.
Consequently, the formula of the 14th row in column F should be:
SUM(F4:F13)
Excel has a tool, the Filling Tool that can be used for copying formulas into the consecutive
columns or rows when the formulas differ only in the cell references.
For copying the formula in E14 into the cell F14:
Click on the cell E14 because you have to copy its formula into the F14 cell.
Move the mouse pointer to the lower right corner of the active cell (i.e. E14).
Hold down the left mouse button and drag to the cell F14.
You have copied the formula that you can see if you click on F14. The formula here:
SUM(F4:F13)
Move the pointer to the lower right corner of the
cell
Drag to F14
Copying the formula has changed the references You can copy more formula in the same time
As you can see, the cell references have been changed during copying. This is why we call these
type of references as “relative references”. So you have to use relative references, if you want to
copy a formula, but the references have to be changed during copying.
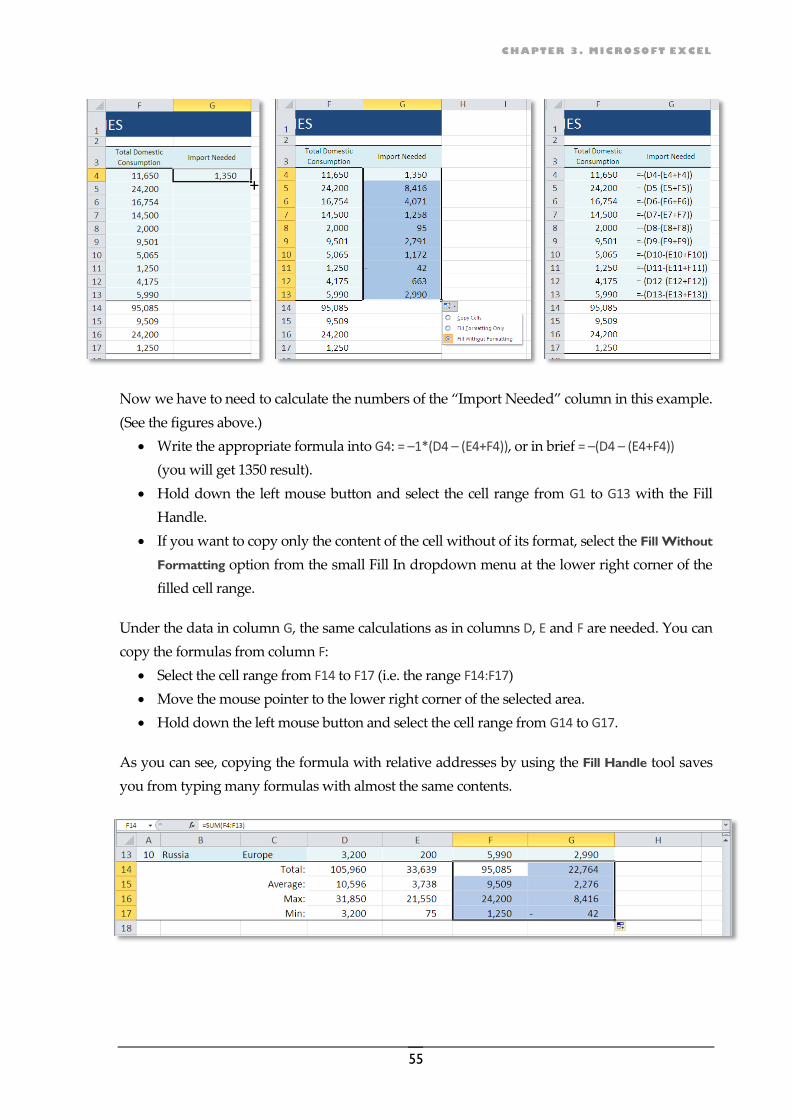
CHAPTER 3. MICROSOFT EXCEL
55
Now we have to need to calculate the numbers of the “Import Needed” column in this example.
(See the figures above.)
Write the appropriate formula into G4: = –1*(D4 – (E4+F4)), or in brief = –(D4 – (E4+F4))
(you will get 1350 result).
Hold down the left mouse button and select the cell range from G1 to G13 with the Fill
Handle.
If you want to copy only the content of the cell without of its format, select the Fill Without
Formatting option from the small Fill In dropdown menu at the lower right corner of the
filled cell range.
Under the data in column G, the same calculations as in columns D, E and F are needed. You can
copy the formulas from column F:
Select the cell range from F14 to F17 (i.e. the range F14:F17)
Move the mouse pointer to the lower right corner of the selected area.
Hold down the left mouse button and select the cell range from G14 to G17.
As you can see, copying the formula with relative addresses by using the Fill Handle tool saves
you from typing many formulas with almost the same contents.

A SHORT INTRODUCTION TO MICROSOFT OFFICE
56
Absolute references
Absolute references are needed in many formulas that you want to copy. The absolute
references have three forms depending on the mathematical meaning: Sometimes you need to
fix only the row number, sometimes only the column name, sometimes both.
In Excel there are 4 types of references: 1 relative and 3 absolute.
B25 Relative reference Absolut reference, where
B$25 Absolut reference of the row Only the row number is fixed
The column name will be changed if you skip
into another column during copying
$B25 Absolut reference of the
column
Only the column name is fixed.
The row number will be changed if you skip
into another row during copying
$B$25 Absolut reference for both The row number and the column name are
fixed
None of them will be changed if you skip into
another row and/or column during copying
Here we continue with the previous exercise. Now we want to know for each country that its
import is how many percent of the totally needed import of the ten countries. The mathematical
formula for getting it
The required import of a given country
The total of the import these countries need
It means, that we need the formula
in H4 in row 4: =G4/G14
in H5 in row 5: =G5/G14
in H6 in row 6: =G6/G14, etc.
If we copy the formula in the previous way, we got =G5/G15 in row 5 because the row numbers
would increase by 1 in the references.
It means that you have to fixate the number 14 in the address G14 in the formula of cell H4.
You can do it with the $ sign. The formula you need
in H4 in row 4 is: =G4/G$14

CHAPTER 3. MICROSOFT EXCEL
57
If you copy this formula into the other rows with the Fill Handle, you get the right formulas and
the right results in each row of column H, as you can see on the figures below.
In this example, we could have used
in H4 the =G4/$G$14 absolute reference form,
because it would resulted the same values. The range where the formula was copied is in the
same column. It means that the column number does not change if you do not fix it or if you fix
it as well.
For getting the percentage
format of the numbers, click
on the Percent Style icon in
the Number group of the
Home ribbon.

A SHORT INTRODUCTION TO MICROSOFT OFFICE
58
Charts
Charts make the information transmission more effective than tables.
In Excel (as well as in the other programs of Microsoft Office) there are many types of charts.
In Excel, you can reach them from the Charts group on the Insert ribbon.
On the Pie, Doughnut
and Bubble type chart
only one sequence of
data can be presented.
On the other chart types
many data sequences can
be shown.
Excel gives many tools
for creating charts.
The easiest way is to insert a chart, if you select all data that you want to see on the chart. After
inserted a chart, you can modify the format all parts of it from the Design, the Layout and the
Format ribbons in the Chart Tools. You can see the Chart Tools and the tags of these ribbons if
the chart is selected.

59
Microsoft Project
The aim of this chapter is to give an overview of Microsoft Project
and introduce some basic features to allow users to manage projects and
using this software. From this chapter you get information about how to
create a plan, how to assign resources to a task, how to set their details, and
how to manage the budget. You can learn about viewing and
understanding Gantt charts.
Project management is a nice and complex field that has several topics that you have to know if you
want to plan project tasks. In this chapter we go through the basics that you have to know before
using the Microsoft Project software.
Microsoft Project 2007 is an efficient tool for project managers. It is designed specifically to increase
effectiveness and productivity around managing project type activities. It can help manage key project
components using planning, tracking and analyzing tools.
Project Management
What is a project?
By the Oxford Advanced Learner’s Encyclopedic Dictionary, a project is a “plan for a scheme or
undertaking”. Projects are different from ordinary work. There are some features that they have
to fulfill:
Projects are designed to promote changes and innovations
Projects have time frame
Projects have to be planned
Projects uses resources
Projects need budget
Projects require evaluation
The outcome of a project is a kind of products in most cases
Here are some examples for projects:
Chapter
4

A SHORT INTRODUCTION TO MICROSOFT OFFICE
60
Planning a big party
Hosting an exhibition
Designing and producing a book
Designing and implementing a computer system
A project needs inputs and outcomes:
A project manager has to control the most important factors:
Goals – Tasks
Resources
Time
Risks
Products – some kind of sense
How to plan a project?
Without a serious planning, the success of project could be unlikely. How to begin? Here are the
steps that you have to follow during planning.
Scope and goal management
You have to start to plan a project with defining the clear scopes and goals. If you do not have
clear goal(s) the outcome(s) of the success of the project will be uncertain. First you have to write
the list of goals with short descriptions of their some details. It is good to specify the
requirements and the definition of the success.
Task, activity management
Tasks that are required to accomplish the goals should be assigned to every goal. For this, you
have to make a list of goals and assign a task or a task list to each of them with the tasks that are
needed for reaching the goal.
Resource management
Resources are the things which are needed for accomplish the project. A project manager has to
analyze the tasks and determine what kind of resources the tasks need. The allocation of
resources can have a major influence on project schedules, because resources usually are limited,
some of them are hard to obtain, others are expensive, or both.
There are many types of resources that can be necessary for performing a project, such as:
MICROSOFT PROJECT
61
Human resources ◦ People can be needed e.g. for administration, product delivery, system
analysis, making designs, driving trucks, coordinating the work of the groups, etc. It is
very important in a project plan that the right number and kind of people have to be
available at the right time and place.
Equipment ◦ Projects need equipment that has to be planned. The project manager has to
discover what kinds of tools are needed for performing the operations of the project.
These tools can be, for example, some computers, printers and software, some sound
amplifiers or trucks could be required.
Time ◦ Performing operations need time. In the projects there are factors without project
operations which need time, too. For example, waiting for permissions from the local
government needs time and cannot begin some project tasks before receiving it. It is
important to divide the time plan into phases, and to fix some deadline for activities. The
correct estimation of the required time is very important. If the project management
underestimate the required time of (some) tasks or other factors, the success of the project
could be uncertain; this is a common mistake in project management.
You have to calculate the project participant’s time. You have to know for example how
many hours they can work a day (it can be different for people in the administration and
in delivery), or how many days they can work a week (some of the project members are
employees of another company, so they cannot work in the project each day).
Financial resources – Budget and cost control◦ Money is needed for all tasks of the project.
The project manager has to know the financial requirement of the human resources, the
equipment, the administration, hiring the trucks, etc. Of course, the project manager has to
know the amount of the accessible money; he or she has to harmonize the incomes and
the outgoings of the project.
The aim of activity resource estimating is to estimate the resources which are needed for each
activity. The resources should be deployed in the most effective manner they can be.
Risk management
It is necessary to pay attention on risks in planning a project. You can save a lot of money if you
deal with uncertain events during the project. This allows you to deliver your project on time,
on budget and with the quality results your project sponsor demands.
You have to make the risk management of part of your project. You have to identify the risk at
an earlier stage of your project. You have to identify and analyze the threads and the
opportunities. You have to make a priority list of risks. You have to clarify the ownership of the
risks. Each project member has to know if he or she has the responsibility to optimize a given
risk for the project. You have to plan and implement the responses to the risks during the
project. Associate the risks to the appropriate tasks, and tracking the risks.

A SHORT INTRODUCTION TO MICROSOFT OFFICE
62
Communication management
You have to make a plan of project meeting. For time to time the members of the project have to
meet and speak about the activities, the risks and they have to present the outcomes of the given
phases. The project members have to harmonize the field they are responsible and make
correction in the plan if it is needed. Some project needs to disseminate materials at the end of
some phases.
Running the Microsoft Office Project
Choose the Windows’ Start
menu; from Programs
choose Microsoft Office and then
Microsoft Office Project 2007,
than you will get
a new, blank project.
The Microsoft Office Project is
not a member of any
Microsoft Office package.
Here we use the Microsoft
Office Project 2007.
Prerequisites
We cannot deal with all the parts of computer use. We assume that you are familiar with the use
of computer keyboard and mouse. In this document we suppose that you can use the Microsoft
Windows and the Microsoft Windows based products. We assume that you know what the file
and folder mean, and you can find them on your computer if you want.

MICROSOFT PROJECT
63
Parts of the window
The window of the MS project 2007 is divided into three main parts:
Task Area – contains the task names and other features of the tasks.
Gantt Chart – can show many features of the task, such as duration, links, resources, etc.
Project Guide Pane – helps you to develop the project, and special parts of the projects.
If you do not see the Project Guide Pane it might be a good idea if you turn on the project guide
because it can help you making your first project plan: From the Tools menu choose the
Options… and the Options dialog box appear. Click on the Interface tab and turn on the Project
Guide.

A SHORT INTRODUCTION TO MICROSOFT OFFICE
64
Developing a project
Create a new project
If you opened the Microsoft Project from the Start and Programs (All Programs) menu, you
have a new blank project that you can work with.
If you want to create another project, click on the File menu,
choose the New… option, and select the possibilities you
have: You can create a Blank Project; you can open an
existing project, or you can use a template for creating the
new project.
If you choose the Templates >> On computer… option, you get the Templates dialog box that
shows those templates which are installed on your computer. As you can see on this figure
below, there are many templates that you can use.
You can find many templates on the Microsoft Office Online website, too. If you chose
Templates on Office Online option from the Templates group, a web browser will be opened
presenting the Microsoft Office Online website, where you can browse the many different
templates and can choose from tem.
Save the project with the name ‘ABproject’. From the File menu choose Save, select a folder, enter
the ABproject name into the File name field, then click Save.

MICROSOFT PROJECT
65
Project settings
For designing your project, you can use the options of the Project Guide pane or you can set all
of the necessary settings and enter data from the menus of the Microsoft Project. In this guide
we do not use the Project Guide.
The first task is to give the basic settings of the project. Here we do not deal with all options that
you can set, only the most important data that you need in designing your project.
Start date
From the Project menu choose Project Information. In the Project Information for ‘ABproject’
dialog box give the Start date for the project. The dates of the project tasks will fit to this date.
Here we chose 15th of January in 2013.
If you do not have any restriction, do not set the Finish date. If the Finish date is not given, it will
be calculated based on the tasks that the project contains.
Calendars
For scheduling the project task, you will need calendars. You will need a “standard” calendar
that can be assigned to most of the resources.
You will need calendars for human resources, for example for the designer who can work for
the projects only on Tuesday afternoon from 14.30 to 19.00 and Wednesday morning from 8.00
to 10.45, for the truck driver who can work only 6 hours per day from Tuesday to Saturday.
You will need calendars for not human resources such as truck, cranes or plotters that you need
for project tasks and you have to hire them.
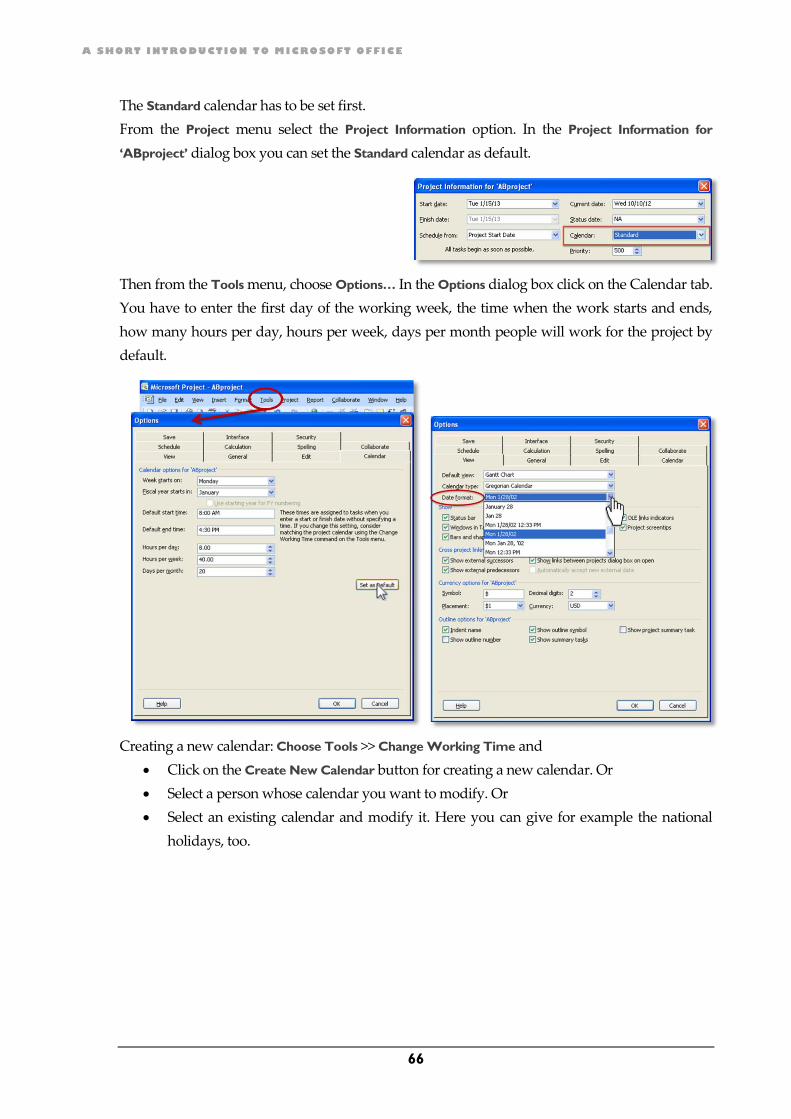
A SHORT INTRODUCTION TO MICROSOFT OFFICE
66
The Standard calendar has to be set first.
From the Project menu select the Project Information option. In the Project Information for
‘ABproject’ dialog box you can set the Standard calendar as default.
Then from the Tools menu, choose Options… In the Options dialog box click on the Calendar tab.
You have to enter the first day of the working week, the time when the work starts and ends,
how many hours per day, hours per week, days per month people will work for the project by
default.
Creating a new calendar: Choose Tools >> Change Working Time and
Click on the Create New Calendar button for creating a new calendar. Or
Select a person whose calendar you want to modify. Or
Select an existing calendar and modify it. Here you can give for example the national
holidays, too.

MICROSOFT PROJECT
67
On the Exceptions tab you can give extensions such as illness or vacation. Here M. Smith will on
holiday at the end of January.
On the Work Weeks you can modify the settings of the work week. Here M. Smith works until 2
o’clock on Friday.

A SHORT INTRODUCTION TO MICROSOFT OFFICE
68
Rates
On the General tab of the Tools >> Options dialog box you can set the default standard and
overtime rates that the program will use automatically based on the calendars.
On the Schedule tab you have to give the units for the settings. Here we chose Days for entering
the duration of the tasks and Hours for giving working time.
Tasks
After you made the preliminary settings of the project, you have to give the tasks of the project.
You have to organize the tasks into a structure. In this point of view, you have four groups of
tasks that you can work with:
Simple tasks are those tasks that can be described and planned by giving the time that
they need, the resources, and so on. For example: drawing the illustration for a book.
Recurring tasks that occur at regular intervals, such as project meetings.
Milestones form a special group of tasks. These special tasks (or events) are important in
the project life such as a control, a decision made by the management, the arrival of
permission etc. Usually they have 0 hour duration (from the point of view of the project)
for example the arrival of the building permit needs no efforts from the project members.
Sometimes the milestone tasks need some time, for example making a decision by the
project management.
Summarizing tasks help to organize the project into phases. These tasks contain tasks with
their properties. The duration of these tasks are counted by summarizing the durations of
its subtasks.
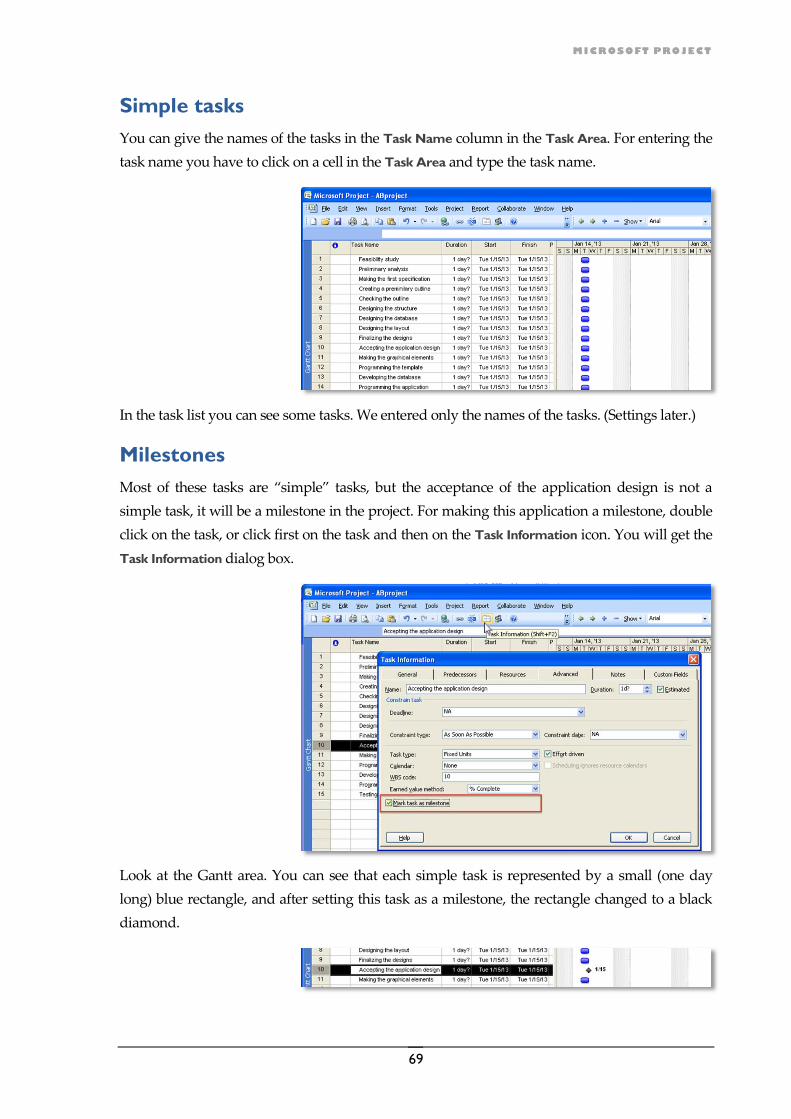
MICROSOFT PROJECT
69
Simple tasks
You can give the names of the tasks in the Task Name column in the Task Area. For entering the
task name you have to click on a cell in the Task Area and type the task name.
In the task list you can see some tasks. We entered only the names of the tasks. (Settings later.)
Milestones
Most of these tasks are “simple” tasks, but the acceptance of the application design is not a
simple task, it will be a milestone in the project. For making this application a milestone, double
click on the task, or click first on the task and then on the Task Information icon. You will get the
Task Information dialog box.
Look at the Gantt area. You can see that each simple task is represented by a small (one day
long) blue rectangle, and after setting this task as a milestone, the rectangle changed to a black
diamond.

A SHORT INTRODUCTION TO MICROSOFT OFFICE
70
Recurring tasks
During a project there are meetings and other recurring task. For inserting a recurring task, click
on the Insert menu and choose the Recurring Task option. You get the Recurring Task
Information dialog box where you can give several settings of the task.
Here we entered the name of the meeting, the duration (2 hours) and the recurrence pattern: The
programmers will have to meet on Tuesday every week. The start and the end date will be set
later. After clicking the OK button, you will get a recurring task in your project.
Summarizing tasks
If you want to designate phases in the project, you have to insert summarizing tasks at the
beginning of the group of the related tasks. The previous task list you have to insert a task before
the first task.
Click on the first task and press the Ins (or Insert) key on the keyboard, or from the Insert
menu choose the New Task option. An empty task line will be inserted above the
selected task.
Enter the name of the summarizing task: Preliminary Phase.
Click on the next task because it has to be push into a subtask position in the Preliminary
Phase.
Click on the Indent icon.
The sign of the summarizing task in the Gantt area has been changed: It is black now, and there
are two small arrows at the ends of the black bar. This sign denotes that this task is a
summarizing task.

MICROSOFT PROJECT
71
Insert more phases into the list and use the Indent icon for making the task subtasks. If you want
to see the summarized data of the whole project, it is useful to insert a Project Total onto the
highest level of the list. You can check the result on the next picture.
Inserting, deleting tasks, changing task level and options
Entering the data of a task: If you click on an empty cell in the Task Name column on the Task
Pane, you can enter the name of the task.
Inserting a task between to existing tasks: Press the Ins (or Insert) key on the keyboard, or from
the Insert menu choose the New Task option. An empty task line will be inserted above
the selected task, and you can enter the data of the task.
Changing the settings of a task: Double-click on the task, or select the task and click on the Task
Information icon. Then you will get the Task Information dialog box.
Deleting a task: The easiest way is to select the whole row of the task by clicking on the number
of the task row, then press the Del (or Delete) key on the keyboard.
Putting the task on a lower level: click on the Indent icon
If you want to bring a task to a higher level, you have to click on the Outdent icon.

A SHORT INTRODUCTION TO MICROSOFT OFFICE
72
Duration
You have to give duration for each task. Minutes, hours, weeks and months can be used. If you
want to fix the duration of a task, you have to select the Fixed Duration option from the Task
Type menu of the Task Information dialog box. Otherwise the duration will be recalculated
based on the work or on the unit of the work.
The tasks are not scheduled yet, so the starting date is the same at each task, and the duration of
the whole project is equal to the duration of the longest task.
Scheduling tasks
Links
Now you have to make links between tasks.
There are more tasks for scheduling the project:
Finish-to-Start (FS) : The previous task has to be finished before the other can start
Start-to-Start (SS) : The tasks have to start in the same time
Finish-to-Finish (FF) : The tasks have to be finished in the same time
Start-to-Finish (SF) : A task can finished when the other has been started.
If you insert a link, you will have a Finish to start link that you can change to another one if you
need it.
Select those tasks that you want to link to each other. (Hold down the Ctrl key and click
on the tasks you want to select.)
Click on the Link Tasks icon. The tasks will be linked. In the Predecessors column you will
see the number of the task that has to be completed before the start of this task.

MICROSOFT PROJECT
73
You can change the type of the link: Double click on the link arrow, and perform the necessary
settings in the small dialog box: Change its type or delete the link between these tasks.
Predecessors
A task that must be completed before another task can start. This is called a predecessor. You
can see the predecessors in the Predecessors column. The first task has no predecessor and each
of the following tasks has to have at least one. In our example we set only some predecessors
now.
In some cases a task might have more than one predecessors. It means that more than one tasks
have to be completed before that one can start. In other cases a task may be predecessor to
several others. In our example, the task number 10 is the predecessor for two tasks (11 and 13),
and the task number 23 has two predecessors (21 and 22).

A SHORT INTRODUCTION TO MICROSOFT OFFICE
74
You can check the types of the links in this column. The default is the Finish-to-Start which is not
signed, but the others are denoted.
After completing the schedule, we got that the project needs – under these conditions – 49.38
days.

MICROSOFT PROJECT
75
Managing resources
As you could see at the beginning of this chapter, there are more types of resources that we have
to handle. In Microsoft Project, resources are grouped into three groups:
Work resources: People and equipment
Material resources: Supplies and stocks
Cost resources: just money.
You can make the setting concerning the resources on the Resources Sheet. From the View
menu, select the Resources Sheet option and you will get a dialog box where you can give the
data for all resources you will need for the project.
Then you have to assign the resources to the tasks.

A SHORT INTRODUCTION TO MICROSOFT OFFICE
76
Go back to the Gantt Chart view (View menu). In the Resources names column you can choose
the resources for a task. A task can have more resources. You can control the resources assigned
to a task from the resources tab of the Task Information dialog box (double click on the task).
You can see at this task that the duration was recalculated because we assigned two people to
this task. If you need the original duration, change the Type of the task.

MICROSOFT PROJECT
77
Views
For checking and controlling the parts of the projects, you can use different views. You can find
some of the view types in the view menu, and you can choose others if you select the View >>
More Views… menu item. Let us see some of them.
Gantt Charts
Select View >> Gantt Diagram. That is the view that we used in the previous sections in this
chapter. Henry Gantt used these graphical bars in his industrial management studies to
compare timeframes.
PERT diagram – Network Diagram
Select View >> Network Diagram. Here you can check the associations, the links, and resources.

A SHORT INTRODUCTION TO MICROSOFT OFFICE
78
Critical path – Tracking Gantt
You have to know which task can be and cannot be delayed in the project without delaying the
whole project. Choose the View >> Tracking Gantt view type and you will get information about
the critical path. The red bars are critical, i.e. if they delay, the project will delay. Blue bars are
not on the critical path.