Embed Size (px)
Citation preview
-
A signature year defining the foundation for the future:Acceleration of digital, step change in sustainability, resilient financial performance,
transformational acquisitions, embracing new normal
All forward-looking statements are Schneider Electric management’s present expectations of future
events and are subject to a number of factors and uncertainties that could cause actual results to differ
materially from those described in the forward-looking statements. For a detailed description of these
factors and uncertainties, please refer to the section “Risk Factors” in our Annual Registration Document
(which is available on www.se.com). Schneider Electric undertakes no obligation to publicly update or
revise any of these forward-looking statements.
This presentation includes information pertaining to our markets and our competitive positions therein.
Such information is based on market data and our actual revenues in those markets for the relevant
periods. We obtained this market information from various third-party sources (industry publications,
surveys and forecasts) and our own internal estimates. We have not independently verified these third-
party sources and cannot guarantee their accuracy or completeness and our internal surveys and
estimates have not been verified by independent experts or other independent sources.
Disclaimer
Investor Relations – Schneider Electric | Page 2
04
29
48
53
56
FY 2020 Business Highlights
FY 2020 Financial Highlights
Expected Market Trends & Financial Target
Q&A
Appendix
Investor Relations – Schneider Electric | Page 3

FY 2020 Business Highlights2020, a year of intensive execution &
accelerated transformation
Jean-Pascal Tricoire
Chairman & CEO
Investor Relations – Schneider Electric | Page 4
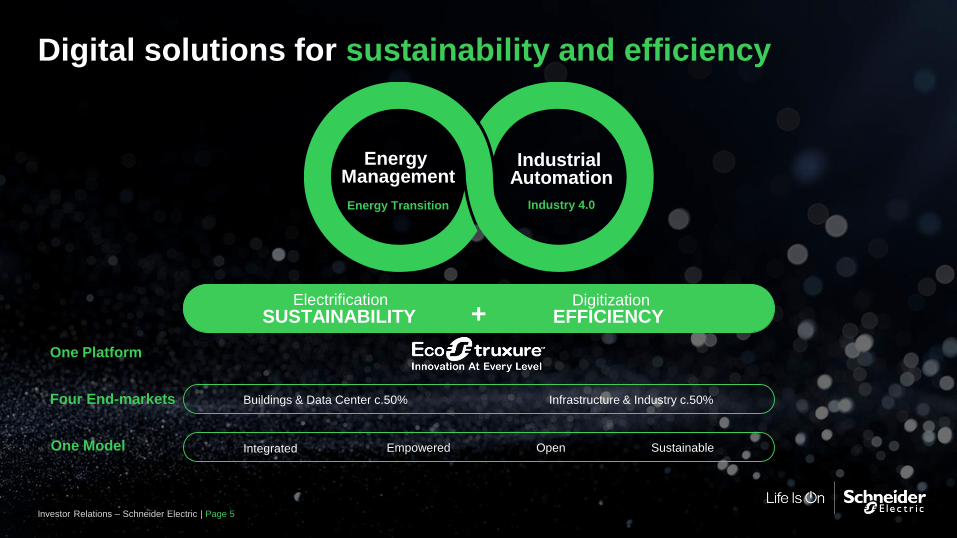
Digital solutions for sustainability and efficiency
Four End-markets
One Model
One Platform
SUSTAINABILITY EFFICIENCY+
Buildings & Data Center c.50% Infrastructure & Industry c.50%
Integrated Empowered Open Sustainable
Energy Management
Energy Transition
Industrial Automation
Industry 4.0
Investor Relations – Schneider Electric | Page 5
Electrification Digitization
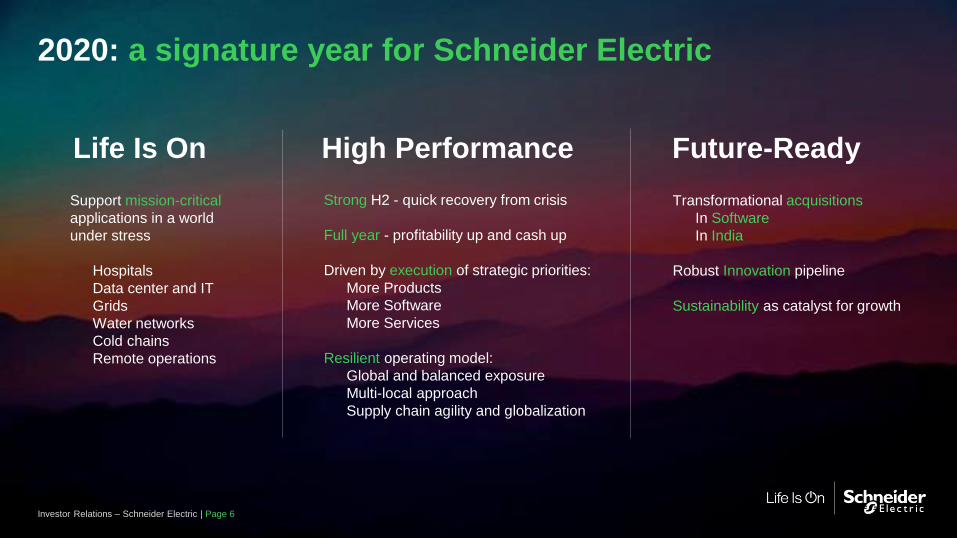
Strong H2 - quick recovery from crisis
Full year - profitability up and cash up
Driven by execution of strategic priorities:
More Products
More Software
More Services
Resilient operating model:
Global and balanced exposure
Multi-local approach
Supply chain agility and globalization
Life Is On High Performance Future-Ready
Support mission-critical
applications in a world
under stress
Hospitals
Data center and IT
Grids
Water networks
Cold chains
Remote operations
Transformational acquisitions
In Software
In India
Robust Innovation pipeline
Sustainability as catalyst for growth
2020: a signature year for Schneider Electric
Investor Relations – Schneider Electric | Page 6

Investor Relations – Schneider Electric | Page 7
Life Is On I High Performance I Future-Ready

Our purpose is to empower all to
make the most of our energy and resources,
bridging progress and sustainability for all.
At Schneider, we call this Life Is On.
Our mission is to be your digital partner for
Sustainability and Efficiency.
Investor Relations – Schneider Electric | Page 8
Life Is On I High Performance I Future-Ready
Investor Relations – Schneider Electric | Page 9
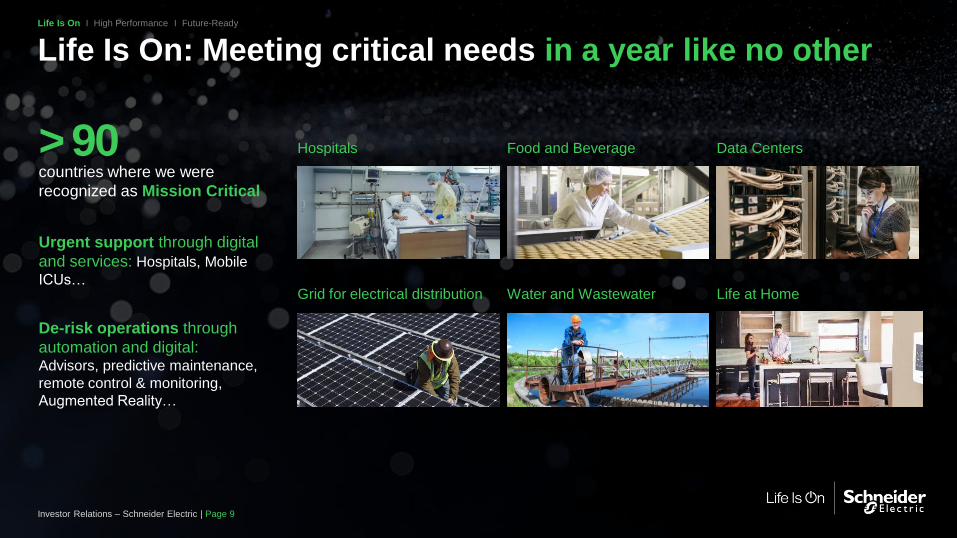
Life Is On: Meeting critical needs in a year like no otherLife Is On I High Performance I Future-Ready
Urgent support through digital
and services: Hospitals, Mobile
ICUs…
countries where we were
recognized as Mission Critical
> 90
De-risk operations through
automation and digital: Advisors, predictive maintenance,
remote control & monitoring,
Augmented Reality…
Hospitals Food and Beverage Data Centers
Water and Wastewater Life at HomeGrid for electrical distribution

Life Is On I High Performance I Future-Ready
Investor Relations – Schneider Electric | Page 10
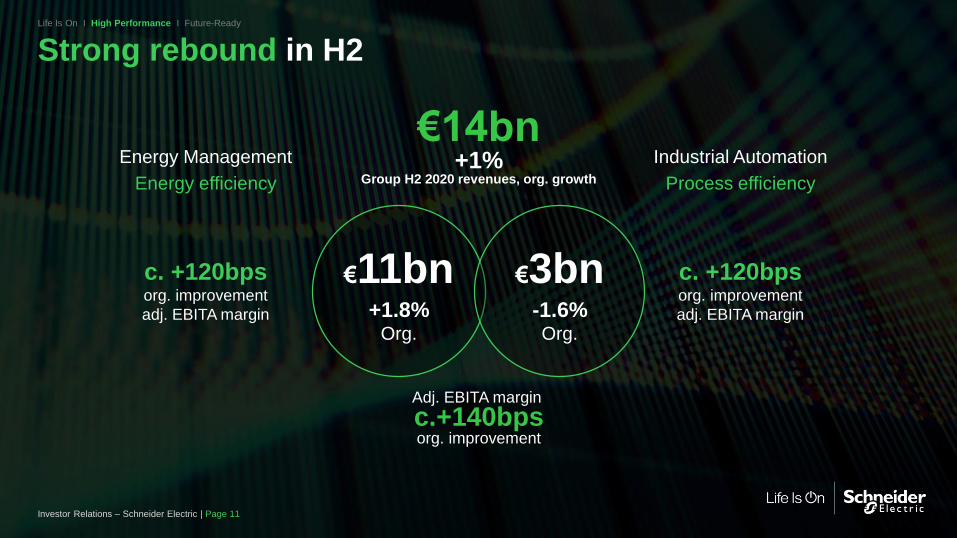
Strong rebound in H2Life Is On I High Performance I Future-Ready
Energy Management
Energy efficiency
Industrial Automation
Process efficiency
€14bn +1%
Group H2 2020 revenues, org. growth
Adj. EBITA margin
c.+140bpsorg. improvement
c. +120bpsorg. improvement
adj. EBITA margin
c. +120bpsorg. improvement
adj. EBITA margin
€11bn €3bn+1.8%
Org.
-1.6%Org.
Investor Relations – Schneider Electric | Page 11
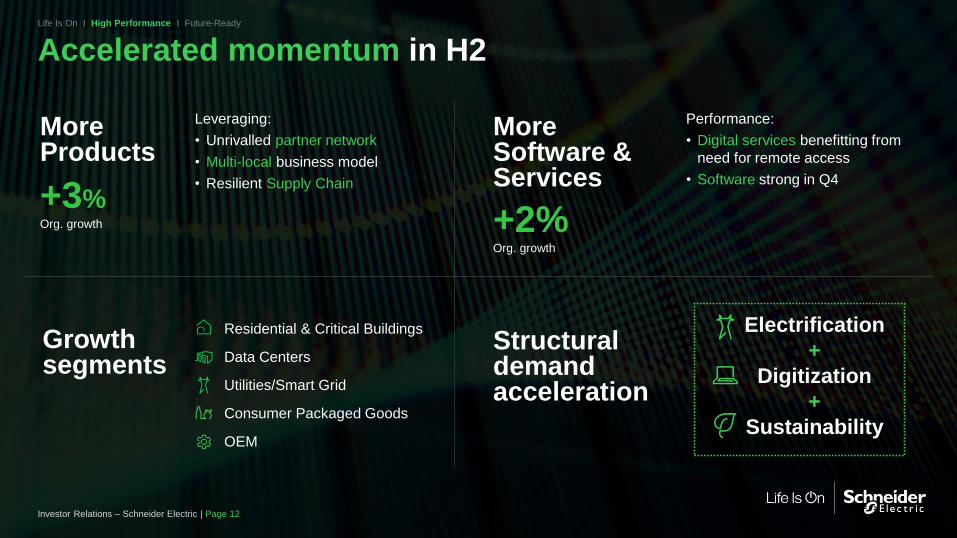
Accelerated momentum in H2Life Is On I High Performance I Future-Ready
More Products
More Software & Services
Growth segments
Structural demand acceleration
+3%Org. growth +2%
Org. growth
Leveraging:
• Unrivalled partner network
• Multi-local business model
• Resilient Supply Chain
Performance:
• Digital services benefitting from
need for remote access
• Software strong in Q4
Residential & Critical Buildings
Data Centers
Utilities/Smart Grid
Consumer Packaged Goods
OEM
Investor Relations – Schneider Electric | Page 12
Electrification
+
Digitization
+
Sustainability
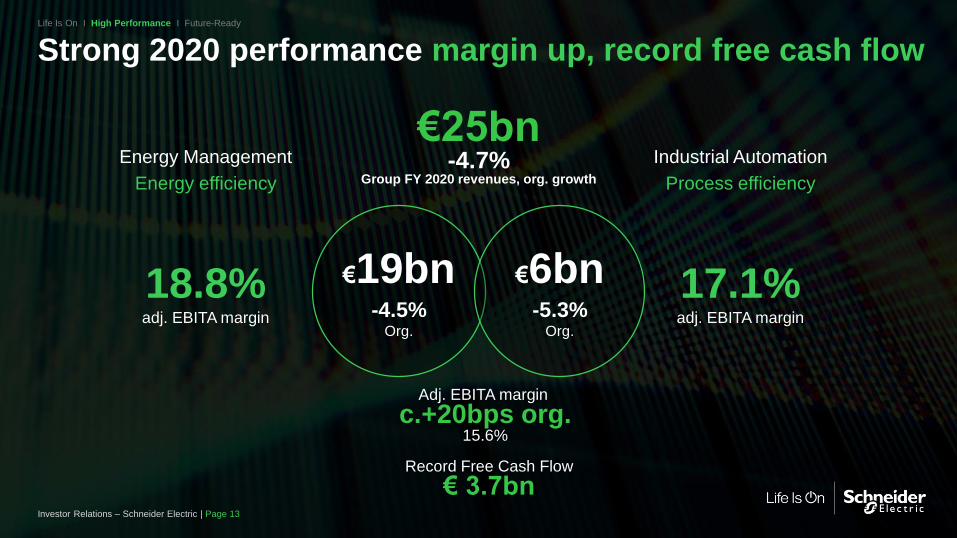
Strong 2020 performance margin up, record free cash flowLife Is On I High Performance I Future-Ready
Energy Management
Energy efficiency
Industrial Automation
Process efficiency
€25bn -4.7%
Group FY 2020 revenues, org. growth
Adj. EBITA margin
c.+20bps org.15.6%
18.8%adj. EBITA margin
17.1%adj. EBITA margin
€19bn €6bn-4.5%
Org.
-5.3%Org.
Record Free Cash Flow
€ 3.7bnInvestor Relations – Schneider Electric | Page 13
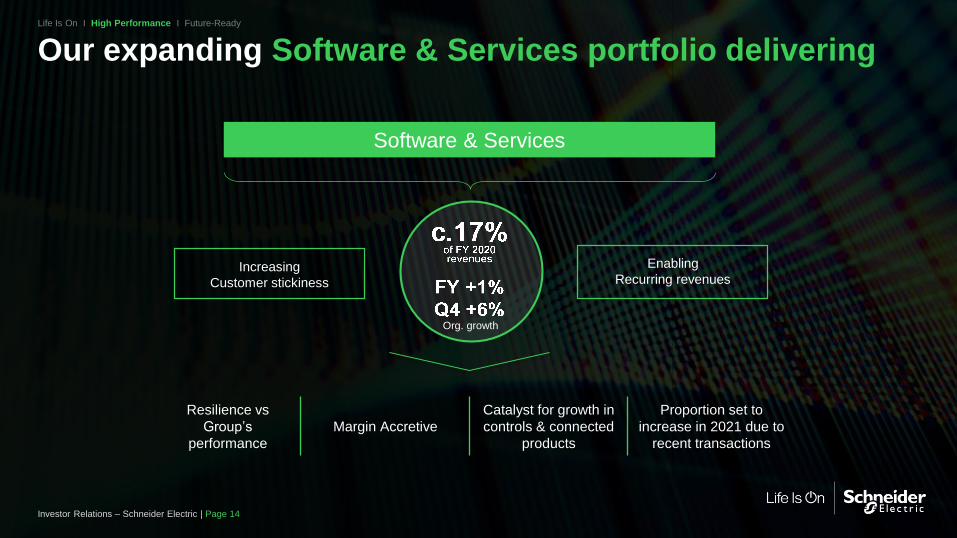
Software & Services
Increasing
Customer stickiness
Enabling
Recurring revenues
Org. growth
Resilience vs
Group’s
performance
Margin Accretive
Catalyst for growth in
controls & connected
products
Proportion set to
increase in 2021 due to
recent transactions
Our expanding Software & Services portfolio delivering Life Is On I High Performance I Future-Ready
Investor Relations – Schneider Electric | Page 14
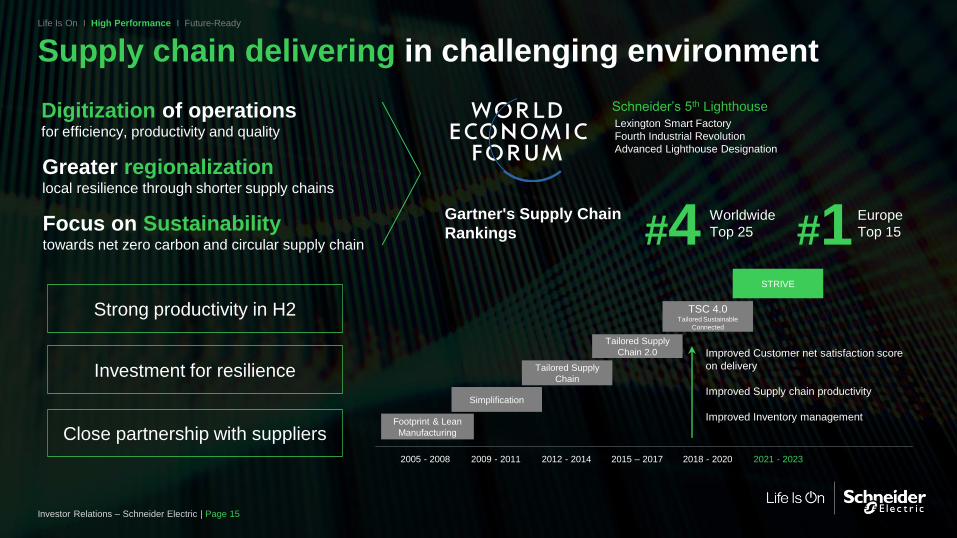
Supply chain delivering in challenging environmentLife Is On I High Performance I Future-Ready
Gartner's Supply Chain
Rankings #4 Europe
Top 15#1Worldwide
Top 25
Lexington Smart Factory
Fourth Industrial Revolution
Advanced Lighthouse Designation
Schneider’s 5th LighthouseDigitization of operationsfor efficiency, productivity and quality
Focus on Sustainabilitytowards net zero carbon and circular supply chain
Greater regionalizationlocal resilience through shorter supply chains
Investment for resilience
Strong productivity in H2
Footprint & Lean
Manufacturing
Simplification
Tailored Supply
Chain
Tailored Supply
Chain 2.0
TSC 4.0Tailored Sustainable
Connected
STRIVE
2005 - 2008 2009 - 2011 2012 - 2014 2015 – 2017 2018 - 2020 2021 - 2023
Improved Customer net satisfaction score
on delivery
Improved Supply chain productivity
Improved Inventory management
Investor Relations – Schneider Electric | Page 15
Close partnership with suppliers
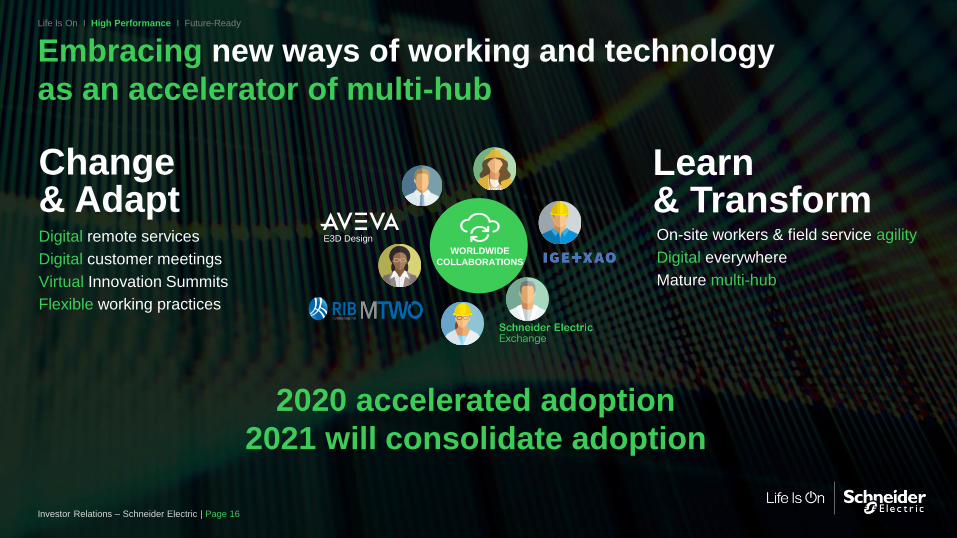
2020 accelerated adoption
2021 will consolidate adoption
Change & Adapt
Learn & Transform
Digital remote services
Digital customer meetings
Virtual Innovation Summits
Flexible working practices
On-site workers & field service agility
Digital everywhere
Mature multi-hub
E3D Design
WORLDWIDE
COLLABORATIONS
Embracing new ways of working and technology
as an accelerator of multi-hub
Life Is On I High Performance I Future-Ready
Investor Relations – Schneider Electric | Page 16
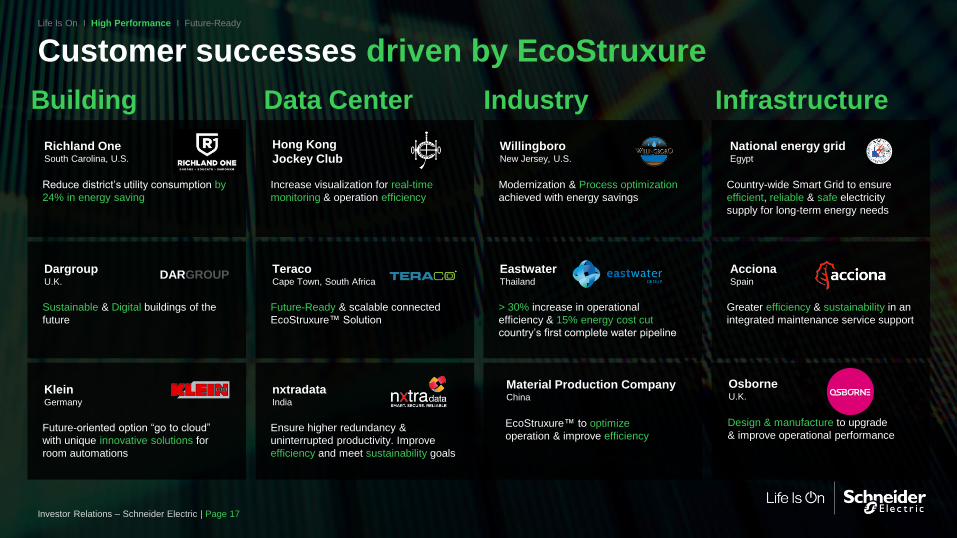
Customer successes driven by EcoStruxureLife Is On I High Performance I Future-Ready
DARGROUP
Reduce district’s utility consumption by
24% in energy saving
Increase visualization for real-time
monitoring & operation efficiency
Modernization & Process optimization
achieved with energy savings
Country-wide Smart Grid to ensure
efficient, reliable & safe electricity
supply for long-term energy needs
Richland OneSouth Carolina, U.S.
Hong Kong
Jockey ClubWillingboroNew Jersey, U.S.
National energy gridEgypt
DargroupU.K.
TeracoCape Town, South Africa
EastwaterThailand
AccionaSpain
Sustainable & Digital buildings of the
future
Future-Ready & scalable connected
EcoStruxure™ Solution
> 30% increase in operational
efficiency & 15% energy cost cut
country’s first complete water pipeline
Greater efficiency & sustainability in an
integrated maintenance service support
KleinGermany
nxtradataIndia
Future-oriented option “go to cloud”
with unique innovative solutions for
room automations
Ensure higher redundancy &
uninterrupted productivity. Improve
efficiency and meet sustainability goals
Investor Relations – Schneider Electric | Page 17
Building Data Center Industry Infrastructure
Design & manufacture to upgrade
& improve operational performance
OsborneU.K.
EcoStruxure™ to optimize
operation & improve efficiency
Material Production CompanyChina

Investor Relations – Schneider Electric | Page 18
Life Is On I High Performance I Future-Ready
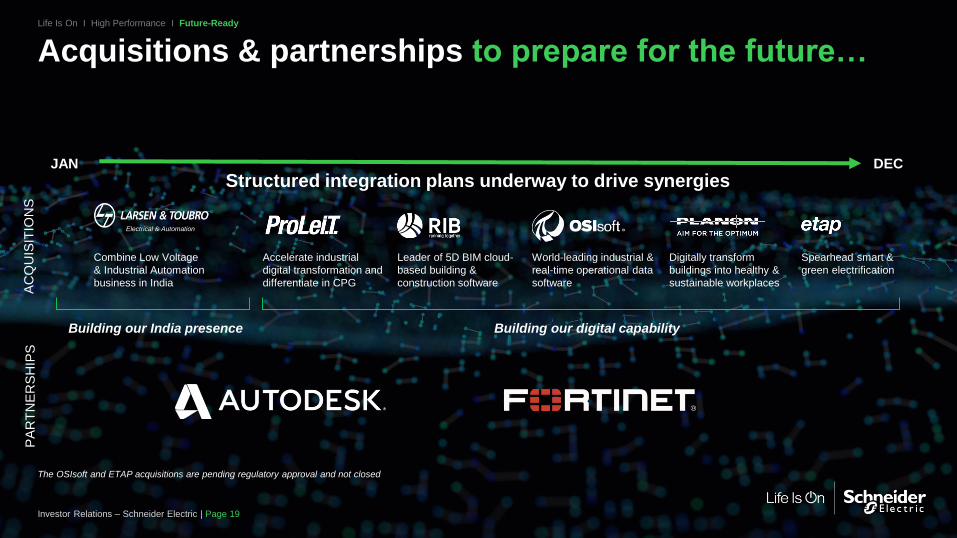
Acquisitions & partnerships to prepare for the future…Life Is On I High Performance I Future-Ready
JAN DEC
Electrical & Automation
Digitally transform
buildings into healthy &
sustainable workplaces
Spearhead smart &
green electrification
Accelerate industrial
digital transformation and
differentiate in CPG
World-leading industrial &
real-time operational data
software
Combine Low Voltage
& Industrial Automation
business in India
Leader of 5D BIM cloud-
based building &
construction software
Structured integration plans underway to drive synergies
The OSIsoft and ETAP acquisitions are pending regulatory approval and not closed
Building our digital capabilityBuilding our India presence
Investor Relations – Schneider Electric | Page 19
AC
QU
ISIT
ION
SP
AR
TN
ER
SH
IPS
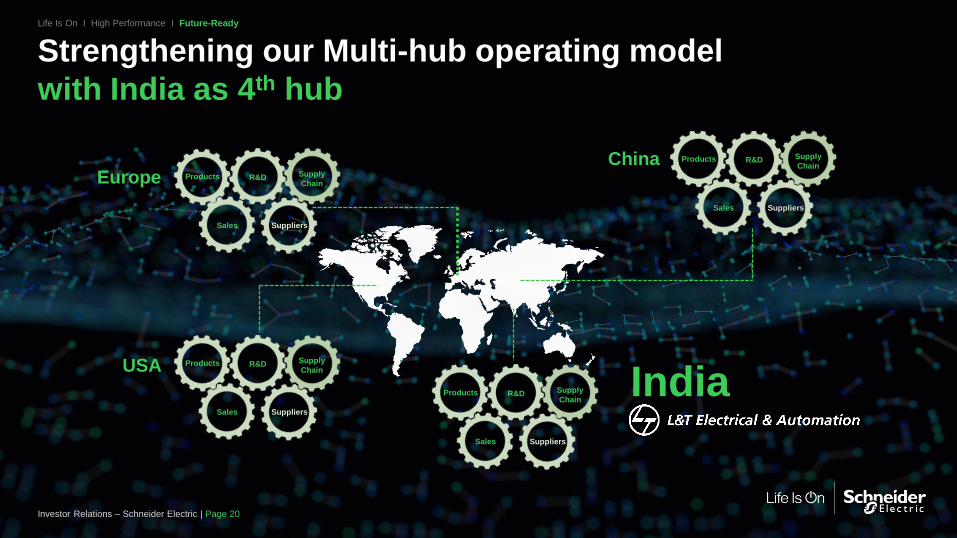
Strengthening our Multi-hub operating model
with India as 4th hub
Life Is On I High Performance I Future-Ready
Europe
USA
India
ChinaR&DProducts Supply
Chain
Sales Suppliers
R&DProducts Supply
Chain
Sales Suppliers
R&DProducts Supply
Chain
Sales Suppliers
R&DProducts Supply
Chain
Sales Suppliers
Investor Relations – Schneider Electric | Page 20
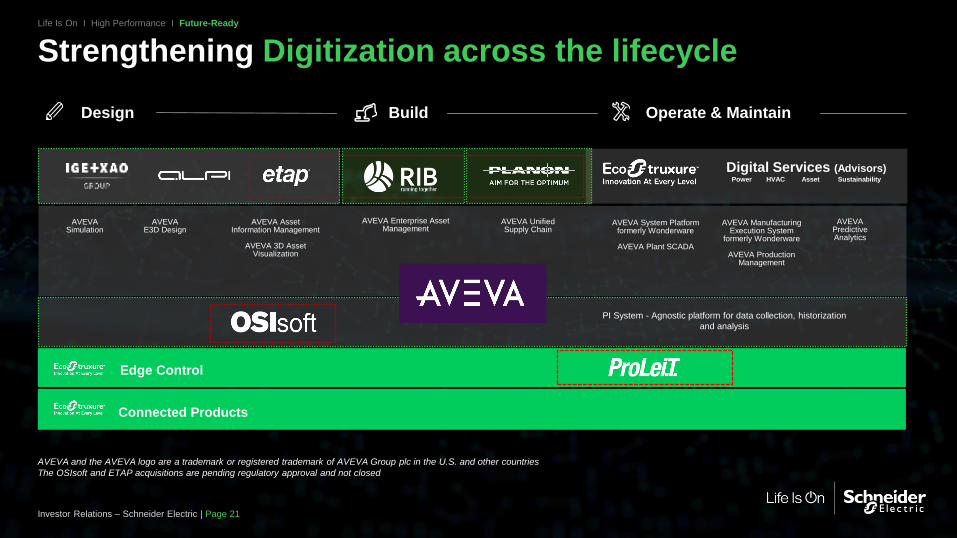
Strengthening Digitization across the lifecycleLife Is On I High Performance I Future-Ready
Edge Control
Connected Products
AVEVA System Platformformerly Wonderware
AVEVA Plant SCADA
AVEVA Manufacturing Execution System
formerly Wonderware
AVEVA Production Management
AVEVA Unified Supply Chain
AVEVA Predictive Analytics
AVEVA Simulation
AVEVAE3D Design
AVEVA Asset Information Management
AVEVA 3D Asset Visualization
AVEVA Enterprise Asset Management
Operate & MaintainDesign Build
Digital Services (Advisors) Power HVAC Asset Sustainability
PI System - Agnostic platform for data collection, historization
and analysis
AVEVA and the AVEVA logo are a trademark or registered trademark of AVEVA Group plc in the U.S. and other countries
The OSIsoft and ETAP acquisitions are pending regulatory approval and not closed
Investor Relations – Schneider Electric | Page 21
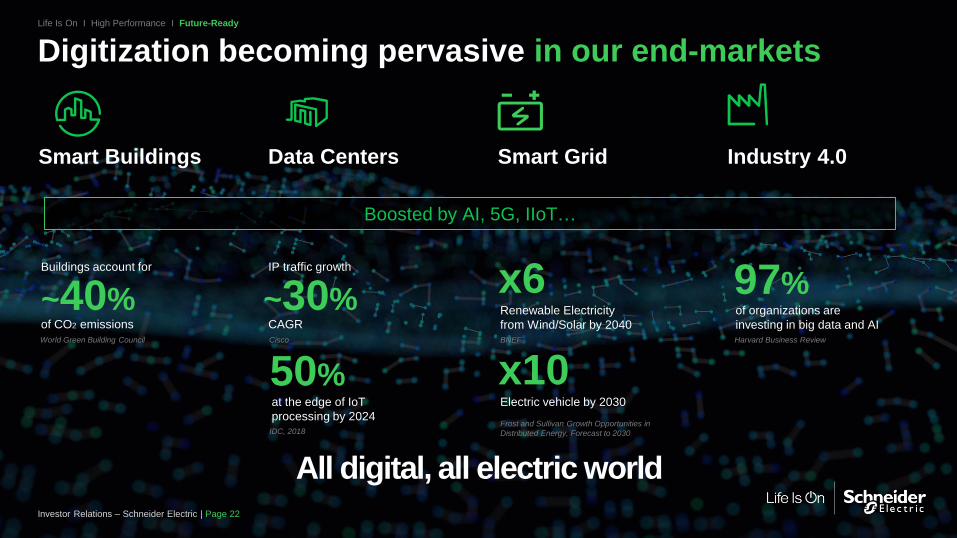
Digitization becoming pervasive in our end-marketsLife Is On I High Performance I Future-Ready
Smart Buildings Data Centers Smart Grid Industry 4.0
All digital, all electric world
Buildings account for
of CO2 emissions
~40%
IP traffic growth
CAGR
~30% Renewable Electricity
from Wind/Solar by 2040
x6of organizations are
investing in big data and AI
97%
Electric vehicle by 2030
x10at the edge of IoT
processing by 2024
50%
World Green Building Council BNEF Harvard Business ReviewCisco
Frost and Sullivan Growth Opportunities in
Distributed Energy, Forecast to 2030IDC, 2018
Investor Relations – Schneider Electric | Page 22
Boosted by AI, 5G, IIoT…
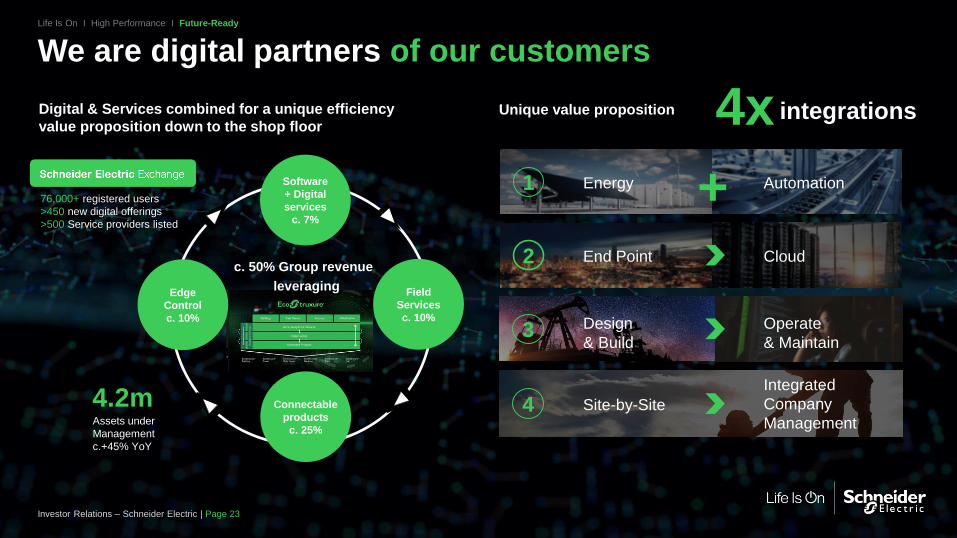
We are digital partners of our customersLife Is On I High Performance I Future-Ready
Digital & Services combined for a unique efficiency
value proposition down to the shop floorUnique value proposition 4x integrations
Energy Automation+1
End Point Cloud2
Design
& Build
Operate
& Maintain3
Site-by-Site4Integrated
Company
Management
Field
Services
c. 10%
Connectable
products
c. 25%
Software
+ Digital
services
c. 7%
c. 50% Group revenue
leveragingEdge
Control
c. 10%
Assets under
Management
c.+45% YoY
4.2m
76,000+ registered users
>450 new digital offerings
>500 Service providers listed
Investor Relations – Schneider Electric | Page 23
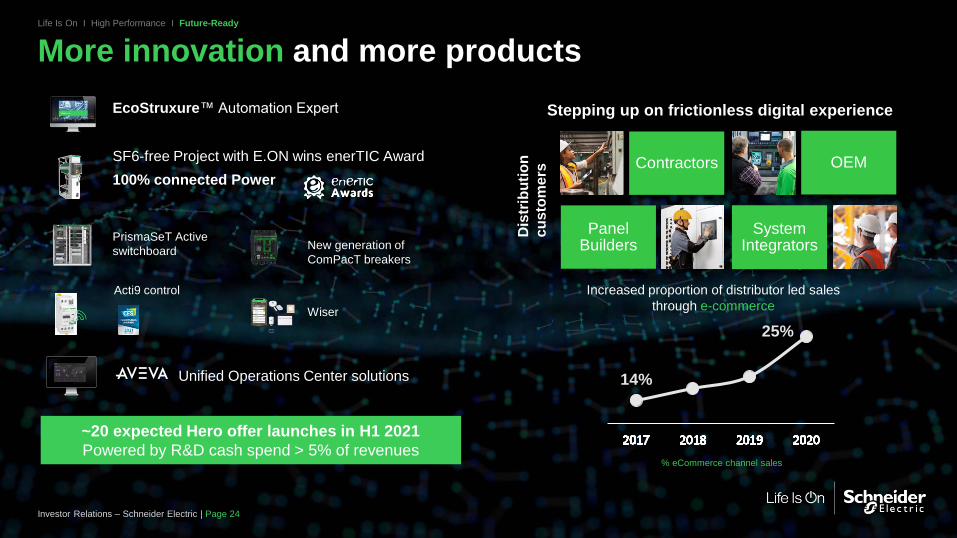
More innovation and more productsLife Is On I High Performance I Future-Ready
~20 expected Hero offer launches in H1 2021
Powered by R&D cash spend > 5% of revenues
SF6-free Project with E.ON wins enerTIC Award
EcoStruxure™ Automation Expert
PrismaSeT Active
switchboard
100% connected Power
Unified Operations Center solutions
New generation of
ComPacT breakers
Acti9 control
Wiser
Investor Relations – Schneider Electric | Page 24
Stepping up on frictionless digital experience
Contractors
Panel Builders
OEM
System Integrators
Dis
trib
uti
on
cu
sto
me
rs
Increased proportion of distributor led sales
through e-commerce
% eCommerce channel sales
14%
25%
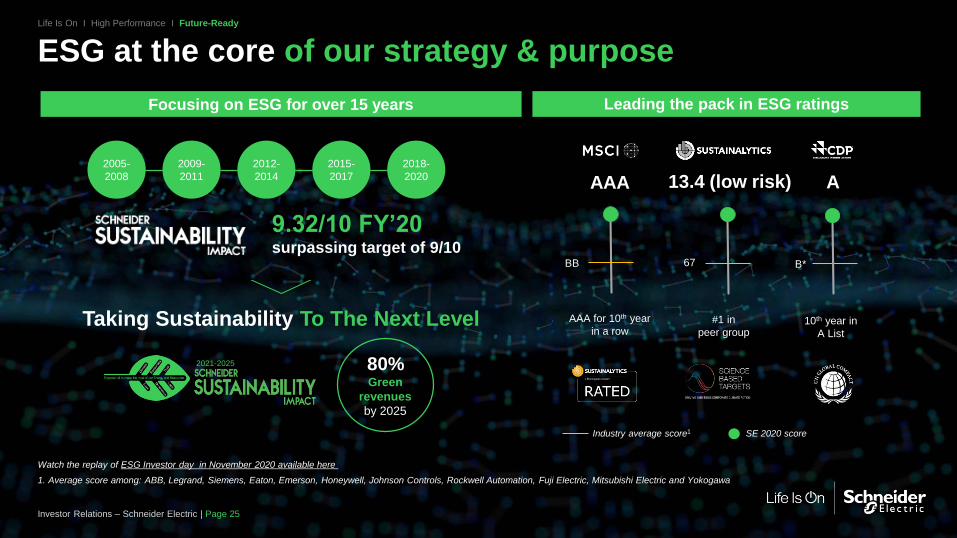
ESG at the core of our strategy & purpose Life Is On I High Performance I Future-Ready
Leading the pack in ESG ratingsFocusing on ESG for over 15 years
2005-
2008
2009-
2011
2012-
2014
2015-
2017
2018-
2020
B*67
AAA 13.4 (low risk) A
BB
Industry average score1
AAA for 10th year
in a row#1 in
peer group10th year in
A List
SE 2020 score
9.32/10 FY’20surpassing target of 9/10
Taking Sustainability To The Next Level
2021-2025
1. Average score among: ABB, Legrand, Siemens, Eaton, Emerson, Honeywell, Johnson Controls, Rockwell Automation, Fuji Electric, Mitsubishi Electric and Yokogawa
Watch the replay of ESG Investor day in November 2020 available here
Investor Relations – Schneider Electric | Page 25
80% Green
revenues
by 2025
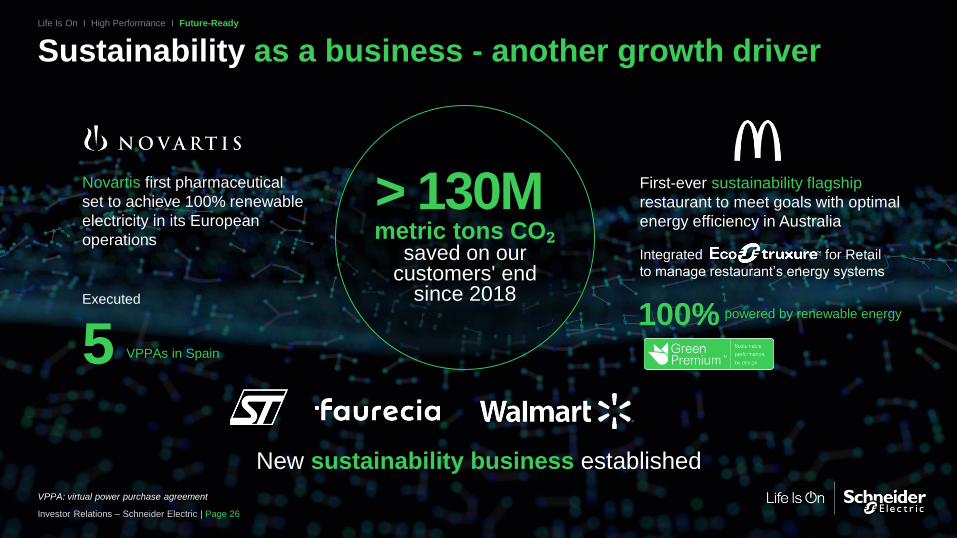
Sustainability as a business - another growth driverLife Is On I High Performance I Future-Ready
> 130Mmetric tons CO₂
saved on ourcustomers' end
since 2018
Integrated for Retail
to manage restaurant’s energy systems
100%
Novartis first pharmaceutical
set to achieve 100% renewable
electricity in its European
operations
5Executed
New sustainability business established
powered by renewable energy
VPPAs in Spain
First-ever sustainability flagship
restaurant to meet goals with optimal
energy efficiency in Australia
VPPA: virtual power purchase agreement
Investor Relations – Schneider Electric | Page 26
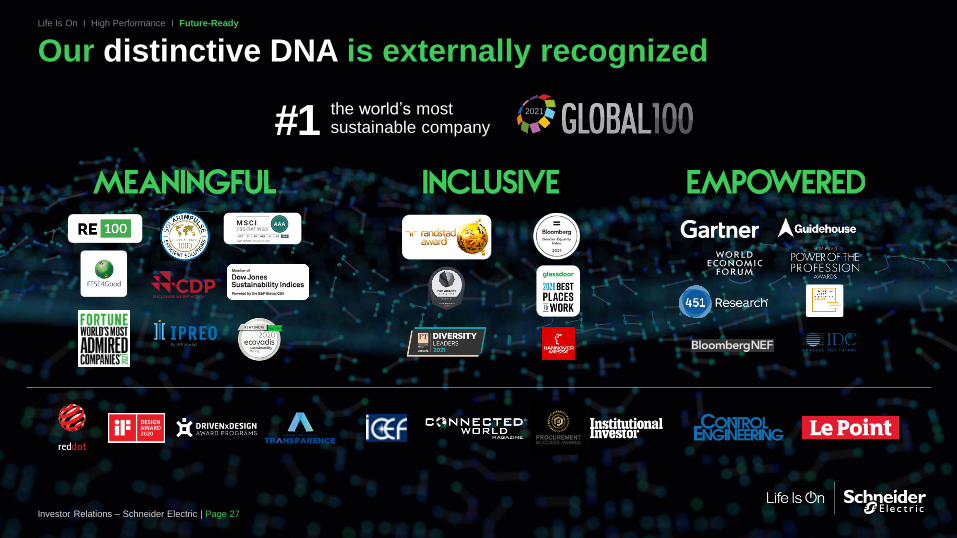
Our distinctive DNA is externally recognizedLife Is On I High Performance I Future-Ready
#1the world’s mostsustainable company
2021
Investor Relations – Schneider Electric | Page 27
We remain focused on generating shareholder value Life Is On I High Performance I Future-Ready
* SE performance among 11 peers as considered for long-term incentive plan (base 100: Jan 1st, 2018)
** Proposed dividend subject to Shareholder approval on April 28, 2021
40
60
80
100
120
140
160
180
200
20202018 2019
Total Shareholder Return
SE #1 in 2020 & over a 3-year period
Progressive Dividend** for 11 years
€2.60**Dividend per share
+2% vs. 2019
*
3-YEAR TSR
c. +85%
1-YEAR TSR
c. +33% 2010 202020172016 2018201520142013 201920122009 2011
x2.5
Progressive dividend
(payout ratio of c.50% of adj. net income)
Investor Relations – Schneider Electric | Page 28

FY 2020 Financial Highlights
Hilary Maxson
CFO
Investor Relations – Schneider Electric | Page 29
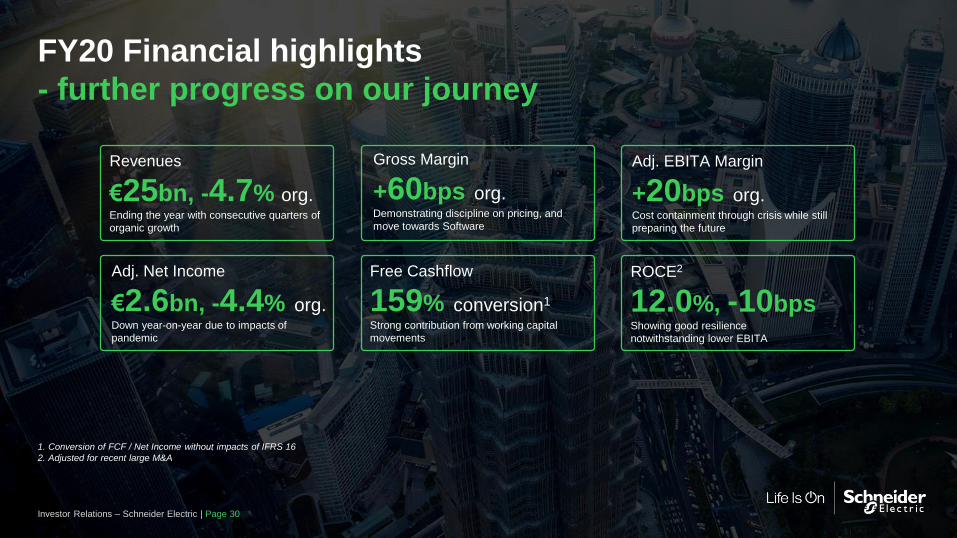
FY20 Financial highlights
- further progress on our journey
Revenues
€25bn, -4.7% org.Ending the year with consecutive quarters of
organic growth
Gross Margin
+60bps org.Demonstrating discipline on pricing, and
move towards Software
Adj. EBITA Margin
+20bps org.Cost containment through crisis while still
preparing the future
Free Cashflow
159% conversion1
Strong contribution from working capital
movements
ROCE2
12.0%, -10bpsShowing good resilience
notwithstanding lower EBITA
1. Conversion of FCF / Net Income without impacts of IFRS 16
2. Adjusted for recent large M&A
Investor Relations – Schneider Electric | Page 30
Adj. Net Income
€2.6bn, -4.4% org.Down year-on-year due to impacts of
pandemic
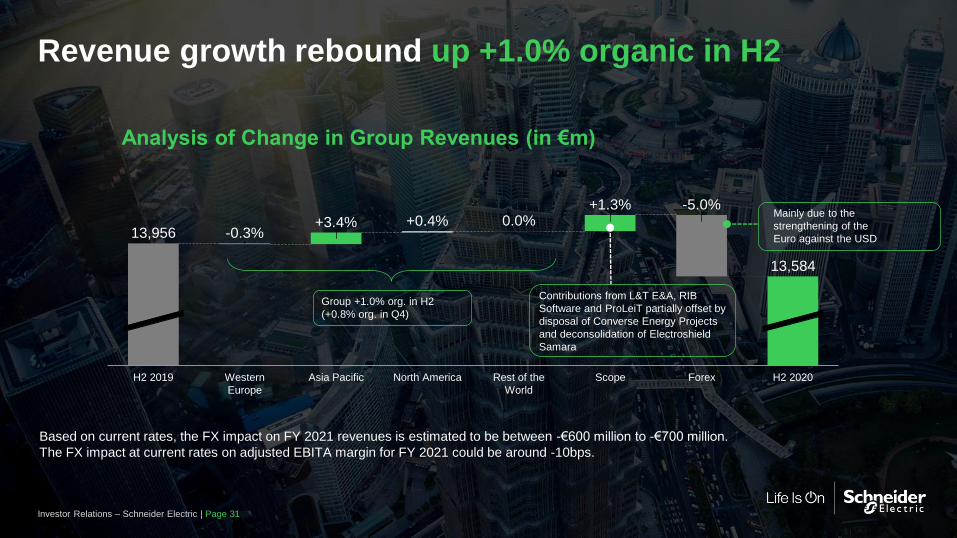
Revenue growth rebound up +1.0% organic in H2
Analysis of Change in Group Revenues (in €m)
Based on current rates, the FX impact on FY 2021 revenues is estimated to be between -€600 million to -€700 million.
The FX impact at current rates on adjusted EBITA margin for FY 2021 could be around -10bps.
Investor Relations – Schneider Electric | Page 31
+1.3%
-0.3%
Forex H2 2020
13,9560.0%
Western
Europe
+3.4%
13,584
Asia Pacific
+0.4%
North America
-5.0%
H2 2019 ScopeRest of the
World
Contributions from L&T E&A, RIB
Software and ProLeiT partially offset by
disposal of Converse Energy Projects
and deconsolidation of Electroshield
Samara
Group +1.0% org. in H2
(+0.8% org. in Q4)
Mainly due to the
strengthening of the
Euro against the USD
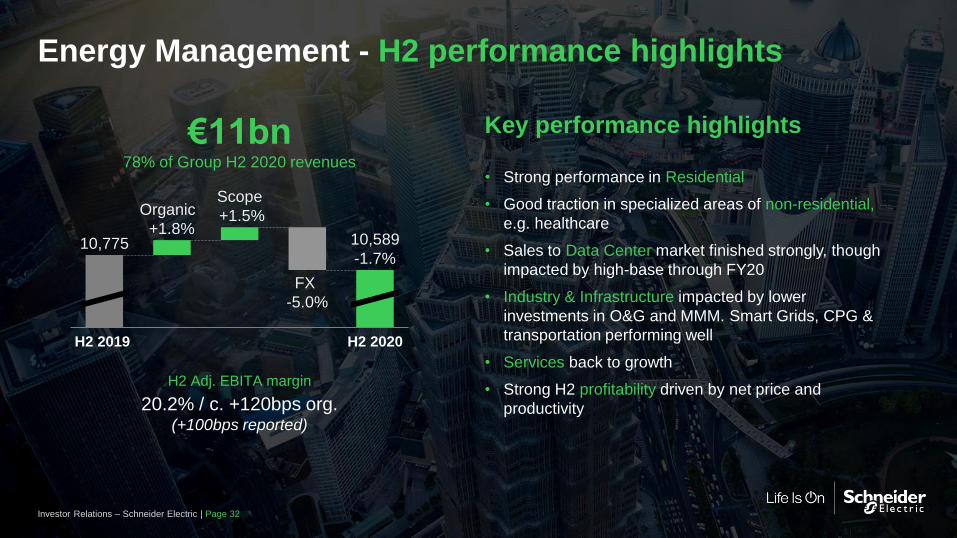
Energy Management - H2 performance highlights
€11bn78% of Group H2 2020 revenues
H2 Adj. EBITA margin
20.2% / c. +120bps org.(+100bps reported)
H2 2020H2 2019
10,775
Organic
+1.8%
Scope
+1.5%
FX
-5.0%
10,589
-1.7%
Key performance highlights
• Strong performance in Residential
• Good traction in specialized areas of non-residential,
e.g. healthcare
• Sales to Data Center market finished strongly, though
impacted by high-base through FY20
• Industry & Infrastructure impacted by lower
investments in O&G and MMM. Smart Grids, CPG &
transportation performing well
• Services back to growth
• Strong H2 profitability driven by net price and
productivity
Investor Relations – Schneider Electric | Page 32
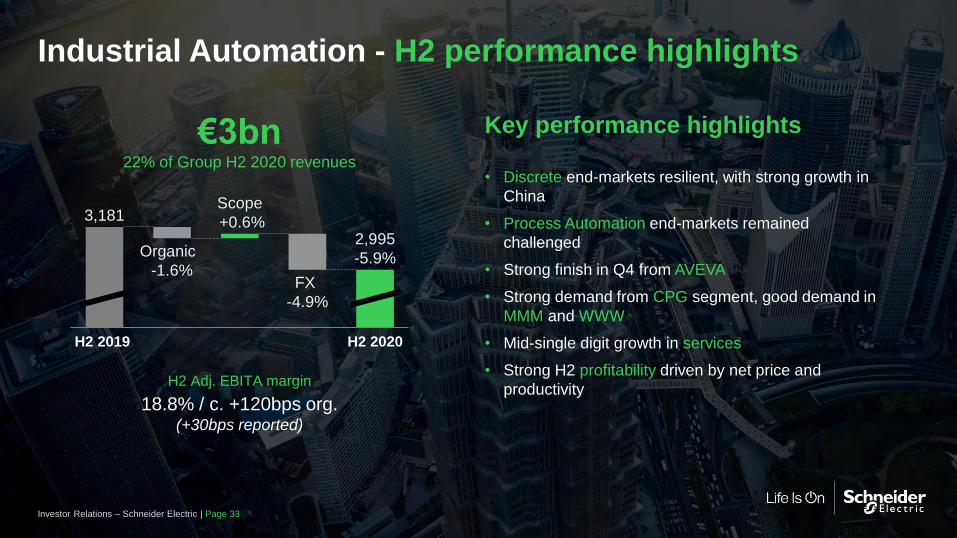
Industrial Automation - H2 performance highlights
€3bn22% of Group H2 2020 revenues
H2 Adj. EBITA margin
18.8% / c. +120bps org.(+30bps reported)
H2 2020H2 2019
Key performance highlights
• Discrete end-markets resilient, with strong growth in
China
• Process Automation end-markets remained
challenged
• Strong finish in Q4 from AVEVA
• Strong demand from CPG segment, good demand in
MMM and WWW
• Mid-single digit growth in services
• Strong H2 profitability driven by net price and
productivity
2,995
-5.9%
FX
-4.9%
3,181
Organic
-1.6%
Scope
+0.6%
Investor Relations – Schneider Electric | Page 33
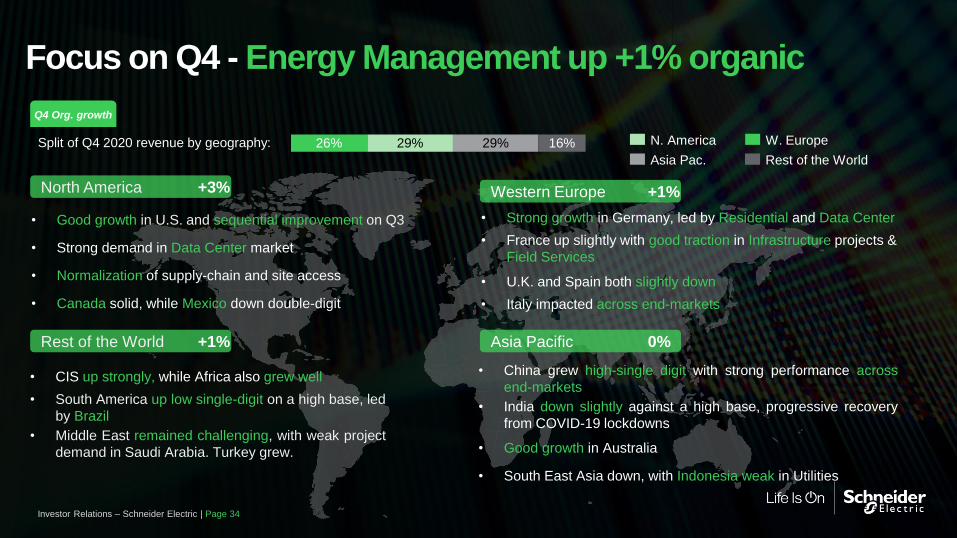
Split of Q4 2020 revenue by geography:
Q4 Org. growth
W. Europe
Rest of the World
• Good growth in U.S. and sequential improvement on Q3
• Strong demand in Data Center market
• Normalization of supply-chain and site access
• Canada solid, while Mexico down double-digit
N. America
• CIS up strongly, while Africa also grew well
• South America up low single-digit on a high base, led
by Brazil
• Middle East remained challenging, with weak project
demand in Saudi Arabia. Turkey grew.
Asia Pac.
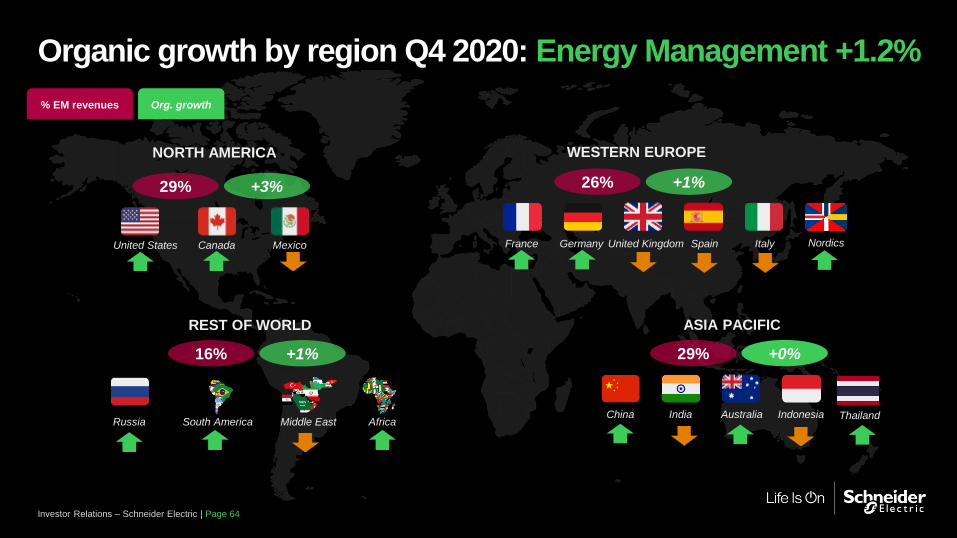
North America +3%
Rest of the World +1%
• China grew high-single digit with strong performance across
end-markets
• India down slightly against a high base, progressive recovery
from COVID-19 lockdowns
• Good growth in Australia
• South East Asia down, with Indonesia weak in Utilities
Asia Pacific 0%
• Strong growth in Germany, led by Residential and Data Center
• France up slightly with good traction in Infrastructure projects &
Field Services
• U.K. and Spain both slightly down
• Italy impacted across end-markets
26% 29% 29% 16%
Western Europe +1%
Focus on Q4 - Energy Management up +1% organic
Investor Relations – Schneider Electric | Page 34
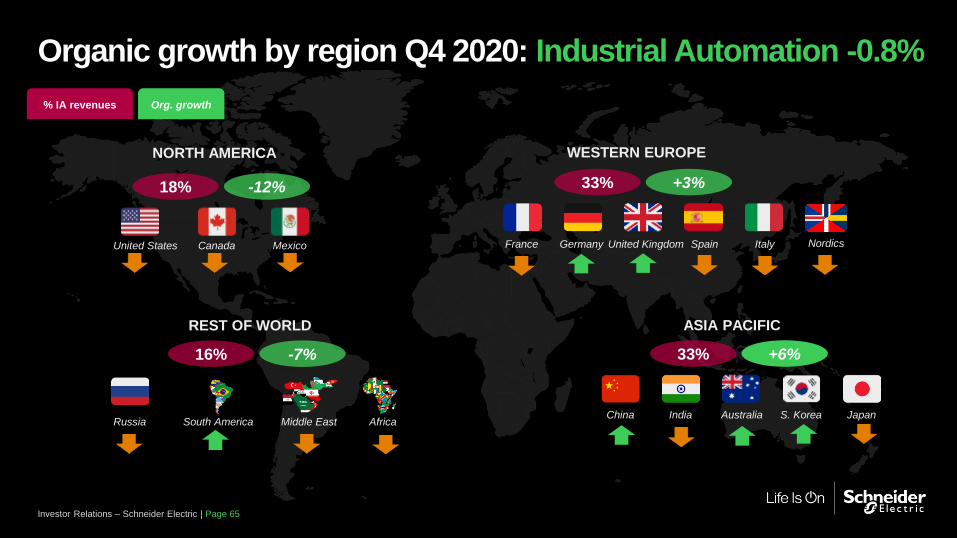
• U.S. OEM demand remained soft overall, but with
growth in certain targeted segments
• Process Automation markets in U.S. remained
challenged
• Canada and Mexico down
• Good growth in South America, with recovery in OEM
demand and good traction in CPG
• Middle East resilient, good performance in Turkey in
discrete markets, Gulf weaker
• Africa weak with delayed investment decisions
• CIS down on high base
• Good demand for the Group’s software offers, incl. U.K.
• Germany and Spain around flat
• Recovery in Discrete automation markets in Germany
• France and Italy down, due to weakness in Discrete markets
• China up double-digit led by OEM demand
• India down on high base of comparison in Process end-markets
• Strong growth in Australia, benefitting from Software
• Varied performance in other countries, South Korea up, Japan down
North America -12%
Rest of the World -7%
Western Europe +3%
Asia Pacific +6%
33% 18% 33% 16%
Q4 Org. growth
Split of Q4 2020 revenue by geography:
Focus on Q4 - Industrial Automation down -1% organic
W. Europe
Rest of the World
N. America
Asia Pac.
Investor Relations – Schneider Electric | Page 35
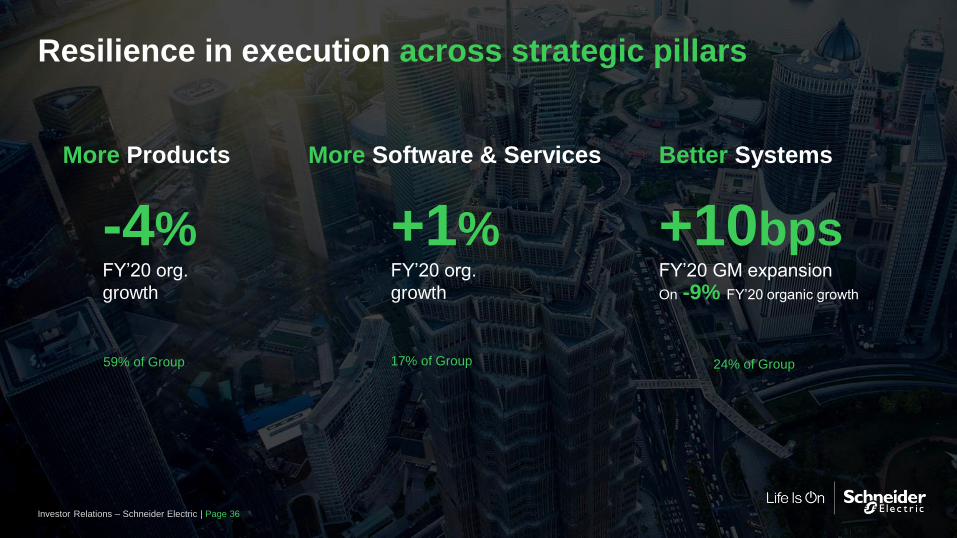
Resilience in execution across strategic pillars
More Software & ServicesMore Products Better Systems
+1%FY’20 org.
growth
-4%FY’20 org.
growth
+10bpsFY’20 GM expansion
On -9% FY’20 organic growth
59% of Group 24% of Group17% of Group
Investor Relations – Schneider Electric | Page 36
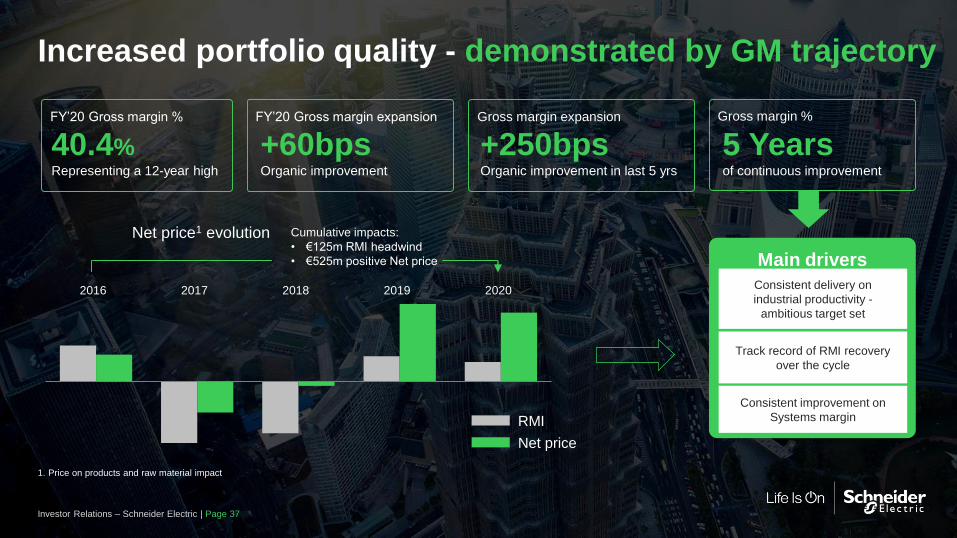
Increased portfolio quality - demonstrated by GM trajectory
FY’20 Gross margin % FY’20 Gross margin expansion Gross margin expansion Gross margin %
40.4%Representing a 12-year high
+60bpsOrganic improvement
+250bpsOrganic improvement in last 5 yrs
5 Yearsof continuous improvement
Main drivers
Track record of RMI recovery
over the cycle
Consistent delivery on
industrial productivity -
ambitious target set
Consistent improvement on
Systems margin
1. Price on products and raw material impact
2016 2017 2018 20202019
Net price1 evolution Cumulative impacts:
• €125m RMI headwind
• €525m positive Net price
RMI
Net price
Investor Relations – Schneider Electric | Page 37
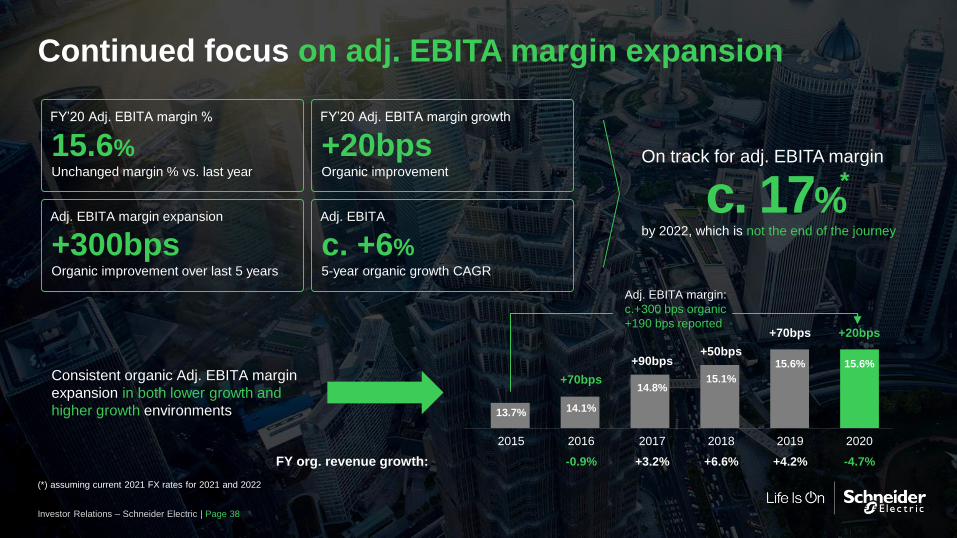
Continued focus on adj. EBITA margin expansion
FY’20 Adj. EBITA margin %
Adj. EBITA margin expansion
FY’20 Adj. EBITA margin growth
Adj. EBITA
15.6%Unchanged margin % vs. last year
+20bpsOrganic improvement
+300bpsOrganic improvement over last 5 years
c. +6%5-year organic growth CAGR
On track for adj. EBITA margin
by 2022, which is not the end of the journey
c. 17%
Consistent organic Adj. EBITA margin
expansion in both lower growth and
higher growth environments
-0.9% +6.6%+3.2% -4.7%+4.2%FY org. revenue growth:
2016 20182017 202020192015
14.1%
15.1%14.8%
15.6%15.6%
13.7%
+70bps
+50bps+90bps
+20bps+70bps
Adj. EBITA margin:
c.+300 bps organic
+190 bps reported
Investor Relations – Schneider Electric | Page 38
*
(*) assuming current 2021 FX rates for 2021 and 2022
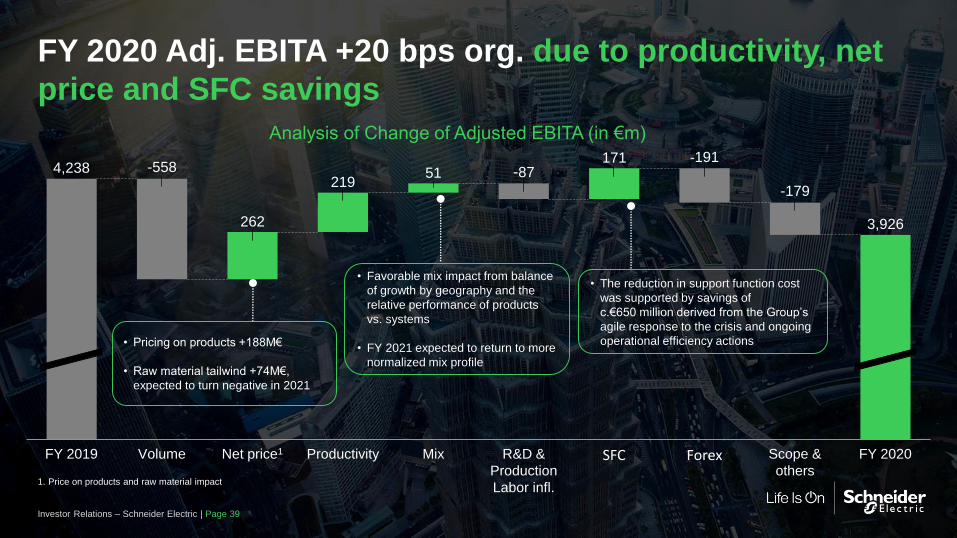
FY 2020 Adj. EBITA +20 bps org. due to productivity, net
price and SFC savings
Investor Relations – Schneider Electric | Page 39
Analysis of Change of Adjusted EBITA (in €m)
262
21951
171
-179
R&D &
Production
Labor infl.
Scope &
others
FY 2020Volume Net price1 Productivity
4,238
Mix
3,926
-87-558-191
FY 2019 ForexSFC
• Pricing on products +188M€
• Raw material tailwind +74M€,
expected to turn negative in 2021
• Favorable mix impact from balance
of growth by geography and the
relative performance of products
vs. systems
• FY 2021 expected to return to more
normalized mix profile
• The reduction in support function cost
was supported by savings of
c.€650 million derived from the Group’s
agile response to the crisis and ongoing
operational efficiency actions
1. Price on products and raw material impact
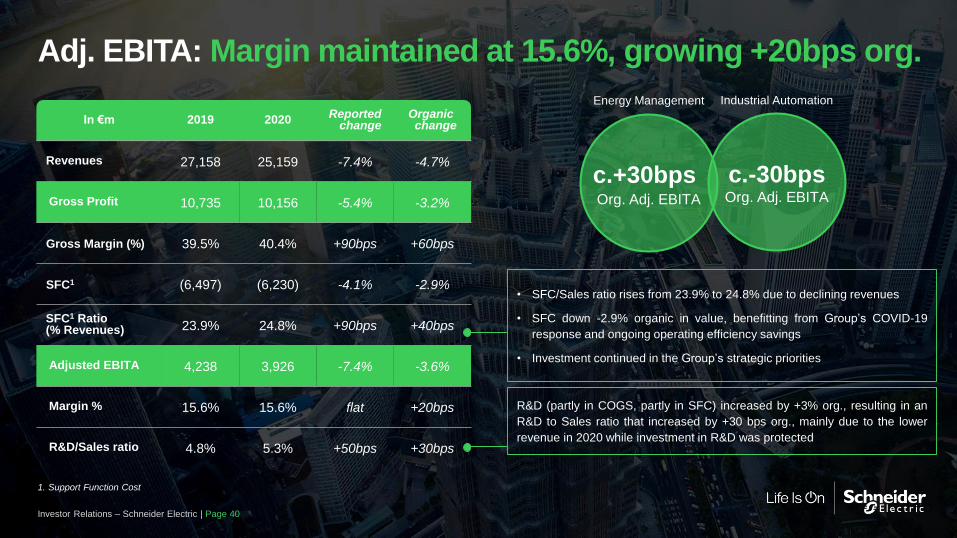
Adj. EBITA: Margin maintained at 15.6%, growing +20bps org.
In €m 2019 2020Reported
changeOrganicchange
Revenues 27,158 25,159 -7.4% -4.7%
Gross Profit 10,735 10,156 -5.4% -3.2%
Gross Margin (%) 39.5% 40.4% +90bps +60bps
SFC1 (6,497) (6,230) -4.1% -2.9%
SFC1 Ratio(% Revenues) 23.9% 24.8% +90bps +40bps
Adjusted EBITA 4,238 3,926 -7.4% -3.6%
Margin % 15.6% 15.6% flat +20bps
R&D/Sales ratio 4.8% 5.3% +50bps +30bps
• SFC/Sales ratio rises from 23.9% to 24.8% due to declining revenues
• SFC down -2.9% organic in value, benefitting from Group’s COVID-19
response and ongoing operating efficiency savings
• Investment continued in the Group’s strategic priorities
R&D (partly in COGS, partly in SFC) increased by +3% org., resulting in an
R&D to Sales ratio that increased by +30 bps org., mainly due to the lower
revenue in 2020 while investment in R&D was protected
Energy Management Industrial Automation
c.+30bpsOrg. Adj. EBITA
c.-30bpsOrg. Adj. EBITA
1. Support Function Cost
Investor Relations – Schneider Electric | Page 40
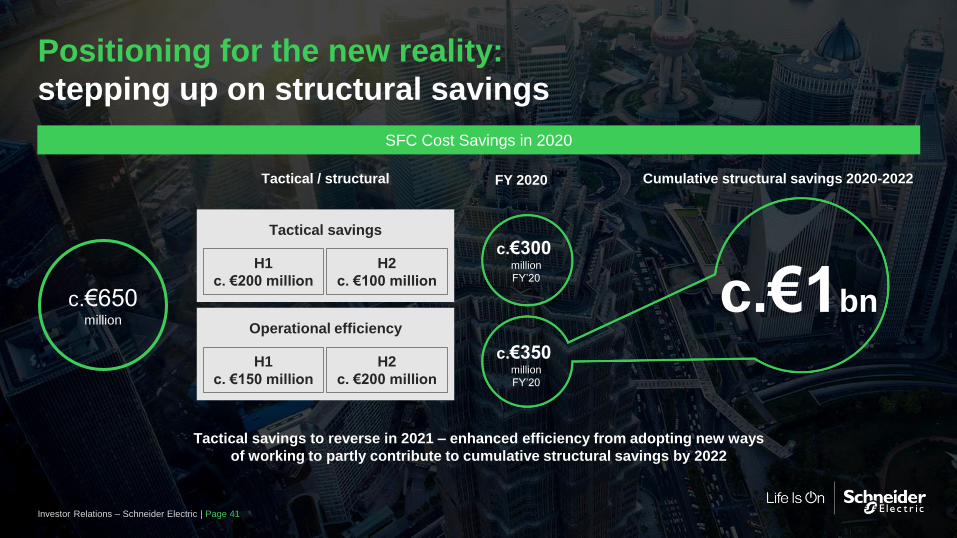
Positioning for the new reality:
stepping up on structural savings
SFC Cost Savings in 2020
Tactical / structural Cumulative structural savings 2020-2022FY 2020
c.€650 million
Tactical savings to reverse in 2021 – enhanced efficiency from adopting new ways
of working to partly contribute to cumulative structural savings by 2022
c.€300 million
FY’20
c.€350 million
FY’20
c.€1bn
Tactical savings
Operational efficiency
H1
c. €200 million
H2
c. €100 million
H1
c. €150 million
H2
c. €200 million
Investor Relations – Schneider Electric | Page 41
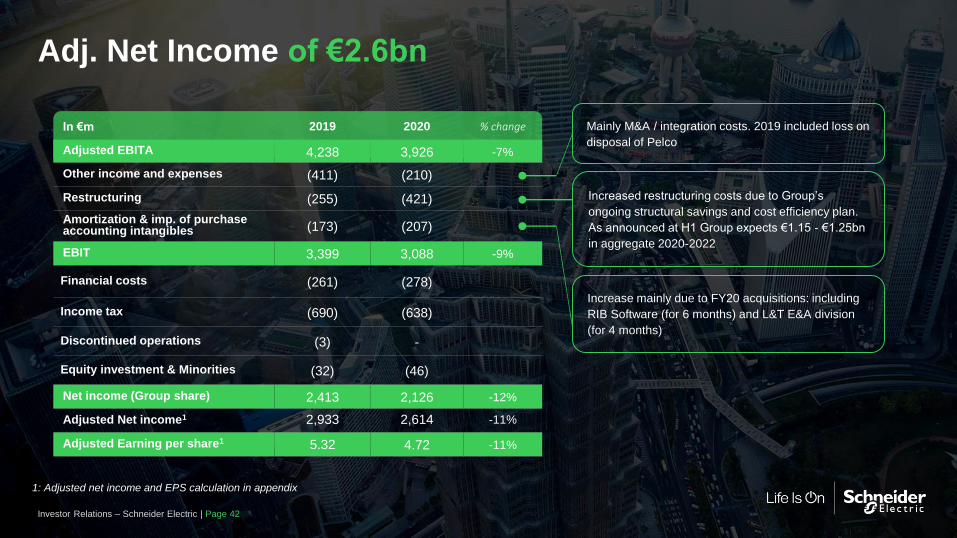
Adj. Net Income of €2.6bn
In €m 2019 2020 % change
Adjusted EBITA 4,238 3,926 -7%
Other income and expenses (411) (210)
Restructuring (255) (421)
Amortization & imp. of purchase accounting intangibles (173) (207)
EBIT 3,399 3,088 -9%
Financial costs (261) (278)
Income tax (690) (638)
Discontinued operations (3) -
Equity investment & Minorities (32) (46)
Net income (Group share) 2,413 2,126 -12%
Adjusted Net income1 2,933 2,614 -11%
Adjusted Earning per share1 5.32 4.72 -11%
Mainly M&A / integration costs. 2019 included loss on
disposal of Pelco
Increased restructuring costs due to Group’s
ongoing structural savings and cost efficiency plan.
As announced at H1 Group expects €1.15 - €1.25bn
in aggregate 2020-2022
Increase mainly due to FY20 acquisitions: including
RIB Software (for 6 months) and L&T E&A division
(for 4 months)
Investor Relations – Schneider Electric | Page 42
1: Adjusted net income and EPS calculation in appendix
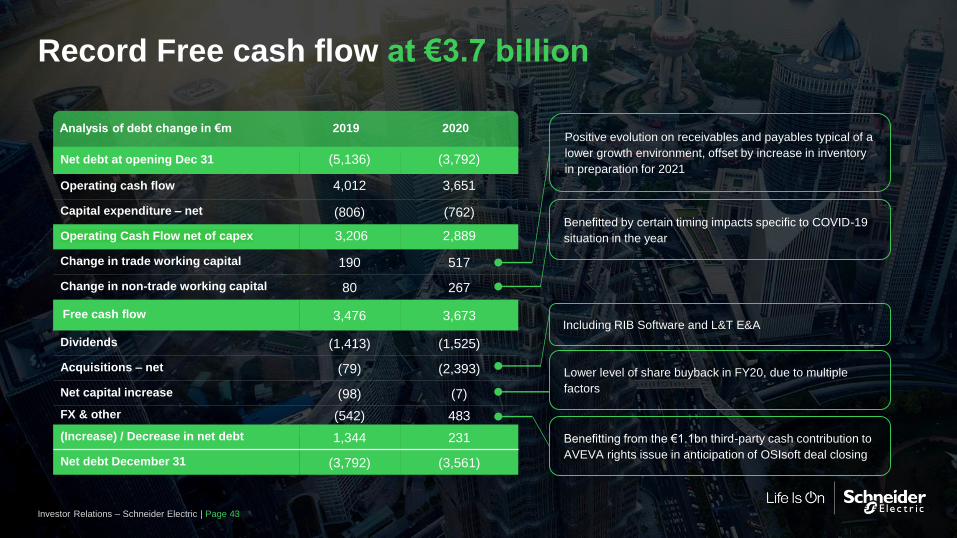
Record Free cash flow at €3.7 billion
Positive evolution on receivables and payables typical of a
lower growth environment, offset by increase in inventory
in preparation for 2021
Analysis of debt change in €m 2019 2020
Net debt at opening Dec 31 (5,136) (3,792)
Operating cash flow 4,012 3,651
Capital expenditure – net (806) (762)
Operating Cash Flow net of capex 3,206 2,889
Change in trade working capital 190 517
Change in non-trade working capital 80 267
Free cash flow 3,476 3,673
Dividends (1,413) (1,525)
Acquisitions – net (79) (2,393)
Net capital increase (98) (7)
FX & other (542) 483
(Increase) / Decrease in net debt 1,344 231
Net debt December 31 (3,792) (3,561)
Benefitted by certain timing impacts specific to COVID-19
situation in the year
Including RIB Software and L&T E&A
Lower level of share buyback in FY20, due to multiple
factors
Benefitting from the €1.1bn third-party cash contribution to
AVEVA rights issue in anticipation of OSIsoft deal closing
Investor Relations – Schneider Electric | Page 43
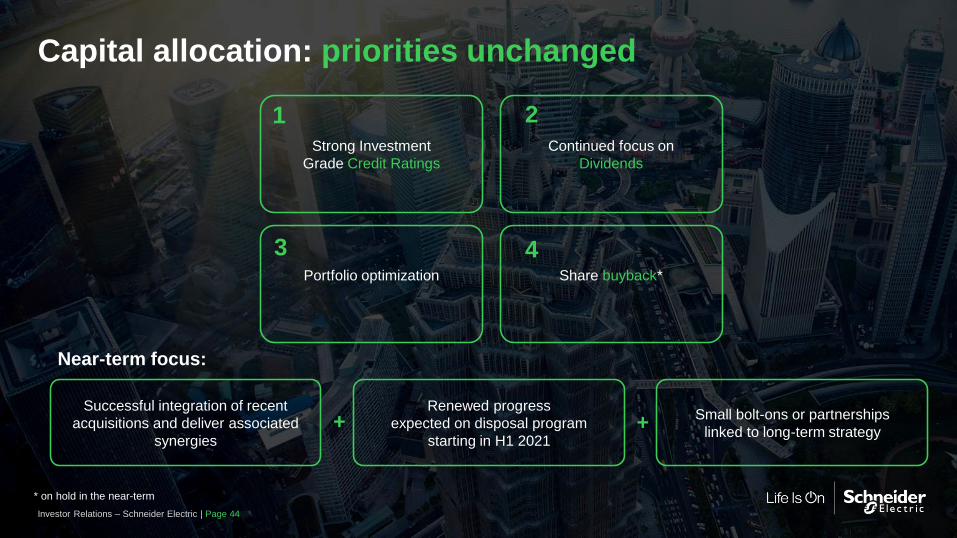
Capital allocation: priorities unchanged
Successful integration of recent
acquisitions and deliver associated
synergies
Renewed progress
expected on disposal program
starting in H1 2021
Small bolt-ons or partnerships
linked to long-term strategy
Portfolio optimization
Strong Investment
Grade Credit Ratings
Share buyback*
Continued focus on
Dividends
Investor Relations – Schneider Electric | Page 44
* on hold in the near-term
1 2
3 4
Near-term focus:
++
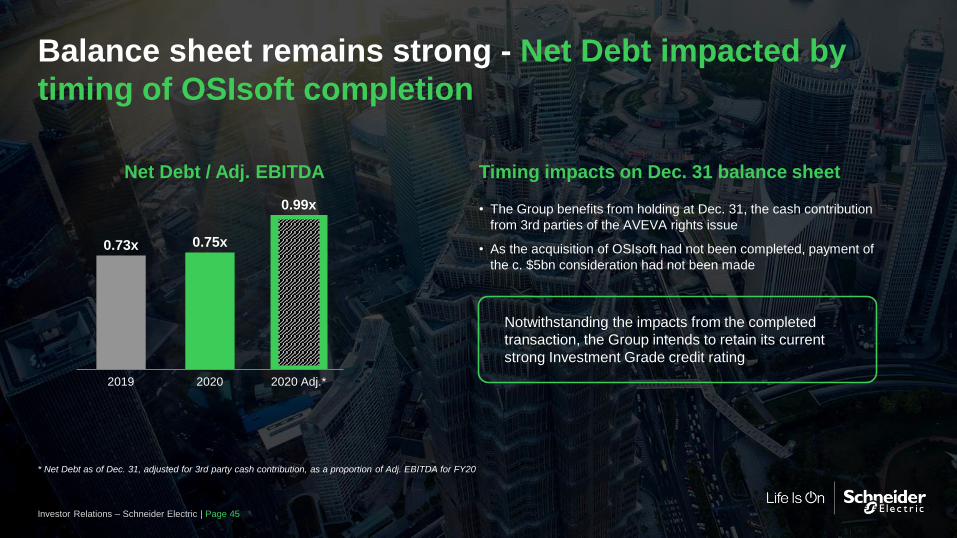
Balance sheet remains strong - Net Debt impacted by
timing of OSIsoft completion
• The Group benefits from holding at Dec. 31, the cash contribution
from 3rd parties of the AVEVA rights issue
• As the acquisition of OSIsoft had not been completed, payment of
the c. $5bn consideration had not been made
Timing impacts on Dec. 31 balance sheet
Notwithstanding the impacts from the completed
transaction, the Group intends to retain its current
strong Investment Grade credit rating
Net Debt / Adj. EBITDA
* Net Debt as of Dec. 31, adjusted for 3rd party cash contribution, as a proportion of Adj. EBITDA for FY20
2020 Adj.*2020
0.99x
2019
0.73x 0.75x
Investor Relations – Schneider Electric | Page 45
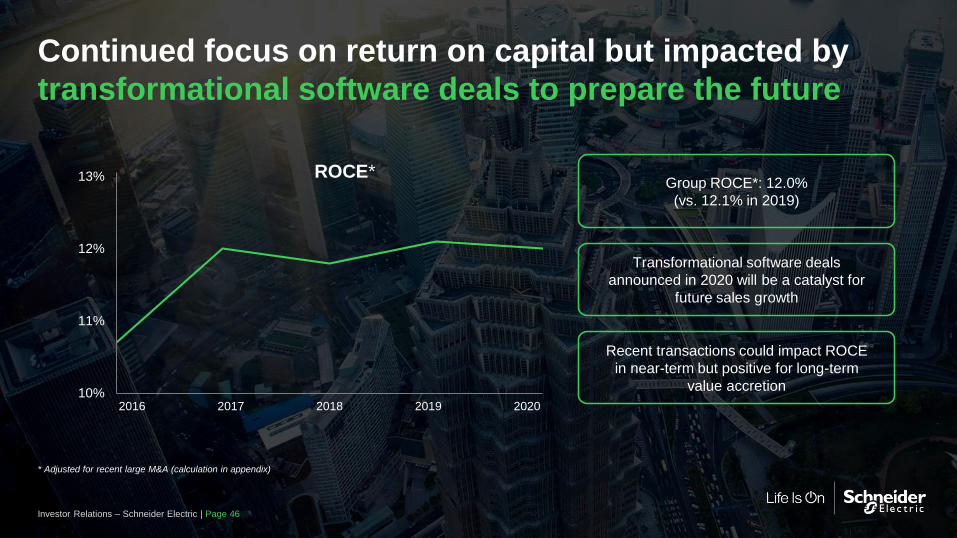
Continued focus on return on capital but impacted by
transformational software deals to prepare the future
* Adjusted for recent large M&A (calculation in appendix)
10%
11%
12%
13%
201920172016 2018 2020
ROCE*Group ROCE*: 12.0%
(vs. 12.1% in 2019)
Transformational software deals
announced in 2020 will be a catalyst for
future sales growth
Recent transactions could impact ROCE
in near-term but positive for long-term
value accretion
Investor Relations – Schneider Electric | Page 46
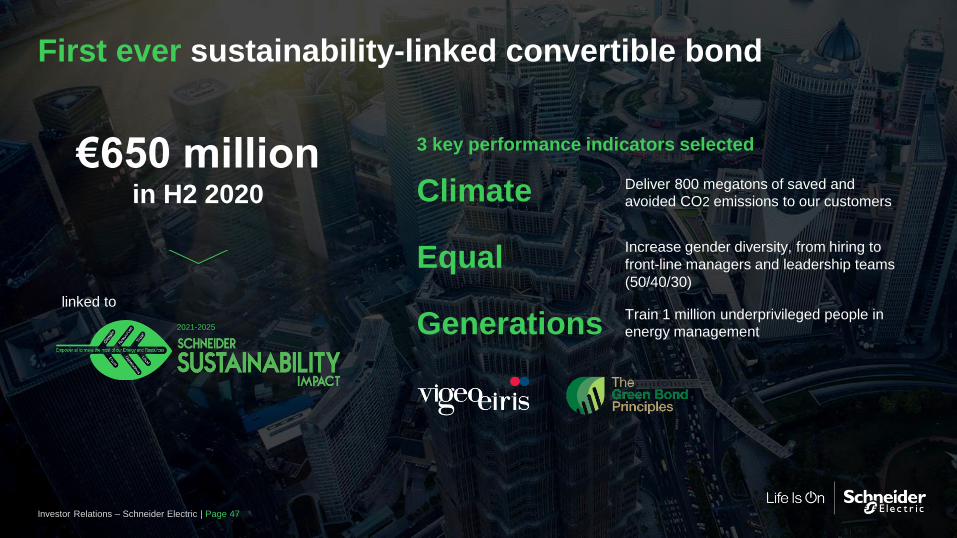
First ever sustainability-linked convertible bond
€650 millionin H2 2020
linked to
2021-2025
Climate
Equal
Generations
3 key performance indicators selected
Deliver 800 megatons of saved and
avoided CO2 emissions to our customers
Increase gender diversity, from hiring to
front-line managers and leadership teams
(50/40/30)
Train 1 million underprivileged people in
energy management
Investor Relations – Schneider Electric | Page 47

Expected market trends & financial target
Jean-Pascal Tricoire
Chairman & CEO
Investor Relations – Schneider Electric | Page 48
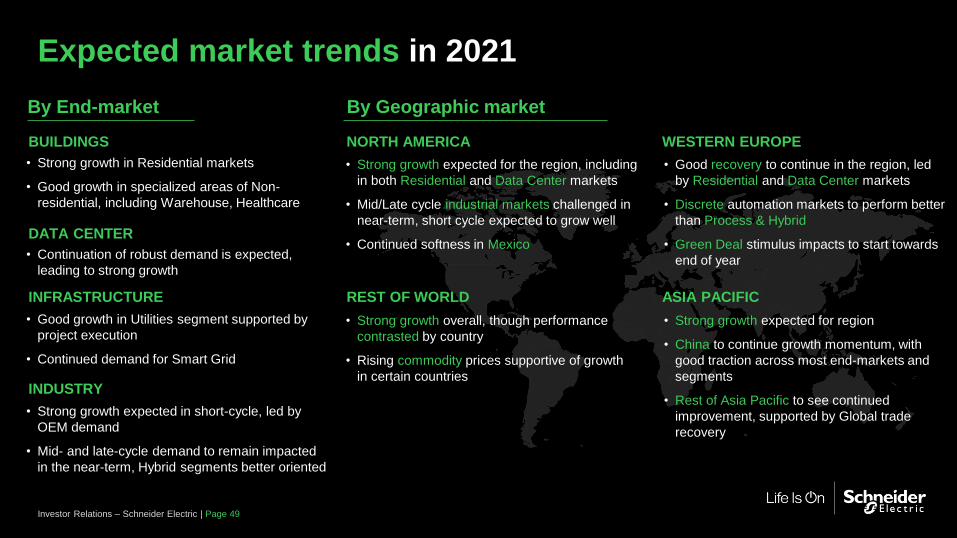
Expected market trends in 2021
Investor Relations – Schneider Electric | Page 49
By End-market By Geographic market
NORTH AMERICA
• Strong growth expected for the region, including
in both Residential and Data Center markets
• Mid/Late cycle industrial markets challenged in
near-term, short cycle expected to grow well
• Continued softness in Mexico
WESTERN EUROPE
• Good recovery to continue in the region, led
by Residential and Data Center markets
• Discrete automation markets to perform better
than Process & Hybrid
• Green Deal stimulus impacts to start towards
end of year
ASIA PACIFIC
• Strong growth expected for region
• China to continue growth momentum, with
good traction across most end-markets and
segments
• Rest of Asia Pacific to see continued
improvement, supported by Global trade
recovery
REST OF WORLD
• Strong growth overall, though performance
contrasted by country
• Rising commodity prices supportive of growth
in certain countries
BUILDINGS
DATA CENTER
INFRASTRUCTURE
INDUSTRY
• Strong growth in Residential markets
• Good growth in specialized areas of Non-
residential, including Warehouse, Healthcare
• Continuation of robust demand is expected,
leading to strong growth
• Strong growth expected in short-cycle, led by
OEM demand
• Mid- and late-cycle demand to remain impacted
in the near-term, Hybrid segments better oriented
• Good growth in Utilities segment supported by
project execution
• Continued demand for Smart Grid
2021 Target
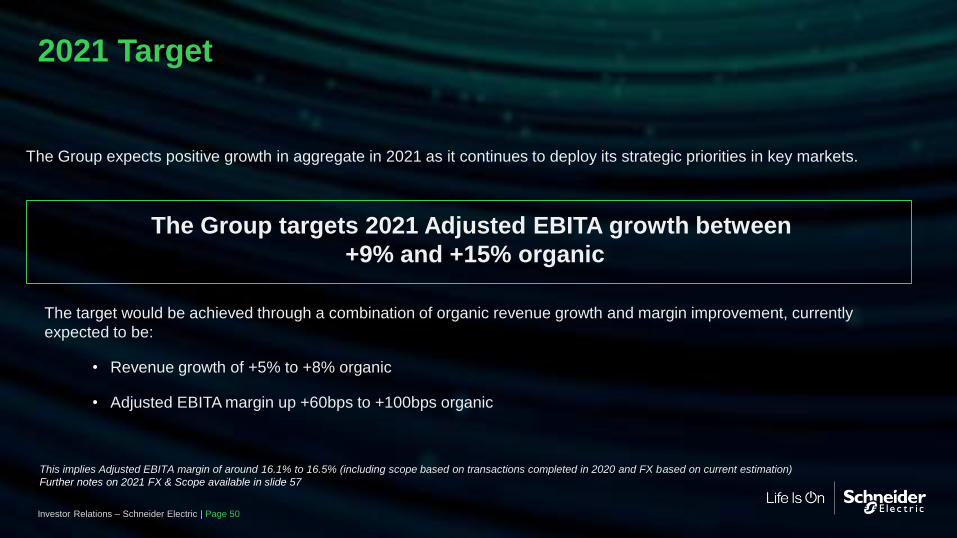
Investor Relations – Schneider Electric | Page 50
The Group expects positive growth in aggregate in 2021 as it continues to deploy its strategic priorities in key markets.
The Group targets 2021 Adjusted EBITA growth between
+9% and +15% organic
The target would be achieved through a combination of organic revenue growth and margin improvement, currently
expected to be:
• Revenue growth of +5% to +8% organic
• Adjusted EBITA margin up +60bps to +100bps organic
This implies Adjusted EBITA margin of around 16.1% to 16.5% (including scope based on transactions completed in 2020 and FX based on current estimation)
Further notes on 2021 FX & Scope available in slide 57
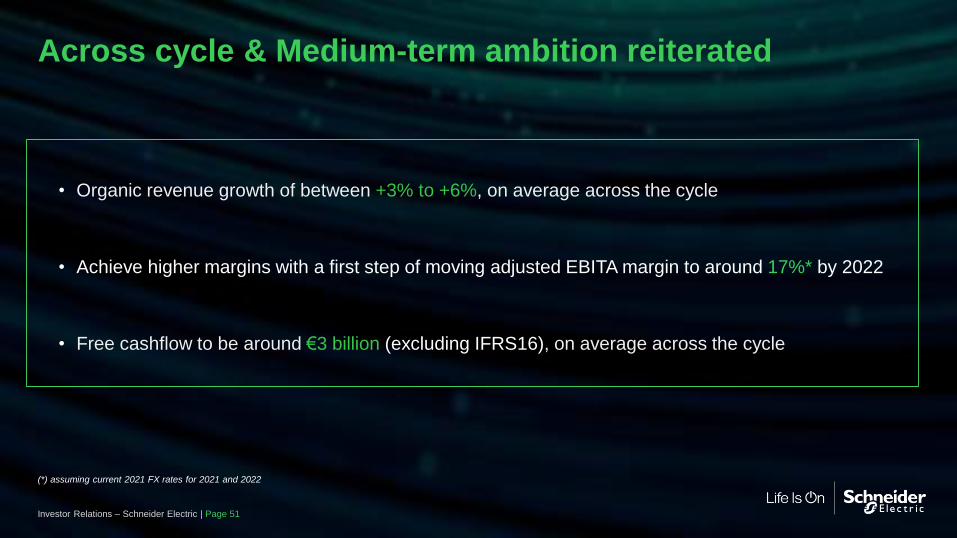
Across cycle & Medium-term ambition reiterated
Investor Relations – Schneider Electric | Page 51
• Organic revenue growth of between +3% to +6%, on average across the cycle
• Achieve higher margins with a first step of moving adjusted EBITA margin to around 17%* by 2022
• Free cashflow to be around €3 billion (excluding IFRS16), on average across the cycle
(*) assuming current 2021 FX rates for 2021 and 2022
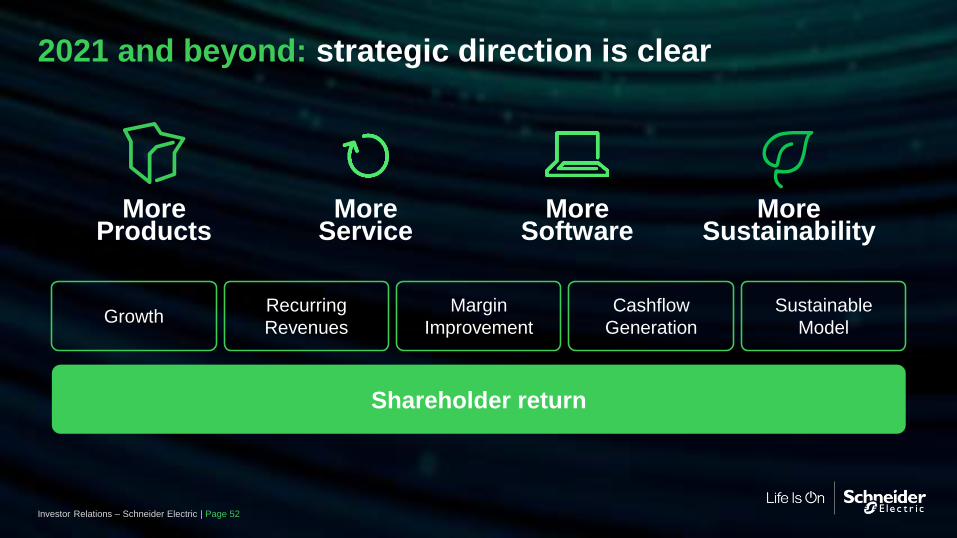
2021 and beyond: strategic direction is clear
MoreSustainability
MoreProducts
MoreSoftware
MoreService
GrowthRecurring
Revenues
Margin
Improvement
Cashflow
Generation
Sustainable
Model
Shareholder return
Investor Relations – Schneider Electric | Page 52

Q&A
Investor Relations – Schneider Electric | Page 53
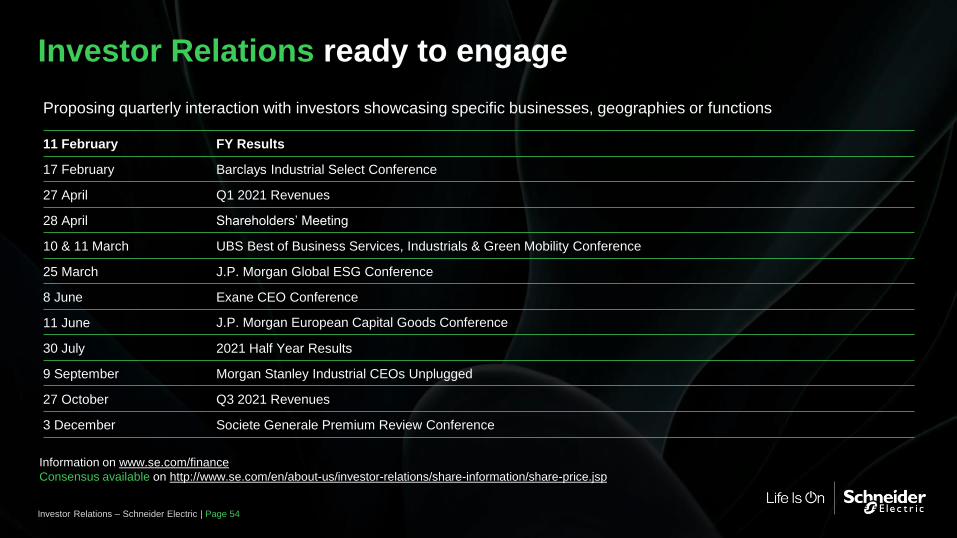
Investor Relations ready to engage
Information on www.se.com/finance
Consensus available on http://www.se.com/en/about-us/investor-relations/share-information/share-price.jsp
Proposing quarterly interaction with investors showcasing specific businesses, geographies or functions
11 February FY Results
17 February Barclays Industrial Select Conference
27 April Q1 2021 Revenues
28 April Shareholders’ Meeting
10 & 11 March UBS Best of Business Services, Industrials & Green Mobility Conference
25 March J.P. Morgan Global ESG Conference
8 June Exane CEO Conference
11 June J.P. Morgan European Capital Goods Conference
30 July 2021 Half Year Results
9 September Morgan Stanley Industrial CEOs Unplugged
27 October Q3 2021 Revenues
3 December Societe Generale Premium Review Conference
Investor Relations – Schneider Electric | Page 54

Investor Relations contacts
Investor Relations – Schneider Electric | Page 55
Graham Phillips – Investor Relations Director, [email protected]
Amit Bhalla – Head of Investor Relations, [email protected]
Alban de Beaulaincourt – Investor Relations Director, [email protected]

Appendix
Investor Relations – Schneider Electric | Page 56
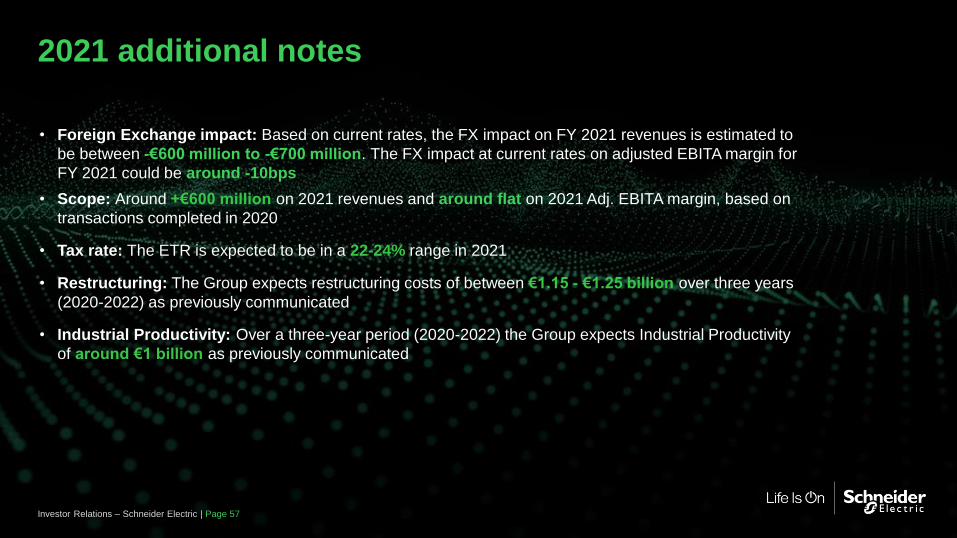
2021 additional notes
• Foreign Exchange impact: Based on current rates, the FX impact on FY 2021 revenues is estimated to
be between -€600 million to -€700 million. The FX impact at current rates on adjusted EBITA margin for
FY 2021 could be around -10bps
• Scope: Around +€600 million on 2021 revenues and around flat on 2021 Adj. EBITA margin, based on
transactions completed in 2020
• Tax rate: The ETR is expected to be in a 22-24% range in 2021
• Restructuring: The Group expects restructuring costs of between €1.15 - €1.25 billion over three years
(2020-2022) as previously communicated
• Industrial Productivity: Over a three-year period (2020-2022) the Group expects Industrial Productivity
of around €1 billion as previously communicated
Investor Relations – Schneider Electric | Page 57
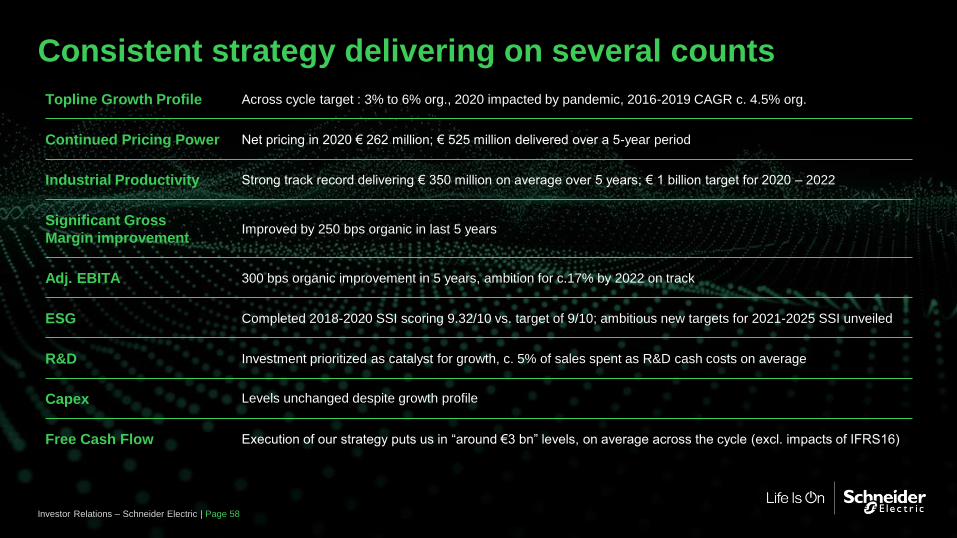
Consistent strategy delivering on several counts
Continued Pricing Power
ESG
Industrial Productivity
Adj. EBITA
R&D
Significant Gross
Margin improvement
Topline Growth Profile
Capex
Free Cash Flow
Net pricing in 2020 € 262 million; € 525 million delivered over a 5-year period
Completed 2018-2020 SSI scoring 9.32/10 vs. target of 9/10; ambitious new targets for 2021-2025 SSI unveiled
Strong track record delivering € 350 million on average over 5 years; € 1 billion target for 2020 – 2022
300 bps organic improvement in 5 years, ambition for c.17% by 2022 on track
Investment prioritized as catalyst for growth, c. 5% of sales spent as R&D cash costs on average
Improved by 250 bps organic in last 5 years
Across cycle target : 3% to 6% org., 2020 impacted by pandemic, 2016-2019 CAGR c. 4.5% org.
Levels unchanged despite growth profile
Execution of our strategy puts us in “around €3 bn” levels, on average across the cycle (excl. impacts of IFRS16)
Investor Relations – Schneider Electric | Page 58
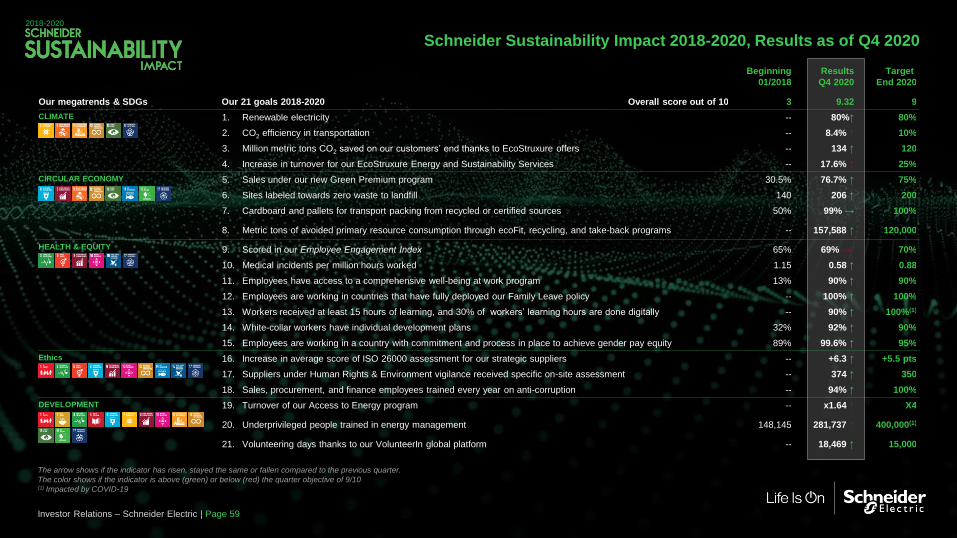
Schneider Sustainability Impact 2018-2020, Results as of Q4 2020
2018-2020
Beginning
01/2018
Results
Q4 2020
Target
End 2020
Overall score out of 10 3 9.32 9
1. Renewable electricity -- 80%↑ 80%
2. CO2 efficiency in transportation -- 8.4% ↑ 10%
3. Million metric tons CO2 saved on our customers’ end thanks to EcoStruxure offers -- 134 ↑ 120
4. Increase in turnover for our EcoStruxure Energy and Sustainability Services -- 17.6% ↑ 25%
5. Sales under our new Green Premium program 30.5% 76.7% ↑ 75%
6. Sites labeled towards zero waste to landfill 140 206 ↑ 200
7. Cardboard and pallets for transport packing from recycled or certified sources 50% 99% → 100%
8. Metric tons of avoided primary resource consumption through ecoFit, recycling, and take-back programs -- 157,588 ↑ 120,000
9. Scored in our Employee Engagement Index 65% 69% → 70%
10. Medical incidents per million hours worked 1.15 0.58 ↑ 0.88
11. Employees have access to a comprehensive well-being at work program 13% 90% ↑ 90%
12. Employees are working in countries that have fully deployed our Family Leave policy -- 100% ↑ 100%
13. Workers received at least 15 hours of learning, and 30% of workers’ learning hours are done digitally -- 90% ↑ 100%(1)
14. White-collar workers have individual development plans 32% 92% ↑ 90%
15. Employees are working in a country with commitment and process in place to achieve gender pay equity 89% 99.6% ↑ 95%
16. Increase in average score of ISO 26000 assessment for our strategic suppliers -- +6.3 ↑ +5.5 pts
17. Suppliers under Human Rights & Environment vigilance received specific on-site assessment -- 374 ↑ 350
18. Sales, procurement, and finance employees trained every year on anti-corruption -- 94% ↑ 100%
19. Turnover of our Access to Energy program -- x1.64 ↑ X4
20. Underprivileged people trained in energy management 148,145 281,737 ↑ 400,000(1)
21. Volunteering days thanks to our VolunteerIn global platform -- 18,469 ↑ 15,000
The arrow shows if the indicator has risen, stayed the same or fallen compared to the previous quarter.
The color shows if the indicator is above (green) or below (red) the quarter objective of 9/10(1) Impacted by COVID-19
Our 21 goals 2018-2020Our megatrends & SDGs
CLIMATE
CIRCULAR ECONOMY
HEALTH & EQUITY
Ethics
DEVELOPMENT
Investor Relations – Schneider Electric | Page 59
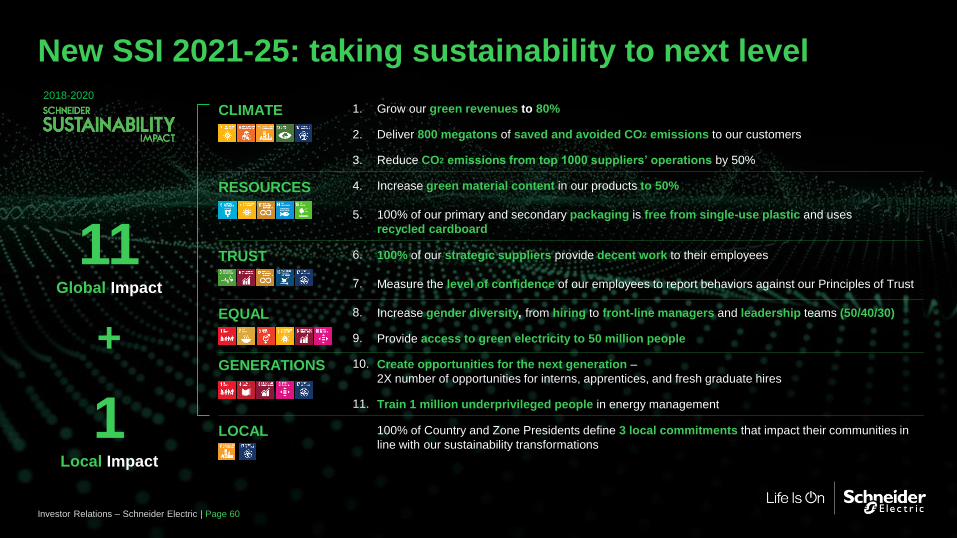
New SSI 2021-25: taking sustainability to next level
CLIMATE 1. Grow our green revenues to 80%
2. Deliver 800 megatons of saved and avoided CO2 emissions to our customers
3. Reduce CO2 emissions from top 1000 suppliers’ operations by 50%
RESOURCES 4. Increase green material content in our products to 50%
5. 100% of our primary and secondary packaging is free from single-use plastic and uses
recycled cardboard
TRUST 6. 100% of our strategic suppliers provide decent work to their employees
7. Measure the level of confidence of our employees to report behaviors against our Principles of Trust
EQUAL 8. Increase gender diversity, from hiring to front-line managers and leadership teams (50/40/30)
9. Provide access to green electricity to 50 million people
GENERATIONS 10. Create opportunities for the next generation –
2X number of opportunities for interns, apprentices, and fresh graduate hires
11. Train 1 million underprivileged people in energy management
LOCAL 100% of Country and Zone Presidents define 3 local commitments that impact their communities in
line with our sustainability transformations
2018-2020
11Global Impact
1Local Impact
+
Investor Relations – Schneider Electric | Page 60
Investor Relations – Schneider Electric | Page 61
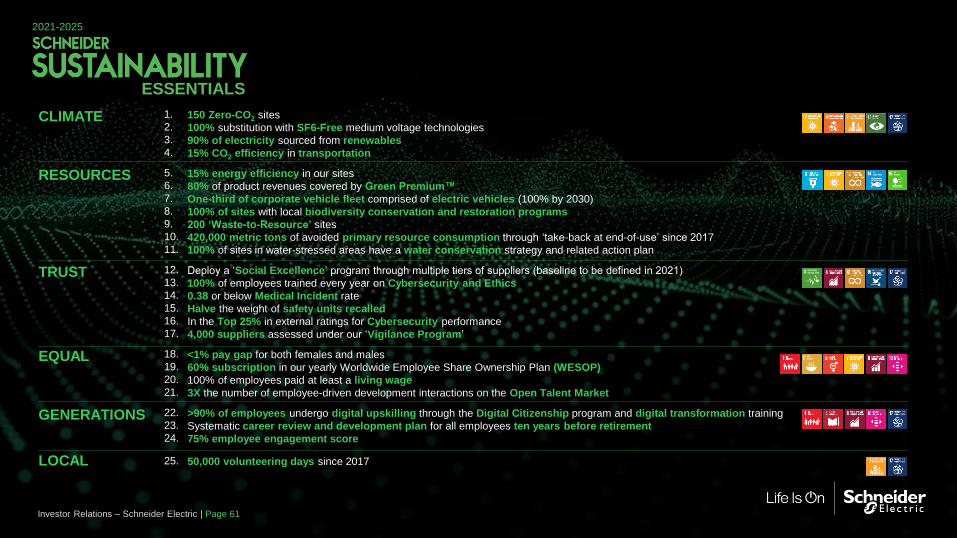
2021-2025
ESSENTIALS
CLIMATE 1.
2.
3.
4.
150 Zero-CO2 sites
100% substitution with SF6-Free medium voltage technologies
90% of electricity sourced from renewables
15% CO2 efficiency in transportation
RESOURCES 5.
6.
7.
8.
9.
10.
11.
15% energy efficiency in our sites
80% of product revenues covered by Green Premium™
One-third of corporate vehicle fleet comprised of electric vehicles (100% by 2030)
100% of sites with local biodiversity conservation and restoration programs
200 ‘Waste-to-Resource’ sites
420,000 metric tons of avoided primary resource consumption through ‘take-back at end-of-use’ since 2017
100% of sites in water-stressed areas have a water conservation strategy and related action plan
TRUST 12.
13.
14.
15.
16.
17.
Deploy a ‘Social Excellence’ program through multiple tiers of suppliers (baseline to be defined in 2021)
100% of employees trained every year on Cybersecurity and Ethics
0.38 or below Medical Incident rate
Halve the weight of safety units recalled
In the Top 25% in external ratings for Cybersecurity performance
4,000 suppliers assessed under our ‘Vigilance Program’
EQUAL 18.
19.
20.
21.
<1% pay gap for both females and males
60% subscription in our yearly Worldwide Employee Share Ownership Plan (WESOP)
100% of employees paid at least a living wage
3X the number of employee-driven development interactions on the Open Talent Market
GENERATIONS 22.
23.
24.
>90% of employees undergo digital upskilling through the Digital Citizenship program and digital transformation training
Systematic career review and development plan for all employees ten years before retirement
75% employee engagement score
LOCAL 25. 50,000 volunteering days since 2017
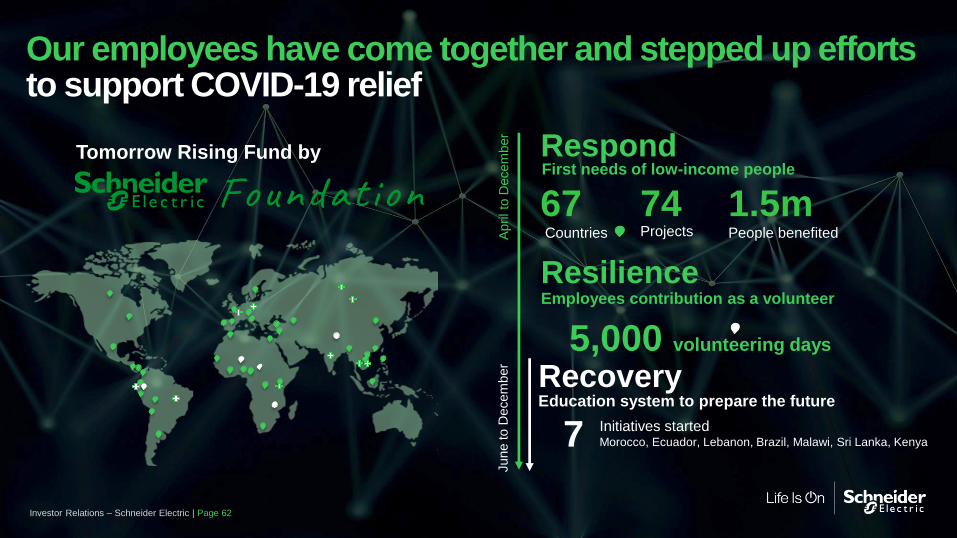
Respond
Countries
67Projects
74People benefited
1.5m
Recovery
Resilience
April to
Decem
ber
Education system to prepare the future
June to D
ecem
ber
First needs of low-income people
7
Employees contribution as a volunteer
5,000 volunteering days
Initiatives started Morocco, Ecuador, Lebanon, Brazil, Malawi, Sri Lanka, Kenya
Tomorrow Rising Fund by
Investor Relations – Schneider Electric | Page 62
Our employees have come together and stepped up efforts to support COVID-19 relief
Investor Relations – Schneider Electric | Page 63
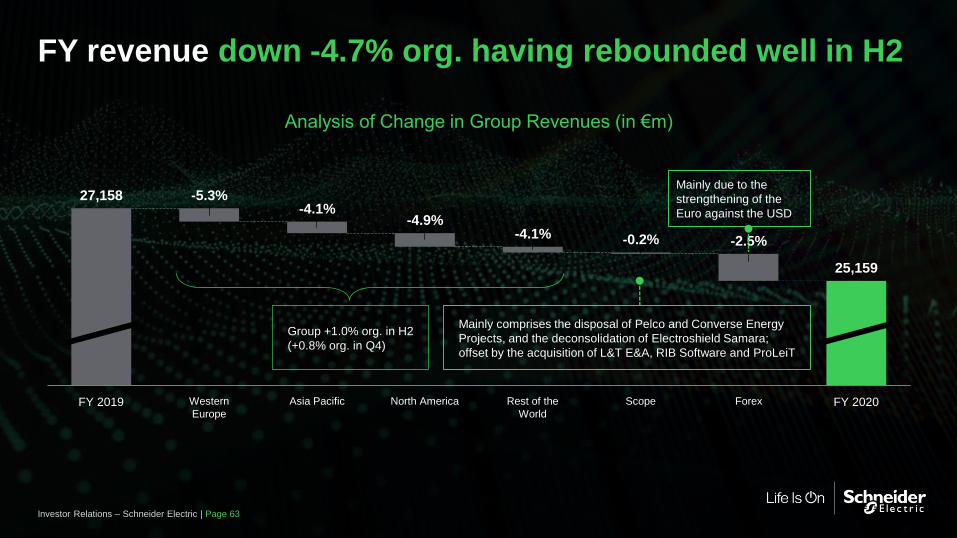
FY revenue down -4.7% org. having rebounded well in H2
Analysis of Change in Group Revenues (in €m)
Asia Pacific
-5.3%
-4.1%
North America Rest of the
World
Scope
-2.5%
Forex FY 2020
27,158-4.1%
Western
Europe
-0.2%
FY 2019
25,159
-4.9%
Mainly comprises the disposal of Pelco and Converse Energy
Projects, and the deconsolidation of Electroshield Samara;
offset by the acquisition of L&T E&A, RIB Software and ProLeiT
Mainly due to the
strengthening of the
Euro against the USD
Group +1.0% org. in H2
(+0.8% org. in Q4)
Investor Relations – Schneider Electric | Page 64
Organic growth by region Q4 2020: Energy Management +1.2%
NORTH AMERICA WESTERN EUROPE
REST OF WORLD
+3%29%
+1%16%
+1%26%
Org. growth% EM revenues
United States Canada Mexico
Russia South America Middle East Africa
France Germany United Kingdom Spain Italy
ASIA PACIFIC
+0%29%
China India Australia Indonesia
Nordics
Thailand
Investor Relations – Schneider Electric | Page 65
Organic growth by region Q4 2020: Industrial Automation -0.8%
NORTH AMERICA
ASIA PACIFIC
WESTERN EUROPE
REST OF WORLD
-12%18%
-7%16%
+3%33%
Russia South America Middle East Africa
France Germany United Kingdom Spain Italy
+6%33%
China India Australia S. Korea Japan
United States Canada Mexico Nordics
Org. growth% IA revenues
Investor Relations – Schneider Electric | Page 66
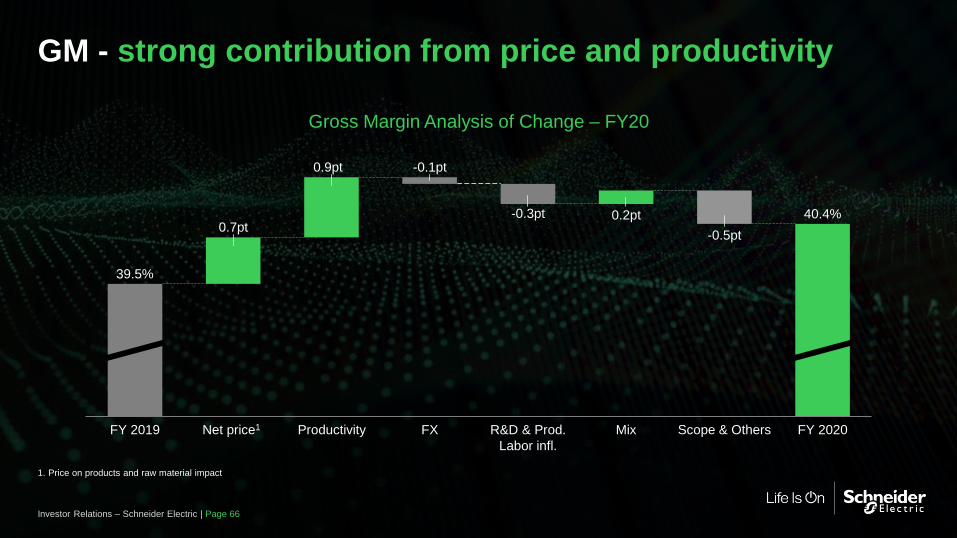
GM - strong contribution from price and productivity
Gross Margin Analysis of Change – FY20
39.5%
FY 2019 Scope & Others
-0.5pt0.7pt
Net price1
0.9pt
Productivity
-0.1pt
FX
-0.3pt
MixR&D & Prod.
Labor infl.
0.2pt
FY 2020
40.4%
1. Price on products and raw material impact
Adjusted Net Income calculation
Investor Relations – Schneider Electric | Page 67
In €m FY2019 FY2020
Adjusted EBITA 4,238 3,926
Amortization of purchase accounting intangibles (173) (207)
Financial Costs (261) (278)
Income tax with impact from adjusted items (836) (781)
Discontinued ops (3) -
Equity investment & Minority Interests (32) (46)
Adjusted Net Income (Group share) 2,933 2,614
Adjusted EPS (€) 5.32 4.72

Record Free cash flow at €3.7 billion
Free cash-flow evolution (€m)
FY20 FCF €3.7bn with strong
contribution from working capital typical
of low growth environment
Resulting in 159% conversion** of Net
Income to FCF
20172015 202020192016 2018 2021
Also benefitted by certain timing impacts
specific to COVID-19 situation in the year
FCF expected to be around €3bn
(excluding IFRS16), on average across
the cycle
€3bn
2,0452,206 2,253
2,102
3,4763,673
* 2015-2018 not restated for impacts of IFRS16 which added €283m to Free cash flow in 2020 and €274m in 2019
** Conversion of FCF / Net Income without impacts of IFRS 16
Investor Relations – Schneider Electric | Page 68
€274m
IFRS 16€283m
IFRS 16
€3,202m €3,390m
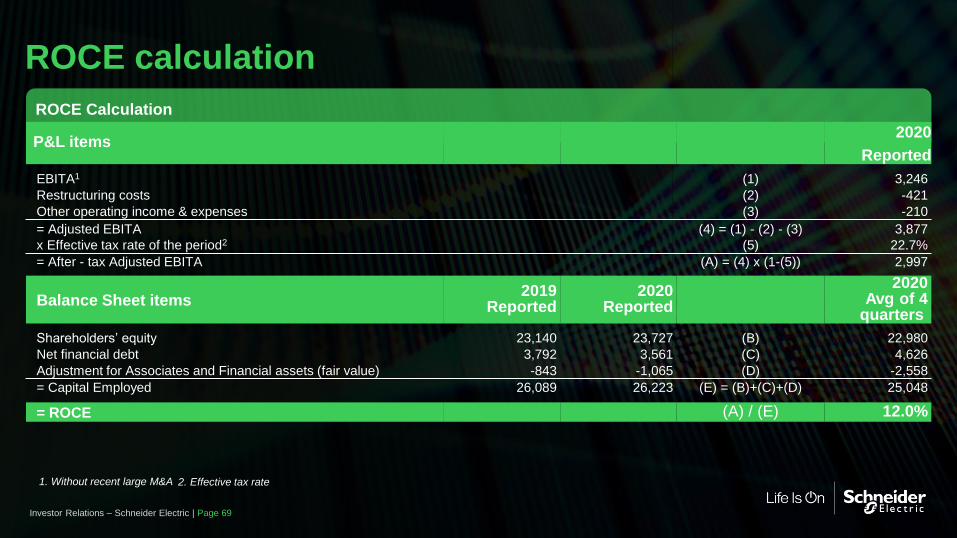
ROCE Calculation
P&L items2020
Reported
EBITA1 (1) 3,246
Restructuring costs (2) -421
Other operating income & expenses (3) -210
= Adjusted EBITA (4) = (1) - (2) - (3) 3,877
x Effective tax rate of the period2 (5) 22.7%
= After - tax Adjusted EBITA (A) = (4) x (1-(5)) 2,997
Balance Sheet items2019
Reported2020
Reported
2020 Avg of 4
quarters
Shareholders’ equity 23,140 23,727 (B) 22,980
Net financial debt 3,792 3,561 (C) 4,626
Adjustment for Associates and Financial assets (fair value) -843 -1,065 (D) -2,558
= Capital Employed 26,089 26,223 (E) = (B)+(C)+(D) 25,048
= ROCE (A) / (E) 12.0%
1. Without recent large M&A
ROCE calculation
2. Effective tax rate
Investor Relations – Schneider Electric | Page 69