Embed Size (px)
Citation preview
A simple flow cytometric method to assess lipid accumulation in
fat cells
Ying-Hue Lee1*, Su-Yin Chen1, Rudolf J. Wiesner2 and Yi-Fong Huang1
1Laboratory of Molecular Pathology, Institute of Molecular Biology,
Academia Sinica, Taipei 115, Taiwan, and 2Institute of Vegetative
Physiology, University of Cologne, Germany.
*Corresponding author: Institute of Molecular Biology
Academia Sinica
Nangang
Taipei 115
Taiwan
Tel/Fax: +886-2-2651-7983
Email: [email protected]
by guest, on Decem
ber 11, 2018w
ww
.jlr.orgD
ownloaded from
1
ABSTRACT
Adipogenesis of pre-adipocytes in culture has been frequently used to study the
molecular basis and effect of drugs on fat cell conversion. However, after adipogenic
induction, cells respond to the inducing agent with various speeds of conversion and fat
accumulation, which complicates direct molecular and biochemical analyses. Here we
present a simple and sensitive method to detect and quantify fat accumulation inside cells
by flow cytometry. Using this method, we detected elevated levels of cytoplasmic
granularity that correlated well with an increased level of fat accumulated inside cells
after adipogenic conversion. We further demonstrated the ability of this method to
monitor and quantify fat cell maturation within a complex population of cells and to
identify and collect the fat cells with similar fat storage for further analyses. Flow
cytometry offers distinct advantages over existing detection systems for cytoplasmic lipid
staining and lipid extraction and could represent a powerful analytical tool to monitor the
effect of chemicals and biological molecules on fat cell conversion and maturation.
Moreover, in combination with a cell sorting facility, our method offers a simple and
efficient means of collecting fat cells of specific status for further analyses.
Supplementary key words: Flow cytometry, Adipogenesis, Fat accumulation, Cytoplasmic
granularity, Adipocyte
by guest, on Decem
ber 11, 2018w
ww
.jlr.orgD
ownloaded from
2
INTRODUCTION
The prevalence of obesity and obesity-related disorders, such as diabetes and
arthritis, has promoted much research in recent years into the prevention and treatment of
obesity (1-3). Understanding the molecular mechanism underlying fat cell development
has been one of the major focuses of many researchers in the field. Methods in use for the
assessment of fat cell development and maturation after initiation of adipogenesis in cell
culture include microscopic examination of cellular lipid droplet formation and cellular
lipid staining by Oil-Red O (4). These methods, although excellent in detecting the
presence of intracellular fat, are ineffective in objectively quantifying the degree of fat
accumulation if not used in conjunction with other extraction and analytic systems.
Particularly, during the process of adipogenesis of pre-adipocytes, it is observable that
cells are heterogeneous in their response to adipogenic agents, in terms of speed of
adipogenic conversion and degree of fat accumulation (5). This heterogeneity of response
may cause difficulties when evaluating and comparing the effects of several treatments
that target only fat cells of certain status, due to the masking influence of those non-
targeted cells. Thus, an effective method to detect and classify cells with similar fat
content will certainly increase analytical precision in monitoring fat cell development and
the ability to quantify the effects of therapeutic agents. Currently, flow cytometry and
FACS are extensively used in the analysis of hematological cells (6,7); we have explored
the feasibility of using these methods to assess fat content during fat cell development and
to group fat cells with similar fat content for more precise biochemical and molecular
analyses.
by guest, on Decem
ber 11, 2018w
ww
.jlr.orgD
ownloaded from
3
METHODS
3T3-L1 cell culture and adipogenesis
3T3-L1 pre-adipocytes were obtained from ATCC (CL173, ATCC) and
maintained in culture according to the ATCC protocol. Adipogenesis was induced by
adding insulin, 3-isobutyl-1-methyl-xanthine (IBMX) and dexamethasone to 2-day post-
confluence cells (designated Day 0) at final concentrations of 10µg/ml, 0.5 mM and 1
µM, respectively, for 2 days (8). Cells were then maintained in culture media containing
5µg/ml of insulin until needed.
Flow cytometry
Adipogenically induced 3T3-L1 cells were analyzed and sorted in flow
cytofluorometers (FACS calibur and FACS starplus, Becton Dickinson) using FACS
(Fluorescence-Activated Cell Sorter) technology. Cells were briefly rinsed twice with
pre-warmed 0.25% trypsin-EDTA and then incubated for 5 min at 37oC. Cell were then
gently resuspended in PBS, washed twice with PBS, re-suspended in cold PBS and kept
on ice prior to flow cytometric analysis. For cell sorting, the sorted cells were collected
directly into the culture medium and returned to the CO2 incubator immediately after
sorting. The cytofluorometer settings for both side (SSC) and forward (FSC) scatters to
analyze fat cells were dependent on the analytic sensitivity of the machine. In general,
the voltages and compensation between scatters were set to the degree so that the
majority of control cells (Adipo 0D, non-induced) were, as shown in Fig. 1B, located
below the scale of 200 for the SSC and between the scales of 200 and 800 for the FSC.
RNA extraction and Northern blot analysis.
by guest, on Decem
ber 11, 2018w
ww
.jlr.orgD
ownloaded from
4
Cells were homogenized in TRIzol RNA reagent (GIBCO-BRL), and total RNA
was isolated according to the manufacturer’s protocol. Total RNA (5 µg) was denatured,
electrophoresed, transferred to a nylon membrane, and probed with 32P-labeled perilipin
cDNA probe using standard protocols.
Oxygen consumption.
Immediately prior to measurement, cells were harvested by trypsinization, washed
twice in PBS and re-suspended in 0.2 ml PBS. Cells were then added to an Oxytherm
oxygen electrode (HansaTech, UK) previously equilibrated and stabilized with air in a
0.5 ml oxygen buffer at 37 oC. Oxygen consumption was monitored for 10 min and
calculated according to the manufacturer’s instruction. The electrode buffer contained
0.3M mannitol, 10mM KCl, 5 mM MgCl2, 10 mM KH2PO4 and 1 mg/ml BSA (pH 7.4).
Additional protocols.
Mouse pre-adipocytes were isolated from male epidedylmal fat pads and cultured
accordingly (9). Adipogenesis induction for the isolated pre-adipoctes was similar to that
for 3T3-L1 cells. In addition, BRL49653C (Rosiglitazone, Smithkline Beecham , UK)
was included in the induction media. To measure cellular lipid, cells were briefly
homogenized in PBS using a Teflon homogenizer. After removal of cell debris, lipid
levels were measured using a Triglyceride detection kit (Infinity, Sigma). For
cytoplasmic lipid staining, cells were fixed in 70% isopropanol and stained in 0.2% Oil-
Red O (4). Recombinant adenovirus carrying the GPF marker gene and a gene of interest
was generated using the AdEasy vector system (Q-BIOgene).
by guest, on Decem
ber 11, 2018w
ww
.jlr.orgD
ownloaded from
5
RESULTS AND DISCUSSION
3T3-L1 cells, grown to 2-day post-confluence in culture (designated Day 0,
shown as Adipo 0D in Fig 1) were hormonally induced for adipogenesis (8), then
dissociated and analyzed in a flow cytometer at 0, 2, 4, 6, 8 and 10 days post-induction
(Fig. 1A to 1B). The dot plot of cytometric FSC (shown as the X-axis in Fig. 1B and Fig.
2A) and SSC (shown as the Y-axis) scatters, reflecting the cell diameter and granular
structures within the cell, respectively, showed that after adipogenic induction the cells
had become increasingly heterogeneous in their cellular granularity (Fig. 1B). After
adipogenic induction, the cells containing greater granular structure were markedly
increased, and this increase in granularity positively correlated with the time of the post-
adipogenic induction (Fig. 1B to 1C). In general, the longer the period of induction, the
greater the quantity of lipid a fat cell in culture can accumulate. Thus, to determine
whether increasing the fat stored within a cell would result in the greater granularity seen
in side scatter, eight days post-induction cells were gated for four regions as shown in
Fig. 2A based on the full scale of SSC. The R1 region contains cells with a level of
granularity similar to that seen in the control cells (non-induced), whereas R2 to R4
regions contain cells with increasing granularity. Cells in the gated regions were sorted
and collected for further microscopic examination (Fig. 2B) and lipid content analysis
(Fig. 2C). Indeed, both microscopic and lipid analyses of the sorted fat cells revealed
that the granularity detected in the SSC correlated well with levels of fat storage within
cells (Fig. 2B and 2C); the cells collected from the R4 region had the greatest
intracellular granularity with the biggest lipid droplets and highest lipid content, whilst
cells that exhibited lower granularity (R2, R3) contained fewer and smaller lipid droplets
by guest, on Decem
ber 11, 2018w
ww
.jlr.orgD
ownloaded from
6
and a lower lipid content (Fig. 2B). After sorting, cells collected from all regions were
analyzed for their ability to re-attach to the surface of culture dished under culturing
conditions (Fig. 2D). It was found that the degree of re-attachment was negatively
correlated with the increased cellular granularity; more than 95% of the cells from the R1
region could re-attach, whilst less than 10% of cells from the R4 region could re-attach.
Cells in the R1 region appeared to be not induced and could proliferate, whilst cells from
other regions continued to accumulate fat as indicated by the growth of their cellular lipid
pool (Fig. 2D). Nevertheless, our results indicate that the granularity of fat cells, as
detected by flow cytometry, is an excellent indicator for cellular fat stored, and thus that
the granularity of a fat cell can be easily distinguished via flow cytometric side-scatter.
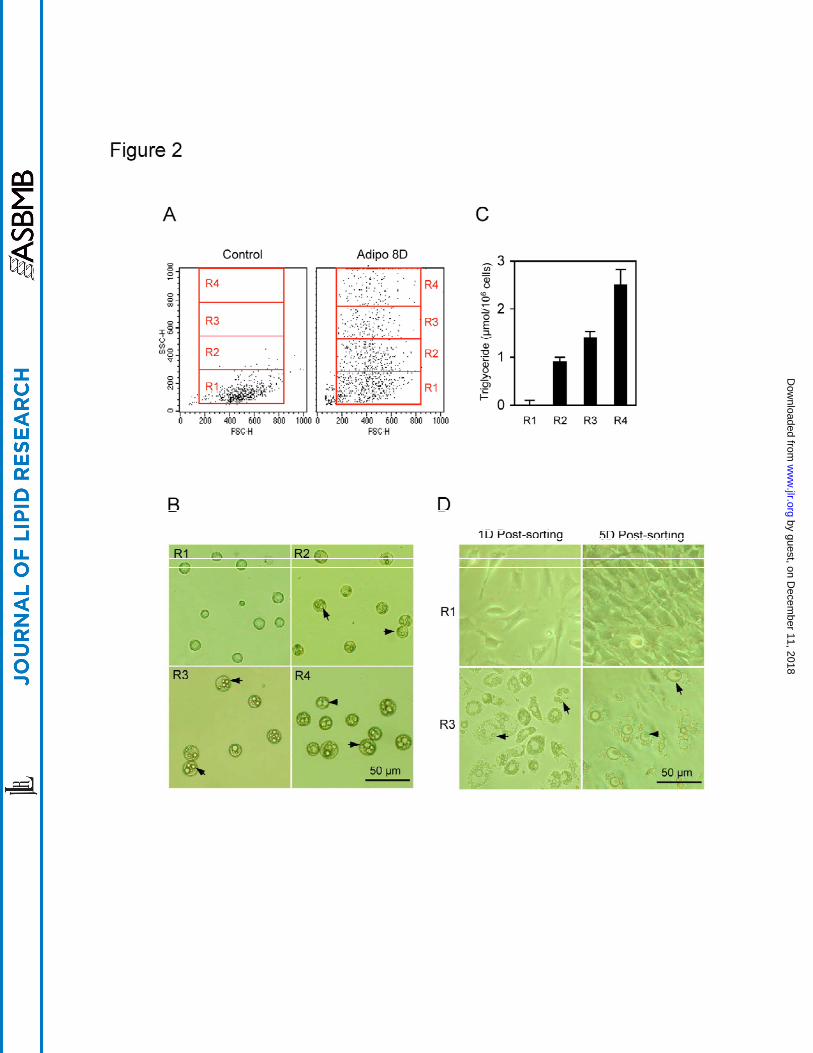
Quantification of distinct cell populations is one of the integral functions of flow
cytometry. Thus, we next used flow cytometry to monitor and quantify 3T3-L1 cells
based on their degree of fat accumulation at various stages of adipogenesis. Figure 3A
summarizes and compares the R1, R2, R3 and R4 cell populations of 3T3-L1 cells at
various stages of adipogenesis. Changes in cell distribution from low to higher
granularity during the 10-day period of adipogenesis were clearly profiled by flow
cytometry (Fig. 3A, upper panel). In comparison, cells at various stages of adipogenesis
were also stained with Oil-Red O, which has been routinely used to monitor
adipogenesis. Although the Oil-Red O staining clearly indicated the presence of lipid
droplets within cells, by itself it did not provide any quantitive information regarding the
lipid levels nor the heterogeneity of fat accumulation among cells, unlike flow cytometry
(Fig. 3A, lower panel). Accordingly, we hypothesized that flow cytometry might be also
more sensitive in detecting fat content when used to evaluate and compare the effect of
by guest, on Decem
ber 11, 2018w
ww
.jlr.orgD
ownloaded from
7
different factors on fat accumulation in fat cells. To examine this possibility, we isolated
pre-adipocytes from mouse epidedymal fat pads and maintained them in culture for
adipogenic conversion. To induce these cells to become fat cells, a PPAR ligand, BRL
49653 (10), was needed in addition to the insulin, IBMX and dexamethasone cocktail that
were adequate to adipogenically induce 3T3-L1 cells. Thus, these isolated pre-
adipocytes are ideal for used in evaluating the efect of PPAR ligands on adipogenic
conversion. To evaluate the dosage effect of BRL 49653 on adipogenic conversion,
isolated pre-adipocytes were cultured to confluency and induced for adipogenesis using
the same system as used for 3T3-L1 cells, except that BRL 49653C was included in the
inducing media. Eight days after induction, cells were analyzed for their granularity
using flow cytometry (Fig. 3B). At concentrations of 0.5µM and higher, BRL 49653C
significantly increased the cell populations in the R2 to R4 regions where cells contain
greater granularity, suggesting that more cells were adipogenically induced to store fat.
Although at the concentration of 5 µM, BRL 49653 did not further enhance the total level
of adipogenesis (R2 to R4), the population of cells containing greater granularity (R4)
increased relative to the cell populations from the R2 and R3 regions (Fig. 3B).
As demonstrated above, despite under the same culturing condition, cells
underwent adipogenesis at varying rates reflected by the degree of their fat accumulation.
We were thus interested to see whether these fat cells with various degrees of fat storage
differed in other physiological parameters associated or influenced by their cellular fat
content. To test this, we analyzed and compared the expression levels of perilipin , a
lipid droplet-specific protein that coats the surfaces of lipid droplets of adipocytes (11),
and the oxygen consumption of fat cells with different levels of fat storage (the R2 to R4
by guest, on Decem
ber 11, 2018w
ww
.jlr.orgD
ownloaded from
8
regions). 3T3-L1 cells, eight days after adipogenic induction, were sorted and collected
based on their granularity, similar to those cells shown in Figure 2A. The collected cells
were monitored for their perilipin mRNA levels and their oxygen consuming (Fig. 3C to
3D). We found that cells in the R1 region did not express perilipin mRNA and consumed
the least oxygen relative to the cells having higher granularity (R2 to R4). In addition,
levels of perilipin mRNA in cells from the R2 and R3 regions were found to be higher
than in cells from the R4 region. Similarly, cells from the R2 and R3 regions consumed
significantly more oxygen than those from the R4 region, indicating that fat cells with
less fat stored are more active in oxidation when compared to those with higher fat
storage.
Lastly, to precisely analyze the effect of a treatment, such as over-expression of a
gene in fat cells, we used flow cytofluorometer to identify and collect fat cells that were
carrying similar fat stores and were subjected to treatments for further analysis. Here, we
used recombinant adenoviral vector to deliver the GFP marker gene and the G alpha
inhibitory subunit 2 (G i2) expression cassette into fat cells. 3T3-L1 cells, four days after
adipogenic induction, were infected with the recombinant adenoviral vector Ad.Track
carrying the GFP marker gene under the control of a CMV promoter (12) or the
recombinant adenoviral vector carrying G i2 in addition to the GFP marker gene.
Despite the use of the highly efficient adenoviral gene delivery system and a viral dosage
of over 5 MOI, only a small number of fat-laden cells were found to express the GFP
marker gene after 3 days of infection. To specifically select those fat cells that had
similar fat content, we again used flow cytometric side scatter in combination with
fluorescence detection. As shown in Fig. 3E, a group of GFP positive fat cells with
by guest, on Decem
ber 11, 2018w
ww
.jlr.orgD
ownloaded from
9
similar fat content were effectively sorted and collected for further analysis to determine
the effects of G i2 on the lipolytic activity of fat cells stimulated by the adrenergic
receptor agonist, isoproterenol. The inhibitory effective of G i2 on the isoproterenol-
stimulated lipid release was not detected when the condition medium from the whole
population of cells was analyzed (Fig. 3F). This could be due to the low infection rate of
the adenoviral vector and/or the heterogeneous population of cells that contained close to
40% of cells failed to be adipogenically induced (Fig. 3A). However, a significant
inhibitory effect of G i2 on the isoproterenol-stimulated lipid release was measured in the
condition medium from the GFP-positive cells collected from the R3 region (Fig. 3F).
This result further indicates the necessity to utilized an analytical system capable of
monitoring, quantifying and selecting fat cells with different degrees of adipogenic
conversion before an objective comparison among treatments can be made.
In conclusion, this study demonstrates the feasibility of directly measuring the fat
content of specific cells in a complex population of fat cells using flow cytometry. Not
only is the system simple, sensitive and quantitative, but it also offers the advantage over
existing methodology of being capable of monitoring the degree of intracellular fat
accumulation in a precise, fast and selective manner. These results provide a basis for
developing a variety of applications that including diagnostic and drug screening
procedures to monitor fat cell development.
by guest, on Decem
ber 11, 2018w
ww
.jlr.orgD
ownloaded from

10
ACKNOWLEDGMENTS
This work was supported in part by the grant NSC-91-2311-B-001-122 from the
National Science Council and a fellowship (to YHL) from Alexander von Humboldt
Foundation.
by guest, on Decem
ber 11, 2018w
ww
.jlr.orgD
ownloaded from
11
REFERECES
1. Kopelman, P.G. (2000) Obesity as a medical problem. Nature 404, 635-643.
2. Barsh, G.S., Farooqi, I.S., and O'Rahilly, S. (2000) Genetics of body-weight
regulation. Nature 404, 644-51.
3. Valet, P., Tavernier, G., Castan-Laurell, I., Saulnier-Blache, J.S., and Langin, D.
(2002) Understanding adipose tissue development from transgenic animal models. J
Lipid Res. 43, 835-860.
4. von Goor, H., Gerrits, P.O. and Groud, J. (1986) The application of lipid-soluble
stains in plastic-embedded sections. Histochemistry 85, 251-253.
5. Shigematsu, S., Miller, S.L., and Pessin, JE. (2001) Differentiated 3T3L1 adipocytes
are composed of heterogenous cell population with distinct receptor tyrosin kinase
signaling properties. J. Biol. Chem. 276, 15292-15297.
6. Peerschke, E.I. (2002) The laboratory evaluation of platelet dysfunction. Clin Lab
Med. 22, 405-420.
7. Chianese, R., Brando, B. and Gratama, J.W. (2002) Diagnostic and prognostic value
of flow cytometric immunophenotyping in malignant hematological diseases. J. Biol.
Regul. Homeost. Agents. 16, 259-69.
8. Sadowski, H.B., Wheeler, T.T., and Young, D.A. (1992) Gene expression during
3T3-L1 adipocyte differentiation. J. Biol. Chem. 266, 4722-4731.
9. Zuk, P.A., Zhu, M., Mizuno H., Huang, J., Futrell, W., Katz, A.J., Benhaim, P.,
Lorenz, P., and Hedrick, M.H. (2001) Multilineage cells from Human adipose Tissue:
Implications for cell-based therapies. Tissue Engineering 7, 211-228.
10. Lehmann, J.M., Moore, L.B., Smith-Oliver, T.A., Wilkison, W.O., Willson, T.M.,
by guest, on Decem
ber 11, 2018w
ww
.jlr.orgD
ownloaded from
12
and Kliewer, S.A. (1995) An antidiabetic thiazolidinedione is a high affinity ligand
for peroxisome proliferator-activated receptor gamma (PPAR gamma). J Biol Chem.
270, 12953-12956.
11. Greenberg, A.S., Egan, J.J., Wek, S.A., Garty, N.B.,Blanchette-Mackie, E. J.,
and Londos, C. (1991) Perilipin, a major hormonally regulated adipocyte-
specific phosphoprotein associated with the periphery of lipid storage droplets.
J. Biol. Chem., 266, 11341-11346
12. He, T.C., Zhou, S., da Costa, L.T., Yu, J., Kinzler K.W. and Vogelsterin, B. (1998) A
simplified system for generating recombinant adenoviruses. Proc. Natl. Acad. Sci.
USA. 95, 2509-2514.
by guest, on Decem
ber 11, 2018w
ww
.jlr.orgD
ownloaded from

13
FIGURE LEGENDS
Figure 1. Increased granularity and heterogeneity among 3T3-L1 cells during
adipogenesis (A) Light microscopic examination of 3T3-L1 cells eight days
after adipogenic induction. Arrowhead indicates the lipid droplets
accumulated inside cells. (B) Dot plots of side scatter (SSC, x-axis) vs. forward
scatter (FSC, y-axis) of 3T3-L1 cells generated from flow cytometric analysis
of levels of granularity at different time points of adipogenesis. FSC represents
the cell size, whereas SSC represents cytoplasmic granular intensity. Two-day
post confluent 3T3-L1 cells (designated Day O, shown here as Adipo 0D) were
hormonally induced for adipogenesis. Cells were dissociated and analyzed in
a flow cytometer at 0, 2, 4, 6, 8 and 10 days after induction. (C) The overlay of
cell distribution vs cellular granular intensity from five plots in 1B.
Figure 2. Positive correlation between the cellular lipid content and granularity of 3T3-
L1 cells after adipogenic induction (A) The regions gated for cell sorting.
Scatter plot of 3T3-L1 cells eight days after adipogenic induction were gated
into 4 regions based on their granularity distribution. The R1 region was gated
to include the majority of control cells shown on the SSC scale. Regions R2 to
R4 were gated to include the remaining range of SSC, and each region
contained an equal range of SSC. Cells from these 4 regions were then
collected separately. The x-axis, FSC, represents the cell size, whereas the y-
axis, SSC, represents cytoplasmic granular intensity. (B) Light microscopy of
the cultured 3T3-L1 cells collected from R1 and R3 regions. Arrowheads
by guest, on Decem
ber 11, 2018w
ww
.jlr.orgD
ownloaded from
14
indicate lipid droplets accumulated inside cells. (C) Comparison of the cellular
lipid content of cells collected from each region in 2A. Cells were briefly
homogenized in PBS in a Teflon homogenizer. The cytoplasmic fraction was
collected and assayed for triglyceride levels. The value for each gated group is
the mean of four sortings and is presented as a vertical bar in the figure. The
standard error for each group is shown as a vertical line. (D) Light microscopy
of the sorted 3T3-L1 cells from each region. After sorting, cells were collected
from each region and re-cultured. Cell photographs were taken 1 day (1D) and
5 days (5D) after re-culturing. Arrowheads indicate lipid droplets accumulated
inside cells.
Figure 3. Use of flow cytometry in analyzing fat cell development (A) Quantification of
fat cells during adipogenesis. Two-day post-confluent 3T3-L1 cells
(designated 0D) were induced for adipogenesis and analyzed at different time
points for both cytoplasmic granularity in flow cytometry (upper panel) and
lipid storage via Oil-Red O staining (lower panel). For flow cytometric
analysis, the value of granularity for a gated region at each time point was the
mean of four samples, and the granularity (gated region) values for the same
time point are displayed in a stacked column. (B) Analysis of the dosage effect
of BRL49653C on adipogenesis in isolated mouse pre-adipocytes. Mouse pre-
adipocytes isolated from male epidedymal fat pads were induced for
adipogenesis two days post-confluence. Various concentrations of
BRL49653C, as indicated, were added to the inducing medium. Eight days
after induction, cells were analyzed for their scatter profile using flow
by guest, on Decem
ber 11, 2018w
ww
.jlr.orgD
ownloaded from
15
cytometry. The granularity value for each gated region at each concentration of
BRL49653C was the mean of four samples, and the gated region values at the
same time point are displayed in a stacked column. (C) Comparison of the
levels of perilipin mRNA in cells from each region. Five µg of total RNA
from cells were electrophoresed, blotted onto a nylon membrane and probed
with a 32P-labelled perilipin cDNA probe. (D) Comparison of oxygen
consumption among fat cells gated for levels of fat storage. Four groups of
cells were collected based on their SSC profile with regards to granularity as
those shown in Fig. 2A and re-cultured for at least a further 12-hour in culture
media prior to oxygen consumption measurement. The value for each gated
group is the mean of four sortings and is presented as a vertical bar in the
figure. The standard error for each group is shown as a vertical line. (E)
Identification and collection of GFP-carrying adenovirus targeted fat cells
displaying similar fat accumulation. Two days post-confluent 3T3-L1 cells
were induced for adipogenesis. Four days after induction, recombinant
adenoviruses carrying a GFP marker gene were added to the culture medium at
the dosage of 5 MOI and incubated for 24 hours. Eight days after induction,
cell were dissociated (upper panel) and analyzed in a flow cytometer. The cells
that displayed a scatter profile in the R3 gated region (see Fig. 2A) and emitted
green fluorescence were selected and collected for fluorescence microscopy
(lower panel). (F) Lipolytic effect of isoproterenol on fat cells infected with
adenovirus carrying the GFP marker gene and a gene encoding for G i2.
Similar to the experiment described in 3E, cells were infected with
by guest, on Decem
ber 11, 2018w
ww
.jlr.orgD
ownloaded from
16
recombinant adenovirus carrying the G i2 expression cassette. Fat cells
displaying a SSC profile in the R3 region and emitting green fluorescence were
collected for re-culture. Isoproterenol was added to the culture media one day
after re-culture. One day after the addition of isoproterenol, 100 µl of the
condition media were removed for triglyceride measurement. The value for
each gated group is the mean of four sortings and is presented as a vertical bar
in the figure. The standard error for each group is shown as a vertical line.
by guest, on Decem
ber 11, 2018w
ww
.jlr.orgD
ownloaded from