Embed Size (px)
Citation preview

A Simple Model of Global Cascades on Random NetworksAuthor(s): Duncan J. WattsSource: Proceedings of the National Academy of Sciences of the United States of America,Vol. 99, No. 9 (Apr. 30, 2002), pp. 5766-5771Published by: National Academy of SciencesStable URL: http://www.jstor.org/stable/3058573 .Accessed: 16/03/2011 19:39
Your use of the JSTOR archive indicates your acceptance of JSTOR's Terms and Conditions of Use, available at .http://www.jstor.org/page/info/about/policies/terms.jsp. JSTOR's Terms and Conditions of Use provides, in part, that unlessyou have obtained prior permission, you may not download an entire issue of a journal or multiple copies of articles, and youmay use content in the JSTOR archive only for your personal, non-commercial use.
Please contact the publisher regarding any further use of this work. Publisher contact information may be obtained at .http://www.jstor.org/action/showPublisher?publisherCode=nas. .
Each copy of any part of a JSTOR transmission must contain the same copyright notice that appears on the screen or printedpage of such transmission.
JSTOR is a not-for-profit service that helps scholars, researchers, and students discover, use, and build upon a wide range ofcontent in a trusted digital archive. We use information technology and tools to increase productivity and facilitate new formsof scholarship. For more information about JSTOR, please contact [email protected].
National Academy of Sciences is collaborating with JSTOR to digitize, preserve and extend access toProceedings of the National Academy of Sciences of the United States of America.
http://www.jstor.org
A simple model of global cas random networks Duncan J. Watts*
Department of Sociology, Columbia University New York, NY 10027
Communicated by Murray Gell-Mann, Santa Fe Institute, Santa Fe, NM, February 14
The origin of large but rare cascades that are triggered by small initial an shocks is a phenomenon that manifests itself as diversely as cultural ap fads, collective action, the diffusion of norms and innovations, and cascading failures in infrastructure and organizational networks. This sib paper presents a possible explanation of this phenomenon in terms wi of a sparse, random network of interacting agents whose decisions sai are determined by the actions of their neighbors according to a simple of threshold rule. Two regimes are identified in which the network is ne susceptible to very large cascades-herein called global cascades- Sp that occur very rarely. When cascade propagation is limited by the th; connectivity of the network, a power law distribution of cascade sizes exi is observed, analogous to the cluster size distribution in standard siz percolation theory and avalanches in self-organized criticality. But sh( when the network is highly connected, cascade propagation is limited are instead by the local stability of the nodes themselves, and the size distribution of cascades is bimodal, implying a more extreme kind of M4 instability that is correspondingly harder to anticipate. In the first Th regime, where the distribution of network neighbors is highly ea skewed, it is found that the most connected nodes are far more wh likely than average nodes to trigger cascades, but not in the second of regime. Finally, it is shown that heterogeneity plays an ambiguous oft role in determining a system's stability: increasingly heteroge- inf neous thresholds make the system more vulnerable to global eve cascades; but an increasingly heterogeneous degree distribution me makes it less vulnerable. tio
th(
H ow is it that small initial shocks can cascade to affect or disrupt res large systems that have proven stable with respect to similar aC'
disturbances in the past? Why do some books, movies, and albums tec
emerge out of obscurity, and with small marketing budgets, to th( become popular hits (1), when many a priori indistinguishable of efforts fail to rise above the noise? Why does the stock market SCe exhibit occasional large fluctuations that cannot be traced to the dil arrival of any correspondingly significant piece of information (2)?
act
How do large, grassroots social movements start in the absence of centralized control or public communication (3)? un
These phenomena are all examples of what economists call un information cascades (ref. 4; but which are herein called simply reE cascades), during which individuals in a population exhibit tiv herd-like behavior because they are making decisions based on the actions of other individuals rather than relying on their own ge] information about the problem. Although they are generated by t quite different mechanisms, cascades in social and economic co]
systems (3-6) are similar to cascading failures in physical infra- P? structure networks (7, 8) and complex organizations (9) in that co]
initial failures increase the likelihood of subsequent failures, on of
leading to eventual outcomes that, like the August 10, 1996 cascading failure in the western United States power transmis- ap ual sion grid (8), are extremely difficult to predict, even when the in properties of the individual components are well understood. Not as newsworthy, but just as important as the cascades reI themselves, is that the very same systems routinely display great len stability in the presence of continual small failures and shocks that are at least as large as the shocks that ultimately generate a cascade. Cascades can therefore be regarded as a specific manifestation of the robust yet fragile nature of many complex systems (10): a system may appear stable for long periods of time *E-r
5766-5771 | PNAS | April 30, 2002 | vol. 99 I no. 9
cades on
2002 (received for review May 29, 2001)
d withstand many external shocks (robust), then suddenly and parently inexplicably exhibit a large cascade (fragile). Although the social, economic, and physical mechanisms respon- le for the occurrence of cascades are complex and may vary dely across systems and even between particular cascades in the ne system, it is proposed in this paper that some generic features cascades can be explained in terms of the connectivity of the twork by which influence is transmitted between individuals. ecifically, this paper addresses the set of qualitative observations it (i) global (i.e., very large) cascades can be triggered by )genous events (shocks) that are very small relative to the system e, and (ii) global cascades occur rarely relative to the number of )cks that the system receives, and may be triggered by shocks that ' a priori indistinguishable from shocks that do not.
Wdel Motivation: Binary Decisions with Externalities is model is motivated by considering a population of individuals :h of whom must decide between two alternative actions, and ose decisions depend explicitly on the actions of other members the population. In social and economic systems, decision makers en pay attention to each other either because they have limited ormation about the problem itself or limited ability to process -n the information that is available (6). When deciding which ,vie (11) or restaurant (12) to visit, we often have little informa- n with which to evaluate the alternatives, so frequently we rely on
recommendation of friends, or simply pick the movie or taurant to which most people are going. Even when we have :ess to plentiful information, such as when we evaluate new hnologies, risky financial assets, or job candidates, we often lack ability to make sense of it; hence, again we rely on the advice
trusted friends, colleagues, or advisors. In other decision making narios, such as in collective action problems (3) or social :mmas (13), an individual's payoff is an explicit function of the ions of others. And in other problems still, involving say the fusion of a new technology (14), the utility of a single additional it-a fax machine for example-may depend on the number of its that have already been sold. In all these problems, therefore, :ardless of the details, individual decision makers have an incen- I to pay attention to the decisions of others. In economic terms, this entire class of problems is known lerically as binary decisions with externalities (6). As simplistic as .ppears, a binary decision framework is relevant to surprisingly nplex problems. To take an extreme example, the creation of a itical coalition or an international treaty is unquestionably a nplex, multifaceted process with many potential outcomes. But :e the coalition exists or the treaty has been drafted, the decision xhether or not to join is essential a binary one. Similar reasoning )lies to a firm's choice between two technologies, or an individ- 's choice between two neighborhood restaurants-the factors olved in the decision may be many, but the decision itself can be arded as binary. 3oth the detailed mechanisms involved in binary decision prob- is, and also the origins of the externalities can vary widely across :cific problems. Nevertheless, in many applications that have mn examined in the economics and sociology literature-for
iail: [email protected].
www.pnas.org/cgi/doi/ 10.1 073/pnas.082090499

example, fads (1, 4, 5), riots (15), crime (16), competing technol- dif
ogies (14), and the spread of innovations (17, 18), conventions (6), dei and cooperation (13)-the decision itself can be considered a dy: function solely of the relative number of other agents who are rel observed to choose one alternative over the other (6). Because thi
many decisions are inherently costly, requiring commitment of time ne or resources, the relevant decision function frequently exhibits a
strong threshold nature: agents display inertia in switching states, E but once their personal threshold has been reached, the action of Th even a single neighbor can tip them from one state to another. ab
thi Model Specification tic A particularly simple binary decision rule with externalities that de
captures the essential features outlined above is the following: mf An individual agent observes the current states (either 0 or 1) of ne k other agents, which we call its neighbors, and adopts state 1 if ap at least a threshold fraction & of its k neighbors are in state 1, co else it adopts state 0. ab
To account for variations in knowledge, preferences, and obser- ch vational capabilities across the population of decision-making grn
agents, both individual thresholds and also the number of neighbors Al k are allowed to be heterogeneous. First, each agent is assigned a m( threshold 4 drawn at random from a distribution,fl) that is defined fir on the unit interval and normalized such that off(4)d = 1, but tal which is otherwise arbitrary. Next, we construct a network of n co
agents, in which each agent is connected to k neighbors with ca,
probability pk and the average number of neighbors is (k) = z. no
Although we shall continue to speak of an agent's neighbors, we oc should think of them simply as the set of incoming signals that are ex relevant to the problem at hand. More formally, we say that agents de are represented by vertices (or nodes) in a graph; neighboring ev vertices are joined by edges;pk is the degree distribution of the graph; ca and z is the average degree (in physics, z is usually called the mi coordination number). To model the dynamics of cascades, the
population is initially all-off (state 0) and is perturbed at time t = is: O by a small fraction Io << 1 of vertices that are switched on (state ini
1). The population then evolves at successive time steps with all se( vertices updating their states in random, asynchronous order ac- thl cording to the threshold rule above. Once a vertex has switched on, ap it remains on (active) for the duration of the dynamics. wi
In the social science literature, decision rules of this kind are co
usually derived either from the payoff structure of noncooperative of
games such as the prisoner's dilemma (3, 6), or from stochastic eq sampling procedures (18). But when regarded more generally as a un
change of state-not just a decision-the model belongs to a larger st6 class of contagion problems that includes models of failures in qu
engineered systems such as power transmission networks (8) or the thi internet (19, 20), epidemiological (21) and percolation (22, 23) sn models of disease spreading, and a multiplicity of cellular-automata models including random-field Ising models (24), bootstrap perco- cr lation (25, 26), majority voting (27, 28), spreading activation (29), in and self-organized criticality (8, 29). vu
The model, however, differs from these other contagion models va in some important respects. (i) Unlike epidemiological models, is where contagion events between pairs of individuals are indepen- in dent, the threshold rule effectively introduces local dependencies; th that is, the effect that a single infected neighbor will have on a given of node depends critically on the states of the node's other neighbors. ne
(ii) Unlike bootstrap percolation, and self-organized criticality ex models (which also exhibit local dependencies), the threshold is not a
expressed in terms of the absolute number of a node's neighbors hc
choosing a given alternative, but the corresponding fraction of the co neighborhood. This is a natural condition to impose for decision to
making problems, because the more signals a decision maker in receives, the less significant any one signal becomes. (iii) Unlike mi
random-field Ising and majority vote models, which are typically ca modeled on regular lattices, here we are concerned with hetero- (2 geneous networks; that is, networks in which individuals have la:
Watts
ferent numbers of neighbors. All these features-local depen- tcies,fractional thresholds, and heterogeneity-are essential to the lamics of cascades. Furthermore, although they are clearly ated by the threshold condition, network heterogeneity and eshold heterogeneity turn out not to be equivalent, and therefore Id to be considered separately.
act Solution on an Arbitrary Random Graph e main objective of this paper is to explore how the vulner-
ility of interconnected systems to global cascades depends on I network of interpersonal influences governing the informa- n that individuals have about the world, and therefore their cisions. Because building relationships and gathering infor- ition are both costly exercises, interaction and influence tworks tend to be very sparse (17)-a characteristic that
pears to be true of real networks in general (30)-so we nsider only the properties of networks with z << n. In the sence of any known geometry for the problem, a natural first oice for a sparse interaction network is an undirected random
iph (31), with n vertices and specified degree distribution pk. though random graphs are not considered to be highly realistic )dels of most real-world networks (30), they are often used as st approximations (19, 20, 32) because of their relative trac-
)ility, and this tradition is followed here. Our approach ncentrates on two quantities: (i) the probability that a global ;cade will be triggered by a single node (or small seed of
des), where we define a global cascade formally as cascade that
cupies a finite fraction of an infinite network; and (ii) the
pected size of a global cascade once it is triggered. When
scribing our results, the term cascade therefore refers to an ent of any size triggered by an initial seed, whereas global ;cade is reserved for sufficiently large cascades (in practice, this lans more than a fixed fraction of large, but finite network). In any sufficiently large random graph with z < c In n (where c ;ome constant) and Io << 1 (i.e., sparsely connected with a small tial seed), we can assume that the local neighborhood of a small Id will not contain any short cycles; hence, no vertex neighboring I initial seed will be adjacent to more than one seed member. This
proximation becomes exact in the case of an infinite network, th finite z, or a seed consisting of a single vertex. Under this ndition, the only way in which the seed can grow is if at least one its immediate neighbors has a threshold such that (4 - l/k, or
uivalently has degree k - K = L1/4J. We call vertices that are stable in this one-step sense, vulnerable, and those that are not, ble, noting that the distinction only applies when the seed in estion is small (numerical simulations suggest that seeds that are ree orders of magnitude less than the system size are sufficiently tall). The case of large seeds will be discussed later. Although the vulnerability condition is quite general, for con- :teness we use the language of the diffusion of innovations (17), which the initial seed plays the role of the innovators, and Inerable vertices correspond to early adopters. Unless the inno- tors are connected to a community of early adopters, no cascade
possible. In fact, as we show below, the success or failure of an lovation may depend less on the number and characteristics of I innovators themselves than on the structure of the community early adopters. Clearly, the more early adopters exist in the
twork, the more likely it is that an innovation will spread. But the tent of its growth-and hence the susceptibility of the network as
vhole-depends not only on the number of early adopters, but on w connected they are to one another, and also to the much larger mmunity consisting of the early and late majority, who do not tend
respond to the innovators directly, but who can be influenced
lirectly if exposed to multiple early adopters. In the context of this )del, we conjecture that the required condition for a global scade is that the subnetwork of vulnerable vertices mustpercolate 2) throughout the network as a whole, which is to say that the 'gest, connected vulnerable cluster must occupy a finite fraction
PNAS | April 30, 2002 | vol. 99 I no. 9 I 5767
of an infinite network. Regardless of how connected the network as se a whole might be, the claim here is that only if the largest vulnerable cl cluster percolates are global cascades possible. th
This condition, which we call the cascade condition (see Eq. 5 cli below), has the considerable advantage of reducing a complex pu dynamics problem to a static, percolation problem that can be th solved using a generating function approach. A similar technique ex has been used elsewhere (20, 32) to study the connectivity prop- erties of random graphs; here the basic approach is modified (described in detail in ref. 32) to focus on vulnerable vertices. By construction, every vertex has degree k with probabilitypk, and by the vulnerability condition above, a vertex with degree k is vulner- able with probability pk = P[ c il/k]. Hence, the probability of a vertex u having degree k and being vulnerable is pkPk, and the corresponding generating function of vulnerable vertex degree is:
Go(x) = EkpkPkXk, [la] t
1 k =O to where Pk= F(k) k>0 [lb] gl
is i and F(4) = fof(qp)dp. By incorporating all of the information in contained in the degree distribution and the threshold distribution, Wi Go(x) generates all of the moments of the degree distribution solely thl of vulnerable vertices, where the relevant moments can be extracted di by evaluating the derivatives of Go(x) at x = 1. For the purposes of tra this paper, the two most important quantities are (i) the vulnerable ca fraction of the population Pv = Go(l), and (ii) the average degree an of vulnerable vertices Zv = Go(l). Because we are interested in the k(i propagation of cascades from one vertex to another, we also require m' the degree distribution of a vulnerable vertex v that is a random ha neighbor of our initially chosen vertex u. The larger the degree of no v, the more likely it is to be a neighbor of u; hence, the probability ex of choosing v is proportional to kpk, and the correctly normalized oc generating function Gi(x) corresponding to a neighbor of u is: so.
ca;
EkkPkpkXk Go(x) Gj(X)= - - - [2] Re
ZLkkpk z Al
To calculate the properties of clusters of vulnerable vertices (the wi community structure of the early adopters), we introduce the f( analogous generating functions its
wh Ho(x) = Enq, and H,(x) = nrnxn, an
a(, where qn is the probability that a randomly chosen vertex will e belong to a vulnerable cluster of size n, and rn is the correspond- zQ ing probability for a neighbor of an initially chosen vertex. Any ga finite cluster of size n that we arrive at by following a random as edge can be regarded as composed of smaller such clusters, co whose cumulative sizes must sum to n. Because a sufficiently ca, large random graph below percolation can be regarded as a pure re; branching structure, we can therefore ignore the possibility that ve: the subclusters will be connected in cycles, so each subcluster can the be treated independently of the others. (The presence of an of infinite cluster above percolation will be dealt with below.) sin Hence, the probability of a finite cluster of size n is simply the an product of the probabilities of its (also finite) subclusters. It the follows from the properties of generating functions (20, 32) that Hi(x) satisfies the following self-consistency equation: bo
tio H,(x) = [1 - Gl(l)] + xG,(H,(x)), [3a] B
from which Ho(x) can be computed according to vu vul
Ho(x) = [1 - G0o()] + xGo(H,(x)). [3b] E spe
where the first term in both Eqs. 3a and 3b corresponds to the sol probability that the vertex chosen is not vulnerable, and the ev;
5768 | www.pnas.org/cgi/doi/10.1073/pnas.082090499
cond term accounts for the size distribution of vulnerable isters attached to a vertex that is, itself, vulnerable. Ho(x) erefore generates all moments of the distribution of vulnerable ister sizes, the most important of which, for our current rpose, is the average vulnerable cluster size (n) = Ho(1), because is is the quantity that diverges at percolation. Substituting the pressions for Ho(x) and Hl(x) above, we find that
(n) = Go(1) + (Go(1))2/(z - G (1)) = P + Z2/(z - G (1)), [4]
ich diverges when
G'(1) = Ekk(k - 1)PkPk = . [5]
Eq. 5-the cascade condition-is interpreted as follows: When ,(1) < z, all vulnerable clusters in the network are small; hence, I early adopters are isolated from each other and will be unable generate the momentum necessary for a cascade to become )bal. But when Go(1) > z, the typical size of vulnerable clusters nfinite, implying the presence of a percolating vulnerable cluster, which case random initial shocks should trigger global cascades th finite probability. Because Eq. 5 marks the transition between Ise two regimes, or phases, at which the average cluster size erges and global cascades first commence, it is called a phase nsition (31-33). The conditions necessary to generate global ;cades can, in other words, be determined by locating the position d nature of the relevant phase transition. Note, however, that the : - 1) term in Eq. 5 is monotonically increasing in k, but pk is notonically decreasing. Thus we would expect that Eq. 5 will ve either two solutions (resulting in two phase transitions), or ne at all, in contrast with the usual percolation model, which libits a single phase transition in z for all finite values of the cupation probability. Furthermore, in the case where we have two utions, we should observe a continuous interval in z, inside which ;cades occur.
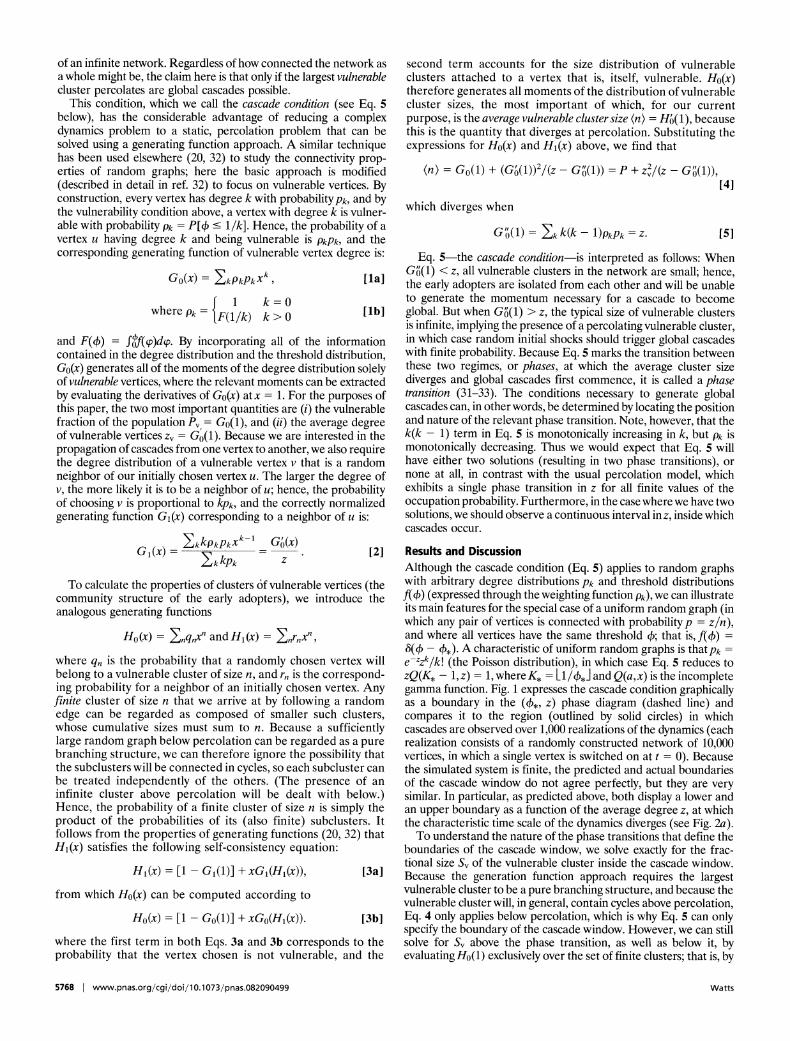
suits and Discussion though the cascade condition (Eq. 5) applies to random graphs :h arbitrary degree distributions pk and threshold distributions i) (expressed through the weighting function pk), we can illustrate main features for the special case of a uniform random graph (in ich any pair of vertices is connected with probability p = zn), i where all vertices have the same threshold 4; that is, f()) = b - 4,). A characteristic of uniform random graphs is thatpk = zk/k! (the Poisson distribution), in which case Eq. 5 reduces to (K, - 1,z) = 1, where K, = L1/4, and Q(a,x) is the incomplete nma function. Fig. 1 expresses the cascade condition graphically a boundary in the (0,, z) phase diagram (dashed line) and npares it to the region (outlined by solid circles) in which cades are observed over 1,000 realizations of the dynamics (each lization consists of a randomly constructed network of 10,000 'tices, in which a single vertex is switched on at t = 0). Because ; simulated system is finite, the predicted and actual boundaries the cascade window do not agree perfectly, but they are very lilar. In particular, as predicted above, both display a lower and upper boundary as a function of the average degree z, at which characteristic time scale of the dynamics diverges (see Fig. 2a).
Fo understand the nature of the phase transitions that define the undaries of the cascade window, we solve exactly for the frac- nal size S, of the vulnerable cluster inside the cascade window. cause the generation function approach requires the largest nerable cluster to be a pure branching structure, and because the nerable cluster will, in general, contain cycles above percolation, . 4 only applies below percolation, which is why Eq. 5 can only ,cify the boundary of the cascade window. However, we can still ve for Sv above the phase transition, as well as below it, by iluating Ho(l) exclusively over the set of finite clusters; that is, by
Watts
16 I I
14
12 L IL_ No Global Cascades
10-
Z 8- .
6- - '
4 - Global Cascades _ *. - *
2- i 4 6 - t - 1 -a - - -. - - -0 -a - a
0 ------i - - - 0.1 0.12 0.14 0.16 0.18 0.2 0.22 0.24 0.26
*
Fig. 1. Cascade windows for the threshold model. The dashed line encloses the region of the (,*, z) plane in which the cascade condition (Eq. 5) is satisfied for a uniform random graph with a homogenous threshold distribution f(G) =
6(o - r). The solid circles outlinethe region in which global cascades occur for the same parameter settings in the full dynamical model for n = 10,000 (averaged over 100 random single-node perturbations).
explicitly excluding the percolating cluster (when it exists) from the sum ,nqn. Using Eq. 3b, it follows that Sv = 1 - Ho(l) = P -
Go(Hi(l)), where HJ(l) satisfies Eq. 3a. Outside the cascade
window, the only solution to Eq. 3a is Hi(1) = 1, which yields Sv = O (and therefore no cascades) as expected. But inside the cascade
window, where the percolating vulnerable cluster exists, Eq. 3a has an additional solution that corresponds to a non-zero value of Sv. In the special case of a uniform random graph with homogeneous thresholds, we obtain Sv = Q(K, + 1, z) - eZ(H-')Q(K, + 1, zH1), in which H1 satisfies H1 = 1 - Q(K,, z) + ez(H1-')Q(K,, zH1). We contrast this expression with that for the size of the entire connected
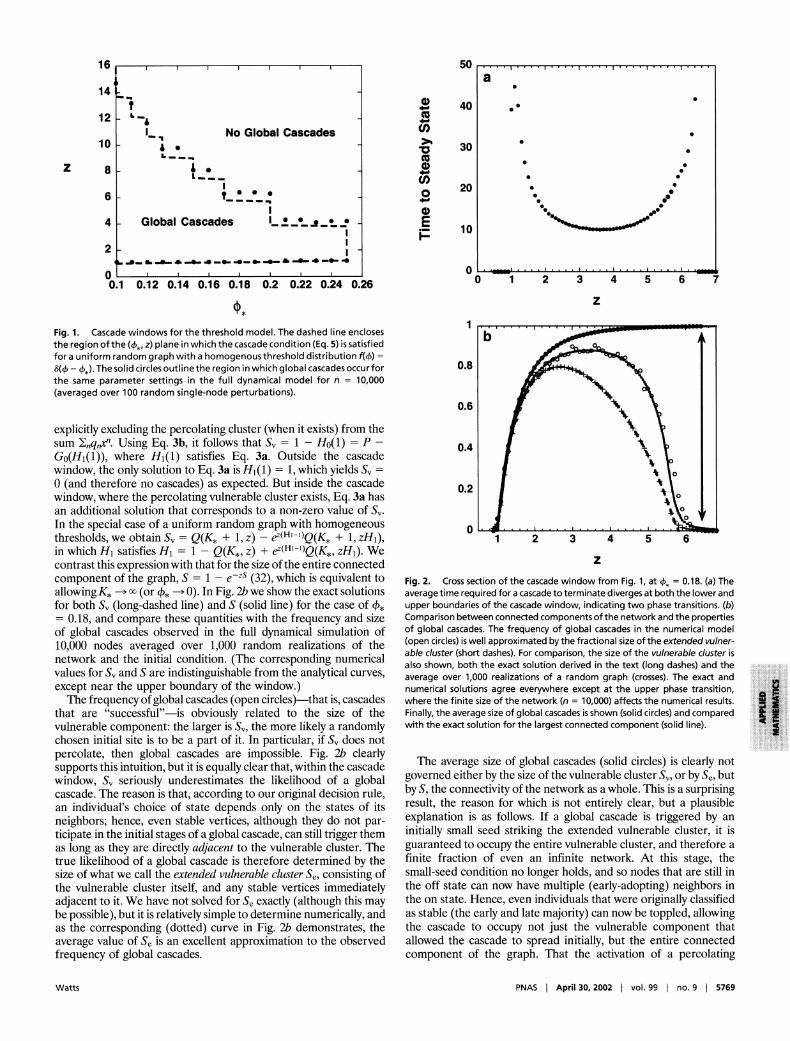
component of the graph, S = 1 - e-ZS (32), which is equivalent to Fig allowing K, -> o (or 0, -> 0). In Fig. 2b we show the exact solutions ave for both Sv (long-dashed line) and S (solid line) for the case of 0, upl = 0.18, and compare these quantities with the frequency and size Co
of global cascades observed in the full dynamical simulation of of
10,000 nodes averaged over 1,000 random realizations of the (oF abi network and the initial condition. (The corresponding numerical als values for Sv and S are indistinguishable from the analytical curves, av
except near the upper boundary of the window.) nu, The frequency of global cascades (open circles)-that is, cascades wh
that are "successful"-is obviously related to the size of the Fin vulnerable component: the larger is Sv, the more likely a randomly wil chosen initial site is to be a part of it. In particular, if Sv does not percolate, then global cascades are impossible. Fig. 2b clearly supports this intuition, but it is equally clear that, within the cascade window, Sv seriously underestimates the likelihood of a global g? cascade. The reason is that, according to our original decision rule, by an individual's choice of state depends only on the states of its re' neighbors; hence, even stable vertices, although they do not par- ex
ticipate in the initial stages of a global cascade, can still trigger them in] as long as they are directly adjacent to the vulnerable cluster. The gu true likelihood of a global cascade is therefore determined by the fin size of what we call the extended vulnerable cluster Se, consisting of sn the vulnerable cluster itself, and any stable vertices immediately th'
adjacent to it. We have not solved for Se exactly (although this may th' be possible), but it is relatively simple to determine numerically, and as as the corresponding (dotted) curve in Fig. 2b demonstrates, the th average value of Se is an excellent approximation to the observed all frequency of global cascades. co
Watts
50 i ... . . . .. . a
0?> 4 , 40 .
-~ 30 co
20 C) o
20 0:0
0 1 2 3 4 5 6 7
2. Cross section of the cascade window from Fig. 1, at i = 0.18. (a) The
Z
1
0.8
0.6
0.4
0.2
0 1 2 3 4 5 6
2. Cross section of the cascade window from Fig. 1, at 4. = 0.18. (a) The
rage time required for a cascade to terminate diverges at both the lower and )er boundaries of the cascade window, indicating two phase transitions. (b) nparison between connected components of the network and the properties global cascades. The frequency of global cascades in the numerical model en circles) is well approximated by the fractional size of the extended vulner- e cluster (short dashes). For comparison, the size of the vulnerable cluster is
shown, both the exact solution derived in the text (long dashes) and the
rage over 1,000 realizations of a random graph (crosses). The exact and nerical solutions agree everywhere except at the upper phase transition, ere the finite size of the network (n = 10,000) affects the numerical results.
ally, the average size of global cascades is shown (solid circles) and compared h the exact solution for the largest connected component (solid line).
The average size of global cascades (solid circles) is clearly not
erned either by the size of the vulnerable cluster Sv, or by Se, but
S, the connectivity of the network as a whole. This is a surprising ult, the reason for which is not entirely clear, but a plausible planation is as follows. If a global cascade is triggered by an
tially small seed striking the extended vulnerable cluster, it is aranteed to occupy the entire vulnerable cluster, and therefore a ite fraction of even an infinite network. At this stage, the all-seed condition no longer holds, and so nodes that are still in
, off state can now have multiple (early-adopting) neighbors in I on state. Hence, even individuals that were originally classified stable (the early and late majority) can now be toppled, allowing ? cascade to occupy not just the vulnerable component that owed the cascade to spread initially, but the entire connected mponent of the graph. That the activation of a percolating
PNAS | April 30, 2002 | vol. 99 I no. 9 I 5769

1000 , .
nc 100 o
Ur 3
S 10
I t
0.0001 0.001 0.01 0.1 1
Cascade Size
Fig. 3. Cumulative distributions of cascade sizes at the lower and upper critical points, for n = 1,000 and z = 1.05 (open squares) and z = 6.14 (solid circles), respectively. The straight line on the double logarithmic scale indi- cates that cascades at the lower critical point are power-law distributed, with slope 3/2 (the cumulative distribution has slope 1/2). By contrast, the distri- bution at the upper critical point is bimodal, with an exponential tail at small cascade size, and a second peak at the size of the entire system corresponding to a single global cascade. Above the upper boundary, the global cascade disappears and large cascades are always exponentially unlikely.
vulnerable cluster should always be sufficient to activate the entire connected component, even when the former is a very small fraction of the latter, is not an obvious result, but it appears to hold consistently, at least within the class of random graphs. Whether or not it turns out to hold for networks more general than random graphs is a matter of current investigation.
As Figs. 1 and 2 suggest, the onset of global cascades can occur in two distinct regimes-a low connectivity regime and a high connectivity regime-corresponding to the lower and upper phase Fig transitions respectively. The nature of the phase transitions at the sol two boundaries is different, and this has important consequences fo for the apparent stability of the systems involved. As Fig. 3 (open rer squares) demonstrates, the cumulative distribution of cascades at the the lower boundary of the cascade window follows a power law, fix analogous to the distribution of avalanches in models of self- organized criticality (29) or the cluster size distribution at criticality for standard percolation (22). In fact, the slope of the cascade size la] distribution is indistinguishable from the known critical exponent im a = 3/2 for the cluster size distribution of random graphs at siz percolation (32). This result is expected because, when z = 1, most co vertices satisfy the vulnerability condition, so the propagation of th cascades is constrained principally by the connectivity of the ra network, which for random graphs is known to undergo a second- ra order phase transition at z = 1 (31). frn
The upper boundary, however, is different. Here, the propa- m; gation of cascades is limited not by the connectivity of the in network, but by the local stability of the vertices. Most vertices ot: in this regime have so many neighbors that they cannot be toppled by a single neighbor perturbation; hence, most initial ra] shocks immediately encounter stable vertices. Most cascades ol therefore die out before spreading very far, giving the appear- ca ance that large cascades are exponentially unlikely. A percolat- ab ing vulnerable cluster, however, still exists, so very rarely a an cascade will be triggered in which case the high connectivity of th: the network ensures that it will be extremely large, typically by much larger than cascades at the lower phase transition. The th: result is a distribution of cascade sizes that is bimodal rather than . a power law (see Fig. 3, solid circles). As the upper phase shl transition is approached from below, global cascades become inc
5770 I www.pnas.org/cgi/doi/10.1073/pnas.082090499
i O. I a=0.05 .
10
55~~I L 5 Homogeneous
- --- ------------------0-'- 1 -
Thresholds ..
0.1 0.15 0.2 0.25 0.3
25 I
20 I
15 z ' L Uniform
10 o L, Random 1 Y0 i -Graph
C1 - 5 Scale Free 1
Random Graph --
0 0.05 0.1 0.15 0.2 0.25 0.3
0
.4. Analytically derived cascade windows for heterogeneous networks. The d lines are the same as Fig. 1. (a) The dashed lines represent cascade windows uniform random graphs, but where the threshold distributions (4) are nor- lly distributed with mean p and SD o- = 0.05 and o- = 0.1. (b) The dashed line -resents the cascade window for a random graph with a degree distribution t is a power law with exponent T and exponential cut-off Ko, where T has been td at T = 2.5 and Ko has been adjusted to generate graphs with variable z.
ger, but increasingly rare, until they disappear altogether, plying a discontinuous (i.e., first-order) phase transition in the e of successful cascades (see Fig. 2b, solid circles). The main nsequence of the first-order phase transition is that just inside I boundary of the window, where global cascades occur very rely (Fig. 3 shows only a single cascade occurring in 1,000 idom trials), the system will in general be indistinguishable im one that is highly stable, exhibiting only tiny cascades for tny initial shocks before generating a massive, global cascade response to a shock that is a priori indistinguishable from any her. These qualitative results are quite general within the class of idom networks, applying to arbitrary distributions both of thresh- s f()) and degree Pk. Variations in either distribution, however, i affect the quantitative results-and thus the effective vulner- ility of the system-considerably, as is demonstrated in Fig. 4 a d b. Fig. 4a shows the original cascade window for homogeneous resholds (solid line) and also two windows (dashed lines) derived the same generating function method, but corresponding to
'eshold distributionsf() that are normally distributed with mean and increasing standard deviation o(. Numerical results (not
)wn) correspond to the analytically derived windows. Clearly, reased heterogeneity of thresholds causes the system to be less
Watts
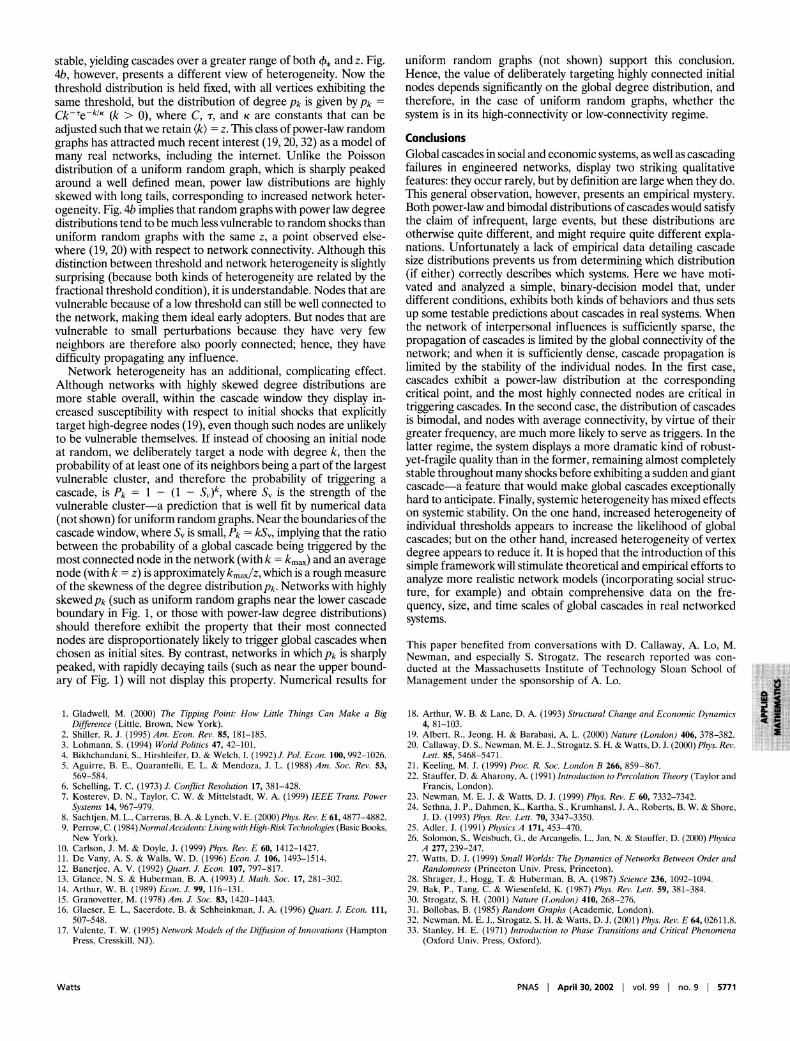
stable, yielding cascades over a greater range of both 4, and z. Fig. un 4b, however, presents a different view of heterogeneity. Now the Hi threshold distribution is held fixed, with all vertices exhibiting the no same threshold, but the distribution of degree pk is given by pk = th{ Ck-Te-klK (k > 0), where C, T, and K are constants that can be sy, adjusted such that we retain (k) = z. This class of power-law random graphs has attracted much recent interest (19, 20, 32) as a model of C many real networks, including the internet. Unlike the Poisson GI distribution of a uniform random graph, which is sharply peaked fai around a well defined mean, power law distributions are highly fe; skewed with long tails, corresponding to increased network heter- Tt ogeneity. Fig. 4b implies that random graphs with power law degree B( distributions tend to be much less vulnerable to random shocks than thl uniform random graphs with the same z, a point observed else- ot] where (19, 20) with respect to network connectivity. Although this na distinction between threshold and network heterogeneity is slightly Si2 surprising (because both kinds of heterogeneity are related by the (if fractional threshold condition), it is understandable. Nodes that are va vulnerable because of a low threshold can still be well connected to dil the network, making them ideal early adopters. But nodes that are UI vulnerable to small perturbations because they have very few th neighbors are therefore also poorly connected; hence, they have pr difficulty propagating any influence. ne
Network heterogeneity has an additional, complicating effect. Although networks with highly skewed degree distributions are ca more stable overall, within the cascade window they display in- cr
tri creased susceptibility with respect to initial shocks that explicitly tn target high-degree nodes (19), even though such nodes are unlikely ls to be vulnerable themselves. If instead of choosing an initial node gr at random, we deliberately target a node with degree k, then the a probability of at least one of its neighbors being a part of the largest ye vulnerable cluster, and therefore the probability of triggering a cascade, is Pk = 1 - (1 - Sv)k, where Sv is the strength of the ca vulnerable cluster-a prediction that is well fit by numerical data (not shown) for uniform random graphs. Near the boundaries of the or cascade window, where Sv is small, Pk - kSv, implying that the ratio between the probability of a global cascade being triggered by the da most connected node in the network (with k = kmax) and an average sir node (with k = z) is approximately kmax/Z, which is a rough measure of the skewness of the degree distributionpk. Networks with highly tu skewedpk (such as uniform random graphs near the lower cascade boundary in Fig. 1, or those with power-law degree distributions) q should therefore exhibit the property that their most connected nodes are disproportionately likely to trigger global cascades when Ti chosen as initial sites. By contrast, networks in which pk is sharply Ne peaked, with rapidly decaying tails (such as near the upper bound- du ary of Fig. 1) will not display this property. Numerical results for M
1. Gladwell, M. (2000) The Tipping Point: How Little Things Can Make a Big 18
Difference (Little, Brown, New York). 2. Shiller, R. J. (1995) Am. Econ. Rev. 85, 181-185. 19 3. Lohmann, S. (1994) World Politics 47, 42-101. 20 4. Bikhchandani, S., Hirshleifer, D. & Welch, I. (1992) J. Pol. Econ. 100, 992-1026. 5. Aguirre, B. E., Quarantelli, E. L. & Mendoza, J. L. (1988) Am. Soc. Rev. 53, 21
569-584. 22 6. Schelling, T. C. (1973) J. Conflict Resolution 17, 381-428. 7. Kosterev, D. N., Taylor, C. W. & Mittelstadt, W. A. (1999) IEEE Trans. Power 23
Systems 14, 967-979. 24 8. Sachtjen, M. L., Carreras, B. A. & Lynch, V. E. (2000) Phys. Rev. E 61,4877-4882. 9. Perrow, C. (1984) NormalAccidents: Living with High-Risk Technologies (Basic Books, 25
New York). 26 10. Carlson, J. M. & Doyle, J. (1999) Phys. Rev. E 60, 1412-1427. 11. De Vany, A. S. & Walls, W. D. (1996) Econ. J. 106, 1493-1514. 27 12. Banerjee, A. V. (1992) Quart. J. Econ. 107, 797-817. 13. Glance, N. S. & Huberman, B. A. (1993) J. Math. Soc. 17, 281-302. 28 14. Arthur, W. B. (1989) Econ. J. 99, 116-131. 29 15. Granovetter, M. (1978) Am. J. Soc. 83, 1420-1443. 30 16. Glaeser, E. L., Sacerdote, B. & Schheinkman, J. A. (1996) Quart. J. Econ. 111, 31
507-548. 32 17. Valente, T. W. (1995) Network Models of the Diffusion of Innovations (Hampton 33
Press, Cresskill, NJ).
Watts
iform random graphs (not shown) support this conclusion. Mnce, the value of deliberately targeting highly connected initial des depends significantly on the global degree distribution, and :refore, in the case of uniform random graphs, whether the tem is in its high-connectivity or low-connectivity regime.
nclusions obal cascades in social and economic systems, as well as cascading lures in engineered networks, display two striking qualitative itures: they occur rarely, but by definition are large when they do. is general observation, however, presents an empirical mystery. ,th power-law and bimodal distributions of cascades would satisfy I claim of infrequent, large events, but these distributions are lerwise quite different, and might require quite different expla- tions. Unfortunately a lack of empirical data detailing cascade e distributions prevents us from determining which distribution either) correctly describes which systems. Here we have moti- :ed and analyzed a simple, binary-decision model that, under ferent conditions, exhibits both kinds of behaviors and thus sets some testable predictions about cascades in real systems. When I network of interpersonal influences is sufficiently sparse, the )pagation of cascades is limited by the global connectivity of the twork; and when it is sufficiently dense, cascade propagation is lited by the stability of the individual nodes. In the first case, scades exhibit a power-law distribution at the corresponding tical point, and the most highly connected nodes are critical in ggering cascades. In the second case, the distribution of cascades bimodal, and nodes with average connectivity, by virtue of their later frequency, are much more likely to serve as triggers. In the ter regime, the system displays a more dramatic kind of robust- t-fragile quality than in the former, remaining almost completely ible throughout many shocks before exhibiting a sudden and giant scade-a feature that would make global cascades exceptionally rd to anticipate. Finally, systemic heterogeneity has mixed effects systemic stability. On the one hand, increased heterogeneity of
lividual thresholds appears to increase the likelihood of global scades; but on the other hand, increased heterogeneity of vertex gree appears to reduce it. It is hoped that the introduction of this nple framework will stimulate theoretical and empirical efforts to alyze more realistic network models (incorporating social struc- 'e, for example) and obtain comprehensive data on the fre- ency, size, and time scales of global cascades in real networked ;tems.
is paper benefited from conversations with D. Callaway, A. Lo, M. wman, and especially S. Strogatz. The research reported was con- cted at the Massachusetts Institute of Technology Sloan School of anagement under the sponsorship of A. Lo.
Arthur, W. B. & Lane, D. A. (1993) Structural Change and Economic Dynamics 4, 81-103. Albert, R., Jeong, H. & Barabasi, A. L. (2000) Nature (London) 406, 378-382.
Callaway, D. S., Newman, M. E. J., Strogatz, S. H. & Watts, D. J. (2000) Phys. Rev. Lett. 85, 5468-5471.
Keeling, M. J. (1999) Proc. R. Soc. London B 266, 859-867. Stauffer, D. & Aharony, A. (1991) Introduction to Percolation Theory (Taylor and Francis, London). Newman, M. E. J. & Watts, D. J. (1999) Phys. Rev. E 60, 7332-7342. Sethna, J. P., Dahmen, K., Kartha, S., Krumhansl, J. A., Roberts, B. W. & Shore, J. D. (1993) Phys. Rev. Lett. 70, 3347-3350. Adler, J. (1991) Physics A 171, 453-470. Solomon, S., Weisbuch, G., de Arcangelis, L., Jan, N. & Stauffer, D. (2000) Physica A 277, 239-247. Watts, D. J. (1999) Small Worlds: The Dynamics of Networks Between Order and Randomness (Princeton Univ. Press, Princeton). Shrager, J., Hogg, T. & Huberman, B. A. (1987) Science 236, 1092-1094. Bak, P., Tang, C. & Wiesenfeld, K. (1987) Phys. Rev. Lett. 59, 381-384.
Strogatz, S. H. (2001) Nature (London) 410, 268-276. Bollobas, B. (1985) Random Graphs (Academic, London). Newman, M. E. J., Strogatz, S. H. & Watts, D. J. (2001) Phys. Rev. E 64, 02611.8. Stanley, H. E. (1971) Introduction to Phase Transitions and Critical Phenomena (Oxford Univ. Press, Oxford).
PNAS I April 30, 2002 I vol. 99 I no. 9 I 5771