Embed Size (px)
Citation preview
A Simple Practical Classification of Cerebral Infarcts on CT and Its Interobserver Reliability
J. M. Wardlaw and R. Sellar
PURPOSE: To test the interobserver reliability of a simple method of classifying cerebral infarcts
as seen on CT brain scans , which might allow differentiation of the site and size of the infarct from
infarct swelling and hemorrhagic transformation . METHOD: Two experienced neuroradiologists
independently reviewed 119 CT brain scans showing recent small to large cortica l and subcortica l
cerebral infarcts and classified each for site and size, amount of swelling, and hemorrhagic
transformation blind to clinical information . Six less experienced general radiologists in training
classified 33 of the CT scans blind to clinical information. lnterobserver agreement was calculated
using unweighted K statistics. RESULTS: The K statistics between the two experienced neuroradi
ologists were: (a) 0 .78 for site and size (95% confidence interva l, 0.69-0.87) ; (b) 0.8 for swelling
(95% confidence interval, 0.68-0.92); and (c) 0.3 for hemorrhagic transformation (95% confi
dence interval, 0-0.77) ; indicating "good," "excellent," and " fair" agreement, respectively. Agree
ment for the less experienced radiologists was fair to excellent. CONCLUSION: The cerebral infarct
morphologic classification is simple, quick, and reliable and therefore practical. It usefully distin
guishes between infarcts of similar site and size but with different amounts of swelling and
hemorrhagic transformation , thus facilitating study of factors such as the influence of drug treat
ment on infarct swelling, which might influence clinical outcome. Although developed for CT, it
could be used equally for MR imaging and has applications in research and clinical practice.
Index terms: Brain , computed tomography; Brain , edema; Brain , infarction; Cerebral hemorrhage
AJNR Am J Neuroradio/15:1933-1939, Nov 1994
Patterns of cerebral infarction of the major arterial territories as seen on computed tomography (CT) brain scans have been described previously, but these are by necessity detailed and complex and do not include a measure of infarct swelling or hemorrhagic transformation ( 1-4). Although some variability occurs in the areas of the brain supplied by the major arteries, they are reasonably constant (5) . Previously described methods of assessing cerebral infarcts on CT brain scans simply measured infarct vol-
Received December 30, 1993: accepted after revision April 5, 1994.
From the Departments of Clinical Neurosciences (J .M.W.) and Neuro
radiology (R.S.) , Western General Hospital, Edinburgh , United Kingdom.
J.M.W. was a Medical Research Council Research Training Fellow in
Neuroradiology.
Address reprint requests to Dr J .M. Wardlaw, Consultant Neuroradiolo
gist, Department of Clinical Neuroradiology, Institute of Neurolog ic Sci
ences, Southern General Hospital , Govan Road, Glasgow G51 4TF, United
Kingdom.
AJNR 15:1933-1939, Nov 1994 0195-6108/94/1510-1933
© American Society of Neuroradiology
ume or assessed swelling by the presence of midline shift, thereby not dissociating the site in the brain and the amount of tissue involved in the infarct (site and size) from the amount of swelling of the infarct (mass effect) or hemorrhagic transformation ( 6-10).
Our intention was to devise a method of classifying infarcts on CT that was not only reliable for the presence of an infarct (ie, its site and size) when one is blind to clinical information, but also was reliable for identifying different amounts of infarct swelling and hemorrhagic transformation for any given infarct size.
Method The classification was devised after reviewing more
than 100 CT brain scans showing cerebral infarction and observing that the appearance of cerebral infarcts tended to follow recurring patterns, despite the recognized variability in territories supplied by the major arteries (5). Figure 1 shows templates devised to illustrate these typica l patterns of infarction: (a) site and size, (b) swelling , and (c) hemorrhagic transformation of the infarct. There were
1933
1934 WARDLAW AJNR: 15, November 1994
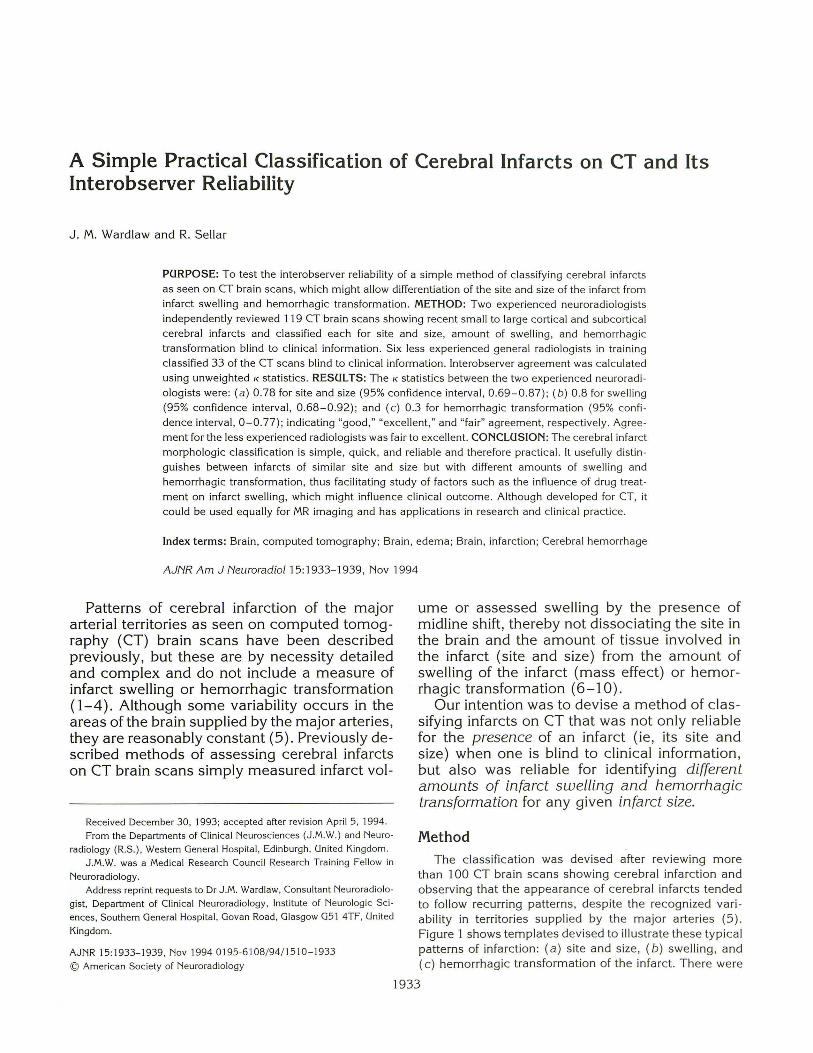
c Fig 1. Templates for the classification of cerebral infarcts as seen on CT brain scans.
A A , Site and size ( 10 to 80 indicates infarcts in the middle cerebral artery territory; 01 to 05, infarcts elsewhere in the brain and lacunar and border zone infarcts) .
B, Swelling (0 indicates no swelling; 1, effacement of cortical sulci; 2, 1 + minor effacement of the ipsi lateral lateral ventricle; 3 , 1 + complete effacement of the ipsilateral lateral ventricle; 4, 3 + effacement of the third ventricle ; 5 , shift of the midline away from the side of the infarction ; and 6 (not shown], 5 + effacement of basal cisterns) .
C, Hemorrhagic transformation (0 indicates no hemorrhage; 1, petechial hemorrhage; 2, small hematoma less than 2 em in diameter; and 3 , hematoma greater than 2 em in diameter) .
more categories for infarcts in the middle cerebral artery territory because the middle cerebral artery supplies the largest part of the brain and is the territory most frequently involved in infarction ( 11 ) .
Over a 9-month period, 180 consecutive patients with symptoms of acute stroke were admitted to our hospital and had a CT brain scan unless the attending physician did not feel that the CT was justified clinically (30 patients) or the patient died or was discharged soon after admission (5) . All patients were examined by a physician with an interest in stroke to confirm that they had had a stroke clinically. Patients with a previous stroke were included. Patients whose CT brain scan showed primary intracerebral hemorrhage (30) , subarachnoid hemorrhage (5) , tumor (4) , or abscess (2 ) (ie , not an infarct as the cause of recent symptoms) were excluded. Fifteen patients had 2 CT scans within the first 3 weeks of admission as part of a separate study , giving a total of 119 CT scans.
A recent infarct was defined as an area of hypodensity relative to adjacent normal brain (possibly associated with mass effect or areas of hemorrhage) whose shape indi-
cated vascular ongm (whether cortical or subcortical) . Density was assessed subjectively to simulate a clinical situation (Hounsfield units were not measured) . Recent infarcts were distinguished from old infarcts by the latter's more marked hypodensity, lack of mass effect, and atrophy of adjacent brain ( 12) . The 119 study CT scans were mixed with 5 scans from elderly patients who had not had a stroke and were considered healthy for their age. Two experienced neuroradiologists (J .M.W. and R.S.) independently reviewed the CT brain scans blind to all clinical information. They knew that most of the patients had had a stroke but not which ones and classified each for the presence, site, and size of infarct, amount of swelling, and hemorrhagic transformation according to the templates shown in Figure 1. Each observer was asked simply to identify any recent infarct and classify it according to the templates . Some patients had more than one CT brain scan, and these were randomly mixed so that no bias in interpretation of any one individual CT brain scan would be introduced by knowledge of the infarct's appearance in the same patient at a different time after stroke onset.
AJNR: 15, November 1994
TABLE 1: lnterobserver agreement between the two experienced neuroradiologists
Parameter of Infarct (95% Confidence Interva l)
Examined K
Infarct site and extent, 0.78 (0.69 to 0.87) all scans
Infarct site and extent, 0.87 (0.77 to 0.97) medium and large cortica l and subcorti cal infarcts
Infarct site and extent, small 0.59 (0.42 to 0.76) cortical and subcortica l infarcts
Infarct swelling 0.8 (0.68 to 0.92) Infarct hemorrhagic 0.3 (0.0 to 0.77 )
transformation
Six less experienced general radiologists in training (first to fifth year of a general radiology training program) were asked to apply the classification to a selection of the study CT scans showing a variety of recent small and large cerebral infarcts with variable amounts of swelling and hemorrhagic transformation mingled with some normal scans. They also were blind to the clinical information . The general radiologists were not familiar with the classification and were not given an opportunity to practice with it before reviewing the CT scans. Therefore , their results are for first-ever use.
The interobserver agreement between the two experi enced neuroradiologists and between one of the two experienced neuroradiologists (J .M.W.) and the general radiologists was calculated using unweighted K statistics (13). The K statistic is a measure of agreement between two observers beyond that expected from chance alone. A K
A B
lNF ARCT CLASSlFlCA TlON 1935
value of 0 indicates agreement no better than chance, and a value of 1 indicates perfect ag reement. Va lues of 0 to 0 .2 generally are thought to indicate poor agreement; 0 .21 to 0.40, fa ir agreement; 0 .41 to 0 .6 , moderate agreement; 0.61 to 0 .8 , good agreement; and 0 .8 1 to 1, exce ll ent agreement ( 13).
Results
There were 119 CT brain scans included in the study. The mean age of the patients was 72 years (range, 19 to 93 years) . The CT scans were obtained between 2 hours and 3 months after the stroke , although the majority were obtained within the first 2 weeks.
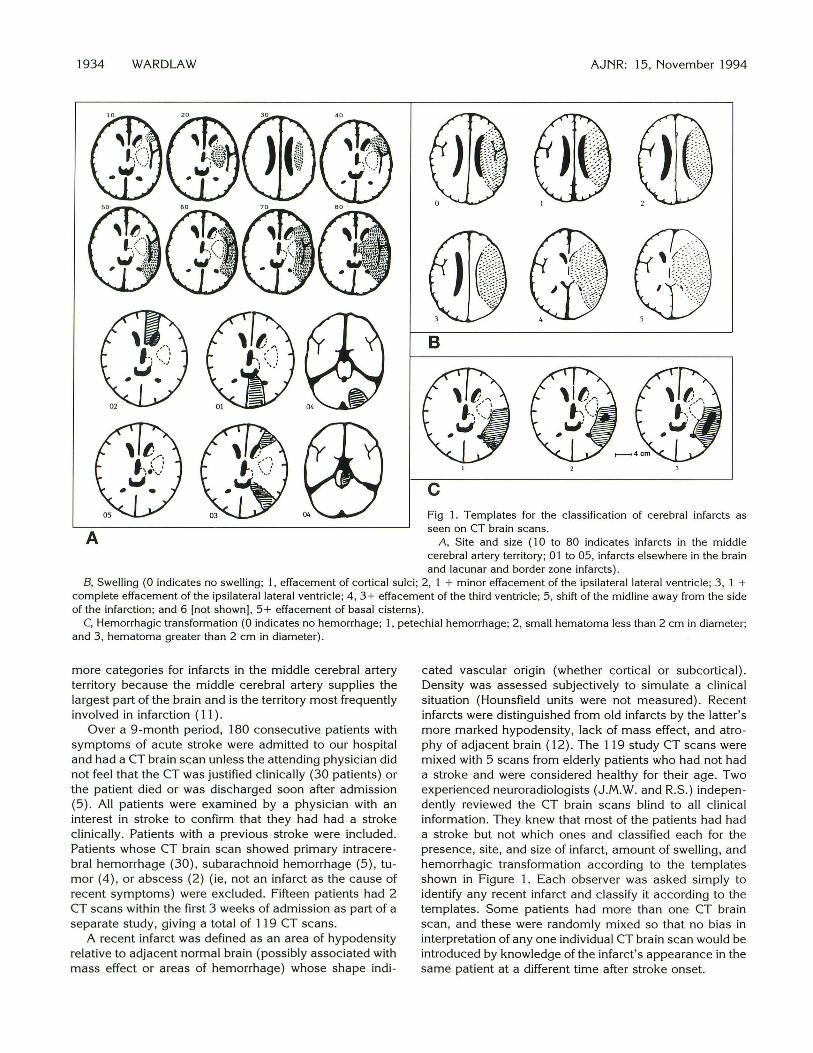
lnterobserver agreement (K) between the two experienced neuroradiologists was "good" for infarct site and size; "excellent" for infarct swelling; and "fair" for hemorrhagic transformation of the infarct (Table 1 ). The poorer interobserver agreement for hemorrhagic transformation was caused by disagreement about minor amounts of petechial hemorrhage, not about the presence of focal hematomas (Fig 2). There was no disagreement about the presence of fo cal hematomas more than 1 em in diameter within the infarct. The K value for infarct site and size for the subgroup of patients with medium to large cortical and subcortical infarcts (72 CT scans) was 0.87 (95% confidence interval 0 .77 to 0.97) and was 0.59 (95% confidence interval
Fig 2 . Exam ples of hem orrhagic transformation.
A, Increased density at the m argin of a 40 cortica l infarct (anterior half of the peripheral part of the midd le cerebra l artery territory not including the basal ganglia , am ount of swelling is 3)-? petechial hem orrhage (code 1) or luxury perfusion.
8 , Hematom a greater than 2 em in diameter (code 3) in a 60 corti ca l infa rct (whole of the peripheral part of the m iddle cerebral artery territory but not including the basal ganglia; swell ing is 1 ) .
1936 WARDLAW
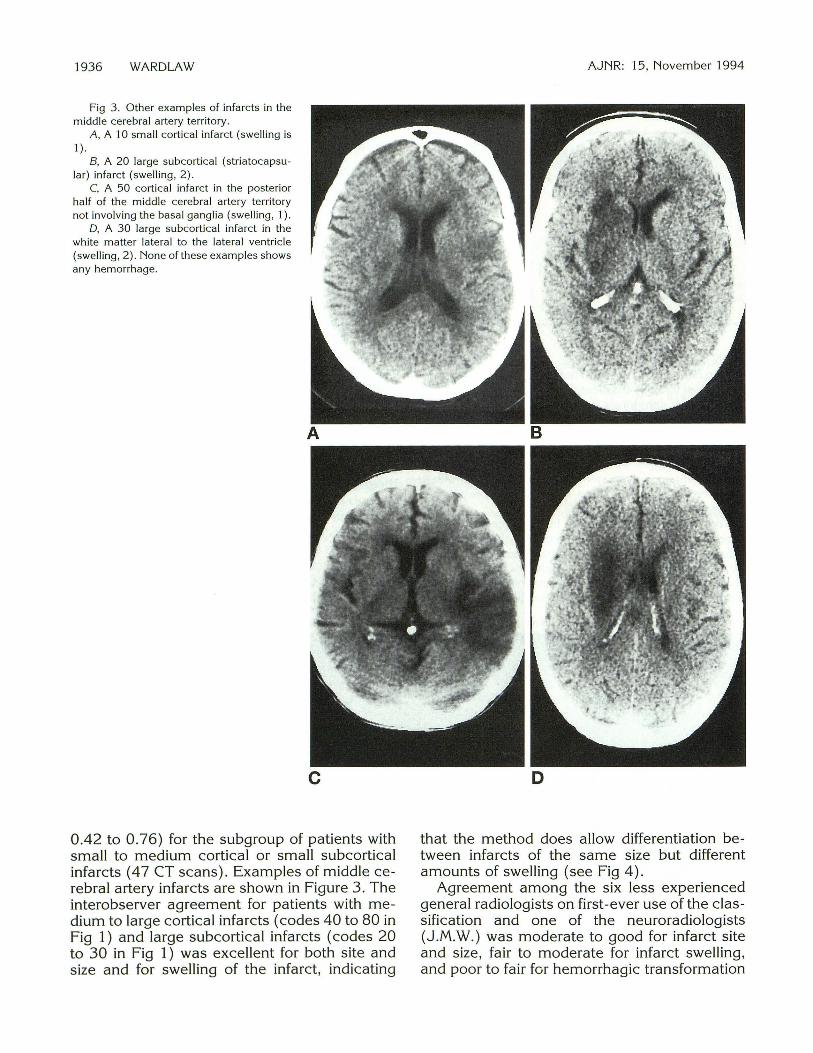
Fig 3. Other examples of infarcts in the middle cerebral artery territory.
A , A 10 small cortical infarct (swelling is 1 ).
8, A 20 large subcortical (striatocapsular) infarct (swelling, 2) .
C, A 50 cortical infarct in the posterior half of the middle cerebral artery territory not involving the basal ganglia (swelling, 1 ) .
D, A 30 large subcortical infarct in the white matter lateral to the lateral ventricle (swelling , 2). None of these examples shows any hemorrhage.
c
0.42 to 0.76) for the subgroup of patients with small to medium cortical or small subcortical infarcts ( 4 7 CT scans). Examples of middle cerebral artery infarcts are shown in Figure 3. The interobserver agreement for patients with medium to large cortical infarcts (codes 40 to 80 in Fig 1) and large subcortical infarcts (codes 20 to 30 in Fig 1) was excellent for both site and size and for swelling of the infarct, indicating
AJNR: 15, November 1994
D
that the method does allow differentiation between infarcts of the same size but different amounts of swelling (see Fig 4).
Agreement among the six less experienced general radiologists on first-ever use of the classification and one of the neuroradiologists (J.M.W.) was moderate to good for infarct site and size, fair to moderate for infarct swelling, and poor to fair for hemorrhagic transformation
AJNR: 15, November 1994
A B
(Table 2) . The poorer agreement for infarct swell ing was caused by minor disagreement about the amount of swelling ( eg, coding a 2 instead of a 3), not major (eg, coding a 2 instead of a 5 ). When classified simply as major amounts of infarct swelling (ie, code 3 to 6) or minor (ie, code 0 to 2) the K values improved to good to excellent (Table 2). The poor agreement for hemorrhagic transformation again was caused by disagreement about minor amounts of petechial hemorrhage . There was no dis agreement about the presence of focal hematomas more than 1 em in diameter.
Discussion
This simple classification of cerebral infarct morphology as seen on CT brain scans has good interobserver reliability , even on first-ever
INFARCT CLASSIFICATION 1937
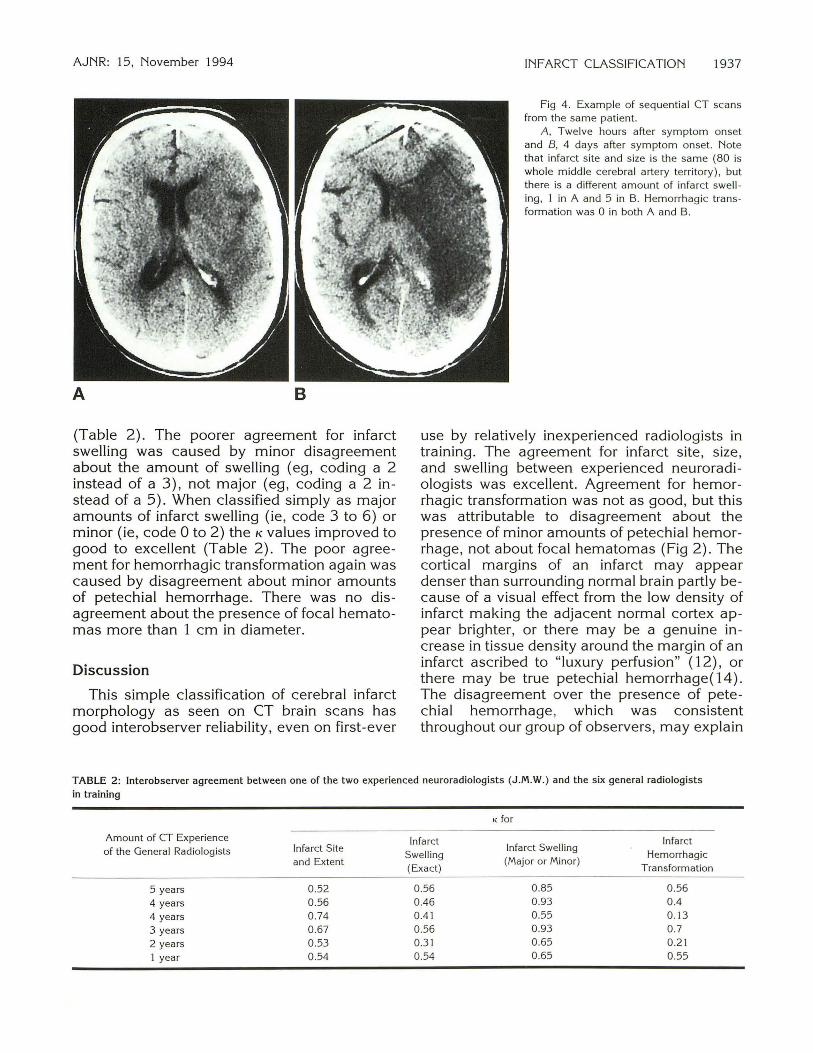
Fig 4 . Example of sequentia l CT scans from the same patient.
A, Twelve hours after symptom onset and B, 4 days after symptom onset. Note that infarct site and size is the same (80 is whole middle cerebra l artery territory) , but there is a different amount of in farct swell ing , 1 in A and 5 in B. Hemorrhag ic transforma t ion was 0 in both A and B.
use by relatively inexperienced radiologists in training. The agreement for infarct site, size, and swelling between experienced neuroradiologists was excellent. Agreement for hemorrhagic transformation was not as good, but this was attributable to disagreement about the presence of minor amounts of petechial hemorrhage, not about focal hematomas (Fig 2) . The cortical margins of an infarct may appear denser than surrounding normal brain partly because of a visual effect from the low density of infarct making the adjacent normal cortex ap pear brighter, or there may be a genuine increase in tissue density around the margin of an infarct ascribed to "luxury perfusion" ( 12), or there may be true petechial hemorrhage( 14). The disagreement over the presence of petechial hemorrhage, which was consistent throughout our group of observers, may explain
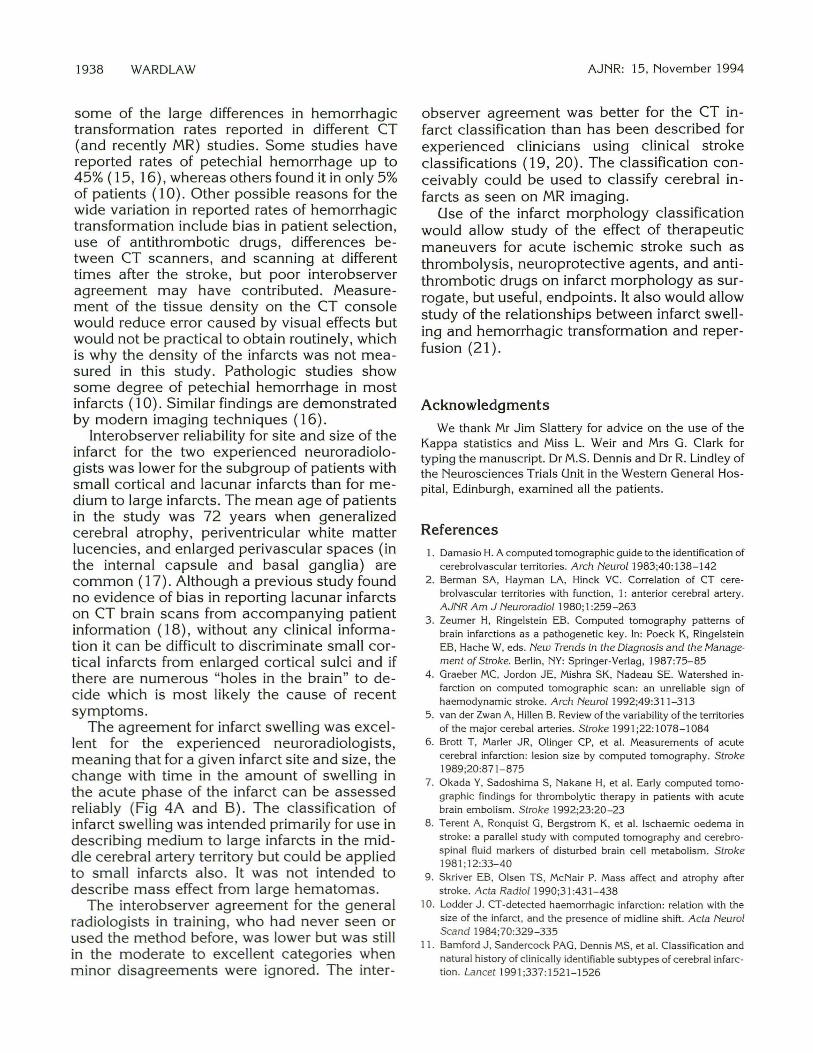
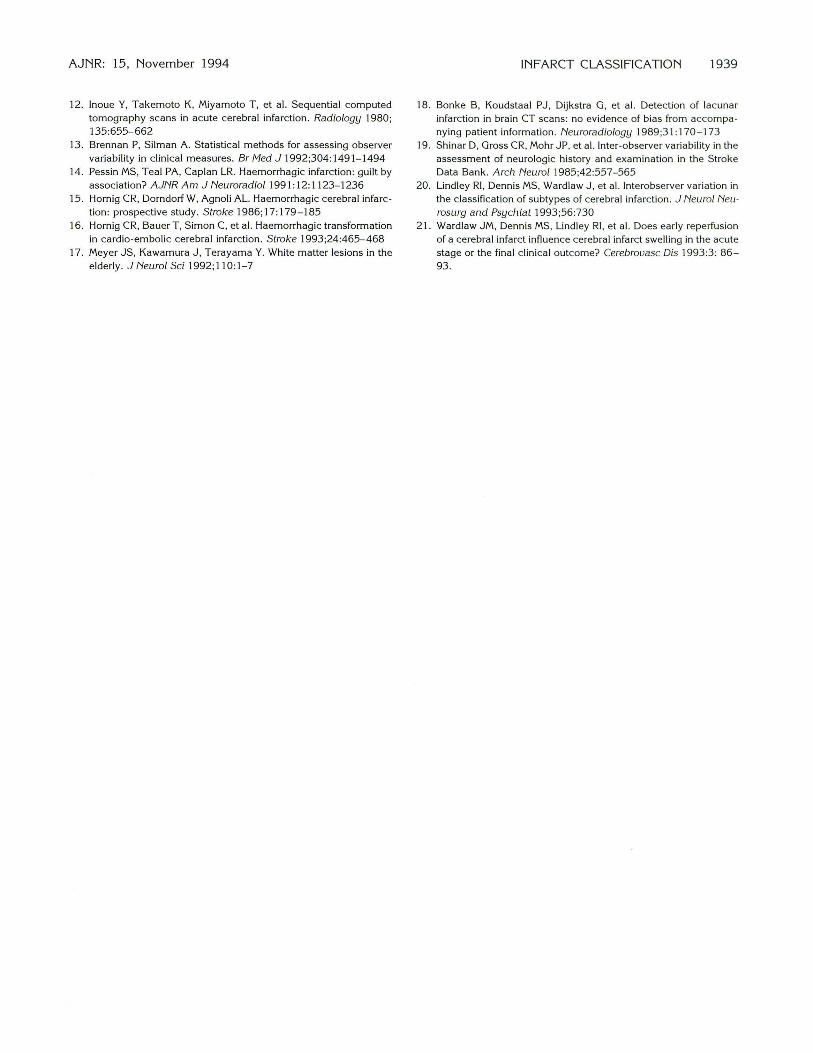
TABLE 2: Interobserver agreement between one of the two experienced neuroradiologists (J.M.W.) and the six general radiologists
in training
K for
Amount of CT Experience Infarct Infarct of the General Radiologists Infarct Site
Swelling Infarct Swelling
Hemorrhagic and Extent
(Exact) (Major or Minor)
Transformation
5 years 0.52 0.56 0.85 0.56
4 years 0 .56 0.46 0.93 0.4
4 years 0.74 0.41 0.55 0.13
3 years 0.67 0.56 0.93 0.7
2 years 0.53 0.31 0.65 0.21
1 year 0.54 0.54 0.65 0.55
1938 WARDLAW
some of the large differences in hemorrhagic transformation rates reported in different CT (and recently MR) studies. Some studies have reported rates of petechial hemorrhage up to 45% (15, 16), whereas others found it in only 5% of patients (1 0). Other possible reasons for the wide variation in reported rates of hemorrhagic transformation include bias in patient selection, use of antithrombotic drugs, differences between CT scanners, and scanning at different times after the stroke, but poor interobserver agreement may have contributed. Measurement of the tissue density on the CT console would reduce error caused by visual effects but would not be practical to obtain routinely, which is why the density of the infarcts was not measured in this study. Pathologic studies show some degree of petechial hemorrhage in most infarcts (1 0). Similar findings are demonstrated by modern imaging techniques ( 16).
Interobserver reliability for site and size of the infarct for the two experienced neuroradiologists was lower for the subgroup of patients with small cortical and lacunar infarcts than for medium to large infarcts. The mean age of patients in the study was 72 years when generalized cerebral atrophy, periventricular white matter lucencies, and enlarged perivascular spaces (in the internal capsule and basal ganglia) are common (17). Although a previous study found no evidence of bias in reporting lacunar infarcts on CT brain scans from accompanying patient information (18), without any clinical information it can be difficult to discriminate small cortical infarcts from enlarged cortical sulci and if there are numerous "holes in the brain" to decide which is most likely the cause of recent symptoms.
The agreement for infarct swelling was excellent for the experienced neuroradiologists, meaning that for a given infarct site and size, the change with time in the amount of swelling in the acute phase of the infarct can be assessed reliably (Fig 4A and B). The classification of infarct swelling was intended primarily for use in describing medium to large infarcts in the middle cerebral artery territory but could be applied to small infarcts also. It was not intended to describe mass effect from large hematomas.
The interobserver agreement for the general radiologists in training, who had never seen or used the method before, was lower but was still in the moderate to excellent categories when minor disagreements were ignored. The inter-
AJNR: 15, November 1994
observer agreement was better for the CT infarct classification than has been described for experienced clinicians using clinical stroke classifications ( 19, 20). The classification conceivably could be used to classify cerebral infarcts as seen on MR imaging.
Use of the infarct morphology classification would allow study of the effect of therapeutic maneuvers for acute ischemic stroke such as thrombolysis, neuroprotective agents, and antithrombotic drugs on infarct morphology as surrogate , but useful, endpoints. It also would allow study of the relationships between infarct swelling and hemorrhagic transformation and reperfusion (21).
Acknowledgments
We thank Mr Jim Slattery for advice on the use of the Kappa statistics and Miss L. Weir and Mrs G. Clark for typing the manuscript. Dr M.S. Dennis and Dr R. Lindley of the Neurosciences Trials Unit in the Western General Hospital, Edinburgh, examined all the patients.
References
1. Damasio H. A computed tomographic guide to the identification of cerebro lvascular territories. Arch Neural 1983;40: 138-142
2. Berman SA, Hayman LA, Hinck VC. Correlation of CT cerebrolvascular territories with function, 1: anterior cerebral artery. AJNR Am J Neuroradiol 1980;1:259-263
3. Zeumer H, Ringelstein EB. Computed tomography patterns of brain infarctions as a pathogenetic key. In: Poeck K, Ringelstein EB, Hache W, eds. New Trends in the Diagnosis and the Management of Stroke. Berlin, NY: Springer-Verlag , 1987:75-85
4. Graeber MC, Jordon JE, Mishra SK, Nadeau SE. Watershed infarction on computed tomographic scan: an unreliable sign of haemodynamic stroke. Arch Neural 1992;49:31 1-313
5. van der Zwan A, Hillen B. Review of the variability of the territories of the major cerebal arteries. Stroke 1991 ;22: 1078-1084
6. Brott T, Marler JR, Olinger CP, et al. Measurements of acute cerebral infarction: lesion size by computed tomography. Stroke 1989;20:871-875
7. Okada Y, Sadoshima S, Nakane H, et al. Early computed tomographic findings for thrombolytic therapy in patients with acute brain embolism. Stroke 1992;23:20-23
8. Terent A , Ronquist G, Bergstrom K, et al. lschaemic oedema in stroke: a paralle l study with computed tomography and cerebrospinal fluid markers of disturbed brain cell metabolism. Stroke 1981 ; 12:33-40
9. Skriver EB, Olsen TS, McNair P. Mass affect and atrophy after stroke. Acta Radio/1 990;31:431-438
10. Ladder J . CT-detected haemorrhagic infarction: relation with the size of the infa rct , and the presence of midline shift. Acta Neural Scand 1984;70:329-335
11. Bamford J, Sandercock PAG, Dennis MS, et al. Classification and natural history of clinically identifiable subtypes of cerebral infarction. Lancet1991;337:1521-1526
AJNR: 15, November 1994
12. Inoue Y, Takemoto K, Miyamoto T , et al. Sequential computed tomography scans in acute cerebral infarction. Radiology 1980; 135:655-662
13. Brennan P, Silman A . Statistical methods for assessing observer variability in clinical measures. Br Med J 1992;304:1491-1494
14. Pessin MS, Teal PA, Caplan LR. Haemorrhagic infarction: guilt by association? AJNR Am J Neuroradiol 1991:12:1 123-1236
15. Hornig CR, Dorndorf W, Agnoli AL. Haemorrhagic cerebral infarction : prospective study. Stroke 1986;17:179-185
16. Hornig CR, Bauer T , Simon C, et al. Haemorrhagic transformation in cardio-embolic cerebra l infarction . Stroke 1993;24:465-468
17. Meyer JS, Kawamura J , Terayama Y. White matter lesions in the elderly. J Neural Sci 1992;11 0 :1-7
INFARCT CLASSIFICATION 1939
18. Bonke B, Koudstaal PJ , Dijkstra G, et al. Detection of lacunar infarction in brain CT scans: no evidence of bias from accompanying patient information . Neuroradiology 1989;3 1: 170 - 173
19. Shinar D, Gross CR, Mohr JP, et al. Inter-observer va riability in the assessment of neuro logic history and examination in the Stroke Data Bank. Arch Neurol 1985;42:557-565
20. Lindley Rl , Dennis MS, Wardlaw J , et al. Interobserver variation in the classification of subtypes of cerebral infarction. J Neural Neurosurg and Psychiat 1993;56:730
21. Wardlaw JM, Dennis MS, Lindley Rl , et al. Does early reperfusion of a cerebral infarct influence cerebral infarct swelling in the acute stage or the final clinica l outcome? Cerebrouasc Dis 1993:3: 86-93 .