Embed Size (px)
Citation preview
N A S A TECHNICAL NOTE - N A S A TJ 1
D-5275
LOAN COPY: RETUtw IU AFWL (WLIL-2)
KIRTLAND AFB, N MEX A SIMPLE TECHNIQUE FOR AUTOMATIC COMPUTER EDITING OF BIODATA
br Ram Swaroop and Kenneth A. West
Compnting and Software, Inc. Field Team at FZight Research Center
and
Charles E. Lewis, Jr.
FZight Research Center Edwmds, Ca ZzF
N A T I O N A L A E R O N A U T I C S A N D S P A C E A D M I N I S T R A T I O N W A S H I N G T O N , D. C. J U N E 1969 B
i i
B
https://ntrs.nasa.gov/search.jsp?R=19690020214 2018-05-19T21:53:36+00:00Z
TECH LIBRARY KAFB, NM
I 111111 IIIII 11111 11111 IIIII 11111 llll11ll111 0332253
A SIMPLE TECHNIQUE FOR AUTOMATIC COMPUTER EDITING
OF BIODATA
By Ram Swaroop and Kenneth A. West
Computing and Software, Inc . Field Team at Flight Research Center
and
Char les E. Lewis, Jr.
Flight Research Center Edwards, Calif.
N A T I O N A L AERONAUTICS AND SPACE ADMINISTRATION
For sale by the Clearinghouse for Federal Scientific and Technical Information Springfield, Virginia 22151 - CFSTI price $3.00
A SIMPLE TECHNIQUE FOR AUTOMATIC COMPUTER EDITING
OF BIODATA
By Ram Swaroop and Kenneth A. West Computing and Software , Inc .
Field Team at Flight Research Center
and
Charles E. Lewis, Jr. Flight Research Center
SUMMARY
Before any data are statistically analyzed, it is always necessary to edit the data to some extent. must be performed by automatic means. the identification of observations which deviate markedly from the rest of the sample, commonly known as outliers. A simple statistical technique for identifying the outliers and the necessary computer program is presented in this report. The program re- quires as input only the data set, sample size, and preselected levels of significance at which outliers are to be identified. sample of size larger than two from a normal population. to illustrate applications of the described technique.
Furthermore, when large quantities of data are collected, the editing One common task in the editing process is
It is assumed that the data set is a random Two examples are presented
INTRODUCTION
The NASA Flight Research Center is engaged in an extensive research and develop- ment program aimed at advancing the state of the art in medical monitoring of humans in flight (ref. 1). flight than is collected under the sum of all other known flight programs. An effort of this magnitude depends entirely on the Flight Research Center's capacity for collecting, reducing, and analyzing these data by automatic means, including development of new techniques for accomplishing this work. No matter how sophisticated the monitoring, collection, and reduction systems, some editing of the biodata is required before they can be analyzed statistically.
Under this program, more biomedical information is collected in
The reduced biodata may contain observations that deviate markedly from the rest
An outlier may be subject to errors other than the
Most of
of the sample, o r from the trend of the data set. outlying observations , o r outliers. usual random fluctuations characterizing the population to which the data belong, o r
the statistical tests which are available to detect and decide whether an outlier is too
Such measurements are termed
I may merely occur too infrequently to be considered in a particular analysis.
rare to be acceptable are either too complex or too cumbersome for general application. One method suggested originally by Cramdr (ref. 2) is derived in this paper and its use demonstrated. This method was chosen because of its simplicity and easy applicability in editing biodata. A computer program for automatic editing was written in FORTRAN IV, based on Crame'r's suggestion. The input to the program is sample data, sample size, and a preselected level of significance. The data sample is either a set of obser- vations o r the deviations of the observations from a model, whichever is appropriate. Before testing the outliers, the program computes and prints the mean and standard deviation. After the test is performed, the data a re printed with each outlier identified by an asterisk. and printed, excluding the outliers. ferent levels of significance.
Then the mean, standard deviation, and sample size a re recalculated Four repetitions of the test may be made for dif-
Two examples are presented. In the first example the observations meet the assumption of random sample from a normal population. input data are deviations of the observations from a given model.
In the second example the
The program source listing, with instructions, and sample problems are presented in appendixes A to C. table of values (table I) is included.
For convenience in manual computations, a related probability
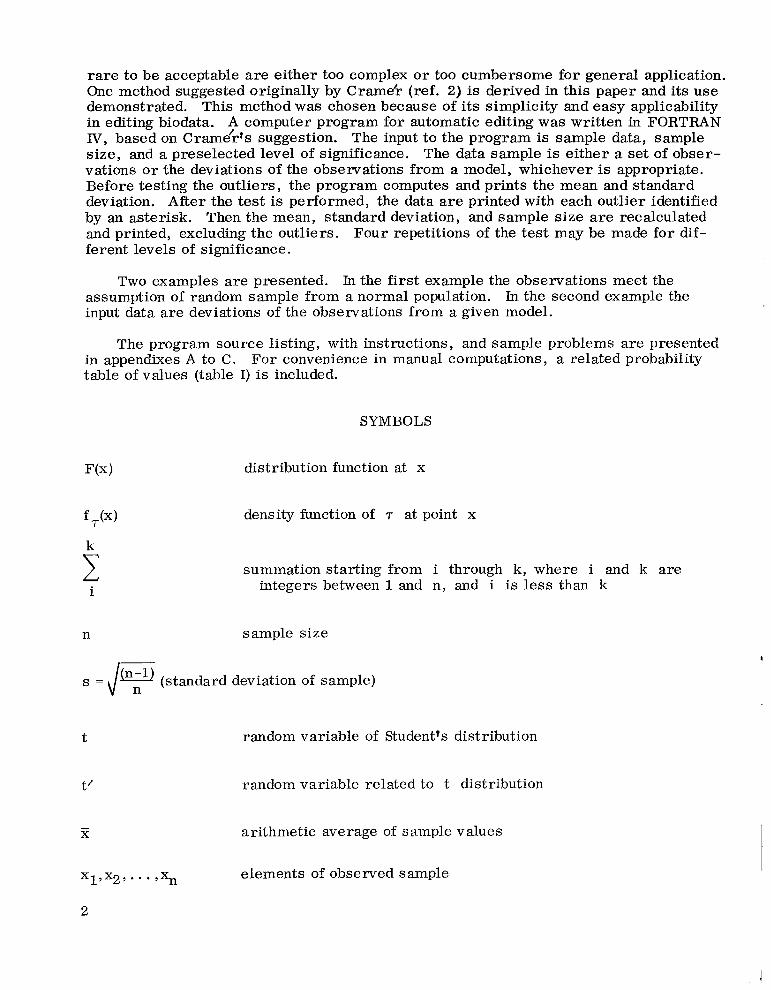
SYMBOLS
F(x) distribution function at x
f#) density function of T at point x
i
summation starting from i through k, where i and k are integers between 1 and n, and i is less than k
n sample size
s = ,/? (standard deviation of sample)
t random variable of Student's distribution
t' random variable related to t distribution
arithmetic average of sample values - X
x1,x2, - - - ,xn elements of observed sample
2
1
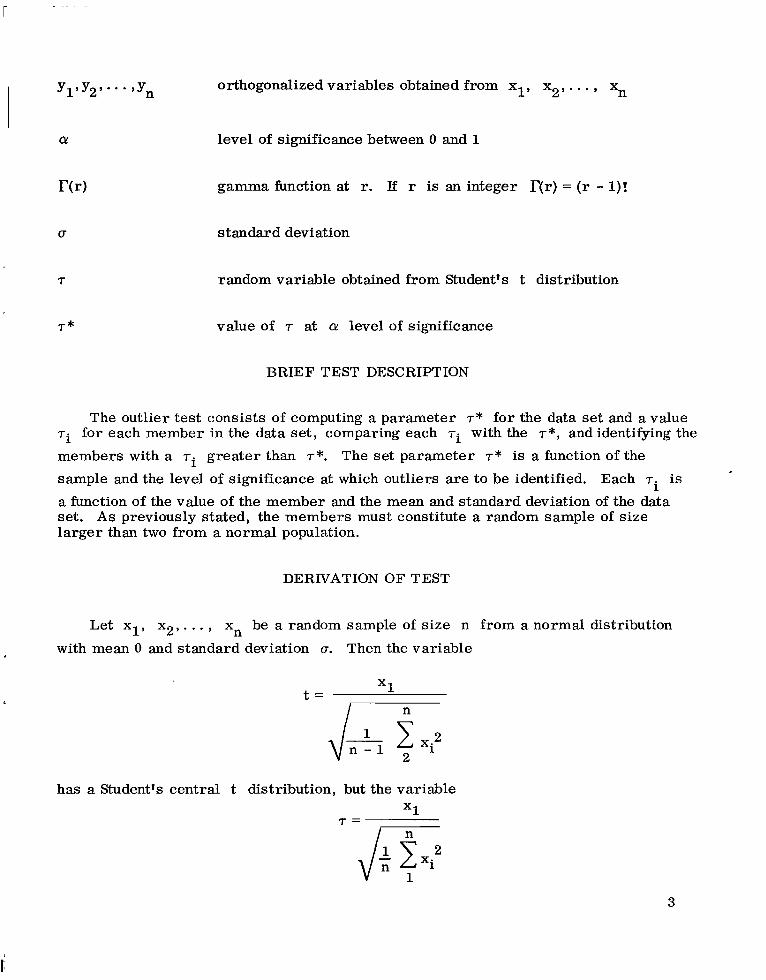
orthogonalized variables obtained from xl, x2, . . . , xn
level of significance between 0 and 1
gamma function at r. If r is an integer r(r) = (r - l)!
standard deviation
random variable obtained from Student's t distribution
value of 7 at a! level of significance
BRIEF TEST DESCRIPTION
The outlier test consists of computing a parameter T* for the data set and a value T~ for each member in the data set, comparing each T~ with the T*, and identifying the members with a T~ greater than T*.
sample and the level of significance at which outliers are to be identified. a function of the value of the member and the mean and standard deviation of the data set. A s previously stated, the members must constitute a random sample of size larger than two from a normal population.
The set parameter T* is a function of the Each T~ is
DERIVATION OF TEST
Let xl, x2 , . . . , x be a random sample of size n from a normal distribution n with mean 0 and standard deviation D. Then the variable
x1 t = I n
has a Student's central t distribution, but the variable x1
3
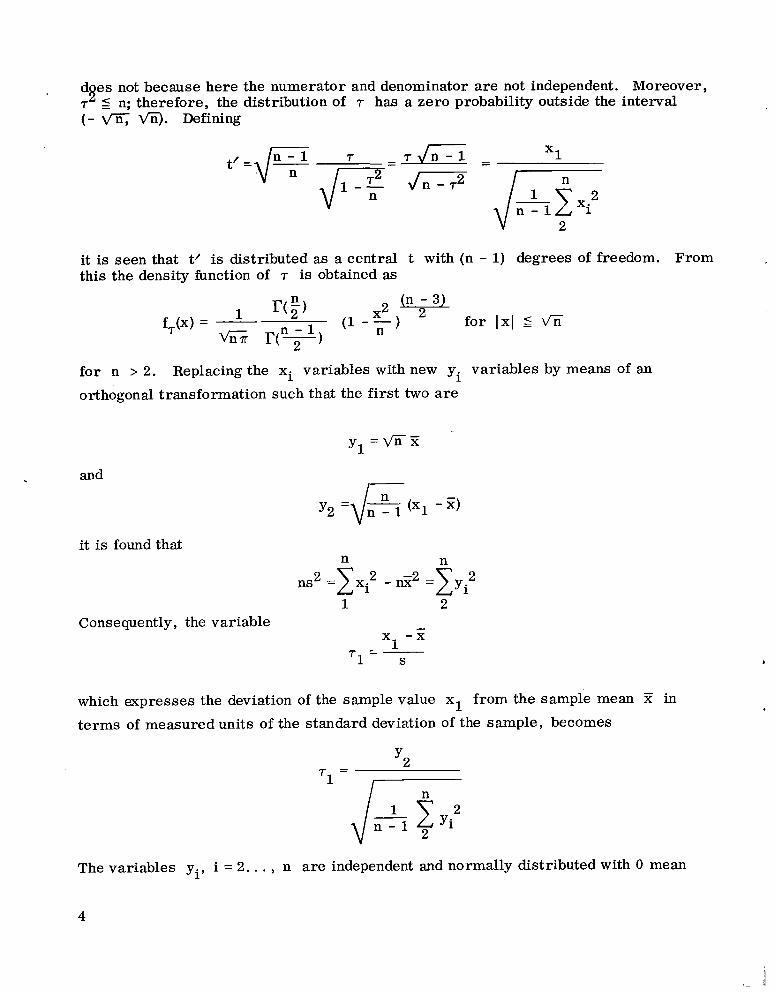
d es not because here the numerator and denominator are not independent. T 2 n; therefore, the distribution of T has a zero probability outside the interval (- a Vi$. Defining
Moreover, 2
v I n
it is seen that t’ is distributed as a central t with (n - 1) degrees of freedom. From this the density function of T is obtained as
for n > 2.
orthogonal transformation such that the first two are
Replacing the xi variables with new yi variables by means of an
and I
it is found that n n
1 2 Consequently, the variable -
x, - x I
T1 - S
which expresses the deviation of the sample value x1 from the sample mean I in terms of measured units of the standard deviation of the sample, becomes
I
The variables yi, i = 2. . . , n are independent and normally distributed with 0 mean
4
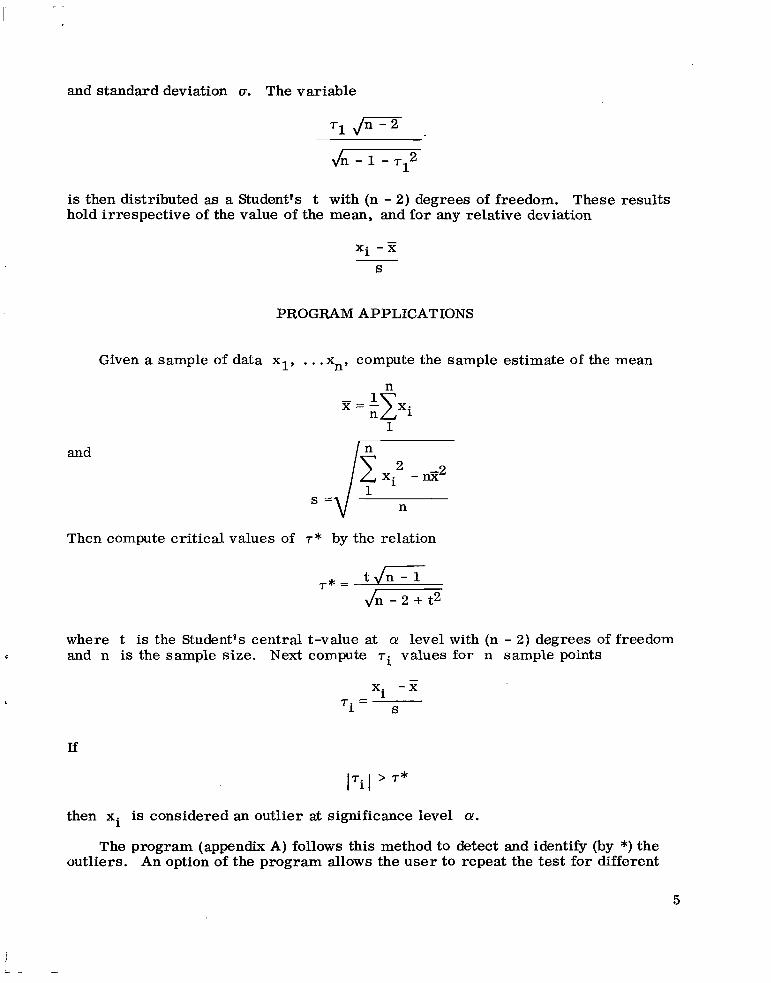
and standard deviation (T. The variable
is then distributed as a Student's t with (n - 2) degrees of freedom. These results hold irrespective of the value of the mean, and for any relative deviation
and
S
PROGRAM APPLICATIONS
Given a sample of data xl, . . .%, compute the sample estimate of the mean
n TI = - c x i 1
n 1
Then compute critical values of r* by the relation
where t is the Studentvs central t-value at a level with (n - 2) degrees of freedom and n is the sample size. Next compute 0 T~ values for n sample points
lf
then xi is considered an outlier at significance level a.
The program (appendix A) follows this method to detect and identify (by *) the outliers. An option of the program allows the user to repeat the test for different
5
levels of significance. The required input parameters are as follows:
1. Format of the data to be read.
2. The sample size n.
3. The significance level a values.
4. The data format is as specified.
The input procedure is completely described in the comments at the beginning of the source listing (appendix A).
EXAMPLES
Example 1
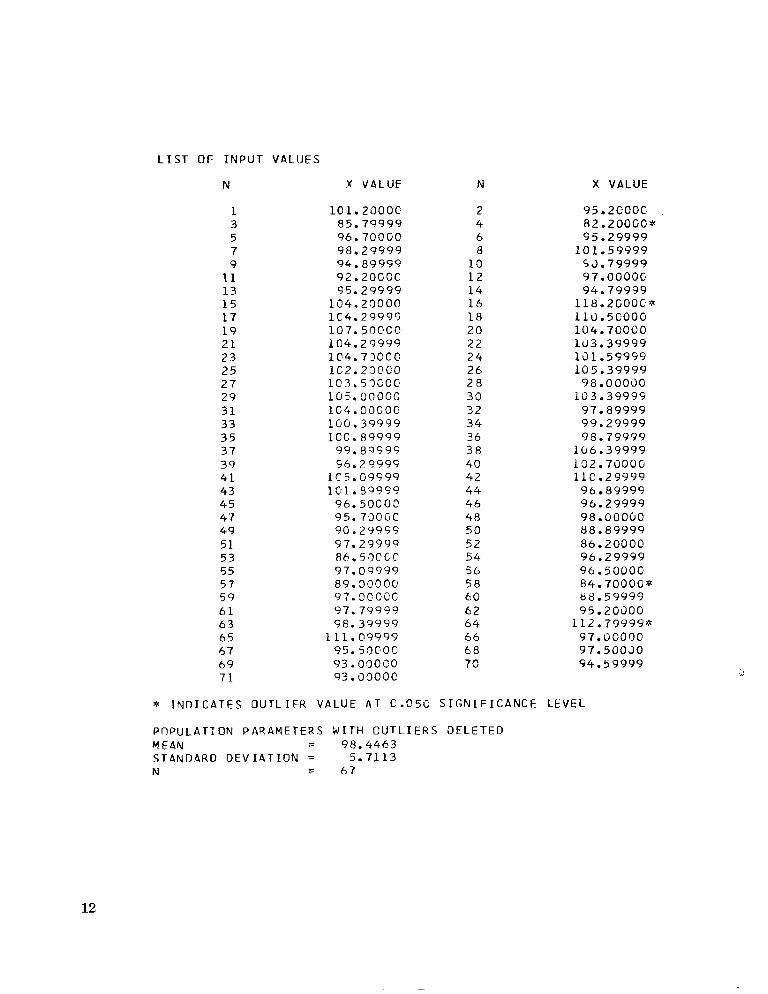
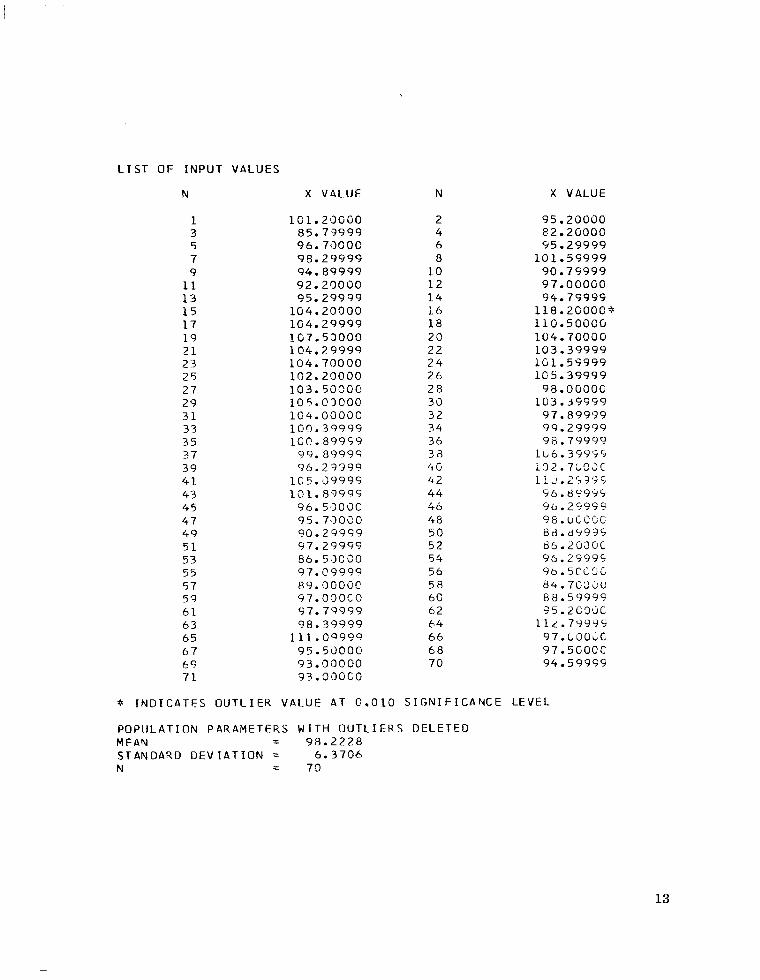
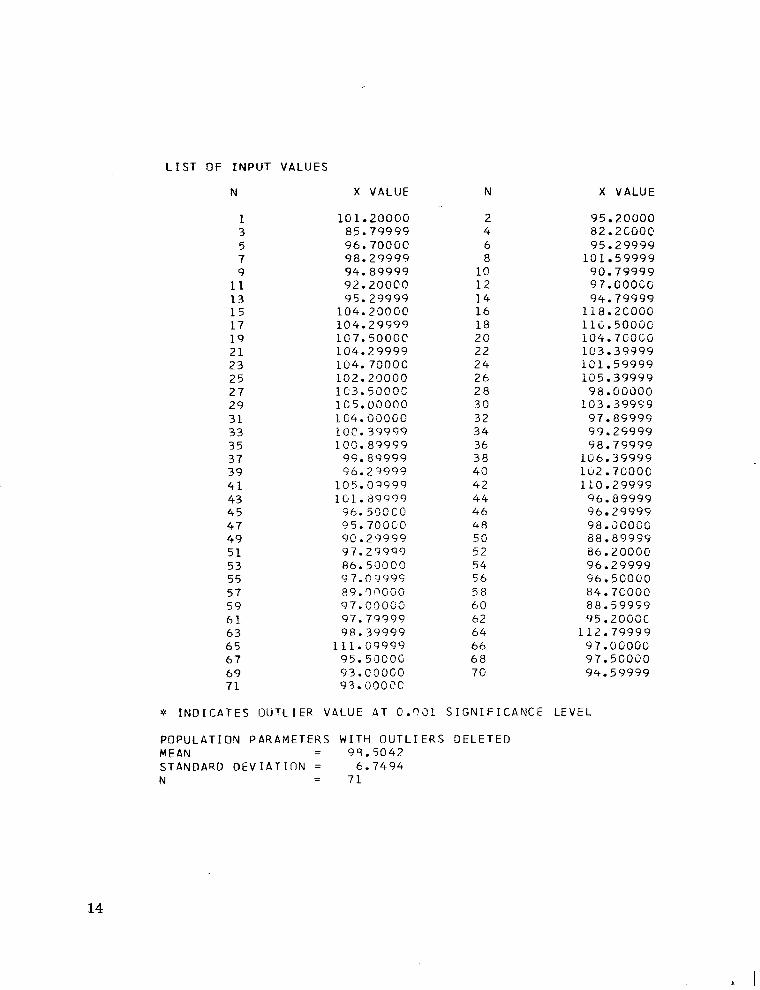
One-minute heart rates from a 71-minute flight piloted by a student pilot from the Aerospace Research Pilot School at Edwards A i r Force Base are used to illustrate the described method of editing for outliers. The heart rates in this example satisfy the assumption of random sampling from a normal population. The sample output, in- cluding the outliers marked by asterisks and the standard deviations, is shown in ap- pendix B. The results of the analysis are shown in the following table:
Significance level, percent 10 5 1 0 . 1 Original data
Reduced sample size 6 1 67 70 7 1 71 Standard deviation of reduced 4 . 5 9 3 5.711 6 . 3 7 1 6 . 7 4 9 6 . 7 4 9
sample
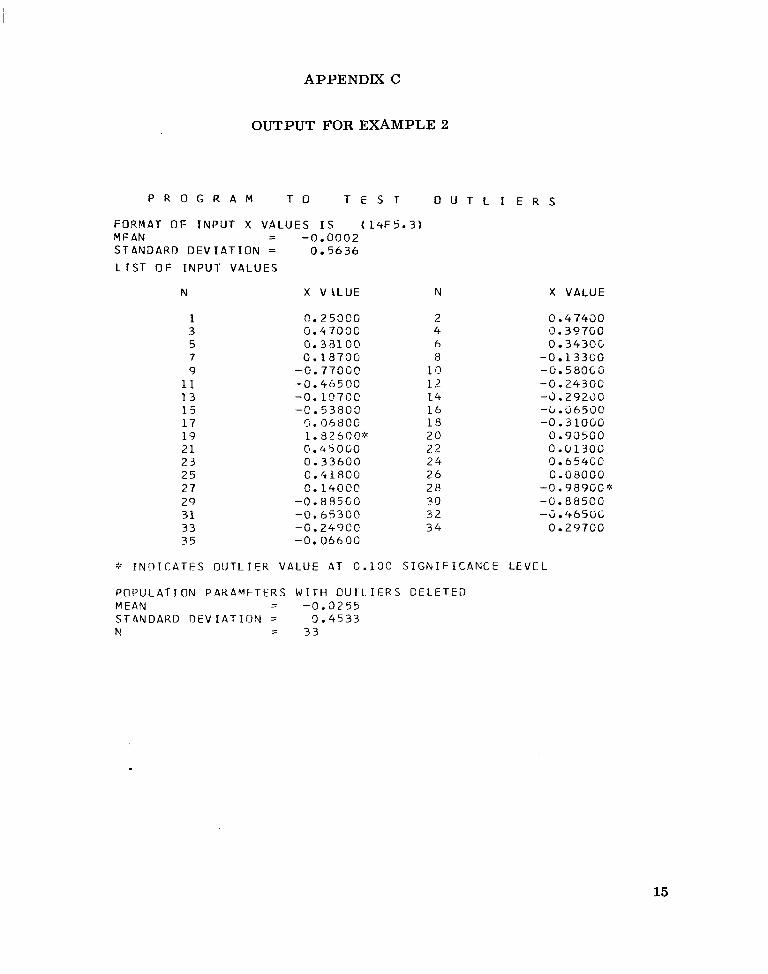
Example 2
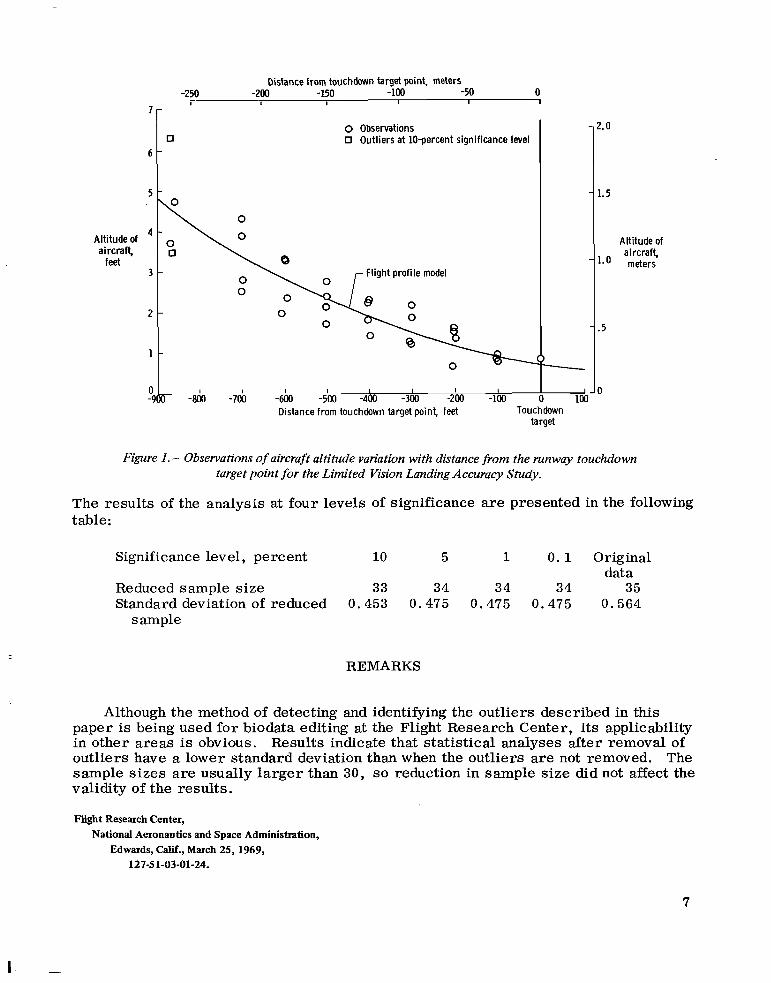
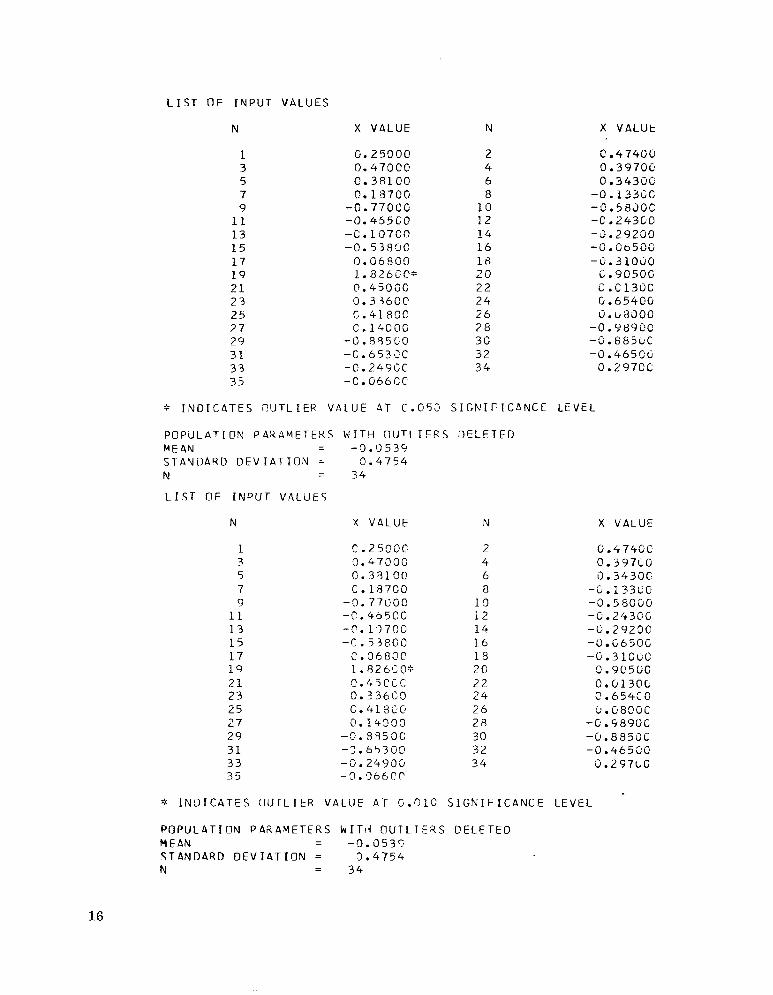
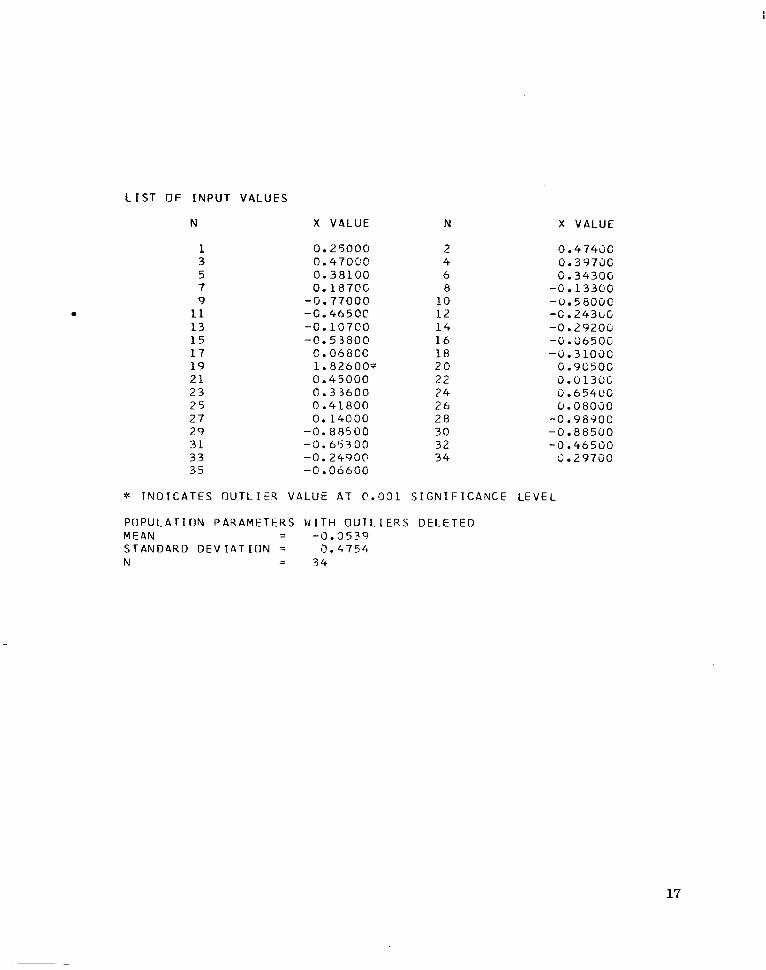
In this example the outlier editing program is used on a flight profile from the Limited Vision Landing Accuracy Study (commonly hown as "Cyclops") in progress at the Flight Research Center. The observations are the altitudes of the aircraft at fixed distances from the touchdown target point on the runway. The flight profile model is assumed to be a second-degree polynomial. The deviations of the observations from this flight profile are the inputs to this program. These deviations satisfy the require- ments of random sampling from a normal population. The computer output identifying outliers with asterisks is presented in appendix C. The flight profile and outliers are shown in figure 1.
1
6
7
6
5
4 Altitude of aircraft,
feet 3
2
1
0
0
Distance from touchdown target point, meters
I I I I I 1 -250 -200 -150 -100 -50 0
0 0
0 Observations 0 Outliers at lovercent significance level
\ o
- ,- Flight profile model
-do -7ab -& -5bo -4bo -3b -200 -1bo Distance from touchdown target point, feet Touc
I 1OC
lown
2.0
1.5
Altitude of aircraft,
1.0 meters
.5
0
target
Figure 1.- Observations of aircraft altitude variation with distance from the runway touchdown target point for the Limited Vision Landing Accuracy Study.
The results of the analysis at four levels of significance are presented in the following table:
Significance level, percent 10 5 1
Reduced sample size 33 34 3 4 Standard deviation of reduced 0 . 4 5 3 0 . 4 7 5 0 . 4 7 5 0
sample
0. 1 Original
3 4 35 475 0 . 5 6 4
data
REMARKS
Although the method of detecting and identifying the outliers described in this paper is being used for biodata editing at the Flight Research Center, its applicability in other areas is obvious. Results indicate that statistical analyses after removal of outliers have a lower standard deviation than when the outliers are not removed. The sample sizes are usually larger than 30, so reduction in sample size did not affect the validity of the results.
Flight Research Center, National Aeronautics and Space Administration,
Edwards, Calif., March 25,1969, 1275 1-03-01-24.
7
C C C C C C C C C C C C C C C C C C c C C C c C C C C C c C c C C C C C C C C c C C C C C C C C
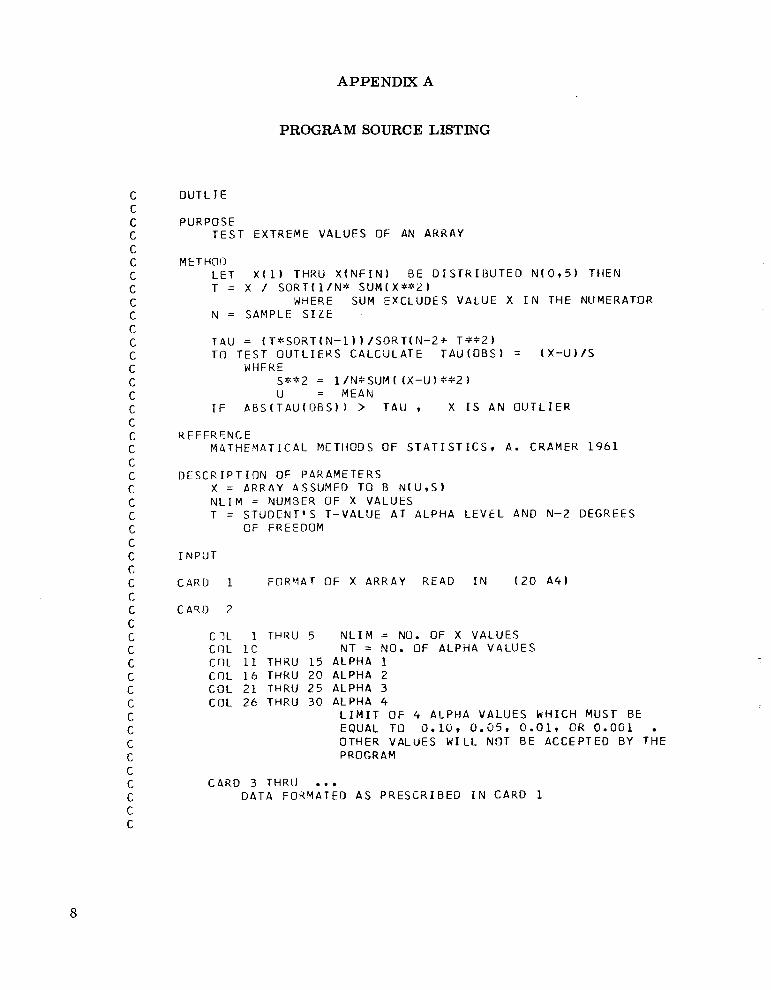
APPENDIX A
PROGRAM SOURCE LISTING
O U T L I E
PURPOSE T E S T EXTREME VALUES OF AN ARRAY
METHOD L E T X ( 1 1 THRU X f N F I N ) B E O i S T R I U U T E D N ( 0 ~ 5 ) THEN T = X / S O R T ( l / N * SUM(X** 'Z )
WHERE SUM EXCLUDES VALUE X I N THE NUMERATOR N = SAMPLE S I Z E
TAU = ( T ~ S O R T I N - l ) ) / S O R T ( N - 2 + T * * 2 ) i n T E S T OUTLIERS CALCULATE TAUIOBS) = ( x -u ) / s
WHERE S * * 2 = l / N * S U M ( ( X - U ) + * Z ) U = MEAN
I F L B S ( T A U ( f l R S ) I > T A U 9 X I S A N O U T L I E R
4 EFER FNC. E MPTHEMATIC,AL METHODS OF S T A T I S T I C S I A . CRAMER 1961
D E S C R I P T I O N OF PARAMETERS X = PRRAY ASSUMED TO B N ( U 9 S )
T = STUDENT'S T-VALUE AT ALPHA L E V E L AND N-2 DEGREES N L I M = NUMBER OF X VALUES
O F FREEDOM
I N P U T
CARD 1 FORMAT OF X ARRAY READ I N (20 A 4 )
CAQD 2
C ' 3 C 1 THRU 5 N L I M = NO. O F X VALUES C17L 1 c N T = NO. OF ALPHA VALUES Cr lL 11 THRU 1 5 ALPHA 1 COL 1 6 THRU 20 ALPHA 2 COL 2 1 THRU 2 5 ALPHA 3 COL 2 6 THRU 30 ALPHA 4
L I M I T O F 4 ALPHA VALUES WHICH MUST BE
OTHER VALUES W I L L NOT B E ACCEPTED BY THE PROGRAM
EQUAL TO 0.10. 0 . 0 5 r 0.01~ OR 0.001
CARD 3 THRlJ - DATA FORMATE0 AS PRESCRIBED I N CARD 1
C C C C C C C C C C
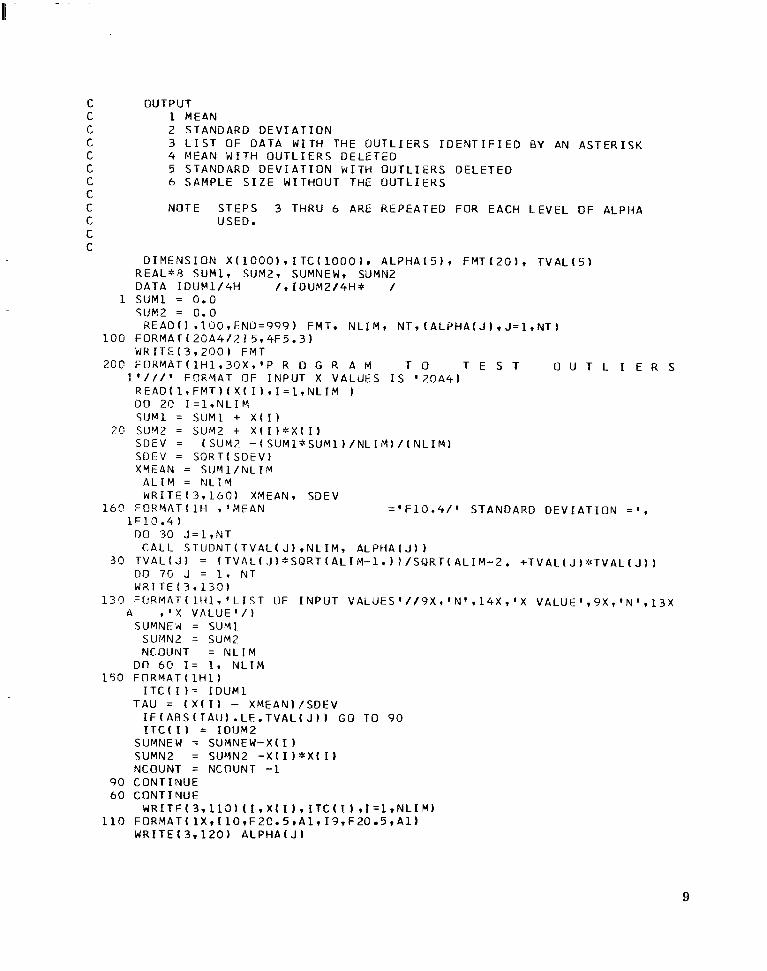
OUTPUT 1 MEAN 2 STANDARD D E V I A T I O N 3 L I S T OF DATA WITH THE O U T L I E R S I D E N T I F I E D BY AN ASTERISK 4 MEAN W I T H O U T L I E R S DELETED 5 STANDARD D E V I A T I O N WITH O U T L I E R S DELETED h SAMPLE S I Z E WITHOUT THE O U T L I E R S
NOTE STEPS 3 THRU 6 ARE REPEATED FOR EACH L E V E L OF ALPHA USED.
C C
D I M E N S I O N X ( 1 0 0 0 ) ~ I T C ( 1 0 0 0 l ~ A L P H A ( 5 ) r F M T ( 2 0 1 r T V A L ( 5 ) REAL*B SUM1r SUM29 SUMNEW, SUMNZ DATA I D U M 1 / 4 H / r I D U M 2 / 4 H * /
1 SUMl = 0.0 5UR2 = 0.0
R E A O ( 1 r l D 0 1 END=999 l F M T T N L I M r N T r ( A L P H A f J l T J = l r N T l 100 F O R M A T ( 2 C A 4 / 2 1 5 * 4 F 5 . 3 )
W R I T E ( 3 r Z O O l FMT 2GC F O R M A T ( l H l r 3 0 X r ' P R 0 G R A M T O T E S T O U T L I E R S
l ' / / / ' FflFiMAT OF INPUT X VALUES I S ' 2 0 A 4 l R E A D ( l r F M T ) ( X ( I ) r I = l r N L I M 1 00 20 I = l + N L I M S U M 1 = SUMl + X ( I I
S D E V = SDEV = SORTfSDEV) XMEAN = SUMl /NLTM
2 0 SUY2 = SUM2 + X ( I ) * X ( I I ( S U M 7 - ( S U M 1 * S U M 1 1 / NL I M 1 / ( N L I M 1
A L I M = N L I Y WRITE ( 3 9 160) XMEANr SDEV
16Q FORMAT ( 1 H + 'MEAN = ' F 1 0 . 4 / ' STANDARD D E V I A T I O N = ' r 1F10.4 1
DO 3c) J = l r Y T C A L L S T U D N T ( T V A L ( J ) r N L I M r A L P H A t J ) )
W R T T E ( 3 r 1 3 0 1 1 3 0 F O R M A T ( 1 H l r ' L I S T O F I N P U T V A L U E S ' / / 9 X r ' N 1 r 1 4 X T ' X V k L U E ' r 9 X r ' N ' , 1 3 X
A r ' X V A L U E ' / ) SUMNEN = SUM1
SUMNZ = SUM2 NCDUNT = N L I M
DD 6Q I = 11 N L I M 1 5 0 F n R M A T ( l H 1 1
I T C ( I ) = I D U M l
I F ( A R S ( T A U 1 .LE.TVAL( J ) 1 G O TO 90 I T C ( 1 ) = I O I J M Z
TAU = ( X ( 1 1 - XMEAN) /SDEV
SUMNEW = SUMNEW-X( I) SUMNZ = SUMNZ - X ( I ) * X ( I l NC.OUNT = NCnUNT -1
90 CONTINUE 60 CONTIlUUE
W R I T E ( 3 r l l O ) ( I r X I 1 ) . ITC(T. 1 ~ I = ~ T N L I M ) 110 FClRMAT( 1 X v I 1 0 r F 2 C . 5 r A l r I 9 r F 2 0 5 r A l l
W R I T E 1 3 . 1 2 0 ) A L P H A l J l
9
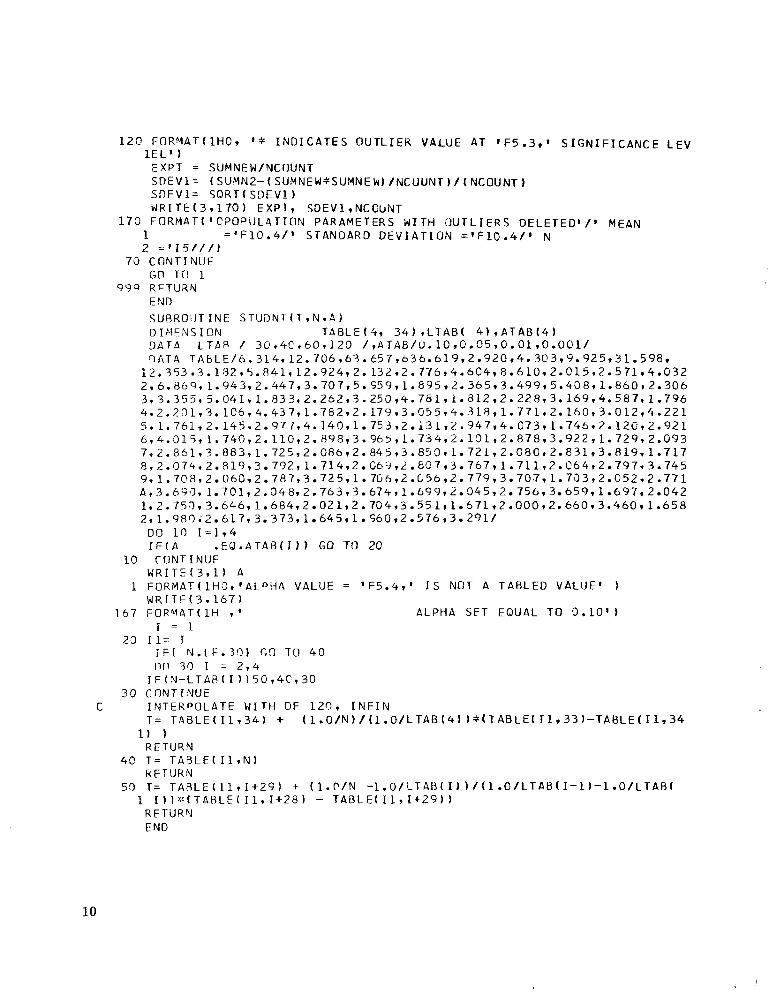
12F F O R M A T ( l H C 9 ' * I N D I C A T E S O U T L I E R VALUE AT 'F5.39' S I G N I F I C A N C E L E V 1 E L ' 1
EXPT = SUMNEW/NCflUNT S D E V l = ( S U M N 2 - ~ S U M N E W * S U M N E ~ ) / ~ C U U N T ) / ( N C O U N T ) SDFV1= S O R T ( S D E V l ) WR I T E ( 3 9 1 70 ) E XPT t SD EV 1 t NC QUNT
170 FORMAT( ' C P O P U L 4 T I O N PARAMETERS WITH O U T L I E R S DELETED' / * MEAN 1 = ' F 1 0 . 4 / * STANOARD D E V I A T I O N = ' F 1 0 . 4 / * N 2 = ' 1 5 / / / )
GO TO 1
END
7 3 CONTINUF
999 RFTURN
SUBROIJ'T I N E S T U D N T ( T i N . A ) O I M E N S I n N T A B L E ( 4 r 3 4 ) 1 L T A B ( 4 ) , A T A B ( 4 1 D A T A L T A R / 3 0 . 4 C 1 6 0 9 1 2 0 / t A J A B / U . l O ~ 0 . 0 5 ~ 0 . O l r 0 . 0 0 1 / D A T A TAHLE/6.314r12.7C6r63.6571636.619~2.920~4.303~~.925,31.598~
1 2 ~ 3 5 3 9 3 ~ 1 9 2 1 5 ~ A 4 1 1 1 2 ~ 9 2 4 1 2 . 1 3 L 1 2 ~ 7 7 6 1 4 ~ 6 0 4 1 ~ ~ 6 1 0 9 2 ~ 0 1 5 1 2 ~ 5 7 1 1 4 ~ 0 3 2 2 9 6 . 8 6 9 1 1.943,2.447r3.707~5.S599 1.895r2.365~3.499r5.408r 1 . 8 6 0 1 2 . 3 0 6 3 9 3 . 3 5 5 1 5 . 0 4 1 1 1 . 8 3 3 1 2 . 2 6 2 1 3 . 2 5 0 1 4 . 7 8 1 1 1 8 1 2 1 2 . 2 2 8 r 3 . 1 6 9 1 4 . 5 8 7 , l e 7 9 6 4 ~ 2 . 2 0 1 1 3 ~ 1 C 6 9 4 ~ 4 3 7 1 1 ~ 7 8 2 1 2 ~ 1 7 9 9 3 ~ 0 5 ~ 1 4 ~ 3 1 ~ 1 1 ~ 7 7 1 9 2 ~ 1 ~ 0 1 3 ~ 0 1 2 1 4 ~ 2 2 1 5 . 1 . 7 6 1 1 2 . 1 4 5 1 2 9 7 7 1 4 . 1 4 0 1 1 7 5 3 r 2 1 3 1 1 2 . 9 4 7 1 4 . 6 7 3 9 1 .7469 2 . 1 2 6 1 2 .92 1 69 4 . 0 1 5 1 1. .7401 2 . 1 1 0 1 2 . 8 9 8 1 3 . 9 6 5 7 1 7 5 4 1 2.131 7 2 . 8 7 8 9 3 . 9 2 2 9 1 . 7 2 9 9 2 . 0 9 3 7 1 2 . 3 5 1 t 3 . 8 8 3 7 1 . 7 2 5 1 2 086 1 2 8 4 5 1 3 . 8 5 0 1 1 7 2 1 1 2 . 0 9 0 1 2 . 8 3 1 1 3.819,1.7 1 7 81 2. G 7 4 1 2 8 1 9 9 3 7 3 2 1 1 7 1 4 1 2 669.2 SO7 r 3 7 6 7 v 1 7 1 1 12. (2649 2 . 7 9 7 1 3 . 7 4 5 9 9 1 . 7 0 8 9 2 0 6 0 7 2 7 8 7 1 3 7 2 5 1 1 70612 . L 5 0 12 7 7 9 9 3 7 0 7 r 1 . 7 5 3 1 2 . C T 2 1 2 e77 1 A 9 3 . h 93 1 1 7 @ 1 1 2.0 4 8 1 2 . 7 6 3 t 3 674 9 1 6 9 9 1 Z '345 't 2 75 6 1 3 5 5 9 t 1 6 97 9 2 0 4 2 1 9 2 . 7 5 3 1 3 . 6 4 6 1 1 6 8 4 1 2 0 2 l r 2 . 7 0 4 9 3 55 1 v 1 6 7 1 9 2 .0001 2 . 6 6 0 9 3 . 4 6 0 1 1 . 6 5 8 2 1 1.98Q i 2 6 1 7 1 3 3 7 3 1 1 6 4 5 t 1 560 t 2 5 7 6 1 3 2 9 1 /
DO 10 f = l r 4 I F ( A . E Q . A T A B ( I ) GO TO 20
10 CONTINUF W R I T E t 3 r l ) A
1 F O R M A T ( 1 H S v ' A L o H A VALUE = 'F5 .4 , ' I S NOT A TABLED VALtJE' ) WRITE ( 3 9 1 6 7 I
1 6 7 F O R M 4 T I l H 1 ' ALPHA SET EQUAL TO 9 . 1 0 ' ) 1 = 1
J F ( N . L F . 3 9 ) GO TO 4 0 ZL) I ? = J
DP 3; ) I = 2 7 4 I F ( N - L T A B ( 1 ) 1 5 0 r 4 C . 3 0
3 0 C n N T r N U E C INTERPOLATE WITH O F 1 2 0 1 I N F I N
T = T A B L E ( I l r 3 4 ) + ~ 1 ~ O / N ~ / ~ l ~ O / L T A B ~ 4 ~ ~ e ( T A B L E ~ T L I 3 3 ~ ~ T A 6 L E ~ I l t 3 4 1) 1
R E TURN
kFTURN 4 0 T = T A B L E ( I l * N )
50 T = T A R L E ( I L 9 1 + 2 9 ) + ( l . P / N - 1 . O / L T A H ( I ) ~ / ( 1 . O / L T A B ( I - l ~ ~ l ~ O / L T A B ( 1 I I ) U I T A B L E ( I l v I + 2 8 ) - T A B L E ( I l r I + 2 9 ) )
R F TU R hJ END
10
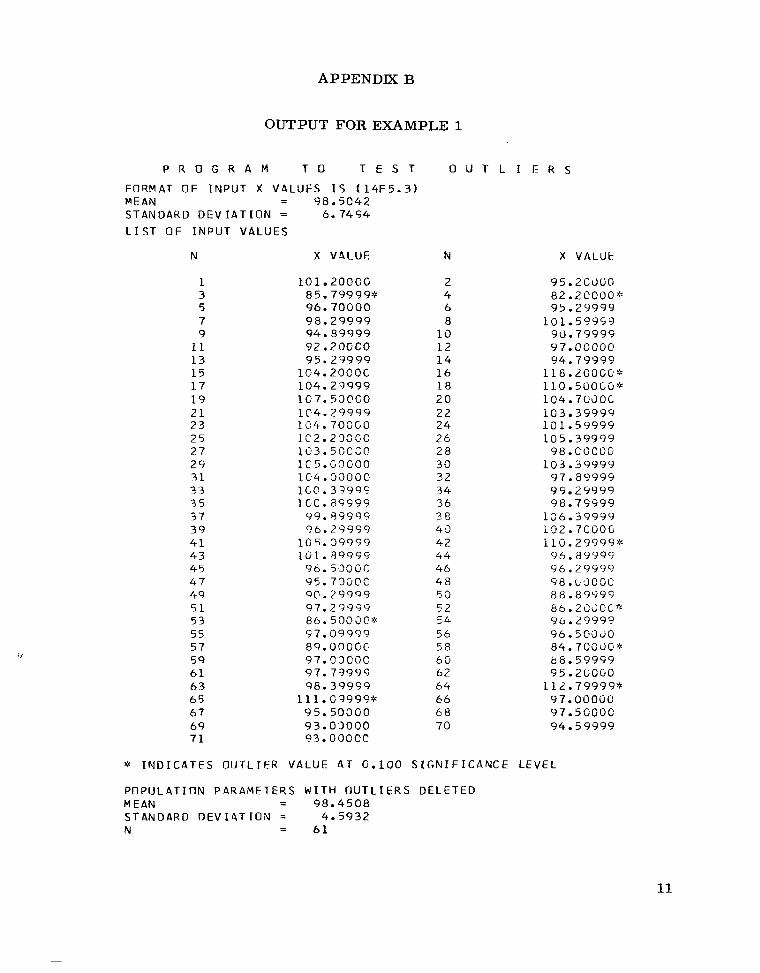
APPENDIX B
OUTPUT FOR EXAMPLE 1
P R O G R A M T O T E S T O U T L I E R S
FORMAT O F I N P U T X VALUES I S (14F5.33 MEAN = 98.5042 STANDARD D E V I A T I O N = 6.7494 L I S T OF I N P U T VALUES
N X VALUE N X VALUE
1 3 5 7 9
1 1 13 1 5 17 19 21 23 25 27 29 31 3 3 35 37 39 41 4 3 45 47 49 5 1 53 55 5 7 59 61 63 65 67 69 71
10 1 20000 85.79999* 96.70000 98.29999 94.89999 92.2OGCO 95.29999 lG4.2OCOC 104.27999 1C7.50CCO lC4.29994 lC4.700GO lC2.23GGO lO3.50CSC 1C5.GOG00
1 C O . 39999 1 CC. 89999 99.89999 36.2 9999
105.09939 101.59990 96.500GC 95.7QCJOC 90.79999 97.21999 86.500dC* 97.0399Q 89. O O O G C 97.0300C 97.73999 98.39999
11 1. C9999* 95.50000 93.03000 93. OGOCC
1 C 4 . GOOGC
2 4 6 8
10 12 14 16
20 22 2 4 26 28 30 32 34 36 3 8 43 4 2 4 4 46 48 50 52 5 h 56 58 6 0 62 64 06 6 8 70
ia
95.ZCUOO 82*2C000* 95.29999
101.59949 90.79999 97. OOCDO 94.79999
118 .LOOGO* 110 5 U O C G * 104.7CdOC 103 39999 10 1.59999 105.39999 98.COCOO 103.39999 97.89999
98.79999 106.39999 132.7COOG 110.29999* 96.8939'7 96.29999 98 . L , J O O C
66.2CdOC*
96.503dO 84.70GJC*
95.2UOOO 112.79999*
9 9 2 5999
88.895199
96.29990
68.59999
97.0OOCJO 97.50000 94.5 9399
8 TNDICATES OUTLIER VALUE A T 6.100 S I G N I F I C A N C E LEVEL
PnPlJLATION PARAMETERS W I T H O U T L I E R S DELETED
STANOARD DEV 1 4 T I O N = 4.5932 N = 61
MEAN = 98.4508
11
L I S T O F I N P U T VALUES
N X VALUF
1 3 5 7 9
I 1 13 15 17 19 21 23 25 27 29 31 33 35 37 39 41 43 45 47 49 51 5 3 55 57 59 61 63 65 47 69 71
101.2000c 85.79999 96.70000 98.29999 94.89999 92.20GOC 95.29999
104.20000 lC4.29999 107.500CC 104.29999 1c4.7~0Co lC2.23OC0 1 0 7 . 5 ' l C O C 105. coooc lG4.C17COC 100.39999 1cc. 89999 99.89999 46.2 0999
lC'1.93990 96.50COC 95.7300c 9G. 29999 97.2999'7 8 6 . 5 3 C C C 97.09999 89.30000 47.occcc 97.79999 98.39999
111.09999 95.59COG 93. O O O C O 93.03000
I C 5.09999
N
2 4 6 8 10 12 14 16 18 20 22 2 4 26 28 3 0 32 34 36 38 4c 42 44 46 48 50 52 54 56 5 8 60 02 64 66 68 7c
X VALUE
95.2COOO
9 5.2 9999 10 1.59399 53.79999 97. OOOOC. 94.79999 118.2000Ct 11 0.5COOO 104.700OG 1u3.39999 101.59999 10 5.39999 98. 0COC)O 10 3.34999 97.89999 99.29999 98.79999
106.39999 102.7OOOO 11 0.2 9999
96.29999 98.00000 88.89999 86.2000@ 96.2 9999 96.5000G 84.7OOOO* 88.59999 95.2G300
112.79999* 97. 0000G 97.5GOG0 94.59999
82.20000+
96 89999
* I N D I C A T E S O U T L I E R VALUE AT C.050 S I G N I F I C A N C E LEVEL
P n P U L A T T U N PARAMETERS W I T H O U T L I E R S DELETED MEAN = 08.4463 STANDARD DEV I A T I O N = 5.71 13 N = 67
12
L T S T O F I N P U T VALUES
N X VALUE N X VALUE
1 3 5 7 9
11 1 3 1 5 17 1 9 2 1 2 3 25 27 29 3 1 33 35 37 39 41 43 45 47 4 9 5 1 53 55 57 5 3 6 1 6 3 65 67 6 9 7 1
1 G1.200GO 8 5 . 7 3 9 9 9 96.71)GOC
9 4 . 8 9 9 9 9 9 2 . 2 0 0 0 0 9 5 . 2 9 9 9 9
1G4.20000 1 0 4 . 2 9 9 9 9 1O7.53000 1 0 4 . 2 9 9 9 9 104.7OOOO 1 0 2 . 2 0 0 0 0 103.50COO 1 0 5 . c 3 0 0 0 104 . 0000C 1 0 9 . 3 9 9 9 9 LCC. 8 9 9 9 9
9 9 . 8 9 9 9 9 9 6 . 2 9 3 9 9
1G5.39999 10 1 . 8 9 9 9 9
96.53GOC 95.711000 90.2 9 9 99 9 7 . 2 9 9 9 9 8 6 . 53CC0 9 7 . c 9 9 9 9 R 9.9 0 0 0 C 9 7.0 0 0 C 0 9 7 . 7 9 9 9 9 9 8 . 3 9 9 9 9
1 1 1 . 0 9 9 9 9 9 5 . 5 d 0 0 0 9 3 . O O O G O 93.030'20
9 8 . 2 9 9 9 9
2 4 6 8
1 0 1 2 14 16 1 8 20 22 2 4 26 2 8 3 0 32 3 4 36 3 8 4 G 4 2 4 4 4 6 48 5 0 52 5 4 5 6 5 8 60 62 6 4 6 6 6 8 7 0
95 .20000 P2.20000 5 5 . 2 9 9 9 9
10 1 . 5 9 9 9 9 9 0 . 7 9 9 9 9 97.000C.O 94 .79999
118.2COO@* 11 0.50OOci
103 .39999 1 G 1 . 5 9 9 9 9 1C 5 . 3 9 9 9 9
104.700OG
98.0000G 103 e39999
9 7 . 8 9 9 9 9 99 .2 9 9 9 9 9 8 . 7 9 9 9 0
1 ~ 6 . 3 9 9 4 5 L32.7L'JZC 1 1 2.2 '7 3 5 c,
9 6 . dC'9'14 4 6 . 2 5 9 9 9 9 8 . UC.CGC: 8 d . d 4 9 3 5 8 6 . 2 0 3 0 C 9 6 . 2 3 9 9 4 9 b . 5 C i 3 c 8 4 . 7 0 3 2 u 8 8 . 5 9 9 9 9 9 5 . 2 C 3 9 C
l l ~ .7999cj 97.bOOCC 97.5GO0C 9 4 . 5 9 9 9 9
* I N D I C A T E S O U T L I E R VALUE AT 0 . 0 1 0 S I G N I F I C A N C E LEVEL
P O P l l L A T I O N PARAMETERS W I T H O U T L I E R S DELETED MEAN = 9 8 . 2 2 2 8 STANDARD D E V I A T I O N = 6 . 3 7 0 6 N = 7 0
13
L I S T DF I N P U T VALUES
N X VALUE
1 3 5 7 9
11 13 15 17 19 21 23 25 27 29 31 33 35 37 39 41 43 45 47 49 51 53 55 57 59 h l 63 65 67 69 71
10 1.20000 85.79999 96.700GO 98.23999 94.89999 92.20000 95.29999 104.290CC 104.29999 1C7.5000C 104.29999 104. 7000C 102.20000 1C3.5OOOC 1 C5.00000 l G 4 . OOOGO 1OC. 39909
99.89999 96.21999
105.03999 101. d9Q99
9 6 . 5 3 C C O 95.7C)OEO 90.29999 97.29999 86.50OCO 9 7. (? 3995 R9.3i’GGG 97. C ‘ l O C O 97.7999s 98.39999
111.09999 95.5000G 93. COOCG 93 .3002C
lCC. 89999
N
2 4 6 8
10 12 14 16 18 20 22 2 4 26 28 30 32 3 4 36 38 40 4 2 44 46 48 5G 52 54 56 58 60 62 64 66 68 7G
X VALUE
95 20000 82.2COOC 95.29999 10 1 59999 90.79999 97.000CG 94.79999
118.2COOG 110.5OOdC 104.7GOGG 103.39399 L01.59999 105.39999 98 .OOOOG 103.39999 97.89999
(38.79999
1U2.7COOO 11 0.29999 96.89999 96 29999 98.3COCC 88.89999 86 .ZOOGO 96.29999 96.50000 84.7COOC 88.59999 95.2GOCC
97.GOOGO 97.50030 94.59999
99.29999
lU6.35999
112.79999
* I N D I C A T E S OUTLIER VALUE AT 0.3C1 S I G N I F I C A N C E LEVEL
POPULATION PARAMETERS WITH O U T L I E R S D E L E T E 0 MEAN = 99.5042 STANDARD OEV I A T I O N = 6.7494 N = 71
14
APPENDIX C
OUTPUT FOR EXAMPLE 2
P R 0 G R. A M T O T E S T O U T L I E R S
FORMAT O F I N P U T X VALUES IS (14F5.3) - MEAN - STANDARD D E V I A T I O N = L I S T O F I N P U T VALUES
N
1 3 5 7 9
11 13 15 17 19 21 2 3 25 27 29 31 33 35
-0.0002 0.5636
X VALUE
0.250CO 0.4700C
0.18700 -0 .7700C -0.46502 -0.107CC -C. 53800
r;. O h d 0 0 1.8260C* 0.450GO 0. 33600 0.41800 0.14OCC
-0.8R5CO -0.65300 -0.249CC - 0 . 0 6 6 0 0
0.381 0 0
N
2 4 6 8 19 12 14 16 18 20 2 2 24 26 28 30 3 2 34
X VALUE
0.474ilO 0 . 3 O 7 t i O 0 34306
- 0 13300 -0.5 e o ~ s -0 .24300 -3.29230 -6.0650C -0.3 lOG0
0 . 9 9 5 0 0 0.01300 rJ 6 5 4 0 0 0.98000
-0.989iiC* -0.885CC -6 .465UC C 29700
* I N D I C A T E S O U T L I E R VALUE AT C.1OC S I G N I F I C A N C E LEVEL
POPULATION PARAMETERS W I T H O U T L I E R S DELETED MEAN = - 0 . 0 2 5 5 ST4NDARD D E V I A T I O N = 9.4533 M = 3 3
15
L I S T O F I N P U T VALUES
N X VALUE N X V A L U t
1 3 5 7 9
1 1 13 15 17 19 2 1 2 3 2 5 27 29 3 1 3 3 3 5
G . 2 5 0 0 0 0 . 4 7 O C C C. 381 G O I?. 13700
-G. 770CG - 0 . 4 5 5 2 ~ 7 -c. i o 7 c n -c. 5 3 8 3 0
0 . 0 6 9 0 0 1.826CC'!= 0.4500O 0.3 4 6 O C G.418CC C.14C0G
- 0 . R55G0 -t.65382C - C . 249GC - C . 366CC
2 4 6 8 10 12 14 16 18 2 0 22 2 4 2 6 2 8 3 c 32 34
c.47400 0.397GO 0 . 3 4 3 0 6
-0.1332c -C.583OC - C .243(;.0 -3 .29200 - 0 . C b S O G - 0 . 3 1 O U G
c. 5050G C.Cl3OC G .654OG 0 . ~ 1 8 0 0 0
-0.989QG u. 685bC
-0 .46520 G.257OC
- ,-
t I N D I C A T E S O!JTLIER VALUE AT C . 0 5 3 S I G K I F I C 4 N C E LEVEL
P O P U L A T I O N PASAYETEKS W I T H flUTL1ER.S DELETED MEAN - - 0 . 'J 5 3 cj
STANOAQD D E V I A T I O N = 3 . 4 7 5 4 N = 3 4
L I S T OF INPUT VALUE5
-
N X VALUE N X VALUE
1 3 5 7 9
1 1 13 1 5 17 19 21 23 25 27 29 31 3 3 35
* I N D I C A T E S O U T L I E R
C.25OOC. 0 . 4 7 0 3 0 G. 3?10@ C. 1 R 7 C O
- 9 . 7 7 0 0 0 - c . 405C.G - C . 13703 -c . 5 3 8 G c
c . 3689C 1.826';@* 2 . 4 5 c i c 0.336OO C.41800 E. 14'709 L.. R350C
- 3 . 6 5 3 C D -0 .2 /+905 -fl Ll. 0 6 6 C C
2 4 6 8
1 9 1 2 14 1 6 1 8 2 0 22 2 4 26 2 8 30 3 2 3 4
Ci.474GC 0 .397 iG 9 .34306
-C. 1 3 3 0 0 -0 .5 8 0 5 0 -9 .24306 -0 .29230 -9 C650G -c.. 3 l 0 c i C
0 . W5UO C eO13OC 2.654CC 0.6800C
-6.4890C -0.8850C -0.46 5 20
cj.297bG
VALUE AT C . C l C S I G N I F I C A N C E LEVEL
POPULATION PARAMETERS h I T d OUTLTEXS D E L E T E 0 MEAN - - 0 . 0 5 3 9 TTANDPRD D E V I P T I O N = 3 . 4 7 5 4 N = 3 4
-
16
L I S T O F INPUT V4LUES
N
1 3 5 7 9
1 1 1 3 15 17 19 2 1 23 2 5 2 7 2 9 3 1 33 35
X VPLUE
0 . 2 5 O O O 0.470c0 0.38100 O.ld70G
-0.46500 -0.10700 - c . 5 3 8 0 0 0.06800
0.45000
-0.77000
1.8260OS
C . 3 3 6 0 0 0.4L800 0 . 14000
- 0 . 8 8 5 0 0 -0.65300
-0.066GG -0.249GO
N
2 4 6 8
1 0 1 2 14 16 1 8 2 0 2 2 24 2 6 2 8 30 32 34
X VALUE
0.4 743c 0.397GC 0.3430G
- G 13300 - 0 5 8000 -C .243~rc. -0.2920U -0.0650C -0.3 103c
0.9050G O.Ul30C 6.65400 U. 08030
-0.9830C
-0.465OG - 0 8 8 5 0 0
6 297OC
* TNDICATES O U T L I E R VALUE AT C.031 S I G N I F I C A N C E LEVEL
POPULATION PARAMETERS W I T H O U T L I E R S DELETED MEAN - - -0.353Q STANDARD DEV I A T I O N = 0.4754 N = 34
17
REFERENCES
1. Roman, James: Long-Range Program to Develop Medical Monitoring in Flight. The Flight Research Program - I. Aerospace Medicine, vol. 36, no. 6, June 1965, pp. 514-518.
2. CrameG, Harald: Mathematical Methods of Statistics. Princeton University Press , 1961, pp. 240, 390.
18
-fi
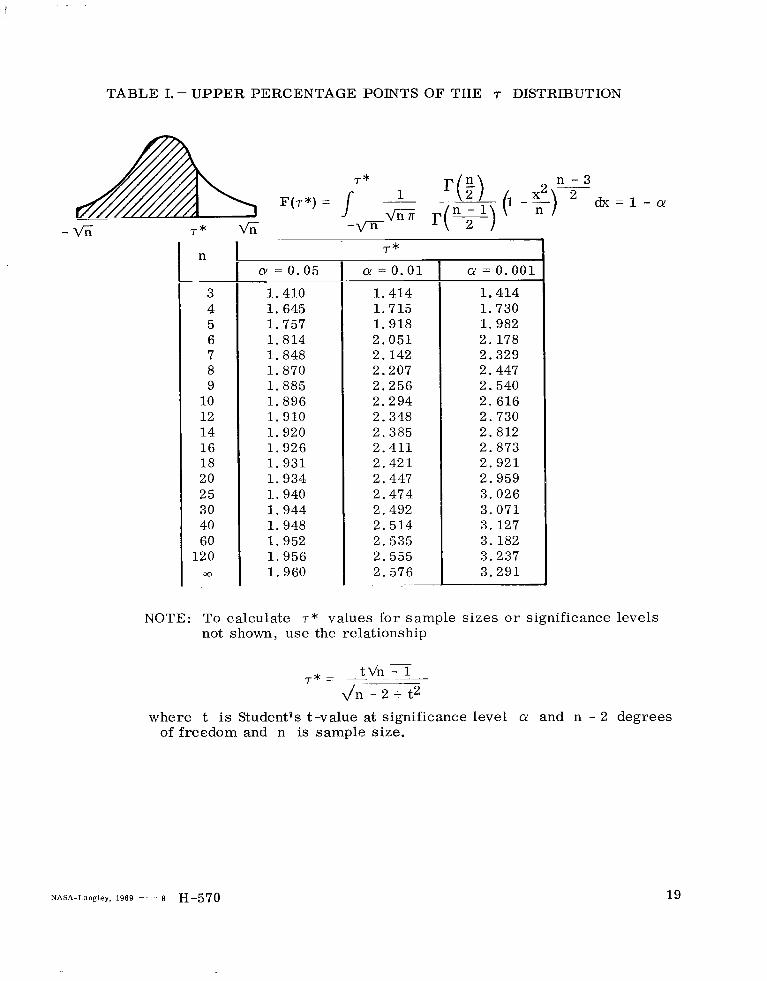
TABLE I.- U P P E R PERCENTAGE POINT§ OF THE T DISTRIBUTION
~~
n
3 4 5 6 7 8 9
10 12 14 16 18 20 25 30 40 60
120 X I
CY = 0 .05
1.410 1.645 1.757 1.814 1 .848 1.870 1 .885 1.896 1.910 1.920 1 .926 1 .931 1.934 1.940 1 .944 1.948 1.952 1.956 1.960
T*
a! = 0 . 0 1
1.414 1.715 1.918 2 .051 2.142 2.207 2.256 2 .294 2.348 2.385 2 .411 2 .421 2.447 2 .474 2.492 2 .514 2.535 2.555 2.576
. ~~ ~
a! = 0 .001
1.414 1.730 1.982 2 .178 2.329 2.447 2.540 2. 616 2.730 2. 812 2.873 2 .921 2.959 3.026 3 .071 3. 127 3. 182 3.237 3 .291
NOTE: To calculate T * values fo r sample s i zes o r significance leve ls not shown, use the relationship
where t is StudentOs t-value at significance level a! and n - 2 degrees of f reedom and n is sample s ize .
NASA-Langley, 1969 - 8 H-570
-
19
NATIONAL AERONAUTICS AND SPACE ADMINISTRATION WASHINGTON, D. C. 20546
OFFICIAL BUSINESS FIRST CLASS MAIL
POSTMASTER: If Undeliverable (Section 158 Postal Manual) Do Not Return
' T h e aeronaiitical and space activities o f the United States shall be conducted so as t o contribute . . . t o the expansion of himan knotol- edge of phenomena in the atniosphere and space. T h e Administration shall provide for the widest practicable and appropriate dissemination of inf oriliation conceriting i ts actiiities and the results thereof."
-NATIONAL AERONAUTICS AND SPACE ACT OF 1958
NASA SCIENTIFIC AND TECHNICAL PUBLICATIONS
TECHNICAL REPORTS: Scientific and technical information considered important, complete, and a lasting contribution to existing knowledge.
TECHNICAL NOTES: Information less broad in scope but nevertheless of importance as a contribution to existing knowledge.
TECHNICAL MEMORANDUMS: Information receiving limited distribution because of preliminary data, security classifica- tion, or other reasons.
TECHNICAL TRANSLATIONS: Information published in a foreign language considered to merit NASA distribution in English.
SPECIAL PUBLICATIONS: Information derived from or of value to NASA activities. Publications include conference proceedings, monographs, data compilations, handbooks, sourcebooks, and special bibliographies.
TECHNOLOGY UTILIZATION PUBLICATIONS: Information on technology used by NASA that may be of particular interest in commercial and other non-aerospace npp!ications. Publications include Tech Briefs, Technology Utilization Reports and Notes, and Technology Surveys.
CONTRACTOR REPORTS: Scientific and technical information generated under a NASA contract or grant and considered an important contribution to existing knowledge.
Details on the availability of these publications may be obtained from:
SCIENTIFIC AND TECHNICAL INFORMATION DIVISION
NATIONAL AERONAUTICS AND SPACE ADMINISTRATION Washington, D.C. 20546

![Automatic Layout and Structure-Based Editing of UML Diagramsbiblio/downloads/...class library that contains sophisticated graph algorithms for automatic layout [12]. Among these is](https://img.pdfslide.net/doc/110x75/6091936d71ed332d4976a80b/automatic-layout-and-structure-based-editing-of-uml-diagrams-bibliodownloads.jpg)