Embed Size (px)
Citation preview

Acta anaesth. scand. 1975, Suppl. 57, 34-38
A Simple Technique for the Determination of the Ventilatory Response to Rising Arterial CO, Tensions, Suitable for Patients with Neurological Disorders
LARS BRANDT, LARS GRANHOLM and DICK THOMSON
Department of Neurosurgery A and Department of Anaesthesia, University Hospital, I.und, Sweden
Patients with neurological disorders may have a reduced ventilatory response to a rising PaCO,. This is often unpredictable and may bccomc apparent only when other complications, e. g. infections (pneumonia), occur or when the patient is subjected to general anaesthesia. This paper describes a simple method suitable for screening patients who may have an impaired capacity of eliminating CO, when stressed. Ventilatory changes were detcrrnincd during the continuous recording of the CO, concentration in end-tidal air in 20 healthy subjects, who were breathing first air and then gas mixtures con- taining 21 % 0, and 2.5 or 5 % CO,. A prediction interval with 90 and 95 % probability limits was constructed for healthy individuals. The normally expected change in minute ventilation per m' body surface area per change in PACO, (AvE/mz, l/min/APACO,) for this technique is also given.
Received 16 December 1974, accepted for Publication 27 January 1975
The ventilatory response to a rising arterial CO, tension varies greatly between individu- als. Normal subjects usually increase their depth and/or frequency of ventilation in order to maintain normal or near-normal arterial CO, tensions. In patients with chron- ic diseases of the lungs on the other hand, the ventilatory response to CO, is often re- duced. During an acute exacerbation of their disease, difficulties in controlling the arterial CO, tension may then necessitate periodic respirator treatment in these patients.
Patients with central nervous system lesions may also have a reduced ability to increase their ventilation in response to a rising ar- terial CO, tension. The elimination of CO, has occasionally been found to fail following head injuries (FROWEIN 1963, GRANHOLM &
WHITE 1974), encephalitis (COHN & KUIDA 1962), brain stem tumors (FROWEIN 1963), posterior fossa surgery (LALL & JAIN 1969), and also in some cases of craniovertebral anomaly (KRIEGER et al. 1969). The ven- tilatory response to CO, is also frequently reduced in poliomyelitis ( LINDERHOLM & WERNEMAN 1956) and is usually impaired following cervical cordotomy ( ROSOMOFF et al. 1969). Thus damages at different levels of the neuroaxis may result in an insufficient ventilation, which irrespective of the leveI of the lesion can turn out to be of clinical im- portance. Furthermore, a patient with an occult neurological lesion may have a seem- ingly sufficient ventilation, but he may require periodic respirator treatment, if he, for example, develops pneumonia. I t should,

VENTILATORY RESPONSE TO RISING PACO, 35
which gives the normal range of variation for the ventilatory response to rising CO, concentrations in a healthy population. The ventilatory response can also be expressed as change in ventilation per square meter B. S. A. divided by the change in PACO, ( AvE/m2, l/min/APACO,) .
The method described here was tested in healthy subjects, and the results from these studies were used to calculate a prediction area*. The analytical method has previously been reported in detail (GRANHOLM 1973). For reasons mentioned in the Discussion, a prediction area with only a lower boundary was used.
however, be possible to predict such a course, but this has not been systematically investi- gated in, for example, neurosurgical patients. This study shows that the ventilatory response to rising arterial CO, tensions can easily and accurately be determined using a method applicable to clinical practice.
METHOD A mouthpiece or the tracheostomy tube is con- nected to a breathing valve with insignificant dead space. The subject, placed in the supine position, inhales from a rubber bag connected to a “pop off” spring valve. This bag is filled either with compressed air from a pipe-line or with a gas mix- ture of known composition with regard to CO, from a gas tank. The CO, percentage of end-tidal air is continuously recorded in gas samples drawn close to the expiratory valve using a rapid infra-red CO, meter (Godart@ Capnograph). The sensitivity of this CO, meter is high (k 0.125 volume per cent GO,). The meter is adjusted with calibration gases containing suitable amounts of CO, in 21 per cent oxygen (balance nitrogen). The signal from the CO, meter is recorded by an ink writer (Honeywell@ recorder). Fig. 1 shows a schematical drawing of the experimental set-up.
The subject starts to breathe from the rubber bag which is initially filled with air. When the CO, concentration of end-tidal air, analyzed breath by breath, has reached a steady level ( k 0.2 %), the respiratory minute volume is measured on a dry gas meter. The same procedure is then re- peated with the bag filled with a known C0,- mixture.
The alveolar CO, tension (PACO,) is assumed to be the same as the mean end-tidal PCO, ob- tained during the period of minute volume mea- surement. The increase in PACO, and in ventila- tion per square meter body surface area (B. S. A,) , comparing air and CO, breathing, is then plotted on a previously constructed curve (see below)
\.“
compressed ail
or
gas mixture
dry gas meter
rubber bag
infrared writer CO, meter
Fig. 1. Schematical drawing of the experimental arrangement.
RESULTS
Determination of the ventilatory response to CO, was performed in 20 healthy subjects, 9 women and 11 men, 20 to 44 years of age. Differences in response between the different sexes and between subjects of different ages were not seen in this group, if change in ventilation was calculated per square meter B. S. A. When steady-state conditions for breathing air had been recorded, each sub- ject was consecutively tested with two differ- ent gas mixtures: 2.5 and 5 per cent CO,, respectively, in 21 per cent oxygen, balance nitrogen. Individual results are given in Table I. The respiratory changes were cal- culated from the initial steady-state values breathing air. The results are also shown in Fig. 2.
Assuming for each individual a linear re- gression of ventilation in l/min per square meter B. S. A. (y) on PACO, in mm Hg (x) , the slope and the residual variance were estimated. The sample mean of the esti- mated slopes was b = 0.91. The correspond- ing sample variance was sb2 = 0.12. The residual was estimated jointly from all in- dividuals to s‘ = 0.59. The assumption is made that x and y are observed in two situations to calculate Ax and Ay for a new healthy individual.
The lower boundary of a one-sided pre- diction interval for Ay with confidence level approximately 1-a and with previously used
* The calculations were done by civing. Carl Johan Lamm, The Lund Institute of Technology.
36 L. BRAND?', L. GRANHOLM A N D D. TIIOMSON
AVE'm', APACO, llmin m m H g
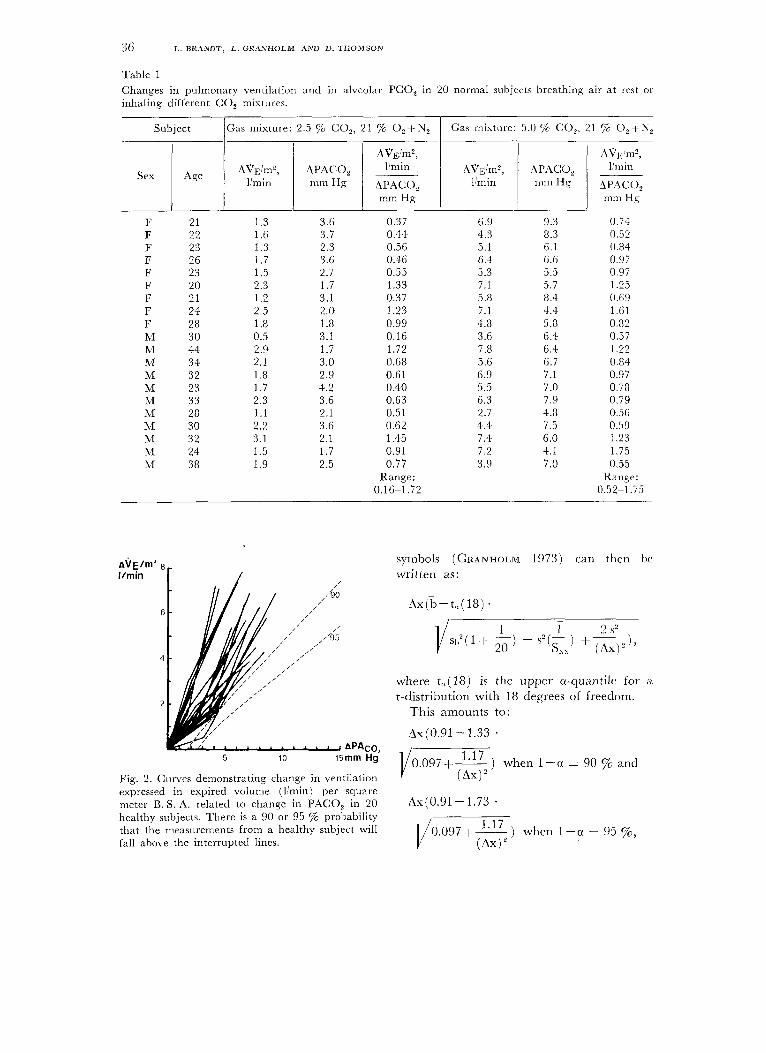
Table 1 Changes in pulmonary ventilation and in alveolar PCO, in 20 normal subjects breathing air at rest or inhaIing different CO, mixtures.
AVE'm2, Umin
APACO, mm Hg
Sex
;as mixture: 2.5 70 CO,, 21 % O,+N,
Age
Gas mixture: 5.0 '/o CO,, 21 % 0, +N,
APACO, nim 11% APACO,
inin Hg
6.9 4.3 5.1 6.4 5.3 7.1 5.8 7.1 4.8 3.6 7.8 5.6 6.9 5.5 6.3 2.7 4.4 7.4 7.2 3.9
9.3 8.3 6.1 6.6 5.5 5.7 8.4 4.4 5.8 6.4 6.4 6.7 7.1 7.0 7.9 4.8 7.5 6.0 4.1 7 .0
0.74 0.52 0.84 0.97 0.97 1.25 0.69 1 .GI 0.82 0.57 1.22 0.84 0.97 0.78 0.79 0.56 0.59 1.23 1.75 0.55
Range: 0.52-1.75
6
4
2
5 10 i5mm Hg-
Fig. 2. Curves demonstrating change in ventilation expressed in expired volume (l'min) per square meter B. S. A. related to change in PACO, in 20 healthy subjects. There is a 90 or 95 % probability that the measurements from a healthy subject will
symbols (GRANHOLM 1973) can then be written as:
Ax(b-t,( 18 ) .
where t,(18) is the upper u-quantile for a t-distribution with 18 degrees of freedom.
This amounts to :
Ax(0.91-1.33 . 117
(AX) ' 0.097 +- ) when 1 -a = 90 $6 and
Ax(0.91- 1.73 .
, . I/o.O97 + 1.17 ) when 1 - u = 95 $6, fall above the interrupted lines. (Ax)'
VEN’I’ILATORY RESPOh‘SE TO RISING PACOz 37
indicated by the dashed lines in the diagram of Fig. 2. The slope ( AVj:/m2, l/min/APACO,) of the rectilinear part of the 90 per cent curve is 0.48 and that of the 95 per cent curve 0.34.
DISCUSSION
A reduced ventilatory response to an increase in arterial CO, tension may be demonstrated if the ventilation per time unit is determined at different experimentally produced alveolar CO, tensions. This can be performed in sever- al different ways. One procedure is to let the subject breathe different gas mixtures and to make repeated arterial blood sampling (usu- ally from an indwelling catheter). Expired gas volume is then collected and measured and the PaCO, of the blood samples is de- termined (See e. g. ALEXANDER et al. 1955). COTES (1965) described a method where alveolar PCO, and ventilation were deter- mined by letting patients (chronic lung dis- ease) rebreathe air, “the bag in the box system”. This method does not, however, permit studies in steady-state situations dur- ing rest. The present technique is simple to handle, allows steady-state measurements and is suitable for clinical use. The concentration of inspired 0, is also kept constant, which excludes effects on ventilation by e. g. hy- poxia.
I t is now well-known that the ventilation- perfusion ratio changes if the depth of ven- tilation is altered (HEDLEY-WHYTE et al. 1964), particularly so in bed-ridden patients. This may prolong the period of time required to establish steady-state conditions following a change in the CO, concentration of the gas mixture. An advantage with the present set-up is that the continuous record from the capnograph immediately tells when a new steady-state level is reached following a change in ventilatory depth; and thus in ven- tilation-perfusion ratio. End-tidal PCO, is not always representative of mean PACO, and A-a PCO, differences may occur in cer- tain patients (e. g. with chronic lung disease). Such differences could perhaps influence the position, but hardly the slope, of the ventila-
tory response curve of a patient, as the mea- surements are performed with the patient in a steady-state, judged by the composition of end-tidal air.
Results obtained in patients with this method are to be compared to data from a group of controls, e. g. using a diagram de- rived from Fig. 2. For a healthy individual, the ventilatory response to an increase in PACO, is predicted to fall above the dashed lines with a probability of 90 or of 95 yo. It appears from Fig. 2 and from Table 1 that the concentration of CO, in inspired gas should be at least 4-5 7% in order to place the observed value in a region of the curve where results can be interpreted with reason- able confidence. This, of course, means that the technique should not be used in cases with increased intracranial pressure.
A prediction area with only a lower boun- dary has been drawn in Fig. 2. The reason for this is that an impaired capacity to eliminate an increasing arterial CO, tension always means a serious complication; where- as an improved capacity in this respect must per se be regarded as less important. The ventilatory response to rising arterial CO, tensions is the end result of a series of complicated interactions inside and outside an intricate, widespread and only partially known respiratory “centre”. Abnormally low values for AvI,/m2, l/min/APACO, may be due to lesions to the chemo-receptor area in the retropontine region or to damage or disease to respiratory nerves, lungs, chest wall or muscles of respiration. Abnormally high values for the ratio have been encountered in cases with supratentorial lesions (PLUM 1970’1.
REFERENCES ALEXANDER, J. K., WEST, J. R., WOOD, .J. A. &
RICHARDS, D. W. (1955) Analysis of the respira- tory response to carbon dioxide inhalation in varying clinical states of hypercapnia, anoxia, and acid-base derangement. J. clin. Invest. 34, 512.
COHN, J. E. & KUIDA, H. (1962) Primary alveolar hypoventilation associated with Westcrn Equine encephalitis. Ann . Intern. M e d . 56, 633.

38 L. BRANDT, L. GRANHOLM AND D. THOMSON
COTES, J. E. (1965) Lung Function, Assessment and Application in Medicine. Blackwell Scientific Publications, Oxford.
FROWEIN, R. A. (1963) Centrale Atemstorungcn bei Schadel-Him- Verlettungen und bei Hirn- tumoren. Monographien aus dem Gesamtgebiete der Neurologie und Psychiatric Heft 101. Ber- lin-Gottingen-Heidelberg, Springer Verlag.
GRANHOLM, L. (1973) Pulmonary ventilation in neurological disorders. Bull. Physio-Path. resp. 9, 593.
GRANHOLM, L. & WHITE, T. (1974) Unpublished data.
HEDLEY-WHYTE, J., LAVER, M. B. & BENDIXEN, H. H. (1964) Effect of change in tidal volume on physiologic shunting. Amer. J . Physiol. 206, 891.
KRIEGER, A. J., ROSOMOFF, H. L., KUPERMAN, A. S. & ZINGESSER, L. H. (1969) Occult respira- tory dysfunction in a craniovertebral anomaly. J . Neurosurg. 31, 15.
LALL, N. G. & JAIN, A. P. (1969) Circulatory
and respiratory disturbances during posterior cranial fossa surgery. Brit. J . Anaesth. 41, 447.
LINDERHOLM, H. & WERNEMAN, H. (1956) On respiratory regulation in poliomyelitis convales- cents. Acta med. scand. Suppl. 316, 135.
PLUM, F. (1970) Neurological integration of be- havioural and metabolic control of breathing. Ciba Foundation Hering-Breuer Centenary Symposium: Breathing, ed.: RUTH PORTER. pp. 159-175. J. & A. Churchill, London.
ROSOMOFF, H. L., KRIEGER, A. J. & KUPERMAN, A. S. (1969) Effects of percutaneous cervical cordotomy on pulmonary function. J . Neurosurg. 31, 620.
Address : Lars Granholm, M. D. Department of Neurosurgery Karolinska Sjukhuset 104 01 Stockholm 60 Sweden