Embed Size (px)
DESCRIPTION
Simulation Based Decis
Citation preview

A
Ma
b
c
a
ARR2AA
KDDOML
1
tmnprRnsartta[
w
g(g
h1
Journal of Computational Science 10 (2015) 86–96
Contents lists available at ScienceDirect
Journal of Computational Science
j ourna l h om epage: www.elsev ier .com/ locate / jocs
simulation based Decision Support System for logistics management
.P. Fanti a,∗, G. Iacobellisa, W. Ukovichb, V. Boschianb, G. Georgoulasc, C. Styliosc
Polytechnic of Bari, Via Orabona 4, 70125 Bari, ItalyUniversity of Trieste, Via Valerio 10, 34127 Trieste, ItalyTechnological Educational Institute of Epirus, GR-47100 Arta, Greece
r t i c l e i n f o
rticle history:eceived 21 February 2014eceived in revised form6 September 2014ccepted 14 October 2014vailable online 6 November 2014
a b s t r a c t
This paper deals with designing and developing a Decision Support System (DSS) that will be able tomanage the flow of goods and the business transactions between a port and a dry port. An integrated DSSarchitecture is proposed and specified and the main components are designed on the basis of simulationand optimization modules. In order to show the use and implementation of the DSS, this work tests andanalyzes the case of the area of the Trieste port and manages the export flows of freights between a dryport and a seaport. An integrated approach is designed mainly at tactical and operational decision level
eywords:ecision Support Systemsiscrete Event Simulationptimizationetaheuristic algorithms
ogistics
exploiting simulation and optimization approaches and especially metaheuristic approaches.© 2014 Elsevier B.V. All rights reserved.
. Introduction
The increasing complexity of modern business environment andhe vast volume of available data, that could be taken into account,
ake the use of advanced modeling and computerized methods aecessity. Among the others, logistics systems such as ports, dryorts and inland terminals have been widely studied during theecent years (see for instance the review in [12]). In particular,oso et al. [17,18] point out that the dry ports are not only termi-als linked one to another but also terminals where some typicalervices of the seaports are moved, in order to provide more avail-ble space and to require less service time at the port area. In theelated literature, there are several papers that analyze intermodalerminals [7,21] and in particular container terminals [19]. Indeed,he management of seaport and dry port terminals has become
popular topic of academic research worldwide (see the surveys
19,20,22] for a comprehensive review).However, the current concept of dry ports directly connectedith the seaport opens new series of problems to be faced,
∗ Corresponding author. Tel.: +39 0805963643.E-mail addresses: [email protected] (M.P. Fanti),
[email protected] (G. Iacobellis), [email protected]. Ukovich), [email protected] (V. Boschian),[email protected] (G. Georgoulas), [email protected] (C. Stylios).
ttp://dx.doi.org/10.1016/j.jocs.2014.10.003877-7503/© 2014 Elsevier B.V. All rights reserved.
since the logistics operations between the two terminals must becoordinated and synchronized [1,9]. Moreover, the increasing avail-ability of Information and Communication Technologies (ICTs), forthe interaction among the Decision Makers (DMs) and the acquisi-tion of information, requires the development of models and leadsto the definition of novel decision making strategies with respectto the related literature.
Analogously to what is done in other application areas (e.g.,production processes), it is possible to identify different hierar-chical/functional levels also for logistics systems which differentdecisional problems are associated to [1]: (a) the tactical level,related (on a middle term) to the management of logistic flowsconnected to the information flow and to the transportation net-work; and (b) the operational level, including real-time decisionalprocesses and decisions concerning the resource assignment, thevehicle routing definition, and so on. In particular, assuming a real-time availability of the information regarding the conditions of thenetwork (like unexpected requests of transportation, variations inthe availability of the transportation system, road conditions andtraffic flows), operational decisions should be taken in a dynamiccontext.
This paper develops a Decision Support System (DSS) to be used
by DMs that have to take operational as well as tactical decisionsin logistics networks composed by a port and a dry port. Startingfrom the approach presented in [2,7], in this paper we specify indetail the main components of the DSS: the data component, the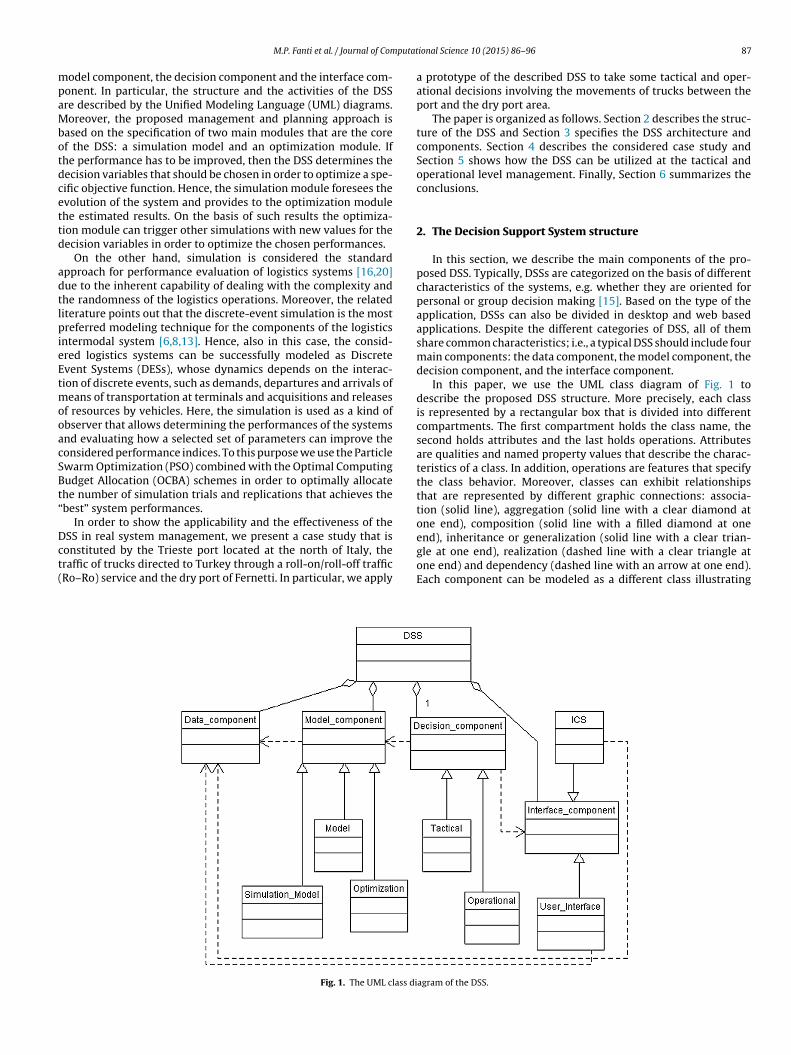
putat
mpaMbotdcettd
adtlpieEtmooacSBt“
Dct(
M.P. Fanti et al. / Journal of Com
odel component, the decision component and the interface com-onent. In particular, the structure and the activities of the DSSre described by the Unified Modeling Language (UML) diagrams.oreover, the proposed management and planning approach is
ased on the specification of two main modules that are the coref the DSS: a simulation model and an optimization module. Ifhe performance has to be improved, then the DSS determines theecision variables that should be chosen in order to optimize a spe-ific objective function. Hence, the simulation module foresees thevolution of the system and provides to the optimization modulehe estimated results. On the basis of such results the optimiza-ion module can trigger other simulations with new values for theecision variables in order to optimize the chosen performances.
On the other hand, simulation is considered the standardpproach for performance evaluation of logistics systems [16,20]ue to the inherent capability of dealing with the complexity andhe randomness of the logistics operations. Moreover, the relatediterature points out that the discrete-event simulation is the mostreferred modeling technique for the components of the logistics
ntermodal system [6,8,13]. Hence, also in this case, the consid-red logistics systems can be successfully modeled as Discretevent Systems (DESs), whose dynamics depends on the interac-ion of discrete events, such as demands, departures and arrivals of
eans of transportation at terminals and acquisitions and releasesf resources by vehicles. Here, the simulation is used as a kind ofbserver that allows determining the performances of the systemsnd evaluating how a selected set of parameters can improve theonsidered performance indices. To this purpose we use the Particlewarm Optimization (PSO) combined with the Optimal Computingudget Allocation (OCBA) schemes in order to optimally allocatehe number of simulation trials and replications that achieves thebest” system performances.
In order to show the applicability and the effectiveness of the
SS in real system management, we present a case study that isonstituted by the Trieste port located at the north of Italy, theraffic of trucks directed to Turkey through a roll-on/roll-off trafficRo–Ro) service and the dry port of Fernetti. In particular, we applyFig. 1. The UML class di
ional Science 10 (2015) 86–96 87
a prototype of the described DSS to take some tactical and oper-ational decisions involving the movements of trucks between theport and the dry port area.
The paper is organized as follows. Section 2 describes the struc-ture of the DSS and Section 3 specifies the DSS architecture andcomponents. Section 4 describes the considered case study andSection 5 shows how the DSS can be utilized at the tactical andoperational level management. Finally, Section 6 summarizes theconclusions.
2. The Decision Support System structure
In this section, we describe the main components of the pro-posed DSS. Typically, DSSs are categorized on the basis of differentcharacteristics of the systems, e.g. whether they are oriented forpersonal or group decision making [15]. Based on the type of theapplication, DSSs can also be divided in desktop and web basedapplications. Despite the different categories of DSS, all of themshare common characteristics; i.e., a typical DSS should include fourmain components: the data component, the model component, thedecision component, and the interface component.
In this paper, we use the UML class diagram of Fig. 1 todescribe the proposed DSS structure. More precisely, each classis represented by a rectangular box that is divided into differentcompartments. The first compartment holds the class name, thesecond holds attributes and the last holds operations. Attributesare qualities and named property values that describe the charac-teristics of a class. In addition, operations are features that specifythe class behavior. Moreover, classes can exhibit relationshipsthat are represented by different graphic connections: associa-tion (solid line), aggregation (solid line with a clear diamond atone end), composition (solid line with a filled diamond at one
end), inheritance or generalization (solid line with a clear trian-gle at one end), realization (dashed line with a clear triangle atone end) and dependency (dashed line with an arrow at one end).Each component can be modeled as a different class illustratingagram of the DSS.
8 putat
tr
f
1
2
3
4
8 M.P. Fanti et al. / Journal of Com
he different types of objects that the system can have and theirelationships.
We briefly specify the DSS components shown in Fig. 1 asollows.
. Data component. The data component usually consists of aDatabase Management System (DBMS). The data used can beinternal, if they come from organization’s internal proceduresand sources such as products and services prices, recourseand budget allocation data, payroll cost, cost-per-product etc.External data can be related with competition market share,government regulations and may come from various resourcessuch as market research firm, government agencies, the webetc. In some cases, the DSS can have its own database or it mayuse other organizational databases either by connecting directlywith them or by using data available from reports.
. Model component. This component mainly includes a simula-tion model, a mathematical model, and a set of optimizationalgorithms suitable to analyze effects of choices on the systemperformances. The models describe the operations at differentmanagement levels and the type of functions varies with theoperation that they support.
. Interface component. This module is the part of the DSS that isresponsible for the communication and interaction of the sys-tem with the DMs. Such a component is very important becauseregardless of the quality and quantity of the available data;the accuracy of the model is based on this interface. Indeed,this component includes an Information Communication Sys-tem (ICS) that is able to interact with the real system andmaintains the consistency between the stored data and the realsystem.
. Decision component. This component consists of two-secondlevel classes: the operational decision class and the tactical
decision class. Moreover, such classes include the performanceindices that have to be considered in order to take the decisions.In addition, in relation with the performance indices and theobject of the decisions, the DSS has to collect the decision rulesFig. 2. The DSS ar
ional Science 10 (2015) 86–96
and the optimization procedures that are used by the model andthe simulation component.
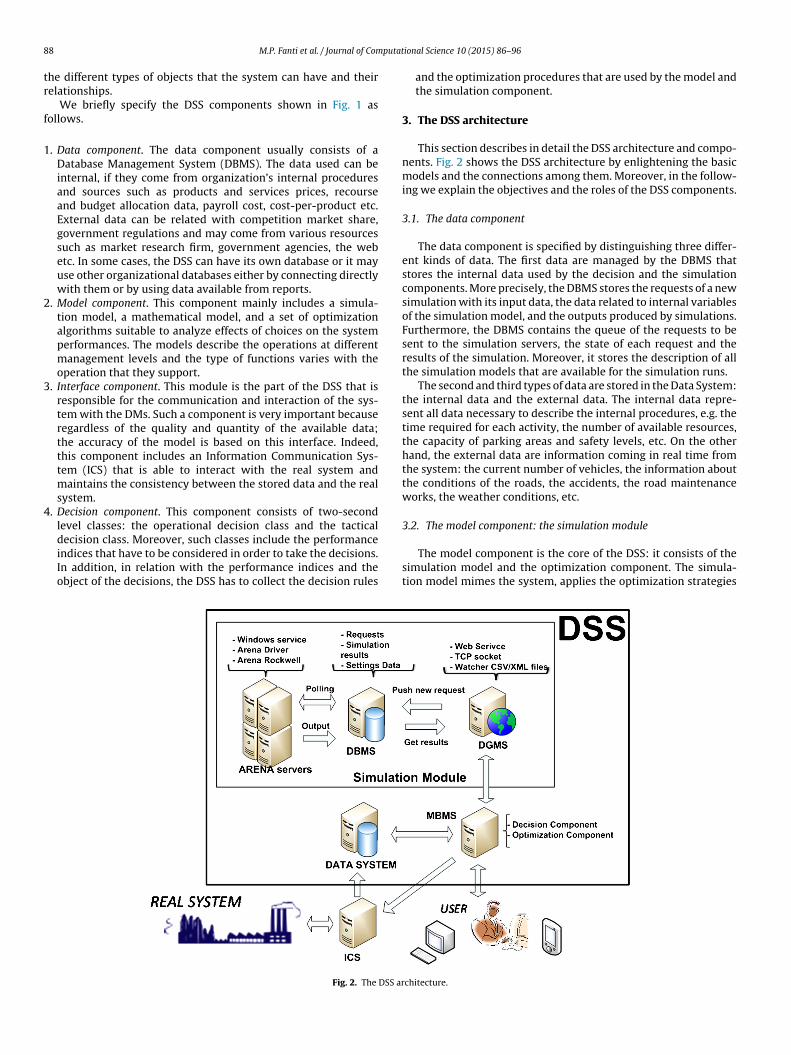
3. The DSS architecture
This section describes in detail the DSS architecture and compo-nents. Fig. 2 shows the DSS architecture by enlightening the basicmodels and the connections among them. Moreover, in the follow-ing we explain the objectives and the roles of the DSS components.
3.1. The data component
The data component is specified by distinguishing three differ-ent kinds of data. The first data are managed by the DBMS thatstores the internal data used by the decision and the simulationcomponents. More precisely, the DBMS stores the requests of a newsimulation with its input data, the data related to internal variablesof the simulation model, and the outputs produced by simulations.Furthermore, the DBMS contains the queue of the requests to besent to the simulation servers, the state of each request and theresults of the simulation. Moreover, it stores the description of allthe simulation models that are available for the simulation runs.
The second and third types of data are stored in the Data System:the internal data and the external data. The internal data repre-sent all data necessary to describe the internal procedures, e.g. thetime required for each activity, the number of available resources,the capacity of parking areas and safety levels, etc. On the otherhand, the external data are information coming in real time fromthe system: the current number of vehicles, the information aboutthe conditions of the roads, the accidents, the road maintenanceworks, the weather conditions, etc.
3.2. The model component: the simulation module
The model component is the core of the DSS: it consists of thesimulation model and the optimization component. The simula-tion model mimes the system, applies the optimization strategies
chitecture.
putat
pmim
-
-
-
socro
3
mwPtTvviiPaabIipatp
x
wspketcia
v
x
wtoacda
i=1, j /= b�
i
M.P. Fanti et al. / Journal of Com
roposed by the optimization module and provides the perfor-ance measures. In the proposed solution, the simulation model
s implemented by simulation servers that consist of the followingain elements [10]:
simulation software that is a server where the simulation modelsare implemented and executed;
windows service, that is automatically started. Moreover, it moni-tors the DBMS, executes the simulation and loads the results onthe data base;
simulation driver, that connects the system to the simulationsoftware: it is in charge of starting and stopping simulations.
By the proposed architectural solution, a set of simulationervers can be provided and each server is independent from thethers. Then, the number of operative servers can dynamicallyhange on the basis of the computational effort that is required ineal time. Moreover, such an approach allows a parallel executionf the simulation requests by reducing the total execution time.
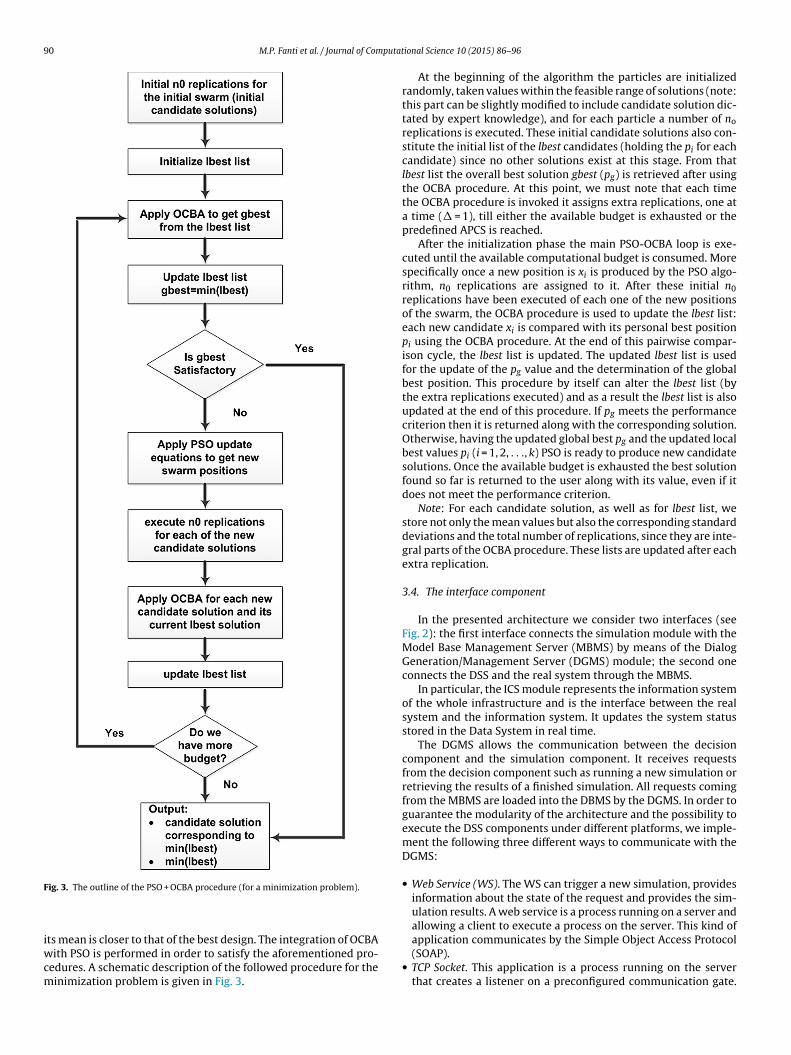
.3. The model component: the optimization module
The second basic module of the model component is the opti-ization module (see Fig. 2) that combines a variant of PSO [11]ith an OCBA scheme [4]. In particular, the main concept of the
SO includes a population, called a swarm, of potential solutions ofhe problem at hand, called the particles, probing the search space.he particles iteratively move in the search space with an adaptableelocity, retaining in a memory the best positions they have everisited, i.e., the positions with the lowest function values (consider-ng only minimization problems). The exploration capability of PSOs promoted by information exchange among particles. In the globalSO variant, the neighborhood of each particle is the whole swarmnd the overall best position is the main information provider forll particles. On the other hand, in the local PSO variant, the neigh-orhoods are strictly smaller, usually consisting of a few particles.n such cases, each particle may have its own leader that influencests velocity update. The use of the global best simplifies the com-arisons that are involved in simulation optimization procedures,s it will be described in the following paragraphs. Therefore thewo fundamental equations governing global best PSO version areresented for the noise free case.
We consider the following generic minimization problem:
min ∈ S⊂Rd
J(x) (1)
here given k particles, the vector xi ∈ S for i = 1, 2, . . ., k of dimen-ion d represents the state of the i-th particle and S is the set of allossible states. The i-th particle has a velocity (position shift) vi andeeps in his personal memory the best position, pi ∈ S, that it hasver visited. Moreover, the swarm keeps in its collective memoryhe best position ever visited by a member of the swarm pg. Theonstriction coefficient version of PSO is described by the follow-ng set of equations [5,14], which govern the update of the positionsnd the velocities of the particles/candidate solution:
(t+1)ij
= �[v(t)ij
+ �1(p(t)ij
− x(t)ij
) + �2(p(t)gij
− x(t)ij
)] (2)
(t+1)ij
= x(t)ij
+ v(t+1)ij
(3)
here i = 1, 2, . . ., k and j = 1, 2, . . ., d. The parameter � is the constric-ion coefficient and it is used as a means to control the magnitudef the velocities. The other two parameters are defined as ϕ1 = c1r1
nd ϕ2 = c2r2, where c1 and c2 are positive constants, also called theognitive and the social parameter, respectively, and r1, r2, are ran-om variables uniformly distributed in [0,1], different for each i, jnd t.ional Science 10 (2015) 86–96 89
In real life problems we usually accept good enough solutionsinstead of the globally optimal solution. Therefore, in case of “noisy”functions, “following” the “best” particle becomes difficult sincethe actual value of a particle is obscured by noise and repeatedfunction evaluations are required in order to accurately estimatethe true value. Especially in situations where a function evaluationis a costly process, a compromise should be reached between theneed for an accurate estimation of the true value and the need ofhaving as small as possible number of function evaluations. In PSO,there are two main procedures that need to be accomplished ateach iteration. One concerns the determination of the personal bestposition for each particle, and the other deals with the selection ofthe neighborhood’s best particle. In simulation optimization, thechallenge lies at the main task of identifying the actual best particleamong k candidates, with respect to the smallest mean objectivefunction value, while minimizing the total number of replicationsneeded for a precise and safe selection. To this aim, OCBA can be auseful tool.
Indeed, the OCBA is a procedure to optimally allocate a pre-defined number of trials/replications in order to maximize theprobability of selecting the best system/design: allocate replica-tions not only based on the variance of the different designs butalso taking into account the respective means.
According to OCBA, if we have a total budget of T replications,T =
∑ki=1Ni then we try to (asymptotically) maximize the probabil-
ity of Correct Selection P{CS} (the probability of actually selectingthe best b among k designs) [3] (for the case of a minimizationproblems):
P{CS} = P{Jb < Ji, i /= b}. (4)
Within the OCBA framework, instead of estimating the P{CS}one resorts to a much easier to compute lower bound which is calledthe Approximate Probability of Correct Selection (APCS) that can bein two forms [3]: APCS-B and APCS-B.
APCS-B is in a summation form derived using the Bonferroniinequality:
APCS-B ≡ 1 −k∑
i=1,i /= b
P{Jb > Ji} ≤ P{CS}. (5)
APCS-P is expressed as a product form:
APCS-B ≡k∏
i=1,i /= b
P{Jb < Ji} ≤ P{CS}. (6)
In [4] it is proved that in order to asymptotically maximize APCS(as the simulation budget approaches infinity) and as a result P{CS}or to minimize the total number of replications for a given confi-dence interval, the following relationship between two non-bestdesigns (Ni, Nj) should hold:
Ni
Nj=
(�i/ıb,i
�j/ıb,j
)2
, for all i /= j /= b, (7)
with the number of simulation replications for the best design givenas
Nb = �b
√√√√ k∑ N2i2
, (8)
where �i, �i, are the mean and standard deviation of the i-th design,ıb,i = �i − �b, and b is the best design. More specifically, the noisierthe simulation output (larger variance), the more replications areallocated while more replications are also given to the design that
90 M.P. Fanti et al. / Journal of Computat
F
iwcm
application communicates by the Simple Object Access Protocol(SOAP).
ig. 3. The outline of the PSO + OCBA procedure (for a minimization problem).
ts mean is closer to that of the best design. The integration of OCBAith PSO is performed in order to satisfy the aforementioned pro-
edures. A schematic description of the followed procedure for theinimization problem is given in Fig. 3.
ional Science 10 (2015) 86–96
At the beginning of the algorithm the particles are initializedrandomly, taken values within the feasible range of solutions (note:this part can be slightly modified to include candidate solution dic-tated by expert knowledge), and for each particle a number of no
replications is executed. These initial candidate solutions also con-stitute the initial list of the lbest candidates (holding the pi for eachcandidate) since no other solutions exist at this stage. From thatlbest list the overall best solution gbest (pg) is retrieved after usingthe OCBA procedure. At this point, we must note that each timethe OCBA procedure is invoked it assigns extra replications, one ata time (� = 1), till either the available budget is exhausted or thepredefined APCS is reached.
After the initialization phase the main PSO-OCBA loop is exe-cuted until the available computational budget is consumed. Morespecifically once a new position is xi is produced by the PSO algo-rithm, n0 replications are assigned to it. After these initial n0replications have been executed of each one of the new positionsof the swarm, the OCBA procedure is used to update the lbest list:each new candidate xi is compared with its personal best positionpi using the OCBA procedure. At the end of this pairwise compar-ison cycle, the lbest list is updated. The updated lbest list is usedfor the update of the pg value and the determination of the globalbest position. This procedure by itself can alter the lbest list (bythe extra replications executed) and as a result the lbest list is alsoupdated at the end of this procedure. If pg meets the performancecriterion then it is returned along with the corresponding solution.Otherwise, having the updated global best pg and the updated localbest values pi (i = 1, 2, . . ., k) PSO is ready to produce new candidatesolutions. Once the available budget is exhausted the best solutionfound so far is returned to the user along with its value, even if itdoes not meet the performance criterion.
Note: For each candidate solution, as well as for lbest list, westore not only the mean values but also the corresponding standarddeviations and the total number of replications, since they are inte-gral parts of the OCBA procedure. These lists are updated after eachextra replication.
3.4. The interface component
In the presented architecture we consider two interfaces (seeFig. 2): the first interface connects the simulation module with theModel Base Management Server (MBMS) by means of the DialogGeneration/Management Server (DGMS) module; the second oneconnects the DSS and the real system through the MBMS.
In particular, the ICS module represents the information systemof the whole infrastructure and is the interface between the realsystem and the information system. It updates the system statusstored in the Data System in real time.
The DGMS allows the communication between the decisioncomponent and the simulation component. It receives requestsfrom the decision component such as running a new simulation orretrieving the results of a finished simulation. All requests comingfrom the MBMS are loaded into the DBMS by the DGMS. In order toguarantee the modularity of the architecture and the possibility toexecute the DSS components under different platforms, we imple-ment the following three different ways to communicate with theDGMS:
• Web Service (WS). The WS can trigger a new simulation, providesinformation about the state of the request and provides the sim-ulation results. A web service is a process running on a server andallowing a client to execute a process on the server. This kind of
• TCP Socket. This application is a process running on the serverthat creates a listener on a preconfigured communication gate.
M.P. Fanti et al. / Journal of Computational Science 10 (2015) 86–96 91
•
pdawuo
3
tcodctpasntgovuaaaa
(urotd
aa
railway.Normally a Ro–Ro ship transports 238 units, and one third of them are complete
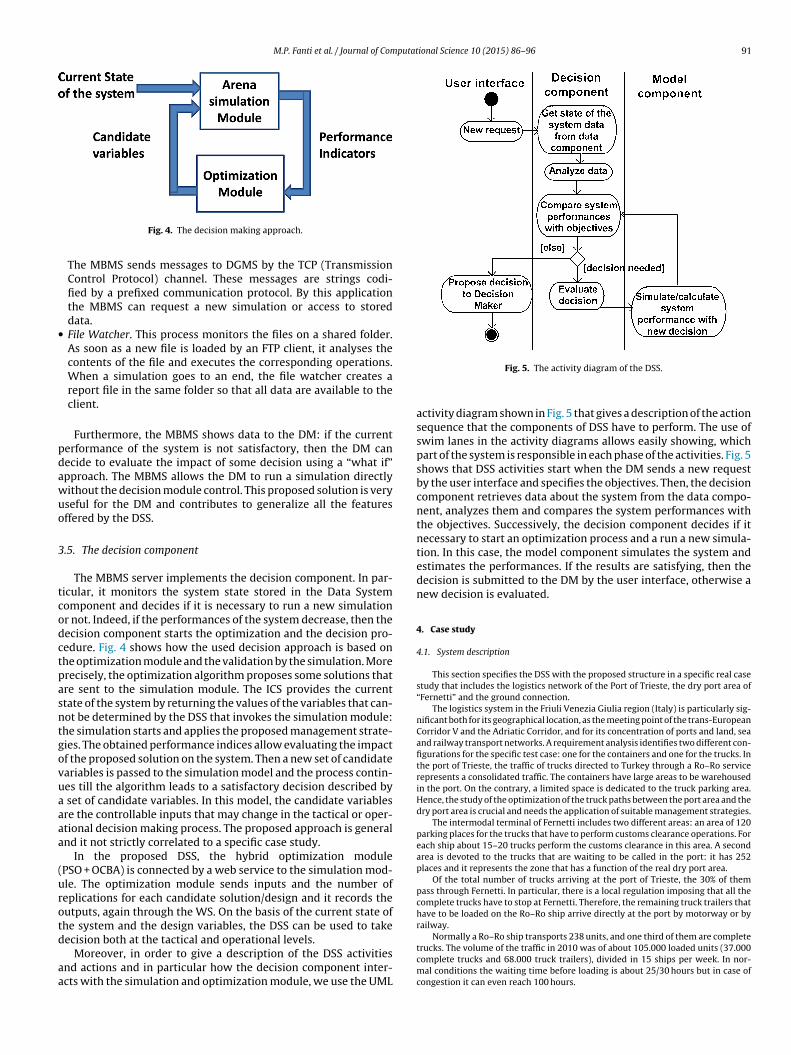
Fig. 4. The decision making approach.
The MBMS sends messages to DGMS by the TCP (TransmissionControl Protocol) channel. These messages are strings codi-fied by a prefixed communication protocol. By this applicationthe MBMS can request a new simulation or access to storeddata.File Watcher. This process monitors the files on a shared folder.As soon as a new file is loaded by an FTP client, it analyses thecontents of the file and executes the corresponding operations.When a simulation goes to an end, the file watcher creates areport file in the same folder so that all data are available to theclient.
Furthermore, the MBMS shows data to the DM: if the currenterformance of the system is not satisfactory, then the DM canecide to evaluate the impact of some decision using a “what if”pproach. The MBMS allows the DM to run a simulation directlyithout the decision module control. This proposed solution is veryseful for the DM and contributes to generalize all the featuresffered by the DSS.
.5. The decision component
The MBMS server implements the decision component. In par-icular, it monitors the system state stored in the Data Systemomponent and decides if it is necessary to run a new simulationr not. Indeed, if the performances of the system decrease, then theecision component starts the optimization and the decision pro-edure. Fig. 4 shows how the used decision approach is based onhe optimization module and the validation by the simulation. Morerecisely, the optimization algorithm proposes some solutions thatre sent to the simulation module. The ICS provides the currenttate of the system by returning the values of the variables that can-ot be determined by the DSS that invokes the simulation module:he simulation starts and applies the proposed management strate-ies. The obtained performance indices allow evaluating the impactf the proposed solution on the system. Then a new set of candidateariables is passed to the simulation model and the process contin-es till the algorithm leads to a satisfactory decision described by
set of candidate variables. In this model, the candidate variablesre the controllable inputs that may change in the tactical or oper-tional decision making process. The proposed approach is generalnd it not strictly correlated to a specific case study.
In the proposed DSS, the hybrid optimization modulePSO + OCBA) is connected by a web service to the simulation mod-le. The optimization module sends inputs and the number ofeplications for each candidate solution/design and it records theutputs, again through the WS. On the basis of the current state ofhe system and the design variables, the DSS can be used to take
ecision both at the tactical and operational levels.Moreover, in order to give a description of the DSS activitiesnd actions and in particular how the decision component inter-cts with the simulation and optimization module, we use the UML
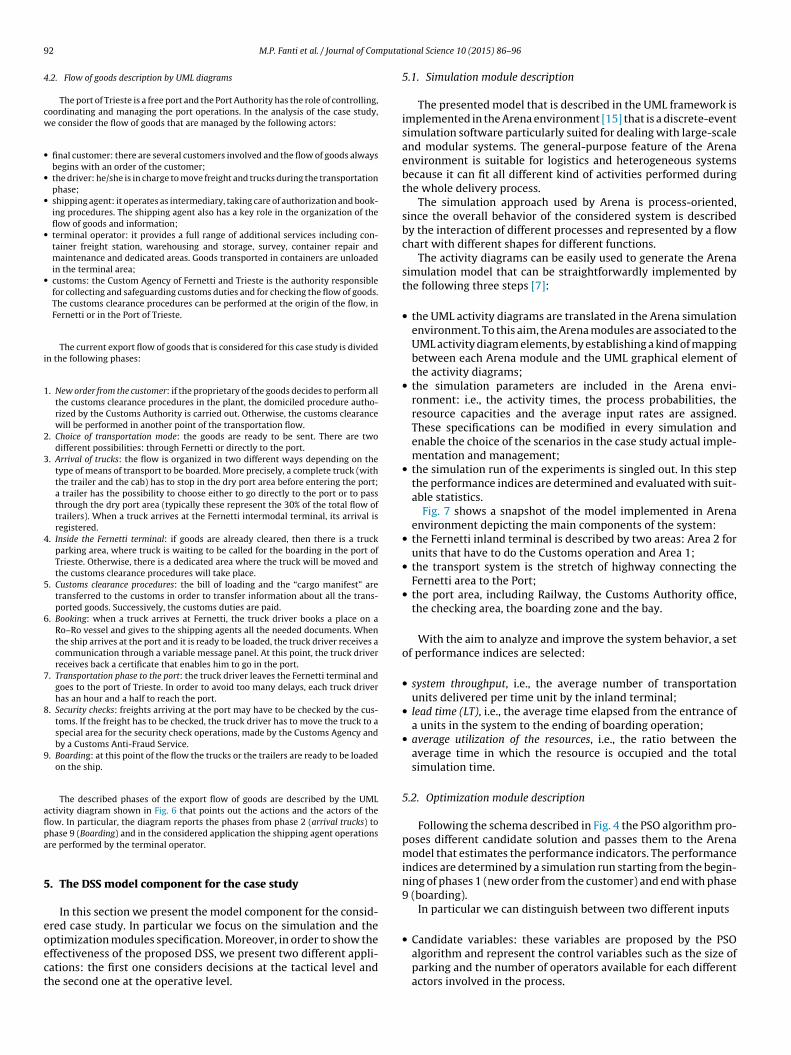
Fig. 5. The activity diagram of the DSS.
activity diagram shown in Fig. 5 that gives a description of the actionsequence that the components of DSS have to perform. The use ofswim lanes in the activity diagrams allows easily showing, whichpart of the system is responsible in each phase of the activities. Fig. 5shows that DSS activities start when the DM sends a new requestby the user interface and specifies the objectives. Then, the decisioncomponent retrieves data about the system from the data compo-nent, analyzes them and compares the system performances withthe objectives. Successively, the decision component decides if itnecessary to start an optimization process and a run a new simula-tion. In this case, the model component simulates the system andestimates the performances. If the results are satisfying, then thedecision is submitted to the DM by the user interface, otherwise anew decision is evaluated.
4. Case study
4.1. System description
This section specifies the DSS with the proposed structure in a specific real casestudy that includes the logistics network of the Port of Trieste, the dry port area of“Fernetti” and the ground connection.
The logistics system in the Friuli Venezia Giulia region (Italy) is particularly sig-nificant both for its geographical location, as the meeting point of the trans-EuropeanCorridor V and the Adriatic Corridor, and for its concentration of ports and land, seaand railway transport networks. A requirement analysis identifies two different con-figurations for the specific test case: one for the containers and one for the trucks. Inthe port of Trieste, the traffic of trucks directed to Turkey through a Ro–Ro servicerepresents a consolidated traffic. The containers have large areas to be warehousedin the port. On the contrary, a limited space is dedicated to the truck parking area.Hence, the study of the optimization of the truck paths between the port area and thedry port area is crucial and needs the application of suitable management strategies.
The intermodal terminal of Fernetti includes two different areas: an area of 120parking places for the trucks that have to perform customs clearance operations. Foreach ship about 15–20 trucks perform the customs clearance in this area. A secondarea is devoted to the trucks that are waiting to be called in the port: it has 252places and it represents the zone that has a function of the real dry port area.
Of the total number of trucks arriving at the port of Trieste, the 30% of thempass through Fernetti. In particular, there is a local regulation imposing that all thecomplete trucks have to stop at Fernetti. Therefore, the remaining truck trailers thathave to be loaded on the Ro–Ro ship arrive directly at the port by motorway or by
trucks. The volume of the traffic in 2010 was of about 105.000 loaded units (37.000complete trucks and 68.000 truck trailers), divided in 15 ships per week. In nor-mal conditions the waiting time before loading is about 25/30 hours but in case ofcongestion it can even reach 100 hours.
9 putat
4
cw
•
•
•
•
•
i
1
2
3
4
5
6
7
8
9
aflpa
5
eoect
2 M.P. Fanti et al. / Journal of Com
.2. Flow of goods description by UML diagrams
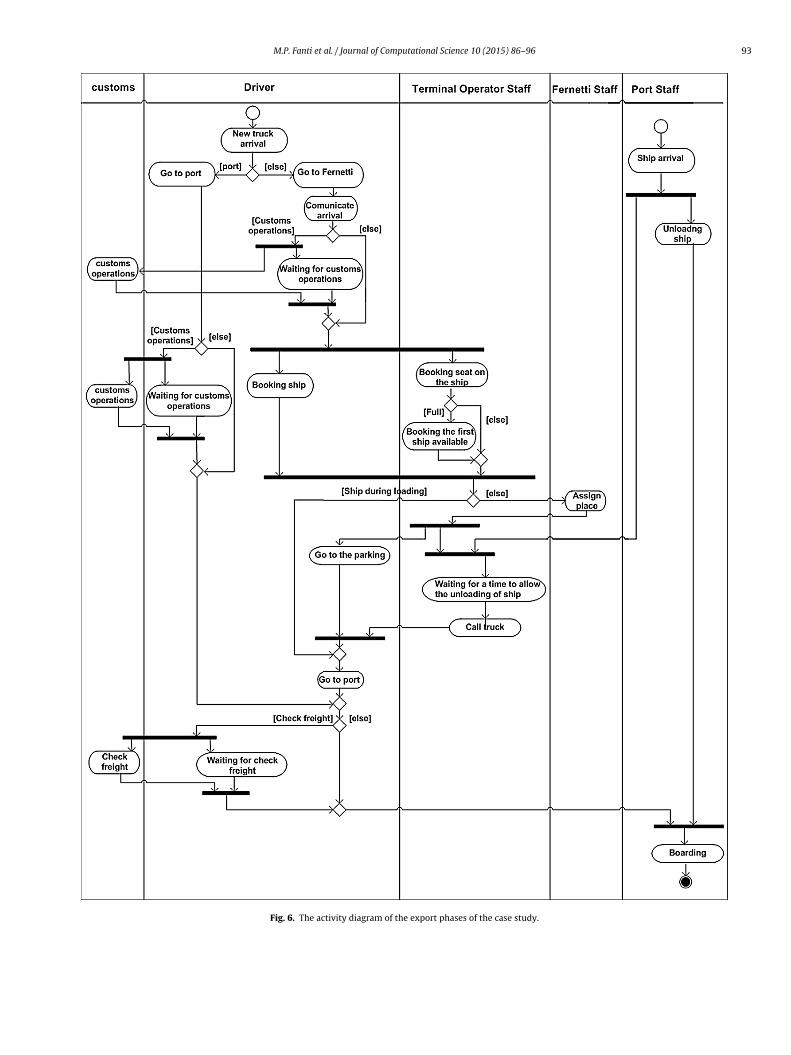
The port of Trieste is a free port and the Port Authority has the role of controlling,oordinating and managing the port operations. In the analysis of the case study,e consider the flow of goods that are managed by the following actors:
final customer: there are several customers involved and the flow of goods alwaysbegins with an order of the customer;the driver: he/she is in charge to move freight and trucks during the transportationphase;shipping agent: it operates as intermediary, taking care of authorization and book-ing procedures. The shipping agent also has a key role in the organization of theflow of goods and information;terminal operator: it provides a full range of additional services including con-tainer freight station, warehousing and storage, survey, container repair andmaintenance and dedicated areas. Goods transported in containers are unloadedin the terminal area;customs: the Custom Agency of Fernetti and Trieste is the authority responsiblefor collecting and safeguarding customs duties and for checking the flow of goods.The customs clearance procedures can be performed at the origin of the flow, inFernetti or in the Port of Trieste.
The current export flow of goods that is considered for this case study is dividedn the following phases:
. New order from the customer: if the proprietary of the goods decides to perform allthe customs clearance procedures in the plant, the domiciled procedure autho-rized by the Customs Authority is carried out. Otherwise, the customs clearancewill be performed in another point of the transportation flow.
. Choice of transportation mode: the goods are ready to be sent. There are twodifferent possibilities: through Fernetti or directly to the port.
. Arrival of trucks: the flow is organized in two different ways depending on thetype of means of transport to be boarded. More precisely, a complete truck (withthe trailer and the cab) has to stop in the dry port area before entering the port;a trailer has the possibility to choose either to go directly to the port or to passthrough the dry port area (typically these represent the 30% of the total flow oftrailers). When a truck arrives at the Fernetti intermodal terminal, its arrival isregistered.
. Inside the Fernetti terminal: if goods are already cleared, then there is a truckparking area, where truck is waiting to be called for the boarding in the port ofTrieste. Otherwise, there is a dedicated area where the truck will be moved andthe customs clearance procedures will take place.
. Customs clearance procedures: the bill of loading and the “cargo manifest” aretransferred to the customs in order to transfer information about all the trans-ported goods. Successively, the customs duties are paid.
. Booking: when a truck arrives at Fernetti, the truck driver books a place on aRo–Ro vessel and gives to the shipping agents all the needed documents. Whenthe ship arrives at the port and it is ready to be loaded, the truck driver receives acommunication through a variable message panel. At this point, the truck driverreceives back a certificate that enables him to go in the port.
. Transportation phase to the port: the truck driver leaves the Fernetti terminal andgoes to the port of Trieste. In order to avoid too many delays, each truck driverhas an hour and a half to reach the port.
. Security checks: freights arriving at the port may have to be checked by the cus-toms. If the freight has to be checked, the truck driver has to move the truck to aspecial area for the security check operations, made by the Customs Agency andby a Customs Anti-Fraud Service.
. Boarding: at this point of the flow the trucks or the trailers are ready to be loadedon the ship.
The described phases of the export flow of goods are described by the UMLctivity diagram shown in Fig. 6 that points out the actions and the actors of theow. In particular, the diagram reports the phases from phase 2 (arrival trucks) tohase 9 (Boarding) and in the considered application the shipping agent operationsre performed by the terminal operator.
. The DSS model component for the case study
In this section we present the model component for the consid-red case study. In particular we focus on the simulation and theptimization modules specification. Moreover, in order to show theffectiveness of the proposed DSS, we present two different appli-ations: the first one considers decisions at the tactical level andhe second one at the operative level.
ional Science 10 (2015) 86–96
5.1. Simulation module description
The presented model that is described in the UML framework isimplemented in the Arena environment [15] that is a discrete-eventsimulation software particularly suited for dealing with large-scaleand modular systems. The general-purpose feature of the Arenaenvironment is suitable for logistics and heterogeneous systemsbecause it can fit all different kind of activities performed duringthe whole delivery process.
The simulation approach used by Arena is process-oriented,since the overall behavior of the considered system is describedby the interaction of different processes and represented by a flowchart with different shapes for different functions.
The activity diagrams can be easily used to generate the Arenasimulation model that can be straightforwardly implemented bythe following three steps [7]:
• the UML activity diagrams are translated in the Arena simulationenvironment. To this aim, the Arena modules are associated to theUML activity diagram elements, by establishing a kind of mappingbetween each Arena module and the UML graphical element ofthe activity diagrams;
• the simulation parameters are included in the Arena envi-ronment: i.e., the activity times, the process probabilities, theresource capacities and the average input rates are assigned.These specifications can be modified in every simulation andenable the choice of the scenarios in the case study actual imple-mentation and management;
• the simulation run of the experiments is singled out. In this stepthe performance indices are determined and evaluated with suit-able statistics.
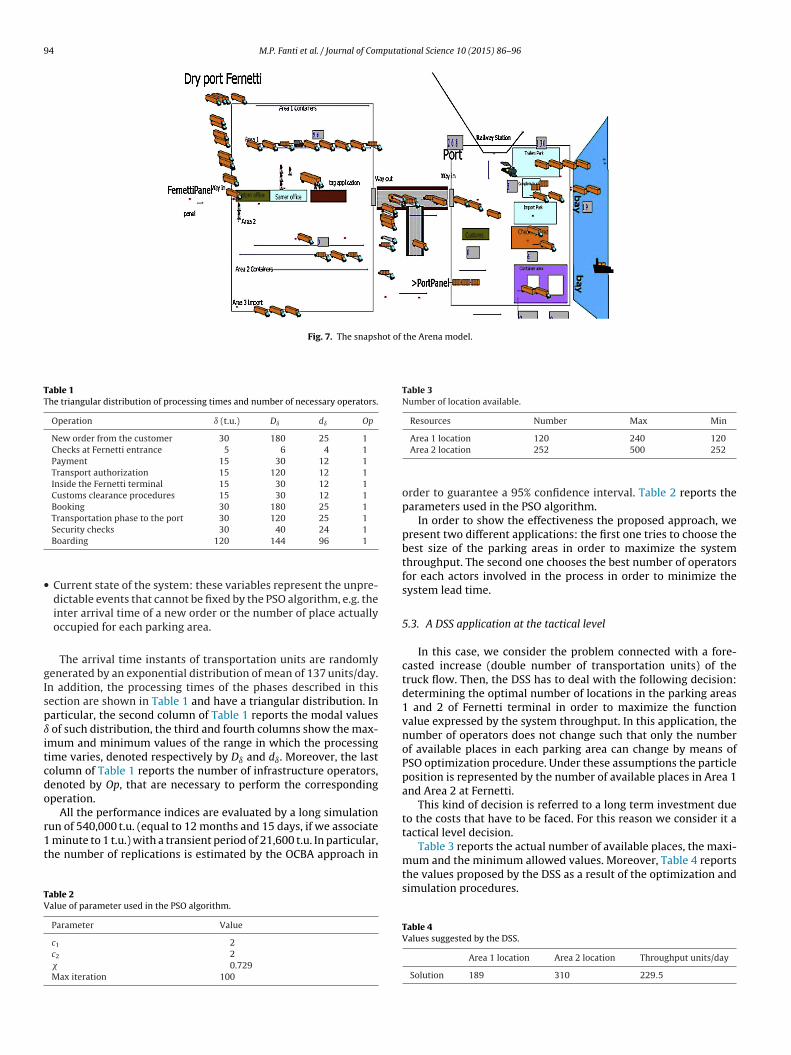
Fig. 7 shows a snapshot of the model implemented in Arenaenvironment depicting the main components of the system:
• the Fernetti inland terminal is described by two areas: Area 2 forunits that have to do the Customs operation and Area 1;
• the transport system is the stretch of highway connecting theFernetti area to the Port;
• the port area, including Railway, the Customs Authority office,the checking area, the boarding zone and the bay.
With the aim to analyze and improve the system behavior, a setof performance indices are selected:
• system throughput, i.e., the average number of transportationunits delivered per time unit by the inland terminal;
• lead time (LT), i.e., the average time elapsed from the entrance ofa units in the system to the ending of boarding operation;
• average utilization of the resources, i.e., the ratio between theaverage time in which the resource is occupied and the totalsimulation time.
5.2. Optimization module description
Following the schema described in Fig. 4 the PSO algorithm pro-poses different candidate solution and passes them to the Arenamodel that estimates the performance indicators. The performanceindices are determined by a simulation run starting from the begin-ning of phases 1 (new order from the customer) and end with phase9 (boarding).
In particular we can distinguish between two different inputs
• Candidate variables: these variables are proposed by the PSOalgorithm and represent the control variables such as the size ofparking and the number of operators available for each differentactors involved in the process.
M.P. Fanti et al. / Journal of Computational Science 10 (2015) 86–96 93
Fig. 6. The activity diagram of the export phases of the case study.
94 M.P. Fanti et al. / Journal of Computational Science 10 (2015) 86–96
Fig. 7. The snapshot of the Arena model.
Table 1The triangular distribution of processing times and number of necessary operators.
Operation ı (t.u.) Dı dı Op
New order from the customer 30 180 25 1Checks at Fernetti entrance 5 6 4 1Payment 15 30 12 1Transport authorization 15 120 12 1Inside the Fernetti terminal 15 30 12 1Customs clearance procedures 15 30 12 1Booking 30 180 25 1Transportation phase to the port 30 120 25 1
•
gIspıitcdo
r1t
TV
Table 3Number of location available.
Resources Number Max Min
Security checks 30 40 24 1Boarding 120 144 96 1
Current state of the system: these variables represent the unpre-dictable events that cannot be fixed by the PSO algorithm, e.g. theinter arrival time of a new order or the number of place actuallyoccupied for each parking area.
The arrival time instants of transportation units are randomlyenerated by an exponential distribution of mean of 137 units/day.n addition, the processing times of the phases described in thisection are shown in Table 1 and have a triangular distribution. Inarticular, the second column of Table 1 reports the modal values
of such distribution, the third and fourth columns show the max-mum and minimum values of the range in which the processingime varies, denoted respectively by Dı and dı. Moreover, the lastolumn of Table 1 reports the number of infrastructure operators,enoted by Op, that are necessary to perform the correspondingperation.
All the performance indices are evaluated by a long simulation
un of 540,000 t.u. (equal to 12 months and 15 days, if we associateminute to 1 t.u.) with a transient period of 21,600 t.u. In particular,he number of replications is estimated by the OCBA approach in
able 2alue of parameter used in the PSO algorithm.
Parameter Value
c1 2c2 2� 0.729Max iteration 100
Area 1 location 120 240 120Area 2 location 252 500 252
order to guarantee a 95% confidence interval. Table 2 reports theparameters used in the PSO algorithm.
In order to show the effectiveness the proposed approach, wepresent two different applications: the first one tries to choose thebest size of the parking areas in order to maximize the systemthroughput. The second one chooses the best number of operatorsfor each actors involved in the process in order to minimize thesystem lead time.
5.3. A DSS application at the tactical level
In this case, we consider the problem connected with a fore-casted increase (double number of transportation units) of thetruck flow. Then, the DSS has to deal with the following decision:determining the optimal number of locations in the parking areas1 and 2 of Fernetti terminal in order to maximize the functionvalue expressed by the system throughput. In this application, thenumber of operators does not change such that only the numberof available places in each parking area can change by means ofPSO optimization procedure. Under these assumptions the particleposition is represented by the number of available places in Area 1and Area 2 at Fernetti.
This kind of decision is referred to a long term investment dueto the costs that have to be faced. For this reason we consider it atactical level decision.
Table 3 reports the actual number of available places, the maxi-
mum and the minimum allowed values. Moreover, Table 4 reportsthe values proposed by the DSS as a result of the optimization andsimulation procedures.Table 4Values suggested by the DSS.
Area 1 location Area 2 location Throughput units/day
Solution 189 310 229.5
M.P. Fanti et al. / Journal of Computational Science 10 (2015) 86–96 95
Table 5Number of available operators.
Resources Number Max Min
Forwarders in Fernetti 6 10 1Customs staff in port 2 10 1Port area staff 8 20 1Customs staff in Fernetti 4 10 1Area staff in Fernetti 6 20 1
i2ari
ePvc
5
nFbfl1
nPfob
(bowa
rbd
ttbili
TR
Forwarders in port 6 6 6
At the tactical level, the solution offered by the DSS shows anncrement in Area 1 as well as in Area 2 to obtain a throughput of29.5 units/day. More in detail, the DSS suggests a higher percent-ge increment of Area 1 (+57%) with respect to Area 2 (+23%): thisesult was expected because the custom operations are performedn Area 1.
The first column of Table 5 reports the number of operators forach resource. We remark that in the presented case study, theSO + OCBA algorithm determines the system throughput (functionalue) for a single particle position by 14 iterations in the worstase. Finally, the total decision process requires 33 min.
.4. A DSS application at the operational level
At the operation level the DM needs to evaluate the optimalumber of operators that should daily work in the port and in theernetti terminal, in order to minimize the function value expressedy the average lead time. This decision is based on the expectedows of trucks for the successive day: we assume an input flow of37 trucks/day.
In this application the number of places in the Fernetti areas doesot change and the number of operators can change by means ofSO + OCBA optimization procedure. Table 3 shows in the third andorth column the maximum and minimum possible numbers of theperators, respectively. Hence, the particle position is representedy the number of available operators in the Fernetti terminal.
The actual average lead time is about of 750 minutes12.5 hours). On the other hand, Table 6 shows the “optimal” num-er of the operators proposed by the DSS: a total number of 33perators (only one more) and a suitable re-assignment of theorkers to the teams. Considering such number of operators the
verage lead time results reduced to 534 minutes (about 9 hours).We remark that in the presented case study, the PSO-OCBA algo-
ithm determines the system throughput (function value) for theest particle position by 8 iterations in the worst case and the totalecision process requires 32 minutes.
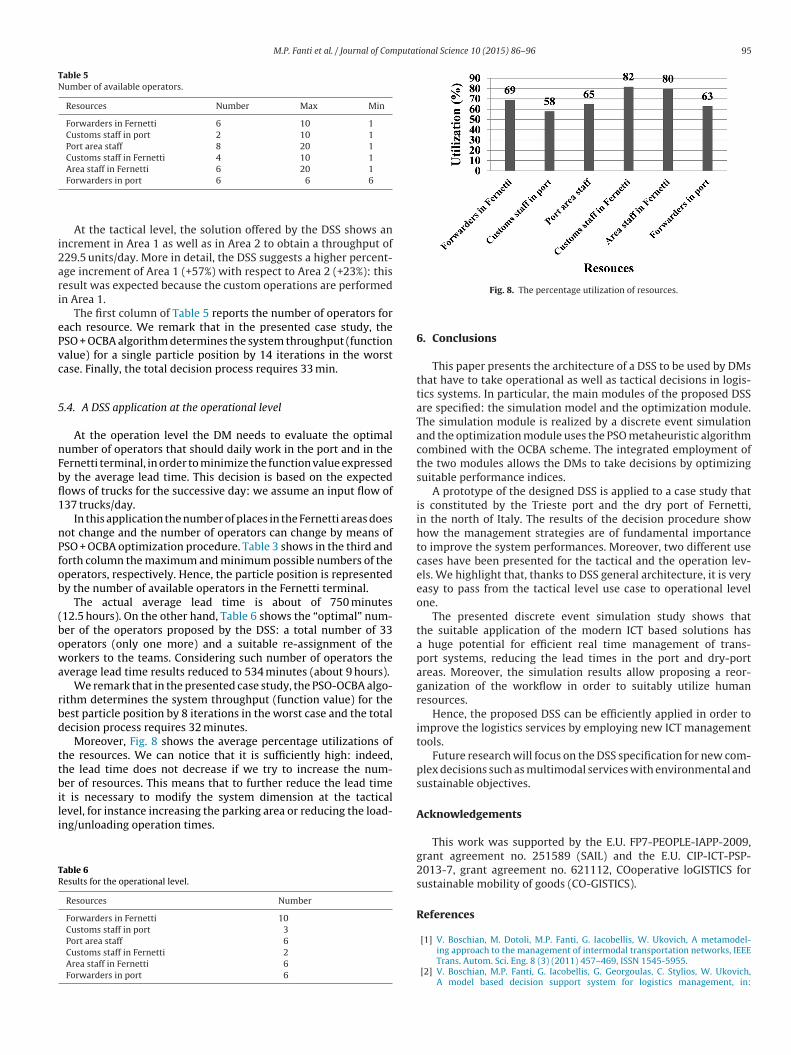
Moreover, Fig. 8 shows the average percentage utilizations ofhe resources. We can notice that it is sufficiently high: indeed,he lead time does not decrease if we try to increase the num-er of resources. This means that to further reduce the lead time
t is necessary to modify the system dimension at the tactical
evel, for instance increasing the parking area or reducing the load-ng/unloading operation times.able 6esults for the operational level.
Resources Number
Forwarders in Fernetti 10Customs staff in port 3Port area staff 6Customs staff in Fernetti 2Area staff in Fernetti 6Forwarders in port 6
Fig. 8. The percentage utilization of resources.
6. Conclusions
This paper presents the architecture of a DSS to be used by DMsthat have to take operational as well as tactical decisions in logis-tics systems. In particular, the main modules of the proposed DSSare specified: the simulation model and the optimization module.The simulation module is realized by a discrete event simulationand the optimization module uses the PSO metaheuristic algorithmcombined with the OCBA scheme. The integrated employment ofthe two modules allows the DMs to take decisions by optimizingsuitable performance indices.
A prototype of the designed DSS is applied to a case study thatis constituted by the Trieste port and the dry port of Fernetti,in the north of Italy. The results of the decision procedure showhow the management strategies are of fundamental importanceto improve the system performances. Moreover, two different usecases have been presented for the tactical and the operation lev-els. We highlight that, thanks to DSS general architecture, it is veryeasy to pass from the tactical level use case to operational levelone.
The presented discrete event simulation study shows thatthe suitable application of the modern ICT based solutions hasa huge potential for efficient real time management of trans-port systems, reducing the lead times in the port and dry-portareas. Moreover, the simulation results allow proposing a reor-ganization of the workflow in order to suitably utilize humanresources.
Hence, the proposed DSS can be efficiently applied in order toimprove the logistics services by employing new ICT managementtools.
Future research will focus on the DSS specification for new com-plex decisions such as multimodal services with environmental andsustainable objectives.
Acknowledgements
This work was supported by the E.U. FP7-PEOPLE-IAPP-2009,grant agreement no. 251589 (SAIL) and the E.U. CIP-ICT-PSP-2013-7, grant agreement no. 621112, COoperative loGISTICS forsustainable mobility of goods (CO-GISTICS).
References
[1] V. Boschian, M. Dotoli, M.P. Fanti, G. Iacobellis, W. Ukovich, A metamodel-ing approach to the management of intermodal transportation networks, IEEETrans. Autom. Sci. Eng. 8 (3) (2011) 457–469, ISSN 1545-5955.
[2] V. Boschian, M.P. Fanti, G. Iacobellis, G. Georgoulas, C. Stylios, W. Ukovich,A model based decision support system for logistics management, in:
9 putat
[
[
[
[
[
[
[
[
[
[
[
[
[
httamfCETIL
6 M.P. Fanti et al. / Journal of Com
Proceedings of the 25th European Modeling & Simulation Symposium(Simulation in Industry), 25–27 September 2013, Athens, Greece, 2013,pp. 364–369.
[3] C.H. Chen, L.H. Lee, Stochastic Simulation Optimization: An Optimal ComputingBudget Allocation, World Scientific Publishing Co., Singapore, 2010.
[4] C.H. Chen, J. Lin, E. Yücesan, S.E. Chick, Simulation budget allocation for furtherenhancing the efficiency of ordinal optimization, J. Discret. Event Dyn. Syst.:Theory Appl. 10 (2000) 251–270.
[5] M. Clerc, J. Kennedy, The particle swarm – explosion, stability, and convergencein a multidimensional complex space, IEEE Trans. Evol. Comput. 6 (1) (2002)58–73.
[6] M. Dotoli, M.P. Fanti, A.M. Mangini, G. Stecco, W. Ukovich, The impact of ICT onintermodal transportation systems: a modelling approach by Petri nets, ControlEng. Pract. 18 (8) (2010) 893–903.
[7] M.P. Fanti, G. Iacobellis, G. Georgoulas, C. Stylios, W. Ukovich, A decision supportsystem for intermodal transportation networks management, in: Proceedings24th European Modeling & Simulation Symposium, September, 19–21, 2012,Vienna, Austria, 2012.
[8] J.-L. Gallego, J.-L. Farges, J.-J. Henry, Design by Petri nets of an intersection signalcontroller, Transp. Res. C 4 (4) (1996) 231–248.
[9] G. Giani, G. Laporte, R. Musmanno, Introduction to Logistics Systems Planningand Control, Willey, England, 2004.
10] W.D. Kelton, R.P. Sadowski, N.B.R. Swets, Simulation With Arena, 5th ed.,McGraw-Hill, Boston, MA, 2009.
11] J. Kennedy, R.C. Eberhart, Particle swarm optimization, in: Proceedings of theIEEE International Conference on Neural Networks, Perth, Australia, 1995,pp. 1942–1948.
12] L. Lättilä, V. Henttu, O.-P. Hilmola, Hinterland operations of sea ports do matter:dry port usage effects on transportation costs and CO2 emissions, Transp. Res.E 55 (2013) 23–42.
13] F. Parola, A. Sciomachen, Intermodal container flows in a port system network:analysis of possible growths via simulation models, Int. J. Prod. Econ. 97 (2005)75–88.
14] K.E. Parsopoulos, M.N. Vrahatis, Particle Swarm Optimization and Intelligence:Advances and Applications, Information Science Publishing, IGI Global, USA,2010.
15] D. Power, Decision Support Systems: Concepts and Resources, Quorum Books,Westport, USA, 2002.
16] L. Ramstedt, J. Woxenius, Modelling approaches to operational decision-making in freight transport chains, in: Proc. 18th NOFOMA Conference, Oslo,7–8 June, Norway, 2006.
17] V. Roso, Factors influencing implementation of a dry port, Int. J. Phys. Distrib.Logist. Manag. 38 (10) (2008) 782–798.
18] V. Roso, J. Woxenius, K. Lumsden, The dry port concept: connecting con-tainer sea ports with the hinterland, J. Transp. Geogr. 17 (5) (2009)338–345.
19] R. Stahlbock, S. Voß, Operations research at container terminals: a literatureupdate, OR Spectrum 30 (2008) 1–52.
20] D. Steenken, S. Voß, R. Stahlbock, Container terminal operation and opera-tions research—a classification and literature review, OR Spectrum 26 (2004)3–49.
21] S. Vasilakos, G. Iacobellis, C.D. Stylios, M.P. Fanti, Decision support systemsbased on a UML description approach, in: In Proceedings of 6th IEEE Interna-tional Conference on Intelligent Systems IS’12, 6–8, September Sofia, Bulgaria,2012, pp. 41–46.
22] I.F.A. Vis, R. de Koster, Transhipment of containers at a container terminal: anoverview, Eur. J. Oper. Res. 147 (2003) 1–16.
M.P. Fanti received the Laurea degree in electronic engi-neering from the University of Pisa, Italy in 1983 and was aVisiting Researcher at the Rensselaer Polytechnic Instituteof Troy, New York, in 1999. Since 1983 she has been withthe Polytechnic of Bari (Italy), where she was AssistantProfessor from 1990 till 1998 and an associate professorfrom 1998 till 2012. Now she is Full Professor of Systemand Control Engineering in the Department of Electricaland Information Engineering of the same Polytechnic. Herresearch interests include discrete event systems, Petrinet, sensor networks, management and modeling of auto-mated manufacturing systems, automatic guided vehiclesystems, railway and traffic networks, supply chains, and
ealthcare systems. She has published around 210+ papers and two textbooks onhese topics. She was General Chair of the 2nd IFAC Workshop on Dependable Con-rol of Discrete Systems, the 2010 IEEE Workshop on Health Care Management,nd the 2011 IEEE Conference on Automation Science and Engineering. She wasember of the International Program Committees of around 30 international con-
erences. Prof. Fanti is Associate Editor of the IEEE TRANS. ON SYSTEMS, MAN, AND
YBERNETICS PART A, and Editor of the IEEE TRANS. ON AUTOMATION SCIENCE ANDNGINEERING. She is vice-chair of the IEEE Italy Section, Co-Chair of the IEEE SMCechnical committee on Discrete Event Systems, Chair of the Central & Southerntaly SMC Chapter, Chair of the IEEE RAS Technical committee on Automation inogistics.ional Science 10 (2015) 86–96
G. Iacobellis received the Laurea degree in electronicengineering and the Ph.D. degree in computer scienceengineering from the Polytechnic of Bari (Italy), in 2004and 2009, respectively. From February 2005 to February2006, he was a Research Fellow at Politecnico di Bari,from September 2009 to 2011 he has been a ResearchFellow at the University of Trieste, from 2011 to 2012he has been Experienced Researcher Fellowship (ER2) onDevelopment of Decision Support System DSS at Techno-logical Educational Institute of Epirus ad Arta (Greece).Since the 2012 he is Research fellow at Politecnico di Bari.His research interests include Decision Support System,modeling, simulation, and control of discrete event sys-
tems, Petri nets, supply chains and urban traffic networks, distribution and internallogistics, management of hazardous materials, management of drug distributionsystems, and healthcare systems.
W. Ukovich is Full Professor of Operations Research atthe University of Trieste, Italy. From 1974 to 1978, hewas in charge of the course of Electrical Engineering, andsince 1979 he holds the course of Operations Researchat the Faculty of Engineering. He has been a member ofthe Evaluation Boards of the National Research Council(CNR) of Italy, of the Universities of Trieste, Italy, and ofMacerata, Italy, of the Polytechnic of Turin, Italy, and ofthe University Institute of Architecture of Venice, Italy.His main research interests are in Optimization, Logis-tics, Transportation, Production Planning and Control andHealth Management Systems. He is the author of overone hundred scientific papers, which appeared in sev-
eral journals, including Operations Research, Management Science, SIAM Journal onAlgebraic and Discrete Methods, SIAM Journal on Optimization, IEEE Transactionson Robotics and Automation, IEEE Transactions on Automatic Control, Automat-ica, Journal of Optimization Theory and Applications, Naval Research Logistics,Networks, Transportation Research, International Journal of Production Research,International Journal of Production Economics, Computers and Operations Researchand European Journal of Operational Research.
V. Boschian graduated in management and logistics engi-neering in 2008, she obtained her Ph.D. at the Universityof Trieste in information technology engineering in March2012 focused on the study of multi-actor systems and ofthe impact of advanced ICT on intermodal logistic system.She is also working since February 2008 on logistic top-ics and working in different European projects founded inthe 7th EU Framework Program in the ICT area. Her experi-ence and knowledge of such topics related to logistics andintermodality allow her to actively work on EU-foundedand research project proposals and publications of scien-tific paper in proceedings of international conferences andin international journals.
G. Georgoulas holds a Diploma in Electrical and ComputerEngineering (1999, University of Patras), and a Ph.D. inData Processing (2006, University of Patras). From 2006to 2008 he worked as a postdoctoral fellow at the GeorgiaInstitute of Technology (Georgia Tech). From 2008 to2009 he worked as Scientific Associate (non-permanentAssistant Professor) at the Department of Applications ofInformation Technology in Management and Economics,Technological Educational Institute (TEI) of Ionian Islandsand at the Department of Informatics Engineering at theTEI of Epirus. Lately he was an Experienced ResearcherFellow (ER2) under the SAIL Marie Curie Project for theDevelopment of a Decision Support System. Currently he
is working as a research fellow at the Laboratory of Knowledge & Intelligent Comput-ing at the Department of Informatics Engineering at the TEI of Epirus. His expertiseand research interests involve areas such as Machine Learning, Computational Intel-ligence, Data Mining, Evolutionary based Global Optimization and Decision SupportSystems for complex environments.
C. Stylios is an Associate Professor at Dept. of ComputerEngineering, Technological Educational Institute of Epirus,Greece. He is also research collaborator at Computer Tech-nology Institute & Press “Diophantus”, Patras, Greece. Hewas a visitor assistant professor at Computer Science Dep.,University of Ioannina. He received his Ph.D. from theDepartment of Electrical & Computer Engineering, Uni-versity of Patras (1999) and the diploma in Electrical& Computer Engineering from the Aristotle Universityof Thessaloniki (1992). He has published over 135 jour-
nal and conference papers and book chapters. His mainscientific interests include: Fuzzy Cognitive Maps, SoftComputing &, Computational Intelligence Techniques,Signal Processing methods and Decision Support Systems. Prof. Stylios is memberof IEEE and member of the TC 8.2 and TC 5.4 of IFAC.