Embed Size (px)
Citation preview

A Smart IoT System for Remote RefrigerationMonitoringB Padmaja ( [email protected] )
Associate Professor, Department of CSE, Institute of Aeronautical Engineering, Hyderabad, IndiaVijayakumar Ch
Assistant Professor, Department of IT, Institute of Aeronautical Engineering, Hyderabad, IndiaE Krishna Rao Patro
Associate Professor, Department of CSE, Institute of Aeronautical Engineering, Hyderabad, IndiaB Shashirekha
Assistant Professor, Department of CSE (AI & ML), Institute of Aeronautical Engineering, Hyderabad,India
Research Article
Keywords: Internet of Things, Refrigeration Monitoring, Temperature Analysis, Edge Computing
Posted Date: April 30th, 2021
DOI: https://doi.org/10.21203/rs.3.rs-432649/v1
License: This work is licensed under a Creative Commons Attribution 4.0 International License. Read Full License

1
A Smart IoT System for Remote Refrigeration Monitoring
1, * B Padmaja, Associate Professor, Department of CSE, Institute of Aeronautical Engineering, Hyderabad,
India, [email protected]
2 Vijayakumar Ch, Assistant Professor, Department of IT, Institute of Aeronautical Engineering, Hyderabad,
India, [email protected]
3E Krishna Rao Patro, Associate Professor, Department of CSE, Institute of Aeronautical Engineering,
Hyderabad, India, [email protected]
4B Shashirekha, Assistant Professor, Department of CSE (AI & ML), Institute of Aeronautical Engineering,
Hyderabad, India, [email protected]
Abstract: The realm of refrigeration industry has marked its significance for storing food and beverages.
Refrigeration warehouses are extensively used to store various combinations of large fresh food stock at
favourable temperatures to maintain its quality. Any deviations from these favourable temperatures pose
negative impacts on the cold stock. Hence, it is essential to minimize the margin of these potential risks that can
incur huge loss to the cold-storage industries. On-site evaluation can be reliable to address these risks, but it is
time consuming and an inefficient process as human intervention can be prone to manual errors. The paper,
therefore, proposes a methodology to build a smart IoT system to remotely monitor and evaluate the
refrigeration warehouses seamlessly at one’s fingertips using a mobile or laptop through dashboards. Furthermore, this paper addresses the difficulties in managing and analysing the large sensory data which are the
result of seamless monitoring by unleashing the power of edge computing and cloud computing.
Keywords: Internet of Things; Refrigeration Monitoring; Temperature Analysis; Edge Computing;
I. Introduction
A network of things such as sensors, devices, embedded boards, computing resources, vehicles,
systems connected with each other to inter-communicate using the Internet as medium. IoT has enabled
communication and exchange of information among things and people in an easier way. All these connected
thing sare called as Smart Objects. IoT has expanded its significance in all major spheres of our lives. Smart
Home, Smart City, Smart Grid, Wearables, Smart Retail and Logistics, Health Care, Smart Agriculture and
Farming are evident use cases of the impact made by Internet of Things. All these applications brought a new
value to our lives. Majority of challenges faced in the logistics sector are addressed by the required use of IoT.
Newer developments in technologies with the incorporation of IoT shaped the future of logistics allowing
businesses to expand and be flexible with changes in industry demands. Continuous tracking of logistics, remote
tracking of logistics, asset monitoring, predictive asset monitoring, optimization of warehouse loads (inventory
control), optimization of routes, vehicle management and fleet management collectively contribute to the
deployment of Smart Logistics concept. In order to reduce the logistic expenses and avoid spoiling of goods
during transportation, continuous and remote monitoring of temperature and humidity is essential in containers
during transportation. A GUI helps in analyzing and supervising the essential parameters during food
transportations. Figure 1 depicts the industrial IoT eco system and its major applications.

2
Figure 1. Industrial IoT Ecosystem and its applications
Refrigeration warehouses in cold storage industry are generally used for storing fresh stock ranging
from variety of food. These places are artificially cooled to from a negative to positive degrees of Celsius based
on the requirements. These warehouses are usually located far away from the living life. Hence, any drastic
changes in the temperatures lead to negative result on the stored stock. These unprecedent situations can be
triggered unknowingly anytime. Hence, it is necessary to address that everything stored are in the permissible
limits of the temperature. Monitoring the temperature and logging the temperature during all instances will be an
ideal way for being vigilant before any immeasurable loss. With the enhanced evolution of Internet and sensors,
it is now achievable to address any problem. Henceforward, this paper proposes a methodology to build a smart
IoT system to remotely monitor and evaluate the refrigeration warehouses seamlessly at one’s fingertips using a mobile or laptop through dashboards.
The remainder of the paper is organized as follows: Section II presents the related literature in IoT
based monitoring systems, Section III presents the importance of Edge Computing in designing the proposed
system, Section IV presents the proposed system architecture, Section V elaborates the proposed system in the
experiment study performed, Section VII elaborates the technology stack used, followed by Conclusions in
Section VI.
II. Related Work
This section gives an overview of smart IoT monitoring solutions developed in the fields of smart
refrigeration, smart healthcare, smart city, smart environment, smart office, and other smart oriented use-cases.
Wu et al. [1] used an IoT based system to check the internal temperature of the refrigerators used in
transportation system. This system used RFID, temperature sensors, GPRS system to monitor food safety in
cold chain logistics. Heidmann et al. [2] proposed a supervision unit using low-power UHF / LF sensor system
using wireless low power sensor nodes for freight quality monitoring. The authors used a web-based interface
along with a virtual network to monitor the container and its essential control parameters using the data received
by sensor nodes. Mambou et al. [3] developed a simple and powerful monitoring system for pharmacy stores
using sensors to control the refrigeration temperature and medication search. The authors claimed their sensor-
based approach is cheaper than software-based system and useful for deprived area. Nasir et al. [4] merged the
idea of IoT and smart kitchen to develop a smart refrigeration system which consists of 3 modules such as
sensing, control and transmission module. All modules together determine the food quality and condition of the
refrigerator by notifying via SMS or email. Edger et al. [5] designed a PCB based monitoring system to check

3
the faults in a chain of refrigerators or cold chain which runs on conventional compressors. The authors used
cloud platform to send data and alarms to or from the cold storages using Sigfox wireless communication. This
system checks the operational failures, voltage, current and power consumption. It also controls and measure the
temperature inside the freezer. Song et al. [6] developed an IoT based smart controlling system to reduce energy
consumption of air conditioners (AC) to improve power efficiency. It includes three modules such as smart
meter, gateway and cloud. Smart meter performs the real-time monitoring of temperature in the AC’s and the readings are stored in a cloud server via gateway. Meimei et al. [7] designed a food cold chain monitoring
system using ZigBee, GPS, GPRS, GIS, embedded system and a remote database. This system performs real-
time monitoring of location information using a remote network. Faz et al. [8] proposed a low-cost IoT system
for monitoring temperature in freezers using a Wi-Fi microcontroller along with temperature sensors. Authors
used clod platform to store and analyze data and helps in supervising various parameters such as light, energy
consumption etc.
Furthermore, Othman et al. [9] proposed an edge-computing based smart energy solution which
monitors the performance of a small-scale standalone PV plant. The edge-device used was responsible to
acquire desired data, perform required processing and then display data for remote performance monitoring of
this PV plant. Desired data included voltage, current, ambient temperature. Baumgartner et al.[10] studied
environment monitoring using a wide variety of sensors acquiring different forms of data on different kinds of
edge computing devices ranging from microcontrollers to microprocessors. Sinha et al. [11] studied the use of
edge devices in smart home solutions by monitoring the total power consumption of domestic appliances and
allowed the user to set up the limits for power consumption for every appliance. Katalina et al. [12] proposed an
edge-computing based smart environment solution which monitors the real-time air quality and classifies
quantitative interpretation of air quality as fresh air, low pollution, medium pollution, high pollution and very
high pollution based on by processing the data acquired and using a metric. This solution uploads a new data
entry into the cloud if there is any deviation observed from the known classifications. The applications of IoT
along with edge and cloud computing are endless. Table 1. depicts some of the important details about the use of
computing devices, sensors and its applications.
Table 1. Overview of components and applications used in the state-of-the-art literature
References Edge Controller Sensors Applications
[1] 8051 Micro
Controller
RFID, Temperature measurement
module (RF SoC NRF9E5 and digit
temperature sensor DS18B20),
GPRS, Wireless Infrared Sensors,
Monitoring the internal temperature
of the Refrigerated Transport
Vehicles
[2] Wireless Low-power
UHF / LF sensor
network
A base station, OSGi-framework,
UHF transceiver, an additional 3D-
LF interface
Intelligent Container Monitoring
System
[3] Raspberry Pi Ambient sensors, EN15251 module,
Comfort Box
IoT based Indoor Personal Comfort
Levels Monitoring System
[4] Arduino UNO Load cell, odor sensor, LCD module
and Wi-Fi module
IoT based Smart Refrigerator
System to reduce Food spoilage
[5] SigFox Module Temperature Controller, Electronic
Paper Display (EPD)
Designed to monitor faults in chain
of refrigerators or freezers.
[6] Zigbee Module Smart Meter (Temperature, humidity
sensor, the integrated infrared
controller, the electrical switch, the
IoT-based Smart Controlling
System to save electricity

4
power monitor, the Zigbee end node) consumption of air conditioners
[7] ARM ZigBee, GPS, GPRS, GIS Remote Food Cold Chain
Monitoring System
[8] ESP-8266-Wi-Fi
microcontroller
DS18B20 temperature sensors,
ThingSpeak IoTplatform
Remote supervision of light control,
energy efficiency of refrigeration in the food chain
[9] Raspberry-Pi A voltage divider, Current Sensor
(ACS 712 – 30A), Temperature
Sensor (LM35)
Smart Energy Solution monitoring
the performance of PV Plant.
[10] Microcontrollers &
microprocessors
Wide Range of Sensors Evaluative study of low-cost
hardware and wireless
communication for environmental
monitoring.
[11] Beagle-Bone
Blackboard
Hall Effect Sensor (ACS712) Smart Home Solution monitoring
the total power consumption.
[12] Raspberry-Pi Grove Pi, Grove Dust Sensor, Grove
Air Quality Sensor
Smart Environment Solution
monitoring the real-time air quality.
III. Edge Computing
IoT has made things such as computing devices, mechanical machines and smart devices connected via
the internet and enabled the ease of communication with each other. Al-Fuqaha et al. defined IoT as the
interconnectivity of real-world smart objects with the global network of sensors and computing devices
communicating through standard protocols to share the information [13, 15]. Generally, most of the IoT devices
are equipped with sensors to detect and monitor the changes in the environment by using the data which is
generated by these devices. According to CISCO, the number of things connected to the internet is growing at
an unprecedented rate and it is expected that there will be a total number of 50 Billion number of IoT connected
devices [14, 16]. These multiple devices with multiple sensors which can sense the changes, collects and
produces a huge amount of continuous data. Analysis on the IoT based Big Data helps to give meaningful and
instantaneous insights to facilitate real-time monitoring of things by using techniques machine learning and deep
learning approaches. It requires high computational capability to pre-process, analyse and find the hidden
patterns to make sense of Big-Data. In this regard, the involvement of Cloud Computing to deploy the above
techniques compensates high operational and computational requirement. Cloud Computing is a platform to
leverage the use of physical and virtual resources, storage capabilities, infrastructure, and many more services
provided based on the requirement of the end-users such as firms and organizations. Cloud based computing
systems can perform CPU and GPU intensive computation in an unbelievable rate. Therefore, it is necessary to
transport the data to the central Cloud for using the analytical techniques to meet computational costs.
Transporting the huge amount of data which is generated at every instance to cloud constantly demands good
Internet connectivity, low latency, high bandwidth, and large storage capacities. This results in a very huge
transportation cost to the user.
Transportation costs can be fairly reduced by adopting the new paradigm which focuses on shifting away the
heavy workloads from Cloud to IoT nodes of the network. This new paradigm is called as ‘Edge-
Computing’.Edge Computing can briefly be defined as the distributed real-time data processing concept
deployed at the edge of the network to address the low-latency communication. The shift of adopting edge-
computing from conventional ways is already observed in many of the researcher’s studies along with industrial implementations.

5
Edge computing processes data on IoT network that is located close to the point of data creation. In short, it
does minimal pre-processing of huge data at the edge of the network before transporting data into cloud service.
This way it creates an impact on transportation cost by reducing the needs of high bandwidth and low latency.
World is adopting ‘Edge-computing’ as part of their IoT solutions and it is evident in research reports [17,18].
Edge Computing aims in handling a certain amount of workload at the edge-nodes of the network. These nodes
are generally the devices to which sensors are attached to or gateway devices which are close to the sensors.
Offloading the infrastructure load to the edge of the network immensely reduces the latency, communication
overhead and related issues. IoT based Edge Computing infrastructure can be deployed to the existing IoT
networks by introducing computational capacity to the end nodes, which communicate to the Cloud via one or
more gateways as shown in Figure 2. Edge nodes in the figure comprises of variety of sensors, micro-
controllers, single board computers and other radio frequency transmitters. Gateways are wireless data receivers,
routers, switches and other computational resources. Cloud is the computing infrastructure, which is provided by
various technology giants like Amazon, Google, Alibaba, Microsoft, etc. Based on the requirement, computation
can be carried at the gateways as well. The computation at the middle layer that is at gateways is called as ‘Fog Computing’.
Figure 2. Edge Computing in IoT Systems
IV. Proposed System Architecture
Sensors generate data and scaling up the sensors to a distributed environment in a large cold-storage
warehouse results in generation of huge amount of data. Therefore, the proposed system aims in the use of Edge
Computing by handling a certain amount of workload at the edge-nodes of the network enabling the use of
decentralization. Amalgamating the concepts of ‘Internet of Things’ and ‘Edge-Computing’ in a novel way to meet remote monitoring, this paper uses a three-tier architecture as shown in Figure 3 for the proposed IoT
System.
The three layers are as follows:
(i) Edge Layer (ii) Server Layer and (iii) Application layer.
6
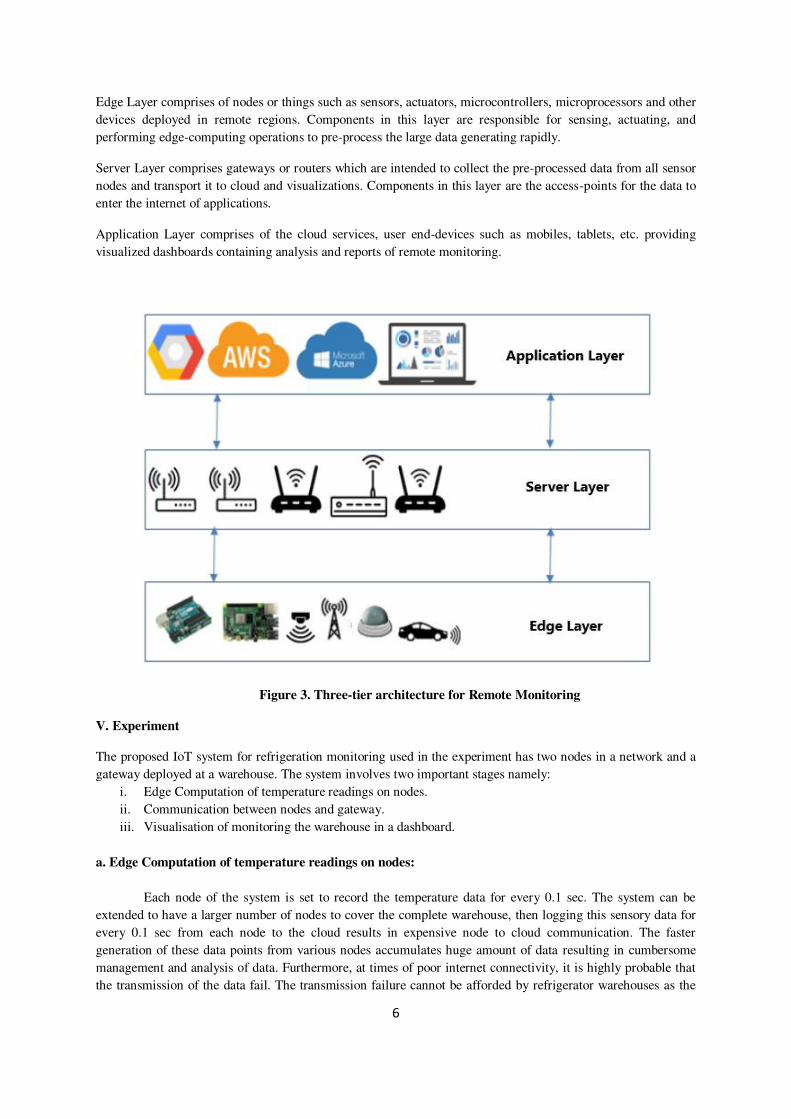
Edge Layer comprises of nodes or things such as sensors, actuators, microcontrollers, microprocessors and other
devices deployed in remote regions. Components in this layer are responsible for sensing, actuating, and
performing edge-computing operations to pre-process the large data generating rapidly.
Server Layer comprises gateways or routers which are intended to collect the pre-processed data from all sensor
nodes and transport it to cloud and visualizations. Components in this layer are the access-points for the data to
enter the internet of applications.
Application Layer comprises of the cloud services, user end-devices such as mobiles, tablets, etc. providing
visualized dashboards containing analysis and reports of remote monitoring.
Figure 3. Three-tier architecture for Remote Monitoring
V. Experiment
The proposed IoT system for refrigeration monitoring used in the experiment has two nodes in a network and a
gateway deployed at a warehouse. The system involves two important stages namely:
i. Edge Computation of temperature readings on nodes.
ii. Communication between nodes and gateway.
iii. Visualisation of monitoring the warehouse in a dashboard.
a. Edge Computation of temperature readings on nodes:
Each node of the system is set to record the temperature data for every 0.1 sec. The system can be
extended to have a larger number of nodes to cover the complete warehouse, then logging this sensory data for
every 0.1 sec from each node to the cloud results in expensive node to cloud communication. The faster
generation of these data points from various nodes accumulates huge amount of data resulting in cumbersome
management and analysis of data. Furthermore, at times of poor internet connectivity, it is highly probable that
the transmission of the data fail. The transmission failure cannot be afforded by refrigerator warehouses as the

7
data is utmost essential to make any analysis, if required. Hence, this stage uses the strategy of ‘window segmentation’. Each window has a length of 300 units, each unit corresponds to temperature data reading collected for every 0.1 sec. Hence, each window is a span of 30 sec. Adding further, these windows are
segmented into statistical parameters such as mean, median and standard deviation by edge-computing.
Mean plays its significance in the system by displaying a value which wholly represents the window of
temperature readings. It is a compact form of representing the span of 30 seconds. The deviations of mean value
readings from the threshold temperature of the warehouse (the temperature at which the warehouse should be
operated) triggers the warnings in form of messages or emails. Mean is also helpful to compare the operation of
other nodes i.e. it can be implied if they are operating correctly. The mean of the window is edge computed at
the nodes as given in equation 1.
(1)
Where,
(2)
Medianplays its significance in the system by indicating the presence of outlier temperature readings (the
readings which are deviated to far apart). It is because mean is affected the most in the presence of outliers.
Hence, the greater difference in mean and median of a window indicates that temperature is fluctuating signing
the importance to pay attention to the space of warehouse where this certain node is deployed.Timsort which is a
hybrid of merge and insertion sort is used to sort the window as given in equation 3 prior to the edge
computation of median of the window at the nodes as given in equation 4.
(3)
(4)
Standard deviation plays its significance in the system by giving an approximate view of the spread of data
readings in the window around the mean. The higher standard deviation indicates that the temperature readings
of the window are widely spread implying that readings are less reliable. The lower standard deviation indicates
that the temperature readings of the window are clustered closely implying that window of readings are more
reliable. This parameter judges the trust of readings giving the user higher confidences of the system. The
standard deviation of the window is edge computed at the nodes as given in equation 5.
(5)
b. Communication between nodes and gateway:
The edge-computed data of the windows from all the nodes is sent to the gateway (access-point) using
Message Queuing Telemetry Transport (MQTT), an IoT Communication Protocol. MQTT follows Publish-
Subscribe Model. Publish-subscribe model consists of three components namely Broker, Publisher and
Subscriber. Broker is the central point in the architecture, which is responsible for filtration and segregation of

8
messages which are published by a publisher. A publisher is responsible for posting data onto a topic into the
broker, whereas a subscriber is responsible to receive data from the broker on a subscribed topic without always
requesting the broker for information. In the stage, nodes are publishers, gateway is the broker and dashboards
along with cloud services are subscribers.
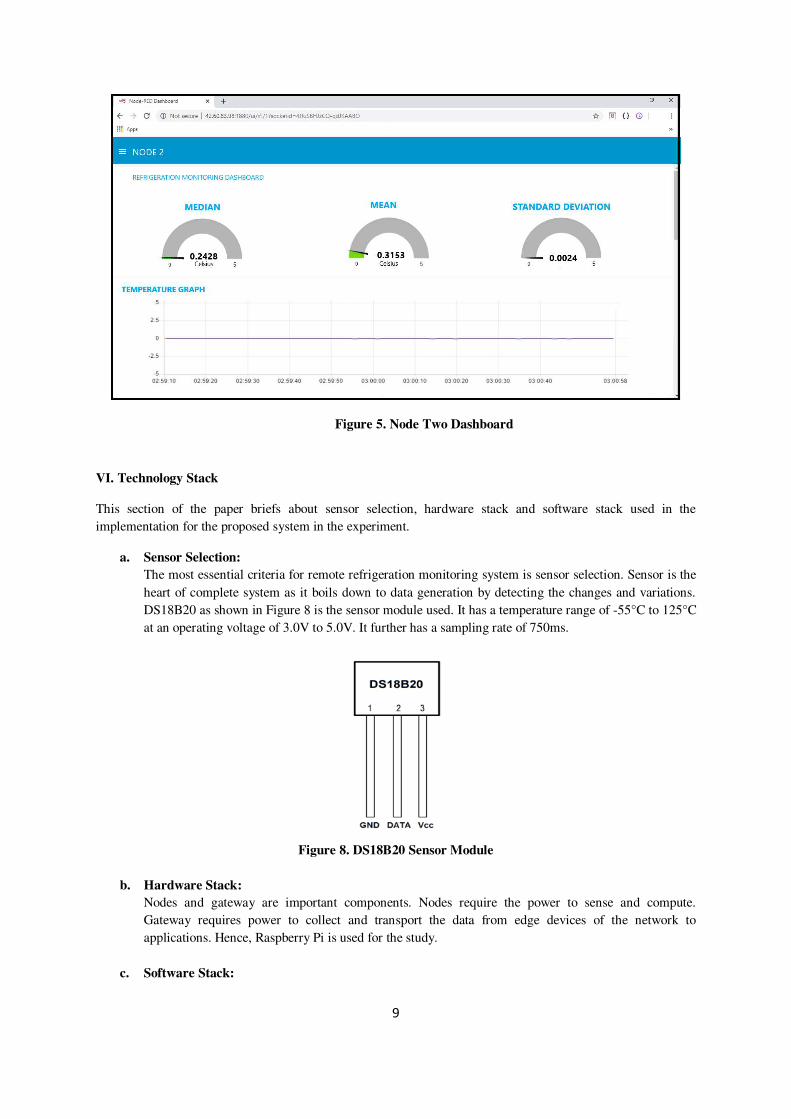
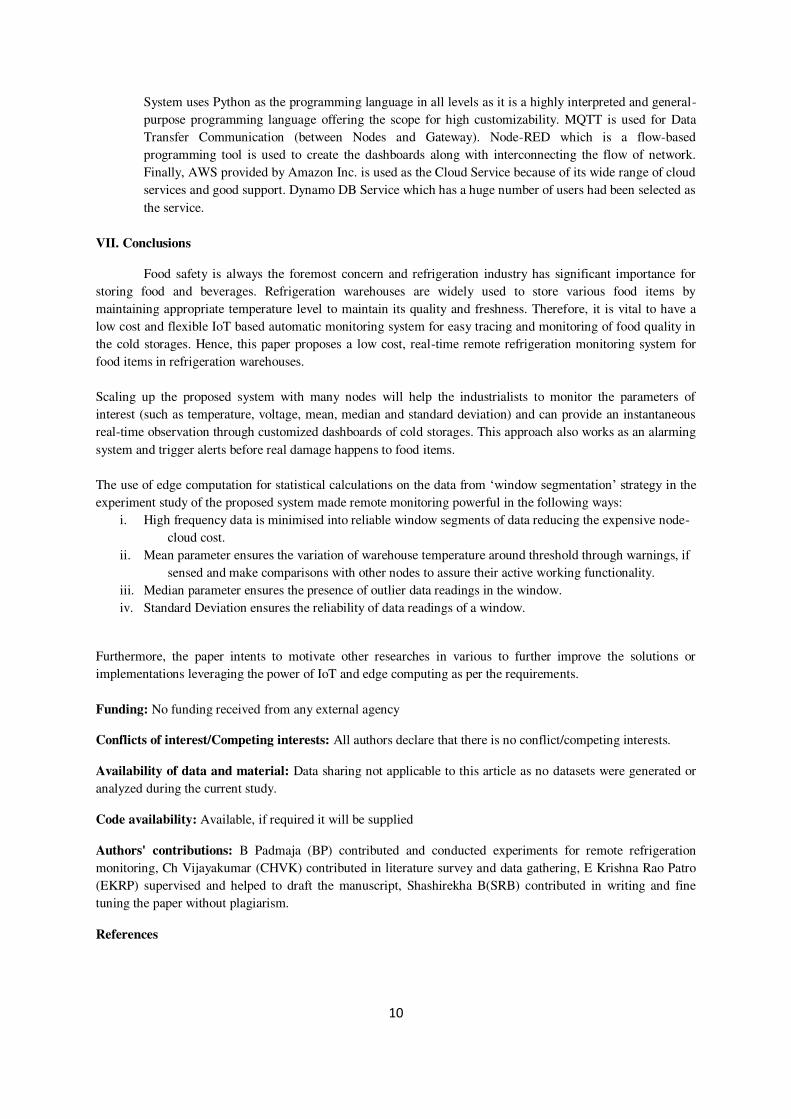
c. Visualisation of monitoring the warehouse in a dashboard:
The dashboard visualisation of each node of the system deployed in the warehouse is pointed by the IP
and ports of the nodes. Each node has a separate dashboard as shown in Figures 6 and 7. Every dashboard
displays mean, median and standard deviation of windows spanning for 30 seconds. It also displays a graph of
mean versus time, where, mean is on y-axis and time is on x-axis. The presence of spikes on the graph indicates
the extensive variation of temperature readings. The user will also be triggered by a message or an email in
those unprecedented situations. The three lines on the left of dashboard are used to view the dashboard of
different nodes. Furthermore, the edge computed data for all nodes along with time stamps is logged in cloud
services concurrently.
Figure 4. Node One Dashboard
9
Figure 5. Node Two Dashboard
VI. Technology Stack
This section of the paper briefs about sensor selection, hardware stack and software stack used in the
implementation for the proposed system in the experiment.
a. Sensor Selection:
The most essential criteria for remote refrigeration monitoring system is sensor selection. Sensor is the
heart of complete system as it boils down to data generation by detecting the changes and variations.
DS18B20 as shown in Figure 8 is the sensor module used. It has a temperature range of -55°C to 125°C
at an operating voltage of 3.0V to 5.0V. It further has a sampling rate of 750ms.
Figure 8. DS18B20 Sensor Module
b. Hardware Stack:
Nodes and gateway are important components. Nodes require the power to sense and compute.
Gateway requires power to collect and transport the data from edge devices of the network to
applications. Hence, Raspberry Pi is used for the study.
c. Software Stack:
10
System uses Python as the programming language in all levels as it is a highly interpreted and general-
purpose programming language offering the scope for high customizability. MQTT is used for Data
Transfer Communication (between Nodes and Gateway). Node-RED which is a flow-based
programming tool is used to create the dashboards along with interconnecting the flow of network.
Finally, AWS provided by Amazon Inc. is used as the Cloud Service because of its wide range of cloud
services and good support. Dynamo DB Service which has a huge number of users had been selected as
the service.
VII. Conclusions
Food safety is always the foremost concern and refrigeration industry has significant importance for
storing food and beverages. Refrigeration warehouses are widely used to store various food items by
maintaining appropriate temperature level to maintain its quality and freshness. Therefore, it is vital to have a
low cost and flexible IoT based automatic monitoring system for easy tracing and monitoring of food quality in
the cold storages. Hence, this paper proposes a low cost, real-time remote refrigeration monitoring system for
food items in refrigeration warehouses.
Scaling up the proposed system with many nodes will help the industrialists to monitor the parameters of
interest (such as temperature, voltage, mean, median and standard deviation) and can provide an instantaneous
real-time observation through customized dashboards of cold storages. This approach also works as an alarming
system and trigger alerts before real damage happens to food items.
The use of edge computation for statistical calculations on the data from ‘window segmentation’ strategy in the
experiment study of the proposed system made remote monitoring powerful in the following ways:
i. High frequency data is minimised into reliable window segments of data reducing the expensive node-
cloud cost.
ii. Mean parameter ensures the variation of warehouse temperature around threshold through warnings, if
sensed and make comparisons with other nodes to assure their active working functionality.
iii. Median parameter ensures the presence of outlier data readings in the window.
iv. Standard Deviation ensures the reliability of data readings of a window.
Furthermore, the paper intents to motivate other researches in various to further improve the solutions or
implementations leveraging the power of IoT and edge computing as per the requirements.
Funding: No funding received from any external agency
Conflicts of interest/Competing interests: All authors declare that there is no conflict/competing interests.
Availability of data and material: Data sharing not applicable to this article as no datasets were generated or
analyzed during the current study.
Code availability: Available, if required it will be supplied
Authors' contributions: B Padmaja (BP) contributed and conducted experiments for remote refrigeration
monitoring, Ch Vijayakumar (CHVK) contributed in literature survey and data gathering, E Krishna Rao Patro
(EKRP) supervised and helped to draft the manuscript, Shashirekha B(SRB) contributed in writing and fine
tuning the paper without plagiarism.
References

11
[1] Lizhu Wu 1, Yu Zhao (2013), “Cold Chain Logistics Temperature Monitoring System Based on Internet of Things Technology,” in Applied Mechanics and Materials Journal, vol. 416-417 (2013) pp. 1969-1973,
Switzerland doi:10.4028/www.scientific.net/AMM.416-417.1969.
[2] Nils Heidmann et al. (2013), “A Low-Power Wireless UHF / LF Sensor Network with Web-Based Remote
Supervision - Implementation in the Intelligent Container,” in 2013 IEEE conference on Sensors, Baltimore, USA, November 2013, doi: 10.1109/ICSENS.2013.6688422.
[3] Mambou et al. (2016), “Monitoring of the Medication Distribution and the Refrigeration Temperature in a Pharmacy based on Internet of Things (IoT) Technology,” in Proceedings of the 18th Mediterranean Electro Technical Conference MELECON 2016, Limassol, Cyprus, April 2016, doi: 10.1109/MELCON.2016.7495412.
[4] Nasir et al. (2018), “The Implementation of IoT based Smart Refrigerator System,” in 2018 2nd International Conference on Smart Sensors and Application (ICSSA), Kuching, Malaysia, November 2018, doi:
10.1109/ICSSA.2018.8535867.
[5] Edger et al. (2019), “IoT Circuit Design to Monitor Cold Chain Refrigerators,” in 2019 Latin American Electron Devices Conference (LAEDC), Armenia, Colombia, May 2019, doi: 10.1109/LAED.2019.8714747.
[6] Song et al. (2017), “An IoT-Based Smart Controlling System of Air Conditioner for High Energy
Efficiency,” in 2017 IEEE International Conference on Internet of Things (iThings) and IEEE Green Computing and Communications (GreenCom) and IEEE Cyber, Physical and Social Computing (CPSCom) and IEEE Smart
Data (SmartData), Exeter, UK, June 2017, doi: 10.1109/iThings-GreenCom-CPSCom-SmartData.2017.72.
[7] Meimei et al. (2015), “The Design and Implementation of Food Cold Chain Monitoring System Based on ZigBee,” in Applied Mechanics and Materials Journal, vol. 751, pp. 281-286,
doi:10.4028/www.scientific.net/AMM.751.281.
[8] Faz et al. (2020), “Monitoring of Temperature in Retail Refrigerated Cabinets Applying IoT Over Open-
Source Hardware and Software,” in Sensors Journal, vol. 20(3): 846, doi: 10.3390/s20030846.
[9] Nor Azlan Othman et al. (2017), “Remote Monitoring System Development via Raspberry- Pi for Small
Scale Standalone PV Plant” in 2017 7th IEEE International Conference on Control System, Penang, Malaysia, 2017.
[10] Baumgartner et al. (2018), “Environmental Monitoring Using Low-Cost Hardware and Infrastructure less
Wireless Communication” in IEEE Global Humanitarian Technology Conference, San Jose, CA, USA, 2018.
[11] Sinha, N., Alex, J. S. R (2015), “IoT Based iPower Saver Meter” in Indian Journal of Science and Technology, 8(19), 2015.
[12] Katalina Biondi et al.(2019), “Air Pollution Detection System using Edge Computing” in International Conference in Engineering Applications, Sao Miguel, Portugal, 2019.
[13] B Padmaja et al. (2018), “IoT Based Surveillance of Agriculture and Smart Detection of Infestation,” in Journal of Advanced Research in Dynamical and Control Systems, 10(5S), 2018.
[14] B Padmaja et al. (2018), “A Novel Design of Autonomous Cars using IoT and Visual Features,” in 2018 2nd IEEE International Conference on I-SMAC (IoT in Social, Mobile, Analytics and Cloud) (I-SMAC),
August 2018, Palladam, India.

12
[15] A. Al-Fuqaha, M. Guizani, M. Mohammadi, M. Aledhari, M. Ayyash, “Internet of things: A survey on
enabling technologies, protocols, and applications” in IEEE Communications Surveys & Tutorials, 17(4), 2015, pp. 2347-2376.
[16] Cisco Internet Business Solutions Group (2011), The Internet of Things- How the Next Evolution of the
Internet Is Changing Everything.
https://www.cisco.com/c/dam/en_us/about/ac79/docs/innov/IoT_IBSG_0411FINAL.pdf
[17] Mobile Edge Computing Market worth 838.6 Million USD by 2022.
http://www.marketsandmarkets.com/PressReleases/mobile-edgecomputing.asp
[18] Edge Analytics Market worth 7.96 Billion USD by 2021.
http://www.marketsandmarkets.com/PressReleases/edge-analytics.asp
Author Biography
Ms. B. Padmaja is a faculty member in the Department of Computer Science, Institute of Aeronautical
Engineering, Hyderabad, Telangana, India. She has received her B.Tech from North Eastern Regional Institute
of Science and Technology (NERIST), Arunachal Pradesh, India in 2001. She completed her M.Tech from
School of IT, JNTUH, Hyderabad, India. Currently she is pursuing her research in “Reality Mining: Smart
Phone Based Human Behavior Analysis” from JNTUH, Hyderabad. She is a member of ISTE and CSI. She has more than 18 years of teaching experience and published 20 research papers in various International Journals
and Conferences.
Mr. E Krishna Rao Patro is a faculty member in the Department of Computer Science, Institute of
Aeronautical Engineering, Hyderabad, Telangana, India. He has received his MCA from Anna University,
Chennai in 1997. He completed his M.Tech from, JNTUH, Hyderabad, India. Currently he is pursuing his
research in “Web Intrusion Detection System using Machine Learning Approach” from Vel Tech University, Chennai. He has more than 20 years of teaching and industry experience and published 10 research papers in
various International Journals and Conferences.

Figures
Figure 1
Industrial IoT Ecosystem and its applications

Figure 2
Edge Computing in IoT Systems

Figure 3
Three-tier architecture for Remote Monitoring
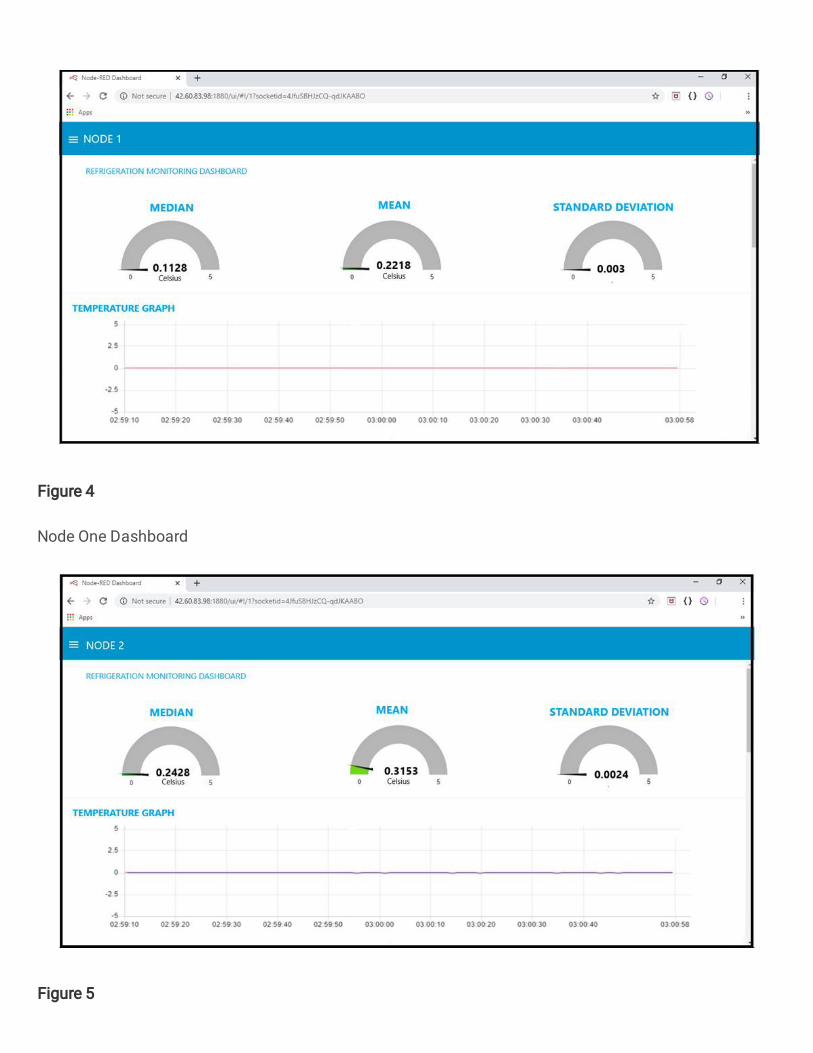
Figure 4
Node One Dashboard
Figure 5

Node Two Dashboard
Figure 6
DS18B20 Sensor Module