Embed Size (px)
Citation preview

Economía Agraria y Recursos Naturales. ISSN: 1578-0732. e-ISSN: 2174-7350. Vol. 13, 2. (2013). pp. 05-31
A socio-economic sustainability indicator for the Basque tropical tuna purse-seine fleet
with a FAD fishing strategyArantza Murillas-Mazaa, Gala Morenoa and Jefferson Muruaa 1
a AZTI, Technological Institute for Fisheries and Food, Department of Fisheries Resources, Sukarrieta.
Agradecimientos: Los autores desean agradecer la financiación recibida del proyecto MADE (Mitigating Adverse Ecological Impact of Open Oceans Fisheries, www.made-project.eu) co-financiado por la UE y el Gobierno Vasco. Este artículo es la contribución número 632 de AZTI-Tecnalia (Unidad de Investiga-ción Marina).
Dirigir correspondencia a: Arantza Murillas-Maza. E-mail: [email protected].
Recibido en agosto 2012. Aceptado en septiembre 2013.
ABSTRACT: This article applies the Rapfish methodology, a non-parametric and multi-disciplinary technique, with the objective of defining and evaluating a Sustainability Index of the Basque purse-seine fleet, fishing tropical tuna in the Indian and Atlantic Oceans. The estimated Sustainability Index for the fleet fishing in the Indian Ocean is above a critical sustainability threshold and improves between 1998 and 2009. The opposite occurs for the fleet in the Atlantic Ocean. The influence of the growing use of Fish Aggregating Devices on the behaviour of fishers in the Indian Ocean is also analysed.
KEYWORDS: Purse-seiners, FAD, rapfish, sustainability, tropical tuna stocks.
JEL classification: Q22.
Un indicador de sostenibilidad socio-económica de la flota de cerco de túnidos tropicales del País Vasco y su estrategia de pesca con FADs
RESUMEN: Este artículo aplica la metodología de Rapfish, técnica no paramétrica y multi-disciplinar, con el objetivo de definir y evaluar un índice de sostenibilidad de la flota de cerco del País Vasco, dedi-cada a las pesquerías de túnidos tropicales en los Océanos Índico y Atlántico. El índice de sostenibilidad estimado para la flota del Océano Índico se sitúa por encima de un umbral crítico de sostenibilidad y me-jora entre 1998 y 2009. Lo contrario sucede para la flota del Atlántico. Asimismo, se analiza la influencia que el uso creciente de dispositivos concentradores de peces genera en la estrategia de los pescadores del Océano Índico.
PALABRAS CLAVE: Cerqueros, FAD, rapfish, sostenibilidad, túnidos tropicales.
Clasificación JEL: Q22.
DOI: 10.7201/earn.2013.02.01.
DOI: 10.7201/earn.2013.02.01.

6 A. Murillas-Maza, G. Moreno and J. Murua
1. Introduction
Sustainability in the fishing sector is undoubtedly accepted as a desirable aim, and a very important goal that has recently been included as one of the three funda-mental aspects (together with coherence and efficiency) of the proposed reform of the Common Fisheries Policy (CFP) which shall be effective upon its publication -expected over 2014- (http://ec.europa.eu/fisheries/reform/index_es.htm). One of the main goals of the CFP and its current reform is to take action against overfishing and promote and assure the long-term sustainability of fish stocks by preventing the over-exploitation of the resource by the fishing industry. Overfishing has become one of the main threats to modern fisheries1 and it is known that many stocks in Euro-pean Union waters are now below their safe biological thresholds. The CFP promotes sustainability by implementing various stock conservation measures. These include setting targets for Total Allowable Catch (TAC) and Total Allowable Effort (TAE), as well as enforcing spatial and technical measures, such as closed areas and mesh sizes.
In addition to the pressure placed on fish as a result of high fishing effort, other factors, such as biological uncertainty, socio-economic issues and technological developments may also threaten the sustainability of fisheries worldwide. In this respect, García and Staples (2000) state that “sustainability explicitly requires the conditions of the eco-system and the people living in it to be either good or impro-ving as a result of an action”. Thus, in order to assess the sustainability of fisheries, it is necessary to integrate data from various disciplines, such as economics, techno-logy, sociology and ecology.
However, the main problem that arises when talking about sustainability is the difficulty that different stakeholders (i.e. fishers, ship-owners, administrations, scientists, NGOs, etc.) may have in both defining and evaluating the sustainability of a fleet or fishery. The concept of sustainability itself presents the first difficulty be-cause there is no general consensus on an acceptable definition (García and Staples, 2000). Consequently, several definitions can be found according to different criteria, hindering comparisons among the different fisheries and fleets. These authors remark that sustainability is a highly dimensional concept and this is especially true in the case of the complex systems that characterise fisheries.
The main objective of this paper is to analyse the socio-economic and technolo-gical approaches to sustainability through the use of Rapfish, a non-parametric eva-luation methodology, developed by the Fisheries Centre at the University of British Columbia, Canada (Pitcher and Preikshot, 2001). Rapfish uses simple and easily scored attributes to provide a rapid, cost-effective, multi-indicator and multi-discipli-nary appraisal of the status of a fishery, in terms of comparative levels of sustaina-bility (Preikshot et al., 1998). In this paper we apply this technique to perform both
1 According to the FAO (http://www.fao.org/fi/glossary/), a fishery is defined as “a unit determined by an authority or other entity that is engaged in raising and/or harvesting fish. Typically, the unit is defined in terms of some or all of the following: people involved, species or type of fish, area of water or seabed, method of fishing, class of boats and purpose of the activities”.

A socio-economic sustainability indicator for the Basque tropical tuna... 7
an inter-temporal and spatial analysis of the Basque purse-seine fleet operating in the Indian and Atlantic Oceans using data collected between 1998 and 20092. This dyna-mic and multi-criteria analysis provides a useful tool that: (i) assesses the effective-ness of fisheries management, and (ii) provides information for policy-makers about the best policy options for the sustainable management of the selected fisheries.
The paper is organised as follows. Section 2 describes the selected case study, na-mely the Basque purse-seine fleet fishing in the Indian and Atlantic Oceans. Section 3 introduces the Rapfish methodology used in this paper to assess the sustainability of the Basque purse-seine fleet. Section 4 presents the results. Comments and conclu-sions obtained from the analysis are detailed in the last section.
2. Background of the Basque purse-seine fleet involved in tropical tuna fisheries in open oceans
2.1. General overview
Tuna stocks are harvested by many countries in all oceans and are managed by Re-gional Fishery Management Organizations (RFMOs). A number of international tuna RMFOs have been created in order to manage these stocks sustainably3. The FAO Fisheries & Aquaculture Department periodically reviews the state of world marine fishery resources, which includes a summary chapter for tuna and tuna-like species.
Tuna and tuna-like species are important socio-economic resources as well as a significant source of protein for society. They include approximately forty species found in the Indian, Pacific and Atlantic Oceans. The most commercially important tuna species are albacore (Thunnus alalunga, ALB), bigeye (Thunnus obesus, BET), Atlantic bluefin (Thunnus thynnus thynnus, BFT), Pacific bluefin (Thunnus orientalis, PBF), skipjack (Katsuwonus pelamis, SKJ), southern bluefin (Thunnus maccoyii, SBF) and yellowfin (Thunnus albacares, YFT). They can perform long migrations and their spatial distribution includes temperate and tropical regions of all oceans. SKJ, YFT and BET are tropical tuna, while ALB, BFT, PBF, SBF are temperate tuna. These species are caught by several industrial fleets from different countries using different gear
2 As far as we know there are four other papers (Alder et al., 2000; Pitcher and Preikshot, Murillas et al., 2008; Garmendia et al., 2010) applying Rapfish within a dynamic framework. The first two papers refer to dynamic analyses focusing on a longer but discontinuous time series data.3 The International Commission for the Conservation of Atlantic Tuna (ICCAT, www.iccat.int), the Indian Ocean Tuna Commission (IOTC, www.iotc.org), the Western and Central Pacific Fisheries Commission (WCPFC, www.wcpfc.int), the Inter-American Tropical Tuna Commission (IATTC, www.iattc.org) and the Commission for the Conservation of Southern Bluefin Tuna (CCSBT, www.ccsbt.org). ICCAT, IOTC, WCPFC and IATTC are responsible for the management of tuna in the Atlantic Ocean, Indian Ocean, Western Pacific Ocean and Eastern Pacific Ocean, respectively, while CCSBT is respon-sible for the conservation of southern bluefin tuna that inhabits the three oceans. In addition, the Interim Scientific Committee for Tuna and Tuna-like Species in the North Pacific Ocean (ISC, http://isc.ac.affrc.go.jp/) and the Secretariat of the Pacific Community (SPC, www.spc.int) conductor facilitate the assess-ment of tuna stocks in the North and South Pacific, respectively.

8 A. Murillas-Maza, G. Moreno and J. Murua
(purse-seine, longline, driftnet, pole and line, …), as well as by artisanal fleets of coas-tal states, landed and processed in many locations around the world, traded in a global market, and finally consumed worldwide (Arrizabalaga et al., 2012).
In recent decades, tuna fleets and their catches have been growing, currently rea-ching over four million tons per year (Allen, 2010), and to the extent that some stocks are overexploited or at risk of being overexploited. Fleets from 56 countries have tra-ditionally caught tuna stocks in the Indian Ocean. Graph 1 and Graph 2 show the 10 most important countries (and their catches) devoted to the tropical tuna fisheries in the Indian Ocean, taking into account total landings from 1954 to 2010. It is impor-tant to mention that Spain and France represent the most important European Union (EU) purse-seine fleets (Source: IOTC4).
GRAPH 1
Ranking of the most important countries involved in tropical tuna fisheries in the Indian Ocean
Source: Own elaboration.
4 The statistics compiled by IOTC are obtained from liaison officers nominated by the governments of countries fishing for tuna and tuna-like species in the Indian Ocean. In some cases, statistics were es-timated by IOTC using best available information obtained from reliable sources or obtained from FAO statistics (provided by the Fishery Information, Data and Statistics Service, FAO, Rome).

A socio-economic sustainability indicator for the Basque tropical tuna... 9
GRAPH 2
Total tuna catches by country in the Indian Ocean
Source: Own elaboration.
Graph 3 shows total catches by tuna stock by the Spanish purse-seiners (PS) in the Indian Ocean. It is observed that the SKJ and YFT Spanish catches have increased since 1984. A more constant trend is observed in the case of the BET and ALB catches.
GRAPH 3
Historical catches of tuna stocks by the Spanish fleet in the Indian Ocean
Source: Own elaboration.

10 A. Murillas-Maza, G. Moreno and J. Murua
A similar analysis is presented for the Atlantic Ocean. Fleets from 100 countries have traditionally caught tuna stocks in the Atlantic Ocean. Graph 4 and Graph 5 show the 20 most importat countries devoted to tuna fisheries taking into account total landings from 1927 to 2011.
GRAPH 4
Ranking of the most important countries involved in tropical tuna fisheries in the Atlantic Ocean
Source: Own elaboration.
The evolution of the Spanish PS number of vessels increased until 2006 –going from 19 vessels in 1990 to 24 vessels in 2006– and from that year onwards, there has been a slight reduction. This paper is focused on the Basque purse-seine (BPS) fleet. The main reason for presenting the BPS as representative of the Spanish PS is the availability of information related to the socio-economic variables by vessel and by trip. In addition, the BPS represents about 50% of the total Spanish fleet, reaching almost a 100% for Spanish vessels operating in the Indian Ocean. This Ocean is the most important fishing region for the Spanish purse-seine fleet.

A socio-economic sustainability indicator for the Basque tropical tuna... 11
GRAPH 5
Total catches by country in the Atlantic Ocean
Source: Own elaboration.
GRAPH 6
Historical catches of tuna stocks by the Spanish fleet in the Atlantic Ocean
Source: Own elaboration.
12 A. Murillas-Maza, G. Moreno and J. Murua
2.2. The Basque purse-seiners involved in tropical tuna fisheries
The Basque purse-seine fisheries use vessels with an average length of 68 metres, an average gross tonnage of around 2,200 and an average of 25 fishers on board. The BPS fleet’s home-port in Bermeo, which is one of the main ports in the Basque Country. However, this is a long distance fleet fishing mainly in the Indian and At-lantic Oceans. Only two vessels operated in the Pacific Ocean until 2009. BPS target species are SKJ, YFT and BET.
2.3. Spanish and Basque purse-seiners’ fishing strategy
One of the main issues when analysing the fishing activity of the BPS fleet is the use of Fish Aggregating Devices (FADs). Since the early 1990s, FADs have been increasingly used around the world by the PS fleets targeting the three main species of tropical tuna: SKJ, YFT and BET. FADs, like any floating object, attract tropical tuna and other tropical species (Kingsford, 1993; Parin and Fedoryako, 1999; Cas-tro et al., 2002). Thus, the main advantage of FADs for fishers is that they increase catchability, as compared to sets on free-swimming schools (FS). Guillotreau et al. (2011) report that, firstly, FADs help fishers locate the fish, significantly reducing search time. This is particularly true at present with satellite tracking buoys attached to FADs which allow the long term tracking of FADs (Moreno et al., 2007). Secon-dly, fishing around FADs usually provides high rates of successful sets compared to those for FS with more failed or null set incidence.
In Graph 7a, the evolution of the average number of sets per annum by the BPS fleet operating in the Indian Ocean is shown. A large growth in the number of sets from 1995 onwards is observed. In Graph 7b total number of log (natural floating object sets) and FAD sets are presented in contrast to FS sets.

A socio-economic sustainability indicator for the Basque tropical tuna... 13
GRAPH 7
Average number of sets (a) per year, and (b) by type of set (log, FAD and FS) by the BPS fleet in the Indian Ocean
(a)
(b)Source: Own elaboration.
14 A. Murillas-Maza, G. Moreno and J. Murua
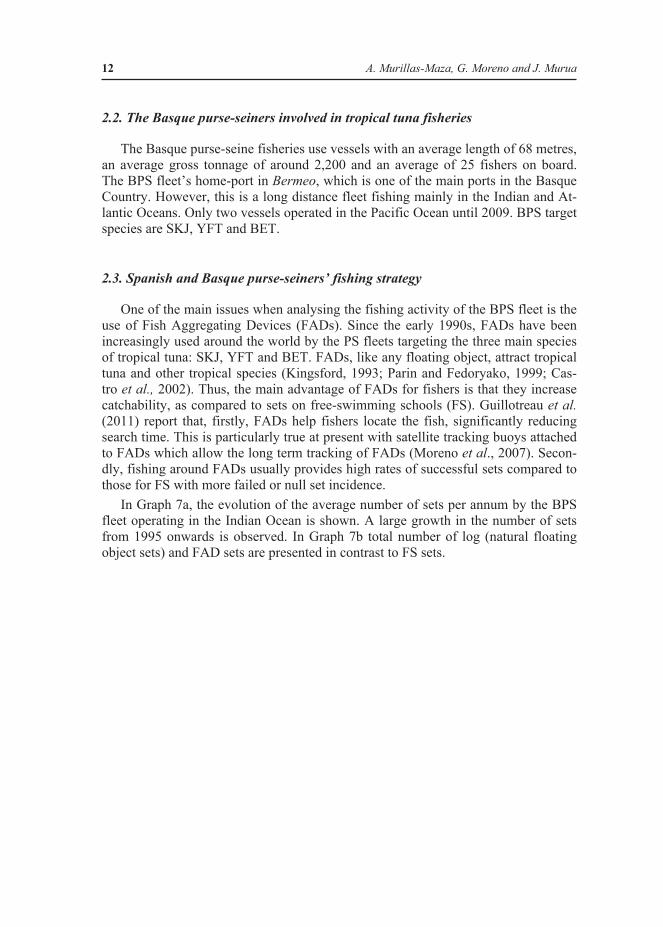
In addition, Graph 8 shows the Catch Per Unit Effort (CPUE; estimated as the ratio between total landings and days at sea) is characterised by an upward trend in the historical series even after the sharp increase in sets that followed the introduction of FADs in 1994. As previously mentioned, FADs help fishers locate the fish more easily by reducing search time. This increase in fishing efficiency did not result in a reduction of fishing activity by the BPS (e.g. fewer days spent at sea to save on fuel, wages, etc.) but instead it produced more sets and effort, as in the absence of limiting regulations (i.e. TACs, FAD closures) there is a race between fishers (and/or compa-nies) to try to fish as much as they can.
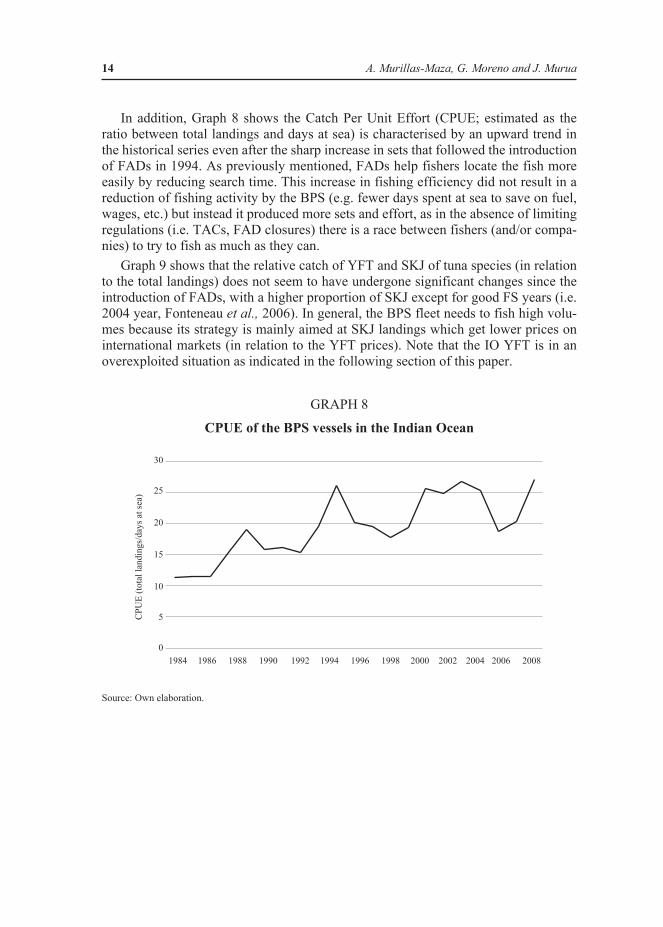
Graph 9 shows that the relative catch of YFT and SKJ of tuna species (in relation to the total landings) does not seem to have undergone significant changes since the introduction of FADs, with a higher proportion of SKJ except for good FS years (i.e. 2004 year, Fonteneau et al., 2006). In general, the BPS fleet needs to fish high volu-mes because its strategy is mainly aimed at SKJ landings which get lower prices on international markets (in relation to the YFT prices). Note that the IO YFT is in an overexploited situation as indicated in the following section of this paper.
GRAPH 8
CPUE of the BPS vessels in the Indian Ocean
Source: Own elaboration.
A socio-economic sustainability indicator for the Basque tropical tuna... 15
GRAPH 9
YFT and SKJ catches (% in relation to the total catches of all species) in the Indian Ocean
Source: Own elaboration.
3. Methodological framework: RAPFISH analysis and key attributes
To assess the sustainability of fisheries, it is necessary to integrate data from various disciplines, such as economics, sociology, technology and ecology, among others. Fisheries scientists grade fisheries according to a large set of attributes that are grouped under many disciplines, so that sustainability can be considered from a holistic perspective.
Following this premise, one multidisciplinary approach to examine sustainabi-lity in its wider sense is through the use of Rapfish, a non-parametric evaluation methodology, developed by the Fisheries Centre at the University of British Co-lumbia, Canada. Rapfish uses simple and easily scored attributes to provide a rapid, cost-effective and multi-disciplinary appraisal of the status of a fishery, in terms of comparative levels of sustainability (Preikshot et al., 1998; Pitcher and Preikshot, 2001). The Rapfish technique is flexible enough to evaluate the sustainability of each dimension in isolation. Thus, it is possible to evaluate the sustainability of a fishery from an economic point of view, or from a social point of view, among other dimensions, or to evaluate the sustainability by considering all of the attributes from different dimensions all together.

16 A. Murillas-Maza, G. Moreno and J. Murua
Rapfish has been used to compare the sustainability status of many fisheries around the world (Andalecio, 2010; Garmendia et al., 2010; Murillas et al., 2008; Al-der et al., 2000; Baeta et al., 2005; Preikshot et al., 1998; Tesfamichael and Pitcher, 2006). However, Garmendia et al. (2010) show that it is possible to analyse the status of a fishery in terms of comparative levels of sustainability using two assumptions: when switching among different dimensions is allowed (weak sustainability) and when such substitutability is constrained (strong sustainability).
Rapfish applies a statistical ordination technique called Multi-Dimensional Scaling (MDS) to reduce the N×M matrix of fisheries statistics for N fisheries and M attributes into an N×2 dimensional space which has similar distance properties as the N×M statistics. In this 2D attribute space, one dimension (x-axis) is the score representing the status (degree of sustainability) from ‘bad’ to ‘good’, and the other dimension (y-axis) represents other factors, unrelated to sustainability (or whatever status is being scored), which distinguish fisheries.
In this work, the Rapfish method has been applied mainly considering a socio-economic dimension. In particular, it has chosen eight key attributes to be included in the analysis for a time period from 1998 to 2009, considering the Indian and Atlantic Oceans. Thus, in this inter-temporal, spatial and multivariable approach it is neces-sary to assign scores to each attribute in order to make the selected indicators compa-rable. Kavanagh and Pitcher (2004) provide approximate scores on a scale from the worst to the best score. Following their approach, we refer to this scale system using the “good” and “bad” terminology for the minimum and maximum possible levels and always under the sustainability perspective. The overall 8 attributes that have been considered, grouped in one unique socio-economic evaluation field together with the scoring criteria are listed in Table 1.
Other biological indicators such as Biomass, Fishing Mortality and the Maximum Sustainable Yield (MSY) have also been reviewed for each stock in both the Indian and Atlantic Oceans (IO, AO, henceforth), but are not included in the Rapfish analy-sis due to the lack of scientific evaluations on an annual basis for some stocks. The information on the status of the stocks is usually obtained from stock assessment reports and/or reports by Scientific Committees from different RFMOs.
A summary of the status of the stocks is presented in Arrizabalaga et al. (2012), which notes that the status of YFT in the AO has shown some improvement bet-ween the 2003 and 2008 assessments. In 1990, the maximum catch of 193,000t was reached and since then a general decline has been observed, with catches of around 100,000t since 2005 (the same level as in 1974). This overall decline of 45 percent since 1990 contrasts with the increasing catches of YFT in other Oceans. The fishing mortality of the YFT in the IO has been increasing steadily since the 1990s. Arriza-balaga et al. (2012) report that YFT has recently been overexploited and is probably still being overfished. The range of stock indicators available to the Scientific Com-mittee does not indicate any current problem regarding the state of the SKJ in the IO. A similar result is derived for the SKJ in the AO.

A socio-economic sustainability indicator for the Basque tropical tuna... 17
TABLE 1
List of indicators for Rapfish analysis
Socioeconomic Indicators Possible scores*
“Bad”score
“Good”score Criteria notes*(a)
1. Average wage 0,1,2,3,4 0 4Do fishers make more or less than the average person? Much less (0), less (1), the same (2), more (3), much more (4).
2. Profitability 0,1,2,3 0 3Profitability: Revenues - variable costs – fixed costsProfits >> average > 0 (3), Profits > average > 0 (2), Profits <, = average > 0 (1), Profits <, = 0 (0).
3. Subsidy 0,1,2,3 3 0 No subsidies (0), < somewhat (1), > large (2), >> heavily reliant (3).
4. Revenue 0,1,2,3 0 3 Low (0), <, = average (1), > average (2), >> average (3).
5. Landings of SKJ and YFT 0,1,2,3 0 3 Low (0), <, = average (1), > average (2), >> average (3).
6. Full Total Employment (FTE) 0,1,2,3 0 3
Fishery employment in relation to the fishing sector employment. < 20% (0), 20-50% (1), 50-100% (2), >100% (3).
7. Market 0,1,2 2 0 Market is principally: local/national (0), national/regional (1), international (2).
8. Ownership 0,1,2 2 0 Profit from fishery mainly to: locals (0), mixed (1), foreigners (2).
* Scores and notes defined according to previous literature, as Baeta et al. (2005), Tesfamichael and Pitcher (2006), Pitcher and Preikshot (2001), Murillas et al. (2008) and Garmendia et al. (2010).
(a) Notice that recent works dealing with Rapfish methodology are using a score range from 0 to 10. However, in this paper the range is shorter due to the nature of the time-series data for each indicator. The real data (before scored) does not allow establishing such a large score range, and therefore traditional literature has been followed.
Source: Own elaboration.
Additional details concerning the indicators and the evaluation criteria in Table 1 are offered below:
• Average wage: An average wage earned by a person working within the fishing sectors at the same scale has been compared with the average wage for the selected fisheries. When wages exceed more than 36,000 euros and 40,000 euros the average wage was assigned a “higher” and “much higher” score, respectively.
• Profitability: The score of this attribute is related to the difference bet-ween the total revenues and the variable and fixed costs. When profitabi-lity exceeded more than 1.5 times the average it was assigned a score of 3, Profits >> average > 0.
• Subsidy: The score for this attribute is related to the average subsidies recei-ved by fishers during analysed years, from 1998 to 2009. Given the historical

18 A. Murillas-Maza, G. Moreno and J. Murua
trend of this indicator, when subsidy is below average then a “somewhat” score is assigned, while when exceeding more than the average and 1.5 times the average scores assigned were “large” and “heavily reliant”, respectively.
• Revenue: The score for this attribute is related to the positive or negative va-lue of the total revenues (price*landings). When revenue exceeds more than 1.5 times the average it is assigned the score 3, Revenue >> average.
• Landings: The average value of SKJ, YFT and ALB was used to score this attribute, in a similar way to the aforementioned indicators.
• Full Total Employment (FTE): The FTE of the selected fisheries is in re-lation to the employment in the fishing sector (Basque trawlers,…). When the FTE exceeds more than 100% of the employment in compared fishing sectors, a score of 3 was assigned.
• Market: This attribute shows the indirect impact of the fishing activity of selected fisheries for the Basque Country. The Market in which the tropical tunas are sold is mainly international, which was represented by the score 2.
• Ownership: This is the second social attribute, together with the FTE at-tribute, which gives evidence about the impact of the selected fisheries on employment. In the case of the selected fisheries, crew members are mixed, whereby not only Basque people are on board. Thus, the assigned score must be 1. However, the profit is mainly attached to local or Basque owners, given huge wage differences between Basque officials (i.e. captains, chief engi-neers, etc.) and foreigners (usually deck crew), which could allow assigning a score of 0.
Once all of the attributes were defined the scoring process provided the results showed in Table 2. In addition to the standard scoring analysis, Garmendia et al. (2010) highlighted the importance of defining reference values for each attribute, which serve to establish a ‘critical’ sustainability threshold of the Sustainability Index. The sustainability of a hypothetical ‘dummy fishery’ is estimated according to the reference values defined at the level of each attribute, as a proxy of a critical threshold (see Murillas et al., 2008 for more details). The reference values for each indicator are also presented in Table 2.

A socio-economic sustainability indicator for the Basque tropical tuna... 19
TABLE 2
Socio-economic indicators scoring
BPS Fisheries
Landings SKJ
Landings YFT
Subsidies Employment Revenue ProfitabilityAverage wage
Market Ownership
1998 IO 1 1 0 0 1 1 2 2 1
1999 IO 1 1 0 0 2 2 4 2 1
2000 IO 1 2 1 1 1 1 2 2 1
2001 IO 1 1 1 1 1 1 3 2 1
2002 IO 1 2 1 1 1 2 4 2 1
2003 IO 2 2 3 0 2 2 4 2 1
2004 IO 3 1 3 0 1 1 4 2 1
2005 IO 2 2 3 0 1 1 4 2 1
2006 IO 2 3 1 0 2 2 4 2 1
2007 IO 1 1 na na na na na 2 1
2008 IO 1 1 0 1 2 2 4 2 1
2009 IO 1 1 0 0 1 1 4 2 1
1998 AO 2 2 0 1 2 0 1 2 1
1999 AO 2 1 0 1 1 1 3 2 1
2000 AO 2 2 1 2 1 1 1 2 1
2001 AO 1 2 1 1 1 2 1 2 1
2002 AO 1 2 1 2 1 2 1 2 1
2003 AO 2 2 3 2 1 0 1 2 1
2004 AO 2 1 3 2 1 1 1 2 1
2005 AO 1 1 3 2 1 1 1 2 1
2006 AO 1 1 2 2 2 3 1 2 1
2007 AO 1 1 na na na na na 2 1
2008 AO 2 2 0 2 2 3 1 2 1
2009 AO 2 2 0 1 2 0 4 2 1
Reference value
IO/AO 1 1 0 0 1 1 2 0 0
Source: Own elaboration.

20 A. Murillas-Maza, G. Moreno and J. Murua
4. Results
In this section results from Sustainability Index estimation are presented with the main aim of finding out about: (i) the spatial and inter-temporal differences among tropical tuna fisheries in terms of their contribution to the socio-economic sustaina-bility in the IO and AO between 1998 and 2009. (ii) The incentives generated by the use of FADs in contrast to a FS fishing strategy, in terms of sustainability.
The statistical data supporting the analysis comes from the regional authority, na-mely the Basque Government. In particular, the Basque Government produces yearly socio-economic surveys of the BPS fleet activity, specifically related to information on exploitation costs, revenues and investments. In addition, Azti-Tecnalia usually produces other research surveys on tuna stocks. Data collection for this particular paper has been examined between 1998 and 2009. In addition, for the FADs analy-sis other information related to trip number, days at sea, landings, fishing strategy, among other variables have been obtained from logbooks, covering the fishing acti-vity in the IO between 1984 and 2008 years.
4.1. Basque purse seine fisheries exploiting tuna in open oceans
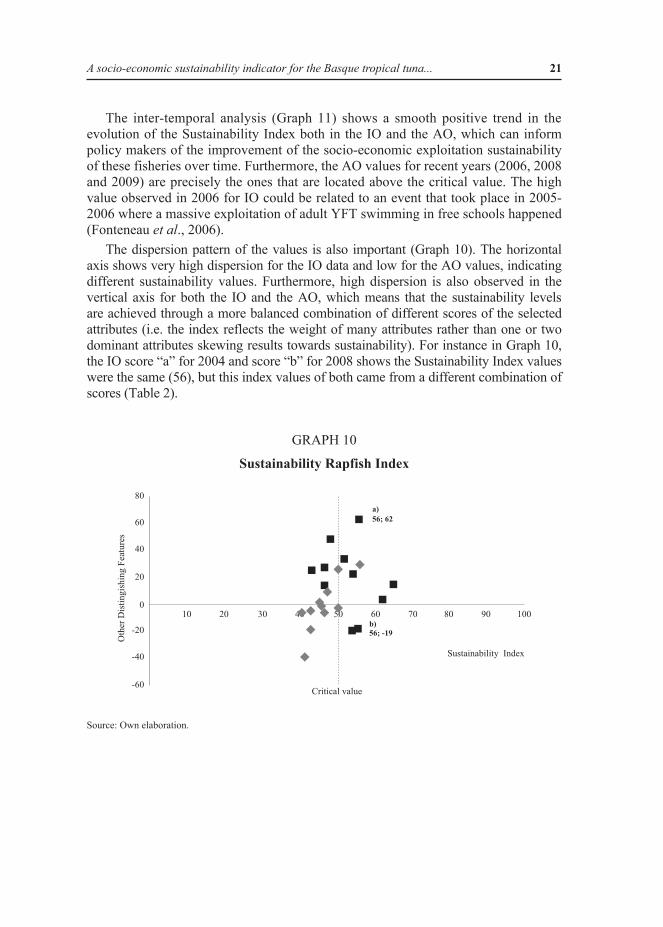
Graph 10 represents the results of the MDS statistical analysis which shows the sustainability of BPS fisheries exploiting tuna in the AO (black rhombus) and the IO (black squares) between 1998 and 2009. The Rapfish Index Value in the horizontal axis goes from 0 to 100 and represents the sustainability status. The same value in the horizontal axis can be reached through different combinations of scores of the attributes, whereas the vertical distribution value is due to different combinations of scores.
Socio-economic Sustainability Index values stood between 40 and 70. In general, the lowest values correspond to the BPS fisheries operating in the AO, in contrast to the higher values which correspond to the vessels operating in the IO. It is known from surveys within the fishing sector that BPS vessels operating in the IO usua-lly get better profitability than vessels located in the AO, and at the same time it is derived from this analysis that these more profitable vessels contribute more to the socioeconomic sustainability.
Rapfish method was also run using the reference values of selected attributes by estimating a critical sustainability value of 50. Graph 10 showed how most of the AO Sustainability Index values were below this critical value while the contrary happened for the IO.
A socio-economic sustainability indicator for the Basque tropical tuna... 21
The inter-temporal analysis (Graph 11) shows a smooth positive trend in the evolution of the Sustainability Index both in the IO and the AO, which can inform policy makers of the improvement of the socio-economic exploitation sustainability of these fisheries over time. Furthermore, the AO values for recent years (2006, 2008 and 2009) are precisely the ones that are located above the critical value. The high value observed in 2006 for IO could be related to an event that took place in 2005-2006 where a massive exploitation of adult YFT swimming in free schools happened (Fonteneau et al., 2006).
The dispersion pattern of the values is also important (Graph 10). The horizontal axis shows very high dispersion for the IO data and low for the AO values, indicating different sustainability values. Furthermore, high dispersion is also observed in the vertical axis for both the IO and the AO, which means that the sustainability levels are achieved through a more balanced combination of different scores of the selected attributes (i.e. the index reflects the weight of many attributes rather than one or two dominant attributes skewing results towards sustainability). For instance in Graph 10, the IO score “a” for 2004 and score “b” for 2008 shows the Sustainability Index values were the same (56), but this index values of both came from a different combination of scores (Table 2).
GRAPH 10
Sustainability Rapfish Index
Source: Own elaboration.

22 A. Murillas-Maza, G. Moreno and J. Murua
GRAPH 11
Sustainability Rapfish Index. Evolution over time
Source: Own elaboration.
The Monte Carlo analysis was performed for 100 repeats, adding random zero mean normally distributed error with 95% confidence interval set to 25% of full range for each attribute. The result, plotted in Graph 12 assures the robustness of the previously presented results (Graph 10). It is worth noting that it is important to find out not only about the specific value of the Rapfish Index for each fleet for each year, but also about the most frequently covered areas (between 0 and 100) of the index values (Graph 12).
The leverage analysis of individual attributes on Rapfish ordinations (which is calculated as a standard error of differences between the ordinations obtained with and without including the attribute) determines how much each attribute influences the overall ordination. According to this analysis, market, wage and profitability re-present the most influential key attributes on sustainability scores while the subsidy attribute represent the less influential one. The other variables have similar influence on the sustainability score within the economic dimension, which has management implications (Graph 13).

A socio-economic sustainability indicator for the Basque tropical tuna... 23
GR
APH
12
Mon
te C
arlo
ana
lysi
s
Sour
ce: O
wn
elab
orat
ion

24 A. Murillas-Maza, G. Moreno and J. Murua
GRAPH 13
Leverage analysis for the indicators
Source: Own elaboration.
When removing the market and ownership indicators, the Sustainability Index value became higher (an increase of 11% and 5% in the IO and AO Index values, respectively), reaching a maximum value of 75 in the IO and 63 in the AO. The market was the indicator that most contributed to a change in values when removed from the analysis (Graph 13). These attributes might be removed from the analysis when managers are mainly interested in the sustainability of the fishing activity itself (i.e. direct effect of fishing), without taking into account the positive socio-economic impact on the local market and employment.
4.2. FAD influence on fishermen´s behaviour and fishing strategy sustainability
The substantial changes which have occurred in relation to the fishing effort exer-ted by the BPS fleet in the IO over the past 10 years have taken place in the context of using FADs, equipped with radio and satellite buoys, called instrumented FADs (see Graph 7, Graph 8, and Graph 9). Thus, it is reasonable to describe the changes which have occurred and their implication in terms of the sustainability of this activity. The purpose of this section is to examine if fishers’ behaviour has changed since the introduction of instrumented FADs and understand the influence of these technologi-cal tools on fishing effort and its impact on the sustainability of the fishing strategy itself. This section aims to identify whether there are different contributions of the
A socio-economic sustainability indicator for the Basque tropical tuna... 25
fishers’ behaviour to sustainability when using different technology with FADs (i.e. FADs with geo-locating buoys) which is directly related to the number of FADs used by fishers. FAD´s have been used by the IO BPS since the beginning of the fishery in the mid 80-s. While at the beginning more natural floating objects and few man-made FADs were used, improvements in buoy technology allowed fishers to be more efficient at monitoring FADs and thus increase the number of FADs for fishing at sea (Moron et al., 2001). This outcome is very important given that tuna PS fishing strategy is mainly dictated by the decision on how many FADs a vessel is going to manage at sea. Furthermore, this decision represents one of the main key conflicts with other fleets relying less on FADs, in particular with the French PS fleet accor-ding the expert knowledge (Moreno et al., 2007). When FADs are used to increase the catching power, vessels score towards the “bad”.
The Rapfish technique was run again for the particular and more relevant case of the BPS fleet in the IO. In this case, a dimension containing mainly technological attributes was considered for a time series covering from 1984-2008. An insight into the main technical variables linked with FAD fishing was developed using log-book data from each BPS vessel.
A list of indicators was then selected for this particular objective, and as in pre-vious analyses a scoring methodology was defined. Results are shown in Table 3, Table 4, Graph 14 and Graph 15.
Trip number, Effort and Revenue or Landings attributes are scored similar to the revenue attribute in Table 2 before.
Conflict status: This attribute shows if there is certain level of conflicts with other sector, including other fleets. In particular, this attribute has increasing relevance in pa-rallel to the huge introduction of FADs within the BPS fleet fishing strategy.
FADs with buoys: This attribute represents the type of fishing strategy adop-ted by fishers; that is, the decision of fishing using FADs or Logs (natural floating objects) in contrast to FS. In addition, the use of radio and satellite buoys is also considered. The progressive introduction of FADs with radio and satellite buoys is used to score this attribute.

26 A. Murillas-Maza, G. Moreno and J. Murua
TABLE 3
List of indicators for FADs analysis
Technological and economic indicators
Possible scores*
“Bad”score
“Good”score Criteria notes
1. Trip number 0,1,2,3 3 0 Average trip number in a year. Low (0), <, = average (1), > average (2), >> average (3).
2. Effort (fishing days at sea = trip length) 0,1,2,3 3 0 Average days at sea in a year. Low (0), <, = average
(1), > average (2), >> average (3).
3. Revenue 0,1,2,3 0 3 Low (0), <, = average (1), > average (2), >> average (3).
4. Landings all stocks 0,1,2,3 0 3 Low (0), <, = average (1), > average (2), >> average (3).
5. Conflict status 0,1,2 2 0 Level of conflict with other sectors: none (0); some (1);lots (2) includes other fisheries or industries.
6. FADs with buoys 0,1,2,3 3 0FS, Logs, few FADs (0), FS, Logs, FADs with radio buoys (1), FS, Logs, FADs with radio and satellite buoys (2), Mostly FADs with satellite buoys (3).
Source: Own elaboration.
TABLE 4
Indicators scoring for FADs analysis
BPS fisheries
All landings
Trip number Effort FADs with
buoysConflict status Revenue
1984 IO 1 1 1 0 0 1
1985 IO 1 1 1 0 0 1
1986 IO 1 1 3 0 0 1
1987 IO 1 1 1 0 0 1
1990 IO 1 1 1 0 0 1
1991 IO 1 1 1 1 0 1
1993 IO 1 1 1 1 0 1
1995 IO 2 2 3 1 2 2
1997 IO 2 2 3 1 2 2
1999 IO 2 1 1 2 2 2
2002 IO 3 3 3 2 2 2
2004 IO 3 3 3 3 2 3
2006 IO 3 3 3 3 2 3
2008 IO 2 3 3 3 2 2
Reference value IO 1 1 1 1 0 1
Source: Own elaboration.

A socio-economic sustainability indicator for the Basque tropical tuna... 27
GRAPH 14
Rapfish Sustainability Index depending on BPS fleet number of FADs and the technology used to geo-locate them in Indian Ocean (in black years with few FADs, in grey years with increasing use of instrumented FADs; in white years with most FADs)
Source: Own elaboration.
Rapfish results are presented in Graph 14. The sustainability scores are located between 25 and 62, whereby 62, 50, 46 and 22 are the respective average sustaina-bility values from 0 to 3 score attached to “FADs with buoys” attribute. Given that the estimated critical value is set at 55, it seems that in parallel to the increase in use of FADs and buoys, the associated fishing practices are not sustainable enough (i.e. below the critical sustainability value). Notice that except for 1986, with a value of 53, the rest of the years before FAD use (score 0) always reached the value of 62 (Graph 15). Graph 15 shows the evolution over time of the Sustainability Index and the higher gap with the critical value for the last studied years.
The problem is not the use of FADs versus catching FS, but the fishers’ behaviour or fishing strategy modification after the introduction of FADs with buoys. It is not a case of FADs themselves, which are simply a fishing tool or gear, not being sustaina-ble; it is the fishing strategy and company incentives pursued by purse-seining fleets which also need to be monitored from a socio-economic point of view. The main advantage of FADs for fishers is that they can reduce the fish searching time and reduce the number of failed sets. This increases the catchability of tuna, as compared to FS sets, which has positive implications for the socio-economic sustainability of the fleet, such as less explotation and fishing variable costs. However, the problem is that as illustrated in Graph 14, the fishers’ strategy after the FAD introduction was to increase the fishing effort and this pushed the Sustainability Index attached to the fishing strategy towards the bad score. Regardless of the use of FAD or not, the fishing effort should be controlled in some way (i.e. TACS, monitor number of

28 A. Murillas-Maza, G. Moreno and J. Murua
FADs, etc.). In the absence of control mechanisms it seems that FAD-based fishing reinforced the strategy of fishing as much as possible, but now with the aid of a more efficient tool which can be used in high numbers.
GRAPH 15
Sustainability Rapfish Index. Evolution over time
Source: Own elaboration.
5. Conclusions
This paper analyses the sustainability of Basque purse-seine fisheries operating in open oceans using for this aim the Rapfish tool. This technique allows the study of the sustainability of fisheries in a multidimensional and inter-temporal framework, providing relevant and useful information for policy makers. The analysis has been carried out with a unique evaluation field in which different socio-economic indi-cators, along a time series between 1998 and 2009 have been examined. The appli-cation of Rapfish is not straightforward, and both the attributes themselves and the definitions for scoring and criteria have been redefined to adapt them to the context of this particular case study.
In general, the BPS fleet in the IO maintains a good sustainability trend along the time series from 1998 to 2009, reaching annual sustainability values above the estimated critical threshold from 2002 onwards. On the contrary, the sustainability values attached to the AO fleet might constitute the focus of future policies with the aim of improving it. In the latter case, most of the sustainability values lie below or just on the critical threshold.
A socio-economic sustainability indicator for the Basque tropical tuna... 29
If managers were to decide not to take into account the estimate of the socio-economic impact of tropical tuna activity on vessels-owning regions (in terms for instance of employment) both market and ownership indicators could be removed from the analysis. And therefore, it would result in a significant increase of the Sus-tainability Index in both the AO and IO, reaching better values especially in the case of vessels operating in the latter.
In the analysis, in general, the observed vertical dispersion is high which makes it difficult to predict the possible structure of the fishery and to find medium to long term policy options. According to the leverage analysis reported in this work, the three most influential attributes in the Sustainability Index are market, wages and profitability. In particular, the best score is assigned to the wage attribute given its high values for fishers involved in Indian Ocean fisheries. Leverage analysis shows that although the three aforementioned attributes strongly influence the analysis, the rest of the attributes considered are also relevant in determining the sustainability level of the selected fisheries. Nevertheless, as Tesfamichael and Pitcher (2006) point out, the highest scoring attributes in the leverage analysis should be given special attention in the future planning of a sustainable fishery.
Within this general context, particular attention should be placed on the recent effort changes following the introduction of FADs. Based on peer-reviewed litera-ture on FADs (for a review on the potential adverse impacts of FADs see Dagorn et al., 2012) their widespread use could result in some adverse biological impacts, including reduction of the target stocks, modification of the surface habitat of tunas and increase of by-catch including sharks, sea turtles and juvenile tunas. However, some of these potential effects have not yet been fully demonstrated. By turning to the socio-economic dimension, the empirical evidence indicates that not only cat-chability is improving, but also the fishing effort has been increasing in parallel to the introduction of FADs. There are good practices to adopt on the use of FADs. For instance, FADs themselves can be better designed to be more ecological to reduce shark and turtle entanglement (Franco et al., 2009), and by-catch handling practices to increase post release survival can be implanted. However, at the same time ma-nagers should pay attention to the incentives FADs create. Particularly, how FADs influence fishers’ behaviour when conducting their daily fishing activities. In this respect, Rapfish analysis results show that fishers’ behaviour is not sustainable after the introduction of FADs, while the contrary happened before using them. If using FADs does not create the right incentives, policy makers should try to correct this in the future, along with the implementation of more sustainable practices with FADs (by-catch handling practices, non-entangling FAD designs, improved acoustic selec-tivity to discriminate by-catch, etc.). According to Pauly et al. (2002), increases in fishing-fleet capacity represent one of the main threats to the long-term survival of marine captured-fishery resources and fisheries themselves. Guillotreau et al. (2011) also concluded that no effect on the fishing strategy can be demonstrated by the price difference between large yellowfin tuna and skipjack. The overall strategy of skippers remains to catch as many tuna tonnes as possible, without paying attention to the relative price levels. Win-win situations are hard to find and policy makers

30 A. Murillas-Maza, G. Moreno and J. Murua
usually face complex decisions where improvements in some aspects of the fishery lead to losses for others. In this respect, Rapfish is a useful tool that can make sense of the complex questions which arise when looking at the sustainability of fisheries as a whole, simultaneously considering all of the related dimensions and identifying weak points which need to be improved.
Rapfish analysis does not explain the causality relations among different varia-bles. However, what it does do is provide an overall sustainability result in which the relative weight of weak and strong factors can be pinpointed and may be used as complementary tools for defining policy recommendations and management options.
References
Alder, J., Pitcher, T.J., Preikshot, D.B., Kaschner, K. and Ferriss, B. (2000). “How good is good? A rapid appraisal technique for evaluation of the sustainability status of fisheries of the North Atlantic”. In Pauly, D. and Pitcher, T.J. (Eds.): Methods for Evaluating the Impacts of Fisheries on North Atlantic Ecosystems. University of British Columbia, Vancouver: 136-182.
Allen, R. (2010). “International management of tuna fisheries. Arrangements, challenges and a way forward”. FAO Fisheries and Aquaculture technical pa-per. No. 536. FAO, Rome. 45 p.
Andalecio, M.N. (2010). “Multi-criteria decision models for management of tropical coastal fisheries. A review”. Agronomy for Sustainable Development, 30: 557-580. http://doi.org/frttbr.
Arrizabalaga, H., Murua, M. and Majkowski, J. (2012). “Global status of tuna stocks: Summary sheets”. Revista de Investigación Marina, 19(8): 645-676.
Baeta, F., Pinheiro, A., Corte-Real, M., Costa, J.L., Raposo de Almeida, P., Cabral, H. and Costa, M.J. (2005). “Are the Fisheries in the Tagus estuary sustainable?” Fisheries Research, 76(2): 243-251. http://doi.org/frttbr.
Castro, J.J., Santiago, J.A. and Santana-Ortega, A.T. (2002). “A general theory on fish aggregation to floating objects: An alternative to the meeting point hypothesis”. Re-views in Fish Biology and Fisheries, 11(3): 255-277. http://doi.org/c6rd62.
Dagorn, L., Holland, K.N., Restrepo, V. and Moreno, G. (2012). “Is it good or bad to fish with FADs? What are the real impacts of the use of drifting FADs on pelagic marine ecosystems?” Fish and Fisheries, 14(3): 391-415. http://doi.org/pz3.
Fonteneau, A., Lucas, V., Delgado, A. and Demarcq, H. (2006). Meso-scale exploi-tation of a major tuna concentration in the Indian Ocean. Indian Ocean Tuna Commission Document. IOTC-2006-WPTT-24.
Franco, J., Dagorn, L., Sancristobal I. and Moreno, G. (2009). Design of ecological FADs. Indian Ocean Tuna Commission Document. IOTC-2009-WPE 16.

A socio-economic sustainability indicator for the Basque tropical tuna... 31
García, S.M. and Staples D.J. (2000). “Sustainability reference systems and indi-cators for responsible marine capture fisheries: A review of concepts and ele-ments for a set of guidelines”. Marine Freshwater Research, 51(5): 385-426. http://doi.org/fv7b7g.
Garmendia, E., Prellezo, R., Murillas, A., Escapa, M. and Gallastegui, M.C. (2010). “Weak and strong sustainability assessment in fisheries”. Fisheries Ecological Economics, 70(1): 96-106. DOI: http://doi.org/cznhj6.
Guillotreau, P., Salladarré, F., Dewals, P. and Dagorn, L. (2011). “Fishing tuna around Fish Aggregating Devices (FADs) vs. free swimming schools: Skipper decision and other determining factors”. Fisheries Research, 109(2-3): 234-242. http://doi.org/bj72sp.
Kavanagh, P. and Pitcher, T.J. (2004). “Implementing Microsoft Excel Software for Rapfish: A Technique for the Rapid Appraisal of Fisheries Status”. Fisheries Cen-tre Research Reports, 12(2). University of British Columbia, Vancouver.
Kingsford, M.J. (1993). “Biotic and abiotic structure in the pelagic environment: Im-portance to small fish”. Bulletin of Marine Sciences, 53(2): 393-415.
Moreno, G., Dagorn, L., Sancho, G. and Itano, D. (2007). “Fish behaviour from fishers’ knowledge: the case study of tropical tuna around drifting fish aggregating devices (DFADs)”. Canadian Journal of Fisheries and Aquatic Sciences, 64(11): 1517-1528. http://doi.org/fkz7b2.
Moron, J., Areso, J.J. and Pallares, P. (2001). “Statistics and Technical Informa-tion about the Spanish Purse Seine Fleet in the Pacific”. Paper presented at 14th Meeting of the Standing Committee on Tuna and Billfish, Noumea.
Murillas, A., Prellezo, R., Garmendia, E., Escapa, M., Gallastegui, M.C. and Ansua-tegi, A. (2008). “Multidimensional and intertemporal sustainability assessment: A case study of the Basque trawl fisheries”. Fisheries Research, 91(2-3): 222-238. http://doi.org/cj7785.
Pauly, D., Christensen, V., Guénette, S., Pitcher, T.J., Sumaila, U.R., Walters, C.J., Waltson, R. and Zeller, D. (2002). “Towards sustainability in world fisheries”. Nature, 418: 689-695. http://doi.org/c2mnrr.
Parin, N.V. and Fedoryako, B.I. (1999). “Pelagic fish communities around floating objects in the open ocean. Fishing for Tunas associated with floating objects”. Inter-American Tropical Tuna Commission Document. Special Report, 11: 447-458.
Pitcher, T.J. and Preikshot, D. (2001). “RAPFISH: A rapid appraisal technique to evaluate the sustainability status of fisheries”. Fisheries Research, 49(3): 255-270. http://doi.org/b79vk2.
Preikshot, D., Nsiky, E., Pitcher, T. and Pauly, D. (1998). “An interdisciplinary eva-luation of the status and health of African lake fisheries using a rapid appraisal technique”. Journal of Fish Biology, 53: 381-393. http://doi.org/b6zdtp.
Tesfamichael, D. and Pitcher, T.J. (2006). “Multidisciplinary evaluation of the sustai-nability of Red Sea fisheries using Rapfish”. Fisheries Research, 78(2-3): 227-235. http://doi.org/fdh9kk.