Embed Size (px)
Citation preview
Marine Sanctuaries Conservation Series ONMS-15-11
A Socioeconomic Profile of Recreation Users of
the California Northern Central Coast Region,
Greater Farallones National Marine Sanctuary
and the northern portion of Monterey Bay
National Marine Sanctuary, 2011
U.S. Department of Commerce
National Oceanic and Atmospheric Administration
National Ocean Service
Office of National Marine Sanctuaries December 2015
About the Marine Sanctuaries Conservation Series
The Office of National Marine Sanctuaries, part of the National Oceanic and
Atmospheric Administration, serves as the trustee for a system of 14 marine protected
areas encompassing more than 170,000 square miles of ocean and Great Lakes waters.
The 13 national marine sanctuaries and one marine national monument within the
National Marine Sanctuary System represent areas of America’s ocean and Great Lakes
environment that are of special national significance. Within their waters, giant
humpback whales breed and calve their young, coral colonies flourish, and shipwrecks
tell stories of our maritime history. Habitats include beautiful coral reefs, lush kelp
forests, whale migrations corridors, spectacular deep-sea canyons, and underwater
archaeological sites. These special places also provide homes to thousands of unique or
endangered species and are important to America’s cultural heritage. Sites range in size
from one square mile to almost 140,000 square miles and serve as natural classrooms,
cherished recreational spots, and are home to valuable commercial industries.
Because of considerable differences in settings, resources, and threats, each marine
sanctuary has a tailored management plan. Conservation, education, research,
monitoring and enforcement programs vary accordingly. The integration of these
programs is fundamental to marine protected area management. The Marine
Sanctuaries Conservation Series reflects and supports this integration by providing a
forum for publication and discussion of the complex issues currently facing the sanctuary
system. Topics of published reports vary substantially and may include descriptions of
educational programs, discussions on resource management issues, and results of
scientific research and monitoring projects. The series facilitates integration of natural
sciences, socioeconomic and cultural sciences, education, and policy development to
accomplish the diverse needs of NOAA’s resource protection mandate. All publications
are available on the Office of National Marine Sanctuaries Web site
(http://www.sanctuaries.noaa.gov).
A Socioeconomic Profile of Recreation Users of the California
Northern Central Coast Region, Greater Farallones National
Marine Sanctuary and the northern portion of Monterey Bay
National Marine Sanctuary, 2011
Vernon R. Leeworthy, Danielle Schwarzmann and Daniela Reyes Saade
NOAA’s Office of National Marine Sanctuaries
Conservation Science Division
Silver Spring, Maryland
September 2015
U.S. Department of Commerce
Penny Pritzker, Secretary
National Oceanic and Atmospheric Administration
Kathryn Sullivan, Ph.D.
Under Secretary of Commerce for Oceans and Atmosphere
National Ocean Service
Russell Callender, Ph.D., Acting Assistant Administrator
Office of National Marine Sanctuaries
John Armour, Acting Director
U.S. Department of Commerce
Carlos M. Gutierrez, Secretary
National Oceanic and Atmospheric Administration
VADM Conrad C. Lautenbacher, Jr. (USN-ret.)
f Commerce for Oceans and Atmosphere
National Ocean Service
John H. Dunnigan, Assistant Administrator
Office of National Marine Sanctuaries
Daniel J. Basta, Director
Disclaimer
Report content does not necessarily reflect the views and policies of the Office of
National Marine Sanctuaries or the National Oceanic and Atmospheric Administration,
nor does the mention of trade names or commercial products constitute endorsement or
recommendation for use.
Report Availability
Electronic copies of this report may be downloaded from the Office of National Marine
Sanctuaries web site at http://sanctuaries.noaa.gov.
Cover
ONMS (Top Left). MBNMS, Bob Talbot (Top Center). Brandt Cormorant GFNMS (Top
Right). GFNMS (Bottom Left). Brown Pelican UFWS (Bottom Right).
Suggested Citation
Leeworthy, V., Schwarzmann, D. and Reyes Saade, D. 2015. A Socioeconomic Profile of
Recreation Users of the California Northern Central Coast Region, Greater Farallones
National Marine Sanctuary and the northern portion of Monterey Bay National Marine
Sanctuary, 2011. Marine Sanctuaries Conservation Series ONMS-15-11. U.S.
Department of Commerce, National Oceanic and Atmospheric Administration, Office of
National Marine Sanctuaries, Silver Spring, MD. 73 pp.
Contact
Dr. Vernon R. (Bob) Leeworthy Dr. Danielle N. Schwarzmann
Chief Economist Economist
Office of National Marine Sanctuaries Office of National Marine Sanctuaries
1305 East West Highway, SSMC4, 11th floor 1305 East West Highway
Silver Spring, MD 20910 Silver Spring, MD 20910
Telephone: (301) 713-7261 Telephone: (301) 713-7254
Fax: (301) 713-0404 Fax: (301) 713-040
E-mail: [email protected] [email protected]
Acknowledgements
We would like to thank Cheryl Chen of Point97 for providing the data and documentation for
the Northern Central California recreation study and Tony Reyer of the Office of National
Marine Sanctuaries, Conservation Science Division for geographic information support.
i
Abstract
This report provides a socioeconomic profile of recreation users in California’s Northern
Central Coast Region, which includes the Greater Farallones National Marine Sanctuary
(GFNMS) and the northern portion of the Monterey Bay National Marine Sanctuary
(MBNMS). The Cordell Bank National Marine Sanctuary is also located within the
region but there was not enough information obtained to do a profile for this sanctuary.
The information used here was from a study conducted by Ecotrust for the State of
California’s Monitoring Enterprise’s North Central Coast (NCC) MPA Baseline Program.
Point97 (Ecotrust’s small business unit) provided all the data and documentation so we
could estimate how much of the recreation activity in the NCC region was done in
national marine sanctuaries. The study was done covering the activity in the year 2011.
A socioeconomic profile includes demographics (e.g. age, race/ethnicity, gender,
education level, household income, household size, and place of residence) of the users;
the amount of use by type of recreation activity; and the spending in the local economy
while doing the recreation activity, and how that spending generates output/sales, value-
added, income and employment in the local economy.
The report compares profiles of the users of the entire NCC region with users of the
GFNMS and the users of the northern portion of MBNMS, and between the GFNMS and
the northern portion of MBNMS. Statistically significant differences are highlighted.
Key Words
Demographics, Recreation use, person-days, economic impact/contribution, output/sales,
value-added, income, jobs.
ii
Table of Contents
Topic Page
Abstract ................................................................................................................................ i
Key Words ........................................................................................................................... i Table of Contents ................................................................................................................ ii List of Figures and Tables.................................................................................................. iii Glossary Terms ................................................................................................................... 2 1. Introduction ................................................................................................................. 1
Source of Information ..................................................................................................... 1
Survey Methodology ....................................................................................................... 1
What was Estimated ........................................................................................................ 1 Definition of Study Areas ............................................................................................... 2
2. Demographic Profiles of Users – Who are the users? .............................................. 10 Comparative Profiles for the NCC Region, GFNMS and the norther portion of
MBNMS ........................................................................................................................ 10 3. Recreational Use – What are the users doing? .......................................................... 20
Annual and Last Trip Activity Participation ................................................................. 20
GFNMS ......................................................................................................................... 22 Northern portion of the MBNMS ................................................................................. 24
Person-trips ................................................................................................................... 25 Person-days by Activity and Activity Group ................................................................ 30 North Central California Spatial Use Maps by Activity Groups .................................. 38
4. Recreation Expenditure Profiles ............................................................................... 48
All Visitors to the NCC Region .................................................................................... 48 Recreating Visitors – Non-consumptive Recreation..................................................... 49
5. Economic Impact/Contribution to the Local Economy ............................................ 53
The Study Areas for Economic Impact ......................................................................... 53
IMPLAN ....................................................................................................................... 54 Total Output/Sales, Value-added, Income and Employment - NCC Region ............... 55 Total Output/Sales, Value-added, Income and Employment – GFNMS Region ......... 56 Total Output/Sales, Value-added, Income and Employment – northern portion of
MBNMS ........................................................................................................................ 57
References ......................................................................................................................... 58
iii
List of Figures and Tables
Figure/Table Number and Title Page
Figure 1.1 Map of the Survey Sampling Area .................................................................... 3
Figure 1.2 Map of the Recreation Areas ............................................................................. 5 Figure 2.1 Age Distribution in the 3 study areas .............................................................. 10 Figure 2.2 Gender Distribution in the 3 Study Areas ....................................................... 11 Figure 2.3 Race and Ethnicity in the 3 Study Areas ......................................................... 11 Figure 2.4 Marital Status Distribution of the 3 Study Areas ............................................ 12
Figure 2.5 Head of Household of the 3 Study Areas ........................................................ 12
Figure 2.6 Household Size Distribution of the 3 Study Areas .......................................... 13
Figure 2.7 Housing Type Distribution of the 3 Study Areas ............................................ 14 Figure 2.8 Employment Status Distribution of the 3 Study Areas ................................... 15
Figure 2.9 Educational Level Distribution of the 3 Study Areas ...................................... 16 Figure 2.10 Household Income Distribution of the 3 Study Areas................................... 17
Figure 3.1 Non-Consumptive Person-Days as a Percent of Total Person-Days ............... 33 Figure 3.2 Percentage of Person-Days by All Activities within a Region........................ 34 Figure 3.3 Percentage of Non-Consumptive Person-Days by Activity within a Region .. 37
Figure 3.4 North Central California Beach Spatial Use ................................................... 39 Figure 3.5 North Central California Car Sightseeing Spatial Use .................................... 40
Figure 3.6 North Central California Diving Spatial Use .................................................. 41 Figure 3.7 North Central California Fishing Spatial Use ................................................. 42 Figure 3.8 North Central California Photography Spatial Use ......................................... 43
Figure 3.9 North Central California Shore Based Activities Spatial Use ......................... 44
Figure 3.10 North Central California Sightseeing Spatial Use ......................................... 45 Figure 3.11 North Central California Surface Water Sports Activities Spatial Use ......... 46 Figure 3.12 North Central California Wildlife Viewing Spatial Use ............................... 47
Figure 4.1 Distribution of Total Expenditures by All Visitors in NCC ............................ 48
Figure 4.2 Distribution of Non-Consumptive Expenditures by Region ........................... 52
Table 1.1 Survey Sampling Study Area for the NCC Region ........................................... 2 Table 2.1 Age Statistics for the 3 Study Areas ................................................................. 10 Table 2.2 Household Size Statistics .................................................................................. 13
Table 2.3 Top Five Zip Codes for each Study Area ......................................................... 18 Table 2.4 Top Five Counties for each Study Area ............................................................ 19
Table 3.1 Activity Participation by Activity Group and Activity for the Last 12 months
and Last Trip: NCC Region .............................................................................................. 21 Table 3.2 Activity Participation by Activity Group and Activity for the Last 12 months
and Last Trip: GFNMS ..................................................................................................... 22 Table 3.3 Activity Participation by Activity Group and Activity for the Last 12 months
and the Last Trip: northern portion of MBNMS ............................................................... 24 Table 3.4 Person-trips by Activity/Activity Group for the Three Study Areas ................ 26
iv
Table 3.5 Person-trips by Activity/Activity Group for the Three Study Areas: Non-
Consumptive Recreation Only .......................................................................................... 28 Table 3.6 Person-days by Activity/Activity Group for the Three Study Areas ................ 31 Table 3.7 Person-days by Activity/Activity Group for the Three Study Areas: Non-
Consumptive Recreation Only .......................................................................................... 35 Table 4.1 Total Expenditures and Expenditures Per Person-day for the NCC Region
2011: All Visitors (2011 Dollars) ..................................................................................... 49 Table 4.2 Average Expenditures Per Person-day by Study Area: Non-Consumptive
Recreation Only, 2011 (2011$) ......................................................................................... 50
Table 4.3 Total Expenditures by Study Area: Non-Consumptive Recreation Only, 2011
(2011$) .............................................................................................................................. 51 Table 4.4 Estimated Proportion of Expenditures for Non-Consumptive Recreation
Accounted for by Sanctuaries in the NCC Region ........................................................... 51
Table 5.1 Primary and Secondary Counties in the Study Area for the Economic Impact
Analysis NCC Region ....................................................................................................... 53
Table 5.2 Primary and Secondary Counties in the Study Area for the Economic Impact
Analysis GFNMS .............................................................................................................. 54
Table 5.3 Primary and Secondary Counties in the Study Area for the Economic Impact
Analysis northern portion of MBNMS ............................................................................. 54 Table 5.4 IMPLAN Economic Indicators’ Definitions ..................................................... 54
Table 5.5 Impact Type Definitions ................................................................................... 55 Table 5.6 Total Economic Impacts for All Visitors to the NCC Region (2015 $) ........... 55
Table 5.7 Total Economic Impacts for All Visitors to the NCC Region, Non-
Consumptive Recreation Only (2015 $) ........................................................................... 56 Table 5.8 GFNMS Non-Consumptive Recreation Only Impacts (2015 $) ...................... 56
Table 5.9 northern portion of MBNMS Non-Consumptive Recreation Only Impacts
(2015 $) ............................................................................................................................. 57
2
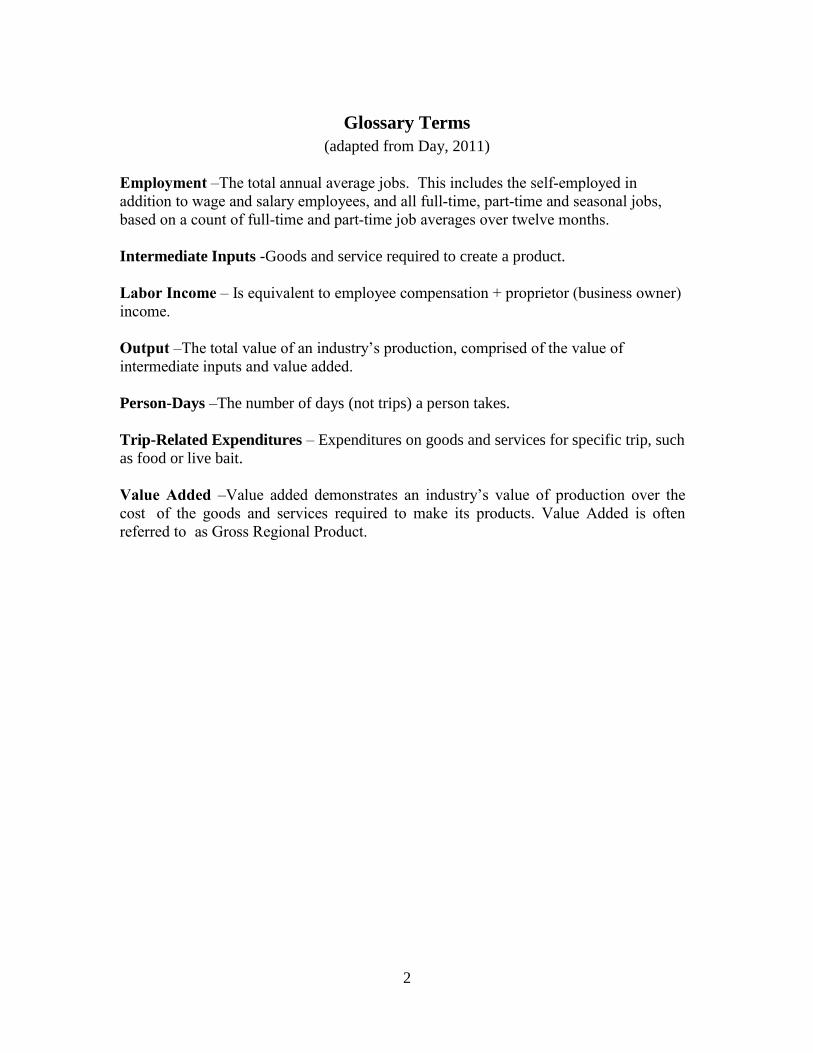
Glossary Terms
(adapted from Day, 2011)
Employment –The total annual average jobs. This includes the self-employed in
addition to wage and salary employees, and all full-time, part-time and seasonal jobs,
based on a count of full-time and part-time job averages over twelve months.
Intermediate Inputs -Goods and service required to create a product.
Labor Income – Is equivalent to employee compensation + proprietor (business owner)
income.
Output –The total value of an industry’s production, comprised of the value of
intermediate inputs and value added.
Person-Days –The number of days (not trips) a person takes.
Trip-Related Expenditures – Expenditures on goods and services for specific trip, such
as food or live bait.
Value Added –Value added demonstrates an industry’s value of production over the
cost of the goods and services required to make its products. Value Added is often
referred to as Gross Regional Product.
1
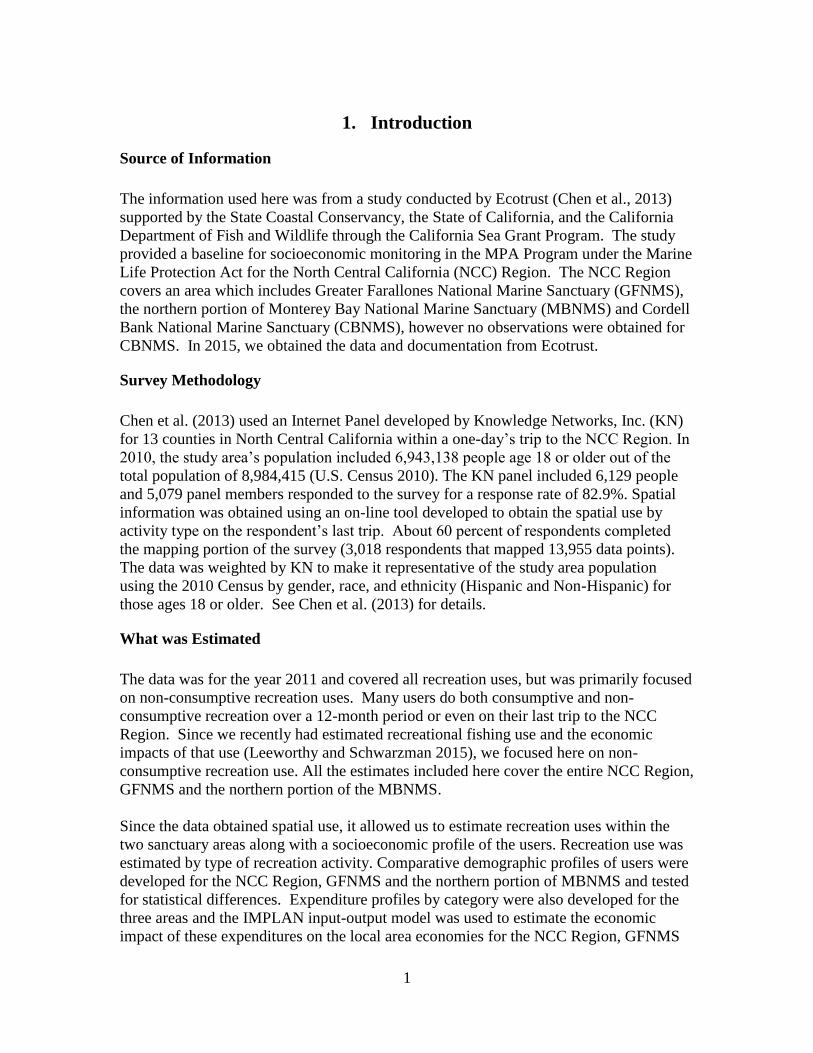
1. Introduction
Source of Information
The information used here was from a study conducted by Ecotrust (Chen et al., 2013)
supported by the State Coastal Conservancy, the State of California, and the California
Department of Fish and Wildlife through the California Sea Grant Program. The study
provided a baseline for socioeconomic monitoring in the MPA Program under the Marine
Life Protection Act for the North Central California (NCC) Region. The NCC Region
covers an area which includes Greater Farallones National Marine Sanctuary (GFNMS),
the northern portion of Monterey Bay National Marine Sanctuary (MBNMS) and Cordell
Bank National Marine Sanctuary (CBNMS), however no observations were obtained for
CBNMS. In 2015, we obtained the data and documentation from Ecotrust.
Survey Methodology
Chen et al. (2013) used an Internet Panel developed by Knowledge Networks, Inc. (KN)
for 13 counties in North Central California within a one-day’s trip to the NCC Region. In
2010, the study area’s population included 6,943,138 people age 18 or older out of the
total population of 8,984,415 (U.S. Census 2010). The KN panel included 6,129 people
and 5,079 panel members responded to the survey for a response rate of 82.9%. Spatial
information was obtained using an on-line tool developed to obtain the spatial use by
activity type on the respondent’s last trip. About 60 percent of respondents completed
the mapping portion of the survey (3,018 respondents that mapped 13,955 data points).
The data was weighted by KN to make it representative of the study area population
using the 2010 Census by gender, race, and ethnicity (Hispanic and Non-Hispanic) for
those ages 18 or older. See Chen et al. (2013) for details.
What was Estimated
The data was for the year 2011 and covered all recreation uses, but was primarily focused
on non-consumptive recreation uses. Many users do both consumptive and non-
consumptive recreation over a 12-month period or even on their last trip to the NCC
Region. Since we recently had estimated recreational fishing use and the economic
impacts of that use (Leeworthy and Schwarzman 2015), we focused here on non-
consumptive recreation use. All the estimates included here cover the entire NCC Region,
GFNMS and the northern portion of the MBNMS.
Since the data obtained spatial use, it allowed us to estimate recreation uses within the
two sanctuary areas along with a socioeconomic profile of the users. Recreation use was
estimated by type of recreation activity. Comparative demographic profiles of users were
developed for the NCC Region, GFNMS and the northern portion of MBNMS and tested
for statistical differences. Expenditure profiles by category were also developed for the
three areas and the IMPLAN input-output model was used to estimate the economic
impact of these expenditures on the local area economies for the NCC Region, GFNMS
2
and the northern portion of MBNMS in terms of total output, value added, income and
employment. The Chen et al. (2013) report did not include estimates of the economic
impact of the expenditures, so we did two estimates for the economic impact of the NCC
Region; one with all visitors and all recreation activities and one with only non-
consumptive recreation for comparison with the GFNMS and the northern portion of
MBNMS. For the details on how each estimates was made, see Leeworthy et al (2015).
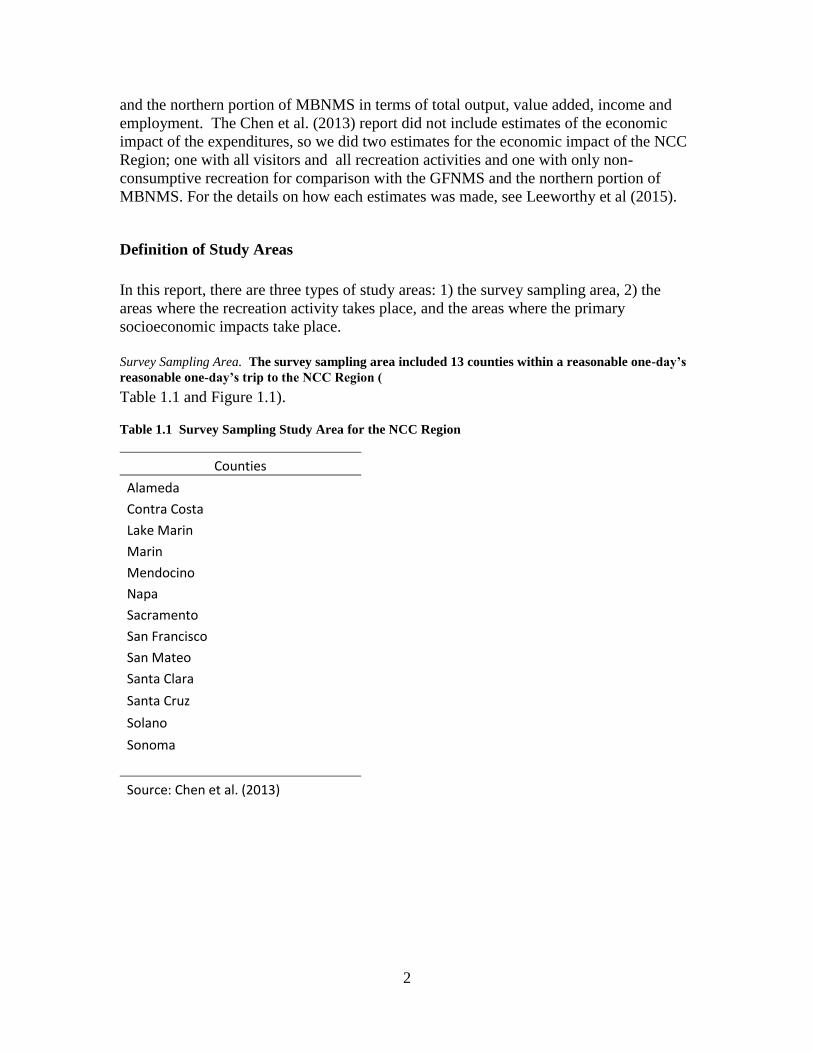
Definition of Study Areas
In this report, there are three types of study areas: 1) the survey sampling area, 2) the
areas where the recreation activity takes place, and the areas where the primary
socioeconomic impacts take place.
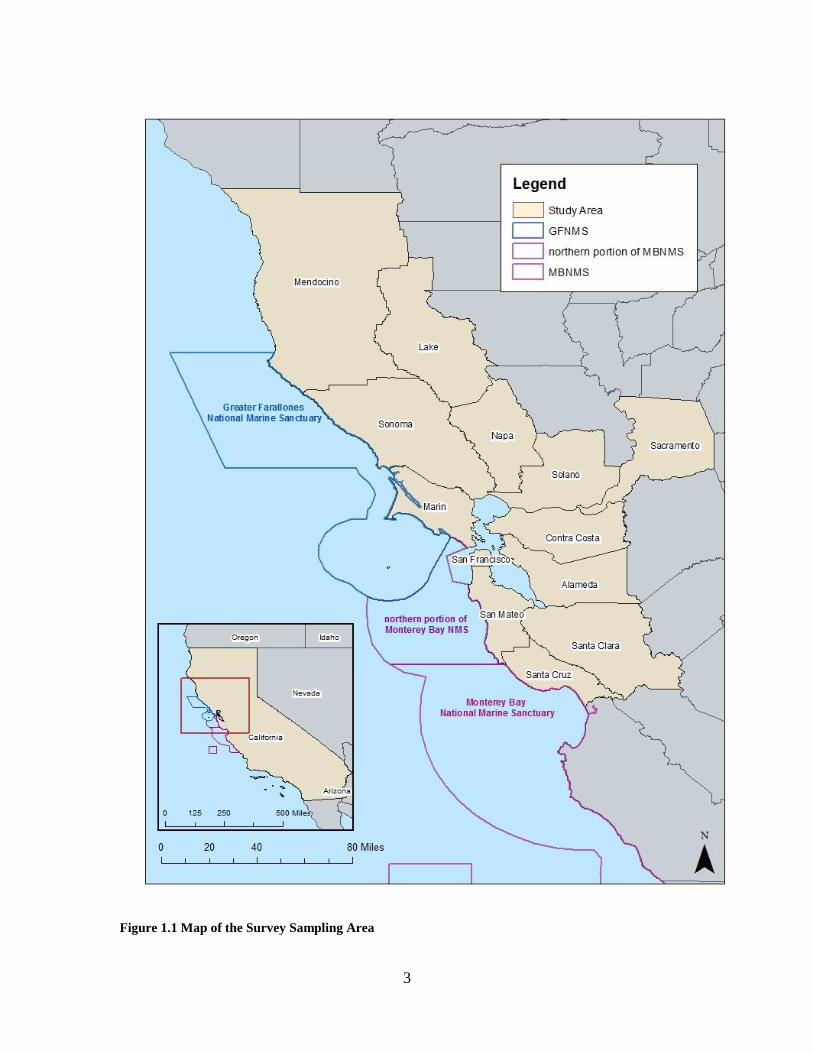
Survey Sampling Area. The survey sampling area included 13 counties within a reasonable one-day’s
reasonable one-day’s trip to the NCC Region (
Table 1.1 and Figure 1.1).
Table 1.1 Survey Sampling Study Area for the NCC Region
Counties
Alameda
Contra Costa
Lake Marin
Marin
Mendocino
Napa
Sacramento
San Francisco
San Mateo
Santa Clara
Santa Cruz
Solano
Sonoma
Source: Chen et al. (2013)
3
Figure 1.1 Map of the Survey Sampling Area
4
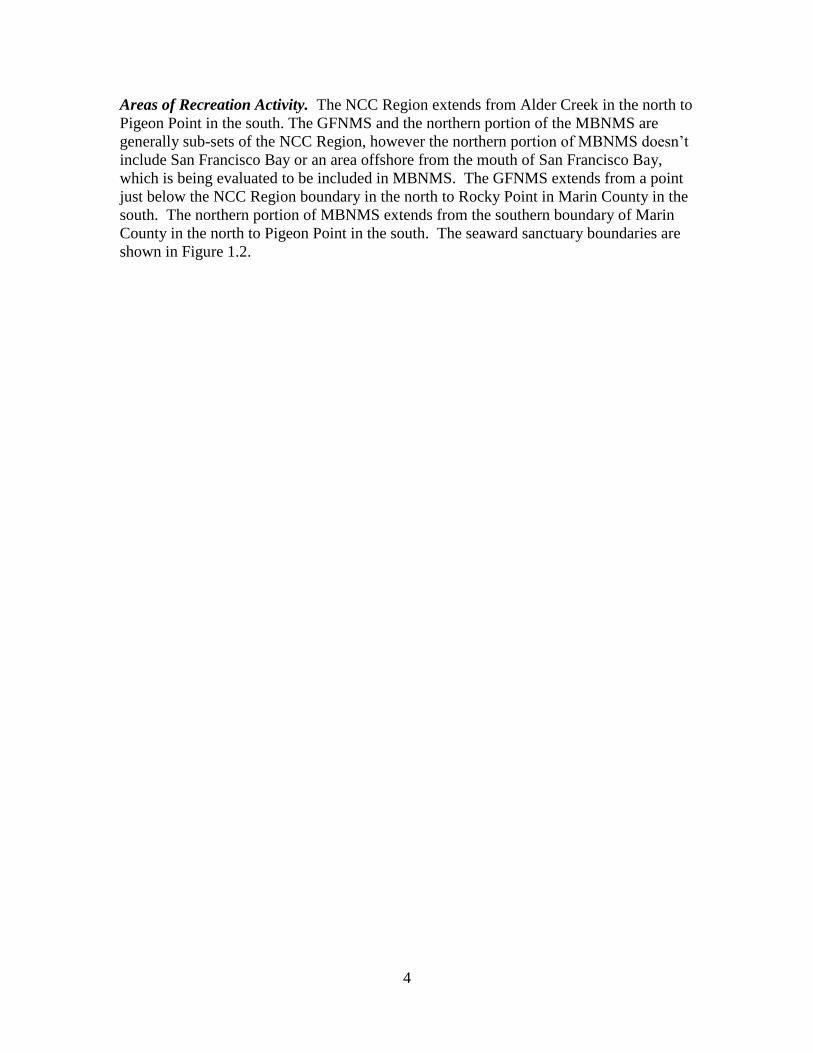
Areas of Recreation Activity. The NCC Region extends from Alder Creek in the north to
Pigeon Point in the south. The GFNMS and the northern portion of the MBNMS are
generally sub-sets of the NCC Region, however the northern portion of MBNMS doesn’t
include San Francisco Bay or an area offshore from the mouth of San Francisco Bay,
which is being evaluated to be included in MBNMS. The GFNMS extends from a point
just below the NCC Region boundary in the north to Rocky Point in Marin County in the
south. The northern portion of MBNMS extends from the southern boundary of Marin
County in the north to Pigeon Point in the south. The seaward sanctuary boundaries are
shown in Figure 1.2.
5
Figure 1.2 Map of the Recreation Areas
6
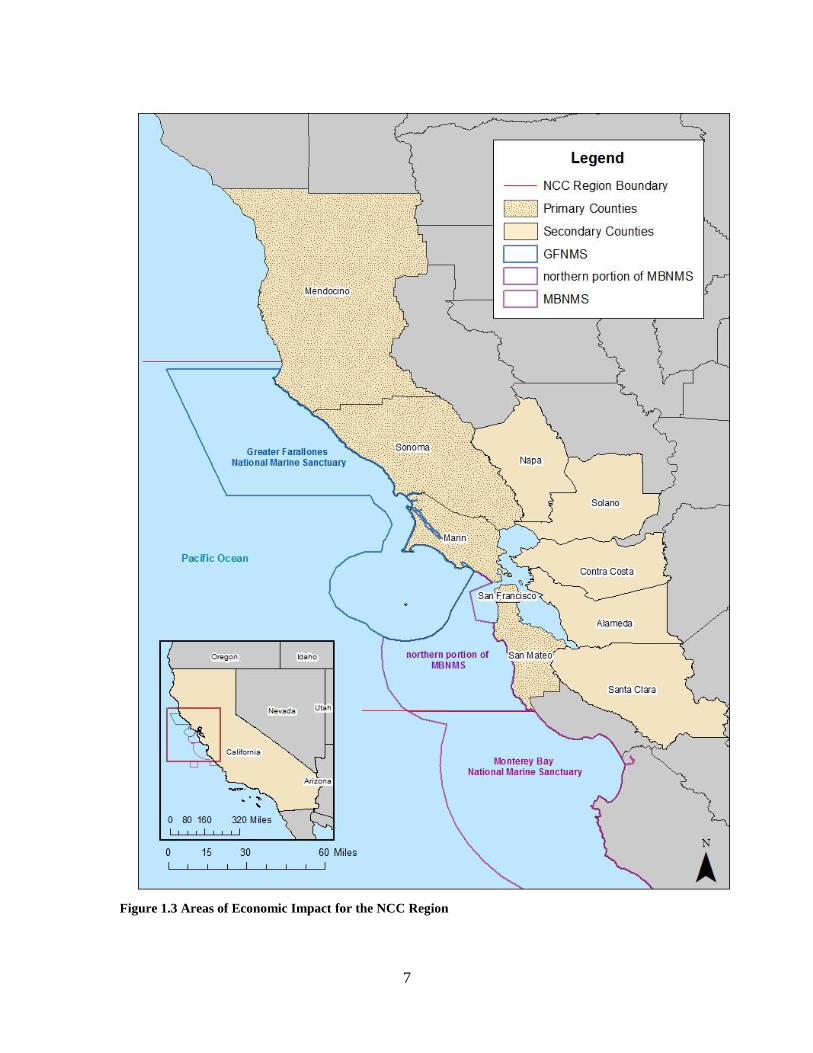
Areas of Economic Impact. Each of the three areas of recreation activity has their own
separate areas where the primary socioeconomic impacts of the recreation activity take
place. Here we focus on where the primary economic impacts take place from spending
associated with the recreation activities. In using the IMPLAN input-output model, the
first task is to define the study area for the economic impact estimation. IMPLAN uses a
county as the basic unit and one can build a study area as an aggregation of counties.
Because IMPLAN estimates the “multiplier” impacts, which include indirect and induced
impacts (see Chapter 4 for definitions), it is important to capture counties which account
for a high proportion of the inputs into production, especially labor since many people
who work in coastal counties live inland in adjacent counties. We defined counties as
primary counties (counties adjacent to the coastal and ocean waters) and secondary
counties (counties for which a high number of employees in the primary counties live).
The employees in primary counties that live in secondary counties spend a portion of
their incomes in their home counties for housing, food, transportation and other services
and this makes up the “induced” portion of the “multiplier” in IMPLAN.
We used the “Census of Inter-county Commuters” (U.S. Census 2009-2013), which
provides the employment by county of residence and county of work to determine
secondary counties of impact. We used a cut-off of 4,000 employees to establish whether
a county would be counted as a secondary impact county. The details of this estimation
are provided in Leeworthy et al (2015).
7
Figure 1.3 Areas of Economic Impact for the NCC Region
8
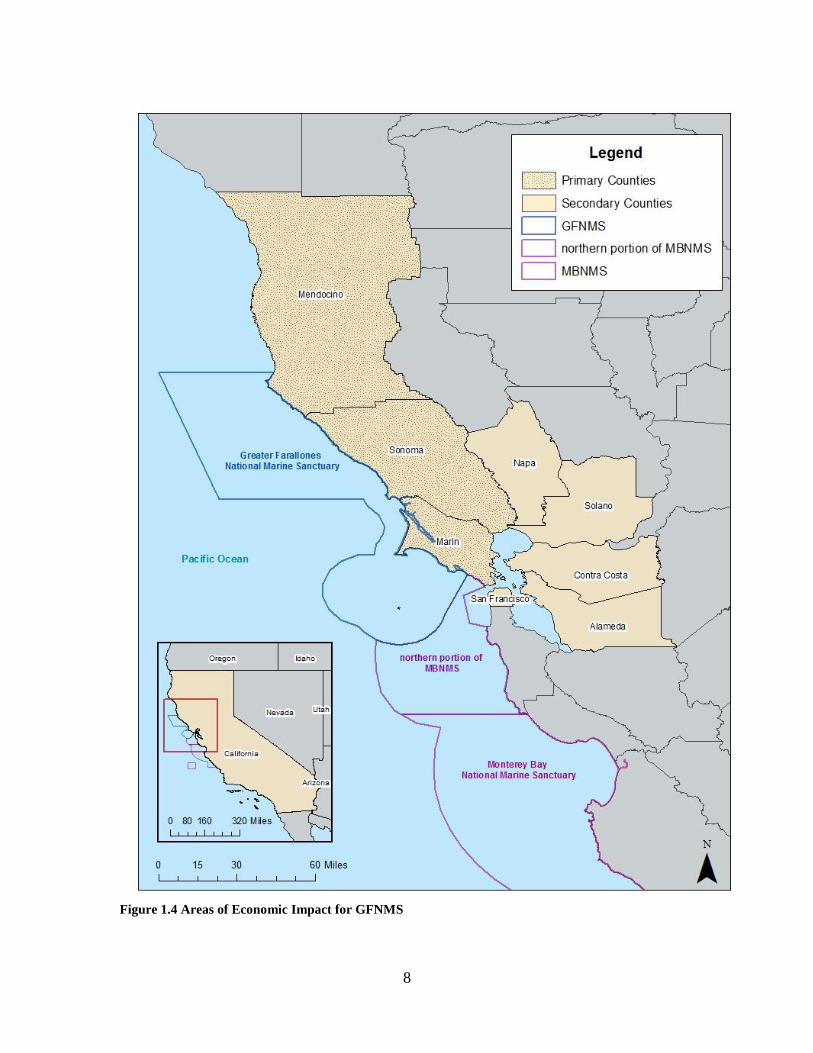
Figure 1.4 Areas of Economic Impact for GFNMS
9
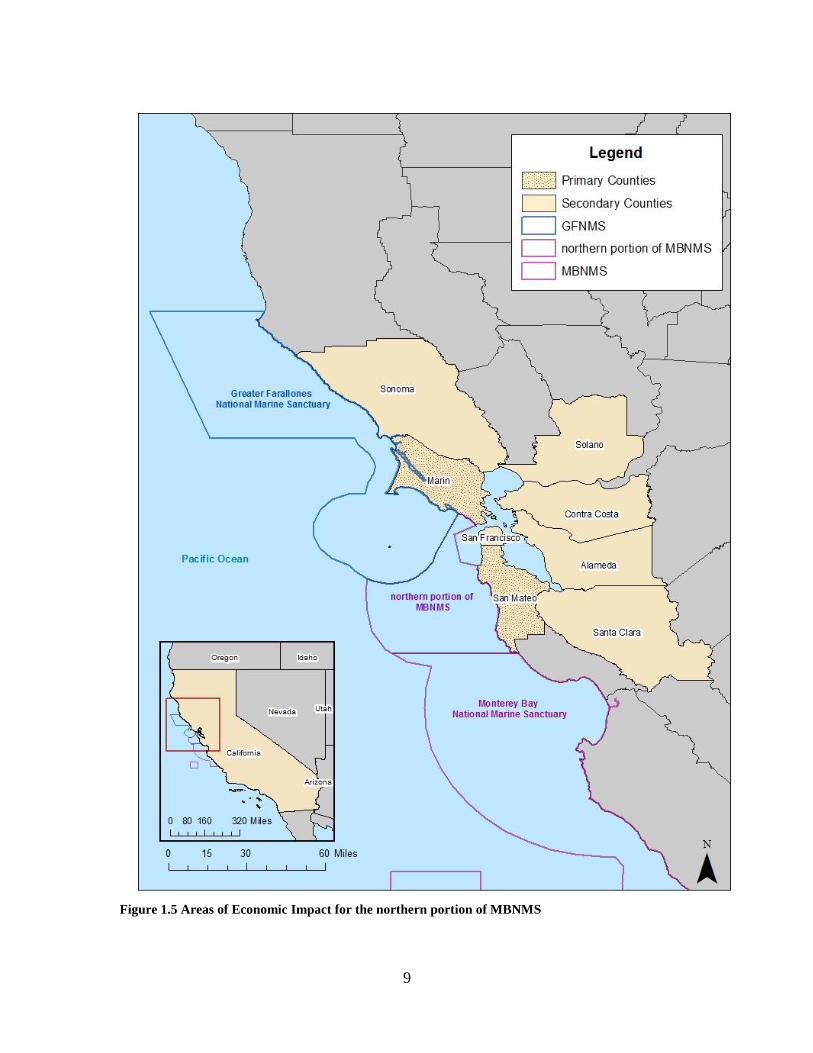
Figure 1.5 Areas of Economic Impact for the northern portion of MBNMS
10
2. Demographic Profiles of Users – Who are the users?
Comparative Profiles for the NCC Region, GFNMS and the norther portion of
MBNMS
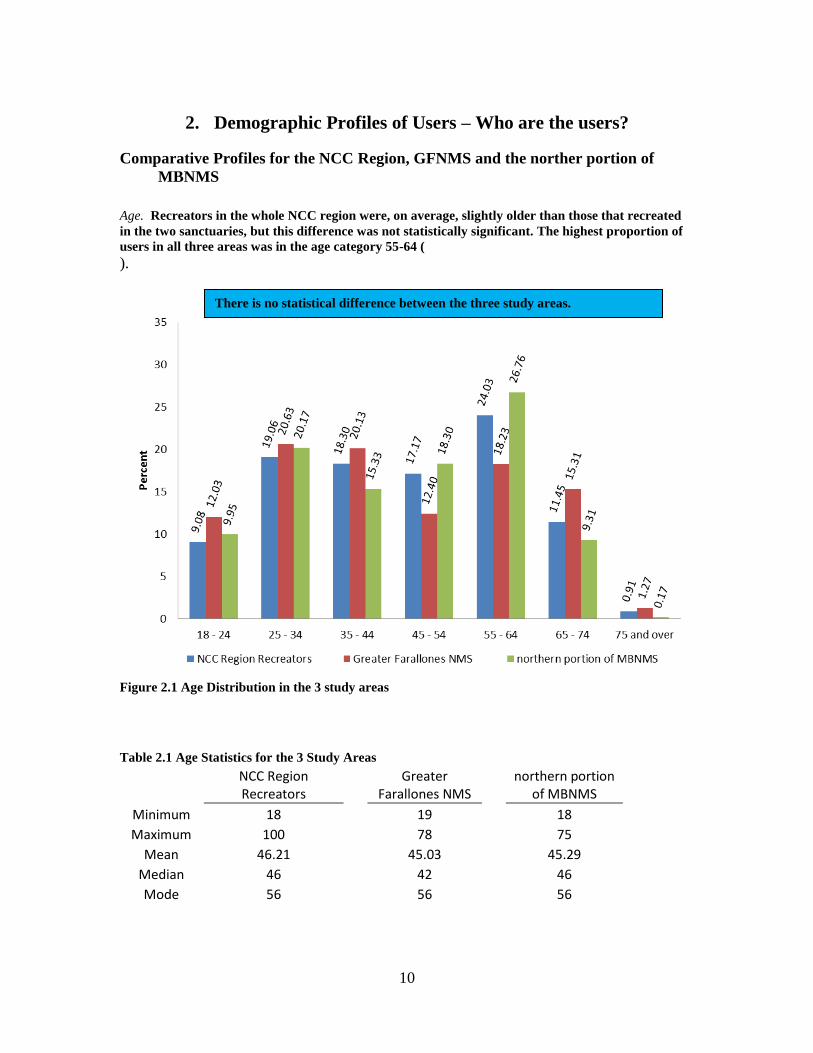
Age. Recreators in the whole NCC region were, on average, slightly older than those that recreated
in the two sanctuaries, but this difference was not statistically significant. The highest proportion of
users in all three areas was in the age category 55-64 (
).
Figure 2.1 Age Distribution in the 3 study areas
Table 2.1 Age Statistics for the 3 Study Areas
NCC Region Recreators
Greater Farallones NMS
northern portion of MBNMS
Minimum 18
19
18
Maximum 100
78
75
Mean 46.21
45.03
45.29
Median 46
42
46
Mode 56
56
56
There is no statistical difference between the three study areas.
11
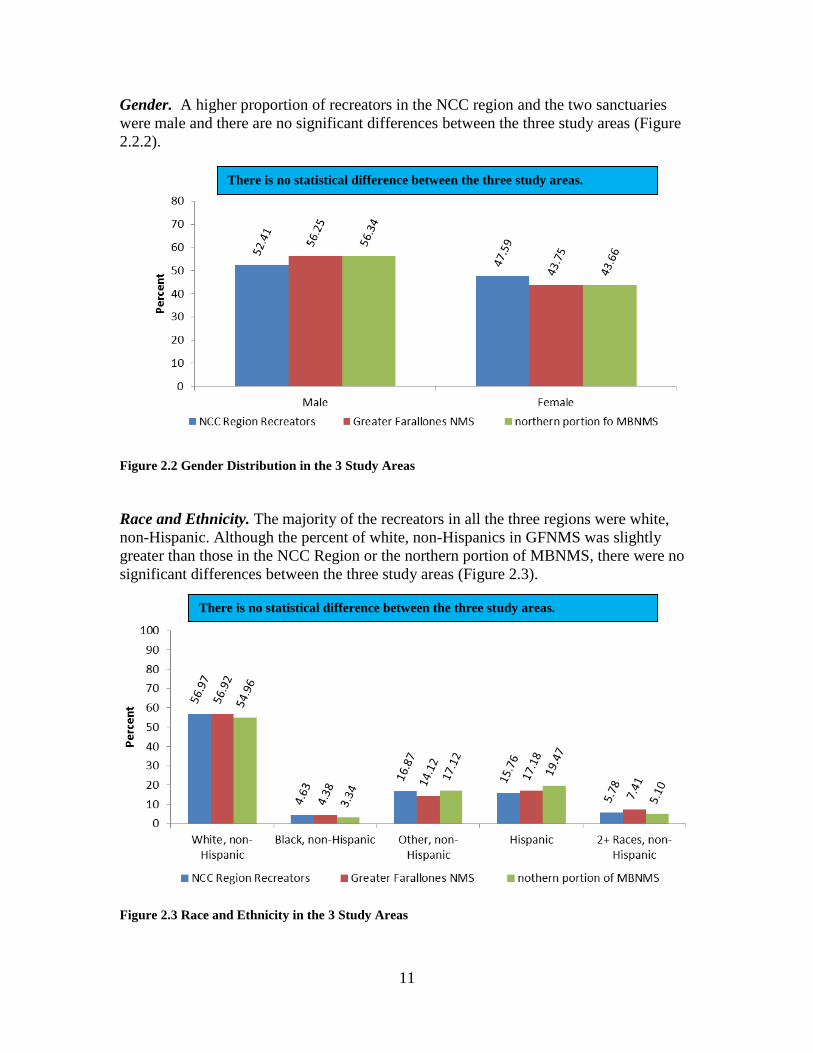
Gender. A higher proportion of recreators in the NCC region and the two sanctuaries
were male and there are no significant differences between the three study areas (Figure
2.2.2).
Figure 2.2 Gender Distribution in the 3 Study Areas
Race and Ethnicity. The majority of the recreators in all the three regions were white,
non-Hispanic. Although the percent of white, non-Hispanics in GFNMS was slightly
greater than those in the NCC Region or the northern portion of MBNMS, there were no
significant differences between the three study areas (Figure 2.3).
Figure 2.3 Race and Ethnicity in the 3 Study Areas
There is no statistical difference between the three study areas.
There is no statistical difference between the three study areas.
12
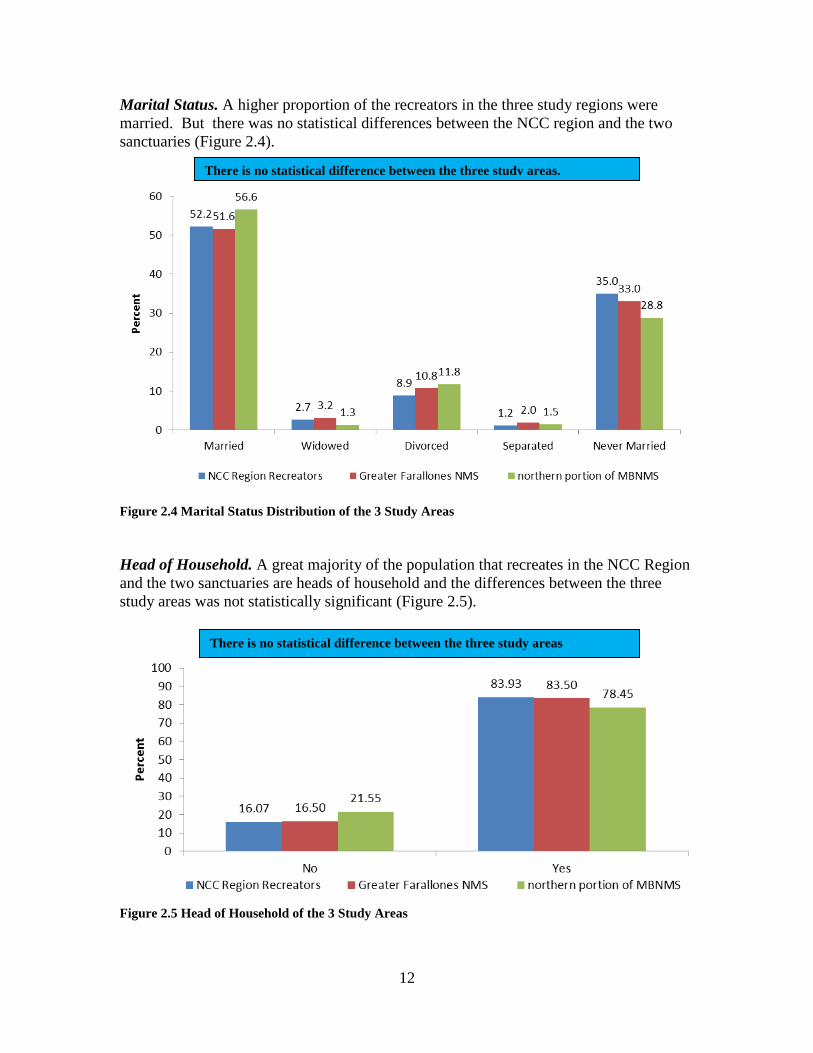
Marital Status. A higher proportion of the recreators in the three study regions were
married. But there was no statistical differences between the NCC region and the two
sanctuaries (Figure 2.4).
Figure 2.4 Marital Status Distribution of the 3 Study Areas
Head of Household. A great majority of the population that recreates in the NCC Region
and the two sanctuaries are heads of household and the differences between the three
study areas was not statistically significant (Figure 2.5).
Figure 2.5 Head of Household of the 3 Study Areas
There is no statistical difference between the three study areas
There is no statistical difference between the three study areas.
13
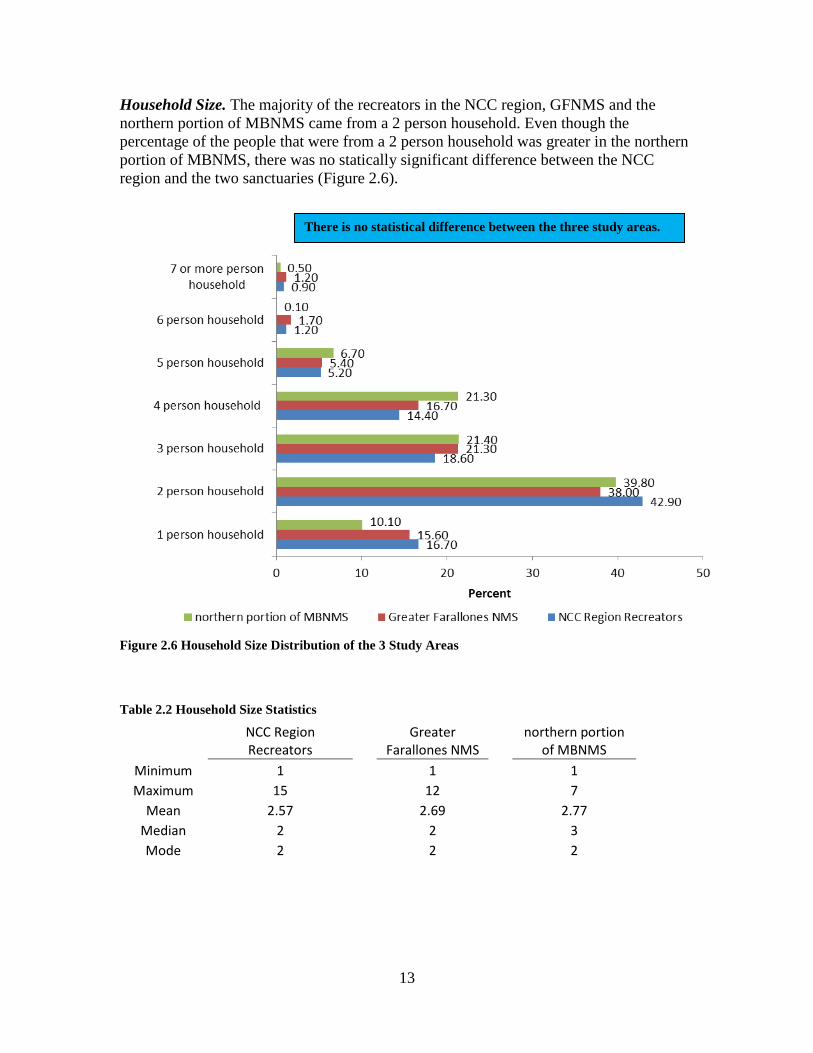
Household Size. The majority of the recreators in the NCC region, GFNMS and the
northern portion of MBNMS came from a 2 person household. Even though the
percentage of the people that were from a 2 person household was greater in the northern
portion of MBNMS, there was no statically significant difference between the NCC
region and the two sanctuaries (Figure 2.6).
Figure 2.6 Household Size Distribution of the 3 Study Areas
Table 2.2 Household Size Statistics
NCC Region Recreators
Greater Farallones NMS
northern portion of MBNMS
Minimum 1
1
1
Maximum 15
12
7
Mean 2.57
2.69
2.77
Median 2
2
3
Mode 2
2
2
There is no statistical difference between the three study areas.
14
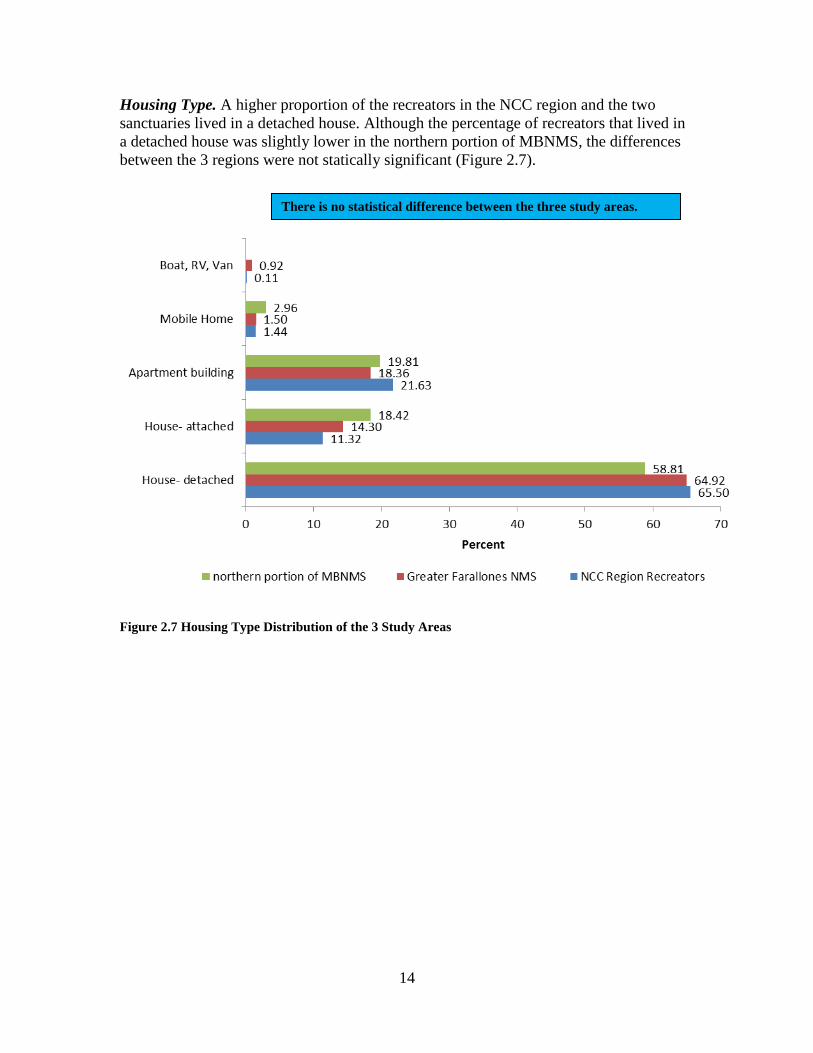
Housing Type. A higher proportion of the recreators in the NCC region and the two
sanctuaries lived in a detached house. Although the percentage of recreators that lived in
a detached house was slightly lower in the northern portion of MBNMS, the differences
between the 3 regions were not statically significant (Figure 2.7).
Figure 2.7 Housing Type Distribution of the 3 Study Areas
There is no statistical difference between the three study areas.
15
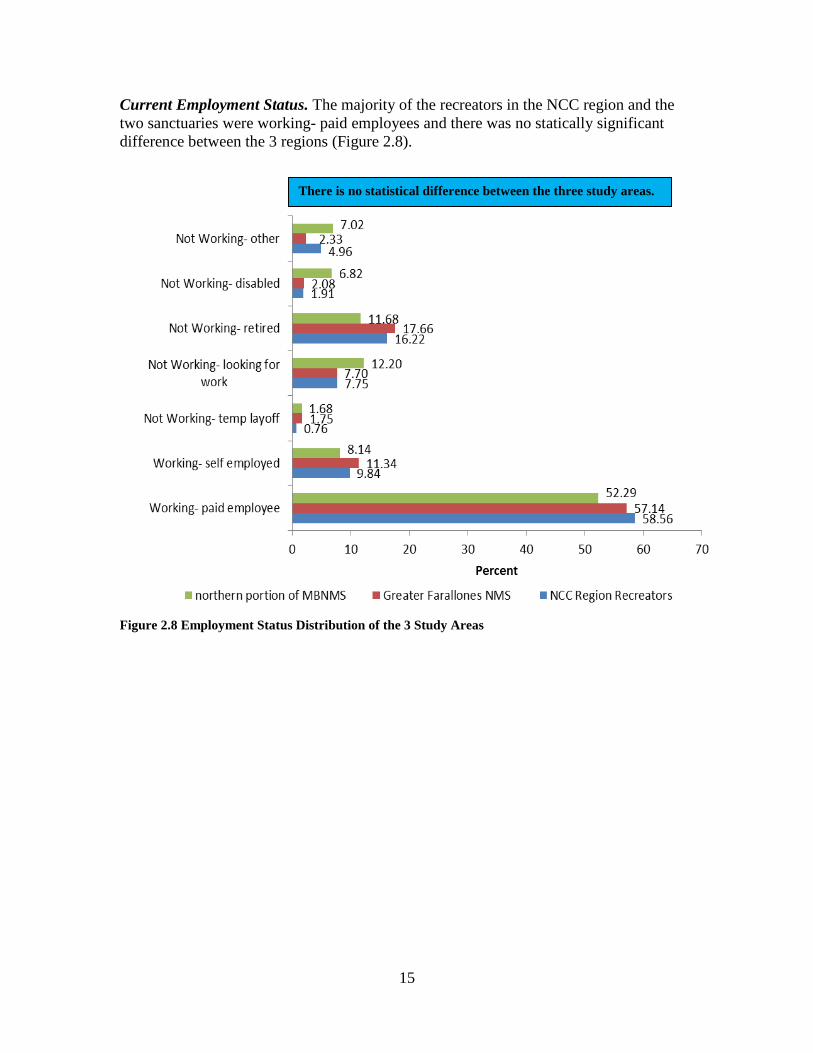
Current Employment Status. The majority of the recreators in the NCC region and the
two sanctuaries were working- paid employees and there was no statically significant
difference between the 3 regions (Figure 2.8).
Figure 2.8 Employment Status Distribution of the 3 Study Areas
There is no statistical difference between the three study areas.
16
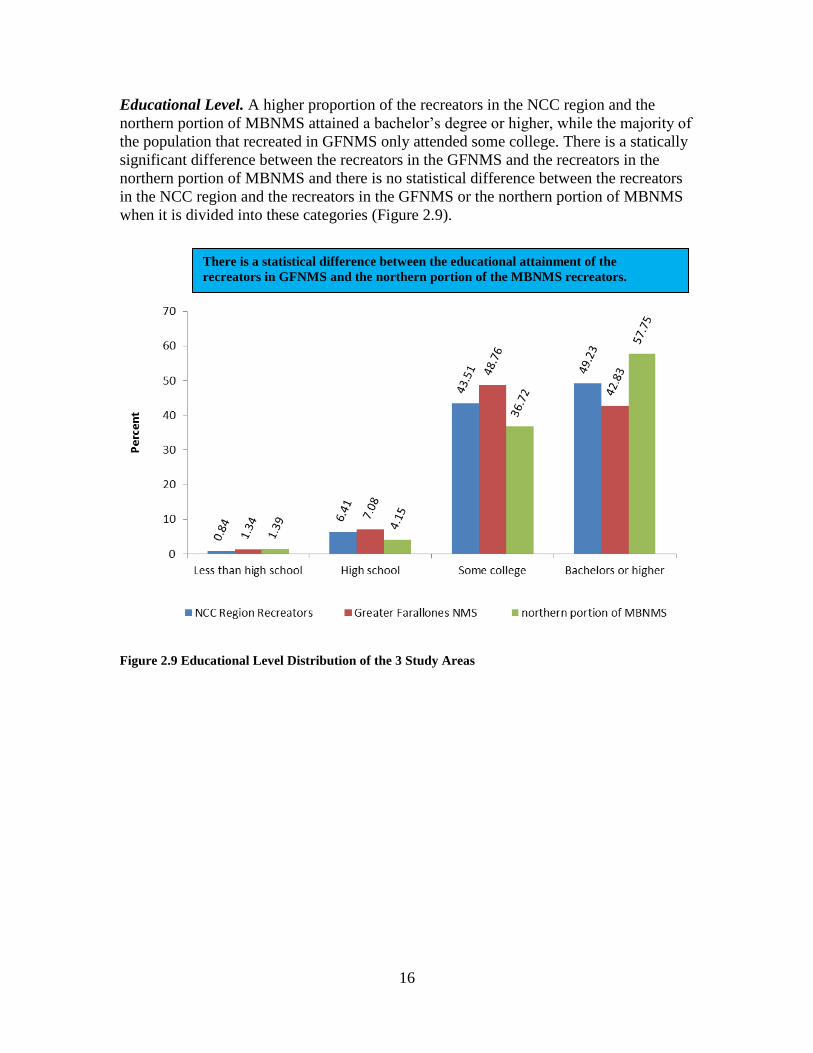
Educational Level. A higher proportion of the recreators in the NCC region and the
northern portion of MBNMS attained a bachelor’s degree or higher, while the majority of
the population that recreated in GFNMS only attended some college. There is a statically
significant difference between the recreators in the GFNMS and the recreators in the
northern portion of MBNMS and there is no statistical difference between the recreators
in the NCC region and the recreators in the GFNMS or the northern portion of MBNMS
when it is divided into these categories (Figure 2.9).
Figure 2.9 Educational Level Distribution of the 3 Study Areas
There is a statistical difference between the educational attainment of the
recreators in GFNMS and the northern portion of the MBNMS recreators.
17
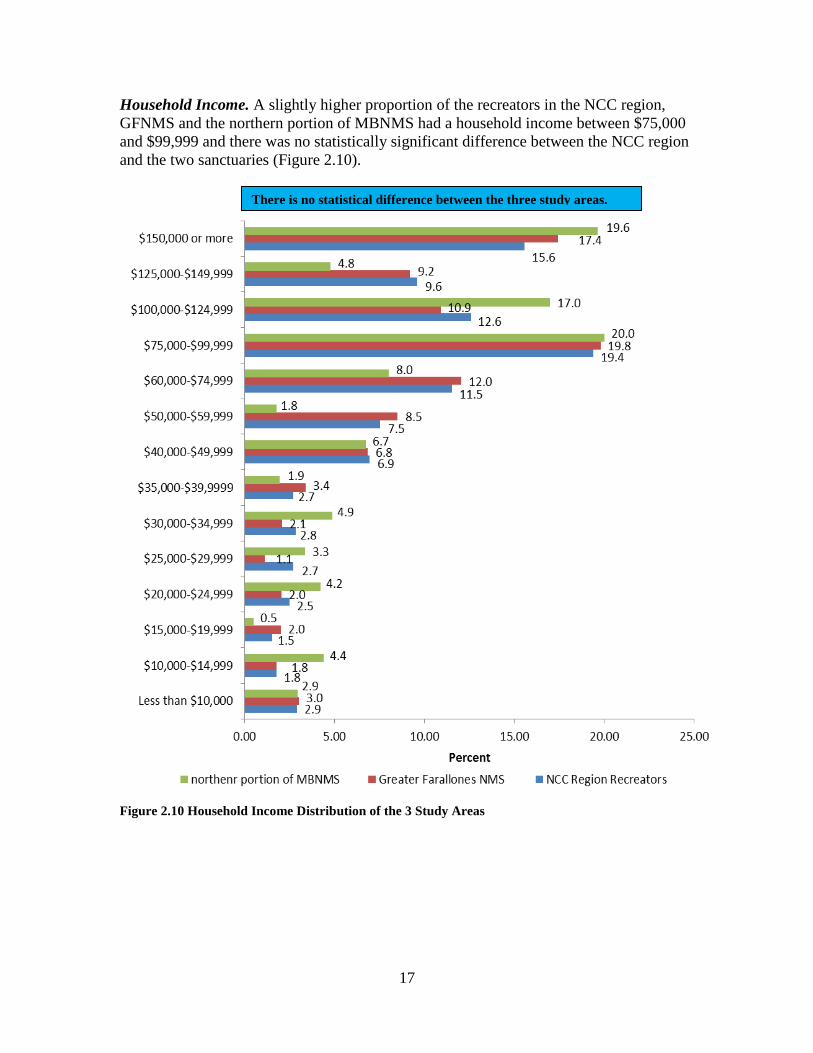
Household Income. A slightly higher proportion of the recreators in the NCC region,
GFNMS and the northern portion of MBNMS had a household income between $75,000
and $99,999 and there was no statistically significant difference between the NCC region
and the two sanctuaries (Figure 2.10).
Figure 2.10 Household Income Distribution of the 3 Study Areas
There is no statistical difference between the three study areas.
18
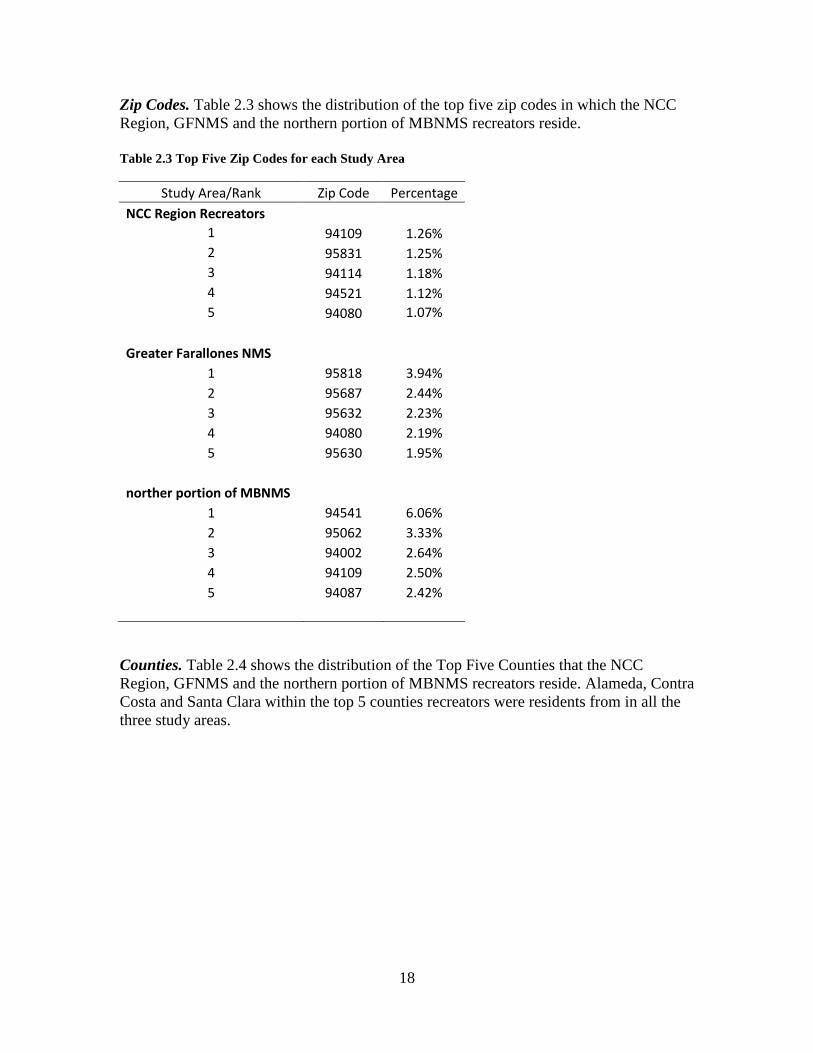
Zip Codes. Table 2.3 shows the distribution of the top five zip codes in which the NCC
Region, GFNMS and the northern portion of MBNMS recreators reside.
Table 2.3 Top Five Zip Codes for each Study Area
Study Area/Rank Zip Code Percentage
NCC Region Recreators 1 94109 1.26%
2 95831 1.25%
3 94114 1.18%
4 94521 1.12%
5 94080 1.07%
Greater Farallones NMS 1 95818 3.94%
2 95687 2.44%
3 95632 2.23%
4 94080 2.19%
5 95630 1.95%
norther portion of MBNMS 1 94541 6.06%
2 95062 3.33%
3 94002 2.64%
4 94109 2.50%
5 94087 2.42%
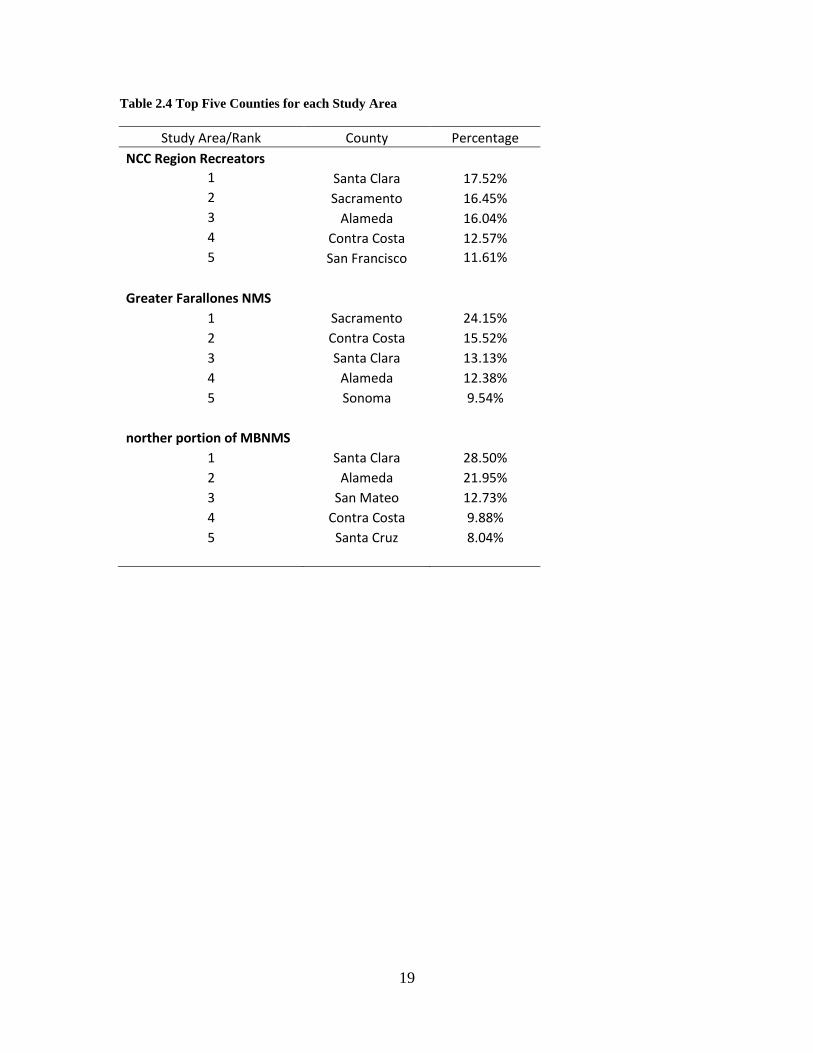
Counties. Table 2.4 shows the distribution of the Top Five Counties that the NCC
Region, GFNMS and the northern portion of MBNMS recreators reside. Alameda, Contra
Costa and Santa Clara within the top 5 counties recreators were residents from in all the
three study areas.
19
Table 2.4 Top Five Counties for each Study Area
Study Area/Rank County Percentage
NCC Region Recreators 1 Santa Clara 17.52%
2 Sacramento 16.45%
3 Alameda 16.04%
4 Contra Costa 12.57%
5 San Francisco 11.61%
Greater Farallones NMS 1 Sacramento 24.15%
2 Contra Costa 15.52%
3 Santa Clara 13.13%
4 Alameda 12.38%
5 Sonoma 9.54%
norther portion of MBNMS 1 Santa Clara 28.50%
2 Alameda 21.95%
3 San Mateo 12.73%
4 Contra Costa 9.88%
5 Santa Cruz 8.04%
20
3. Recreational Use – What are the users doing?
This chapter presents information on the annual level of activity participation for the
NCC region, GFNMS and the northern portion of MBNMS. Information is presented on
annual and last trip activity, person-trips and person-days. For detailed descriptions of
the analysis of activity participation, refer to the Technical Appendix of this Report
(Leeworthy et al, 2015).
Annual and Last Trip Activity Participation
NCC Region
The activity participation estimates provided here are in agreement with those provided in
Chen et al. (2013) for the NCC Region. They are repeated here for easy comparison with
the profiles for the two sanctuary areas. We departed from Chen et al. (2013) in that there
are nine activity groupings. Table 3.1 summarizes the estimates for participation in the
NCC Region.
21
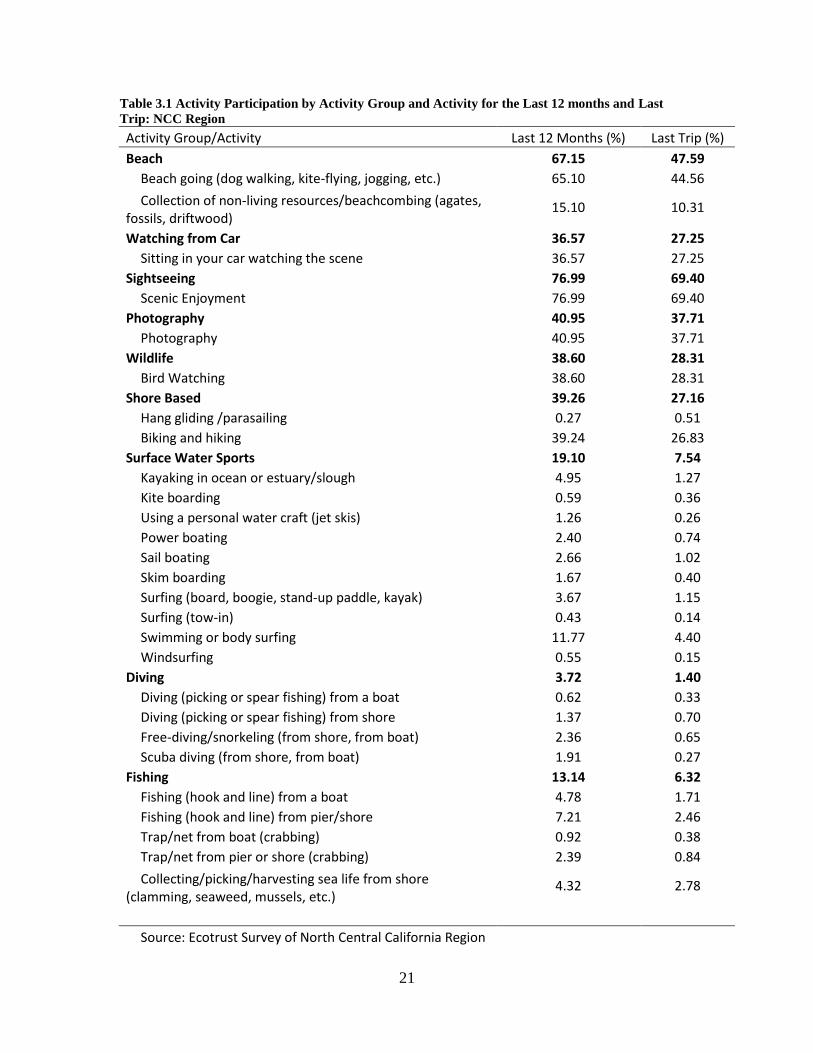
Table 3.1 Activity Participation by Activity Group and Activity for the Last 12 months and Last
Trip: NCC Region
Activity Group/Activity Last 12 Months (%) Last Trip (%)
Beach 67.15 47.59
Beach going (dog walking, kite-flying, jogging, etc.) 65.10 44.56
Collection of non-living resources/beachcombing (agates, fossils, driftwood)
15.10 10.31
Watching from Car 36.57 27.25
Sitting in your car watching the scene 36.57 27.25
Sightseeing 76.99 69.40
Scenic Enjoyment 76.99 69.40
Photography 40.95 37.71
Photography 40.95 37.71
Wildlife 38.60 28.31
Bird Watching 38.60 28.31
Shore Based 39.26 27.16
Hang gliding /parasailing 0.27 0.51
Biking and hiking 39.24 26.83
Surface Water Sports 19.10 7.54
Kayaking in ocean or estuary/slough 4.95 1.27
Kite boarding 0.59 0.36
Using a personal water craft (jet skis) 1.26 0.26
Power boating 2.40 0.74
Sail boating 2.66 1.02
Skim boarding 1.67 0.40
Surfing (board, boogie, stand-up paddle, kayak) 3.67 1.15
Surfing (tow-in) 0.43 0.14
Swimming or body surfing 11.77 4.40
Windsurfing 0.55 0.15
Diving 3.72 1.40
Diving (picking or spear fishing) from a boat 0.62 0.33
Diving (picking or spear fishing) from shore 1.37 0.70
Free-diving/snorkeling (from shore, from boat) 2.36 0.65
Scuba diving (from shore, from boat) 1.91 0.27
Fishing 13.14 6.32
Fishing (hook and line) from a boat 4.78 1.71
Fishing (hook and line) from pier/shore 7.21 2.46
Trap/net from boat (crabbing) 0.92 0.38
Trap/net from pier or shore (crabbing) 2.39 0.84
Collecting/picking/harvesting sea life from shore (clamming, seaweed, mussels, etc.)
4.32 2.78
Source: Ecotrust Survey of North Central California Region
22
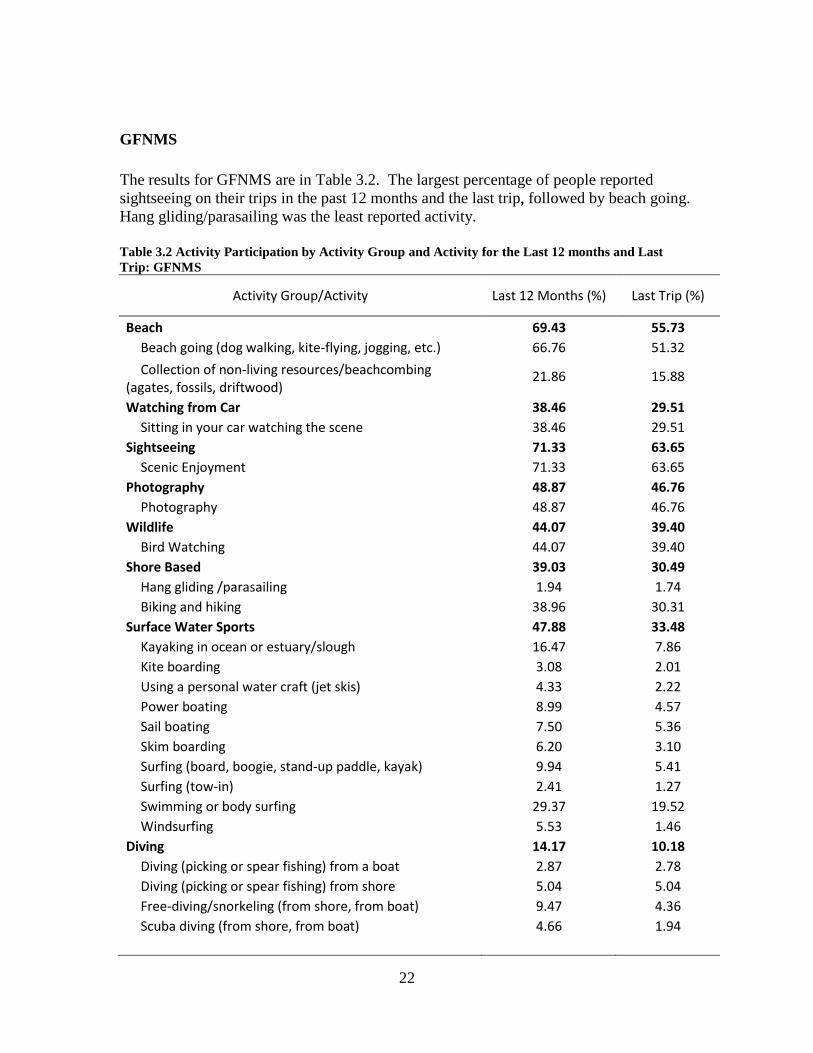
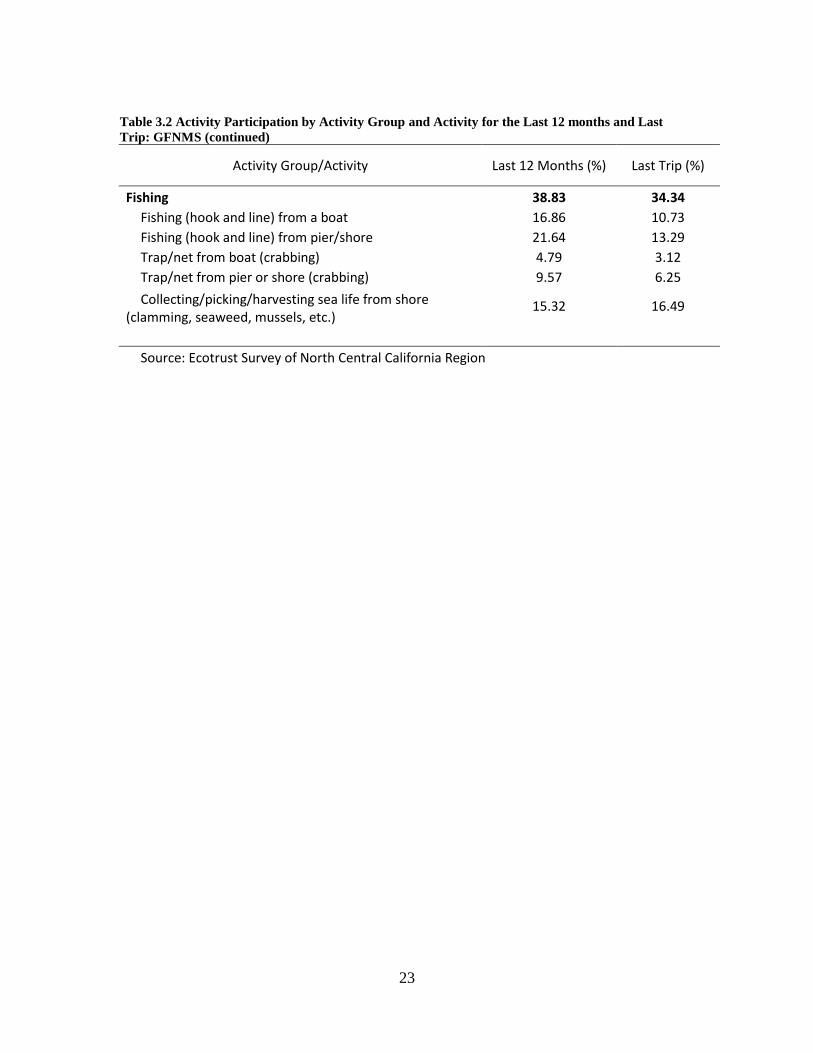
GFNMS
The results for GFNMS are in Table 3.2. The largest percentage of people reported
sightseeing on their trips in the past 12 months and the last trip, followed by beach going.
Hang gliding/parasailing was the least reported activity.
Table 3.2 Activity Participation by Activity Group and Activity for the Last 12 months and Last
Trip: GFNMS
Activity Group/Activity Last 12 Months (%) Last Trip (%)
Beach 69.43 55.73
Beach going (dog walking, kite-flying, jogging, etc.) 66.76 51.32
Collection of non-living resources/beachcombing (agates, fossils, driftwood)
21.86 15.88
Watching from Car 38.46 29.51
Sitting in your car watching the scene 38.46 29.51
Sightseeing 71.33 63.65
Scenic Enjoyment 71.33 63.65
Photography 48.87 46.76
Photography 48.87 46.76
Wildlife 44.07 39.40
Bird Watching 44.07 39.40
Shore Based 39.03 30.49
Hang gliding /parasailing 1.94 1.74
Biking and hiking 38.96 30.31
Surface Water Sports 47.88 33.48
Kayaking in ocean or estuary/slough 16.47 7.86
Kite boarding 3.08 2.01
Using a personal water craft (jet skis) 4.33 2.22
Power boating 8.99 4.57
Sail boating 7.50 5.36
Skim boarding 6.20 3.10
Surfing (board, boogie, stand-up paddle, kayak) 9.94 5.41
Surfing (tow-in) 2.41 1.27
Swimming or body surfing 29.37 19.52
Windsurfing 5.53 1.46
Diving 14.17 10.18
Diving (picking or spear fishing) from a boat 2.87 2.78
Diving (picking or spear fishing) from shore 5.04 5.04
Free-diving/snorkeling (from shore, from boat) 9.47 4.36
Scuba diving (from shore, from boat) 4.66 1.94
23
Table 3.2 Activity Participation by Activity Group and Activity for the Last 12 months and Last
Trip: GFNMS (continued)
Activity Group/Activity Last 12 Months (%) Last Trip (%)
Fishing 38.83 34.34
Fishing (hook and line) from a boat 16.86 10.73
Fishing (hook and line) from pier/shore 21.64 13.29
Trap/net from boat (crabbing) 4.79 3.12
Trap/net from pier or shore (crabbing) 9.57 6.25
Collecting/picking/harvesting sea life from shore (clamming, seaweed, mussels, etc.)
15.32 16.49
Source: Ecotrust Survey of North Central California Region
24
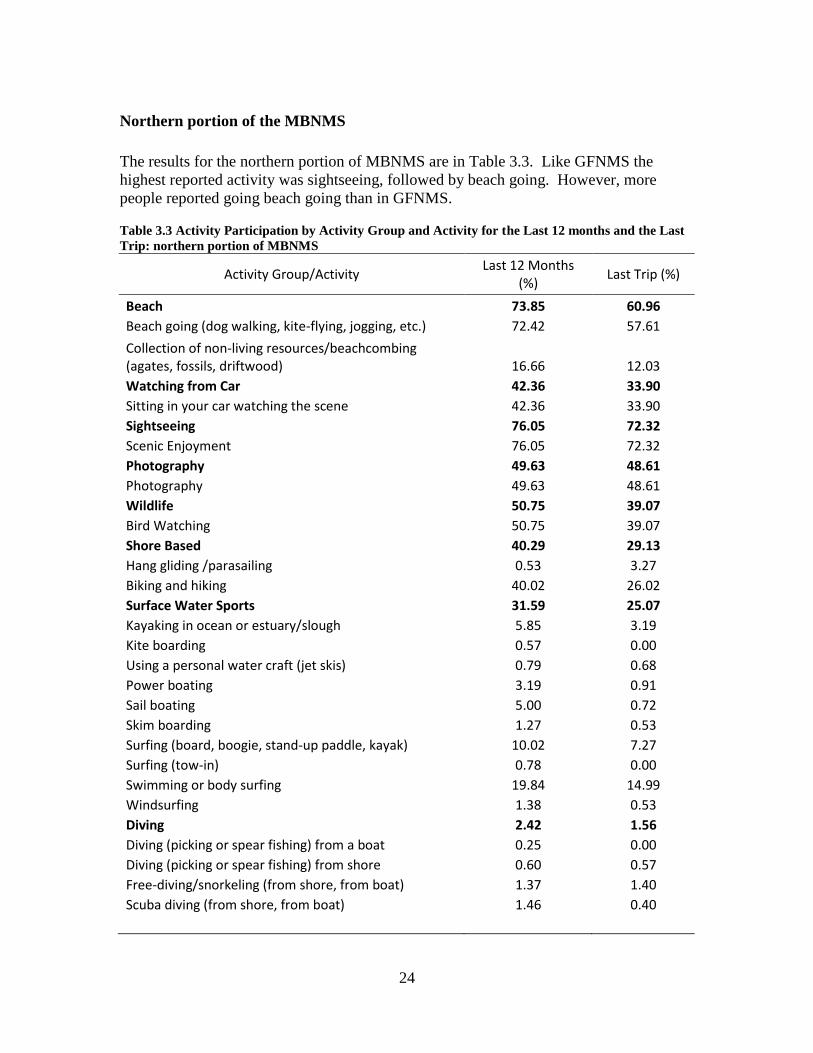
Northern portion of the MBNMS
The results for the northern portion of MBNMS are in Table 3.3. Like GFNMS the
highest reported activity was sightseeing, followed by beach going. However, more
people reported going beach going than in GFNMS.
Table 3.3 Activity Participation by Activity Group and Activity for the Last 12 months and the Last
Trip: northern portion of MBNMS
Activity Group/Activity Last 12 Months
(%) Last Trip (%)
Beach 73.85 60.96
Beach going (dog walking, kite-flying, jogging, etc.) 72.42 57.61
Collection of non-living resources/beachcombing (agates, fossils, driftwood) 16.66 12.03
Watching from Car 42.36 33.90
Sitting in your car watching the scene 42.36 33.90
Sightseeing 76.05 72.32
Scenic Enjoyment 76.05 72.32
Photography 49.63 48.61
Photography 49.63 48.61
Wildlife 50.75 39.07
Bird Watching 50.75 39.07
Shore Based 40.29 29.13
Hang gliding /parasailing 0.53 3.27
Biking and hiking 40.02 26.02
Surface Water Sports 31.59 25.07
Kayaking in ocean or estuary/slough 5.85 3.19
Kite boarding 0.57 0.00
Using a personal water craft (jet skis) 0.79 0.68
Power boating 3.19 0.91
Sail boating 5.00 0.72
Skim boarding 1.27 0.53
Surfing (board, boogie, stand-up paddle, kayak) 10.02 7.27
Surfing (tow-in) 0.78 0.00
Swimming or body surfing 19.84 14.99
Windsurfing 1.38 0.53
Diving 2.42 1.56
Diving (picking or spear fishing) from a boat 0.25 0.00
Diving (picking or spear fishing) from shore 0.60 0.57
Free-diving/snorkeling (from shore, from boat) 1.37 1.40
Scuba diving (from shore, from boat) 1.46 0.40
25
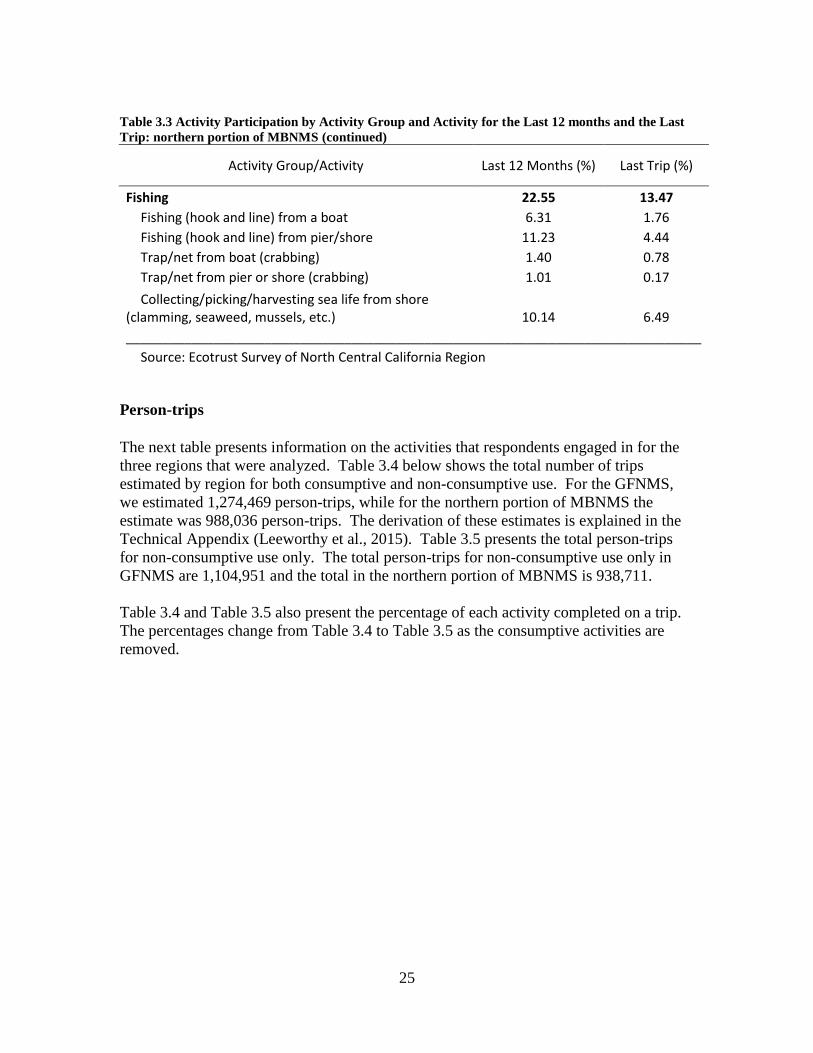
Table 3.3 Activity Participation by Activity Group and Activity for the Last 12 months and the Last
Trip: northern portion of MBNMS (continued)
Activity Group/Activity Last 12 Months (%) Last Trip (%)
Fishing 22.55 13.47
Fishing (hook and line) from a boat 6.31 1.76
Fishing (hook and line) from pier/shore 11.23 4.44
Trap/net from boat (crabbing) 1.40 0.78
Trap/net from pier or shore (crabbing) 1.01 0.17
Collecting/picking/harvesting sea life from shore (clamming, seaweed, mussels, etc.) 10.14 6.49
_______________________________________________________________________________
Source: Ecotrust Survey of North Central California Region
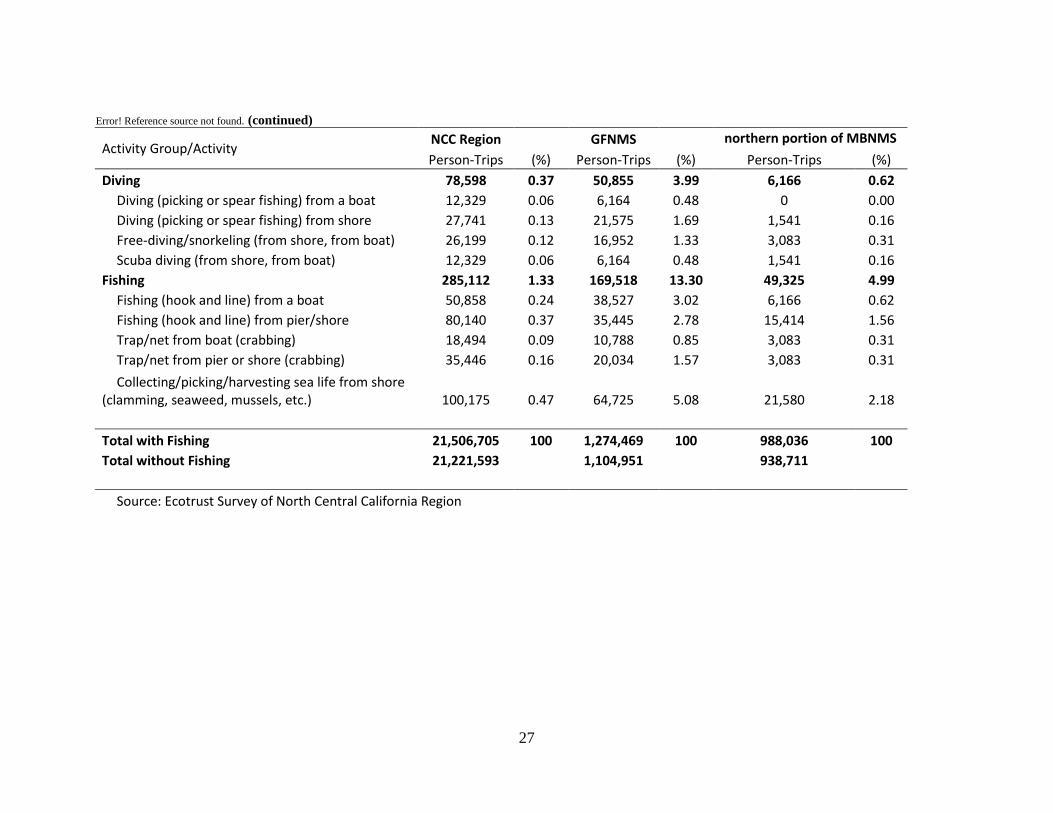
Person-trips
The next table presents information on the activities that respondents engaged in for the
three regions that were analyzed. Table 3.4 below shows the total number of trips
estimated by region for both consumptive and non-consumptive use. For the GFNMS,
we estimated 1,274,469 person-trips, while for the northern portion of MBNMS the
estimate was 988,036 person-trips. The derivation of these estimates is explained in the
Technical Appendix (Leeworthy et al., 2015). Table 3.5 presents the total person-trips
for non-consumptive use only. The total person-trips for non-consumptive use only in
GFNMS are 1,104,951 and the total in the northern portion of MBNMS is 938,711.
Table 3.4 and Table 3.5 also present the percentage of each activity completed on a trip.
The percentages change from Table 3.4 to Table 3.5 as the consumptive activities are
removed.
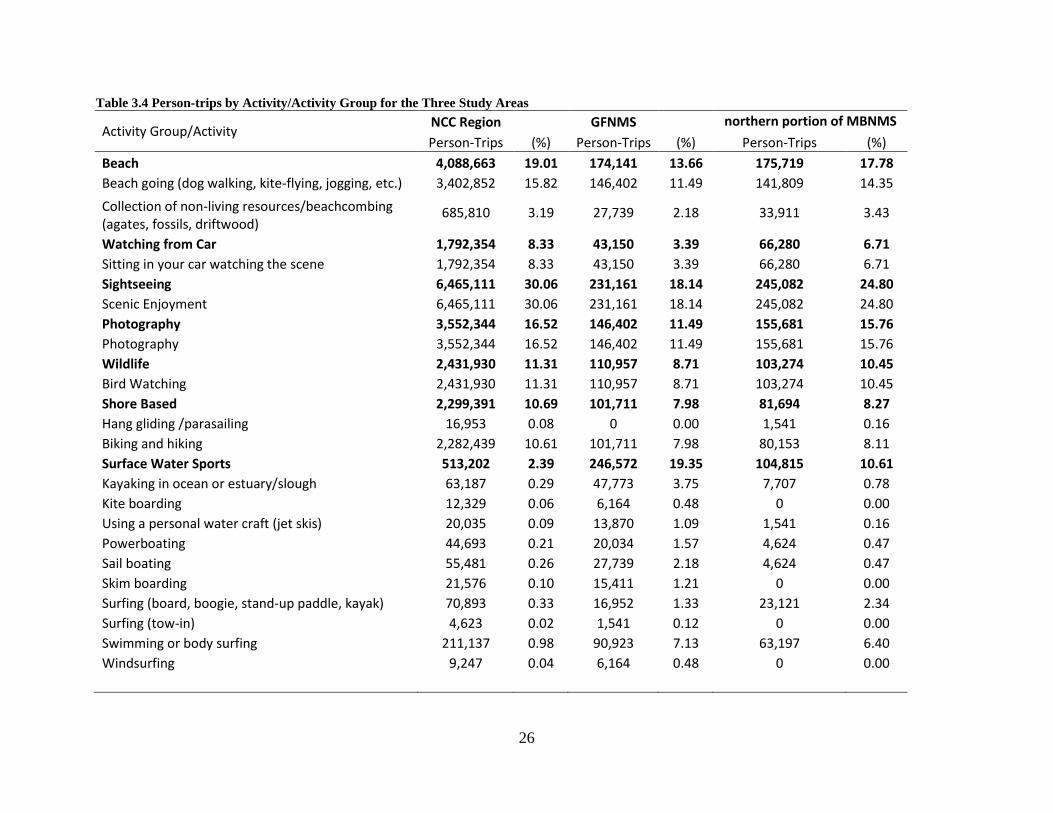
26
Table 3.4 Person-trips by Activity/Activity Group for the Three Study Areas
Activity Group/Activity NCC Region GFNMS northern portion of MBNMS
Person-Trips (%) Person-Trips (%) Person-Trips (%)
Beach 4,088,663 19.01 174,141 13.66 175,719 17.78
Beach going (dog walking, kite-flying, jogging, etc.) 3,402,852 15.82 146,402 11.49 141,809 14.35
Collection of non-living resources/beachcombing (agates, fossils, driftwood)
685,810 3.19 27,739 2.18 33,911 3.43
Watching from Car 1,792,354 8.33 43,150 3.39 66,280 6.71
Sitting in your car watching the scene 1,792,354 8.33 43,150 3.39 66,280 6.71
Sightseeing 6,465,111 30.06 231,161 18.14 245,082 24.80
Scenic Enjoyment 6,465,111 30.06 231,161 18.14 245,082 24.80
Photography 3,552,344 16.52 146,402 11.49 155,681 15.76
Photography 3,552,344 16.52 146,402 11.49 155,681 15.76
Wildlife 2,431,930 11.31 110,957 8.71 103,274 10.45
Bird Watching 2,431,930 11.31 110,957 8.71 103,274 10.45
Shore Based 2,299,391 10.69 101,711 7.98 81,694 8.27
Hang gliding /parasailing 16,953 0.08 0 0.00 1,541 0.16
Biking and hiking 2,282,439 10.61 101,711 7.98 80,153 8.11
Surface Water Sports 513,202 2.39 246,572 19.35 104,815 10.61
Kayaking in ocean or estuary/slough 63,187 0.29 47,773 3.75 7,707 0.78
Kite boarding 12,329 0.06 6,164 0.48 0 0.00
Using a personal water craft (jet skis) 20,035 0.09 13,870 1.09 1,541 0.16
Powerboating 44,693 0.21 20,034 1.57 4,624 0.47
Sail boating 55,481 0.26 27,739 2.18 4,624 0.47
Skim boarding 21,576 0.10 15,411 1.21 0 0.00
Surfing (board, boogie, stand-up paddle, kayak) 70,893 0.33 16,952 1.33 23,121 2.34
Surfing (tow-in) 4,623 0.02 1,541 0.12 0 0.00
Swimming or body surfing 211,137 0.98 90,923 7.13 63,197 6.40
Windsurfing 9,247 0.04 6,164 0.48 0 0.00
27
Error! Reference source not found. (continued)
Activity Group/Activity NCC Region GFNMS northern portion of MBNMS
Person-Trips (%) Person-Trips (%) Person-Trips (%)
Diving 78,598 0.37 50,855 3.99 6,166 0.62
Diving (picking or spear fishing) from a boat 12,329 0.06 6,164 0.48 0 0.00
Diving (picking or spear fishing) from shore 27,741 0.13 21,575 1.69 1,541 0.16
Free-diving/snorkeling (from shore, from boat) 26,199 0.12 16,952 1.33 3,083 0.31
Scuba diving (from shore, from boat) 12,329 0.06 6,164 0.48 1,541 0.16
Fishing 285,112 1.33 169,518 13.30 49,325 4.99
Fishing (hook and line) from a boat 50,858 0.24 38,527 3.02 6,166 0.62
Fishing (hook and line) from pier/shore 80,140 0.37 35,445 2.78 15,414 1.56
Trap/net from boat (crabbing) 18,494 0.09 10,788 0.85 3,083 0.31
Trap/net from pier or shore (crabbing) 35,446 0.16 20,034 1.57 3,083 0.31
Collecting/picking/harvesting sea life from shore (clamming, seaweed, mussels, etc.) 100,175 0.47 64,725 5.08 21,580 2.18
Total with Fishing 21,506,705 100 1,274,469 100 988,036 100
Total without Fishing 21,221,593
1,104,951
938,711
Source: Ecotrust Survey of North Central California Region
28
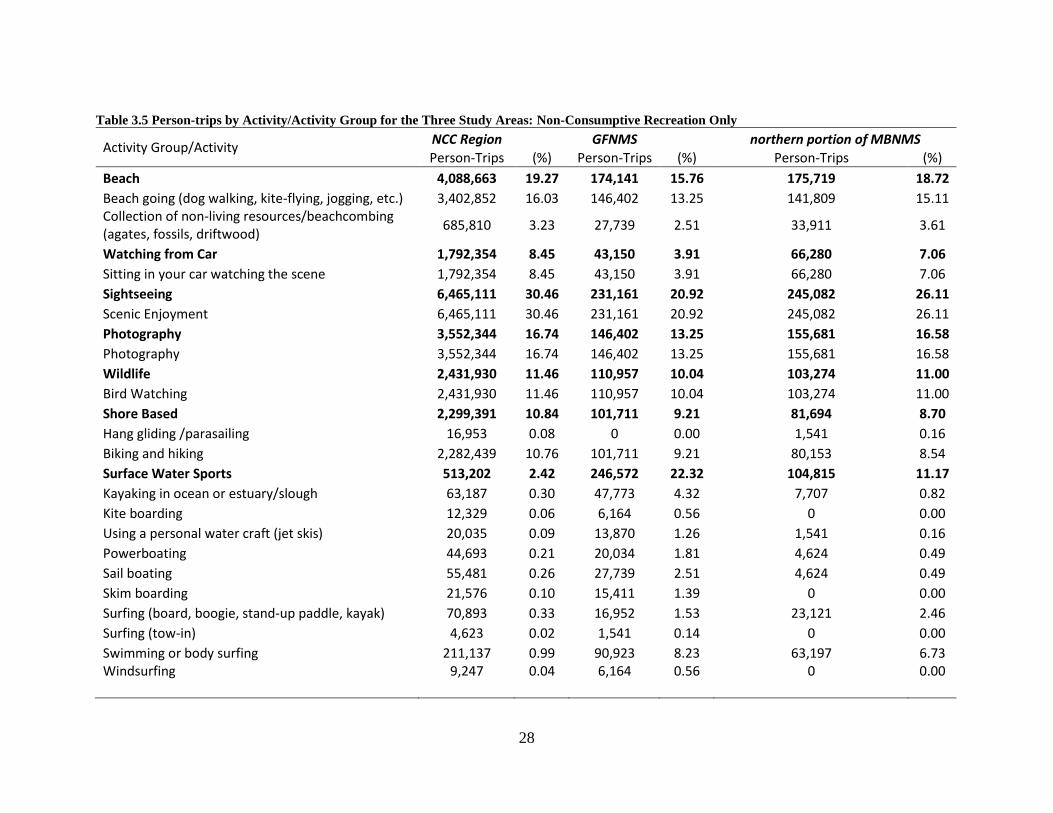
Table 3.5 Person-trips by Activity/Activity Group for the Three Study Areas: Non-Consumptive Recreation Only
Activity Group/Activity NCC Region GFNMS northern portion of MBNMS
Person-Trips (%) Person-Trips (%) Person-Trips (%)
Beach 4,088,663 19.27 174,141 15.76 175,719 18.72
Beach going (dog walking, kite-flying, jogging, etc.) 3,402,852 16.03 146,402 13.25 141,809 15.11 Collection of non-living resources/beachcombing (agates, fossils, driftwood)
685,810 3.23 27,739 2.51 33,911 3.61
Watching from Car 1,792,354 8.45 43,150 3.91 66,280 7.06
Sitting in your car watching the scene 1,792,354 8.45 43,150 3.91 66,280 7.06
Sightseeing 6,465,111 30.46 231,161 20.92 245,082 26.11
Scenic Enjoyment 6,465,111 30.46 231,161 20.92 245,082 26.11
Photography 3,552,344 16.74 146,402 13.25 155,681 16.58
Photography 3,552,344 16.74 146,402 13.25 155,681 16.58
Wildlife 2,431,930 11.46 110,957 10.04 103,274 11.00
Bird Watching 2,431,930 11.46 110,957 10.04 103,274 11.00
Shore Based 2,299,391 10.84 101,711 9.21 81,694 8.70
Hang gliding /parasailing 16,953 0.08 0 0.00 1,541 0.16
Biking and hiking 2,282,439 10.76 101,711 9.21 80,153 8.54
Surface Water Sports 513,202 2.42 246,572 22.32 104,815 11.17
Kayaking in ocean or estuary/slough 63,187 0.30 47,773 4.32 7,707 0.82
Kite boarding 12,329 0.06 6,164 0.56 0 0.00
Using a personal water craft (jet skis) 20,035 0.09 13,870 1.26 1,541 0.16
Powerboating 44,693 0.21 20,034 1.81 4,624 0.49
Sail boating 55,481 0.26 27,739 2.51 4,624 0.49
Skim boarding 21,576 0.10 15,411 1.39 0 0.00
Surfing (board, boogie, stand-up paddle, kayak) 70,893 0.33 16,952 1.53 23,121 2.46
Surfing (tow-in) 4,623 0.02 1,541 0.14 0 0.00
Swimming or body surfing 211,137 0.99 90,923 8.23 63,197 6.73 Windsurfing 9,247 0.04 6,164 0.56 0 0.00
29
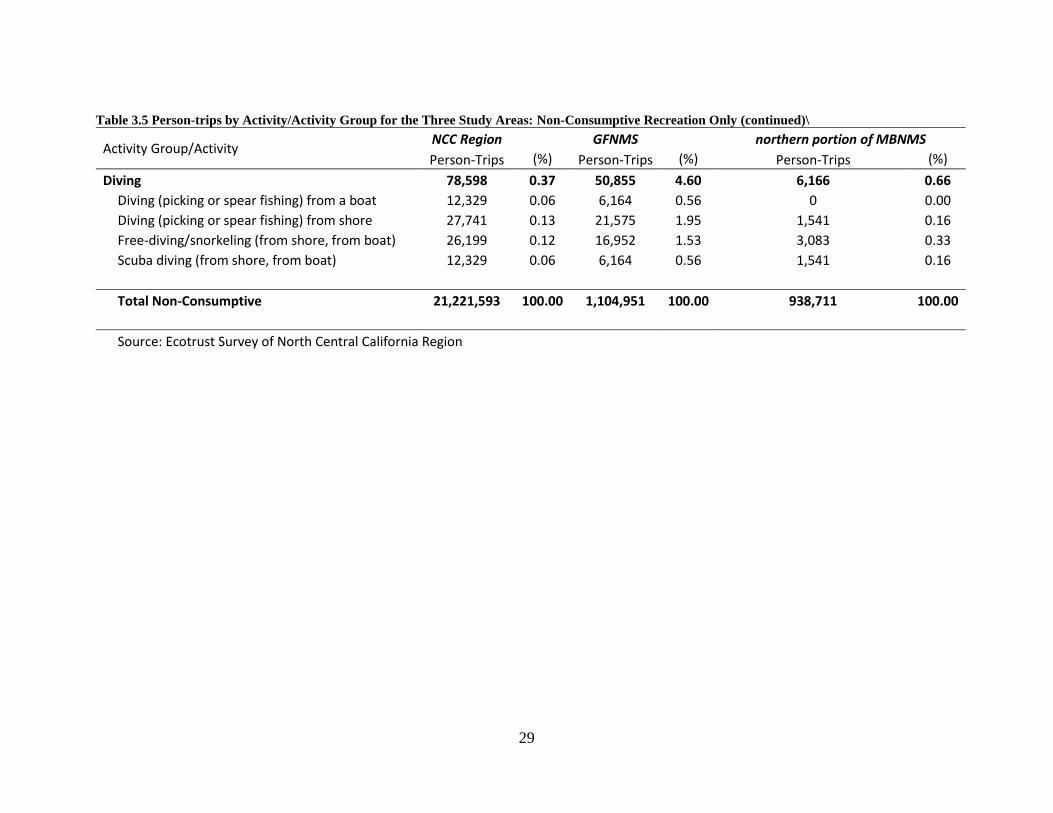
Table 3.5 Person-trips by Activity/Activity Group for the Three Study Areas: Non-Consumptive Recreation Only (continued)\
Activity Group/Activity NCC Region GFNMS northern portion of MBNMS
Person-Trips (%) Person-Trips (%) Person-Trips (%)
Diving 78,598 0.37 50,855 4.60 6,166 0.66
Diving (picking or spear fishing) from a boat 12,329 0.06 6,164 0.56 0 0.00
Diving (picking or spear fishing) from shore 27,741 0.13 21,575 1.95 1,541 0.16
Free-diving/snorkeling (from shore, from boat) 26,199 0.12 16,952 1.53 3,083 0.33
Scuba diving (from shore, from boat) 12,329 0.06 6,164 0.56 1,541 0.16
Total Non-Consumptive 21,221,593 100.00 1,104,951 100.00 938,711 100.00
Source: Ecotrust Survey of North Central California Region
30
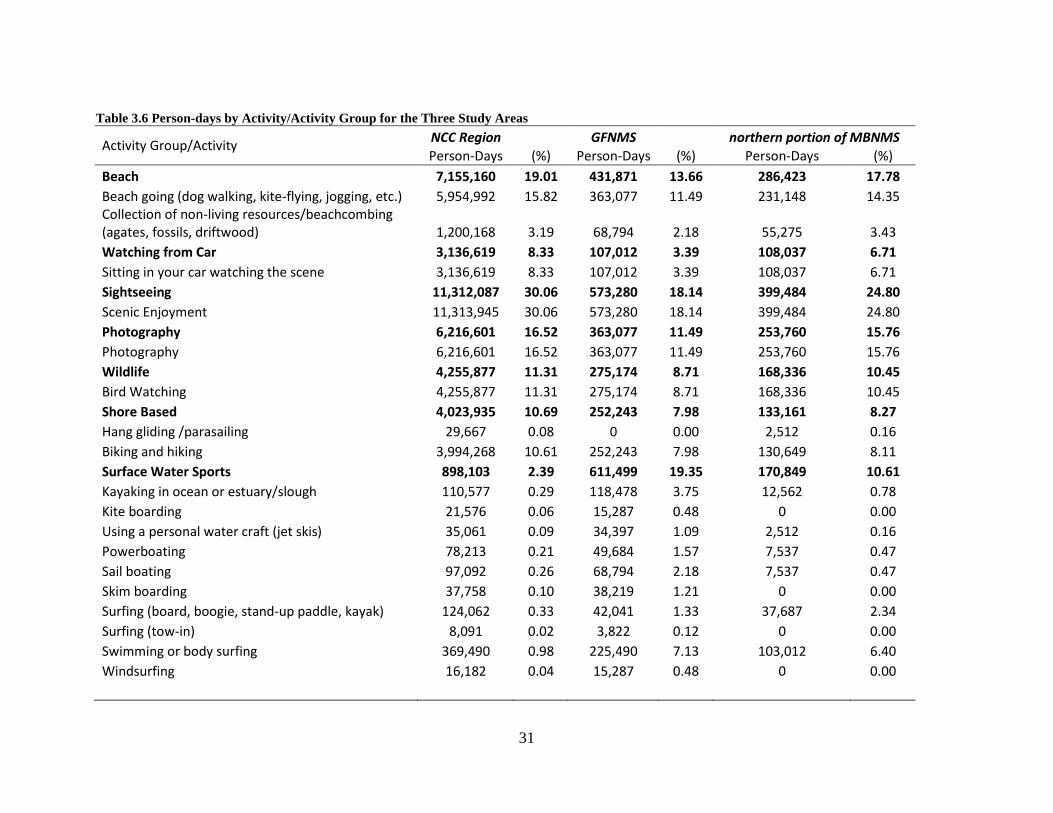
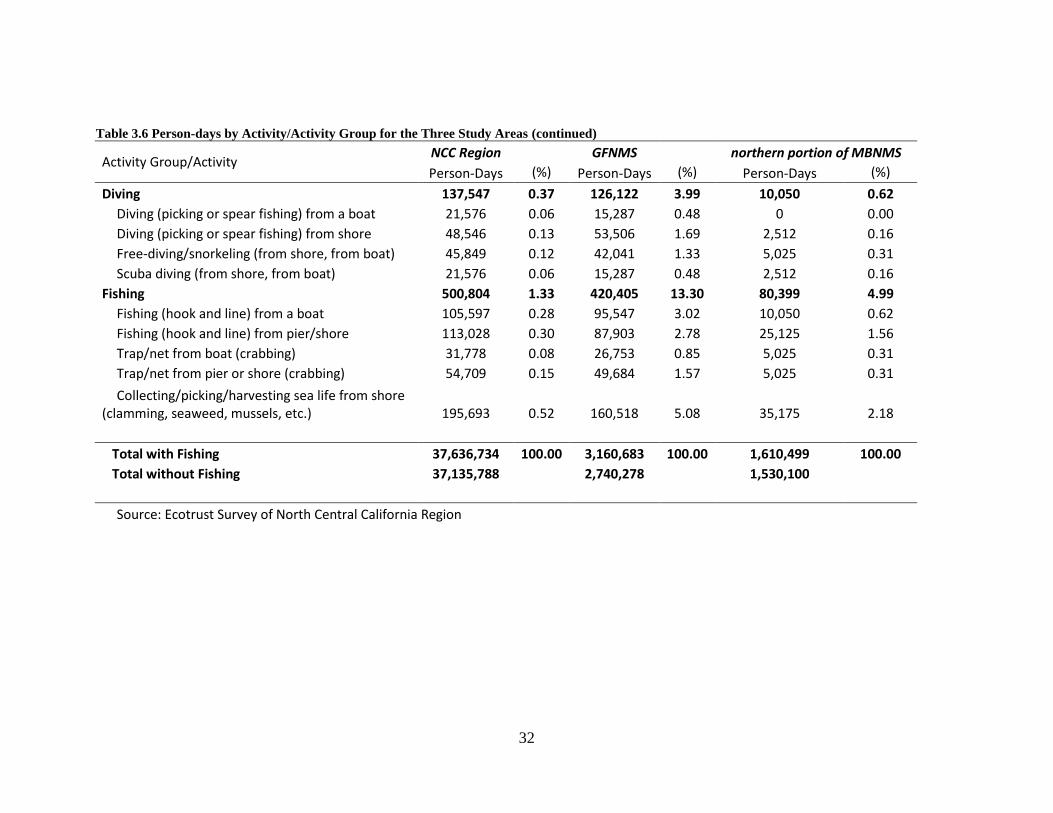
Person-days by Activity and Activity Group
Person-days is a better measure of intensity of use. A person-day is one person doing an
activity for any part of a day or a whole day. Here person-days have been normalized to
equal 100 percent across activities (see Leeworthy et. al 2015 for how this was done) so
adding up person-days across activities will add to the total person-days of annual
recreation in a given area. The results by study area for all activities are summarized in
Table 3.6 for all activities, including fishing, while Table 3.7 summarizes the results for
non-consumptive recreation only.
All Recreation Activities. By activity group, sightseeing was the most popular in the
NCC Region with over 11.3 million person-days (30%). Sightseeing was also the most
popular activity group in the northern portion of MBNMS with 399.5 million person-days
(24.8%), while Surface Water Sports was the most popular activity group in the GFNMS
with 6.11 million person-days (19.35%). Fishing was 13.3% of GFNMS person-days,
while it was only 1.33% for the NCC Region and 4.99% for the northern portion of
MBNMS (Table 3.6).
Non-consumptive Recreation Only. Non-consumptive recreation was 98.67% of all
person-days of recreation in the NCC region followed by 95% in the northern portion of
MBNMS and 86.7% in the GFNMS. Sightseeing accounted for 30.46% of the non-
consumptive recreation in the NCC Region and 26.11% in the northern portion of
MBNMS. Surface Water sports accounted 22.32% of person-days of non-consumptive
recreation activities in the GFNMS (Table 3.7).
31
Table 3.6 Person-days by Activity/Activity Group for the Three Study Areas
Activity Group/Activity NCC Region GFNMS northern portion of MBNMS
Person-Days (%) Person-Days (%) Person-Days (%)
Beach 7,155,160 19.01 431,871 13.66 286,423 17.78
Beach going (dog walking, kite-flying, jogging, etc.) 5,954,992 15.82 363,077 11.49 231,148 14.35 Collection of non-living resources/beachcombing (agates, fossils, driftwood) 1,200,168 3.19 68,794 2.18 55,275 3.43
Watching from Car 3,136,619 8.33 107,012 3.39 108,037 6.71
Sitting in your car watching the scene 3,136,619 8.33 107,012 3.39 108,037 6.71
Sightseeing 11,312,087 30.06 573,280 18.14 399,484 24.80
Scenic Enjoyment 11,313,945 30.06 573,280 18.14 399,484 24.80
Photography 6,216,601 16.52 363,077 11.49 253,760 15.76
Photography 6,216,601 16.52 363,077 11.49 253,760 15.76
Wildlife 4,255,877 11.31 275,174 8.71 168,336 10.45
Bird Watching 4,255,877 11.31 275,174 8.71 168,336 10.45
Shore Based 4,023,935 10.69 252,243 7.98 133,161 8.27
Hang gliding /parasailing 29,667 0.08 0 0.00 2,512 0.16
Biking and hiking 3,994,268 10.61 252,243 7.98 130,649 8.11
Surface Water Sports 898,103 2.39 611,499 19.35 170,849 10.61
Kayaking in ocean or estuary/slough 110,577 0.29 118,478 3.75 12,562 0.78
Kite boarding 21,576 0.06 15,287 0.48 0 0.00
Using a personal water craft (jet skis) 35,061 0.09 34,397 1.09 2,512 0.16
Powerboating 78,213 0.21 49,684 1.57 7,537 0.47
Sail boating 97,092 0.26 68,794 2.18 7,537 0.47
Skim boarding 37,758 0.10 38,219 1.21 0 0.00
Surfing (board, boogie, stand-up paddle, kayak) 124,062 0.33 42,041 1.33 37,687 2.34
Surfing (tow-in) 8,091 0.02 3,822 0.12 0 0.00
Swimming or body surfing 369,490 0.98 225,490 7.13 103,012 6.40
Windsurfing 16,182 0.04 15,287 0.48 0 0.00
32
Table 3.6 Person-days by Activity/Activity Group for the Three Study Areas (continued)
Activity Group/Activity NCC Region GFNMS northern portion of MBNMS
Person-Days (%) Person-Days (%) Person-Days (%)
Diving 137,547 0.37 126,122 3.99 10,050 0.62
Diving (picking or spear fishing) from a boat 21,576 0.06 15,287 0.48 0 0.00
Diving (picking or spear fishing) from shore 48,546 0.13 53,506 1.69 2,512 0.16
Free-diving/snorkeling (from shore, from boat) 45,849 0.12 42,041 1.33 5,025 0.31
Scuba diving (from shore, from boat) 21,576 0.06 15,287 0.48 2,512 0.16
Fishing 500,804 1.33 420,405 13.30 80,399 4.99
Fishing (hook and line) from a boat 105,597 0.28 95,547 3.02 10,050 0.62
Fishing (hook and line) from pier/shore 113,028 0.30 87,903 2.78 25,125 1.56
Trap/net from boat (crabbing) 31,778 0.08 26,753 0.85 5,025 0.31
Trap/net from pier or shore (crabbing) 54,709 0.15 49,684 1.57 5,025 0.31
Collecting/picking/harvesting sea life from shore (clamming, seaweed, mussels, etc.) 195,693 0.52 160,518 5.08 35,175 2.18
Total with Fishing 37,636,734 100.00 3,160,683 100.00 1,610,499 100.00
Total without Fishing 37,135,788
2,740,278
1,530,100
Source: Ecotrust Survey of North Central California Region
33
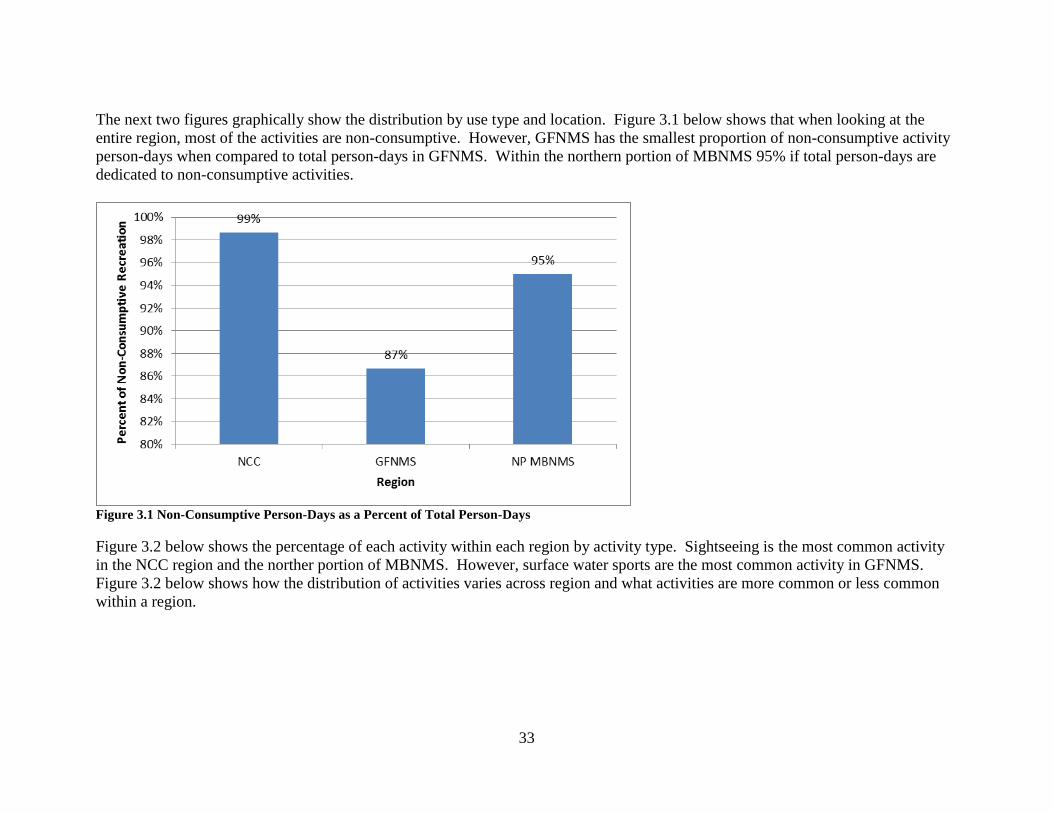
The next two figures graphically show the distribution by use type and location. Figure 3.1 below shows that when looking at the
entire region, most of the activities are non-consumptive. However, GFNMS has the smallest proportion of non-consumptive activity
person-days when compared to total person-days in GFNMS. Within the northern portion of MBNMS 95% if total person-days are
dedicated to non-consumptive activities.
Figure 3.1 Non-Consumptive Person-Days as a Percent of Total Person-Days
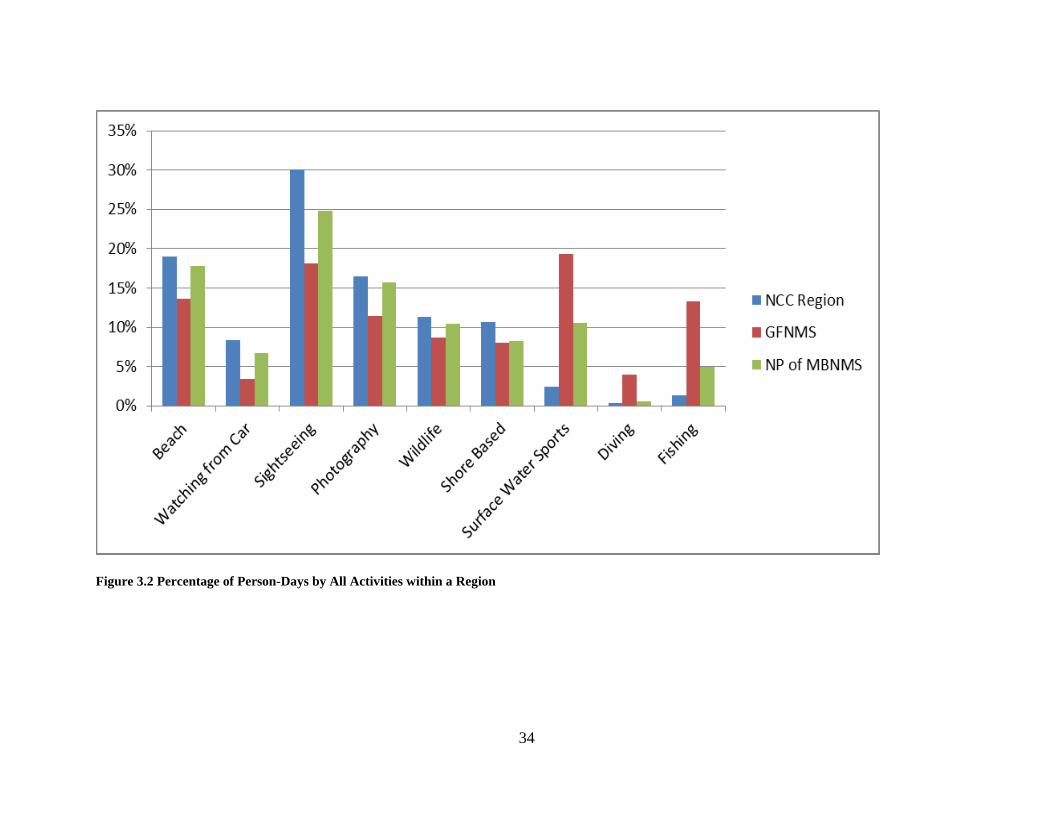
Figure 3.2 below shows the percentage of each activity within each region by activity type. Sightseeing is the most common activity
in the NCC region and the norther portion of MBNMS. However, surface water sports are the most common activity in GFNMS.
Figure 3.2 below shows how the distribution of activities varies across region and what activities are more common or less common
within a region.
34
Figure 3.2 Percentage of Person-Days by All Activities within a Region
35
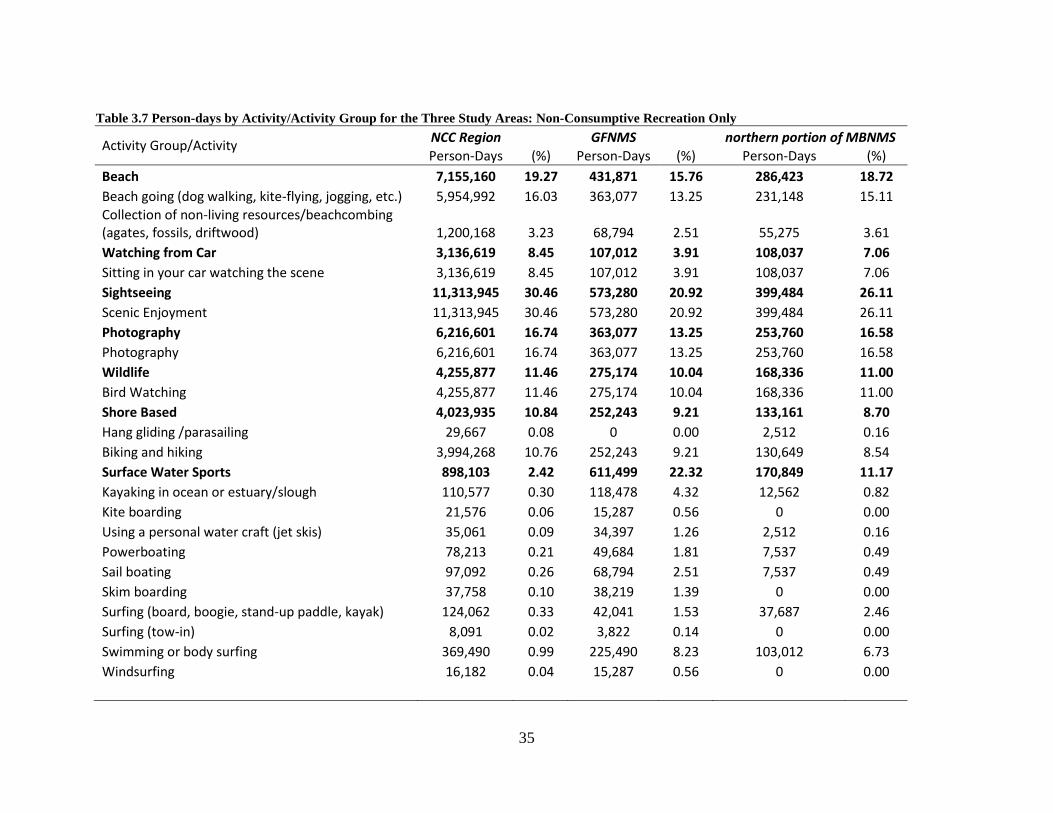
Table 3.7 Person-days by Activity/Activity Group for the Three Study Areas: Non-Consumptive Recreation Only
Activity Group/Activity NCC Region GFNMS northern portion of MBNMS
Person-Days (%) Person-Days (%) Person-Days (%)
Beach 7,155,160 19.27 431,871 15.76 286,423 18.72
Beach going (dog walking, kite-flying, jogging, etc.) 5,954,992 16.03 363,077 13.25 231,148 15.11 Collection of non-living resources/beachcombing (agates, fossils, driftwood) 1,200,168 3.23 68,794 2.51 55,275 3.61
Watching from Car 3,136,619 8.45 107,012 3.91 108,037 7.06
Sitting in your car watching the scene 3,136,619 8.45 107,012 3.91 108,037 7.06
Sightseeing 11,313,945 30.46 573,280 20.92 399,484 26.11
Scenic Enjoyment 11,313,945 30.46 573,280 20.92 399,484 26.11
Photography 6,216,601 16.74 363,077 13.25 253,760 16.58
Photography 6,216,601 16.74 363,077 13.25 253,760 16.58
Wildlife 4,255,877 11.46 275,174 10.04 168,336 11.00
Bird Watching 4,255,877 11.46 275,174 10.04 168,336 11.00
Shore Based 4,023,935 10.84 252,243 9.21 133,161 8.70
Hang gliding /parasailing 29,667 0.08 0 0.00 2,512 0.16
Biking and hiking 3,994,268 10.76 252,243 9.21 130,649 8.54
Surface Water Sports 898,103 2.42 611,499 22.32 170,849 11.17
Kayaking in ocean or estuary/slough 110,577 0.30 118,478 4.32 12,562 0.82
Kite boarding 21,576 0.06 15,287 0.56 0 0.00
Using a personal water craft (jet skis) 35,061 0.09 34,397 1.26 2,512 0.16
Powerboating 78,213 0.21 49,684 1.81 7,537 0.49
Sail boating 97,092 0.26 68,794 2.51 7,537 0.49
Skim boarding 37,758 0.10 38,219 1.39 0 0.00
Surfing (board, boogie, stand-up paddle, kayak) 124,062 0.33 42,041 1.53 37,687 2.46
Surfing (tow-in) 8,091 0.02 3,822 0.14 0 0.00
Swimming or body surfing 369,490 0.99 225,490 8.23 103,012 6.73
Windsurfing 16,182 0.04 15,287 0.56 0 0.00
36
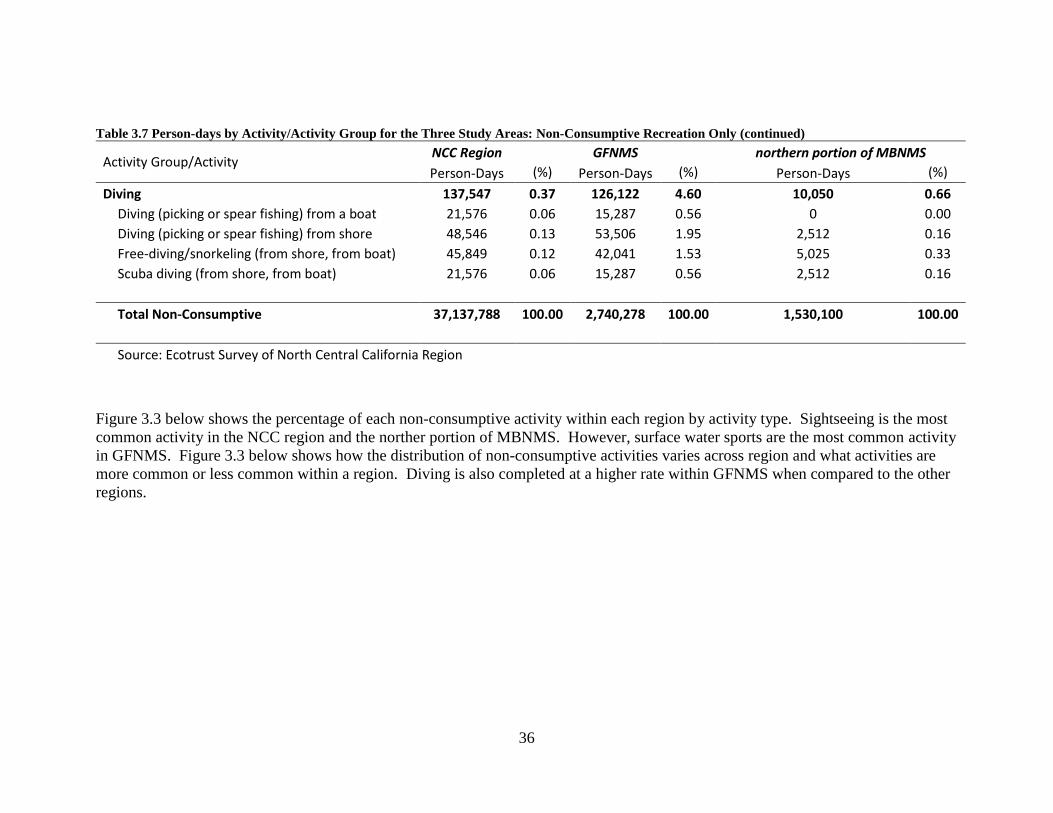
Table 3.7 Person-days by Activity/Activity Group for the Three Study Areas: Non-Consumptive Recreation Only (continued)
Activity Group/Activity NCC Region GFNMS northern portion of MBNMS
Person-Days (%) Person-Days (%) Person-Days (%)
Diving 137,547 0.37 126,122 4.60 10,050 0.66
Diving (picking or spear fishing) from a boat 21,576 0.06 15,287 0.56 0 0.00
Diving (picking or spear fishing) from shore 48,546 0.13 53,506 1.95 2,512 0.16
Free-diving/snorkeling (from shore, from boat) 45,849 0.12 42,041 1.53 5,025 0.33
Scuba diving (from shore, from boat) 21,576 0.06 15,287 0.56 2,512 0.16
Total Non-Consumptive 37,137,788 100.00 2,740,278 100.00 1,530,100 100.00
Source: Ecotrust Survey of North Central California Region
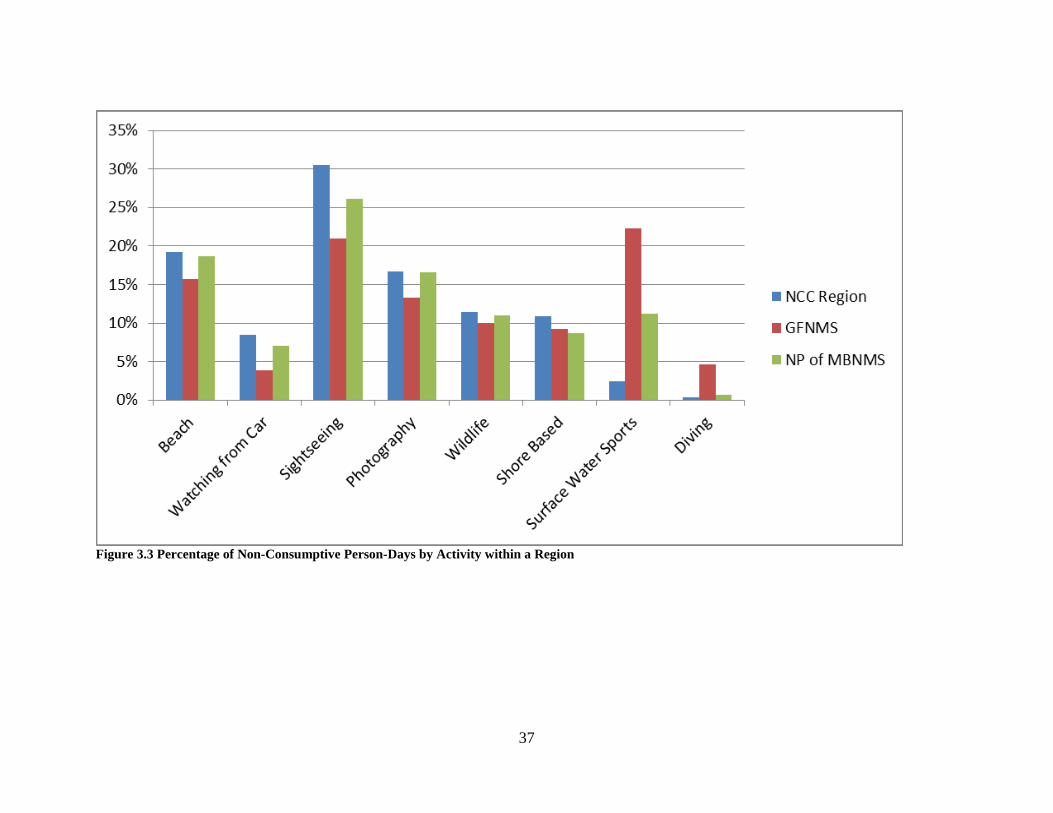
Figure 3.3 below shows the percentage of each non-consumptive activity within each region by activity type. Sightseeing is the most
common activity in the NCC region and the norther portion of MBNMS. However, surface water sports are the most common activity
in GFNMS. Figure 3.3 below shows how the distribution of non-consumptive activities varies across region and what activities are
more common or less common within a region. Diving is also completed at a higher rate within GFNMS when compared to the other
regions.
37
Figure 3.3 Percentage of Non-Consumptive Person-Days by Activity within a Region
38
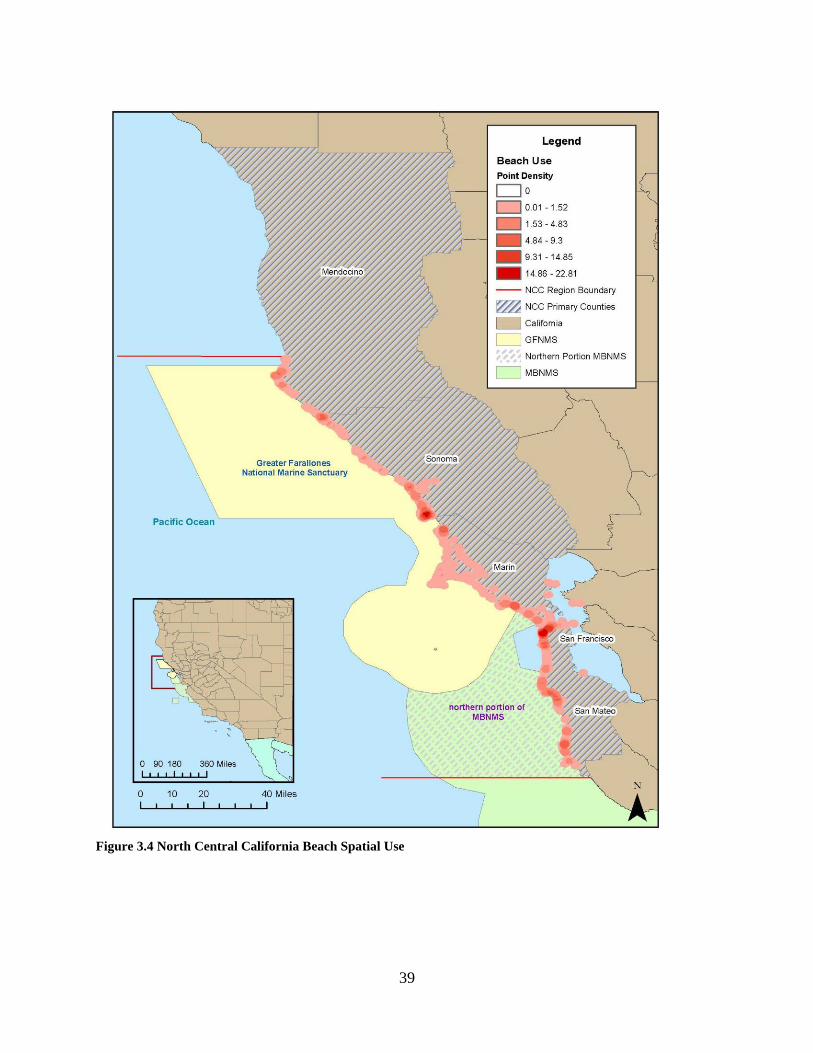
North Central California Spatial Use Maps by Activity Groups
The next set of figures presents heat maps of spatial use by activity or activity group in the North
Central California region. The heat maps are based on the spatial location of each of the sampled
respondents’ reported activities. The darker the red coloring on the map, the higher the reported
level of activity use was in that area by the sampled respondents. Although the heat maps are
based on the sample and not the population, the heat map is representative of the more intensely
used areas by the population.
39
Figure 3.4 North Central California Beach Spatial Use
40
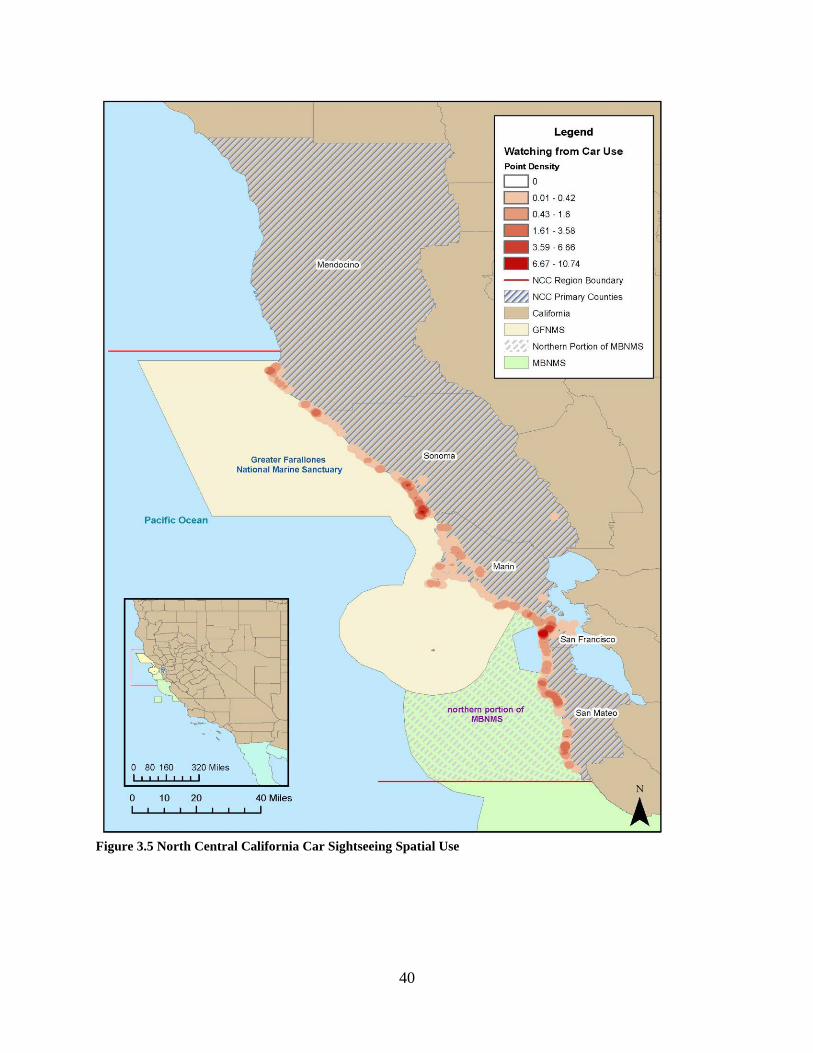
Figure 3.5 North Central California Car Sightseeing Spatial Use
41
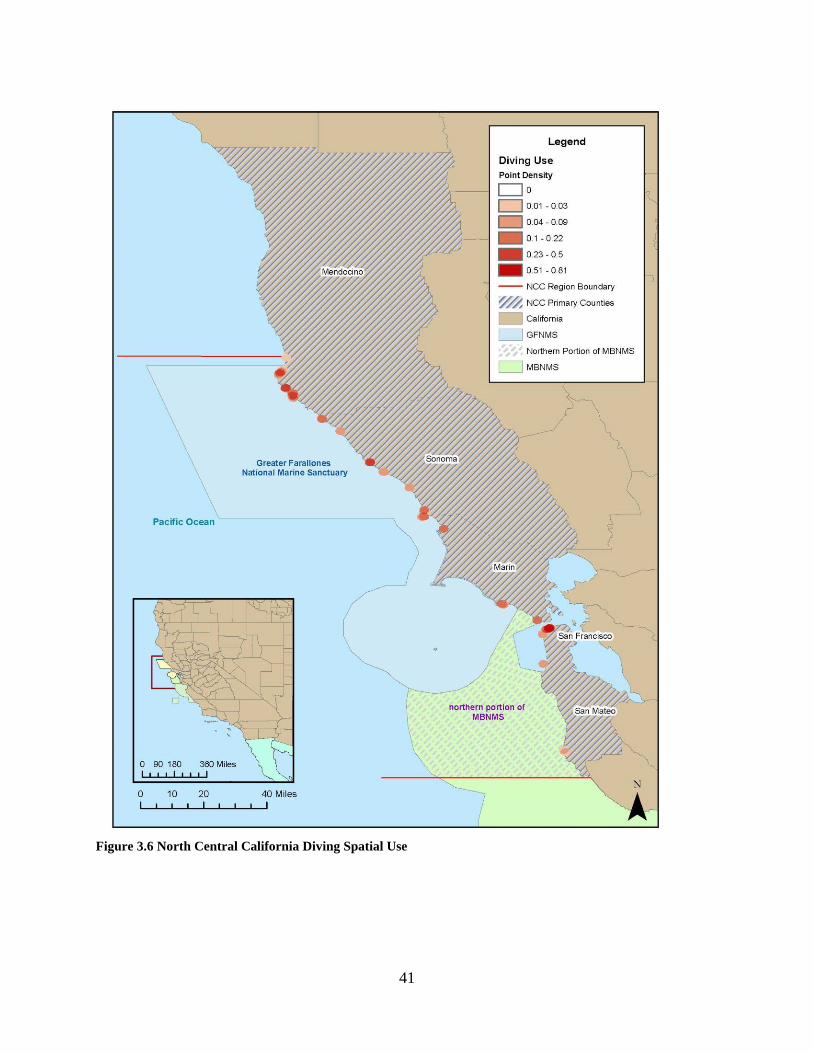
Figure 3.6 North Central California Diving Spatial Use
42
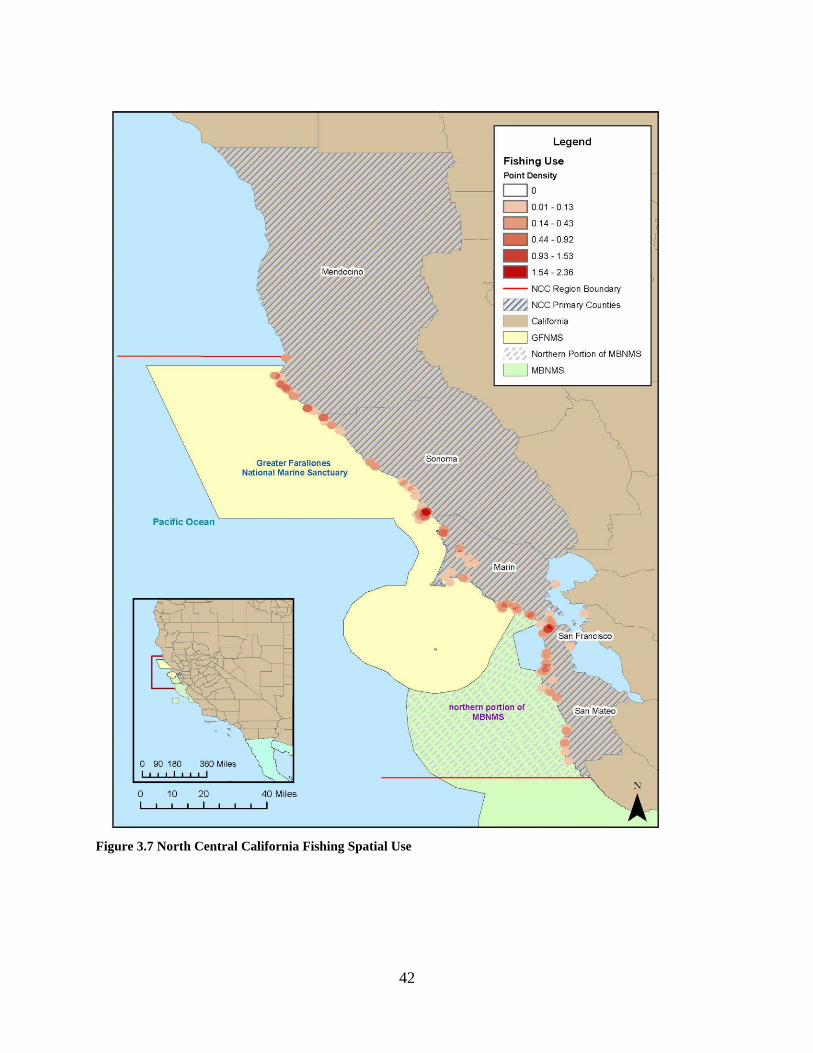
Figure 3.7 North Central California Fishing Spatial Use
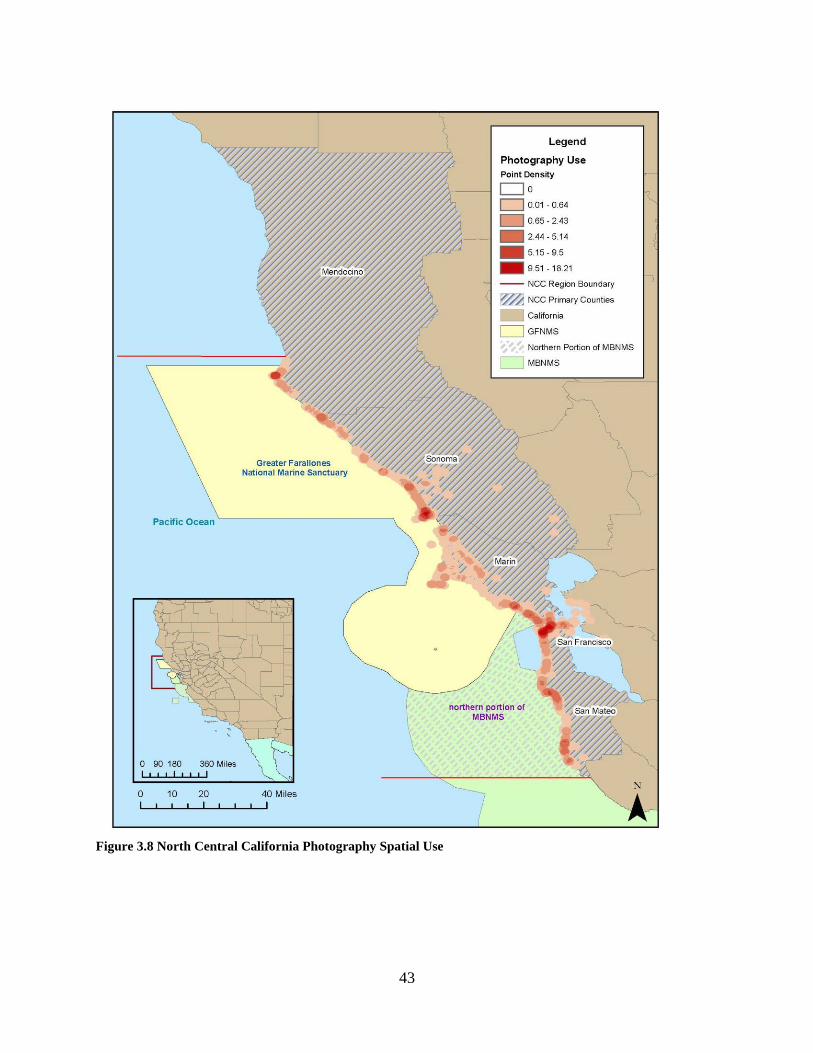
43
Figure 3.8 North Central California Photography Spatial Use

44
Figure 3.9 North Central California Shore Based Activities Spatial Use
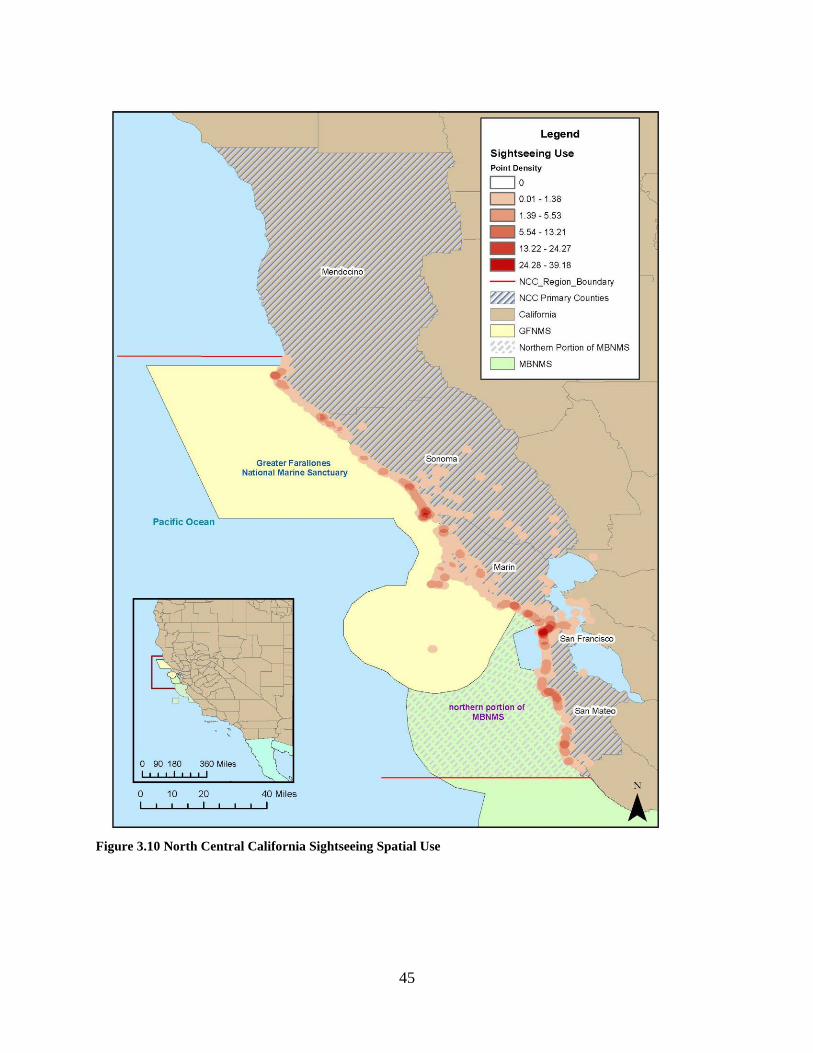
45
Figure 3.10 North Central California Sightseeing Spatial Use

46
Figure 3.11 North Central California Surface Water Sports Activities Spatial Use

47
Figure 3.12 North Central California Wildlife Viewing Spatial Use
48
4. Recreation Expenditure Profiles
As a follow-up to Chen et al (2013), we estimated the total expenditures and expenditures per
person-day for “All Visitors” for all activities to the NCC Region and total expenditures and
expenditures per person-day for those doing non-consumptive recreation for the NCC Region,
GFNMS and the northern portion of MBNMS. Greater details on how these estimates were
derived can be found in Leeworthy et al 2015.
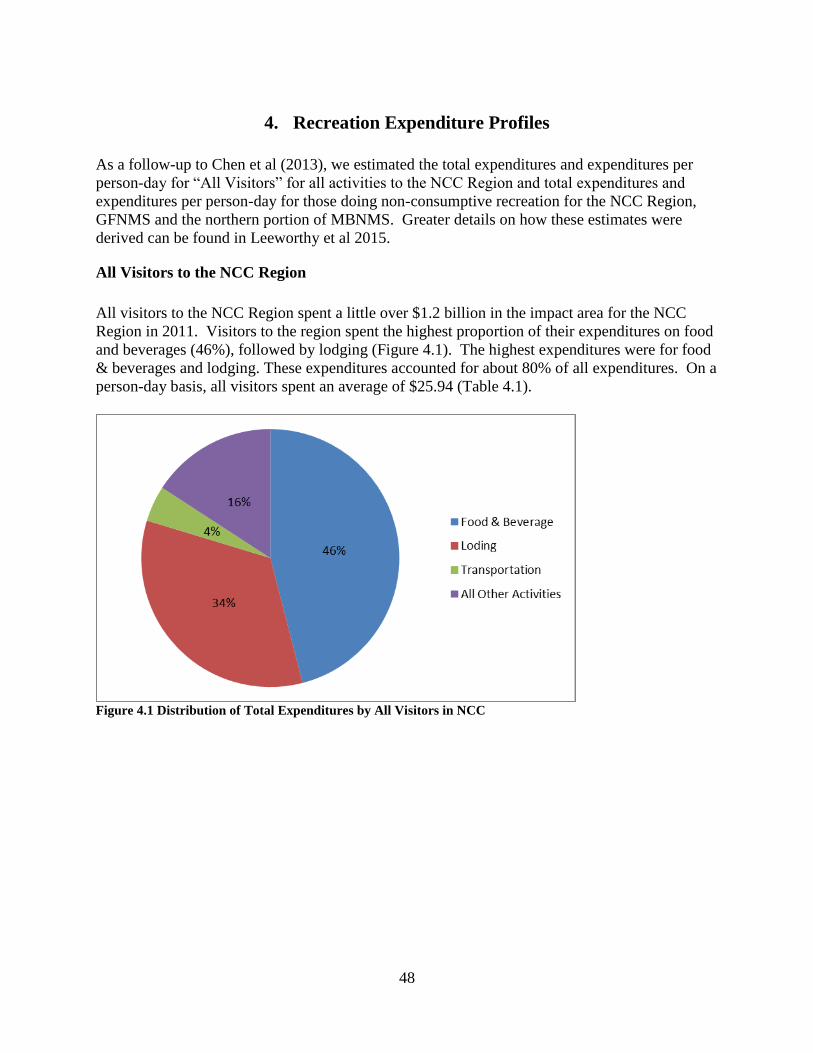
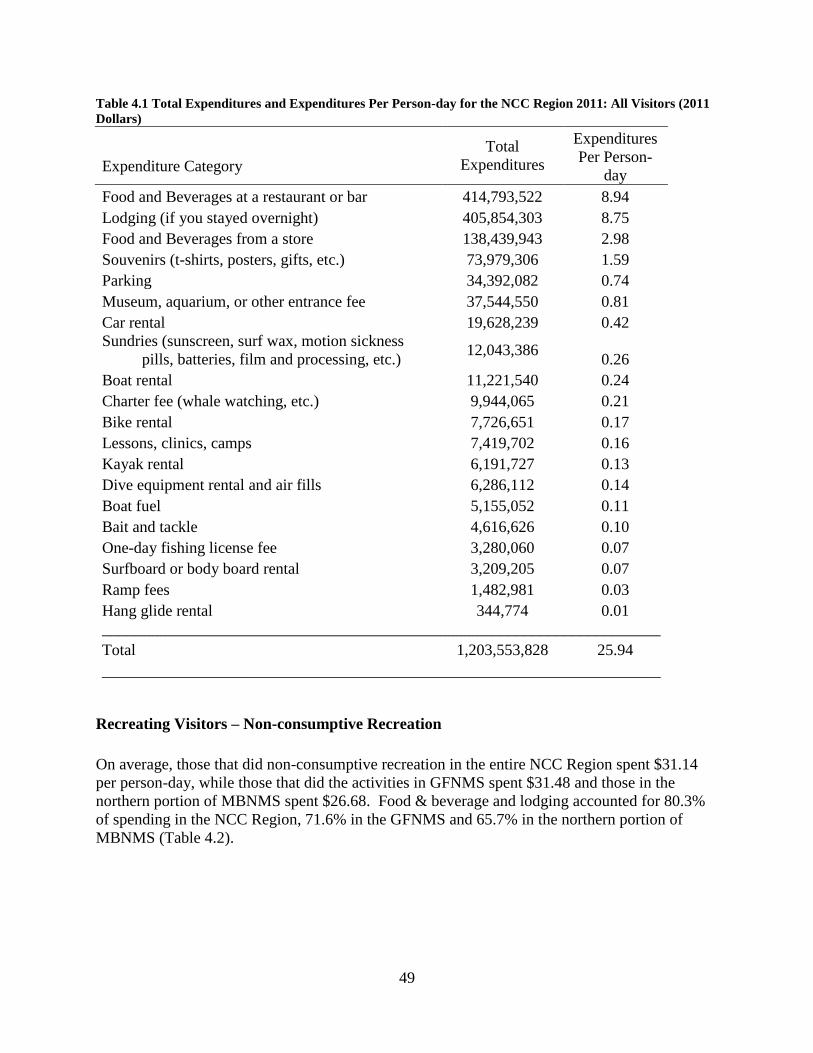
All Visitors to the NCC Region
All visitors to the NCC Region spent a little over $1.2 billion in the impact area for the NCC
Region in 2011. Visitors to the region spent the highest proportion of their expenditures on food
and beverages (46%), followed by lodging (Figure 4.1). The highest expenditures were for food
& beverages and lodging. These expenditures accounted for about 80% of all expenditures. On a
person-day basis, all visitors spent an average of $25.94 (Table 4.1).
Figure 4.1 Distribution of Total Expenditures by All Visitors in NCC
49
Table 4.1 Total Expenditures and Expenditures Per Person-day for the NCC Region 2011: All Visitors (2011
Dollars)
Total
Expenditures
Expenditures
Expenditure Category Per Person-
day
Food and Beverages at a restaurant or bar 414,793,522 8.94
Lodging (if you stayed overnight) 405,854,303 8.75
Food and Beverages from a store 138,439,943 2.98
Souvenirs (t-shirts, posters, gifts, etc.) 73,979,306 1.59
Parking 34,392,082 0.74
Museum, aquarium, or other entrance fee 37,544,550 0.81
Car rental 19,628,239 0.42
Sundries (sunscreen, surf wax, motion sickness
pills, batteries, film and processing, etc.) 12,043,386
0.26
Boat rental 11,221,540 0.24
Charter fee (whale watching, etc.) 9,944,065 0.21
Bike rental 7,726,651 0.17
Lessons, clinics, camps 7,419,702 0.16
Kayak rental 6,191,727 0.13
Dive equipment rental and air fills 6,286,112 0.14
Boat fuel 5,155,052 0.11
Bait and tackle 4,616,626 0.10
One-day fishing license fee 3,280,060 0.07
Surfboard or body board rental 3,209,205 0.07
Ramp fees 1,482,981 0.03
Hang glide rental 344,774 0.01
______________________________________________________________________
Total 1,203,553,828 25.94
______________________________________________________________________
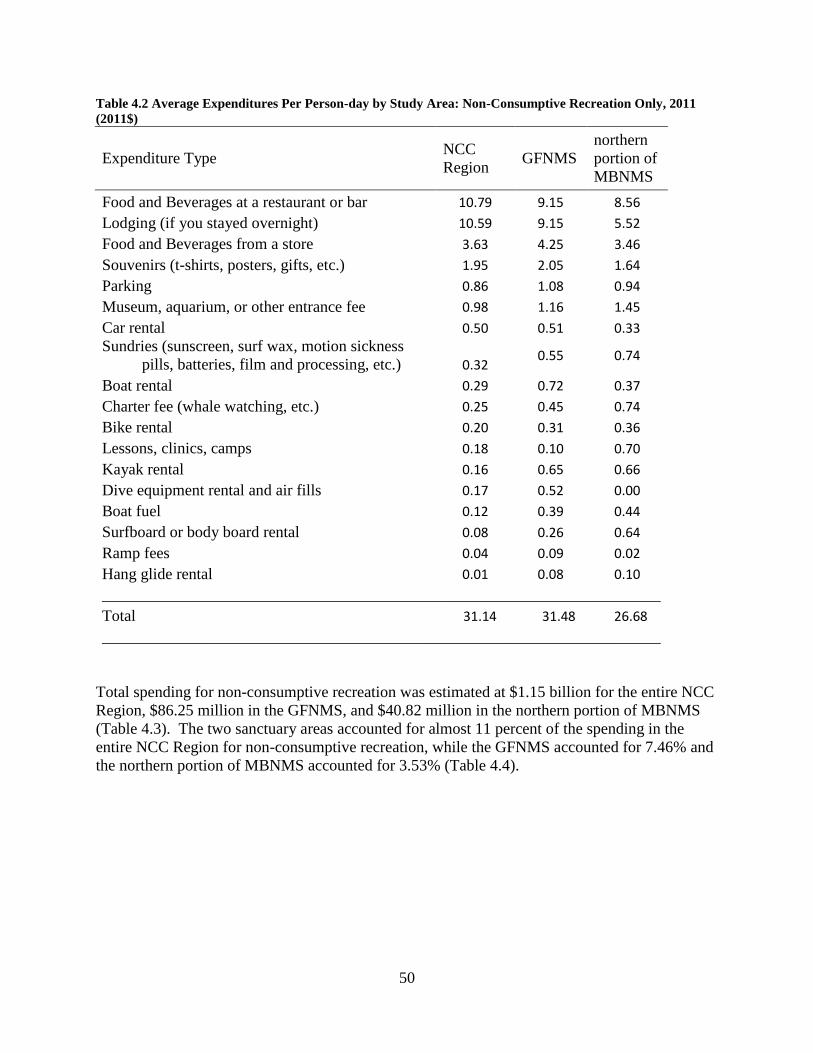
Recreating Visitors – Non-consumptive Recreation
On average, those that did non-consumptive recreation in the entire NCC Region spent $31.14
per person-day, while those that did the activities in GFNMS spent $31.48 and those in the
northern portion of MBNMS spent $26.68. Food & beverage and lodging accounted for 80.3%
of spending in the NCC Region, 71.6% in the GFNMS and 65.7% in the northern portion of
MBNMS (Table 4.2).
50
Table 4.2 Average Expenditures Per Person-day by Study Area: Non-Consumptive Recreation Only, 2011
(2011$)
Expenditure Type NCC
Region GFNMS
northern
portion of
MBNMS
Food and Beverages at a restaurant or bar 10.79 9.15 8.56
Lodging (if you stayed overnight) 10.59 9.15 5.52
Food and Beverages from a store 3.63 4.25 3.46
Souvenirs (t-shirts, posters, gifts, etc.) 1.95 2.05 1.64
Parking 0.86 1.08 0.94
Museum, aquarium, or other entrance fee 0.98 1.16 1.45
Car rental 0.50 0.51 0.33
Sundries (sunscreen, surf wax, motion sickness
pills, batteries, film and processing, etc.) 0.32 0.55 0.74
Boat rental 0.29 0.72 0.37
Charter fee (whale watching, etc.) 0.25 0.45 0.74
Bike rental 0.20 0.31 0.36
Lessons, clinics, camps 0.18 0.10 0.70
Kayak rental 0.16 0.65 0.66
Dive equipment rental and air fills 0.17 0.52 0.00
Boat fuel 0.12 0.39 0.44
Surfboard or body board rental 0.08 0.26 0.64
Ramp fees 0.04 0.09 0.02
Hang glide rental 0.01 0.08 0.10
______________________________________________________________________
Total 31.14 31.48 26.68
______________________________________________________________________
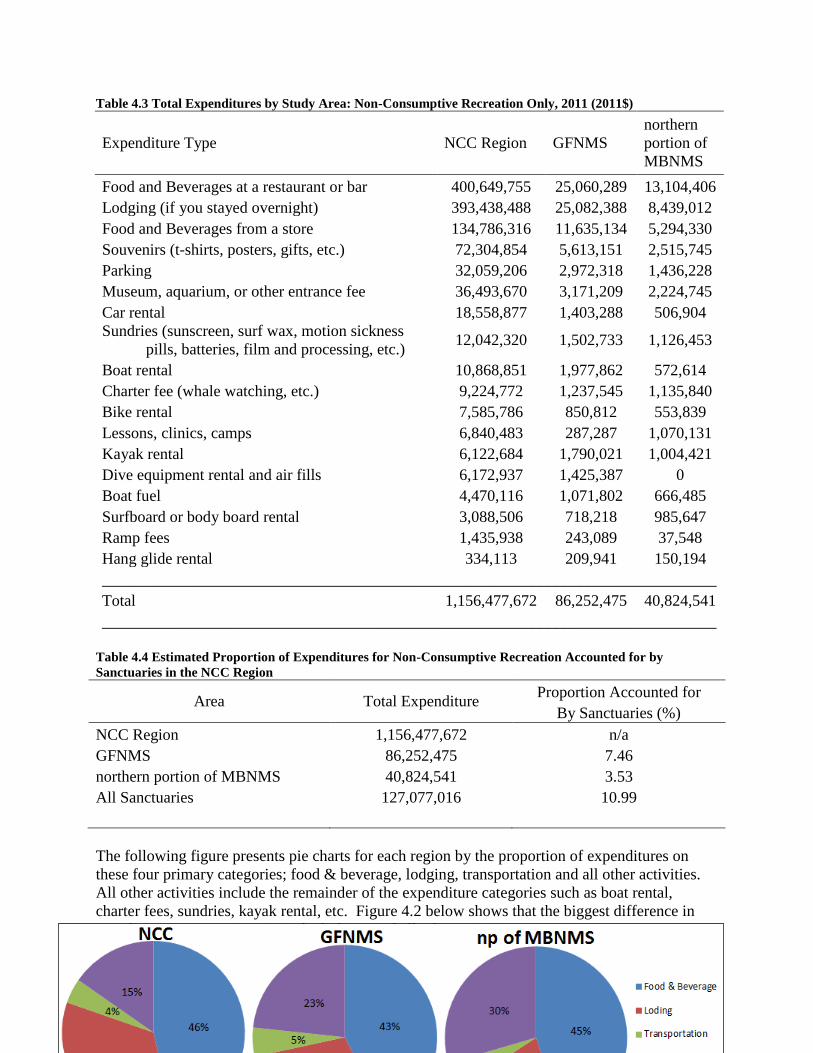
Total spending for non-consumptive recreation was estimated at $1.15 billion for the entire NCC
Region, $86.25 million in the GFNMS, and $40.82 million in the northern portion of MBNMS
(Table 4.3). The two sanctuary areas accounted for almost 11 percent of the spending in the
entire NCC Region for non-consumptive recreation, while the GFNMS accounted for 7.46% and
the northern portion of MBNMS accounted for 3.53% (Table 4.4).
51
Table 4.3 Total Expenditures by Study Area: Non-Consumptive Recreation Only, 2011 (2011$)
Expenditure Type NCC Region GFNMS
northern
portion of
MBNMS
Food and Beverages at a restaurant or bar 400,649,755 25,060,289 13,104,406
Lodging (if you stayed overnight) 393,438,488 25,082,388 8,439,012
Food and Beverages from a store 134,786,316 11,635,134 5,294,330
Souvenirs (t-shirts, posters, gifts, etc.) 72,304,854 5,613,151 2,515,745
Parking 32,059,206 2,972,318 1,436,228
Museum, aquarium, or other entrance fee 36,493,670 3,171,209 2,224,745
Car rental 18,558,877 1,403,288 506,904
Sundries (sunscreen, surf wax, motion sickness
pills, batteries, film and processing, etc.) 12,042,320 1,502,733 1,126,453
Boat rental 10,868,851 1,977,862 572,614
Charter fee (whale watching, etc.) 9,224,772 1,237,545 1,135,840
Bike rental 7,585,786 850,812 553,839
Lessons, clinics, camps 6,840,483 287,287 1,070,131
Kayak rental 6,122,684 1,790,021 1,004,421
Dive equipment rental and air fills 6,172,937 1,425,387 0
Boat fuel 4,470,116 1,071,802 666,485
Surfboard or body board rental 3,088,506 718,218 985,647
Ramp fees 1,435,938 243,089 37,548
Hang glide rental 334,113 209,941 150,194
_____________________________________________________________________________
Total 1,156,477,672 86,252,475 40,824,541
_____________________________________________________________________________
Table 4.4 Estimated Proportion of Expenditures for Non-Consumptive Recreation Accounted for by
Sanctuaries in the NCC Region
Area Total Expenditure Proportion Accounted for
By Sanctuaries (%)
NCC Region 1,156,477,672 n/a
GFNMS 86,252,475 7.46
northern portion of MBNMS 40,824,541 3.53
All Sanctuaries 127,077,016 10.99
The following figure presents pie charts for each region by the proportion of expenditures on
these four primary categories; food & beverage, lodging, transportation and all other activities.
All other activities include the remainder of the expenditure categories such as boat rental,
charter fees, sundries, kayak rental, etc. Figure 4.2 below shows that the biggest difference in
spending amongst regions is in the lodging and all other activities categories.
52
Figure 4.2 Distribution of Non-Consumptive Expenditures by Region
53
5. Economic Impact/Contribution to the Local Economy
The Study Areas for Economic Impact
To estimate the economic impacts of recreational activities for the NCC Region and within
GFNMS and the northern portion of MBNMS the study area must be identified and defined.
Though the multiplier process, theoretically one could include all areas in the chain of producing
goods and services used. This could even include other countries, i.e. a rod or reel or outboard
motor could have been produced outside the country. In Chapter 1, we defined the study areas
for economic impact for each sanctuary limiting our impact areas to more local area counties that
capture the majority of the local economic impact.
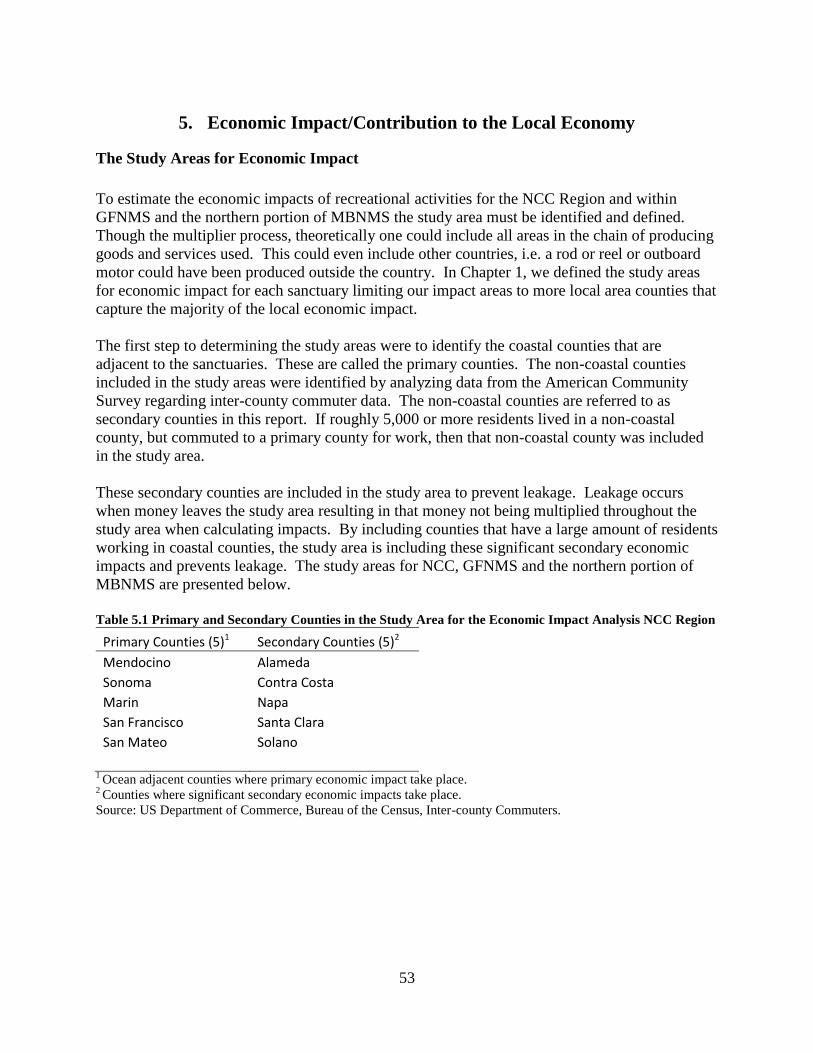
The first step to determining the study areas were to identify the coastal counties that are
adjacent to the sanctuaries. These are called the primary counties. The non-coastal counties
included in the study areas were identified by analyzing data from the American Community
Survey regarding inter-county commuter data. The non-coastal counties are referred to as
secondary counties in this report. If roughly 5,000 or more residents lived in a non-coastal
county, but commuted to a primary county for work, then that non-coastal county was included
in the study area.
These secondary counties are included in the study area to prevent leakage. Leakage occurs
when money leaves the study area resulting in that money not being multiplied throughout the
study area when calculating impacts. By including counties that have a large amount of residents
working in coastal counties, the study area is including these significant secondary economic
impacts and prevents leakage. The study areas for NCC, GFNMS and the northern portion of
MBNMS are presented below.
Table 5.1 Primary and Secondary Counties in the Study Area for the Economic Impact Analysis NCC Region
Primary Counties (5)1 Secondary Counties (5)2
Mendocino Alameda
Sonoma Contra Costa
Marin Napa
San Francisco Santa Clara
San Mateo Solano
1 Ocean adjacent counties where primary economic impact take place.
2 Counties where significant secondary economic impacts take place.
Source: US Department of Commerce, Bureau of the Census, Inter-county Commuters.
54
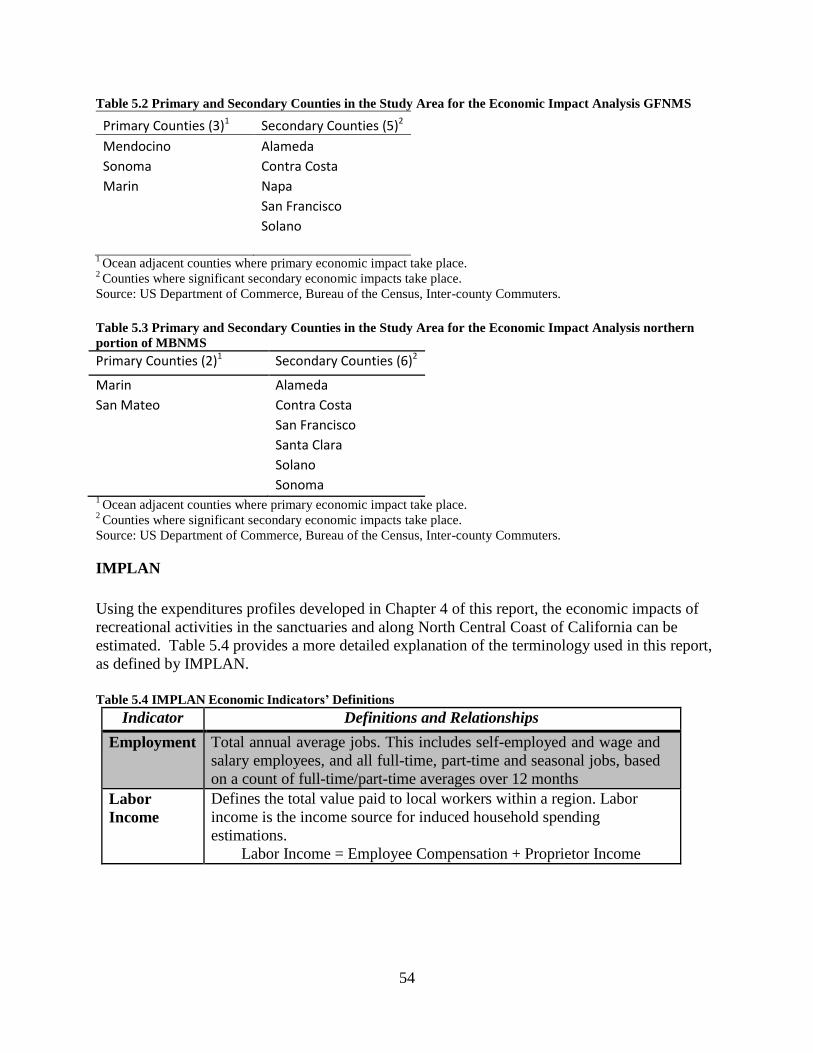
Table 5.2 Primary and Secondary Counties in the Study Area for the Economic Impact Analysis GFNMS
Primary Counties (3)1 Secondary Counties (5)2
Mendocino Alameda
Sonoma Contra Costa
Marin Napa
San Francisco
Solano
1 Ocean adjacent counties where primary economic impact take place.
2 Counties where significant secondary economic impacts take place.
Source: US Department of Commerce, Bureau of the Census, Inter-county Commuters.
Table 5.3 Primary and Secondary Counties in the Study Area for the Economic Impact Analysis northern
portion of MBNMS
Primary Counties (2)1 Secondary Counties (6)2
Marin Alameda
San Mateo Contra Costa
San Francisco
Santa Clara
Solano
Sonoma 1 Ocean adjacent counties where primary economic impact take place.
2 Counties where significant secondary economic impacts take place.
Source: US Department of Commerce, Bureau of the Census, Inter-county Commuters.
IMPLAN
Using the expenditures profiles developed in Chapter 4 of this report, the economic impacts of
recreational activities in the sanctuaries and along North Central Coast of California can be
estimated. Table 5.4 provides a more detailed explanation of the terminology used in this report,
as defined by IMPLAN.
Table 5.4 IMPLAN Economic Indicators’ Definitions
Indicator Definitions and Relationships
Employment Total annual average jobs. This includes self-employed and wage and
salary employees, and all full-time, part-time and seasonal jobs, based
on a count of full-time/part-time averages over 12 months
Labor
Income
Defines the total value paid to local workers within a region. Labor
income is the income source for induced household spending
estimations.
Labor Income = Employee Compensation + Proprietor Income
55
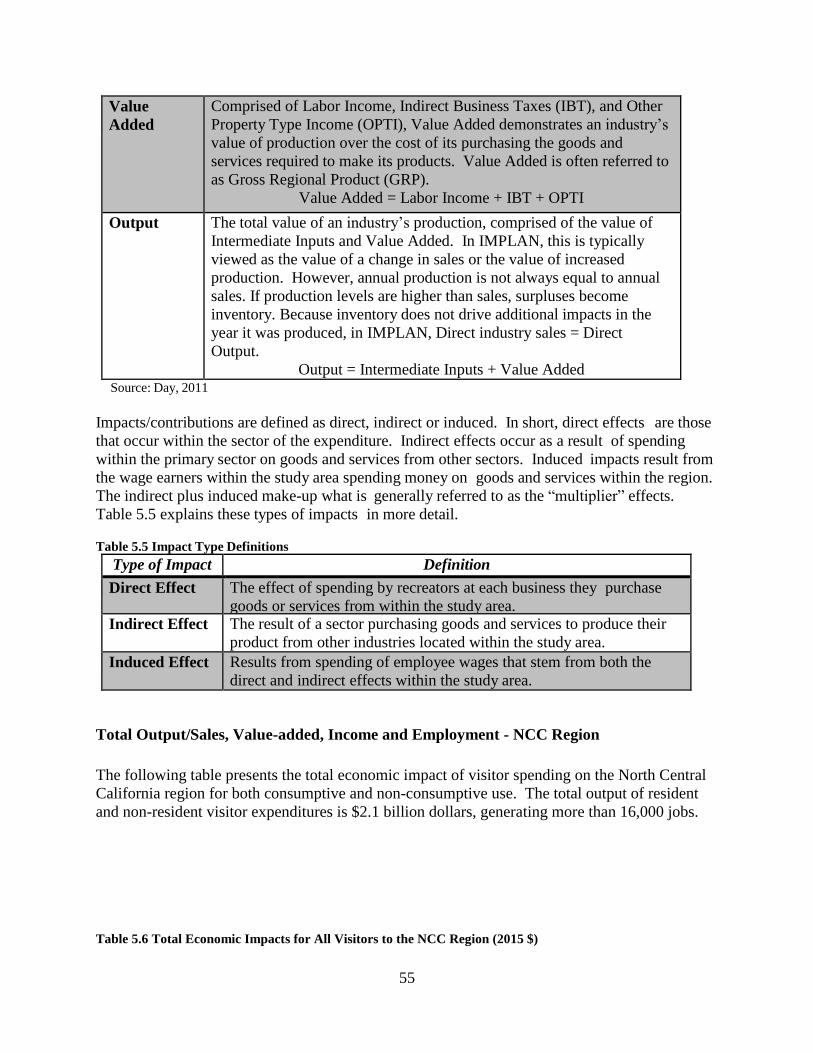
Value
Added
Comprised of Labor Income, Indirect Business Taxes (IBT), and Other
Property Type Income (OPTI), Value Added demonstrates an industry’s
value of production over the cost of its purchasing the goods and
services required to make its products. Value Added is often referred to
as Gross Regional Product (GRP).
Value Added = Labor Income + IBT + OPTI
Output The total value of an industry’s production, comprised of the value of
Intermediate Inputs and Value Added. In IMPLAN, this is typically
viewed as the value of a change in sales or the value of increased
production. However, annual production is not always equal to annual
sales. If production levels are higher than sales, surpluses become
inventory. Because inventory does not drive additional impacts in the
year it was produced, in IMPLAN, Direct industry sales = Direct
Output.
Output = Intermediate Inputs + Value Added Source: Day, 2011
Impacts/contributions are defined as direct, indirect or induced. In short, direct effects are those
that occur within the sector of the expenditure. Indirect effects occur as a result of spending
within the primary sector on goods and services from other sectors. Induced impacts result from
the wage earners within the study area spending money on goods and services within the region.
The indirect plus induced make-up what is generally referred to as the “multiplier” effects.
Table 5.5 explains these types of impacts in more detail.
Table 5.5 Impact Type Definitions
Type of Impact Definition
Direct Effect The effect of spending by recreators at each business they purchase
goods or services from within the study area. Indirect Effect The result of a sector purchasing goods and services to produce their
product from other industries located within the study area.
Induced Effect Results from spending of employee wages that stem from both the
direct and indirect effects within the study area.
Total Output/Sales, Value-added, Income and Employment - NCC Region
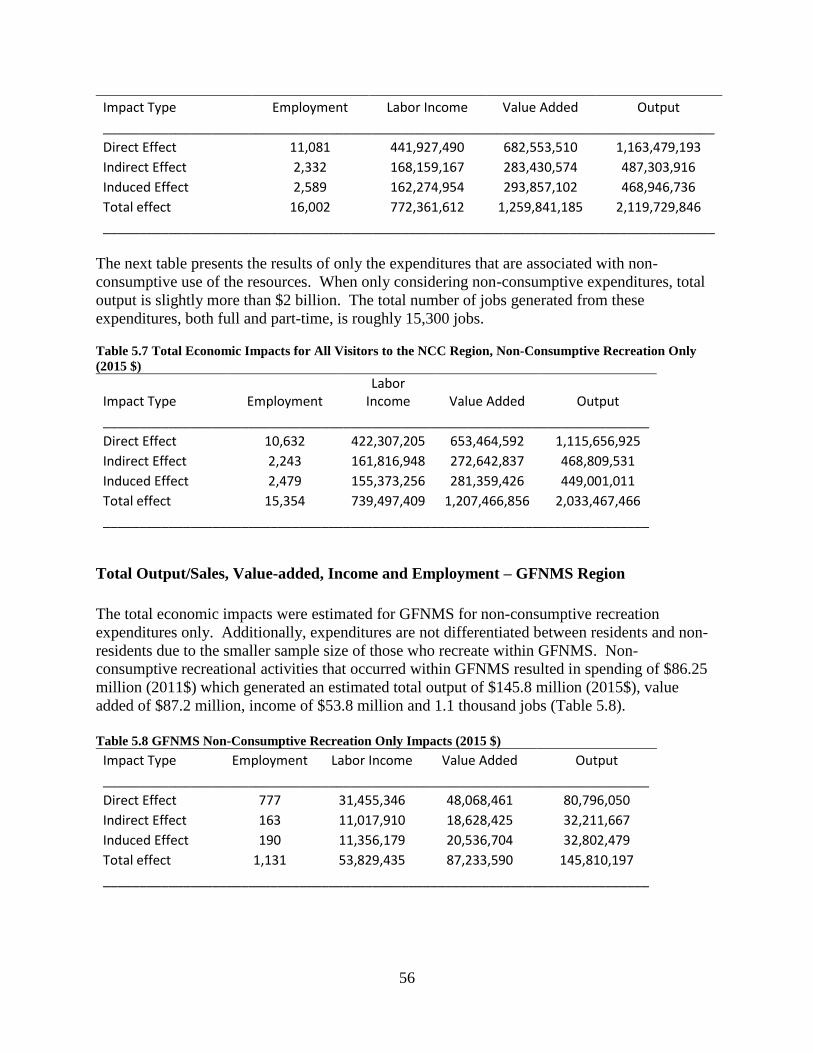
The following table presents the total economic impact of visitor spending on the North Central
California region for both consumptive and non-consumptive use. The total output of resident
and non-resident visitor expenditures is $2.1 billion dollars, generating more than 16,000 jobs.
Table 5.6 Total Economic Impacts for All Visitors to the NCC Region (2015 $)
56
Impact Type Employment Labor Income Value Added Output
____________________________________________________________________________________
Direct Effect 11,081 441,927,490 682,553,510 1,163,479,193
Indirect Effect 2,332 168,159,167 283,430,574 487,303,916
Induced Effect 2,589 162,274,954 293,857,102 468,946,736
Total effect 16,002 772,361,612 1,259,841,185 2,119,729,846
____________________________________________________________________________________
The next table presents the results of only the expenditures that are associated with non-
consumptive use of the resources. When only considering non-consumptive expenditures, total
output is slightly more than $2 billion. The total number of jobs generated from these
expenditures, both full and part-time, is roughly 15,300 jobs.
Table 5.7 Total Economic Impacts for All Visitors to the NCC Region, Non-Consumptive Recreation Only
(2015 $)
Impact Type Employment Labor
Income Value Added Output
___________________________________________________________________________
Direct Effect 10,632 422,307,205 653,464,592 1,115,656,925
Indirect Effect 2,243 161,816,948 272,642,837 468,809,531
Induced Effect 2,479 155,373,256 281,359,426 449,001,011
Total effect 15,354 739,497,409 1,207,466,856 2,033,467,466
___________________________________________________________________________
Total Output/Sales, Value-added, Income and Employment – GFNMS Region
The total economic impacts were estimated for GFNMS for non-consumptive recreation
expenditures only. Additionally, expenditures are not differentiated between residents and non-
residents due to the smaller sample size of those who recreate within GFNMS. Non-
consumptive recreational activities that occurred within GFNMS resulted in spending of $86.25
million (2011$) which generated an estimated total output of $145.8 million (2015$), value
added of $87.2 million, income of $53.8 million and 1.1 thousand jobs (Table 5.8).
Table 5.8 GFNMS Non-Consumptive Recreation Only Impacts (2015 $)
Impact Type Employment Labor Income Value Added Output
___________________________________________________________________________
Direct Effect 777 31,455,346 48,068,461 80,796,050
Indirect Effect 163 11,017,910 18,628,425 32,211,667
Induced Effect 190 11,356,179 20,536,704 32,802,479
Total effect 1,131 53,829,435 87,233,590 145,810,197
___________________________________________________________________________
57
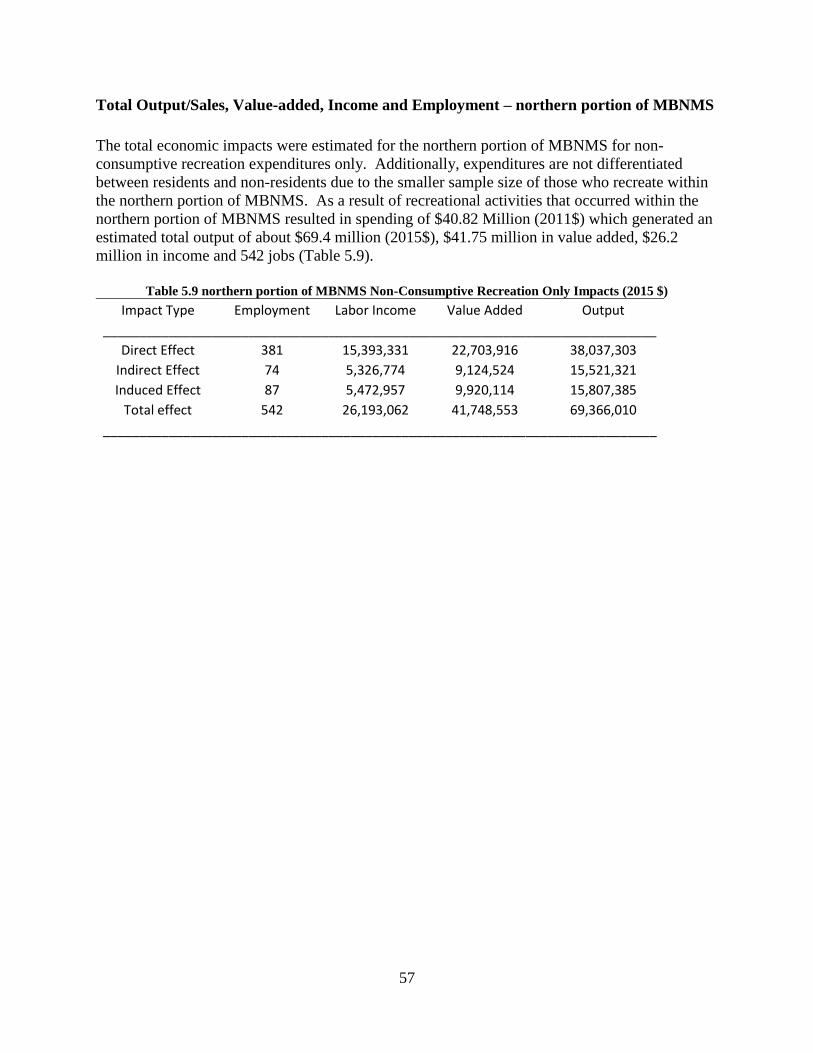
Total Output/Sales, Value-added, Income and Employment – northern portion of MBNMS
The total economic impacts were estimated for the northern portion of MBNMS for non-
consumptive recreation expenditures only. Additionally, expenditures are not differentiated
between residents and non-residents due to the smaller sample size of those who recreate within
the northern portion of MBNMS. As a result of recreational activities that occurred within the
northern portion of MBNMS resulted in spending of $40.82 Million (2011$) which generated an
estimated total output of about $69.4 million (2015$), $41.75 million in value added, $26.2
million in income and 542 jobs (Table 5.9).
Table 5.9 northern portion of MBNMS Non-Consumptive Recreation Only Impacts (2015 $)
Impact Type Employment Labor Income Value Added Output
____________________________________________________________________________
Direct Effect 381 15,393,331 22,703,916 38,037,303
Indirect Effect 74 5,326,774 9,124,524 15,521,321
Induced Effect 87 5,472,957 9,920,114 15,807,385
Total effect 542 26,193,062 41,748,553 69,366,010
____________________________________________________________________________
58
References
Chen, Cheryl, LaFranchi. Chris, Sheeran, Kristen, Steinback, Charles, Hesselgrave, Taylor,
Perry, Matthew, and Bonkoski, Jon. 2013. An Economic and Spatial Baseline of Coastal
Recreation in the North Central Coast of California. Report to The California Sea Grant
College Program in partial fulfillment of Grant No. #09-015 through the California Sea
Grant College Program. April 23, 2013 pp30.
Day, Francis. 2011. Principles of Impact Analysis& IMPLAN Applications. First
Edition. MIG.
Ecotrust. 2013. Data and Documentation for the Survey of Recreation Uses of the North Central
Coast of California. Cheryl Chen, Marine Planning Project Manager, Ecotrust, 721 NW
9th
Avenue, Suite 200, Portland, OR 97209.
Leeworthy, V., & Schwarzmann, D. 2015. Economic Impact of the Recreational Fisheries on Local
County Economies in the Greater Farallones National Marine Sanctuary 2010, 2011 and 2012.
Marine Sanctuaries Conservation Series ONMS-2015-04. U.S. Department of Commerce,
National Oceanic and Atmospheric Administration, Office of National Marine Sanctuaries,
Silver Spring, MD. 29 pp.
Leeworthy,V., Schwarzmann, D., and Reyes Saade, D. 2015. Technical Appendix: A
Socioeconomic Profile of Recreation Users of the California Northern Central Coast
Region, Greater Farallones National Marine Sanctuary and the northern portion of the
Monterey Bay National Marine Sanctuary, 2011. Marine Sanctuaries Conservation Series
ONMS-15-12. U.S. Department of Commerce, National Oceanic and Atmospheric
Administration, Office of National Marine Sanctuaries, Silver Spring, MD. 74 pp.
U.S. Department of Commerce, Census Bureau 2006-2010. Table 1. Residence County to
Workplace County Flows for the United States and Puerto Rico Sorted by Residence
Geography 2006-2010 and Table 2. Residence County to Workplace Flows for the United
States and Puerto Rico by Workplace Geography 2006-2010.
http://www.census.gov/population/metro/data/other.html