Embed Size (px)
Citation preview
A Spectral Analysis of Laser Induced Fluorescence of Iodine
S. B. Bayram∗
Miami University, Physics Department, Oxford, OH 45056
M. V. Freamat†
Morrisville State College, Physics Department, Morrisville, NY 13408(Dated: July 10, 2015)
When optically excited, iodine absorbs in the 490- to 650-nm visible region of the spectrum and,after radiative relaxation, it displays an emission spectrum of discrete vibrational bands at moderateresolution. This makes laser-induced fluorescence spectrum of molecular iodine especially suitableto study the energy structure of homonuclear diatomic molecules at room temperature. In thisspirit, we present a rather straightforward and inexpensive experimental setup and the associatedspectral analysis which provides an excellent exercise of applied quantum mechanics fit for advancedlaboratory courses. The students would be required to assign spectral lines, fill a Deslandres table,process the data to estimate the harmonic and anharmonic characteristics of the ground vibronicstate involved in the radiative transitions, and thenceforth calculate a set of molecular constantsand discuss a model of molecular vibrator.
I. INTRODUCTION
Courses of atomic and molecular spectroscopy are valu-able components of advanced physics curricula not in theleast because they provide a rich ground for quantum me-chanical applications. For example, in the advanced labcourse of spectroscopy offered in the Physics Departmentat Miami University,1–5 the students perform a sequenceof experiments exposing various facets of the inner clock-work of atomic and molecular structures. In this paperwe introduce one of these instructional experiments: thespectral analysis of laser induced fluorescence of molec-ular iodine I2 at room temperature. The educationalvalue of this experiment is two-fold: On one hand it helpsstudents practice some indispensable spectrometry skillsinasmuch as they assign electron transitions based on se-lection rules and Franck-Condon Principle, or an iodineatlas. On the other hand, they learn how to implementa quantum mechanical model for the diatomic moleculeas they use the solution of Schrodinger equation with aMorse potential to find the transition energies in termsof the fundamental vibrational frequency of the moleculeand the first order deviation from a harmonic oscillator.This spectrometric study complements two other exper-iments treating the vibrational and rotational spectrom-etry of the diatomic molecule of nitrogen.5,6
II. THEORETICAL BACKGROUND
A. Iodine absorption and emission
Iodine is the heaviest common halogen and, like theother halogens, in gas phase forms weakly bound di-atomic molecules. Iodine has an unusually long bondlength and its vapor absorbs light in the visible spec-trum, in the yellow region, such that the gas appears vi-olet. The molecular orbitals are characterized by strongspin-orbit coupling, such that the degeneracy of the state
associated with the electronic angular momentum of theexcited molecule is lifted, which results in rather complexabsorption patterns in the visible.7 Therefore, iodine hasa richer configuration of non-degenerate excited statesthan lighter homonuclear diatomic molecules. Withineach of these electronic configuratios, there is a fine struc-ture of vibrational states, which in turn contain rota-tional levels,8 such that the total energy can be parti-tioned as
E = Eel + Evib + Erot. (1)
In our experiment we are interested in the absorptionfollowed by radiative emission between the vibrationallevels of the singlet ground state X1Σ+
g and the first non-
dissociative excited triplet state B3Π+u . A detailed de-
scription of the selection rules governing electronic tran-sitions and the respective spectral notation are given inRef.[ 9]. It is interesting to note that the maxima of theabsorption and ensuing emission spectra are shifted rel-ative to each other, and with respect to the transitionfrom the lowest vibrational state of the excited level. Tounderstand why, note that at room temperature the elec-trons populate mostly the lowest vibrational levels of theground state, indexed by the quantum number v′′. Underincident visible light, the molecule will absorb photonsand undergo vibronic transitions to various vibrationallevels indexed v′ in the excited state. Subsequently, themolecule will relax in two steps, first to a single vibra-tional level in the excited state and then back to a rangeof low-lying vibrational levels in the ground state, suchthat the maximum of the emission spectrum will occur ata higher wavelength then the absorption maximum. Onthe other hand, to explain the shift from the v′ = 0→ v′′
transition, one needs to use the Franck-Condon Prin-ciple, which states that the vibronic transitions occuralmost instantaneously compared to the slow responseof the atomic nuclei shifting to other inter-atomic sep-aration. The idea can be clarified using the potentialcurves and the respective structure of vibrational levels
arX
iv:1
507.
0260
0v1
[ph
ysic
s.ed
-ph]
9 J
ul 2
015
2
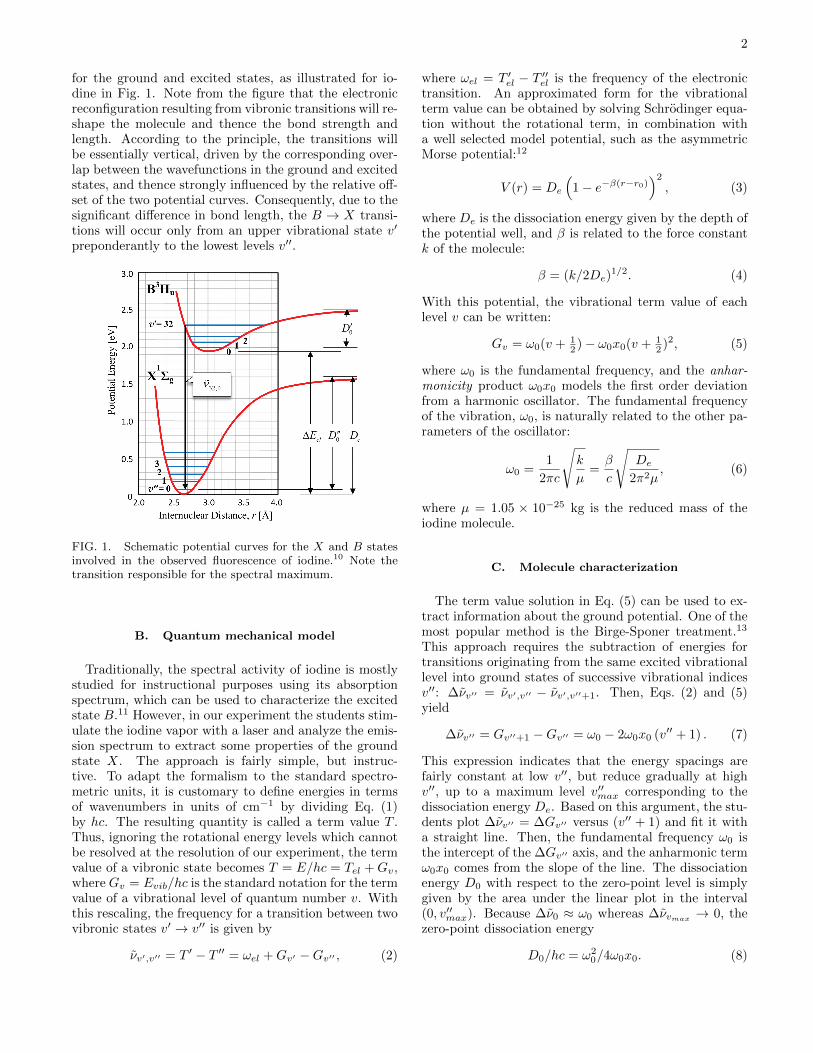
for the ground and excited states, as illustrated for io-dine in Fig. 1. Note from the figure that the electronicreconfiguration resulting from vibronic transitions will re-shape the molecule and thence the bond strength andlength. According to the principle, the transitions willbe essentially vertical, driven by the corresponding over-lap between the wavefunctions in the ground and excitedstates, and thence strongly influenced by the relative off-set of the two potential curves. Consequently, due to thesignificant difference in bond length, the B → X transi-tions will occur only from an upper vibrational state v′
preponderantly to the lowest levels v′′.
FIG. 1. Schematic potential curves for the X and B statesinvolved in the observed fluorescence of iodine.10 Note thetransition responsible for the spectral maximum.
B. Quantum mechanical model
Traditionally, the spectral activity of iodine is mostlystudied for instructional purposes using its absorptionspectrum, which can be used to characterize the excitedstate B.11 However, in our experiment the students stim-ulate the iodine vapor with a laser and analyze the emis-sion spectrum to extract some properties of the groundstate X. The approach is fairly simple, but instruc-tive. To adapt the formalism to the standard spectro-metric units, it is customary to define energies in termsof wavenumbers in units of cm−1 by dividing Eq. (1)by hc. The resulting quantity is called a term value T .Thus, ignoring the rotational energy levels which cannotbe resolved at the resolution of our experiment, the termvalue of a vibronic state becomes T = E/hc = Tel +Gv,where Gv = Evib/hc is the standard notation for the termvalue of a vibrational level of quantum number v. Withthis rescaling, the frequency for a transition between twovibronic states v′ → v′′ is given by
νv′,v′′ = T ′ − T ′′ = ωel +Gv′ −Gv′′ , (2)
where ωel = T ′el − T ′′el is the frequency of the electronictransition. An approximated form for the vibrationalterm value can be obtained by solving Schrodinger equa-tion without the rotational term, in combination witha well selected model potential, such as the asymmetricMorse potential:12
V (r) = De
(1− e−β(r−r0)
)2, (3)
where De is the dissociation energy given by the depth ofthe potential well, and β is related to the force constantk of the molecule:
β = (k/2De)1/2. (4)
With this potential, the vibrational term value of eachlevel v can be written:
Gv = ω0(v + 12 )− ω0x0(v + 1
2 )2, (5)
where ω0 is the fundamental frequency, and the anhar-monicity product ω0x0 models the first order deviationfrom a harmonic oscillator. The fundamental frequencyof the vibration, ω0, is naturally related to the other pa-rameters of the oscillator:
ω0 =1
2πc
√k
µ=β
c
√De
2π2µ, (6)
where µ = 1.05 × 10⁻²⁵ kg is the reduced mass of theiodine molecule.
C. Molecule characterization
The term value solution in Eq. (5) can be used to ex-tract information about the ground potential. One of themost popular method is the Birge-Sponer treatment.13
This approach requires the subtraction of energies fortransitions originating from the same excited vibrationallevel into ground states of successive vibrational indicesv′′: ∆νv′′ = νv′,v′′ − νv′,v′′+1. Then, Eqs. (2) and (5)yield
∆νv′′ = Gv′′+1 −Gv′′ = ω0 − 2ω0x0 (v′′ + 1) . (7)
This expression indicates that the energy spacings arefairly constant at low v′′, but reduce gradually at highv′′, up to a maximum level v′′max corresponding to thedissociation energy De. Based on this argument, the stu-dents plot ∆νv′′ = ∆Gv′′ versus (v′′ + 1) and fit it witha straight line. Then, the fundamental frequency ω0 isthe intercept of the ∆Gv′′ axis, and the anharmonic termω0x0 comes from the slope of the line. The dissociationenergy D0 with respect to the zero-point level is simplygiven by the area under the linear plot in the interval(0, v′′max). Because ∆ν0 ≈ ω0 whereas ∆νvmax → 0, thezero-point dissociation energy
D0/hc = ω20/4ω0x0. (8)
3
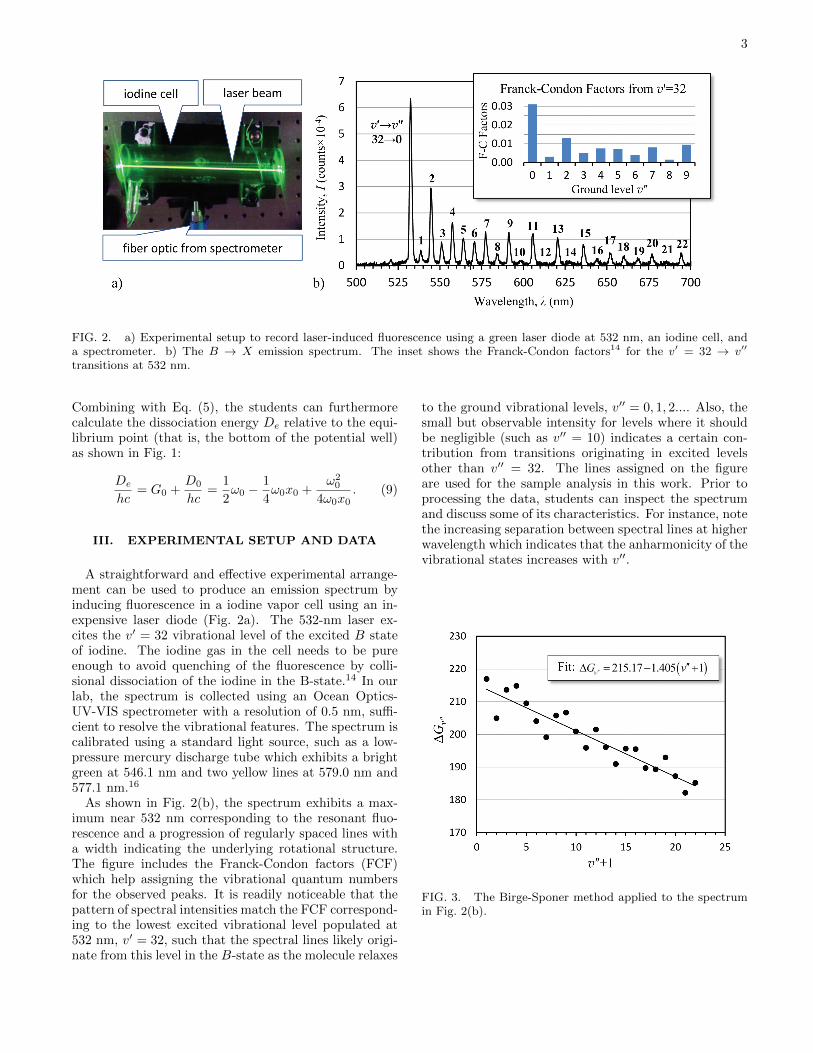
FIG. 2. a) Experimental setup to record laser-induced fluorescence using a green laser diode at 532 nm, an iodine cell, anda spectrometer. b) The B → X emission spectrum. The inset shows the Franck-Condon factors14 for the v′ = 32 → v′′
transitions at 532 nm.
Combining with Eq. (5), the students can furthermorecalculate the dissociation energy De relative to the equi-librium point (that is, the bottom of the potential well)as shown in Fig. 1:
De
hc= G0 +
D0
hc=
1
2ω0 −
1
4ω0x0 +
ω20
4ω0x0. (9)
III. EXPERIMENTAL SETUP AND DATA
A straightforward and effective experimental arrange-ment can be used to produce an emission spectrum byinducing fluorescence in a iodine vapor cell using an in-expensive laser diode (Fig. 2a). The 532-nm laser ex-cites the v′ = 32 vibrational level of the excited B stateof iodine. The iodine gas in the cell needs to be pureenough to avoid quenching of the fluorescence by colli-sional dissociation of the iodine in the B-state.14 In ourlab, the spectrum is collected using an Ocean Optics-UV-VIS spectrometer with a resolution of 0.5 nm, suffi-cient to resolve the vibrational features. The spectrum iscalibrated using a standard light source, such as a low-pressure mercury discharge tube which exhibits a brightgreen at 546.1 nm and two yellow lines at 579.0 nm and577.1 nm.16
As shown in Fig. 2(b), the spectrum exhibits a max-imum near 532 nm corresponding to the resonant fluo-rescence and a progression of regularly spaced lines witha width indicating the underlying rotational structure.The figure includes the Franck-Condon factors (FCF)which help assigning the vibrational quantum numbersfor the observed peaks. It is readily noticeable that thepattern of spectral intensities match the FCF correspond-ing to the lowest excited vibrational level populated at532 nm, v′ = 32, such that the spectral lines likely origi-nate from this level in the B-state as the molecule relaxes
to the ground vibrational levels, v′′ = 0, 1, 2.... Also, thesmall but observable intensity for levels where it shouldbe negligible (such as v′′ = 10) indicates a certain con-tribution from transitions originating in excited levelsother than v′′ = 32. The lines assigned on the figureare used for the sample analysis in this work. Prior toprocessing the data, students can inspect the spectrumand discuss some of its characteristics. For instance, notethe increasing separation between spectral lines at higherwavelength which indicates that the anharmonicity of thevibrational states increases with v′′.
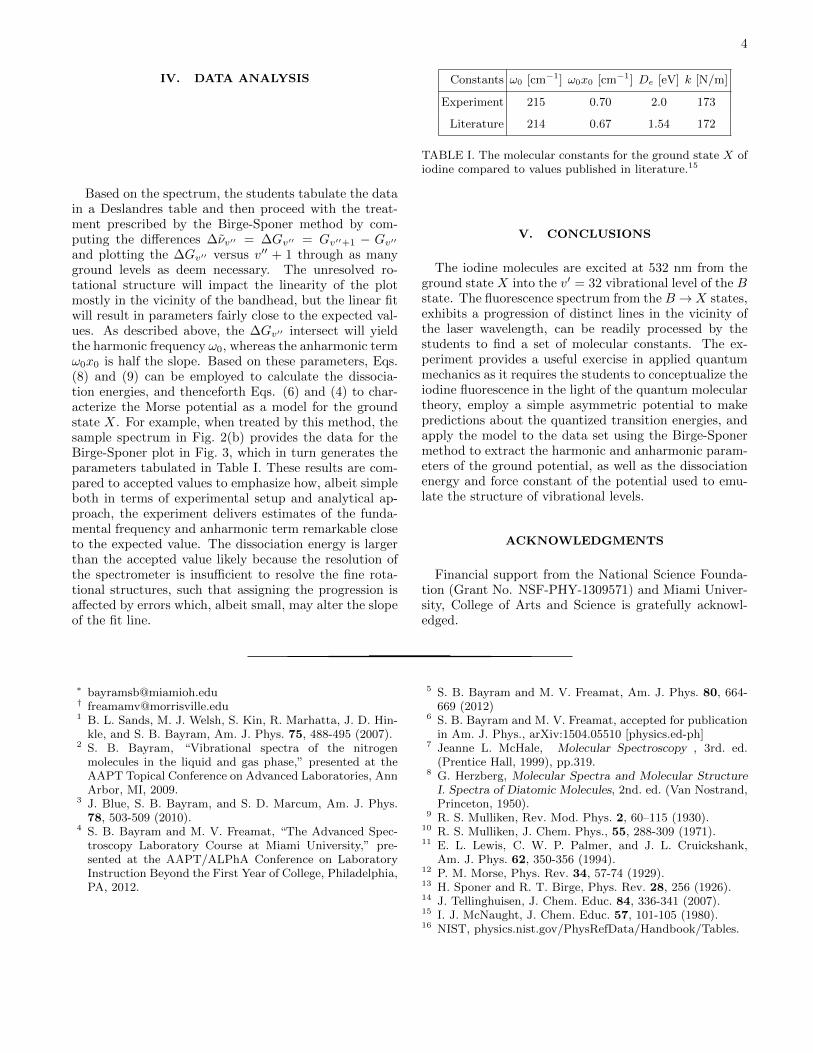
FIG. 3. The Birge-Sponer method applied to the spectrumin Fig. 2(b).
4
IV. DATA ANALYSIS
Based on the spectrum, the students tabulate the datain a Deslandres table and then proceed with the treat-ment prescribed by the Birge-Sponer method by com-puting the differences ∆νv′′ = ∆Gv′′ = Gv′′+1 − Gv′′and plotting the ∆Gv′′ versus v′′ + 1 through as manyground levels as deem necessary. The unresolved ro-tational structure will impact the linearity of the plotmostly in the vicinity of the bandhead, but the linear fitwill result in parameters fairly close to the expected val-ues. As described above, the ∆Gv′′ intersect will yieldthe harmonic frequency ω0, whereas the anharmonic termω0x0 is half the slope. Based on these parameters, Eqs.(8) and (9) can be employed to calculate the dissocia-tion energies, and thenceforth Eqs. (6) and (4) to char-acterize the Morse potential as a model for the groundstate X. For example, when treated by this method, thesample spectrum in Fig. 2(b) provides the data for theBirge-Sponer plot in Fig. 3, which in turn generates theparameters tabulated in Table I. These results are com-pared to accepted values to emphasize how, albeit simpleboth in terms of experimental setup and analytical ap-proach, the experiment delivers estimates of the funda-mental frequency and anharmonic term remarkable closeto the expected value. The dissociation energy is largerthan the accepted value likely because the resolution ofthe spectrometer is insufficient to resolve the fine rota-tional structures, such that assigning the progression isaffected by errors which, albeit small, may alter the slopeof the fit line.
Constants ω0 [cm−1] ω0x0 [cm−1] De [eV] k [N/m]
Experiment 215 0.70 2.0 173
Literature 214 0.67 1.54 172
TABLE I. The molecular constants for the ground state X ofiodine compared to values published in literature.15
V. CONCLUSIONS
The iodine molecules are excited at 532 nm from theground state X into the v′ = 32 vibrational level of the Bstate. The fluorescence spectrum from the B→X states,exhibits a progression of distinct lines in the vicinity ofthe laser wavelength, can be readily processed by thestudents to find a set of molecular constants. The ex-periment provides a useful exercise in applied quantummechanics as it requires the students to conceptualize theiodine fluorescence in the light of the quantum moleculartheory, employ a simple asymmetric potential to makepredictions about the quantized transition energies, andapply the model to the data set using the Birge-Sponermethod to extract the harmonic and anharmonic param-eters of the ground potential, as well as the dissociationenergy and force constant of the potential used to emu-late the structure of vibrational levels.
ACKNOWLEDGMENTS
Financial support from the National Science Founda-tion (Grant No. NSF-PHY-1309571) and Miami Univer-sity, College of Arts and Science is gratefully acknowl-edged.
∗ [email protected]† [email protected] B. L. Sands, M. J. Welsh, S. Kin, R. Marhatta, J. D. Hin-
kle, and S. B. Bayram, Am. J. Phys. 75, 488-495 (2007).2 S. B. Bayram, “Vibrational spectra of the nitrogen
molecules in the liquid and gas phase,” presented at theAAPT Topical Conference on Advanced Laboratories, AnnArbor, MI, 2009.
3 J. Blue, S. B. Bayram, and S. D. Marcum, Am. J. Phys.78, 503-509 (2010).
4 S. B. Bayram and M. V. Freamat, “The Advanced Spec-troscopy Laboratory Course at Miami University,” pre-sented at the AAPT/ALPhA Conference on LaboratoryInstruction Beyond the First Year of College, Philadelphia,PA, 2012.
5 S. B. Bayram and M. V. Freamat, Am. J. Phys. 80, 664-669 (2012)
6 S. B. Bayram and M. V. Freamat, accepted for publicationin Am. J. Phys., arXiv:1504.05510 [physics.ed-ph]
7 Jeanne L. McHale, Molecular Spectroscopy , 3rd. ed.(Prentice Hall, 1999), pp.319.
8 G. Herzberg, Molecular Spectra and Molecular StructureI. Spectra of Diatomic Molecules, 2nd. ed. (Van Nostrand,Princeton, 1950).
9 R. S. Mulliken, Rev. Mod. Phys. 2, 60–115 (1930).10 R. S. Mulliken, J. Chem. Phys., 55, 288-309 (1971).11 E. L. Lewis, C. W. P. Palmer, and J. L. Cruickshank,
Am. J. Phys. 62, 350-356 (1994).12 P. M. Morse, Phys. Rev. 34, 57-74 (1929).13 H. Sponer and R. T. Birge, Phys. Rev. 28, 256 (1926).14 J. Tellinghuisen, J. Chem. Educ. 84, 336-341 (2007).15 I. J. McNaught, J. Chem. Educ. 57, 101-105 (1980).16 NIST, physics.nist.gov/PhysRefData/Handbook/Tables.