Embed Size (px)
Citation preview

s
:
tending to
resolutioninated byc signaturee and thewith both
in incolor of theother icy
dos. Usingng),tral datatonidentified
Icarus 175 (2005) 268–283www.elsevier.com/locate/icaru
A spectroscopic study of the surfaces of Saturn’s large satellitesH2O ice, tholins, and minor constituents✩
Dale P. Cruikshanka,∗, Tobias C. Owenb, Cristina Dalle Orea,c, Thomas R. Geballed,Ted L. Rousha, Catherine de Berghe, Scott A. Sandforda, Francois Pouletf,
Gretchen K. Benedixg, Joshua P. Emerya,c
a NASA Ames Research Center, 245-6, Moffett Field, CA 94035-1000, USAb Institute for Astronomy, University of Hawaii, 2680 Woodlawn Dr., Honolulu, HI 96822, USA
c SETI Institute, 2035 Landings Dr., Mountain View, CA 94043, USAd Gemini Observatory, 670 N. A’ohoku Pl., Hilo, HI 96720, USA
e Observatoire de Paris, 5 Place Jules Janssen, Meudon Cedex 92195, Francef Institut d’Astrophysique Spatiale, Bât. 121, Université de Paris-Sud, F91405 Orsay Cedex, Franceg Department of Earth and Planetary Sciences, Washington University, St. Louis, MO 63130, USA
Received 8 August 2003; revised 30 August 2004
Available online 2 March 2005
Abstract
We present spectra of Saturn’s icy satellites Mimas, Enceladus, Tethys, Dione, Rhea, and Hyperion, 1.0–2.5 µm, with data exshorter (Mimas and Enceladus) and longer (Rhea and Dione) wavelengths for certain objects. The spectral resolution (R = λ/�λ) of thedata shown here is in the range 800–1000, depending on the specific instrument and configuration used; this is higher than the(R = 225 at 3 µm) afforded by the Visual-Infrared Mapping Spectrometer on the Cassini spacecraft. All of the spectra are domwater ice absorption bands and no other features are clearly identified. Spectra of all of these satellites show the characteristiof hexagonal H2O ice at 1.65 µm. We model the leading hemisphere of Rhea in the wavelength range 0.3–3.6 µm with the HapkShkuratov radiative transfer codes and discuss the relative merits of the two approaches to fitting the spectrum. In calculationscodes, the only components used are H2O ice, which is the dominant constituent, and a small amount of tholin (Ice Tholin II). Tholsmall quantities (few percent, depending on the mixing mechanism) appears to be an essential component to give the basic redsatellite in the region 0.3–1.0 µm. The quantity and mode of mixing of tholin that can produce the intense coloration of Rhea andsatellites has bearing on its likely presence in many other icy bodies of the outer Solar System, both of high and low geometric albethe modeling codes, we also establish detection limits for the ices of CO2 (a few weight percent, depending on particle size and mixiCH4 (same), and NH4OH (0.5 weight percent) in our globally averaged spectra of Rhea’s leading hemisphere. New laboratory specfor NH4OH are presented for the purpose of detection on icy bodies. These limits for CO2, CH4, and NH4OH on Rhea are also applicablethe other icy satellites for which spectra are presented here. The reflectance spectrum of Hyperion shows evidence for a broad, uabsorption band centered at 1.75 µm. 2004 Elsevier Inc. All rights reserved.
Keywords:Ices; Infrared observations; Satellites of Saturn; Spectroscopy; Surfaces, satellite; Organic chemistry
planetary
✩ The authors dedicate this paper to the memory of a friend and colleague, Vasily Ivanovich Moroz (1931–2004), one of founders of modern physics and a pioneer in infrared spectroscopy of Solar System bodies.* Corresponding author. Fax: +1-650-604-6779.E-mail address:[email protected](D.P. Cruikshank).
0019-1035/$ – see front matter 2004 Elsevier Inc. All rights reserved.doi:10.1016/j.icarus.2004.09.003

py of
m)lessdo
ntly,
ptionac-zed0;
ingsec-
on
)inandings
hatate-ingl.,iv-
a-thatsur;
etedneror-)ec-
desT
-
emi-
reding5;n
tohigh
er-
asostgaser-.ctro-theom
ined
entshilegionelle.een
p-i-
ndbothHy-inge ob-atandm.
s aree
F/theingts ofdif-
withthe
, werig-ion
Infrared spectrosco
1. Introduction
It is well established from near-infrared (1.0–2.5 µspectroscopy that the surfaces of Saturn’s major airsatellites—with the possible exception of the low-albe(leading) hemisphere (LH) of Iapetus—are predominacovered by water ice (e.g.,Fink et al., 1976; Clark et al.1984; Roush et al., 1995; Cruikshank et al., 1998a). Thereflectance spectra show several characteristic absorbands of H2O ice, plus the 1.65-µm absorption band charteristic of hexagonal ice at low temperature, first recogniin Saturn’s rings(Kuiper et al., 1970; Pilcher et al., 197Fink and Larson, 1975; Fink and Sill, 1982). Kuiper (1957)was the first to propose that ice must be present in the rfrom his unpublished observations, while near-infrared sptra obtained in 1964 byMoroz (1967, Fig. 191)clearly showH2O ice absorption. Reviews of the discoveries of iceSaturn’s satellites have been presented byCruikshank et al.(1984), Clark et al. (1986), andCruikshank et al. (1998a,while the full story of the detection of ice absorptionsspectra of the rings has not yet been written. A recentcomprehensive study of the near-infrared spectra of the rhas been published byPoulet et al. (2003). Further historicaldetails are beyond the scope of this paper.
Models for the interiors of these satellites indicate tthey must be composed of mixtures of ice and denser mrials (presumably rock plus organic compounds) in varyproportions (e.g.,Lupo and Lewis, 1979; Schubert et a1986). Morphological evidence of internal geological actity on some of these objects, plus models for their formtion from a Saturn subnebula have fueled speculationother compounds besides ice may be present on theface, notably ammonia hydrate(Prinn and Fegley, 1981Smith et al., 1981; Morrison et al., 1986). The outer reg-ular satellites (beyond Titan), however, may have accrin regions of the disk that are disconnected from the inportions where disk conditions would have led to the fmation of such compounds(Mosqueira and Estrada, 2003a.A possible absorption band at 1.85 µm reported in sptra of the trailing hemisphere of Tethys byClark et al.(1984) would indicate the presence of something besiwater ice if it were confirmed, and UV studies with HShave demonstrated the presence of O3 and a possible organic compound on Dione and Rhea(Noll et al., 1997). Inthe cases of Hyperion, Phoebe, and the low-albedo hsphere of Iapetus, it is obvious that other materialsmustbepresent, darkening the surfaces and producing a strongdening of the visible spectra of Hyperion and the leadhemisphere of Iapetus(Clark et al., 1984; Roush et al., 199Cruikshank et al., 1998a). Ice was only recently detected oPhoebe(Owen et al., 1999; Brown, 2000).
Because of a general tendency for ageing effectsdarken surfaces of solid bodies in the Solar System, the
albedos of Mimas, Enceladus, Tethys, Dione, and Rhea in-vite further study. In view of their albedos, the range of den-sities (0.98–1.49 g cm−3) among these satellites is also note-Saturn’s icy satellites 269
-
-
worthy(Smith et al., 1981). These satellites may have undgone a unique formation history. A recent study(Mosqueiraand Estrada, 2003b)has them forming 104–105 years afterthe formation of Titan, at a time when gas dissipation wtaking place, the disk was becoming optically thin, and mof the silicates in the disk had been lost to the planet bydrag. Hence, it is important to constrain the physical propties of the satellites, including their surface compositions
For these and other reasons, we undertook a spescopic study of Saturn’s largest icy satellites, usingcooled grating spectrometer CGS4 at the United KingdInfrared Telescope (UKIRT)(Mountain et al., 1990). Addi-tional data for Rhea, Enceladus, and Mimas were obtausing the SpeX spectrometer(Rayner et al., 2003). TheCGS4 data were obtained in individual spectral segmof 0.15–0.64 µm that were also separated in time, wthe SpeX data were obtained simultaneously over the re0.8–2.5 µm in several orders of a cross-dispersed echOur study of the low-albedo hemisphere of Iapetus has breported byOwen et al. (2001), and our Phoebe study apears inOwen et al. (1999). In this paper, we present addtional results from this program.
2. Observations and models
We observed the trailing hemispheres (TH) of Mimas aTethys, the leading hemisphere (LH) of Enceladus, andhemispheres of Dione and Rhea. The chaotic rotation ofperion precludes the possibility of defining a leading/trailhemisphere spectrum. We recorded the spectra of thesjects in the region 0.8–2.5 µm, with the best quality dprimarily in the region 1.4–2.5 µm. The spectra of Dione aRhea were observed to a long wavelength limit of 3.6 µThe relevant parameters describing these observationgiven in Table 1. All of the data were obtained with thCGS4 spectrometer on UKIRT, except as noted.
2.1. Rhea
We observed Rhea with the UKIRT/CGS4 and the IRTSpeX, covering the region 0.8–3.6 µm for a fraction ofsatellite’s surface that corresponds primarily to the leadhemisphere. The data shown in Fig. 1 consist of segmenthe spectrum that were obtained at different times andferent positions on Rhea’s surface, as noted inTable 1. Thevariations in albedos and strength of spectral featuresposition on the satellite’s surface can easily account fordifferent levels and small mismatches seen inFig. 1. Whilerecognizing these limitations of our spectra as presentedare unable to correct all of these differences of level in aorous quantitative way because of the limited informatavailable.
Our most complete spectrum (0.8–2.5 µm) was obtainedwith SpeX, and because all spectral segments were recordedsimultaneously, we use these data as the “backbone” for

/ Ica
ts ofhich
slyFori-urn),-
n the
eX
pecataon
d th
tsent
f theents,thedel-
rep-etric
dpa-)bedo
seg-gestgree-ing
ofba-
re,v-gths
re ofticleca-the
nger
;ofwe
dif-ces,
utcler-un-ent
and
est-e
270 D.P. Cruikshank et al.
Table 1Circumstances of observations
Satellite Date λ regiona P.A. (θ) (◦)b α (◦)c Lead/trailing
Mimasd 2001 Oct. 17 IJHK 268 4.8 TrailingMimasd 2003 Apr. 7 IJHK 104 5.8 LeadingEnceladus 1995 Sept. 7 K 275 0.9 TrailingEnceladus 1995 Sept. 9 H 95 0.7 LeadingEnceladus 1998 Oct. 28 K 267 0.6 TrailingEnceladus 1998 Oct. 28 HK 266 0.6 TrailingEnceladusd 2003 Apr. 5 IJHK 237 5.9 IntermediateTethys 1995 Sept. 9 H 265 0.7 TrailingTethys 1998 Oct. 28 K 252 0.6 TrailingTethys 1998 Oct. 28 HI 249 0.6 IntermediateTethys 1998 Oct. 28 KL 236 0.6 IntermediateTethys 1998 Oct. 29 JH 55 0.7 IntermediateTethys 1998 Oct. 29 J 343 0.7 IntermediateDione 1995 Sept. 7 HK 274 0.9 TrailingDione 1995 Sept. 9 H 95 0.7 LeadingDione 1998 Oct. 28 KL 288 0.6 TrailingDione 1998 Oct. 28 L 282 0.6 TrailingDione 1998 Oct. 29 JH 236 0.7 IntermediateDione 1998 Oct. 29 JH 224 0.7 IntermediateDione 1998 Oct. 29 J 169 0.7 IntermediateRhea 1995 Sept. 7 HK 97 0.9 LeadingRhea 1995 Sept. 9 H 276 0.7 TrailingRhea 1998 Oct. 28 KL 97 0.6 LeadingRhea 1998 Oct. 28 L 94 0.6 LeadingRhea 1998 Oct. 29 JH 63 0.7 IntermediateRhea 1998 Oct. 29 J 53 0.7 IntermediateRhead 2000 Oct. 6 IJHK 110 4.6 LeadingHyperion 1994 Oct. 6 K 99 3.4 –Hyperion 1995 Sept. 5 K 274 1.1 –Hyperion 1995 Sept. 9 H 93 0.7 –Hyperion 1998 Oct. 29 JH 255 0.7 –Hyperion 1998 Oct. 29 J 254 0.7 –Phoebe 1995 Sept. 7 K 58 0.9 –Phoebe 1995 Sept. 9 H 58 0.7 –
a The notation for the wavelength regions covered in various segmenthe spectra recorded is that of the standard infrared filter bands, for wthe central wavelengths are, respectively, I= 0.88 µm, J= 1.22 µm, H=1.66 µm, K= 2.18 µm, L= 3.55 µm(Tokunaga, 2000).
b P.A. is the position angle of the satellite in its orbit; for synchronourotating satellites this is a measure of the longitude visible from Earth.P.A. (longitudes) in the range 70–110◦ we were seeing the leading hemsphere of the satellite (in the sense of the orbital motion around Satand for P.A. in the range 250–290◦ we were viewing the trailing hemisphere. Hyperion and Phoebe are non-synchronous.
c α is the solar phase angle of the Saturn system, the angle betweeSun and Earth as seen from Saturn.
d Observations with the NASA Infrared Telescope Facility (IRTF), Spechelle spectrograph.
matching up separate segments of the UKIRT data. In a stral region of overlap at 2.4 µm, we combine the SpeX dwith the long-wavelength UKIRT data to cover the regi0.8–3.6 µm. Shorter wavelength data come fromNoll et al.(1997), Voyager photometry (Buratti et al., 1990, and Fig. 2of Buratti et al., 1998), and Clark et al. (1984). We notethe discrepancy between the spectrophotometric data an
shortest Voyager wavelength point (0.33 µm), and we assigngreater weight to the spectrophotometry. The error estimatefor the Voyager photometry is±0.08 in geometric albedorus 175 (2005) 268–283
-
e
(Buratti et al., 1998). Figure 1shows all of these segmenfrom 0.22 to 3.6 µm, with the albedo level of each segmscaled to the best of our ability, as described inAppendix A.Discrepancies remain in the absolute levels of several osegments and even in the slopes of some of the segmforcing us to make some judgments in the selection ofcomponents to fuse into a final spectrum suitable for moing.
In terms of the short wavelength region, we see a discancy between the shortest wavelength Voyager photompoint (fromBuratti et al., 1998) and the ultraviolet spectrumfrom Noll et al. (1997). The Noll et al. spectrum is plottewith the geometric albedos scale derived in their 1997per, which in turn is taken fromRoush et al. (1995, Fig. 4who used a variety of data sources. We retained the alscale from the originalNoll et al. (1997)paper for the UVsegment of the spectrum.
Throughout the rest of the spectrum, we selectedments with the minimum noise, the best overlap, the lonuninterrupted expanses, and best mutual photometric ament, using our collective scientific judgment. The resultcomposite spectrum is shown inFig. 2, for which the modelsdescribed below are calculated.
Clark et al. (1984)measured the 0.6–2.5 µm spectrumthe leading hemisphere of Rhea and concluded on thesis of the H2O ice band depths that the ice is nearly puwith less than∼ 1 weight percent particulate minerals, aeraged on a global scale. They also noted that the strenof the ice bands are greater on the leading hemisphethe satellite, suggesting that the greater incidence of parradiation on the trailing hemisphere induces some modifition of the surface ice. (Note the discrepancy betweentext and the figure captions inClark et al. (1984)concern-ing the relative band strengths; in fact the bands are stroon the leading hemisphere, a result corroborated byGrundyet al. (1999).) In our earlier work(Benedix et al., 1998Dalle Ore et al., 1999)we reported on Hapke modelsRhea using H2O ice and ice tholins. In the present paperpresent additional models and more details.
We have modeled the spectrum of Rhea using twoferent theories for diffuse scattering from airless surfaHapke (1981, 1993)theory and Shkuratov theory(Shkuratovet al., 1999). These two theories differ in various ways, bprimarily in the way they formulate the scattering partiasymmetry parameter,g, which governs the single scatteing phase function. This in turn affects the calculated abdances of the individual components in multi-componmodels needed to match astronomical spectra.Poulet etal. (2002)discussed and compared the two theories,demonstrated the differences with synthetic spectra of H2Oice and Titan tholin.
The composite spectrum of Rhea is shown with our bfit Hapke model inFig. 2. Our basic approach to Hapk
modeling is described byRoush (1994)andCruikshank etal. (1998b). The goal is to match not only the spectral shapeof the satellite’s reflectance spectrum, but also the albedo at
ns d
Infrared spectroscopy of Saturn’s icy satellites 271
Fig. 1. The spectrum (0.2–3.6 µm) of the leading hemisphere of Rhea, showing various components from different sources, including the observatioiscussedin the present paper.
Fig. 2. The composite smoothed spectrum of the leading hemisphere of Rhea (in red) and two models calculated with the Hapke and Shkuratov codes. Theminimum in the Rhea spectrum at∼ 0.25 µm is the O3 band reported byNoll et al. (1997); O3 is not included in the models.

272 D.P. Cruikshank et al. / Icarus 175 (2005) 268–283
odel refract
trumodelberntssitecal-thefea-
data
tionnts
gere toapeaf-ec-inichls of
ted on-
m-
)
,ceson,nsi-
arelents,ionf ra-sed
ncede-
ulatemet-
Fig. 3. Complex refractive indices of two components (tholins) of the mindices of NH4OH in H2O, as noted in text.
every wavelength. Because we are matching the specover a very wide wavelength range (0.22–3.60 µm, a mfit is challenging. Furthermore, we are limited by the numof candidate materials for which reliable optical consta(complex refractive indices) are available. The compospectrum of Rhea in Fig. 2 is not readily amenable to aculated formal error at each wavelength point; instead,uncertainties in the albedo levels and specific spectraltures can be judged by the point-to-point scatter in theand by reference toFig. 1.
In general terms, continuum albedo between absorpbands is strongly influenced by the scattering coefficie(e.g., Legendreb coefficient). The strengths of the H2O icebands are strongly influenced by particle size, with larparticles giving deeper bands. As grain sizes continuincrease, a distinct blue slope in the overall spectral shis introduced. Tholins are strongly colored, and mostlyfect the short wavelength portion (0.3–1.4 µm) of the sptrum, where H2O ice is nearly neutral in reflectance. Certatholins have a strong N–H absorption band at 3 µm, whappears in the model spectra (note particularly the modeIapetus inOwen et al., 2001).
After experimenting with many combinations of intimamixture and spatially segregated models, we convergethe Rhea models shown here (Fig. 2). The Hapke model con
sists of a spatial mixture of two components, each covering50% of the leading hemisphere of the satellite. One compo-nent consists of an intimate mixture of 95% H2O ice plus 5%s for Rhea, provided by Dr. Bishun Khare. Also shown are the complexive
Ice Tholin II, both in grains 5 µm in size. The second coponent consists of an intimate mixture of 49.85% H2O ice(grain size 120 µm) plus 49.85% H2O ice (grain size 480 µmplus 0.3% Ice Tholin II (grain size 5 µm). The H2O ice com-plex indices were measured at 80 K (Grundy and Schmitt1998, and personal communication), and the tholin indiwere provided by Dr. B.N. Khare (personal communicatiplotted inFig. 3). Note that in an intimate mixture model aincoming solar photon scatters from grains of all compotional components before emerging.
Additional parameters of our preferred Hapke modelgiven in Table 2. Whereas a spatial mixture is a simpweighted average of the optical effects of the componethe intimate mixture requires a more complex calculatbased on a two-stream approximation to the equation odiative transfer as developed byHapke (1993 and referencetherein). A detailed description of the Hapke equation ushere and its parameters is given byCruikshank et al. (1998b);Eq. (A1) of that paper shows the bidirectional reflectaof a surface and the physical parameters upon which itpends. The parameters we used in the model to calcthe bidirectional reflectance spectrum expressed as georic albedo are given inTable 2.
As described inCruikshank et al. (1998b), we assumeh = 0.05, S(0) = 1.0, andc = 0.0 for all models, whereh
is the compaction parameter,S(0) is the fraction of lightscattered from near the surface atg = 0, andc is one ofthe Legendre polynomial coefficients. The other Legendre
py of
nts 1
eds.
ngleno
ualerv-nal
re-n isly
che
forbe-
pe.olin, atrgergth-l
ewellsis-
and1.9We
ar tthen inar-
leswith
leur-
po-)he
-
ro-ed
o-
ber-lar
um4;
clesm
ly
ta;, andthera-datahers atanyost
rac-omee in-eringo thetheirof
iquefor
er-ts ofthe
µm-µm
Infrared spectrosco
Table 2Hapke parameters for the Rhea model
Modelcomponentsa
Materials Massfraction
Density(g cm−3)
Grain size(mm)
Legendreb
1 A H2O ice 0.9500 0.918 0.005 1.501 B Ice Tholin II in
H2O ice0.0500 1.400 0.005 1.50
2 A H2O ice 0.4985 0.918 0.120 1.002 B H2O ice 0.4985 0.918 0.480 1.002 C Ice Tholin II in
H2O ice0.0030 1.400 0.005 1.00
a The preferred model consists of 50% spatial coverage of componeand 2, each of which is an intimate mixture of the subcomponents A+ B,and A+ B + C, respectively, as described in the text.
coefficient (b) is varied in this study, and the values usare shown inTable 2for the different model componentAs shown in Eq. (A1) ofCruikshank et al. (1998b), Θ̄ , theparameter describing the average topographic slope aof surface roughness at sub-spatial resolution scale, isused in our calculations; its value is known only at viswavelengths from the literature and because of our obsing conditions it cannot be derived from the observatiodata.
Our preferred Hapke model matches the 0.5–1.1 µmgion reasonably well. The shape of the violet absorptiogenerally difficult to match, and in our models is entireattributed to the contribution of the tholin material, whiis highly absorbing in the violet and ultraviolet regions. Wexperimented with all five of the solid organic materialswhich complex refractive indices are available to us (seelow), and Ice Tholin II yields the best match to the shaWe note, however, that the use of 5-µm grains of the thviolates the Hapke geometric optics model constraintsleast in the spectral region beyond 3 µm (see below); lagrains worsen the fit at these longer wavelengths by strenening the absorption of H2O ice and lowering the modereflectance at 3.4–3.5 µm.1
The H2O ice band at 1.6 µm is well fit by the Hapkmodel, and the temperature-sensitive 1.65-µm band ismatched with the 80 K ice used in the calculations, content withGrundy et al. (1999), who foundT = 81.6± 3.6 Kwith their spectrum matching technique (and the same H2Oice laboratory data). Neither the 1.3- nor the 2-µm ice bis well fit by our model, and the entire region betweenand 3 µm departs significantly from the Rhea spectrum.attribute this poor fit to the model parameters and/or the H2Oice optical constants, as the spectral data for Rhea appebe satisfactory in view of the good mutual agreement ofGrundy et al., the SpeX 2000, and the UKIRT data showFig. 1. We further note that the region 2.2–2.5 µm is ch
1 Piatek (2002, 2003)find that the scattering properties of small particdisagree strongly with predictions that they act as independent particles
dominantly forward scattering. Thus, for reasons not yet understood, theuse of particles of size comparable to the wavelength of the light in Hapketheory does not invalidate the results.Saturn’s icy satellites 273
t
o
acteristically difficult to fit with Hapke models and availaboptical constants, especially for relatively high-albedo sfaces.
The best-fit Shkuratov model, also shown inFig. 2, con-sists of an intimate mixture of three components. Comnent 1 consists of crystalline H2O ice (grain size 10 µmcontaining fine absorbing inclusions of Triton tholin in tamount of 0.23%. Component 2 is H2O ice (grain size500 µm) with inclusions of 0.23% of Triton tholin, and Component 3 is amorphous carbon (grain size> 10 µm). Thecomponents are mixed (at the molecular level) in the pportions 93.3%:6.0%:0.7%. A very similar fit is obtainwith an intimate mixture of Component 1= H2O (10 µmgrains) with 0.049% Titan tholin, Component 2= H2O(380 µm grains) with 0.049% Titan tholin, and Compnent 3=amorphous carbon (size> 10 µm), mixed in theproportions 92.4%:6.8%:0.8%. The tholin inclusions candistributed throughout the H2O ice particle or near the suface. This kind of mixing is called intraparticle or molecumixing (Poulet et al., 2002)in which the complex refractiveindices of the mixture are calculated by effective meditheory (e.g.,Bohren and Huffman, 1983; Wilson et al., 199Cuzzi and Estrada, 1998; see alsoCruikshank et al., 2003).In the Shkuratov modeling we usedg = 0.6, in accor-dance with the approximate calculated value for ice partishown inPoulet et al. (2002, Fig. 3), and the Rhea spectruwas fit using a simplex technique and 325 points uniformspaced throughout the spectrum.
Our models do not give uniquely good fits to the daother scattering parameters, other non-ice componentsother scattering theories might give improved fits. Also,number of significant figures in some of the modeling pameters suggests a degree of sensitivity of the fits to thethat is perhaps misleading. While the quality of fit of tpreferred models is in fact sensitive to these parametea high level of accuracy, the models themselves have mmore physical parameters that are not well known for mbodies in the Solar System. In addition, the complex reftive indices of the materials we use in the models are in scases uncertain by 30% or more. Once a set of refractivdices is selected and other parameters of particle scattare chosen, the calculated models are quite sensitive tabundances of the components, their grain sizes, andmixing geometry. Furthermore, in evaluating the “qualityfit” of a model to the data, a standard chi-squared technis used, tempered with visual inspection that accountsvariations in the quality of the observational data in diffent wavelength regions, and other uncertainties in aspecthe quality of the data that do not translate numerically tochi-squared analysis.
The Shkuratov model fits the spectral region 0.3–1.4very well, and reproduces the shape and level of the 2
ice band satisfactorily, although the 1.55-µm ice band is toodeep in the model. The strong H2O ice band at 3 µm is fitonly approximately.
/ Ica
raintesWeithfit
ularku-
fac-es,
gionalthain
0ngsaryInkerac-umrep-uric
n
re-fac-thetionr.
nygs
opay
etheci-
in-ye in-anic
In-oflsidlyas
eo-
lu-telypur-tionrals
any
el
f yetun-theromheling
in-
ku-eyboutm ofchedls;
andandIa-dort-ace)l re-
274 D.P. Cruikshank et al.
As in the case of the Hapke models, decreasing the gsize improves the fit beyond 3 µm, but similarly violathe geometric optics constraints of the Shkuratov model.also found in several tests that pure water ice mixed wtholins intimately or spatially does not yield a satisfactoryto the spectrum. The importance of the intra- or molecmixing of water ice and tholin (as noted above) in the Shratov models is thus corroborated (seePoulet et al., 2002).
Because we have been unable to find a fully satistory model using either the Hapke or Shkuratov codand because each of our best-fit models fails in the re∼ 2.3–2.9 µm, we explore the possibility that an additionabsorbing species might be present on Rhea. We notethis spectral region has been particularly difficult to fitother modeling attempts for other objects (e.g.,Calvin andClark, 1991; Davies et al., 1997; Buie and Grundy, 200).Owen et al. (2001)succeeded with the Hapke code in fittithe low-albedo hemisphere of Iapetus, but it was necesto violate the small-particle limit in the Hapke theory.Fig. 4 we show the ratio of data to the best-fitting Hapand Shkuratov models (data/model), revealing the chateristics of the lack-of-fit. In some regions of the spectr(1.12–1.15, 1.35–1.40, 1.82–1.90, and 2.5–2.6 µm) discancies can be attributed to incomplete cancellation of tellabsorption bands.
Grundy and Schmitt (1998)estimate that the error ithe absolute absorption coefficient in H2O ice in the re-gion of strong absorptions is several percent, while ingions of weak absorption the uncertainty could be ator of ∼ 2. We find the greatest discrepancy betweenmodels and Rhea in the region of the strongest absorpband (∼ 2.7–3.4 µm) in the wavelength interval we coveAbsorption in this and the other strong H2O ice bands isstrongly dependent on particle size (e.g.,Calvin and Clark,1991, Fig. 5), and a perfectly fitting model may require madifferent particle sizes in a variety of microphysical settinand ice grain configurations. Absorption attributed to H2O2at ∼ 3.4 µm has been reported in the spectrum of Eur(Carlson et al., 1999). Small amounts of this molecule ma
Fig. 4. Smoothed ratio of Rhea spectral data to the models inFig. 2.
rus 175 (2005) 268–283
t
be produced in the H2O ice by irradiation. A quantitativeevaluation of possible H2O2 absorption on Rhea and thother satellites of Saturn awaits the Cassini mission andacquisition of spatially resolved spectra of high signal presion.
It does not seem that the imperfect fits arise fromcorrect absorption coefficients in H2O ice. The discrepancbetween the models and the spectrum of Rhea might bterpreted as a broad absorption band characteristic of orgsolids different from the tholin we used in the model.spection of the reflectance spectra of four tholins in Fig. 2Cruikshank et al. (1991)shows that none of these materiasatisfies the condition that the reflectance must rise raplongward of∼ 3.2 µm, and there are other discrepancieswell. Among several minerals examined in the U.S. Glogical Survey on-line spectral database(Clark et al., 1993),kaolinite (aluminum-bearing clay) and beryl (beryllium aminum silicate) have absorption bands with approximathe correct shape between 2.3 and 3 µm. We do notsue this matter further here because of the weak foundafor the existence of such a band on Rhea. Silicate minenormally present strong Fe2+ and Fe3+ absorptions in the0.9–1.1 µm region, but we see no evidence for these inof the satellite spectra.
While we might speculate that the misfit of the modcould arise from the effects of a multiplicity of H2O iceparticle sizes and shapes on Rhea, or the presence ounidentified additional absorbers, we leave the matterresolved at this time. When spectra of Rhea and the osatellites with high spatial resolution become available frthe Visual-Infrared Mapping Spectrometer (VIMS) on tCassini spacecraft, all the issues connected with modewill be reopened.
2.2. The role of tholin in the models
In both the Hapke and Shkuratov models of Rhea, wecluded a small quantity of tholin with the H2O ice; as notedabove, it was included as an inclusion in the ice in the Shratov models. The role of the tholins is two-fold. First, thprovide the absorption in the spectrum that begins at a0.7 µm and increases toward the ultraviolet. The spectruRhea in this region has a curved shape that is not matby any of the other materials that we tried in our modethose materials included the igneous minerals olivinepyroxene, HCN polymer, and the meteorites AllendeMurchison. In models of the low-albedo hemisphere ofpetus,Owen et al. (2001)found that a tholin was needeto provide the strong red color in the spectral region shward of 1 µm, and in models of the very red colored surfof Centaur objects 5145 Pholus,Cruikshank et al. (1998cfound that a tholin was required to fit the same spectragion.
Second, tholins have relatively high reflectance longwardof ∼ 3.2 µm, and they therefore quench the very strong ab-sorption of H2O ice in this spectral region. This effect of
Infrared spectroscopy of Saturn’s icy satellites 275
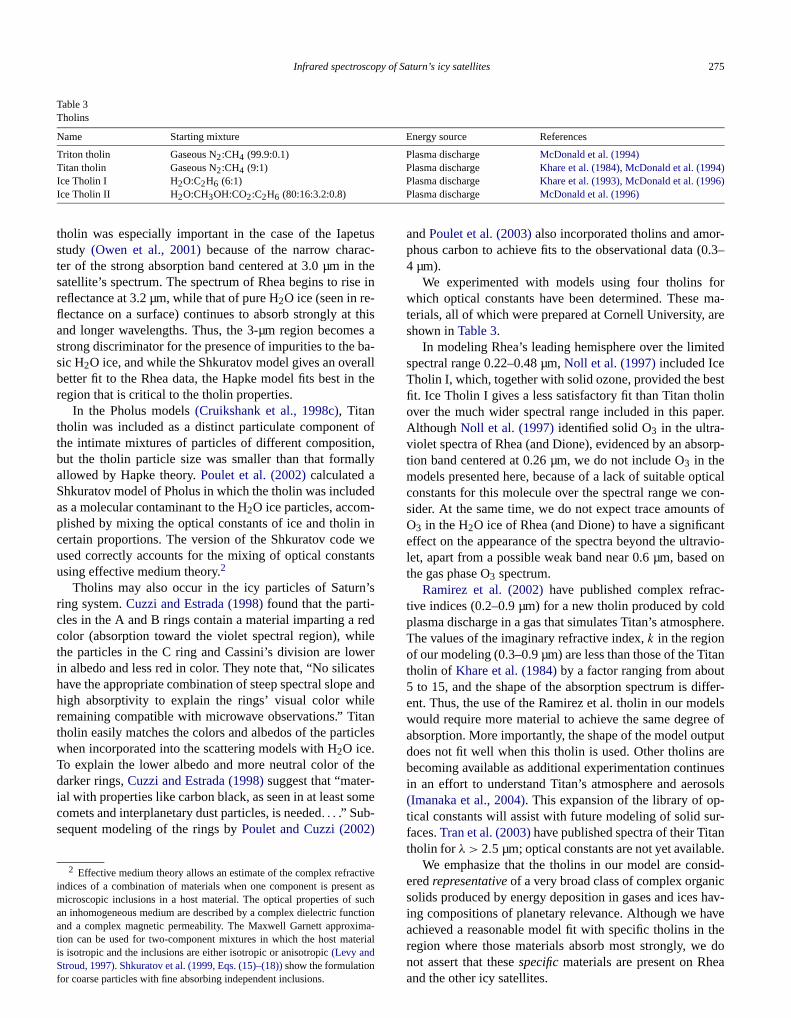
Table 3Tholins
Name Starting mixture Energy source References
Triton tholin Gaseous N2:CH4 (99.9:0.1) Plasma discharge McDonald et al. (1994)Titan tholin Gaseous N:CH (9:1) Plasma discharge Khare et al. (1984), McDonald et al. (1994)
2 4tusc-the
e in-thises aba-rallthe
t ofn,lly
ed-inwents
n’s
redileertesand
leanicles
the-ome
)
tivent asuchctionma-erial
r-0.3–
forma-
are
ted
estlinper.
orp-
ticalcon-ts ofntvio-d on
c-oldhere.
itantffer-else oftputareuessols-
ur-nle.sid-ichav-avethe
Ice Tholin I H2O:C2H6 (6:1)Ice Tholin II H2O:CH3OH:CO2:C2H6 (80:16:3.2:0.8)
tholin was especially important in the case of the Iapestudy (Owen et al., 2001)because of the narrow charater of the strong absorption band centered at 3.0 µm insatellite’s spectrum. The spectrum of Rhea begins to risreflectance at 3.2 µm, while that of pure H2O ice (seen in reflectance on a surface) continues to absorb strongly atand longer wavelengths. Thus, the 3-µm region becomstrong discriminator for the presence of impurities to thesic H2O ice, and while the Shkuratov model gives an ovebetter fit to the Rhea data, the Hapke model fits best inregion that is critical to the tholin properties.
In the Pholus models(Cruikshank et al., 1998c), Titantholin was included as a distinct particulate componenthe intimate mixtures of particles of different compositiobut the tholin particle size was smaller than that formaallowed by Hapke theory.Poulet et al. (2002)calculated aShkuratov model of Pholus in which the tholin was includas a molecular contaminant to the H2O ice particles, accomplished by mixing the optical constants of ice and tholincertain proportions. The version of the Shkuratov codeused correctly accounts for the mixing of optical constausing effective medium theory.2
Tholins may also occur in the icy particles of Saturring system.Cuzzi and Estrada (1998)found that the parti-cles in the A and B rings contain a material imparting acolor (absorption toward the violet spectral region), whthe particles in the C ring and Cassini’s division are lowin albedo and less red in color. They note that, “No silicahave the appropriate combination of steep spectral slopehigh absorptivity to explain the rings’ visual color whiremaining compatible with microwave observations.” Tittholin easily matches the colors and albedos of the partwhen incorporated into the scattering models with H2O ice.To explain the lower albedo and more neutral color ofdarker rings,Cuzzi and Estrada (1998)suggest that “material with properties like carbon black, as seen in at least scomets and interplanetary dust particles, is needed. . . .” Sub-sequent modeling of the rings byPoulet and Cuzzi (2002
2 Effective medium theory allows an estimate of the complex refracindices of a combination of materials when one component is presemicroscopic inclusions in a host material. The optical properties of san inhomogeneous medium are described by a complex dielectric funand a complex magnetic permeability. The Maxwell Garnett approxition can be used for two-component mixtures in which the host mat
is isotropic and the inclusions are either isotropic or anisotropic(Levy andStroud, 1997). Shkuratov et al. (1999, Eqs. (15)–(18))show the formulationfor coarse particles with fine absorbing independent inclusions.Plasma discharge Khare et al. (1993), McDonald et al. (1996)Plasma discharge McDonald et al. (1996)
andPoulet et al. (2003)also incorporated tholins and amophous carbon to achieve fits to the observational data (4 µm).
We experimented with models using four tholinswhich optical constants have been determined. Theseterials, all of which were prepared at Cornell University,shown inTable 3.
In modeling Rhea’s leading hemisphere over the limispectral range 0.22–0.48 µm,Noll et al. (1997)included IceTholin I, which, together with solid ozone, provided the bfit. Ice Tholin I gives a less satisfactory fit than Titan thoover the much wider spectral range included in this paAlthoughNoll et al. (1997)identified solid O3 in the ultra-violet spectra of Rhea (and Dione), evidenced by an abstion band centered at 0.26 µm, we do not include O3 in themodels presented here, because of a lack of suitable opconstants for this molecule over the spectral range wesider. At the same time, we do not expect trace amounO3 in the H2O ice of Rhea (and Dione) to have a significaeffect on the appearance of the spectra beyond the ultralet, apart from a possible weak band near 0.6 µm, basethe gas phase O3 spectrum.
Ramirez et al. (2002)have published complex refrative indices (0.2–0.9 µm) for a new tholin produced by cplasma discharge in a gas that simulates Titan’s atmospThe values of the imaginary refractive index,k in the regionof our modeling (0.3–0.9 µm) are less than those of the Ttholin of Khare et al. (1984)by a factor ranging from abou5 to 15, and the shape of the absorption spectrum is dient. Thus, the use of the Ramirez et al. tholin in our modwould require more material to achieve the same degreabsorption. More importantly, the shape of the model oudoes not fit well when this tholin is used. Other tholinsbecoming available as additional experimentation continin an effort to understand Titan’s atmosphere and aero(Imanaka et al., 2004). This expansion of the library of optical constants will assist with future modeling of solid sfaces.Tran et al. (2003)have published spectra of their Titatholin for λ > 2.5 µm; optical constants are not yet availab
We emphasize that the tholins in our model are coneredrepresentativeof a very broad class of complex organsolids produced by energy deposition in gases and icesing compositions of planetary relevance. Although we hachieved a reasonable model fit with specific tholins in
region where those materials absorb most strongly, we donot assert that thesespecificmaterials are present on Rheaand the other icy satellites.
/ Ica
trar adhavevant;
-ere;s
rnia
pecturescalem
se o
torsts,
cal-ticade-
codepke
ed inif-ls o. Forthe
res
f thede-
and
formit
ns
rp-o se
odeldcor-d
odel
um.
mfor
a as
de-
oft
276 D.P. Cruikshank et al.
2.3. Search for other absorbing species
The high quality and spectral resolution of the specpresented here allow us to make meaningful searches foditional absorbing species among the several ices thatbeen observed in the laboratory under conditions releto the satellites of the outer planets (e.g.,Bohn et al., 1994Schmitt et al., 1998). The fact that ices occur in various complex combinations is clear from the cases of Triton, whfive different ices are found(Cruikshank et al., 1993, 2000Quirico et al., 1999), and Pluto, where four different iceare seen(Owen et al., 1993; Douté et al., 1999). We havesearched our spectra of Rhea and the other large satusatellites for species other than H2O ice, with the resultsgiven below. We emphasize that these results pertain to stra of an entire hemisphere of a given satellite, and that fuspectra of regions on these bodies at a smaller spatialmay reveal absorbing species that cannot be seen at hspheric scales because of spectral dilution, as in the cathe satellites of Jupiter (e.g.,McCord et al., 1998). Further-more, the detection sensitivity depends upon several facincluding the nature of the mixing with other componenparticle size, scattering phase functions, etc.
To search for other constituents in the spectra, weculated synthetic spectra using the Hapke code and opconstants for the relevant materials. The upper limits werive are dependent to varying degrees on the modelingused, and we cite the example of the comparison of Haand Shkuratov models of Centaur 5145 Pholus presentPoulet et al. (2002). The two codes give considerably dferent abundances of the same components in modethe Pholus spectrum having comparable goodness of fitconsistency, we use a single code (Hapke) in modelingupper limits presented here.
2.3.1. CO2
To search for the three narrow bands of CO2 ice at 1.97,2.01, and 2.06 µm, we calculated synthetic spectra at theolution of our satellite data, using a basic H2O ice intimatemixture Hapke scattering model. We then added CO2 in var-ious amounts and grain sizes to establish the strength obands and estimate the minimum amount that could betected at the level of signal precision of our data for Rheathe other satellites.Figure 5shows a model with 25% CO2and three different grain sizes, with the spectrum of Rheacomparison. From intimate mixture models, the upper lifor CO2 on Rhea for 5 µm grains is∼ 2 weight percent, for50 µm grains∼ 5 weight percent, and for 500 µm grai∼ 20 weight percent.
2.3.2. CH4
The spectrum of methane ice is rich with strong absotion bands in the K-region. We have used these bands t
an upper limit to the amount of methane ice by progressivelyadding CH4 to a Hapke model that otherwise matches theH2O absorption spectrum of Rhea.Figure 6shows three dif-rus 175 (2005) 268–283
-
n
-
ei-f
,
l
f
-
t
Fig. 5. A segment of the spectrum of Rhea (bottom trace), and three mspectra with 25% CO2 ice in three different grain sizes, intimately mixewith H2O ice. The increasing albedo with decreasing particle size isrectly shown in this graph. The CO2 bands occur at 1.966, 2.012, an2.070 µm.
Fig. 6. A segment of the spectrum of Rhea (bottom trace), and three mspectra with different amounts of CH4 ice mixed with H2O ice. The traceswith CH4 absorption bands are vertically offset from the Rhea spectrThe principal CH4 absorption bands occur at 2.21, 2.32, and 2.38 µm.
ferent amounts of CH4 ice in the model, and the spectruof Rhea. From intimate mixture models, the upper limitCH4 ice on Rhea for both 5 and 50 µm grains is∼ 2 weightpercent.
2.3.3. NH3 and ammonium compoundsThe presence on any of Saturn’s satellites of ammoni
a pure ice, as a hydrate with H2O ice, or as frozen NH4OH,would be of special interest, primarily because ammoniapresses the freezing temperature of H2O. Brown and Calvin(2000), for example, have reported a possible detectionammonia ice (NH3 or NH3•2H2O) on Charon to accounfor an absorption band at 2.2 µm.Bauer et al. (2002)suggest
that NH3•H2O might give rise to a feature at∼ 2.2 µm in thespectrum of the uranian satellite Miranda. Because images ofsome of Saturn’s satellites show surface regions suggestive
py of
onia
also the
and
iting0,m-ab-thingths
m.,f
µmve-sionl-ion
with
ions
ahea,
re-
rticleapescethe
d by
pec-niauld
thatuse
ceges
it-
Infrared spectrosco
Table 4Absorption bands of ammonia ice, ammonium hydroxide, and ammhydrate
Wavelengthµm
Frequencycm−1
Absorptioncoefficient cm−1
NH3 icea 2.005 4988 4502.237 4470 9102.247 4450 3902.964 3374 450002.962 3368 220002.970 3367 270003.101 3225 800
NH3 hydrateb 1.983 5044 1201.994 5014 2152.209 4526 802.220 4505 95
NH3 hydratec 2.950 3390 Not available3.001 3332 “3.032 3298 “3.115 3210 “3.431 2915 “
NH3 hydrated 1.993 5107 “2.210 4524 “
NH4OHe 1.04 9615 “1.22 8197 “1.30 7692 “1.53 6536 “1.63 6135 “1.99 5025 “2.21 4525 “
a Sill et al. (1980). b Schmitt et al. (1998). c Sill et al. (1981).d S. Sandford (this paper).e Brown et al. (1988).
of the relatively recent flow of fluids, the issue of materiand sources arises. We have given particular attention tdetection of solid NH3, NH3 hydrate, and NH4OH on thesatellites because they have distinguishing absorption bin the spectral region covered by our data.
We prepared an ammonia hydrate ice by co-deposH2O and NH3 in various relative concentrations at 10, 7and 90 K, and then warming the ice film to various teperatures up to 150 K. The most prominent and usefulsorption bands were found in transmission spectra offilms at 1.993 and 2.210 µm. Bands at the same wavelenwere also seen in an ammonia hydrate examined bySchmittet al. (1998); they are clearly different in wavelength fropure NH3 bands (e.g.,Slobodkin et al., 1978; Sill et al1980, 1981; Schmitt et al., 1998). In reflectance spectra ogranulated, frozen NH4OH, Brown et al. (1988)found sev-eral absorption bands, including those at 1.99 and 2.21(the spectra were relatively low resolution, and the walengths could not be determined with any greater precithan three significant figures).Table 4summarizes the avaiable information on ammonia ices in the wavelength regof relevance in the present work.
Figure 7 presents the 1.3–2.4 µm spectrum of Rheaand three Hapke models in which the optical constants ofNH4OH ice (1% NH4OH in H2O) have been substituted for
Saturn’s icy satellites 277
s
Fig. 7. A section of the spectrum of Rhea and a model calculatedNH4OH (1 percent solution) ice instead of H2O ice. Vertical lines at1.99 and 2.21 µm indicate the positions of the two principal absorptof NH4OH. Model a is an intimate mixture of 95% NH4OH + 5% IceTholin II, all in 5 µm grains. Modelc is an intimate mixture of 49.85%NH4OH (120 µm grains)+ 49.85% NH4OH (480 µm grains)+ 0.3% IceTholin II (5 µm grains). Modelb, which gives a good overall fit to the Rhespectrum, but shows the additional feature (2.21 µm) not present on Ris a spatial mixture of 50% each of modelsa andc.
those of pure H2O ice. The optical constants (Fig. 3) for theNH4OH ice were derived (by T. Roush) from laboratoryflectance spectra published byBrown et al. (1988). The firststep of the procedure was to estimate the sample pasize from the lab spectra by matching the depths and shof the measured H2O bands with Hapke models of pure i(80 K). With a value for the characteristic particle size,values of the refractive indicesn andk across the spectrumwere then calculated using Hapke theory, as describeClark and Roush (1984)andLucey (1998).
There is no evidence for any absorption bands in the strum of Rhea or the other satellites attributable to ammoin any of its forms. We estimate that the 2.21-µm band wobe visible in the presence of� 0.5 weight percent NH3 inwater ice as a hydrate or as frozen NH4OH on any of thesatellites.
2.3.4. Other moleculesThe magnetosphere of Saturn contains plasma ions
impact the rings and satellites, carrying the potential to cachemical changes in their surface materials. Ions of N+ andN+
2 originating from Titan and implanted into the surfaices of the large satellites should induce chemical chanresulting in many combinations of N, H, and O(Delitsky andLane, 2002). With the list of expected species from Del
sky and Lane, plus the spectra of various ices presented byQuirico and Schmitt (1997), we have searched for variouspossible constituents of the surface of Rhea. From a qualita-
/ Ica
dataheed anto
ncee of
f the
ofex-to
ilar,datadtheachngth
d Ks
,ugh
no-duathe
cenre-
998.
in thea fork.
he98;
rp-
inghors.ella-
ead forstentheterf
low
caleee7ing
ser-f
ithingding
278 D.P. Cruikshank et al.
Fig. 8. Spectra of Tethys, Hyperion, and Phoebe, using UKIRT CGS4for 1994–1998 (Table 1). The data for Tethys extend to 3.05 µm,while tothers terminate at 2.55 µm. The Phoebe spectrum has been describmodeled byOwen et al. (1999), and is included here to show its contrastthe spectra of the other objects.
tive comparison of the published spectra we find no evidefor any spectral features that might indicate the presencSO2, NO2, HC3N, C2H2, C2H4, C2H6, or C3H8 in our hemi-spherically averaged spectrum of Rhea or in spectra osatellites discussed below.
3. Other icy satellites
In this section we discuss our near-infrared spectraseveral other satellites, but we do not model each oneplicitly. These objects vary in geometric albedo from onethe other (e.g.,Buratti et al., 1998, Table 3), but their glob-ally averaged, near-infrared spectra are remarkably simwith some interesting exceptions discussed below. Thepresented inFigs. 8 and 9were obtained with the UKIRT anthe CGS4 spectrometer in 1994–1996 when the view ofSaturn system was nearly in Saturn’s equatorial plane. Espectrum has been assembled from two or three wavelesegments observed separately (seeTable 1), and scaled to thecorrect geometric albedo using photometry in the H anbands (Appendix A). When viewed in this way, differenceand similarities among the spectra become apparent.
All of the satellite spectra inFigs. 8 and 9show thecharacteristic absorption bands of H2O ice at 1.5, 1.65, 2.0and 2.5 µm (and some show the 1.25-µm band), althothere are differences from object to object that merittice and comment. In some of the spectra there is resinoise around 1.88 µm due to incomplete cancellation ofeffects of telluric atmospheric H2O vapor. Associated withthe incomplete cancellation, anomalous slopes in adjawavelength regions may have been introduced into the
duced spectra, a point to which we return below. The sym-metrical absorption centered at 1.65 µm seen in the spectraof all the satellites is particularly diagnostic of the hexag-rus 175 (2005) 268–283
d
l
t
Fig. 9. Spectra of Rhea and Dione, using UKIRT CGS4 data for 1994–1The inset shows the region of the Fresnel peak in H2O ice, smoothed andplotted on an expanded scale. Because of a presumed inaccuracyoriginal wavelength scale derived for the Dione observation, the datthis satellite in the inset were offset by+0.017 µm to bring the Fresnel peainto agreement with its correct position as shown in the Rhea spectrum
onal phase of H2O ice, as well as the temperature of tice (Fink and Larson, 1975; Grundy and Schmitt, 19Grundy et al., 1999).
We note that there is no indication of the 1.85 µm absotion reported byClark et al. (1984)in the trailing hemisphereof Tethys, and weakly visible in the spectra of the leadhemisphere of Rhea and Dione published by those autThis feature may have been caused by incomplete canction of telluric absorptions, asClark et al. (1984)anticipated.
Figure 9shows the 3-µm region of the spectra of Rhand Dione, with the Fresnel peak enlarged and smoothecomparison. The weaker Fresnel peak on Dione is consiwith the overall lower albedos, which may arise from tpresence of material of low albedos mixed with the waice. Owen et al. (2001)showed that the intimate mixture ogreater than about 10% of minerals or other material ofalbedos suppresses the strength of the Fresnel peak.
The region 1.9–2.5 µm is shown on an expanded sin Fig. 10. Many molecules of planetary relevance (sFigs. 4–6; Bohn et al., 1994; Quirico and Schmitt, 199)have absorption bands in this spectral interval, thus givit special significance. The quality of the data inFig. 10andthe lack of discernible absorption bands support our astion that no ices other than H2O are visible in the spectra othe five satellites shown.
3.1. Mimas
In Fig. 11we show two spectra of Mimas obtained wIRTF/SpeX. The spectrum from 2001 shows the trailhemisphere, while the 2003 spectrum is largely the leahemisphere. The albedo scale is set at 0.73± 0.03 at 0.9 µm
from theBuratti et al. (1998)analysis of Voyager photome-try of Mimas’ trailing hemisphere; the lower trace inFig. 11is offset in geometric albedo by−0.2 for clarity. The Buratti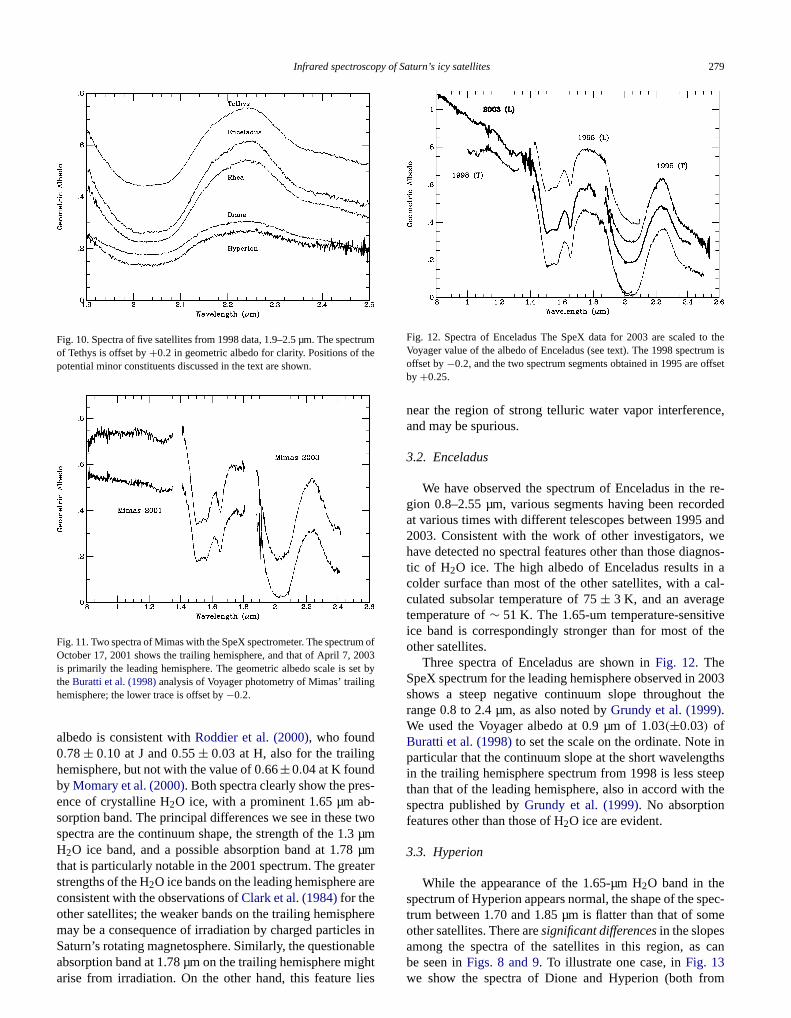
py of
trume
m of003et byg
s--two
3 µmµm
aterare
heres in
o theum isffset
ce,
re-rdedandwegnos-n acal-eivethe
003the
ingthsteepthe
pec-me
Infrared spectrosco
Fig. 10. Spectra of five satellites from 1998 data, 1.9–2.5 µm. The specof Tethys is offset by+0.2 in geometric albedo for clarity. Positions of thpotential minor constituents discussed in the text are shown.
Fig. 11. Two spectra of Mimas with the SpeX spectrometer. The spectruOctober 17, 2001 shows the trailing hemisphere, and that of April 7, 2is primarily the leading hemisphere. The geometric albedo scale is stheBuratti et al. (1998)analysis of Voyager photometry of Mimas’ trailinhemisphere; the lower trace is offset by−0.2.
albedo is consistent withRoddier et al. (2000), who found0.78± 0.10 at J and 0.55± 0.03 at H, also for the trailinghemisphere, but not with the value of 0.66±0.04 at K foundby Momary et al. (2000). Both spectra clearly show the preence of crystalline H2O ice, with a prominent 1.65 µm absorption band. The principal differences we see in thesespectra are the continuum shape, the strength of the 1.H2O ice band, and a possible absorption band at 1.78that is particularly notable in the 2001 spectrum. The grestrengths of the H2O ice bands on the leading hemisphereconsistent with the observations ofClark et al. (1984)for theother satellites; the weaker bands on the trailing hemispmay be a consequence of irradiation by charged particle
Saturn’s rotating magnetosphere. Similarly, the questionableabsorption band at 1.78 µm on the trailing hemisphere mightarise from irradiation. On the other hand, this feature liesSaturn’s icy satellites 279
Fig. 12. Spectra of Enceladus The SpeX data for 2003 are scaled tVoyager value of the albedo of Enceladus (see text). The 1998 spectroffset by−0.2, and the two spectrum segments obtained in 1995 are oby +0.25.
near the region of strong telluric water vapor interferenand may be spurious.
3.2. Enceladus
We have observed the spectrum of Enceladus in thegion 0.8–2.55 µm, various segments having been recoat various times with different telescopes between 19952003. Consistent with the work of other investigators,have detected no spectral features other than those diatic of H2O ice. The high albedo of Enceladus results icolder surface than most of the other satellites, with aculated subsolar temperature of 75± 3 K, and an averagtemperature of∼ 51 K. The 1.65-um temperature-sensitice band is correspondingly stronger than for most ofother satellites.
Three spectra of Enceladus are shown inFig. 12. TheSpeX spectrum for the leading hemisphere observed in 2shows a steep negative continuum slope throughoutrange 0.8 to 2.4 µm, as also noted byGrundy et al. (1999).We used the Voyager albedo at 0.9 µm of 1.03(±0.03) ofBuratti et al. (1998)to set the scale on the ordinate. Noteparticular that the continuum slope at the short wavelenin the trailing hemisphere spectrum from 1998 is less sthan that of the leading hemisphere, also in accord withspectra published byGrundy et al. (1999). No absorptionfeatures other than those of H2O ice are evident.
3.3. Hyperion
While the appearance of the 1.65-µm H2O band in thespectrum of Hyperion appears normal, the shape of the strum between 1.70 and 1.85 µm is flatter than that of soother satellites. There aresignificant differencesin the slopes
among the spectra of the satellites in this region, as canbe seen inFigs. 8 and 9. To illustrate one case, inFig. 13we show the spectra of Dione and Hyperion (both from
/ Ica
thetherp-
to ansur-, buµm.
ong
emtionnes
;bean
ibil-nsH
tionnceatel-rvedthe
n.
son-
we
ce-tral
hysonepec-atovive.lpec-
µm.
ithse of
ialings,risbeole-n,eticow
therof
cen-
p-
fornerk.inThe
ointandOren-
rtedso-on
280 D.P. Cruikshank et al.
1995 September 9), normalized to give a good match in1.55 µm band. The ratio of Hyperion to Dione showsnature of the difference, possibly defining additional absotion in the Hyperion spectrum, centered at 1.75 µm.
The difference appears to be real, and may be relatedabsorption band in some unidentified component of thefaces of the satellites. Methane ice absorbs in this regionis ruled out by the lack of stronger bands at 2.2 and 2.3Some of the tholins listed inTable 3have minor absorptionbands near this region(Cruikshank et al., 1991, Fig. 2), butare probably too weak to account for the differences amthe satellites. Reference to the plot (Fig. 3) of the imagi-nary refractive index,k, of the two tholins we used will showthat there is no significant absorption in either one of that 1.8 µm. Solid hydrocarbon complexes have combinaand overtone bands in this region, with the first overtoand combinations of –CH2 and –CH3 occurring in the 1.69–1.76 µm region in terrestrial bitumins(Cloutis et al., 1994Moroz et al., 1998). Complex hydrocarbons may indeedpresent on Hyperion, contributing to its lower albedo thmost of Saturn’s other icy satellites. The test of this possity will come with the VIMS data from the Cassini–Huygemission, which will cover the 3.4 µm region where the –C2and –CH3 stretching mode fundamentals occur.
The absorption coefficients for hexagonal H2O ice in thetemperature range 70–120 K shown byGrundy and Schmit(1998, Fig. 2)show differences in the slope of the absorptprofile in the spectral region in question, but the differein temperatures of Hyperion and Dione, and the other slites presented here, are probably too small for the obseslope variations to be a temperature effect. This region inspectra of Saturn’s satellites requires further investigatio
3.4. Tethys and Dione
Our spectra shown inFigs. 8–10do not show any featureexcept H2O ice absorption bands, and appear to be fully csistent with the spectra ofGrundy et al. (1999). Because theyare not obviously spectrally distinguished in other ways,do not discuss them further.
4. Summary and conclusions
We have observed Saturn’s icy satellites Mimas, Enladus, Tethys, Dione, Rhea, and Hyperion in the specregion 0.8–2.5 µm, with data extending to 3.05 µm for Tetand to 3.6 µm for Rhea (leading hemisphere) and Di(trailing hemisphere). We have modeled the composite strum of Rhea, 0.3–3.6 µm, using the Hapke and Shkurcodes, finding that a fit to the entire spectrum is elusWhile crystalline (hexagonal) H2O ice is the fundamentasurface constituent, the absorption in the photovisual s
tral region (0.3–1 µm) requires an additional component. Wefind that the addition of a very small quantity of a complexorganic solid in the form of tholin provides the color in therus 175 (2005) 268–283
t
Fig. 13. (Top) Spectra of Dione and Hyperion (1995), normalized at 1.6(Bottom) Ratio of Hyperion to Dione.
ultraviolet and photovisual regions, and is consistent wthe appearance of the remainder of the spectrum. Our utholin in this regard is consistent with the results ofCuzziand Estrada (1998), Poulet and Cuzzi (2002), andPoulet etal. (2003)in their models of Saturn’s rings. Organic materin the icy surfaces of Rhea, the other satellites, and the rmight originate from the infall of micrometeoroids (debfrom comets or collisions in the Kuiper belt), or mightgenerated within the icy surfaces by the interaction of mcular impurities in the ice with solar ultraviolet radiatiocosmic rays, or atomic particles trapped in Saturn’s magnfield. The leading and trailing hemispheres of Mimas shthe 1.65 µm absorption band indicative of crystalline H2Oice. We find no absorption bands attributable to ices othan H2O on any of the satellites, although the spectrumHyperion shows a broad, unidentified absorption bandtered at 1.75 µm.
Acknowledgments
We thank Dr. Will Grundy and his colleagues for suplying his spectra of the Saturn satellites(Grundy et al.,1999) in advance of publication, and Dr. Paul Estradaa discussion of effective medium theory. Ms. Mary JaBartholomew contributed to an early phase of this woWe thank the support staff of UKIRT for its assistanceaccomplishing some of the observations reported here.United Kingdom Infrared Telescope is operated by the JAstronomy Centre on behalf of the U.K. Particle PhysicsAstronomy Research Council. Cruikshank and Dalleacknowledge partial support by NASA’s Planetary Astroomy program (RTOP 344-32-20-01). Geballe is suppoby the Gemini Observatory, which is operated by the Asciation of Universities for Research in Astronomy, Inc.,
behalf of the international Gemini partnership of Argentina,Australia, Brazil, Canada, Chile, the United Kingdom, andthe United States of America. Roush acknowledges support
py of
m.red
as-ts ofopeng-
esr-
tel-rved
998).the
ck-e of
f theto
the
andasesola
on-dataherens,
ured
u-thatdidtoetri
lter-a-st
nessons ofolu-
tes
kseg-om,
ec-
cca,of
.R.,itionron.
ea,
94.satu-
t by
ular
m-
.N.,62–
of
s of
.G.,ring
al-
ce of
ativephys.
atel-and
tural. of
.,0.2340
rop-
Infrared spectrosco
from NASA’s Planetary Geology and Geophysics prograWe thank the management and staff of the NASA InfraTelescope Facility for their support of this work.
Appendix A. Determination of spectral geometricalbedos of the Saturn satellites
As noted in the text, the spectra reported here weresembled by piecing together data obtained in incremenspectral coverage that varied with instrument and telescand with time. The CGS4 spectrometer on the United Kidom Infrared Telescope, for example, was at different timconfigured with a variety of gratings with different dispesions and camera optics with different focal lengths.
Preceding or following each spectrum of one of the salites, a solar-type star, or near solar-type star was obseat the same or very similar (within∼ 0.1) airmass. Typi-cal near-solar type stars included BS 6836 (G0V), BS 6(G4V), BS 88 (G2V), BS 582 (G2IV), and BS 7994 (G1VThe measured spectrum of the satellite was divided bystellar spectrum and then multiplied by the flux of a blabody at a temperature corresponding to the spectral typthe standard star. This produced the measured flux osatellite in standard flux units. To convert these flux unitsgeometric albedo, we divided the flux of the satellite byflux of the Sun given byColina et al. (1996)(λ � 2.5 µm) orSmith and Gottlieb (1974)(λ > 2.5 µm) and then multipliedby the quantityR2 ∗ D2/r2, whereR andD are the helio-centric and geocentric distances of Saturn, respectively,r is the radius of the satellite. No corrections for solar phangle were made; all observations were made at smallphase angles.
This method of calculating geometric albedo relies upthe assumption thatall of the light from the satellite is included in the measurement. However, because all of thewere obtained with spectrometers using entrance slits, tis typically some loss of light because of seeing fluctuatioimage drift, etc.; all such effects tend to reduce the measflux and result in a lower calculated value for the albedo.
In view of this limitation on the geometric albedo calclation across the full spectrum, and because we foundsome of the segments of the spectrum of a given satellitenot overlap (in geometric albedo) perfectly, we electedassemble the spectral segments by reference to photomdeterminations of the geometric albedo at standard fiband wavelengths (e.g., UBVRIJHK), where such informtion is available. An additional important factor is that moof the objects observed here show asymmetries in brightwith their position in their orbits because of variationstheir surfaces. Hyperion presents the additional variablean irregular shape and a non-synchronous (chaotic) rev
tion/rotation. Where we show the spectra of Hyperion in thispaper, we accept the observed flux and make no further cor-rections.Saturn’s icy satellites 281
,
r
c
Corrections for the lightcurve variations of the satelliwere made using the Earth-based data ofBlair and Owen(1974), Noland et al. (1974), Franz and Millis (1975), andVerbiscer and Veverka (1989). The photometric frameworfor adjustment of the geometric albedo of each observedment of the spectrum of a given satellite was derived frdata given in the above references, plusCruikshank (19791980), Clark et al. (1984), Degewij et al. (1980), Buratti et al.(1998), andMomary et al. (2000), while therelativealbedolevels at various wavelengths were in part derived from sptra byGrundy et al. (1999).
References
Bauer, J.M., Roush, T.L., Geballe, T.R., Meech, K.J., Owen, T.C., VaW.D., Rayner, J.T., Jim, K.T.C., 2002. The near infrared spectrumMiranda. Icarus 158, 178–190.
Benedix, G.K., Roush, T.L., Owen, T.C., Cruikshank, D.P., Geballe, TDalle Ore, C.M., Khare, B.N., de Bergh, C., 1998. Surface composmodels of the leading surfaces of Rhea and Dione. Bull. Am. AstSoc. 30, 1101. Abstract.
Blair, G.N., Owen, F.N., 1974. The UBV orbital phase curves of RhDione, and Tethys. Icarus 22, 224–229.
Bohn, R.B., Sandford, S.A., Allamandola, L.A., Cruikshank, D.P., 19Infrared spectroscopy of Triton and Pluto ice analogs: the case forrated hydrocarbons. Icarus 111, 151–173.
Bohren, C.F., Huffman, D.R., 1983. Absorption and Scattering of LighSmall Particles. Wiley, New York.
Brown, M.E., 2000. Near-infrared spectroscopy of Centaurs and irregsatellites. Astron. J. 119, 977–983.
Brown, M.E., Calvin, W.M., 2000. Evidence for crystalline water and amonia ices on Pluto’s satellite Charon. Science 287, 107–109.
Brown, R.H., Cruikshank, D.P., Tokunaga, A.T., Smith, R.G., Clark, R1988. Search for volatiles on icy satellites. I. Europa. Icarus 74, 2271.
Buie, M.W., Grundy, W.M., 2000. The distribution and physical stateH2O on Charon. Icarus 148, 324–339.
Buratti, B.J., Mosher, J.A., Johnson, T.V., 1990. Albedo and color mapthe saturnian satellites. Icarus 87, 339–357.
Buratti, B.J., Mosher, J.A., Nicholson, P.D., McGhee, C.A., French, R1998. Near-infrared photometry of the saturnian satellites duringplane crossing. Icarus 136, 223–231.
Calvin, W.M., Clark, R.N., 1991. Modeling the reflectance spectrum of Clisto 0.25–4.1 µm. Icarus 89, 305–317.
Carlson, R.W., 13 colleagues, 1999. Hydrogen peroxide on the surfaEuropa. Science 283, 2062–2064.
Clark, R.N., Roush, T.L., 1984. Reflectance spectroscopy—quantitanalysis techniques for remote sensing applications. J. GeoRes. 89, 6329–6340.
Clark, R.N., Brown, R.H., Owensby, P.D., Steele, A., 1984. Saturn’s slites: near-infrared spectrophotometry (0.65–2.5 µm) of the leadingtrailing sides and compositional implications. Icarus 58, 265–281.
Clark, R.N., Fanale, F.P., Gaffey, M.J., 1986. Surface composition of nasatellites. In: Burns, J.A., Matthews, M.S. (Eds.), Satellites. UnivArizona Press, Tucson, pp. 437–491.
Clark, R.N., Swayze, G.A., Gallagher, A.J., King, T.V.V., Calvin, W.M1993. U.S. Geological Survey, Digital Spectral Library: Version 1:to 3.0 microns. U.S. Geological Survey Open File Report 93-592, 1pages,http://speclab.cr.usgs.gov.
Cloutis, E.A., Gaffey, M.J., Moslow, T.F., 1994. Spectral reflectance perties of carbon-bearing materials. Icarus 107, 276–287.
Colina, L., Bohlin, R.C., Castelli, F., 1996. The 0.12–2.5 µm absolute fluxdistribution of the Sun for comparison with solar analog stars. Astron.J. 112, 307–315.
/ Ica
turn.
and
urn:niv.
wn,
, C.,face
w,. In:wer
C.,In:
wer
dle-gh,re,135,
E.,M.,6.ling. R.
ings
.L.,romAb-
alle,met
col-re-
try, 3-1–
rgh,ation
r-iceede,
ens,
ctrahea,
ce-
rared3,
Geo-
pec-ical
niv.
uik-ex-res:in
ms,mu-ies.
awa,tants
tron.
le-
ofRev.
py-713.
lites.
ntsileo. 103,
C.,08,
A.,y ice
.A.,ear-397–
.lidnics.
. In:ss,
es ofl and
es ofand
cedoc.
.R.,lor334–
282 D.P. Cruikshank et al.
Cruikshank, D.P., 1979. The surfaces and interiors of the satellites of SaRev. Geophys. Space Phys. 17, 165–176.
Cruikshank, D.P., 1980. Near-infrared studies of the satellites of SaturnUranus. Icarus 41, 246–258.
Cruikshank, D.P., Lebofsky, L.A., Veverka, J., 1984. Satellites of Satoptical properties. In: Gehrels, T., Matthews, M.S. (Eds.), Saturn. Uof Arizona Press, Tucson, pp. 640–667.
Cruikshank, D.P., Allamandola, L.J., Hartmann, W.K., Tholen, D.J., BroR.H., Matthews, C.N., Bell, J.F., 1991. Solid C≡N bearing material onouter Solar System bodies. Icarus 94, 345–353.
Cruikshank, D.P., Roush, T.L., Owen, T.C., Geballe, T.R., de BerghSchmitt, B., Brown, R.H., Bartholomew, M.J., 1993. Ices on the surof Triton. Science 261, 742–745.
Cruikshank, D.P., Brown, R.H., Calvin, W., Roush, T.L., BartholomeM.J., 1998a. Ices on the satellites of Jupiter, Saturn, and UranusSchmitt, B., de Bergh, C., Festou, M. (Eds.), Solar System Ices. KluAcademic, Dordrecht, pp. 579–606.
Cruikshank, D.P., Roush, T.L., Owen, T.C., Quirico, E., de Bergh,1998b. The surface compositions of Triton, Pluto, and Charon.Schmitt, B., de Bergh, C., Festou, M. (Eds.), Solar System Ices. KluAcademic, Dordrecht, pp. 655–684.
Cruikshank, D.P., Roush, T.L., Bartholomew, M.J., Geballe, T.R., Penton, Y.J., White, S.M., Bell III, J.F., Davies, J.K., Owen, T.C., de BerC., Tholen, D.J., Bernstein, M.P., Brown, R.H., Tryka, K.A., Dalle OC.M., 1998c. The composition of Centaur 5145 Pholus. Icarus389–407.
Cruikshank, D.P., Schmitt, B., Roush, T.L., Owen, T.C., Quirico,Geballe, T.R., de Bergh, C., Bartholomew, M.J., Dalle Ore, C.Douté, S., Meier, R., 2000. Water ice on Triton. Icarus 147, 309–31
Cruikshank, D.P., Roush, T.L., Poulet, F., 2003. Quantitative modeof the spectral reflectance of Kuiper belt objects and Centaurs. CPhys. 4, 783–789.
Cuzzi, J.N., Estrada, P.R., 1998. Compositional evolution of Saturn’s rdue to meteoroid bombardment. Icarus 132, 1–35.
Dalle Ore, C.M., Cruikshank, D.P., Owen, T.C., Geballe, T.R., Roush, TKhare, B.N., de Bergh, C., 1999. Surface composition of Rhea freflectance spectra, 0.2–3.6 µm. Bull. Am. Astron. Soc. 31, 1073.stract.
Davies, J.K., Roush, T.L., Cruikshank, D.P., Bartholomew, M.J., GebT.R., Owen, T., de Bergh, C., 1997. The detection of water ice in CoHale–Bopp. Icarus 127, 238–245.
Degewij, J., Cruikshank, D.P., Hartmann, W.K., 1980. Near-infraredorimetry of J6 Himalia and S9 Phoebe: a summary of 0.3–2.2 µmflectances. Icarus 44, 542–547.
Delitsky, M.L., Lane, A.L., 2002. Saturn’s inner satellites: ice chemisand magnetosphere effects. J. Geophys. Res. 107 (E11), 50933-17.
Douté, S., Schmitt, B., Quirico, E., Owen, T.C., Cruikshank, D.P., de BeC., Geballe, T.R., Roush, T.R., 1999. Evidence for methane segregat the surface of Pluto. Icarus 142, 421–444.
Fink, U., Larson, H.P., 1975. Temperature dependence of the watespectrum between 1 and 4 microns: application to Europa, Ganymand Saturn’s rings. Icarus 24, 411–420.
Fink, U., Sill, G.T., 1982. The infrared spectral properties of frozvolatiles. In: Wilkening, L.L. (Ed.), Comets. Univ. of Arizona PresTucson, pp. 164–202.
Fink, U., Larson, H.P., Gautier, T.N., Treffers, R.R., 1976. Infrared speof the satellites of Saturn: identification of water ice on Iapetus, RDione, and Tethys. Astrophys. J. 207, L63–L67.
Franz, O.G., Millis, R.L., 1975. Photometry of Dione, Tethys, and Enladus on the UBV system. Icarus 24, 433–442.
Grundy, W.M., Schmitt, B., 1998. The temperature-dependent near-infabsorption spectrum of hexagonal H2O ice. J. Geophys. Res. 1025809–25822.
Grundy, W.M., Buie, M.W., Stansberry, J.A., Spencer, J.R., 1999. Near-infrared spectra of outer Solar System surfaces: remote determinationof H2O ice temperatures. Icarus 142, 536–549.
rus 175 (2005) 268–283
Hapke, B., 1981. Bidirectional reflectance spectroscopy 1. Theory. J.phys. Res. 86, 3039–3054.
Hapke, B., 1993. Combined theory of reflectance and emittance stroscopy. In: Pieters, C.M., Englert, P.A.J. (Eds.), Remote GeochemAnalysis: Elemental and Mineralogical Composition. Cambridge UPress, New York, pp. 31–42.
Imanaka, H., Khare, B.N., Elsila, J.E., Bakes, E.L.O., McKay, C.P., Crshank, D.P., Sugita, S., Matsui, T., Zare, R.N., 2004. Laboratoryperiments on Titan tholin formed in cold plasma at various pressuimplications for nitrogen-containing polycyclic aromatic compoundsTitan haze. Icarus 168, 344–366.
Khare, B.N., Sagan, C., Arakawa, E.T., Suits, R., Callcot, T.A., WilliaM.W., 1984. Optical constants of organic tholins produced in a silated titanian atmosphere: from soft X-ray to microwave frequencIcarus 60, 127–137.
Khare, B.N., Thompson, W.R., Cheng, L., Chyba, C., Sagan, C., ArakE.T., Meisse, C., Tuminello, P., 1993. Production and optical consof ice tholin from charged particle irradiation of (1:6) C2H6/H2O at77 K. Icarus 103, 290–300.
Kuiper, G.P., 1957. Infrared observations of planets and satellites. AsJ. 62, 245. Abstract.
Kuiper, G.P., Cruikshank, D.P., Fink, U., 1970. Letter to Editor. Sky Tescope 39, 80.
Levy, O., Stroud, D., 1997. Maxwell Garnett theory for mixturesanisotropic inclusions: application to conducting polymers. Phys.B 56, 8035–8046.
Lucey, P.G., 1998. Model near-infrared optical constants of olivine androxene as a function of iron content. J. Geophys. Res. 103, 1703–1
Lupo, M.J., Lewis, J.S., 1979. Mass-radius relationships in icy satelIcarus 40, 157–170.
McCord, T.B., the Galileo NIMS Team, 1998. Non-water-ice constituein the surface material of the icy galilean satellites from the Galnear-infrared mapping spectrometer investigation. J. Geophys. Res8603–8616.
McDonald, G.D., Thompson, W.R., Heinrich, M., Khare, B.N., Sagan,1994. Chemical investigation of Titan and Triton tholins. Icarus 1137–145.
McDonald, G.D., Whited, L.J., DeRuiter, C., Khare, B.N., Patniak,Sagan, C., 1996. Production and chemical analysis of cometartholins. Icarus 122, 107–117.
Momary, T.W., Baines, K.H., Yanamandra-Fisher, P.A., Lebofsky, LGolisch, W., Kaminski, C., 2000. The saturnian satellites in the ninfrared: absolute photometry at ring plane crossing. Icarus 148,406.
Moroz, V.I., 1967. Physika Planet. Nauka, Moscow. 496 pp. In RussianMoroz, L.V., Arnold, G., Korochantsev, A.V., Wasch, 1998. Natural so
bitumens as possible analogs for cometary and asteroid orgaIcarus 134, 253–268.
Morrison, D., Owen, T., Soderblom, L.A., 1986. The satellites of SaturnBurns, J.A., Matthews, M.S. (Eds.), Satellites. Univ. of Arizona PreTucson, pp. 764–801.
Mosqueira, I., Estrada, P.R., 2003a. Formation of large regular satellitgiant planets in an extended gaseous nebula. I. Subnebula modeaccretion of satellites. Icarus 163, 198–231.
Mosqueira, I., Estrada, P.R., 2003b. Formation of large regular satellitgiant planets in an extended gaseous nebula. II. Satellite migrationsurvival. Icarus 163, 232–255.
Mountain, C.M., Robertson, D., Lee, T.J., Wade, R., 1990. An advancooled grating spectrometer for UKIRT. In: Crawford, D.L. (Ed.), PrSPIE, vol. 1235, pp. 25–33.
Noland, M., Veverka, J., Morrison, D., Cruikshank, D.P., Lazarewicz, AMorrison, N.D., Elliot, J.L., Goguen, J., Burns, J.A., 1974. Six-cophotometry of Iapetus, Titan, Rhea, Dione and Tethys. Icarus 23,354.
Noll, K.S., Roush, T.L., Cruikshank, D.P., Pendlelton, Y.J., Johnson, R.E.,1997. Detection of ozone on Saturn’s satellites Rhea and Dione. Na-ture 388, 45–47.

py of
.H.,and
.L.,ebe.
.L.,ino:
02.net.
03.etar
tract
rn’s
160,
002.s fortwo
003.olu-412,
As-
hy-:
en,and
.E.,m-
L.,ues
cott,ring
.uterlar
tiesM.40.posi-urns,son,
l ofper-
H
onias. 74,
reduds
Sci.
oy-
s-
on ofd in-
aly-
Infrared spectrosco
Owen, T.C., Cruikshank, D.P., Roush, T., de Bergh, C., Brown, RBartholomew, M.J., Elliot, J., Young, L., 1993. The surface icesthe atmospheric composition of Pluto. Science 261, 745–748.
Owen, T.C., Cruikshank, D.P., Dalle Ore, C.M., Geballe, T.R., Roush, Tde Bergh, C., 1999. Detection of water ice on Saturn’s satellite PhoIcarus 139, 379–382.
Owen, T.C., Cruikshank, D.P., Dalle Ore, C.M., Geballe, T.R., Roush, Tde Bergh, C., Pendleton, Y.J., Khare, B.N., 2001. Decoding the domthe dark side of Iapetus. Icarus 149, 160–172.
Piatek, J.L., Hapke, B., Nelson, R.M., Smythe, W.D., Hale, A.S., 20Scattering properties of planetary regolith analogs. Lunar PlaSci. 33. Abstract 1171 [CD-ROM].
Piatek, J.L., Hapke, B., Nelson, R.M., Hale, A.S., Smythe, W.D., 20Size-dependent measurements of the scattering properties of planregolith analogs: a challenge to theory. Lunar Planet. Sci. 34. Abs1440 [CD-ROM].
Pilcher, C.B., Chapman, C.R., Lebofsky, L.A., Kieffer, H.H., 1970. Saturings: identification of water frost. Science 167, 1372–1373.
Poulet, F., Cuzzi, J.N., 2002. The composition of Saturn’s rings. Icarus350–358.
Poulet, F., Cuzzi, J.N., Cruikshank, D.P., Roush, T., Dalle Ore, C.M., 2Comparison between the Shkuratov and Hapke scattering theoriesolid planetary surfaces. Application to the surface composition ofcentaurs. Icarus 160, 313–324.
Poulet, F., Cruikshank, D.P., Cuzzi, J.N., Roush, T.L., French, R.G., 2Compositions of Saturn’s rings A, B, and C from high spectral restion near-infrared spectroscopic observations. Astron. Astrophys.305–316.
Prinn, R.G., Fegley Jr., B., 1981. Kinetic inhibition of CO and N2 reductionin circumplanetary nebulae—implications for satellite composition.trophys. J. 249, 308–317.
Quirico, E., Schmitt, B., 1997. Near-infrared spectroscopy of simpledrocarbons and carbon oxides diluted in solid N2 and as pure icesimplications for Triton and Pluto. Icarus 127, 354–378.
Quirico, E., Douté, S., Schmitt, B., de Bergh, C., Cruikshank, D.P., OwT.C., Geballe, T.R., Roush, T.L., 1999. Composition, physical statedistribution of ices at the surface of Triton. Icarus 139, 159–178.
Rayner, J.T., Toomey, D., Onaka, P.M., Denault, A.J., Stahlberger, WVacca, W.D., Cushing, M.C., Wang, S., 2003. SpeX: a mediu
resolution 0.8–5.5 micron spectrograph and imager for the NASA in-frared telescope facility. Publ. Astron. Soc. Pacific 115, 362–382.Saturn’s icy satellites 283
y
Ramirez, S.I., Coll, P., da Silva, A., Navarro-González, R., Lafait,Raulin, F., 2002. Complex refractive index of Titan’s aerosol analogin the 200–900 nm domain. Icarus 156, 515–529.
Roddier, F., Roddier, C., Brahic, A., Dumas, C., Graves, J.E., NorthM.J., Owen, T., 2000. Adaptive optics observations of Saturn’splane crossing in August 1995. Icarus 143, 299–307.
Roush, T.L., 1994. Charon: more than water ice? Icarus 108, 243–254Roush, T.L., Cruikshank, D.P., Owen, T.C., 1995. Surface ices in the o
Solar System. In: Farley, K.A. (Ed.), Volatiles in the Earth and SoSystem. In: Am. Inst. Phys. Conf. Proc., vol. 341, pp. 143–153.
Schmitt, B., Quirico, E., Trotta, F., Grundy, W.M., 1998. Optical properof ices from UV to infrared. In: Schmitt, B., de Bergh, C., Festou,(Eds.), Solar System Ices. Kluwer Academic, Dordrecht, pp. 199–2
Schubert, G., Spohn, T., Reynolds, R.T., 1986. Thermal histories, comtions and internal structures of the moons of the Solar System. In: BJ.A., Matthews, M.S. (Eds.), Satellites. Univ. of Arizona Press, Tucpp. 224–292.
Shkuratov, Y., Starukhina, Y., Hoffmann, H., Arnold, G., 1999. A modespectral albedo of particulate surfaces: implications for optical proties of the Moon. Icarus 137, 235–246.
Sill, G., Fink, U., Ferraro, J.R., 1980. Absorption coefficients of solid N3from 50 to 7000 cm−1. J. Opt. Soc. Am. 70, 724–739.
Sill, G., Fink, U., Ferraro, J.R., 1981. The infrared spectrum of ammhydrate: explanation for a reported ammonia phase. J. Chem. Phy997–1000.
Slobodkin, L.S., Buyakov, I.F., Cess, R.D., Caldwell, J., 1978. Near infrareflection spectra of ammonia frost: interpretation of the upper cloof Saturn. J. Quant. Spectrosc. Radiat. Transfer 20, 481–490.
Smith, E.V.P., Gottlieb, D.M., 1974. Solar flux and its variations. SpaceRev. 16, 771–802.
Smith, B.A., the Voyager Imaging Team, 1981. Encounter with Saturn: Vager 1 imaging science results. Science 212, 163–191.
Tokunaga, A.T., 2000. Infrared astronomy. In: Cox, A.N. (Ed.), Allen’s Atrophysical Quantities. Springer-Verlag, New York, pp. 143–167.
Tran, B.N., Ferris, J.P., Chera, J.J., 2003. The photochemical formatia Titan haze analog. Structural analysis by X-ray photoelectron anfrared spectroscopy. Icarus 162, 114–124.
Verbiscer, A.J., Veverka, J., 1989. Albedo dichotomy of Rhea: Hapke ansis of Voyager photometry. Icarus 82, 336–353.
Wilson, P.D., Sagan, C., Thompson, W.R., 1994. The organic surface of5145 Pholus: constraints set by scattering theory. Icarus 107, 288–303.