Embed Size (px)
Citation preview
A SPITZER SPACE TELESCOPE STUDY OF DISKS IN THE YOUNG � ORIONIS CLUSTER
Jesus Hernandez,1,2
L. Hartmann,1T. Megeath,
3R. Gutermuth,
4J. Muzerolle,
5N. Calvet,
1A. K. Vivas,
2
C. Briceno,2L. Allen,
4J. Stauffer,
6E. Young,
5and G. Fazio
4
Received 2006 October 9; accepted 2007 February 5
ABSTRACT
We report new Spitzer Space Telescope observations, using the IRAC andMIPS instruments, of the young (�3Myr)� Orionis cluster. We identify 336 stars as members of the cluster, using optical and near-infrared color-magnitudediagrams. Using the spectral energy distribution slopes in the IRAC spectral range, we place objects into several classes:non-excess stars, stars with optically thick disks (such as classical T Tauri stars), class I (protostellar) candidates, andstars with ‘‘evolved disks’’; the last exhibit smaller IRAC excesses than optically thick disk systems. In general, thisclassification agrees with the location expected in IRAC-MIPS color-color diagrams for these objects. We find thatthe evolved disk systems are mostly a combination of objects with optically thick but nonflared disks, suggestinggrain growth and/or settling, and transition disks, systems in which the inner disk is partially or fully cleared of smalldust. In all, we identify seven transition disk candidates and three possible debris disk systems. As in other youngstellar populations, the fraction of disks depends on the stellar mass, ranging from�10% for stars in the Herbig Ae/Bemass range (>2 M�) to �35% for those in the T Tauri mass range (1Y0.1 M�). The IRAC infrared excesses found instellar clusters and associations with and without central high-mass stars are similar, suggesting that external photo-evaporation is not very important in many clusters. Finally, we find no correlation between the X-ray luminosity andthe disk infrared excess, suggesting that the X-rays are not strongly affected by disk accretion.
Subject headings: infrared: stars — open clusters and associations: individual (� Orionis cluster) —planetary systems: protoplanetary disks — stars: formation — stars: preYmain-sequence
Online material: color figures, machine-readable tables
1. INTRODUCTION
Observations have shown and theory predicts that disks aroundyoung stars are an inescapable consequence of star formation,given angular momentum conservation during protostellar cloudcore collapse (Hartmann 2005a; Ward-Thompson et al. 2005;Andre et al. 2000). As the resulting protoplanetary disks age, theirexcesses at near-infrared (NIR) and mid-infrared wavelengthsdecrease. Previous studies have indicated that the timescale forthis evolution in disk emission is strongly dependent on the stellarmass (Lada&Lada 1995;Muzerolle et al. 2003;Calvet et al. 2004;Sicilia-Aguilar et al. 2005), ranging from 5 to 7 Myr for objects inthe mass range of the T Tauri stars (TTSs; with spectral type K5or later; Haisch et al. 2001; Hartmann 2005b; L. Hillenbrand et al.2007, in preparation) to <3 Myr for objects in the mass rangeof the Herbig Ae/Be (HAeBe) stars (spectral type F5 or earlier;Hernandez et al. 2005).
The observed decreases in infrared emission can result fromany of the following: grain growth to sizes much larger than thewavelength of observation; dust settling to the disk midplane,which reduces the ‘‘flaring’’ of the disk and thus the amountof energy radiated (Kenyon & Hartmann 1987; Dullemond &Dominik 2005; D’Alessio et al. 2006); clearing of small dustparticles by large bodies in the disk; or some combination ofthese processes. Since grain growth and settling to the midplane
occur fastest in the (warmer) inner disk (Weidenschilling 1997;Dullemond & Dominik 2004), the disk emission is expected todecline faster at short wavelengths than at long wavelengths, andthere is observational evidence for this (Sicilia-Aguilar et al. 2006;Hartmann 2005b; Lada et al. 2006).
Of particular interest are ‘‘transition disk’’ objects, whichhave an inner, optically thin disk region, possibly produced byplanet clearing, combinedwith an outer, optically thick disk (Calvetet al. 2002, 2005; D’Alessio et al. 2005b; Megeath et al. 2005a).Prior to the complete or nearly complete clearing seen in transi-tion disks, onewould expect to observe optically thick but reducedinfrared emission from the inner disk, for which there is someevidence (e.g., Sicilia-Aguilar et al. 2006; Lada et al. 2006). How-ever, additional large samples of stars are desirable to make the re-sult more statistically significant, as stars of the samemass and ageshow a wide range of disk emission properties (Furlan et al. 2006).
The � Orionis cluster is of particular interest because it isreasonably near and relatively populous, making possible statis-tically significant studies of disk properties as a function of stel-lar mass. Moreover, � Ori has an age of �3 Myr, at which onemight expect the beginnings of disk evolution to become evident.It is part of the Orion OB1b subassociation, which has an ageof 1.7Y7Myr (Warren & Hesser 1978; Brown et al. 1994, 2007;Briceno et al. 2005). Low-mass members of the � Ori clusterwere first reported by Walter et al. (1997), who found over 80X-ray sources and spectroscopically identifiedmore than 100 low-mass, preYmain-sequence (PMS) members lying within 1� fromthe star � Ori. The distance calculated by Hipparcos for this star(352þ166
�85 pc) agrees, within the uncertainties of Hipparcos, withthe Hipparcos distance calculated for the overall populationof the stellar subassociation OB1b (439 � 33 pc; Brown et al.2007), which is statistically more reliable. The estimated ageof the cluster is 2Y4 Myr (Zapatero Osorio et al. 2002; Oliveira
A
1 Department of Astronomy, University of Michigan, Ann Arbor, MI 48109.2 Centro de Investigaciones de Astronomıa, Merida 5101-A, Venezuela.3 Department of Physics and Astronomy, University of Toledo, Toledo, OH
43606-3390.4 Harvard-Smithsonian Center for Astrophysics, Cambridge, MA 02138.5 Steward Observatory, University of Arizona, Tucson, AZ 85721.6 Spitzer Science Center, California Institute of Technology, Pasadena, CA
91125.
1067
The Astrophysical Journal, 662:1067Y1081, 2007 June 20
# 2007. The American Astronomical Society. All rights reserved. Printed in U.S.A.
et al. 2002; Sherry et al. 2004; Franciosini et al. 2006). Since the� Ori cluster is relatively near and the reddening toward thecenter of the cluster is low [E B� Vð Þ ¼ 0:05mag; Brown et al.1994; Bejar et al. 1999], this stellar cluster is an excellent labo-ratory in which to study young stars in a entire range of masses,from the massive and multiple O9.5 type star �Ori to the lowestmass objects, such as brown dwarfs and free-floating planets(e.g., Barrado y Navascues et al. 2001, 2003; Bejar et al. 1999,2001, 2004; Burningham et al. 2005; Caballero 2005; Kenyonet al. 2005; Oliveira et al. 2006; Scholz & Eisloffel 2004; Sherryet al. 2004; Zapatero Osorio et al. 2002; Walter et al. 1998).
The unprecedented sensitivity and spatial resolution providedby the Spitzer Space Telescope in the near- and mid-infraredwindows are powerful tools with which we can significantly ex-pand our understanding of star and planet formation processes.In this contribution, we analyze the near- and mid-infrared prop-erties of stars in the � Orionis cluster, ranging in mass fromHAeBe stars to the substellar limit.
This paper is organized as follows. In x 2 we present the ob-servational data. In x 3 we describe the selection of cluster mem-bers. We analyze the observations and describe the results in x 4and give our conclusions in x 5.
2. OBSERVATIONS
2.1. Infrared Photometry
We have observed a field of �1730 arcmin2 in the � Orioniscluster using the four channels (3.6, 4.5, 5.8, and 8.0 �m) of theInfraRed Array Camera (IRAC; Fazio et al. 2004). In addition,90% of this field was also observed using the 24 �m band ofthe Multiband Imaging Spectrometer for Spitzer (MIPS; Riekeet al. 2004).
The IRAC observations presented here were taken on 2004October 9. The field of view was covered by a 9 ; 10 positionmosaic (2000 overlap), with three dithered exposures at each posi-tion. Images were obtained in high dynamic range (HDR) mode,in which a short integration (1 s) is immediately followed by a
long integration (26.8 s). Standard Basic Calibrated Data (BCD)products from version S13.2 of the Spitzer Science Center’sIRACpipelinewere used tomake the finalmosaics. Post-BCDdatatreatment was performed using custom IDL software (Gutermuthet al. 2004; R. Gutermuth et al. 2007, in preparation) that includesmodules for detection and correction of bright source artifacts,detection and removal of cosmic-ray hits, construction of thelong- and short-exposure HDRmosaics, and the merger of thosemosaics to yield the final science images.MIPS observations were made using the medium-scan mode
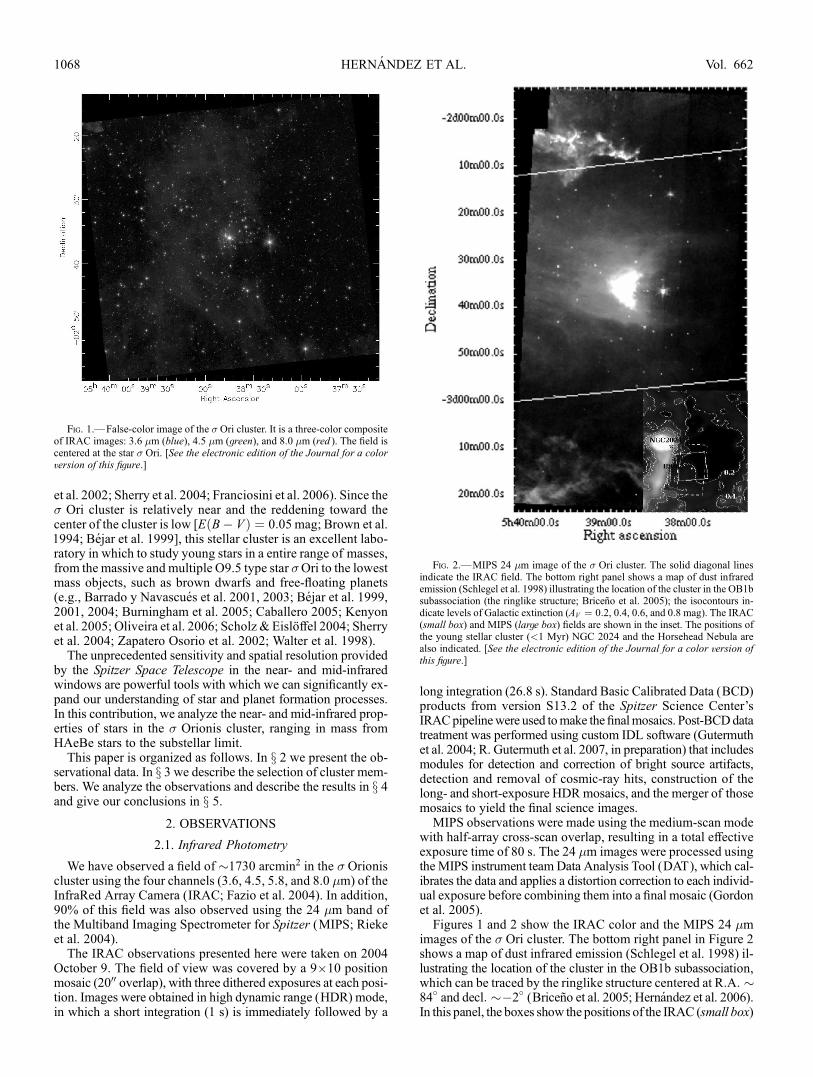
with half-array cross-scan overlap, resulting in a total effectiveexposure time of 80 s. The 24 �m images were processed usingthe MIPS instrument team Data Analysis Tool (DAT), which cal-ibrates the data and applies a distortion correction to each individ-ual exposure before combining them into a final mosaic (Gordonet al. 2005).Figures 1 and 2 show the IRAC color and the MIPS 24 �m
images of the � Ori cluster. The bottom right panel in Figure 2shows a map of dust infrared emission (Schlegel et al. 1998) il-lustrating the location of the cluster in the OB1b subassociation,which can be traced by the ringlike structure centered at R:A: �84� and decl: ��2� (Briceno et al. 2005; Hernandez et al. 2006).In this panel, the boxes show the positions of the IRAC (small box)
Fig. 1.—False-color image of the � Ori cluster. It is a three-color compositeof IRAC images: 3.6 �m (blue), 4.5 �m (green), and 8.0 �m (red ). The field iscentered at the star � Ori. [See the electronic edition of the Journal for a colorversion of this figure.]
Fig. 2.—MIPS 24 �m image of the � Ori cluster. The solid diagonal linesindicate the IRAC field. The bottom right panel shows a map of dust infraredemission (Schlegel et al. 1998) illustrating the location of the cluster in the OB1bsubassociation (the ringlike structure; Briceno et al. 2005); the isocontours in-dicate levels of Galactic extinction (AV ¼ 0:2, 0.4, 0.6, and 0.8 mag). The IRAC(small box) and MIPS (large box) fields are shown in the inset. The positions ofthe young stellar cluster (<1 Myr) NGC 2024 and the Horsehead Nebula arealso indicated. [See the electronic edition of the Journal for a color version ofthis figure.]
HERNANDEZ ET AL.1068 Vol. 662
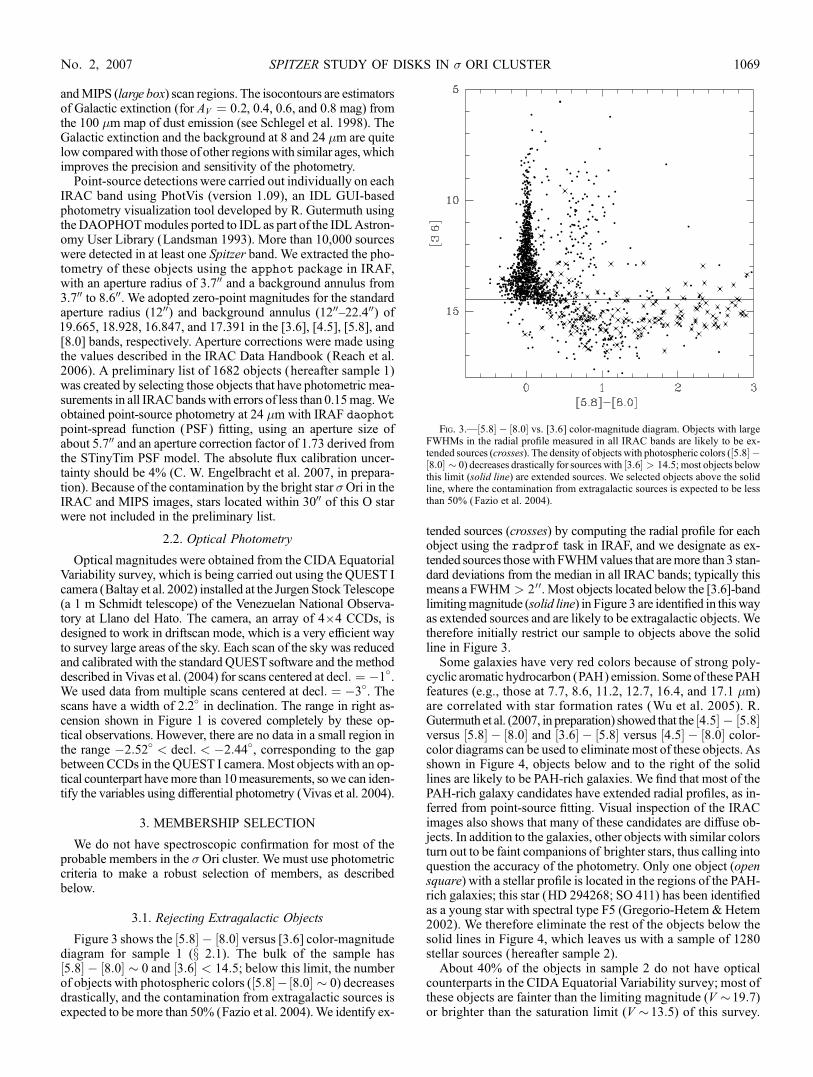
andMIPS (large box) scan regions. The isocontours are estimatorsof Galactic extinction (for AV ¼ 0:2, 0.4, 0.6, and 0.8 mag) fromthe 100 �m map of dust emission (see Schlegel et al. 1998). TheGalactic extinction and the background at 8 and 24 �m are quitelow comparedwith those of other regionswith similar ages, whichimproves the precision and sensitivity of the photometry.
Point-source detections were carried out individually on eachIRAC band using PhotVis (version 1.09), an IDL GUI-basedphotometry visualization tool developed by R. Gutermuth usingtheDAOPHOTmodules ported to IDL as part of the IDLAstron-omy User Library (Landsman 1993). More than 10,000 sourceswere detected in at least one Spitzer band. We extracted the pho-tometry of these objects using the apphot package in IRAF,with an aperture radius of 3.700 and a background annulus from3.700 to 8.600. We adopted zero-point magnitudes for the standardaperture radius (1200) and background annulus (1200Y22.400) of19.665, 18.928, 16.847, and 17.391 in the [3.6], [4.5], [5.8], and[8.0] bands, respectively. Aperture corrections were made usingthe values described in the IRAC Data Handbook (Reach et al.2006). A preliminary list of 1682 objects (hereafter sample 1)was created by selecting those objects that have photometric mea-surements in all IRACbandswith errors of less than 0.15mag.Weobtained point-source photometry at 24 �m with IRAF daophotpoint-spread function (PSF) fitting, using an aperture size ofabout 5.700 and an aperture correction factor of 1.73 derived fromthe STinyTim PSF model. The absolute flux calibration uncer-tainty should be 4% (C. W. Engelbracht et al. 2007, in prepara-tion). Because of the contamination by the bright star �Ori in theIRAC and MIPS images, stars located within 3000 of this O starwere not included in the preliminary list.
2.2. Optical Photometry
Optical magnitudes were obtained from the CIDA EquatorialVariability survey, which is being carried out using the QUEST Icamera (Baltay et al. 2002) installed at the Jurgen Stock Telescope(a 1 m Schmidt telescope) of the Venezuelan National Observa-tory at Llano del Hato. The camera, an array of 4 ; 4 CCDs, isdesigned to work in driftscan mode, which is a very efficient wayto survey large areas of the sky. Each scan of the sky was reducedand calibrated with the standard QUESTsoftware and the methoddescribed in Vivas et al. (2004) for scans centered at decl: ¼ �1
�.
We used data from multiple scans centered at decl: ¼ �3�. Thescans have a width of 2.2� in declination. The range in right as-cension shown in Figure 1 is covered completely by these op-tical observations. However, there are no data in a small region inthe range �2:52� < decl: < �2:44�, corresponding to the gapbetween CCDs in the QUEST I camera.Most objects with an op-tical counterpart havemore than 10measurements, sowe can iden-tify the variables using differential photometry (Vivas et al. 2004).
3. MEMBERSHIP SELECTION
We do not have spectroscopic confirmation for most of theprobable members in the �Ori cluster. We must use photometriccriteria to make a robust selection of members, as describedbelow.
3.1. Rejecting Extragalactic Objects
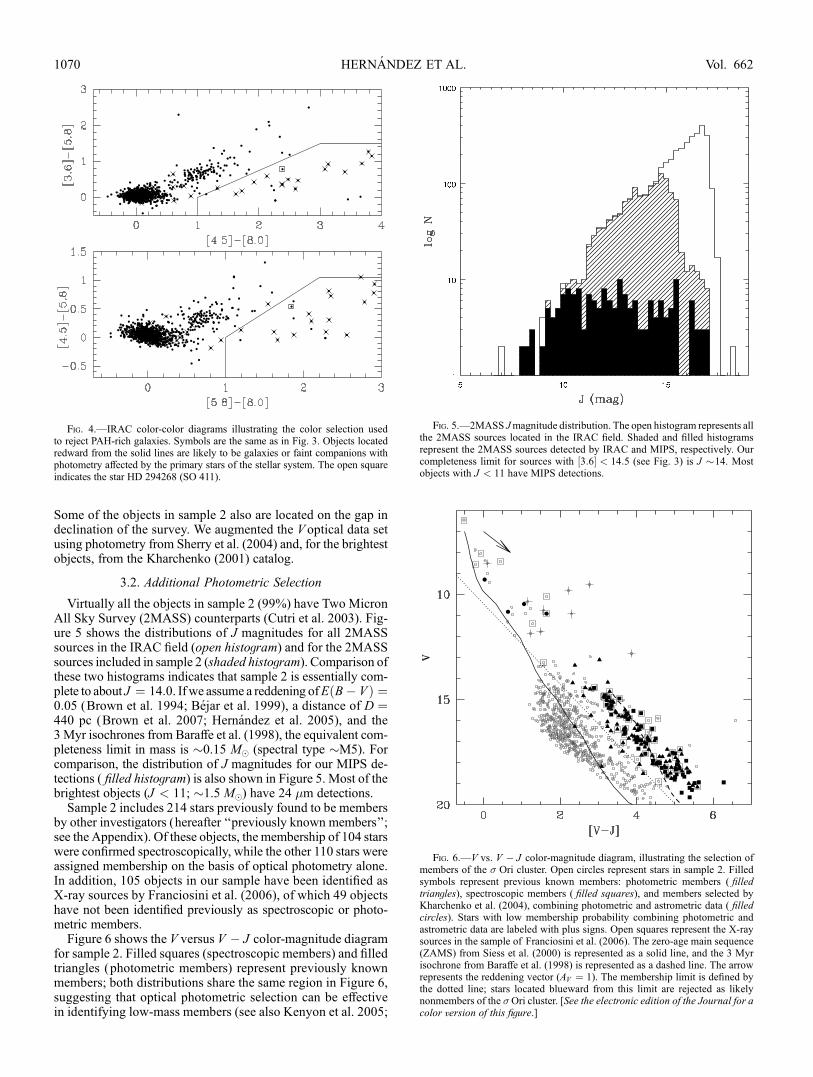
Figure 3 shows the 5:8½ � � 8:0½ � versus [3.6] color-magnitudediagram for sample 1 (x 2.1). The bulk of the sample has5:8½ � � 8:0½ � � 0 and 3:6½ � < 14:5; below this limit, the numberof objects with photospheric colors ( 5:8½ �� 8:0½ � � 0) decreasesdrastically, and the contamination from extragalactic sources isexpected to be more than 50% (Fazio et al. 2004).We identify ex-
tended sources (crosses) by computing the radial profile for eachobject using the radprof task in IRAF, and we designate as ex-tended sources thosewith FWHMvalues that aremore than 3 stan-dard deviations from the median in all IRAC bands; typically thismeans a FWHM > 200. Most objects located below the [3.6]-bandlimitingmagnitude (solid line) in Figure 3 are identified in thiswayas extended sources and are likely to be extragalactic objects. Wetherefore initially restrict our sample to objects above the solidline in Figure 3.
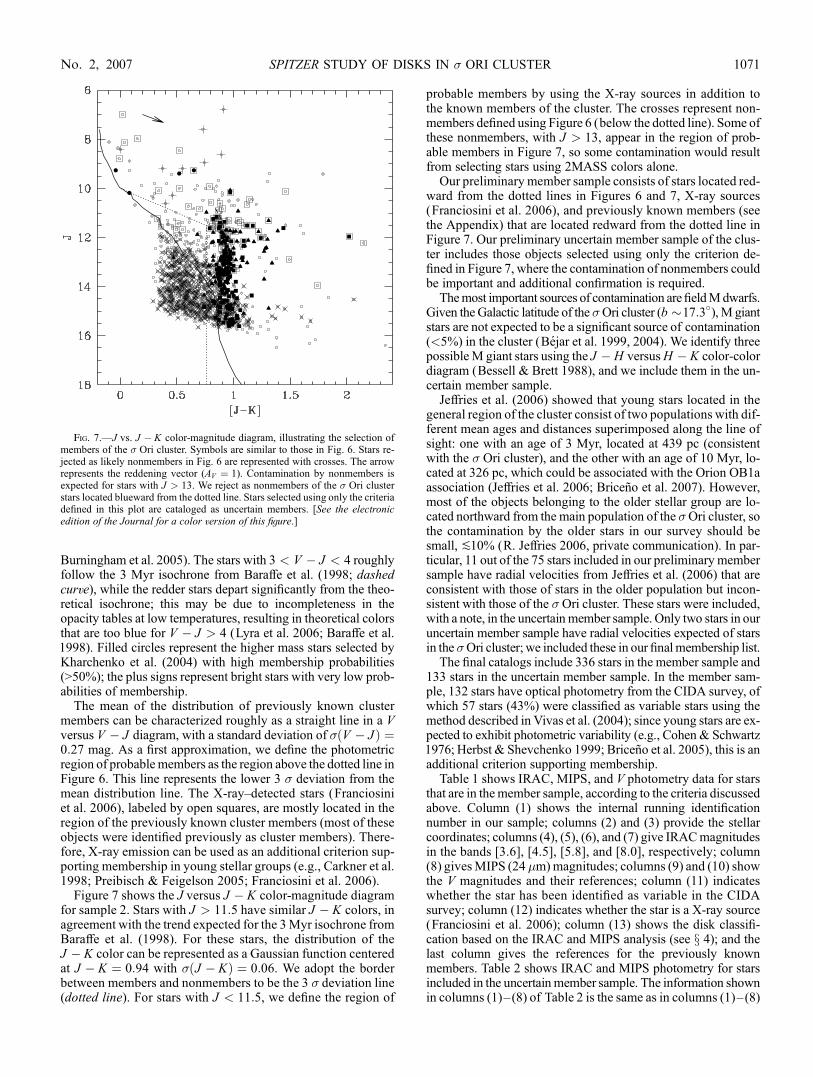
Some galaxies have very red colors because of strong poly-cyclic aromatic hydrocarbon (PAH) emission. Some of these PAHfeatures (e.g., those at 7.7, 8.6, 11.2, 12.7, 16.4, and 17.1 �m)are correlated with star formation rates (Wu et al. 2005). R.Gutermuth et al. (2007, in preparation) showed that the 4:5½ � � 5:8½ �versus 5:8½ � � 8:0½ � and 3:6½ � � 5:8½ � versus 4:5½ � � 8:0½ � color-color diagrams can be used to eliminate most of these objects. Asshown in Figure 4, objects below and to the right of the solidlines are likely to be PAH-rich galaxies. We find that most of thePAH-rich galaxy candidates have extended radial profiles, as in-ferred from point-source fitting. Visual inspection of the IRACimages also shows that many of these candidates are diffuse ob-jects. In addition to the galaxies, other objects with similar colorsturn out to be faint companions of brighter stars, thus calling intoquestion the accuracy of the photometry. Only one object (opensquare) with a stellar profile is located in the regions of the PAH-rich galaxies; this star (HD 294268; SO 411) has been identifiedas a young star with spectral type F5 (Gregorio-Hetem & Hetem2002). We therefore eliminate the rest of the objects below thesolid lines in Figure 4, which leaves us with a sample of 1280stellar sources (hereafter sample 2).
About 40% of the objects in sample 2 do not have opticalcounterparts in the CIDA Equatorial Variability survey; most ofthese objects are fainter than the limiting magnitude (V �19:7)or brighter than the saturation limit (V �13:5) of this survey.
Fig. 3.— 5:8½ � � 8:0½ � vs. [3.6] color-magnitude diagram. Objects with largeFWHMs in the radial profile measured in all IRAC bands are likely to be ex-tended sources (crosses). The density of objects with photospheric colors ( 5:8½ � �8:0½ � � 0) decreases drastically for sources with 3:6½ � > 14:5; most objects belowthis limit (solid line) are extended sources. We selected objects above the solidline, where the contamination from extragalactic sources is expected to be lessthan 50% (Fazio et al. 2004).
SPITZER STUDY OF DISKS IN � ORI CLUSTER 1069No. 2, 2007
Some of the objects in sample 2 also are located on the gap indeclination of the survey. We augmented the V optical data setusing photometry from Sherry et al. (2004) and, for the brightestobjects, from the Kharchenko (2001) catalog.
3.2. Additional Photometric Selection
Virtually all the objects in sample 2 (99%) have Two MicronAll Sky Survey (2MASS) counterparts (Cutri et al. 2003). Fig-ure 5 shows the distributions of J magnitudes for all 2MASSsources in the IRAC field (open histogram) and for the 2MASSsources included in sample 2 (shaded histogram). Comparison ofthese two histograms indicates that sample 2 is essentially com-plete to about J ¼ 14:0. If we assume a reddening ofE B� Vð Þ ¼0:05 (Brown et al. 1994; Bejar et al. 1999), a distance of D ¼440 pc (Brown et al. 2007; Hernandez et al. 2005), and the3 Myr isochrones from Baraffe et al. (1998), the equivalent com-pleteness limit in mass is �0.15 M� (spectral type �M5). Forcomparison, the distribution of J magnitudes for our MIPS de-tections ( filled histogram) is also shown in Figure 5. Most of thebrightest objects (J < 11; �1.5 M�) have 24 �m detections.
Sample 2 includes 214 stars previously found to be membersby other investigators (hereafter ‘‘previously known members’’;see the Appendix). Of these objects, the membership of 104 starswere confirmed spectroscopically, while the other 110 stars wereassigned membership on the basis of optical photometry alone.In addition, 105 objects in our sample have been identified asX-ray sources by Franciosini et al. (2006), of which 49 objectshave not been identified previously as spectroscopic or photo-metric members.
Figure 6 shows the V versus V � J color-magnitude diagramfor sample 2. Filled squares (spectroscopic members) and filledtriangles (photometric members) represent previously knownmembers; both distributions share the same region in Figure 6,suggesting that optical photometric selection can be effectivein identifying low-mass members (see also Kenyon et al. 2005;
Fig. 4.—IRAC color-color diagrams illustrating the color selection usedto reject PAH-rich galaxies. Symbols are the same as in Fig. 3. Objects locatedredward from the solid lines are likely to be galaxies or faint companions withphotometry affected by the primary stars of the stellar system. The open squareindicates the star HD 294268 (SO 411).
Fig. 5.—2MASS Jmagnitude distribution. The open histogram represents allthe 2MASS sources located in the IRAC field. Shaded and filled histogramsrepresent the 2MASS sources detected by IRAC and MIPS, respectively. Ourcompleteness limit for sources with 3:6½ � < 14:5 (see Fig. 3) is J �14. Mostobjects with J < 11 have MIPS detections.
Fig. 6.—V vs. V � J color-magnitude diagram, illustrating the selection ofmembers of the � Ori cluster. Open circles represent stars in sample 2. Filledsymbols represent previous known members: photometric members ( filledtriangles), spectroscopic members ( filled squares), and members selected byKharchenko et al. (2004), combining photometric and astrometric data ( filledcircles). Stars with low membership probability combining photometric andastrometric data are labeled with plus signs. Open squares represent the X-raysources in the sample of Franciosini et al. (2006). The zero-age main sequence(ZAMS) from Siess et al. (2000) is represented as a solid line, and the 3 Myrisochrone from Baraffe et al. (1998) is represented as a dashed line. The arrowrepresents the reddening vector (AV ¼ 1). The membership limit is defined bythe dotted line; stars located blueward from this limit are rejected as likelynonmembers of the �Ori cluster. [See the electronic edition of the Journal for acolor version of this figure.]
HERNANDEZ ET AL.1070 Vol. 662
Burningham et al. 2005). The stars with 3 < V � J < 4 roughlyfollow the 3 Myr isochrone from Baraffe et al. (1998; dashedcurve), while the redder stars depart significantly from the theo-retical isochrone; this may be due to incompleteness in theopacity tables at low temperatures, resulting in theoretical colorsthat are too blue for V � J > 4 (Lyra et al. 2006; Baraffe et al.1998). Filled circles represent the higher mass stars selected byKharchenko et al. (2004) with high membership probabilities(>50%); the plus signs represent bright stars with very low prob-abilities of membership.
The mean of the distribution of previously known clustermembers can be characterized roughly as a straight line in a Vversus V � J diagram, with a standard deviation of � V � Jð Þ ¼0:27 mag. As a first approximation, we define the photometricregion of probablemembers as the region above the dotted line inFigure 6. This line represents the lower 3 � deviation from themean distribution line. The X-rayYdetected stars (Franciosiniet al. 2006), labeled by open squares, are mostly located in theregion of the previously known cluster members (most of theseobjects were identified previously as cluster members). There-fore, X-ray emission can be used as an additional criterion sup-porting membership in young stellar groups (e.g., Carkner et al.1998; Preibisch & Feigelson 2005; Franciosini et al. 2006).
Figure 7 shows the J versus J � K color-magnitude diagramfor sample 2. Stars with J > 11:5 have similar J � K colors, inagreement with the trend expected for the 3Myr isochrone fromBaraffe et al. (1998). For these stars, the distribution of theJ � K color can be represented as a Gaussian function centeredat J � K ¼ 0:94 with � J � Kð Þ ¼ 0:06. We adopt the borderbetween members and nonmembers to be the 3 � deviation line(dotted line). For stars with J < 11:5, we define the region of
probable members by using the X-ray sources in addition tothe known members of the cluster. The crosses represent non-members defined using Figure 6 (below the dotted line). Some ofthese nonmembers, with J > 13, appear in the region of prob-able members in Figure 7, so some contamination would resultfrom selecting stars using 2MASS colors alone.
Our preliminary member sample consists of stars located red-ward from the dotted lines in Figures 6 and 7, X-ray sources(Franciosini et al. 2006), and previously known members (seethe Appendix) that are located redward from the dotted line inFigure 7. Our preliminary uncertain member sample of the clus-ter includes those objects selected using only the criterion de-fined in Figure 7, where the contamination of nonmembers couldbe important and additional confirmation is required.
Themost important sources of contamination are fieldMdwarfs.Given theGalactic latitude of the �Ori cluster (b �17:3�), M giantstars are not expected to be a significant source of contamination(<5%) in the cluster (Bejar et al. 1999, 2004). We identify threepossibleM giant stars using the J � H versusH � K color-colordiagram (Bessell & Brett 1988), and we include them in the un-certain member sample.
Jeffries et al. (2006) showed that young stars located in thegeneral region of the cluster consist of two populations with dif-ferent mean ages and distances superimposed along the line ofsight: one with an age of 3 Myr, located at 439 pc (consistentwith the � Ori cluster), and the other with an age of 10 Myr, lo-cated at 326 pc, which could be associated with the Orion OB1aassociation (Jeffries et al. 2006; Briceno et al. 2007). However,most of the objects belonging to the older stellar group are lo-cated northward from the main population of the �Ori cluster, sothe contamination by the older stars in our survey should besmall, P10% (R. Jeffries 2006, private communication). In par-ticular, 11 out of the 75 stars included in our preliminary membersample have radial velocities from Jeffries et al. (2006) that areconsistent with those of stars in the older population but incon-sistent with those of the � Ori cluster. These stars were included,with a note, in the uncertainmember sample. Only two stars in ouruncertain member sample have radial velocities expected of starsin the �Ori cluster; we included these in our finalmembership list.
The final catalogs include 336 stars in the member sample and133 stars in the uncertain member sample. In the member sam-ple, 132 stars have optical photometry from the CIDA survey, ofwhich 57 stars (43%) were classified as variable stars using themethod described in Vivas et al. (2004); since young stars are ex-pected to exhibit photometric variability (e.g., Cohen & Schwartz1976; Herbst & Shevchenko 1999; Briceno et al. 2005), this is anadditional criterion supporting membership.
Table 1 shows IRAC, MIPS, and V photometry data for starsthat are in the member sample, according to the criteria discussedabove. Column (1) shows the internal running identificationnumber in our sample; columns (2) and (3) provide the stellarcoordinates; columns (4), (5), (6), and (7) give IRACmagnitudesin the bands [3.6], [4.5], [5.8], and [8.0], respectively; column(8) givesMIPS (24�m)magnitudes; columns (9) and (10) showthe V magnitudes and their references; column (11) indicateswhether the star has been identified as variable in the CIDAsurvey; column (12) indicates whether the star is a X-ray source(Franciosini et al. 2006); column (13) shows the disk classifi-cation based on the IRAC and MIPS analysis (see x 4); and thelast column gives the references for the previously knownmembers. Table 2 shows IRAC and MIPS photometry for starsincluded in the uncertainmember sample. The information shownin columns (1)Y (8) of Table 2 is the same as in columns (1)Y (8)
Fig. 7.—J vs. J � K color-magnitude diagram, illustrating the selection ofmembers of the � Ori cluster. Symbols are similar to those in Fig. 6. Stars re-jected as likely nonmembers in Fig. 6 are represented with crosses. The arrowrepresents the reddening vector (AV ¼ 1). Contamination by nonmembers isexpected for stars with J > 13. We reject as nonmembers of the � Ori clusterstars located blueward from the dotted line. Stars selected using only the criteriadefined in this plot are cataloged as uncertain members. [See the electronicedition of the Journal for a color version of this figure.]
SPITZER STUDY OF DISKS IN � ORI CLUSTER 1071No. 2, 2007
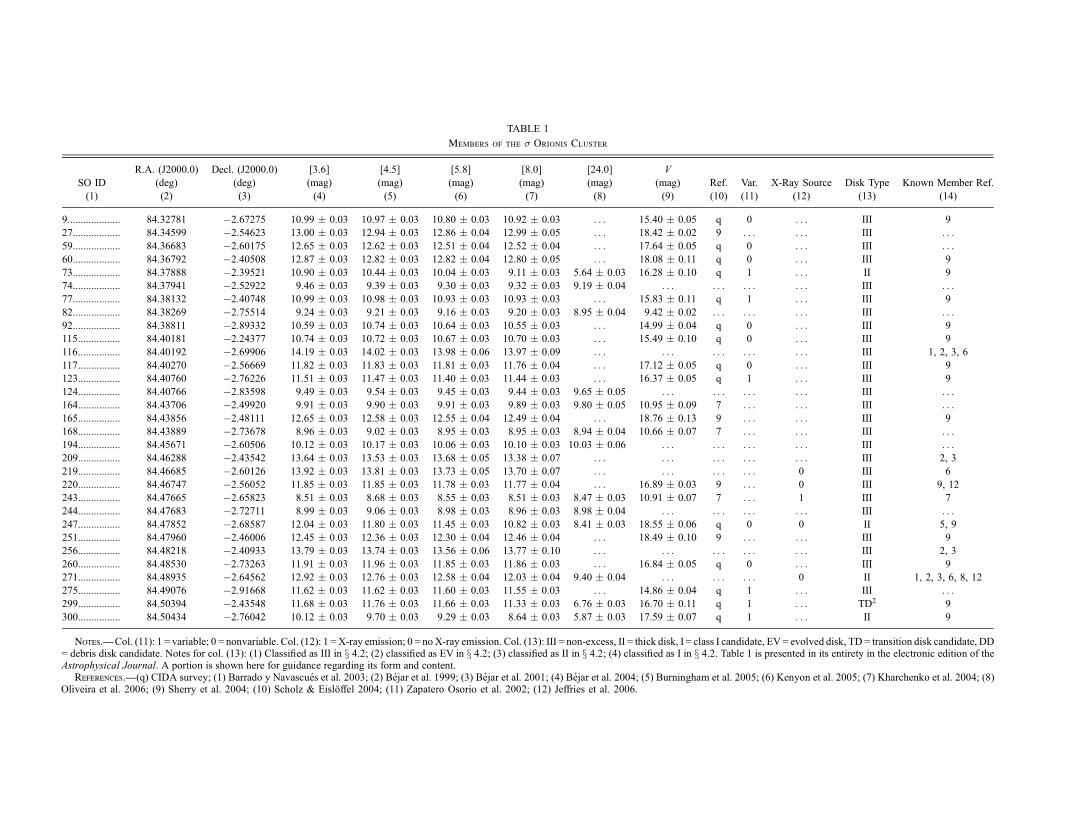
TABLE 1
Members of the � Orionis Cluster
SO ID
(1)
R.A. (J2000.0)
(deg)
(2)
Decl. (J2000.0)
(deg)
(3)
[3.6]
(mag)
(4)
[4.5]
(mag)
(5)
[5.8]
(mag)
(6)
[8.0]
(mag)
(7)
[24.0]
(mag)
(8)
V
(mag)
(9)
Ref.
(10)
Var.
(11)
X-Ray Source
(12)
Disk Type
(13)
Known Member Ref.
(14)
9.................... 84.32781 �2.67275 10.99 � 0.03 10.97 � 0.03 10.80 � 0.03 10.92 � 0.03 . . . 15.40 � 0.05 q 0 . . . III 9
27.................. 84.34599 �2.54623 13.00 � 0.03 12.94 � 0.03 12.86 � 0.04 12.99 � 0.05 . . . 18.42 � 0.02 9 . . . . . . III . . .
59.................. 84.36683 �2.60175 12.65 � 0.03 12.62 � 0.03 12.51 � 0.04 12.52 � 0.04 . . . 17.64 � 0.05 q 0 . . . III . . .
60.................. 84.36792 �2.40508 12.87 � 0.03 12.82 � 0.03 12.82 � 0.04 12.80 � 0.05 . . . 18.08 � 0.11 q 0 . . . III 9
73.................. 84.37888 �2.39521 10.90 � 0.03 10.44 � 0.03 10.04 � 0.03 9.11 � 0.03 5.64 � 0.03 16.28 � 0.10 q 1 . . . II 9
74.................. 84.37941 �2.52922 9.46 � 0.03 9.39 � 0.03 9.30 � 0.03 9.32 � 0.03 9.19 � 0.04 . . . . . . . . . . . . III . . .
77.................. 84.38132 �2.40748 10.99 � 0.03 10.98 � 0.03 10.93 � 0.03 10.93 � 0.03 . . . 15.83 � 0.11 q 1 . . . III 9
82.................. 84.38269 �2.75514 9.24 � 0.03 9.21 � 0.03 9.16 � 0.03 9.20 � 0.03 8.95 � 0.04 9.42 � 0.02 . . . . . . . . . III . . .
92.................. 84.38811 �2.89332 10.59 � 0.03 10.74 � 0.03 10.64 � 0.03 10.55 � 0.03 . . . 14.99 � 0.04 q 0 . . . III 9
115................ 84.40181 �2.24377 10.74 � 0.03 10.72 � 0.03 10.67 � 0.03 10.70 � 0.03 . . . 15.49 � 0.10 q 0 . . . III 9
116................ 84.40192 �2.69906 14.19 � 0.03 14.02 � 0.03 13.98 � 0.06 13.97 � 0.09 . . . . . . . . . . . . . . . III 1, 2, 3, 6
117................ 84.40270 �2.56669 11.82 � 0.03 11.83 � 0.03 11.81 � 0.03 11.76 � 0.04 . . . 17.12 � 0.05 q 0 . . . III 9
123................ 84.40760 �2.76226 11.51 � 0.03 11.47 � 0.03 11.40 � 0.03 11.44 � 0.03 . . . 16.37 � 0.05 q 1 . . . III 9
124................ 84.40766 �2.83598 9.49 � 0.03 9.54 � 0.03 9.45 � 0.03 9.44 � 0.03 9.65 � 0.05 . . . . . . . . . . . . III . . .
164................ 84.43706 �2.49920 9.91 � 0.03 9.90 � 0.03 9.91 � 0.03 9.89 � 0.03 9.80 � 0.05 10.95 � 0.09 7 . . . . . . III . . .
165................ 84.43856 �2.48111 12.65 � 0.03 12.58 � 0.03 12.55 � 0.04 12.49 � 0.04 . . . 18.76 � 0.13 9 . . . . . . III 9
168................ 84.43889 �2.73678 8.96 � 0.03 9.02 � 0.03 8.95 � 0.03 8.95 � 0.03 8.94 � 0.04 10.66 � 0.07 7 . . . . . . III . . .
194................ 84.45671 �2.60506 10.12 � 0.03 10.17 � 0.03 10.06 � 0.03 10.10 � 0.03 10.03 � 0.06 . . . . . . . . . . . . III . . .
209................ 84.46288 �2.43542 13.64 � 0.03 13.53 � 0.03 13.68 � 0.05 13.38 � 0.07 . . . . . . . . . . . . . . . III 2, 3
219................ 84.46685 �2.60126 13.92 � 0.03 13.81 � 0.03 13.73 � 0.05 13.70 � 0.07 . . . . . . . . . . . . 0 III 6
220................ 84.46747 �2.56052 11.85 � 0.03 11.85 � 0.03 11.78 � 0.03 11.77 � 0.04 . . . 16.89 � 0.03 9 . . . 0 III 9, 12
243................ 84.47665 �2.65823 8.51 � 0.03 8.68 � 0.03 8.55 � 0.03 8.51 � 0.03 8.47 � 0.03 10.91 � 0.07 7 . . . 1 III 7
244................ 84.47683 �2.72711 8.99 � 0.03 9.06 � 0.03 8.98 � 0.03 8.96 � 0.03 8.98 � 0.04 . . . . . . . . . . . . III . . .
247................ 84.47852 �2.68587 12.04 � 0.03 11.80 � 0.03 11.45 � 0.03 10.82 � 0.03 8.41 � 0.03 18.55 � 0.06 q 0 0 II 5, 9
251................ 84.47960 �2.46006 12.45 � 0.03 12.36 � 0.03 12.30 � 0.04 12.46 � 0.04 . . . 18.49 � 0.10 9 . . . . . . III 9
256................ 84.48218 �2.40933 13.79 � 0.03 13.74 � 0.03 13.56 � 0.06 13.77 � 0.10 . . . . . . . . . . . . . . . III 2, 3
260................ 84.48530 �2.73263 11.91 � 0.03 11.96 � 0.03 11.85 � 0.03 11.86 � 0.03 . . . 16.84 � 0.05 q 0 . . . III 9
271................ 84.48935 �2.64562 12.92 � 0.03 12.76 � 0.03 12.58 � 0.04 12.03 � 0.04 9.40 � 0.04 . . . . . . . . . 0 II 1, 2, 3, 6, 8, 12
275................ 84.49076 �2.91668 11.62 � 0.03 11.62 � 0.03 11.60 � 0.03 11.55 � 0.03 . . . 14.86 � 0.04 q 1 . . . III . . .
299................ 84.50394 �2.43548 11.68 � 0.03 11.76 � 0.03 11.66 � 0.03 11.33 � 0.03 6.76 � 0.03 16.70 � 0.11 q 1 . . . TD2 9
300................ 84.50434 �2.76042 10.12 � 0.03 9.70 � 0.03 9.29 � 0.03 8.64 � 0.03 5.87 � 0.03 17.59 � 0.07 q 1 . . . II 9
Notes.—Col. (11): 1 = variable; 0 = nonvariable. Col. (12): 1 =X-ray emission; 0 = noX-ray emission. Col. (13): III = non-excess, II = thick disk, I = class I candidate, EV= evolved disk, TD = transition disk candidate, DD= debris disk candidate. Notes for col. (13): (1) Classified as III in x 4.2; (2) classified as EV in x 4.2; (3) classified as II in x 4.2; (4) classified as I in x 4.2. Table 1 is presented in its entirety in the electronic edition of theAstrophysical Journal. A portion is shown here for guidance regarding its form and content.
References.—(q) CIDA survey; (1) Barrado y Navascues et al. 2003; (2) Bejar et al. 1999; (3) Bejar et al. 2001; (4) Bejar et al. 2004; (5) Burningham et al. 2005; (6) Kenyon et al. 2005; (7) Kharchenko et al. 2004; (8)Oliveira et al. 2006; (9) Sherry et al. 2004; (10) Scholz & Eisloffel 2004; (11) Zapatero Osorio et al. 2002; (12) Jeffries et al. 2006.
of Table 1. The last column shows the disk classification basedon the IRAC and MIPS analysis, which is discussed in the fol-lowing section.
4. RESULTS
4.1. Infrared Color-Color Diagrams
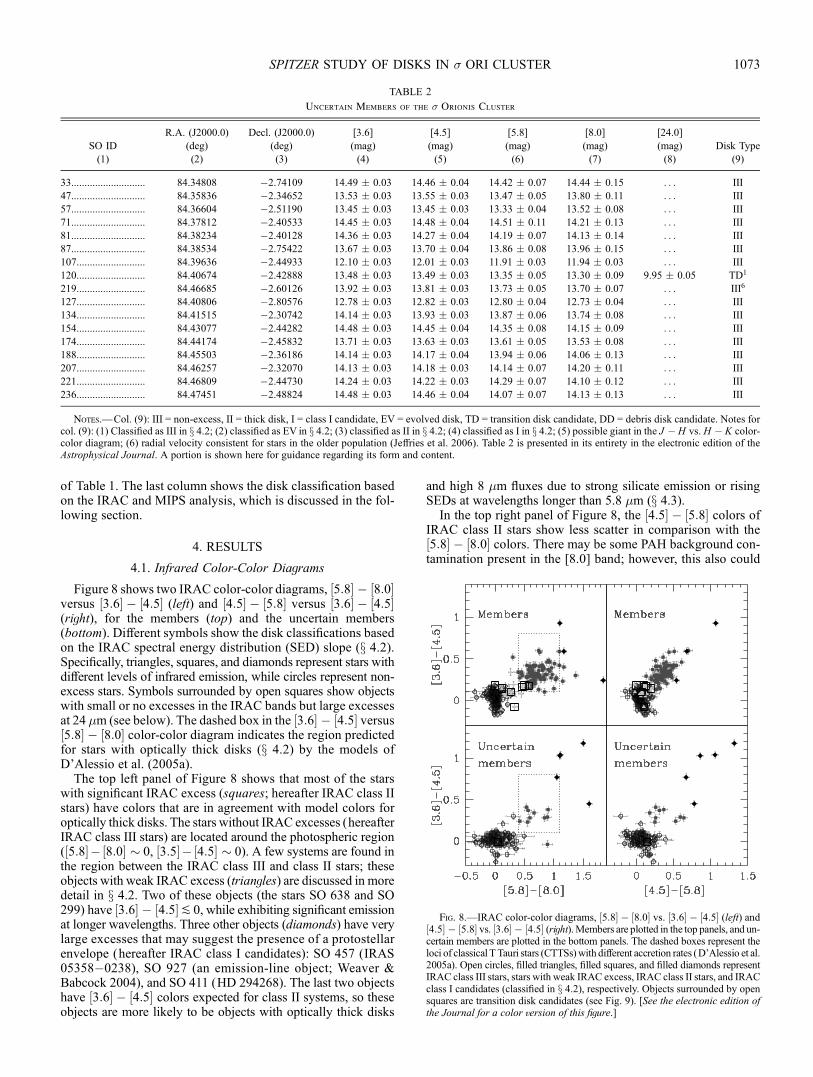
Figure 8 shows two IRAC color-color diagrams, 5:8½ � � 8:0½ �versus 3:6½ � � 4:5½ � (left) and 4:5½ � � 5:8½ � versus 3:6½ � � 4:5½ �(right), for the members (top) and the uncertain members(bottom). Different symbols show the disk classifications basedon the IRAC spectral energy distribution (SED) slope (x 4.2).Specifically, triangles, squares, and diamonds represent stars withdifferent levels of infrared emission, while circles represent non-excess stars. Symbols surrounded by open squares show objectswith small or no excesses in the IRAC bands but large excessesat 24 �m (see below). The dashed box in the 3:6½ � � 4:5½ � versus5:8½ � � 8:0½ � color-color diagram indicates the region predictedfor stars with optically thick disks (x 4.2) by the models ofD’Alessio et al. (2005a).
The top left panel of Figure 8 shows that most of the starswith significant IRAC excess (squares; hereafter IRAC class IIstars) have colors that are in agreement with model colors foroptically thick disks. The stars without IRAC excesses (hereafterIRAC class III stars) are located around the photospheric region( 5:8½ �� 8:0½ � � 0, 3:5½ �� 4:5½ � � 0). A few systems are found inthe region between the IRAC class III and class II stars; theseobjects with weak IRAC excess (triangles) are discussed in moredetail in x 4.2. Two of these objects (the stars SO 638 and SO299) have 3:6½ � � 4:5½ �P 0, while exhibiting significant emissionat longer wavelengths. Three other objects (diamonds) have verylarge excesses that may suggest the presence of a protostellarenvelope (hereafter IRAC class I candidates): SO 457 (IRAS05358�0238), SO 927 (an emission-line object; Weaver &Babcock 2004), and SO 411 (HD 294268). The last two objectshave 3:6½ � � 4:5½ � colors expected for class II systems, so theseobjects are more likely to be objects with optically thick disks
and high 8 �m fluxes due to strong silicate emission or risingSEDs at wavelengths longer than 5.8 �m (x 4.3).
In the top right panel of Figure 8, the 4:5½ � � 5:8½ � colors ofIRAC class II stars show less scatter in comparison with the5:8½ � � 8:0½ � colors. There may be some PAH background con-tamination present in the [8.0] band; however, this also could
Fig. 8.—IRAC color-color diagrams, 5:8½ � � 8:0½ � vs. 3:6½ � � 4:5½ � (left) and4:5½ � � 5:8½ � vs. 3:6½ � � 4:5½ � (right).Members are plotted in the top panels, and un-certain members are plotted in the bottom panels. The dashed boxes represent theloci of classical T Tauri stars (CTTSs)with different accretion rates (D’Alessio et al.2005a). Open circles, filled triangles, filled squares, and filled diamonds representIRAC class III stars, stars with weak IRAC excess, IRAC class II stars, and IRACclass I candidates (classified in x 4.2), respectively. Objects surrounded by opensquares are transition disk candidates (see Fig. 9). [See the electronic edition ofthe Journal for a color version of this figure.]
TABLE 2
Uncertain Members of the � Orionis Cluster
SO ID
(1)
R.A. (J2000.0)
(deg)
(2)
Decl. (J2000.0)
(deg)
(3)
[3.6]
(mag)
(4)
[4.5]
(mag)
(5)
[5.8]
(mag)
(6)
[8.0]
(mag)
(7)
[24.0]
(mag)
(8)
Disk Type
(9)
33............................ 84.34808 �2.74109 14.49 � 0.03 14.46 � 0.04 14.42 � 0.07 14.44 � 0.15 . . . III
47............................ 84.35836 �2.34652 13.53 � 0.03 13.55 � 0.03 13.47 � 0.05 13.80 � 0.11 . . . III
57............................ 84.36604 �2.51190 13.45 � 0.03 13.45 � 0.03 13.33 � 0.04 13.52 � 0.08 . . . III
71............................ 84.37812 �2.40533 14.45 � 0.03 14.48 � 0.04 14.51 � 0.11 14.21 � 0.13 . . . III
81............................ 84.38234 �2.40128 14.36 � 0.03 14.27 � 0.04 14.19 � 0.07 14.13 � 0.14 . . . III
87............................ 84.38534 �2.75422 13.67 � 0.03 13.70 � 0.04 13.86 � 0.08 13.96 � 0.15 . . . III
107.......................... 84.39636 �2.44933 12.10 � 0.03 12.01 � 0.03 11.91 � 0.03 11.94 � 0.03 . . . III
120.......................... 84.40674 �2.42888 13.48 � 0.03 13.49 � 0.03 13.35 � 0.05 13.30 � 0.09 9.95 � 0.05 TD1
219.......................... 84.46685 �2.60126 13.92 � 0.03 13.81 � 0.03 13.73 � 0.05 13.70 � 0.07 . . . III6
127.......................... 84.40806 �2.80576 12.78 � 0.03 12.82 � 0.03 12.80 � 0.04 12.73 � 0.04 . . . III
134.......................... 84.41515 �2.30742 14.14 � 0.03 13.93 � 0.03 13.87 � 0.06 13.74 � 0.08 . . . III
154.......................... 84.43077 �2.44282 14.48 � 0.03 14.45 � 0.04 14.35 � 0.08 14.15 � 0.09 . . . III
174.......................... 84.44174 �2.45832 13.71 � 0.03 13.63 � 0.03 13.61 � 0.05 13.53 � 0.08 . . . III
188.......................... 84.45503 �2.36186 14.14 � 0.03 14.17 � 0.04 13.94 � 0.06 14.06 � 0.13 . . . III
207.......................... 84.46257 �2.32070 14.13 � 0.03 14.18 � 0.03 14.14 � 0.07 14.20 � 0.11 . . . III
221.......................... 84.46809 �2.44730 14.24 � 0.03 14.22 � 0.03 14.29 � 0.07 14.10 � 0.12 . . . III
236.......................... 84.47451 �2.48824 14.48 � 0.03 14.46 � 0.04 14.07 � 0.07 14.13 � 0.13 . . . III
Notes.—Col. (9): III = non-excess, II = thick disk, I = class I candidate, EV = evolved disk, TD = transition disk candidate, DD = debris disk candidate. Notes forcol. (9): (1) Classified as III in x 4.2; (2) classified as EV in x 4.2; (3) classified as II in x 4.2; (4) classified as I in x 4.2; (5) possible giant in the J � H vs. H � K color-color diagram; (6) radial velocity consistent for stars in the older population (Jeffries et al. 2006). Table 2 is presented in its entirety in the electronic edition of theAstrophysical Journal. A portion is shown here for guidance regarding its form and content.
SPITZER STUDY OF DISKS IN � ORI CLUSTER 1073
indicate intrinsic differences in disk flaring or other propertiesthat may be more easily detected at 8 �m (D’Alessio et al. 2006).For example, the IRAC class II stars located redward from thedashed box (SO 462, SO 774, and SO 1266) and the star SO 411(with 5:8½ �� 8:0½ � > 1:5) in the top left panel, have a flat or ris-ing SED at wavelengths longer than 5.8 �m (see x 4.3).
In the bottom panels, nine IRAC class II stars are located inthe region expected for stars with optically thick disks and thusare likely to be clustermembers. One IRAC class II star (SO1356),located below the model region, has an excess at 5:8½ � � 8:0½ �, butnot at 3:6½ � � 4:5½ � or 4:5½ � � 5:8½ �. This star was not covered inthe MIPS field, so it is not clear if the excess observed at 8 �moriginates from PAH background contamination or from emis-sion from an outer disk. The object SO 1293 (represented by thetriangle) has a larger excess at 4:5½ � � 5:8½ � than at 5:8½ � � 8:0½ �;it is faint (J ¼ 15:64) and so could have a longer wavelength ex-cess below the MIPS detection limit.
Five uncertain members with very large infrared excesses(IRAC class I candidates) are plotted in the IRAC color-colordiagrams: SO 950, SO 336, SO 361, SO 916, and SO 668. Be-cause active galactic nuclei (AGNs) are located in the same re-gion as the class I objects in these diagrams (Stern et al. 2005)and are too faint to easily detect spatial extension, additional dataare needed to confirm these objects as protostellar members.
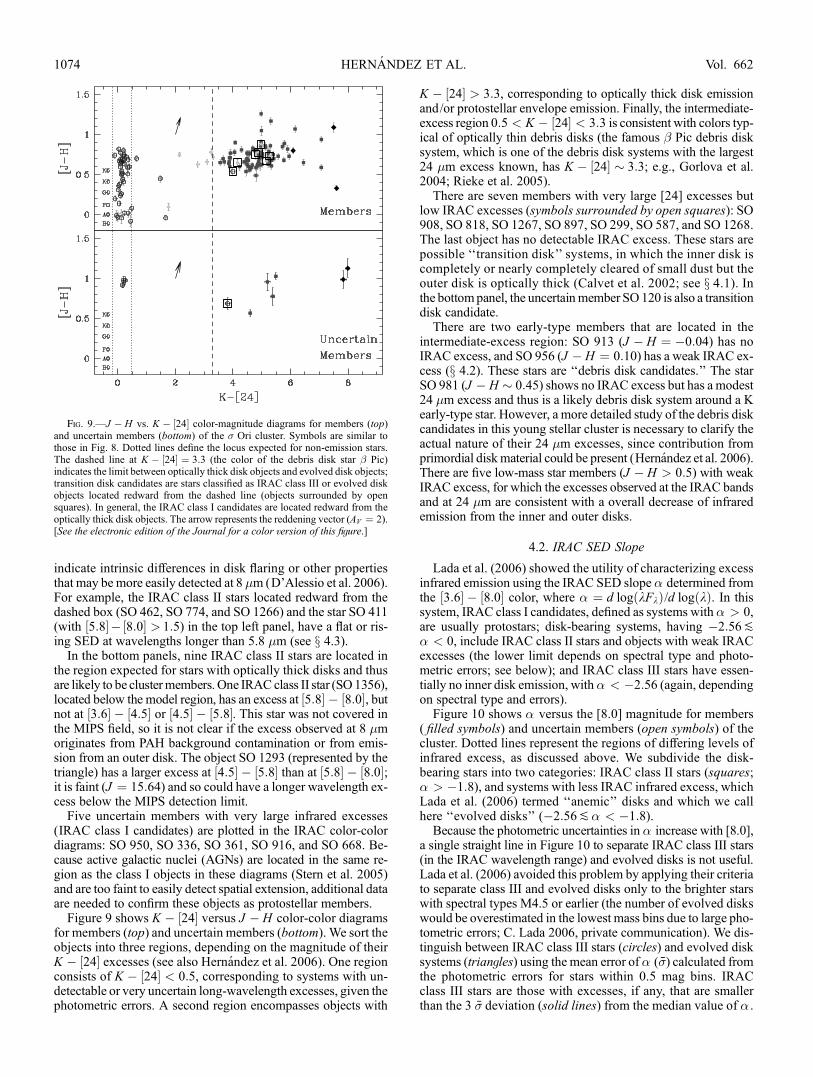
Figure 9 shows K � 24½ � versus J � H color-color diagramsfor members (top) and uncertain members (bottom). We sort theobjects into three regions, depending on the magnitude of theirK � 24½ � excesses (see also Hernandez et al. 2006). One regionconsists of K � 24½ � < 0:5, corresponding to systems with un-detectable or very uncertain long-wavelength excesses, given thephotometric errors. A second region encompasses objects with
K � 24½ � > 3:3, corresponding to optically thick disk emissionand/or protostellar envelope emission. Finally, the intermediate-excess region 0:5 < K � 24½ � < 3:3 is consistent with colors typ-ical of optically thin debris disks (the famous � Pic debris disksystem, which is one of the debris disk systems with the largest24 �m excess known, has K � 24½ � � 3:3; e.g., Gorlova et al.2004; Rieke et al. 2005).There are seven members with very large [24] excesses but
low IRAC excesses (symbols surrounded by open squares): SO908, SO 818, SO 1267, SO 897, SO 299, SO 587, and SO 1268.The last object has no detectable IRAC excess. These stars arepossible ‘‘transition disk’’ systems, in which the inner disk iscompletely or nearly completely cleared of small dust but theouter disk is optically thick (Calvet et al. 2002; see x 4.1). Inthe bottompanel, the uncertainmember SO120 is also a transitiondisk candidate.There are two early-type members that are located in the
intermediate-excess region: SO 913 (J � H ¼ �0:04) has noIRAC excess, and SO 956 (J � H ¼ 0:10) has a weak IRAC ex-cess (x 4.2). These stars are ‘‘debris disk candidates.’’ The starSO 981 (J � H � 0:45) shows no IRAC excess but has a modest24 �m excess and thus is a likely debris disk system around a Kearly-type star. However, a more detailed study of the debris diskcandidates in this young stellar cluster is necessary to clarify theactual nature of their 24 �m excesses, since contribution fromprimordial diskmaterial could be present (Hernandez et al. 2006).There are five low-mass star members (J � H > 0:5) with weakIRAC excess, for which the excesses observed at the IRAC bandsand at 24 �m are consistent with a overall decrease of infraredemission from the inner and outer disks.
4.2. IRAC SED Slope
Lada et al. (2006) showed the utility of characterizing excessinfrared emission using the IRAC SED slope � determined fromthe 3:6½ � � 8:0½ � color, where � ¼ d log kFkð Þ/d log kð Þ. In thissystem, IRAC class I candidates, defined as systems with� > 0,are usually protostars; disk-bearing systems, having �2:56P� < 0, include IRAC class II stars and objects with weak IRACexcesses (the lower limit depends on spectral type and photo-metric errors; see below); and IRAC class III stars have essen-tially no inner disk emission, with� < �2:56 (again, dependingon spectral type and errors).Figure 10 shows � versus the [8.0] magnitude for members
( filled symbols) and uncertain members (open symbols) of thecluster. Dotted lines represent the regions of differing levels ofinfrared excess, as discussed above. We subdivide the disk-bearing stars into two categories: IRAC class II stars (squares;� > �1:8), and systems with less IRAC infrared excess, whichLada et al. (2006) termed ‘‘anemic’’ disks and which we callhere ‘‘evolved disks’’ (�2:56P� < �1:8).Because the photometric uncertainties in � increase with [8.0],
a single straight line in Figure 10 to separate IRAC class III stars(in the IRAC wavelength range) and evolved disks is not useful.Lada et al. (2006) avoided this problem by applying their criteriato separate class III and evolved disks only to the brighter starswith spectral types M4.5 or earlier (the number of evolved diskswould be overestimated in the lowest mass bins due to large pho-tometric errors; C. Lada 2006, private communication). We dis-tinguish between IRAC class III stars (circles) and evolved disksystems (triangles) using the mean error of � (�) calculated fromthe photometric errors for stars within 0.5 mag bins. IRACclass III stars are those with excesses, if any, that are smallerthan the 3 � deviation (solid lines) from the median value of � .
Fig. 9.—J � H vs. K � 24½ � color-magnitude diagrams for members (top)and uncertain members (bottom) of the � Ori cluster. Symbols are similar tothose in Fig. 8. Dotted lines define the locus expected for non-emission stars.The dashed line at K � 24½ � ¼ 3:3 (the color of the debris disk star � Pic)indicates the limit between optically thick disk objects and evolved disk objects;transition disk candidates are stars classified as IRAC class III or evolved diskobjects located redward from the dashed line (objects surrounded by opensquares). In general, the IRAC class I candidates are located redward from theoptically thick disk objects. The arrow represents the reddening vector (AV ¼ 2).[See the electronic edition of the Journal for a color version of this figure.]
HERNANDEZ ET AL.1074 Vol. 662
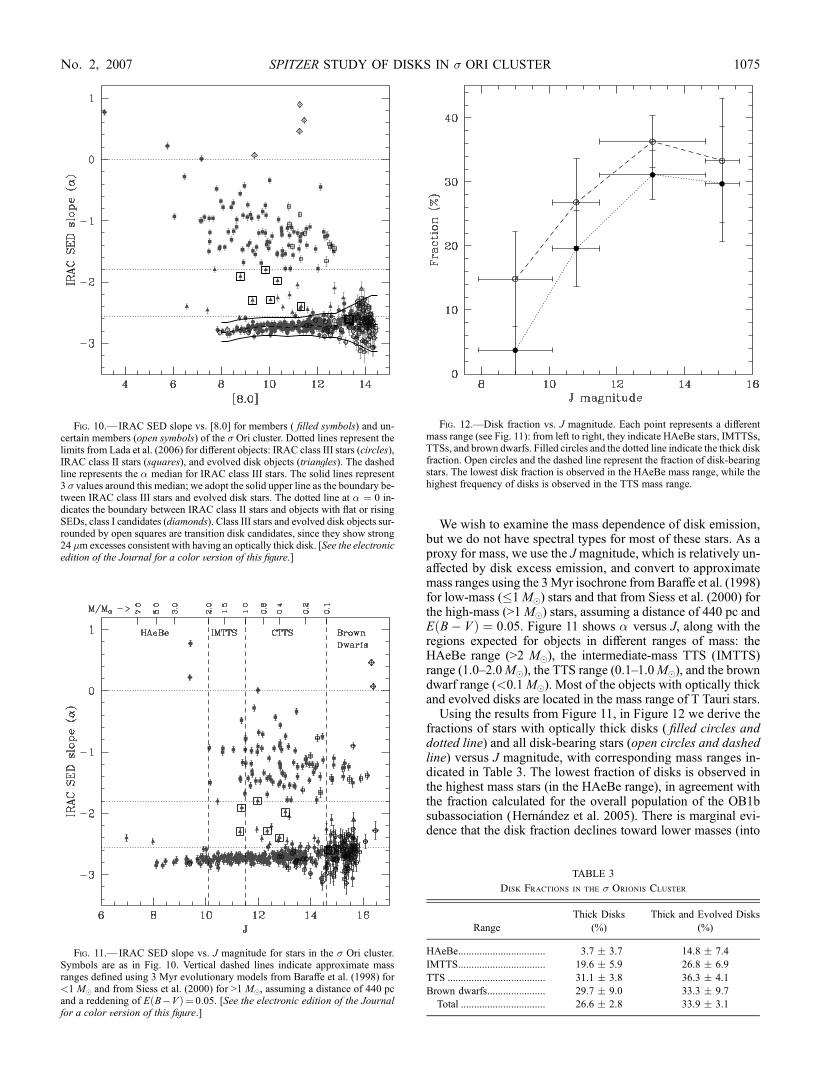
We wish to examine the mass dependence of disk emission,but we do not have spectral types for most of these stars. As aproxy for mass, we use the Jmagnitude, which is relatively un-affected by disk excess emission, and convert to approximatemass ranges using the 3Myr isochrone from Baraffe et al. (1998)for low-mass (�1M�) stars and that from Siess et al. (2000) forthe high-mass (>1M�) stars, assuming a distance of 440 pc andE B� Vð Þ ¼ 0:05. Figure 11 shows � versus J, along with theregions expected for objects in different ranges of mass: theHAeBe range (>2 M�), the intermediate-mass TTS (IMTTS)range (1.0Y2.0M�), the TTS range (0.1Y1.0M�), and the browndwarf range (<0.1M�). Most of the objects with optically thickand evolved disks are located in the mass range of T Tauri stars.
Using the results from Figure 11, in Figure 12 we derive thefractions of stars with optically thick disks ( filled circles anddotted line) and all disk-bearing stars (open circles and dashedline) versus J magnitude, with corresponding mass ranges in-dicated in Table 3. The lowest fraction of disks is observed inthe highest mass stars (in the HAeBe range), in agreement withthe fraction calculated for the overall population of the OB1bsubassociation (Hernandez et al. 2005). There is marginal evi-dence that the disk fraction declines toward lower masses (into
Fig. 12.—Disk fraction vs. J magnitude. Each point represents a differentmass range (see Fig. 11): from left to right, they indicate HAeBe stars, IMTTSs,TTSs, and brown dwarfs. Filled circles and the dotted line indicate the thick diskfraction. Open circles and the dashed line represent the fraction of disk-bearingstars. The lowest disk fraction is observed in the HAeBe mass range, while thehighest frequency of disks is observed in the TTS mass range.
Fig. 10.—IRAC SED slope vs. [8.0] for members ( filled symbols) and un-certain members (open symbols) of the � Ori cluster. Dotted lines represent thelimits from Lada et al. (2006) for different objects: IRAC class III stars (circles),IRAC class II stars (squares), and evolved disk objects (triangles). The dashedline represents the � median for IRAC class III stars. The solid lines represent3 � values around this median; we adopt the solid upper line as the boundary be-tween IRAC class III stars and evolved disk stars. The dotted line at � ¼ 0 in-dicates the boundary between IRAC class II stars and objects with flat or risingSEDs, class I candidates (diamonds). Class III stars and evolved disk objects sur-rounded by open squares are transition disk candidates, since they show strong24 �m excesses consistent with having an optically thick disk. [See the electronicedition of the Journal for a color version of this figure.]
Fig. 11.—IRAC SED slope vs. J magnitude for stars in the � Ori cluster.Symbols are as in Fig. 10. Vertical dashed lines indicate approximate massranges defined using 3 Myr evolutionary models from Baraffe et al. (1998) for<1 M� and from Siess et al. (2000) for >1 M�, assuming a distance of 440 pcand a reddening of E B�Vð Þ ¼ 0:05. [See the electronic edition of the Journalfor a color version of this figure.]
TABLE 3
Disk Fractions in the � Orionis Cluster
Range
Thick Disks
(%)
Thick and Evolved Disks
(%)
HAeBe................................. 3.7 � 3.7 14.8 � 7.4
IMTTS................................. 19.6 � 5.9 26.8 � 6.9
TTS ..................................... 31.1 � 3.8 36.3 � 4.1
Brown dwarfs...................... 29.7 � 9.0 33.3 � 9.7
Total ................................ 26.6 � 2.8 33.9 � 3.1
SPITZER STUDY OF DISKS IN � ORI CLUSTER 1075No. 2, 2007
the brown dwarf range), in agreement with results from Ladaet al. (2006) for the young (2Y3Myr) stellar group IC 348. Never-theless, including the error bars, the fraction is also consistent withno mass dependence toward lower masses. The fraction of thickdisks in the TTSmass range agrees with the result fromOliveiraet al. (2006; 33% � 6%) for low-mass stars.
Only 15% � 5% of disk-bearing stars in the TTS mass rangeare evolved disk objects, approximately in agreement with re-sults from the 4 Myr old cluster Tr 37 (10%; Sicilia-Aguilaret al. 2006), although with better statistics and higher photo-metric accuracy. If we assume a steady state evolution of disksand also assume that the evolved disks are going through aphase of clearing small dust particles in the inner disk, then ourobserved frequency suggests a timescale of inner disk clearing of�0:15(3 Myr) � 0:45 Myr.
4.3. Disk Diversity: SEDs
Figure 13 shows SEDs (data from IRAC,MIPS, 2MASS, andoptical B, V, R, and I magnitudes when available) for selected
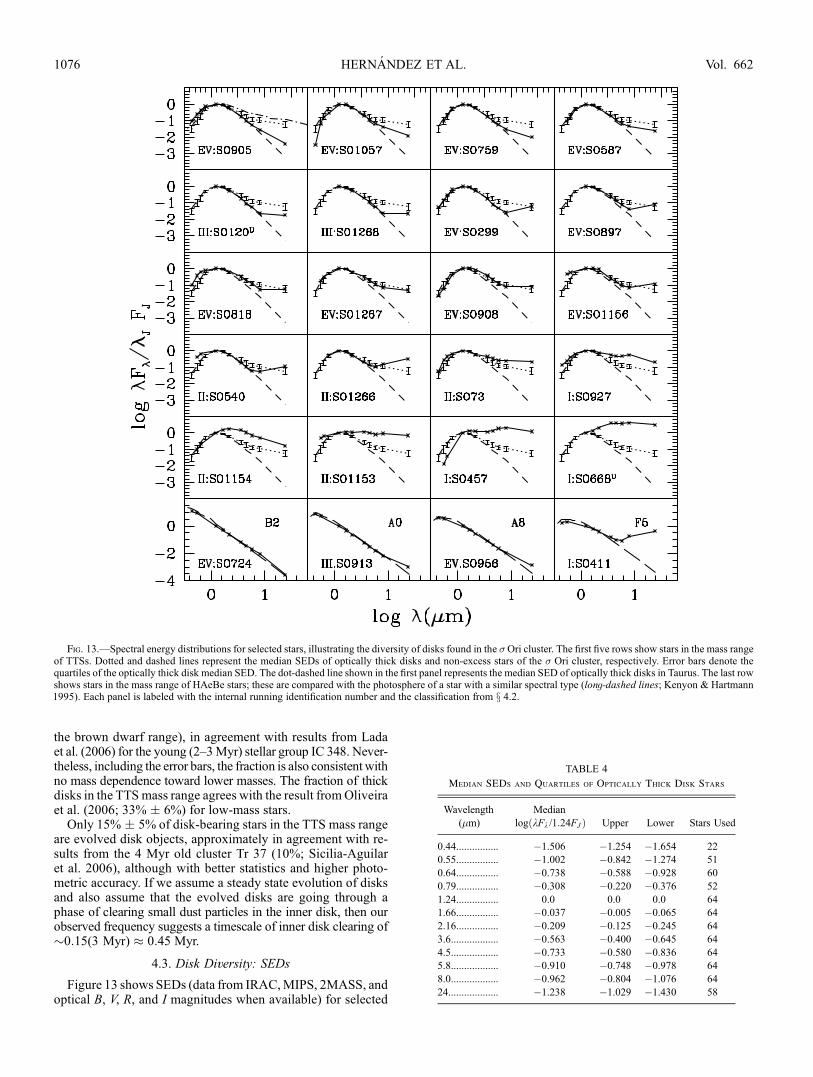
Fig. 13.—Spectral energy distributions for selected stars, illustrating the diversity of disks found in the �Ori cluster. The first five rows show stars in the mass rangeof TTSs. Dotted and dashed lines represent the median SEDs of optically thick disks and non-excess stars of the � Ori cluster, respectively. Error bars denote thequartiles of the optically thick disk median SED. The dot-dashed line shown in the first panel represents the median SED of optically thick disks in Taurus. The last rowshows stars in the mass range of HAeBe stars; these are compared with the photosphere of a star with a similar spectral type (long-dashed lines; Kenyon & Hartmann1995). Each panel is labeled with the internal running identification number and the classification from x 4.2.
TABLE 4
Median SEDs and Quartiles of Optically Thick Disk Stars
Wavelength
(�m)
Median
log kFk /1:24FJð Þ Upper Lower Stars Used
0.44................ �1.506 �1.254 �1.654 22
0.55................ �1.002 �0.842 �1.274 51
0.64................ �0.738 �0.588 �0.928 60
0.79................ �0.308 �0.220 �0.376 52
1.24................ 0.0 0.0 0.0 64
1.66................ �0.037 �0.005 �0.065 64
2.16................ �0.209 �0.125 �0.245 64
3.6.................. �0.563 �0.400 �0.645 64
4.5.................. �0.733 �0.580 �0.836 64
5.8.................. �0.910 �0.748 �0.978 64
8.0.................. �0.962 �0.804 �1.076 64
24................... �1.238 �1.029 �1.430 58
HERNANDEZ ET AL.1076 Vol. 662
members. The first five rows show the SEDs of stars in the massrange of TTSs (0.1Y1.0M�), while the last row shows the SEDsof stars in the mass range of HAeBe stars (>2M�). SEDs (solidlines) are normalized to the J band and are sorted by differentlevels of IR excesses, indicating differences in the disks. Eachpanel is labeled with the internal running identification numberand the classification from the IRAC SED slope analysis (x 4.2).The dotted line represents the median SED (Table 4) of opti-cally thick disk stars in the mass range of TTSs defined in Fig-ure 11 (hereafter the optically thick disk median SED); errorbars denote the quartiles of the distribution. This typical diskemission in the � Ori cluster is lower than the median in Taurus(D’Alessio et al. 1999; dot-dashed line in the top left panel ),which has an age of �1Y2 Myr, indicating differences due toevolutionary effects such as grain growth and/or settling to thedisk midplane (see also Sicilia-Aguilar et al. 2006; Lada et al.2006) or a lower accretion rate (D’Alessio et al. 2006). The dashedlines represent the median photospheric SED (Table 5) in theT Tauri mass range.
The first row of Figure 13 shows the SEDs of evolved diskobjects (SO 905, SO 1057, SO 759, and SO 587) that exhibitmodest infrared disk emission. The lower level of infrared excessemission could be explained by decreasing the height of the ir-radiation surface in the disks due to a higher degree of settling,which diminishes the degree offlaring, thus producing flatter diskstructures (D’Alessio et al. 2006). The second row of SEDs (SO120, SO 1268, SO 299, and SO 897) shows some transition diskcandidates, which exhibit little or no excess in IRAC bands buthave 24 �m emission similar to that of optically thick disks. Thisindicates a removal of small dust particles in the inner disks,but not depletion or removal in the outer disk. In the next rows,the stars SO 818, SO 1267, SO 908, SO 1156, SO 540, andSO 1266 show somewhat weaker IRAC excesses. The starsSO 73, SO 927, SO 1154, SO 1153, SO 457, and SO 668 showlarger infrared excesses than the optically thick median, whichmight indicate more highly flared disk structure (D’Alessioet al. 2006; Dullemond & Dominik 2005), edge-on disks, or acontribution from an envelope. SO 927 has strong emission inH� (Weaver & Babcock 2004). SO 1153 (V510 Ori; HH 444)and SO 1154 (HH 445) are Herbig-Haro objects producingcollimated outflows (Andrews et al. 2004). Finally, SO 457has been identified by Oliveira & van Loon (2004) as a class Iobject.
TABLE 5
Median SEDs and Quartiles of Non-excess Stars
Wavelength
(�m)
Median
log kFk /1:24FJð Þ Upper Lower Stars Used
0.44................. �1.360 �1.206 �1.550 60
0.55................. �0.863 �0.610 �1.166 116
0.64................. �0.597 �0.400 �0.870 128
0.79................. �0.204 �0.144 �0.324 97
1.235............... 0 0 0 137
1.662............... �0.057 �0.037 �0.073 137
2.159............... �0.257 �0.241 �0.273 137
3.6................... �0.748 �0.733 �0.777 137
4.5................... �1.038 �1.007 �1.083 137
5.8................... �1.306 �1.278 �1.348 137
8.0................... �1.693 �1.660 �1.723 137
24.................... �3.259 �3.198 �3.431 42a
a Includes stars in the mass range of IMTTSs and HAeBe stars.
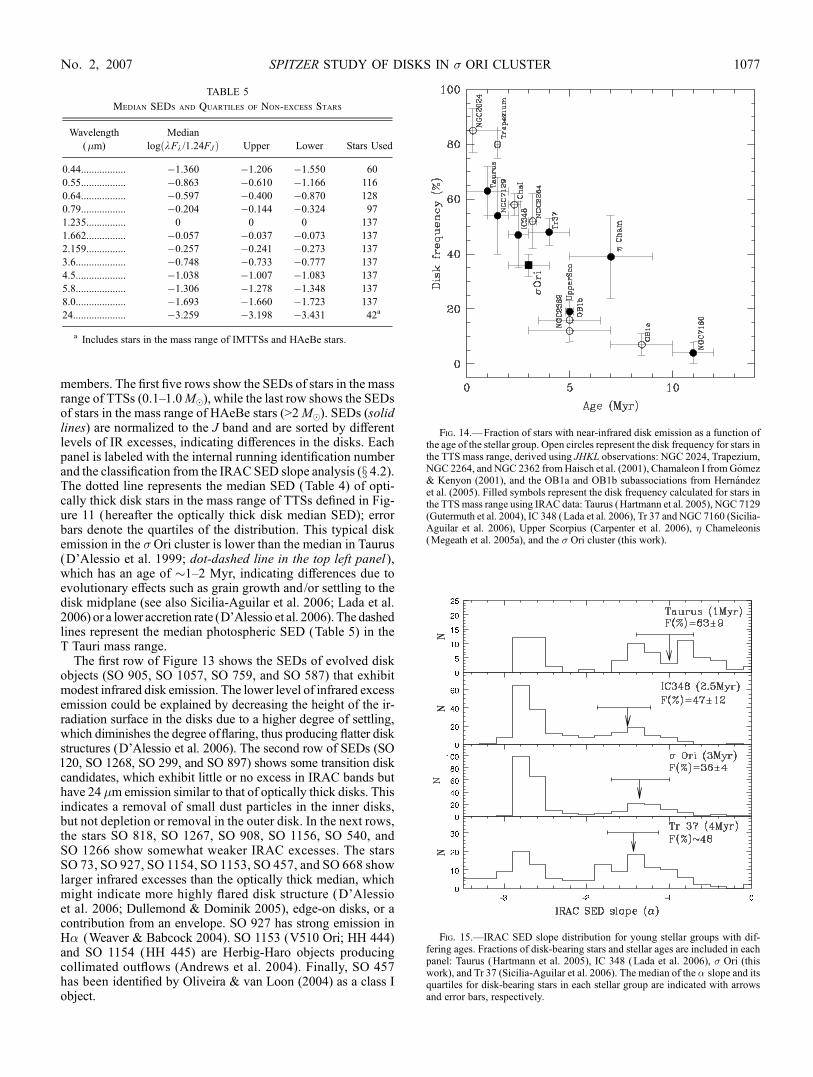
Fig. 14.—Fraction of stars with near-infrared disk emission as a function ofthe age of the stellar group. Open circles represent the disk frequency for stars inthe TTS mass range, derived using JHKL observations: NGC 2024, Trapezium,NGC 2264, and NGC 2362 fromHaisch et al. (2001), Chamaleon I fromGomez& Kenyon (2001), and the OB1a and OB1b subassociations from Hernandezet al. (2005). Filled symbols represent the disk frequency calculated for stars inthe TTSmass range using IRAC data: Taurus (Hartmann et al. 2005), NGC 7129(Gutermuth et al. 2004), IC 348 (Lada et al. 2006), Tr 37 and NGC 7160 (Sicilia-Aguilar et al. 2006), Upper Scorpius (Carpenter et al. 2006), � Chameleonis(Megeath et al. 2005a), and the � Ori cluster (this work).
Fig. 15.—IRAC SED slope distribution for young stellar groups with dif-fering ages. Fractions of disk-bearing stars and stellar ages are included in eachpanel: Taurus (Hartmann et al. 2005), IC 348 (Lada et al. 2006), � Ori (thiswork), and Tr 37 (Sicilia-Aguilar et al. 2006). The median of the � slope and itsquartiles for disk-bearing stars in each stellar group are indicated with arrowsand error bars, respectively.
SPITZER STUDY OF DISKS IN � ORI CLUSTER 1077No. 2, 2007
In the last row of Figure 13, SEDs of earlier type members arecompared with photospheres of stars with similar spectral types(long-dashed line; Kenyon & Hartmann 1995). The star SO 724(type B2; Guetter 1981) shows a small excess at 8 �mbut has noexcess at 24 �m. This star was classified in x 4.2 as an evolveddisk object, possibly due to a background PAH contamination at8 �m. The stars SO 913 (type B9.5; Guetter 1981) and SO 956(type A8; Guetter 1981) show small or no excesses in the IRACbands but have significant excesses at 24 �m, consistent withbeing debris disk stars. Finally, the star SO 411, classified as aclass I candidate in x 4.2, shows small excesses at wavelengthsshorter than 5.8 �mand a rising SED at longer wavelengths. Thisemission-line star,with spectral type F5 (Gregorio-Hetem&Hetem2002), could be an accreting transition disk object in the HAeBemass range. This object alternatively could be considered to bean IMTTS, as F5 is the usual transition spectral type betweenHAeBe stars and IMTTSs (see Hernandez et al. 2004).
Most of the disk classifications using the IRACSEDslope (x 4.2)agree with the results from analyzing SEDs. However, a few
objects were reclassified, taking into account the overall SEDs;these objects are labeled in Tables 1 and 2.
4.4. Disk Evolution
Figure 14 shows the fraction of stars in the TTS mass rangewith near-infrared disk emission in different stellar groups, as afunction of age (Hernandez et al. 2005; Haisch et al. 2001).Recent Spitzer results for the young stellar clusters NGC 7129(Gutermuth et al. 2004), Taurus (Hartmann et al. 2005), �Chameleonis (Megeath et al. 2005a), Tr 37 and NGC 7160(Sicilia-Aguilar et al. 2006), IC 348 (Lada et al. 2006), and UpperScorpius (Carpenter et al. 2006) have been included in this plot.The disk fractions shown in Figure 14 include stars with opticallythick and evolved disks (disk-bearing stars), detected mostly us-ing IRAC photometry. The � Ori cluster ( filled square) follows(within the scatter of the distribution) the disk fraction trend out-lined by other stellar groups (Haisch et al. 2001; L. Hillenbrandet al. 2007, in preparation). Besides the differences in distance ofthe stellar groups, the samples in Figure 14 include mostly K and
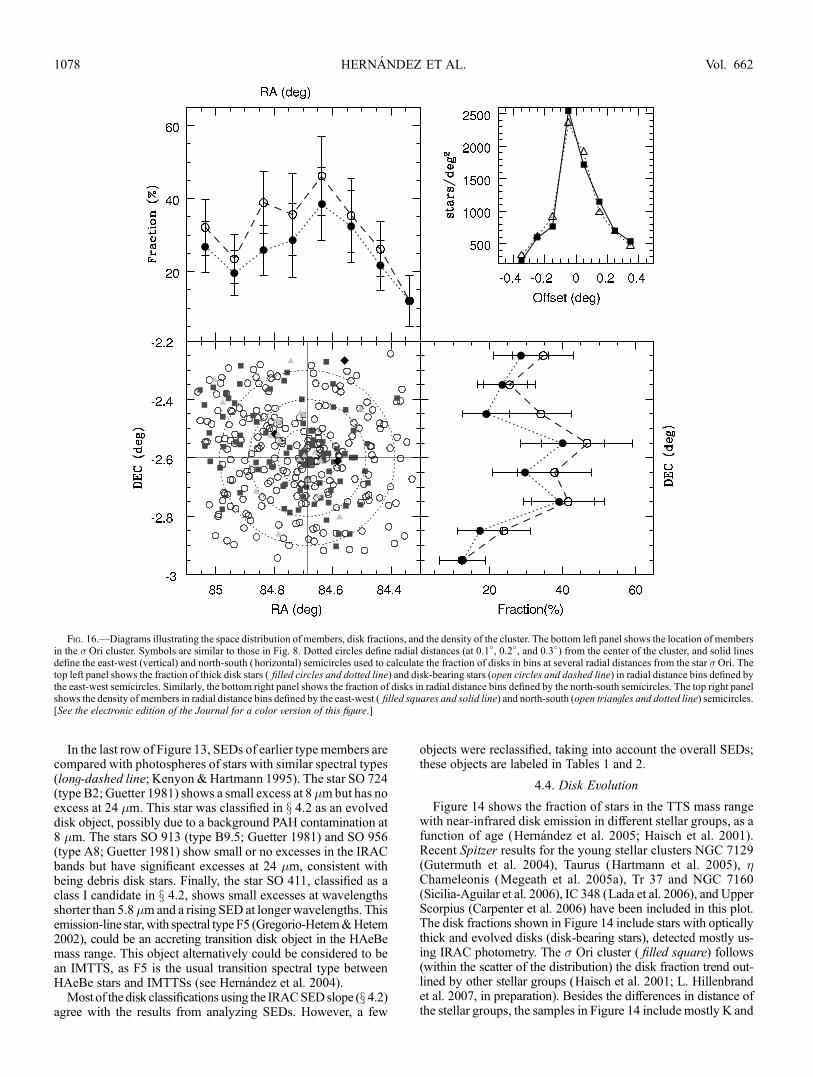
Fig. 16.—Diagrams illustrating the space distribution of members, disk fractions, and the density of the cluster. The bottom left panel shows the location of membersin the � Ori cluster. Symbols are similar to those in Fig. 8. Dotted circles define radial distances (at 0.1�, 0.2�, and 0.3�) from the center of the cluster, and solid linesdefine the east-west (vertical) and north-south ( horizontal) semicircles used to calculate the fraction of disks in bins at several radial distances from the star � Ori. Thetop left panel shows the fraction of thick disk stars ( filled circles and dotted line) and disk-bearing stars (open circles and dashed line) in radial distance bins defined bythe east-west semicircles. Similarly, the bottom right panel shows the fraction of disks in radial distance bins defined by the north-south semicircles. The top right panelshows the density of members in radial distance bins defined by the east-west ( filled squares and solid line) and north-south (open triangles and dotted line) semicircles.[See the electronic edition of the Journal for a color version of this figure.]
HERNANDEZ ET AL.1078 Vol. 662
M stars, including very low mass stars down to the substellarlimit.
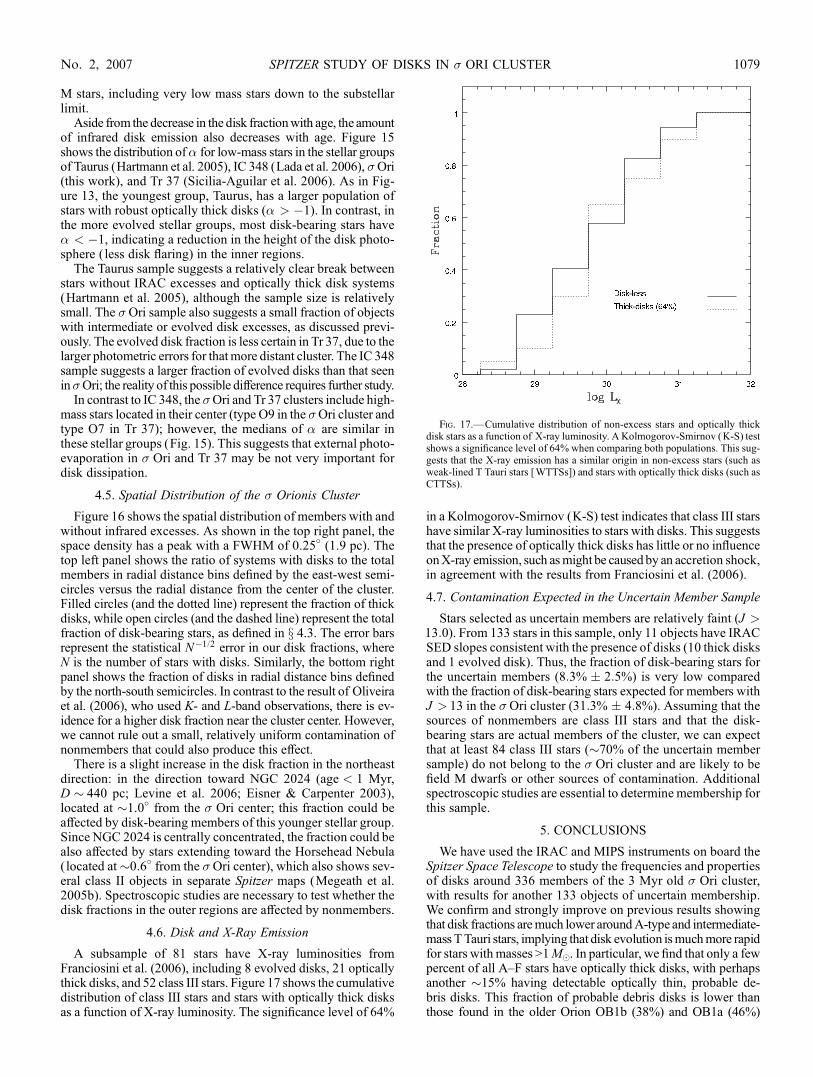
Aside from the decrease in the disk fractionwith age, the amountof infrared disk emission also decreases with age. Figure 15shows the distribution of� for low-mass stars in the stellar groupsof Taurus (Hartmann et al. 2005), IC 348 (Lada et al. 2006), �Ori(this work), and Tr 37 (Sicilia-Aguilar et al. 2006). As in Fig-ure 13, the youngest group, Taurus, has a larger population ofstars with robust optically thick disks (� > �1). In contrast, inthe more evolved stellar groups, most disk-bearing stars have� < �1, indicating a reduction in the height of the disk photo-sphere ( less disk flaring) in the inner regions.
The Taurus sample suggests a relatively clear break betweenstars without IRAC excesses and optically thick disk systems(Hartmann et al. 2005), although the sample size is relativelysmall. The � Ori sample also suggests a small fraction of objectswith intermediate or evolved disk excesses, as discussed previ-ously. The evolved disk fraction is less certain in Tr 37, due to thelarger photometric errors for that more distant cluster. The IC 348sample suggests a larger fraction of evolved disks than that seenin�Ori; the reality of this possible difference requires further study.
In contrast to IC 348, the �Ori and Tr 37 clusters include high-mass stars located in their center (type O9 in the �Ori cluster andtype O7 in Tr 37); however, the medians of � are similar inthese stellar groups (Fig. 15). This suggests that external photo-evaporation in � Ori and Tr 37 may be not very important fordisk dissipation.
4.5. Spatial Distribution of the � Orionis Cluster
Figure 16 shows the spatial distribution of members with andwithout infrared excesses. As shown in the top right panel, thespace density has a peak with a FWHM of 0.25
�(1.9 pc). The
top left panel shows the ratio of systems with disks to the totalmembers in radial distance bins defined by the east-west semi-circles versus the radial distance from the center of the cluster.Filled circles (and the dotted line) represent the fraction of thickdisks, while open circles (and the dashed line) represent the totalfraction of disk-bearing stars, as defined in x 4.3. The error barsrepresent the statistical N�1=2 error in our disk fractions, whereN is the number of stars with disks. Similarly, the bottom rightpanel shows the fraction of disks in radial distance bins definedby the north-south semicircles. In contrast to the result of Oliveiraet al. (2006), who used K- and L-band observations, there is ev-idence for a higher disk fraction near the cluster center. However,we cannot rule out a small, relatively uniform contamination ofnonmembers that could also produce this effect.
There is a slight increase in the disk fraction in the northeastdirection: in the direction toward NGC 2024 (age < 1 Myr,D � 440 pc; Levine et al. 2006; Eisner & Carpenter 2003),located at �1.0� from the � Ori center; this fraction could beaffected by disk-bearing members of this younger stellar group.Since NGC 2024 is centrally concentrated, the fraction could bealso affected by stars extending toward the Horsehead Nebula( located at�0.6
�from the �Ori center), which also shows sev-
eral class II objects in separate Spitzer maps (Megeath et al.2005b). Spectroscopic studies are necessary to test whether thedisk fractions in the outer regions are affected by nonmembers.
4.6. Disk and X-Ray Emission
A subsample of 81 stars have X-ray luminosities fromFranciosini et al. (2006), including 8 evolved disks, 21 opticallythick disks, and 52 class III stars. Figure 17 shows the cumulativedistribution of class III stars and stars with optically thick disksas a function of X-ray luminosity. The significance level of 64%
in a Kolmogorov-Smirnov (K-S) test indicates that class III starshave similar X-ray luminosities to stars with disks. This suggeststhat the presence of optically thick disks has little or no influenceonX-ray emission, such asmight be causedby an accretion shock,in agreement with the results from Franciosini et al. (2006).
4.7. Contamination Expected in the Uncertain Member Sample
Stars selected as uncertain members are relatively faint (J >13:0). From 133 stars in this sample, only 11 objects have IRACSED slopes consistent with the presence of disks (10 thick disksand 1 evolved disk). Thus, the fraction of disk-bearing stars forthe uncertain members (8:3% � 2:5%) is very low comparedwith the fraction of disk-bearing stars expected for members withJ > 13 in the � Ori cluster (31:3% � 4:8%). Assuming that thesources of nonmembers are class III stars and that the disk-bearing stars are actual members of the cluster, we can expectthat at least 84 class III stars (�70% of the uncertain membersample) do not belong to the � Ori cluster and are likely to befield M dwarfs or other sources of contamination. Additionalspectroscopic studies are essential to determine membership forthis sample.
5. CONCLUSIONS
We have used the IRAC and MIPS instruments on board theSpitzer Space Telescope to study the frequencies and propertiesof disks around 336 members of the 3 Myr old � Ori cluster,with results for another 133 objects of uncertain membership.We confirm and strongly improve on previous results showingthat disk fractions aremuch lower aroundA-type and intermediate-mass TTauri stars, implying that disk evolution ismuchmore rapidfor stars withmasses >1M�. In particular, we find that only a fewpercent of all AYF stars have optically thick disks, with perhapsanother �15% having detectable optically thin, probable de-bris disks. This fraction of probable debris disks is lower thanthose found in the older Orion OB1b (38%) and OB1a (46%)
Fig. 17.—Cumulative distribution of non-excess stars and optically thickdisk stars as a function of X-ray luminosity. A Kolmogorov-Smirnov (K-S) testshows a significance level of 64% when comparing both populations. This sug-gests that the X-ray emission has a similar origin in non-excess stars (such asweak-lined T Tauri stars [WTTSs]) and stars with optically thick disks (such asCTTSs).
SPITZER STUDY OF DISKS IN � ORI CLUSTER 1079No. 2, 2007
subassociations, suggesting that the � Ori cluster could be in aphase between the clearing of the primordial disk and the forma-tion of large icy objects, which produce the second-generation dustobserved in debris disk systems (Hernandez et al. 2006). The diskfrequency of �30%Y35% that we find for T Tauri stars is reason-ably consistent with studies of other populations, perhaps a bitlower. We also find no evidence that the disk fraction decreasessignificantly among the highest mass brown dwarfs. Overall,disk frequencies follow the overall trend of decreasing disk fre-quencywith increasing age that is observed in other young stellarpopulations.
About 15% of the T Tauri disk systems exhibit weak IRACexcesses that are inconsistent with simple optically thick diskmodels. If these systems are in the process of clearing small dustparticles from their inner disks, the observed fraction suggeststhat the timescale for this evolution is P0.5 Myr. We also findthat the infrared excesses among optically thick disks in the�Ori cluster are systematically lower than the excesses observedfrom the younger Taurus molecular cloud stars. This result con-firms and strongly extends previous results indicating an overalldecrease in the level of emission of optically thick disks with age,whichmay indicate an overall settling of dust particles to the diskmidplanes, or grain growth, or both. The populous nature and
relatively nearby location of the � Ori cluster allows us to im-prove the statistics of these correlations, providing an importantstep toward a full characterization of protoplanetary disk evolu-tion in clustered environments, in whichmost stars form. Finally,we do not find a correlation between X-ray luminosity and thedisk infrared excess, suggesting that the presence of opticallythick disks has little or no influence on the X-ray emission.
Thanks to R. D. Jeffries, D. Stern, and C. Lada for insightfulcommunications. This publication makes use of data productsfrom the CIDA Equatorial Variability Survey, obtained with theJ. Stock telescope at the Venezuela National Astronomical Ob-servatory, which is operated by CIDA for the Ministerio deCiencia y Tecnologıa of Venezuela, and from the Two MicronAll Sky Survey, which is a joint project of the University ofMassachusetts and the Infrared Processing and Analysis Center/California Institute of Technology. This work is based on obser-vations made with the Spitzer Space Telescope (GO-1 0037 andGO-1 0058), which is operated by the Jet Propulsion Laboratory,California Institute of Technology, under a contract with NASA.Support for this workwas provided by the University ofMichiganand by NASA grant NAG5-13210.
APPENDIX
PREVIOUS MEMBERSHIP STUDIES
The � Orionis cluster has been the subject of several photometric and spectroscopic studies intended to identify members of itspopulation. Analyzing the photometric and kinematic properties of the bright population in the cluster, Kharchenko et al. (2004)determined an angular size of 0.40� for the cluster and identified seven stars with photometric and kinematic membership probabilitieslarger than 50%. Since the cluster is reasonably close, relatively young, and has low reddening, many of the previous studies havefocused on identifying low-mass stars and substellar objects. Adopting an age interval of 2Y7 Myr and the Hipparcos distance of thestar � Ori (352þ166
�85pc), Bejar et al. (1999, 2001, 2004) presented several lists of low-mass stars, brown dwarfs, and free-floating
planets belonging to the � Ori cluster, selected from optical and NIR color-magnitude diagrams. Adopting an age of 2.5 Myr and thedistance calculated for the OB1b subassociation (440 pc), Sherry et al. (2004) reported photometric membership for a sample of low-mass stars (193 objects) based on the V versus V � I color-magnitude diagram. Sherry et al. (2004) found that the cluster has �160members in the mass range from 0.2 M� to 1.0 M�. Adopting an age of 3 Myr and a distance of 350 pc, Scholz & Eisloffel (2004)reported photometric membership for 135 candidates of very low mass stars (<0.4 M�) using the I versus I � J color-magnitudediagram and photometric variability.
Zapatero Osorio et al. (2002) presented intermediate- and low-resolution spectra, including the H� and Li i k6708 lines, andconfirmed 25 low-mass stars and 2 brown dwarfs as members of the cluster. Barrado y Navascues et al. (2003) confirmed 51 low-mass stars and brown dwarfs as members, using a low-resolution spectroscopic analysis of forbidden lines, as well as the Li i k6708and H� lines. Kenyon et al. (2005) presented an intermediate-resolution spectroscopic study of 76 photometrically selected starsranging in mass from 0.04M� to 0.3M�; 57 stars were confirmed as members on the basis that they exhibited Li i k6708 in absorption,a weak Na i doublet (kk8183, 8195) indicating low surface gravity consistent with PMS status, and radial velocities expected forthe kinematic properties of the cluster. Burningham et al. (2005) confirmed as members 38 low-mass stars, using a high-resolutionspectroscopic analysis of the Na i doublet. Kenyon et al. (2005) and Burningham et al. (2005) showed that optical photometricselection alone is very effective for identifying low-mass cluster members, with small contamination by nonmembers for stars withI < 17 mag.
Recently Oliveira et al. (2006) compiled 59 spectroscopically confirmed members of the cluster and studied the circumstellar disksof the sample using NIR data. Franciosini et al. (2006) detected 175 X-ray sources down to the substellar limit. Half of this samplecould be new members of the cluster, based on the X-ray emission as an indicator of youth.
REFERENCES
Andre, P., Ward-Thompson, D., & Barsony, M. 2000, in Protostars and Planets IV,ed. V. Mannings, A. P. Boss, & S. S. Russell (Tucson: Univ. Arizona Press), 59
Andrews, S. M., Reipurth, B., Bally, J., & Heathcote, S. R. 2004, ApJ, 606, 353Baltay, C., et al. 2002, PASP, 114, 780Baraffe, I., Chabrier, G., Allard, F., & Hauschildt, P. H. 1998, A&A, 337, 403Barrado y Navascues, D., Bejar, V. J. S., Mundt, R., Martın, E. L., Rebolo, R.,Zapatero Osorio, M. R., & Bailer-Jones, C. A. L. 2003, A&A, 404, 171
Barrado y Navascues, D., Zapatero Osorio, M. R., Bejar, V. J. S., Rebolo, R.,Martın, E. L., Mundt, R., & Bailer-Jones, C. A. L. 2001, A&A, 377, L9
Bejar, V. J. S., Zapatero Osorio, M. R., & Rebolo, R. 1999, ApJ, 521, 671———. 2004, Astron. Nachr., 325, 705Bejar, V. J. S., et al. 2001, ApJ, 556, 830Bessell, M. S., & Brett, J. M. 1988, PASP, 100, 1134Briceno, C., Calvet, N., Hernandez, J., Vivas, A. K., Hartmann, L., Downes,J. J., & Berlind, P. 2005, AJ, 129, 907
Briceno, C., Hartmann, L., Hernandez, J., Calvet, N., Vivas, A. K., Furesz, G.,& Szentgyorgyi, A. 2007, ApJ, 661, 1119
Brown, A. G. A., de Geus, E. J., & de Zeeuw, P. T. 1994, A&A, 289, 101
HERNANDEZ ET AL.1080 Vol. 662
Brown, A. G. A., Walter, F. M., & Blaauw, A. 2007, in ASP Conf. Ser., TheOrion Complex Revisited, ed. M. J. McCaughrean & A. Burkert, in press(astro-ph/9802054)
Burningham, B., Naylor, T., Littlefair, S. P., & Jeffries, R. D. 2005, MNRAS,356, 1583
Caballero, J. A. 2005, Astron. Nachr., 326, 1007Calvet, N., D’Alessio, P., Hartmann, L., Wilner, D., Walsh, A., & Sitko, M.2002, ApJ, 568, 1008
Calvet, N., Muzerolle, J., Briceno, C., Hernandez, J., Hartmann, L., Saucedo,J. L., & Gordon, K. D. 2004, AJ, 128, 1294
Calvet, N., et al. 2005, ApJ, 630, L185Carkner, L., Kozak, J. A., & Feigelson, E. D. 1998, AJ, 116, 1933Carpenter, J. M., Mamajek, E. E., Hillenbrand, L. A., & Meyer, M. R. 2006,ApJ, 651, L49
Cohen, M., & Schwartz, R. D. 1976, MNRAS, 174, 137Cutri, R. M., et al. 2003, 2MASS All Sky Catalog of Point Sources (Pasadena:IPAC)
D’Alessio, P., Calvet, N., Hartmann, L., Franco-Hernandez, R., & Servın, H.2006, ApJ, 638, 314
D’Alessio, P., Calvet, N., Hartmann,L., Lizano, S., &Canto, J. 1999,ApJ, 527, 893D’Alessio, P., Merın, B., Calvet, N., Hartmann, L., & Montesinos, B. 2005a,Rev. Mex. AA, 41, 61
D’Alessio, P., et al. 2005b, ApJ, 621, 461Dullemond, C. P., & Dominik, C. 2004, A&A, 417, 159———. 2005, A&A, 434, 971Eisner, J. A., & Carpenter, J. M. 2003, ApJ, 598, 1341Fazio, G. G., et al. 2004, ApJS, 154, 39Franciosini, E., Pallavicini, R., & Sanz-Forcada, J. 2006, A&A, 446, 501Furlan, E., et al. 2006, ApJS, 165, 568Gomez, M., & Kenyon, S. J. 2001, AJ, 121, 974Gordon, K. D., et al. 2005, PASP, 117, 503Gorlova, N., et al. 2004, ApJS, 154, 448Gregorio-Hetem, J., & Hetem, A. 2002, MNRAS, 336, 197Guetter, H. H. 1981, AJ, 86, 1057Gutermuth, R. A., Megeath, S. T., Muzerolle, J., Allen, L. E., Pipher, J. L.,Myers, P. C., & Fazio, G. G. 2004, ApJS, 154, 374
Haisch, K. E., Lada, E. A., & Lada, C. J. 2001, ApJ, 553, L153Hartmann, L. 2005a, in ASP Conf. Ser. 337, The Nature and Evolution of Disksaround Hot Stars, ed. R. Ignace & K. G. Gayley (San Francisco: ASP), 3
———. 2005b, in ASP Conf. Ser. 341, Chondrites and the Protoplanetary Disk,ed. A. N. Krot, E. R. D. Scott, & B. Reipurth (San Francisco: ASP), 131
Hartmann, L., Megeath, S. T., Allen, L., Luhman, K., Calvet, N., D’Alessio, P.,Franco-Hernandez, R., & Fazio, G. 2005, ApJ, 629, 881
Herbst, W., & Shevchenko, V. S. 1999, AJ, 118, 1043Hernandez, J., Briceno, C., Calvet, N., Hartmann, L., Muzerolle, J., & Quintero,A. 2006, ApJ, 652, 472
Hernandez, J., Calvet, N., Briceno, C., Hartmann, L., & Berlind, P. 2004, AJ,127, 1682
Hernandez, J., Calvet, N., Hartmann, L., Briceno, C., Sicilia-Aguilar, A., &Berlind, P. 2005, AJ, 129, 856
Jeffries, R. D., Maxted, P. F. L., Oliveira, J. M., & Naylor, T. 2006, MNRAS,371, L6
Kenyon, M. J., Jeffries, R. D., Naylor, T., Oliveira, J. M., & Maxted, P. F. L.2005, MNRAS, 356, 89
Kenyon, S. J., & Hartmann, L. 1987, ApJ, 323, 714———. 1995, ApJS, 101, 117Kharchenko, N. V. 2001, Kinematika Fiz. Nebesnykh Tel., 17, 409Kharchenko, N. V., Piskunov, A. E., Roser, S., Schilbach, E., & Scholz, R.-D.2004, Astron. Nachr., 325, 740
Lada, C. J., et al. 2006, AJ, 131, 1574Lada, E. A., & Lada, C. J. 1995, AJ, 109, 1682Landsman, W. B. 1993, in ASP Conf. Ser. 52, Astronomical Data AnalysisSoftware and Systems II, ed. R. J. Hanisch, R. J. V. Brissenden, & J. Barnes(San Francisco: ASP), 246
Levine, J. L., Steinhauer, A., Elston, R. J., & Lada, E. A. 2006, ApJ, 646, 1215Lyra, W., Moitinho, A., van der Bliek, N. S., & Alves, J. 2006, A&A, 453, 101Megeath, S. T., Hartmann, L., Luhman, K. L., & Fazio, G. G. 2005a, ApJ, 634,L113
Megeath, S. T., et al. 2005b, in IAU Symp. 227, Massive Star Birth: ACrossroads of Astrophysics, ed. R. Cesaroni, M. Felli, E. Churchwell, & M.Walmsley (Cambridge: Cambridge Univ. Press), 383
Muzerolle, J., Hillenbrand, L., Calvet, N., Briceno, C., & Hartmann, L. 2003,ApJ, 592, 266
Oliveira, J. M., Jeffries, R. D., Kenyon, M. J., Thompson, S. A., & Naylor, T.2002, A&A, 382, L22
Oliveira, J. M., Jeffries, R. D., van Loon, J. T., & Rushton, M. T. 2006,MNRAS, 369, 272
Oliveira, J. M., & van Loon, J. T. 2004, A&A, 418, 663Preibisch, T., & Feigelson, E. D. 2005, ApJS, 160, 390Reach, W., et al. 2006, Infrared Array Camera Data Handbook, Version 3.0(Pasadena: SSC)
Rieke, G. H., et al. 2004, ApJS, 154, 25———. 2005, ApJ, 620, 1010Schlegel, D. J., Finkbeiner, D. P., & Davis, M. 1998, ApJ, 500, 525Scholz, A., & Eisloffel, J. 2004, A&A, 419, 249Sherry, W. H., Walter, F. M., & Wolk, S. J. 2004, AJ, 128, 2316Sicilia-Aguilar, A., Hartmann, L. W., Hernandez, J., Briceno, C., & Calvet, N.2005, AJ, 130, 188
Sicilia-Aguilar, A., et al. 2006, ApJ, 638, 897Siess, L., Dufour, E., & Forestini, M. 2000, A&A, 358, 593Stern, D., et al. 2005, ApJ, 631, 163Vivas, A. K., et al. 2004, AJ, 127, 1158Walter, F. M., Wolk, S. J., Freyberg, M., & Schmitt, J. H. M. M. 1997, Mem.Soc. Astron. Italiana, 68, 1081
Walter, F. M., Wolk, S. J., & Sherry, W. 1998, in ASP Conf. Ser. 154, The TenthCambridge Workshop on Cool Stars, Stellar Systems, and the Sun, ed. R.Donahue & J. Bookbinder (San Francisco: ASP), 1793
Ward-Thompson, D., Hartmann, L., & Nutter, D. J. 2005, MNRAS, 357, 687Warren, W. H., Jr., & Hesser, J. E. 1978, ApJS, 36, 497Weaver, W. B., & Babcock, A. 2004, PASP, 116, 1035Weidenschilling, S. J. 1997, Icarus, 127, 290Wu, H., Cao, C., Hao, C.-N., Liu, F.-S., Wang, J.-L., Xia, X.-Y., Deng, Z.-G., &Young, C. K.-S. 2005, ApJ, 632, L79
Zapatero Osorio, M. R., Bejar, V. J. S., Pavlenko, Y., Rebolo, R., AllendePrieto, C., Martın, E. L., & Garcıa Lopez, R. J. 2002, A&A, 384, 937
SPITZER STUDY OF DISKS IN � ORI CLUSTER 1081No. 2, 2007