Embed Size (px)
Citation preview

Smarter imaging: Gaining more from your microscopyexperiments
Sponsored by
Produced by the Science/AAAS Custom
Publishing Office
A Sponsored Supplement to Science

BIOLOGY ¡ EARTH ¡ ENVIRONMENT ¡ LIFE ¡ INTERDISCIPLINARY ¡ PHYSICAL ¡ MATERIAL ¡ SOCIAL SCIENCES
As AAAS’s first multidisciplinary, open access journal, Science Advances publishesresearch that reflects the selectivity of high impact, innovative research you expectfrom the Science family of journals, published in an open access format to serve avast and growing global audience. Check out the latest findings or learn how tosubmit your research: ScienceAdvances.org
Pushing the Boundaries of Knowledge
OPEN ACCESS, DIGITAL , AND FREE TO ALL READERS
INTRODUCTIONS
2 Seeing the bigger picture: High-throughput live-cell imaging Jackie Oberst, Ph.D. Sean Sanders, Ph.D. Science/AAAS
3 Designing better imaging experiments for more meaningful data Lynne Chang, Ph.D. Nikon Instruments Inc.
WHITE PAPER
4 Increasing data collection and fidelity by maximizing confocal field of view Adam White, Ph.D. Biosystems Product Manager, Confocal and Super-Resolution Nikon Instruments Inc.
RESEARCH ARTICLES
6 Analysis of the bystander effect in cone photoreceptors via a guided neural network platform Yuan Ma, Xin Han, Ricardo Bessa de Castro et al.
14 Bacteria as living patchy colloids: Phenotypic heterogeneity in surface adhesion Teun Vissers, Aidan T. Brown, Nick Koumakis et al.
22 Programming self-organizing multicellular structures with synthetic cell-cell signaling Satoshi Toda, Lucas R. Blauch, Sindy K. Y. Tang et al.
This booklet was produced by the Science/AAAS Custom Publishing Office and sponsored by Nikon Instruments Inc.
Editors: Jackie Oberst, Ph.D.; Sean Sanders Ph.D.Proofreader/Copyeditor: Bob FrenchDesigner: Amy Hardcastle
LAURIE FARADAY, ASSOCIATE SALES DIRECTOR–USCustom Publishing Science/[email protected]: 508-747-9395
© 2018 by The American Association for the Advancement of Science. All rights reserved. 7 December 2018
1SCIENCE sciencemag.org
Smarter imaging:Gaining more from your microscopy experiments
TABLE OF CONTENTS
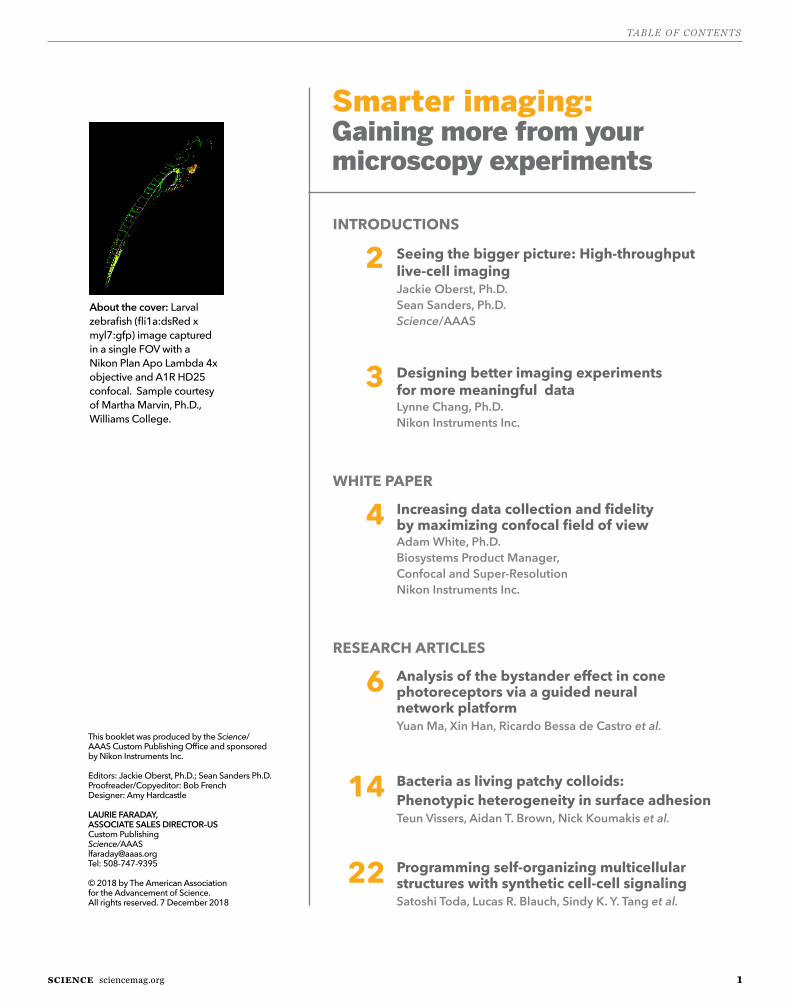
About the cover: Larval zebrafish (fli1a:dsRed x myl7:gfp) image captured in a single FOV with a Nikon Plan Apo Lambda 4x objective and A1R HD25 confocal. Sample courtesy of Martha Marvin, Ph.D., Williams College.

sciencemag.org SCIENCE2
SMARTER IMAGING: GAINING MORE FROM YOUR MICROSCOPY EXPERIMENTS
Imagine a tissue culture dish with cells growing on it as an Olympic-sized swimming pool with inner tubes strewn across it. Previously, investigators analyzing those cultures were only able to choose a handful of these metaphorical inner tubes in a few particular areas,
such as one or two “swimming lanes,” and had to leave the rest. Now, with the advent of higher-throughput imaging techniques, they can measure the entire swimming pool.
Several microscopy methods have arisen that enable researchers to study living cells in more detail and with less effort than ever before. Live single-cell imaging is the study of individual living cells using time-lapse microscopy. Live imaging, of both individual cells and groups of cells and tissues, has become an essential tool in most cell biology laboratories, and is used in numerous biomedical fields, such as neurobiology, developmental biology, and pharmacology.
One of the major advancements in live-cell imaging has been in increasing throughput. By integrating robotic microscopy and automated analysis methods with live-cell imaging, researchers are now able to gather more accurate statistics and population-level data at single-cell level resolution.
Recent developments in imaging technologies such as confocal and superresolution are now allowing researchers to enhance their live-cell high-throughput experiments by applying these techniques. For example, capturing images of large samples—such as tissues, live model organisms, or single cells in multiwell plates—requires extending the detection area or field of view (FOV) and increasing the image capture speed. An increased FOV reduces the image acquisition time as well as the number of frames needed for stitching large images and achieving high-throughput imaging of large-scale samples.
The articles in this supplement reflect the latest single-cell and live-cell imaging techniques. We hope they encourage those who haven’t already done so to dip their toes into the water and try these methods, or inspire those who already use these techniques to venture further and deeper.
Jackie Oberst, Ph.D.Sean Sanders, Ph.D.Custom Publishing OfficeScience/AAAS
Seeing the bigger picture: High-throughput live-cell imagingSeveral microscopy methods have arisen that enable researchers to study living cells in more detail and with less effort than ever before.

SCIENCE sciencemag.org
“W hat is the mechanism?” This is a fundamental question that drives many biological research programs. Imaging experiments have been trending toward higher-content approaches in order to delve deeper
into the mechanism and increase data fidelity. In this digital supplement, we highlight several recent studies from researchers who not only use high-throughput methods but combine them with novel engineering techniques, whether at the specimen or platform level, to gain more from their imaging experiments.
In the first study, Ma et al. describe an ordered neural network guided by microchannels (NN-Chip) to study the bystander effect at the single-cell level. Using this NN-Chip, the authors could directly visualize apoptosis spreading from light-induced apoptotic cone cells to the surrounding cones. This micropatterned platform enables high-efficiency patterning of neural networks and alleviates challenges for dissecting the mechanism of the bystander effect, holding great potential for other neuronal studies. Highly ordered specimens that result from these types of micropatterned substrates would also lessen challenges in image processing and analysis. In the second study, Vissers et al. follow many single cells using high-throughput tracking and big data analysis to study bacterial adhesion properties. This approach is unlike many biophysical studies of bacterial adhesion that use either high-throughput, population-level methods or low-throughput, single-cell studies. In the third study, Toda et al. engineer artificial genetic programs to study the role of cell–cell signaling in the formation of self-organizing multicellular structures. The authors show that minimal intercellular programs are sufficient to yield complex assemblies of cells that mimic natural developmental systems.
The studies we have highlighted stand apart from standard high-throughput experiments in which single cell-level detail is generally sacrificed for population-level data. To meet the demands of single-cell level, high-throughput experiments, Nikon has developed a new point-scanning confocal microscope with the largest field of view (FOV) on the market. With its 25-mm FOV, Nikon’s A1R HD25 captures almost twice the data of conventional confocal systems in a single frame. This new capability not only increases the speed and throughput of imaging experiments, but enables researchers to carry out high-throughput experiments using high-resolution, high-magnification lenses to capture more detail without sacrificing speed. In this supplement we have included a white paper detailing the application benefits of the A1R HD25.
We hope the content provided here provides insights into how high-throughput imaging methods are being used in various scientific fields, and inspires readers to think about ways to gain more data from their imaging experiments.
Lynne Chang, Ph.D.Senior Marketing ManagerNikon Instruments Inc.
Designing better imaging experiments for more meaningful dataImaging experiments have been trending toward higher-content approaches in order to delve deeper intothe mechanism and increase data fidelity.
3
INTRODUCTIONS

WHITE PAPER
Increasing Data Collection and Fidelity by Maximizing Confocal Field of View
SummaryFor years, the field of view (FOV) of confocal systems have been limited by the FOV of the microscope they are attached to. With the release of the Nikon Ti2 inverted microscope, the world’s first 25 mm FOV became available. Now, Nikon has taken advantage of this improvement by building the largest FOV point scanner in the world, the A1R HD25. This application note will focus on the impact of this technology on simple, everyday experiments.
IntroductionMicroscope-based image creation is an important research tool that has continually evolved since the 1600s. Today’s systems utilize a variety of technologies, such as high-end cameras, LEDs, lasers, and confocal point scanners, with the goal of acquiring better data. As part of this, there has been a recent push to increase throughput of these systems so that more data can be produced with less time in front of the system. For confocal fluorescence microscopy, much of this innovation has centered on making systems faster and more sensitive. However, since fluorescent samples have a limited photon budget, these approaches reach a practical limit as too much laser power is applied and/or not enough signal is generated.
Recognizing these limits, Nikon has worked to go beyond our market-leading speed, sensitivity, and image quality in targeting an additional approach to throughput: making a bigger picture. Utilizing the astounding optical quality of Nikon glass, new, larger optical components have been created to increase the standard confocal microscope system FOV to an incredible 25 mm. This application note focuses on the impact of this increased FOV on everyday research and will show why the Nikon A1R HD25 is the new standard in confocal microscopy.
Increased field of view significantly increases cell counts in a single imageOne of the most common types of microscope imaging experi-ments is a simple cell-count assay. These assays are performed in a variety of ways, and used to investigate questions pertaining to cell or tissue growth/death, the impacts of drug treatments, and
the impacts of environmental/applied stresses. When the desired model for such an experiment is best suited for analysis with a microscope, a researcher must create samples for all conditions and proceed to collect images from each. Image analysis is then required to count cells for each condition. In most cases, this type of experiment means sitting in front of the microscope and capturing enough images for each condition to produce a high-enough cell count (n) to address a given question. So, how does FOV impact this common microscope system use case?
Figure 1 shows a representative comparison of data produced when using both a 25 mm FOV and a 18 mm FOV to count nuclei in a single field. For the 18 mm FOV (shown in Panel A), 76 cells are counted in this frame. By simply increasing the FOV to 25 mm and capturing the same image, this count jumps to 149 cells (shown in Panel B). Immediately, one can see that this small improvement in FOV can lead to collection of nearly twice the data in every single image. Such an impact has the potential to cut experiment time in half by requiring the collection of fewer images in order to achieve the same n. Say, for this example, that an n of 1,500 cells is desired for each condition. With the 25 mm FOV, this can be achieved with ~10 images while, at 18 mm, about 20 images are needed for every condition to achieve the same counts.
Figure 1. Cell counts increase ~2 fold using a 25 mm FOV vs. a 18 mm FOV. This figure shows images collected from a representative field of cells using a 18 mm FOV (A) and a 25 mm FOV (B). Cell counts are pre-sented for each condition and show n=76 at 18 mm and n=149 at 25 mm.
Adam White, Ph.D.Biosystems Product Manager, Confocal and Super-Resolution Nikon Instruments Inc., 1300 Walt Whitman Road, Melville, NY 11747-3064, USA
NIK-6368 Science e-book White Paper_FINAL_r2.indd 1 11/8/18 2:59 PM
4
BA

Increased field of view provides higher cell counts, better statis-tics over whole experimentsOf course, saving time may not always be the goal when generat-ing data for a confocal microscopy experiment. Take, for example, a study in which a subtle change has occurred under a particular condition but, when statistical analysis is applied, the results are inconclusive. In this situation, increasing population size, n, may help generate enough confidence to draw a conclusion. Figure 2 shows the cumulative effect of increased FOV on cell count during an experiment in which 47 images were collected at both 18 mm and 25 mm. First, the obvious conclusion based on the data pre-sented above is that the cumulative cell count over these 47 imag-es increases much more rapidly with the 25 mm FOV (Panel A). In this case, average intensity measurements were collected from a subset of these images as well (Panel B). The less obvious conclu-sion, though just as important, is that collecting more data simply by virtue of having a larger FOV means that, in the same number of images, the much larger n produced leads to less statistical error (represented as error bars in Panel B). In other words, captur-
ing data with a large FOV drives a more rapid decrease in relative uncertainty as the total image count increases. Lower uncertainty means that better conclusions can be drawn when the experimen-tal results are collated. A1R HD25 is about using the available tools and technology to produce better data, and more of it, resulting in more impactful research.
ConclusionImportantly, while not covered in this note, the Nikon A1R HD25 can benefit many applications beyond cell counting. For example, the same improvements described above can be applied to confocal high-content screening. This will result in the highest throughput system of its kind, by maximizing data collection in every image. In the case of large model organisms such as zebrafish embryos, one may be able to image the whole organism in a single FOV, and at a higher magnification than was previously achievable. Getting the whole picture allows the user to capture details at higher magnification and resolution than previously possible with a given size FOV. Large image stitching is another common application for confocal microscopes. With A1R HD25, the large FOV not only allows for the generation of stitched images more quickly, but the complete optical redesign means that these images are created with fewer artifacts (example shown in Figure 3).
With the world’s first 25 mm FOV, the Nikon A1R HD25 is the latest in point-scanning confocal technology. The data and examples described above have shown how this simple, yet important optical change can allow researchers to optimize time spent in front of the microscope. The A1R HD25 means more and better data in every image, every day.
Increasing Data Collection and Fidelity by Maximizing Confocal Field of View
microscopyu.com nikon-instruments-inc- nikoninstrumentsinc nikoninst nikoninstruments
Nikon Instruments Inc. | www.microscope.healthcare.nikon.com | [email protected]
Figure 2. Increasing FOV provides better statistics by increasing overall cell counts in a given experiment. This figure shows cumulative cell counts from 47 images collected from both a 25 mm and 18 mm FOV. Data for each condition is summed (A). Also shown is a representative average intensity measurement from a subset of 3 images demonstrating a smaller error generated by the increased value for n (B).
Figure 3. Whole-mouse embryo captured at 10x and stitched using A1R HD25.
NIK-6368 Science e-book White Paper_FINAL_r2.indd 2 11/8/18 3:00 PM
WHITE PAPER
Increasing Data Collection and Fidelity by Maximizing Confocal Field of View
SummaryFor years, the field of view (FOV) of confocal systems have been limited by the FOV of the microscope they are attached to. With the release of the Nikon Ti2 inverted microscope, the world’s first 25 mm FOV became available. Now, Nikon has taken advantage of this improvement by building the largest FOV point scanner in the world, the A1R HD25. This application note will focus on the impact of this technology on simple, everyday experiments.
IntroductionMicroscope-based image creation is an important research tool that has continually evolved since the 1600s. Today’s systems utilize a variety of technologies, such as high-end cameras, LEDs, lasers, and confocal point scanners, with the goal of acquiring better data. As part of this, there has been a recent push to increase throughput of these systems so that more data can be produced with less time in front of the system. For confocal fluorescence microscopy, much of this innovation has centered on making systems faster and more sensitive. However, since fluorescent samples have a limited photon budget, these approaches reach a practical limit as too much laser power is applied and/or not enough signal is generated.
Recognizing these limits, Nikon has worked to go beyond our market-leading speed, sensitivity, and image quality in targeting an additional approach to throughput: making a bigger picture. Utilizing the astounding optical quality of Nikon glass, new, larger optical components have been created to increase the standard confocal microscope system FOV to an incredible 25 mm. This application note focuses on the impact of this increased FOV on everyday research and will show why the Nikon A1R HD25 is the new standard in confocal microscopy.
Increased field of view significantly increases cell counts in a single imageOne of the most common types of microscope imaging experi-ments is a simple cell-count assay. These assays are performed in a variety of ways, and used to investigate questions pertaining to cell or tissue growth/death, the impacts of drug treatments, and
the impacts of environmental/applied stresses. When the desired model for such an experiment is best suited for analysis with a microscope, a researcher must create samples for all conditions and proceed to collect images from each. Image analysis is then required to count cells for each condition. In most cases, this type of experiment means sitting in front of the microscope and capturing enough images for each condition to produce a high-enough cell count (n) to address a given question. So, how does FOV impact this common microscope system use case?
Figure 1 shows a representative comparison of data produced when using both a 25 mm FOV and a 18 mm FOV to count nuclei in a single field. For the 18 mm FOV (shown in Panel A), 76 cells are counted in this frame. By simply increasing the FOV to 25 mm and capturing the same image, this count jumps to 149 cells (shown in Panel B). Immediately, one can see that this small improvement in FOV can lead to collection of nearly twice the data in every single image. Such an impact has the potential to cut experiment time in half by requiring the collection of fewer images in order to achieve the same n. Say, for this example, that an n of 1,500 cells is desired for each condition. With the 25 mm FOV, this can be achieved with ~10 images while, at 18 mm, about 20 images are needed for every condition to achieve the same counts.
Figure 1. Cell counts increase ~2 fold using a 25 mm FOV vs. a 18 mm FOV. This figure shows images collected from a representative field of cells using a 18 mm FOV (A) and a 25 mm FOV (B). Cell counts are pre-sented for each condition and show n=76 at 18 mm and n=149 at 25 mm.
Adam White, Ph.D.Biosystems Product Manager, Confocal and Super-Resolution Nikon Instruments Inc., 1300 Walt Whitman Road, Melville, NY 11747-3064, USA
NIK-6368 Science e-book White Paper_FINAL_r2.indd 1 11/8/18 2:59 PM
5
A
B
nn
SMARTER IMAGING: GAINING MORE FROM YOUR MICROSCOPY EXPERIMENTS
6 sciencemag.org | SCIENCE
CELLULAR NEUROSC I ENCE Copyright © 2018
The Authors, some
rights reserved;
exclusive licensee
American Association
for the Advancement
of Science. No claim to
originalU.S. Government
Works. Distributed
under a Creative
Commons Attribution
NonCommercial
License 4.0 (CC BY-NC).
Analysis of the bystander effect in cone photoreceptorsvia a guided neural network platformYuan Ma,1,2,3 Xin Han,1,3 Ricardo Bessa de Castro,1,3,4 Pengchao Zhang,1,3 Kai Zhang,1,3
Zhongbo Hu,2 Lidong Qin1,3*
The mammalian retina system consists of a complicated photoreceptor structure, which exhibits extensive randomsynaptic connections. To study retinal development and degeneration, various experimental models have beenused previously, but thesemodels are often uncontrollable, are difficult tomanipulate, and do not provide sufficientsimilarity or precision. Therefore, the mechanisms in many retinal diseases remain unclear because of the limitedcapability in observing the progression and molecular driving forces. For example, photoreceptor degenerationcan spread to surrounding healthy photoreceptors via a phenomenon known as the bystander effect; however, noin-depth observations can bemade to decipher themolecular mechanisms or the pathways that contribute to thespreading. It is then necessary to build dissociated neural networks to investigate the communications with con-trollability of cells and their treatment. We developed a neural network chip (NN-Chip) to load single neurons intohighly ordered microwells connected by microchannels for synapse formation to build the neural network. Byobserving the distribution of apoptosis spreading from light-induced apoptotic cones to the surrounding cones,we demonstrated convincing evidence of the existence of a cone-to-cone bystander killing effect. Combining theNN-Chip withmicroinjection technology, we also found that the gap junction protein connexin 36 (Cx36) is criticalfor apoptosis spreading and the bystander effect in cones. In addition, our unique NN-Chip platform provides aquantitative, high-throughput tool for investigating signalingmechanisms and behaviors in neurons and opens anew avenue for screening potential drug targets to cure retinal diseases.
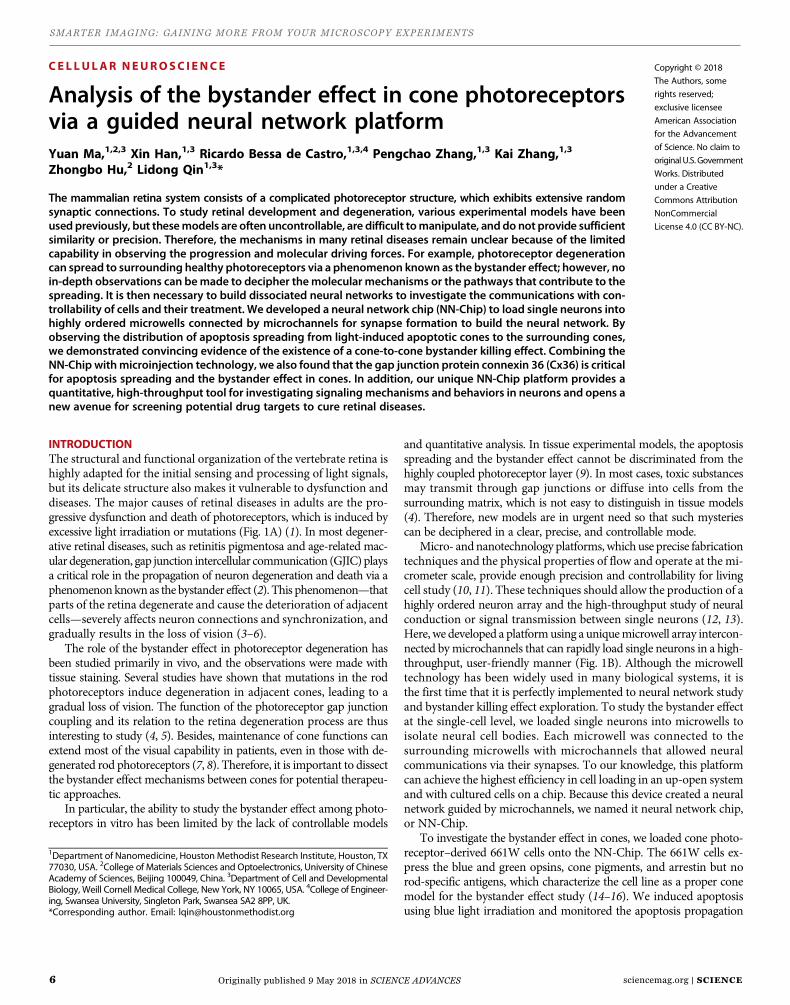
INTRODUCTIONThe structural and functional organization of the vertebrate retina ishighly adapted for the initial sensing and processing of light signals,but its delicate structure also makes it vulnerable to dysfunction anddiseases. The major causes of retinal diseases in adults are the pro-gressive dysfunction and death of photoreceptors, which is induced byexcessive light irradiation or mutations (Fig. 1A) (1). In most degener-ative retinal diseases, such as retinitis pigmentosa and age-related mac-ular degeneration, gap junction intercellular communication (GJIC)playsa critical role in the propagation of neuron degeneration and death via aphenomenonknownas the bystander effect (2). This phenomenon—thatparts of the retina degenerate and cause the deterioration of adjacentcells—severely affects neuron connections and synchronization, andgradually results in the loss of vision (3–6).
The role of the bystander effect in photoreceptor degeneration hasbeen studied primarily in vivo, and the observations were made withtissue staining. Several studies have shown that mutations in the rodphotoreceptors induce degeneration in adjacent cones, leading to agradual loss of vision. The function of the photoreceptor gap junctioncoupling and its relation to the retina degeneration process are thusinteresting to study (4, 5). Besides, maintenance of cone functions canextend most of the visual capability in patients, even in those with de-generated rod photoreceptors (7, 8). Therefore, it is important to dissectthe bystander effect mechanisms between cones for potential therapeu-tic approaches.
In particular, the ability to study the bystander effect among photo-receptors in vitro has been limited by the lack of controllable models
and quantitative analysis. In tissue experimental models, the apoptosisspreading and the bystander effect cannot be discriminated from thehighly coupled photoreceptor layer (9). In most cases, toxic substancesmay transmit through gap junctions or diffuse into cells from thesurrounding matrix, which is not easy to distinguish in tissue models(4). Therefore, new models are in urgent need so that such mysteriescan be deciphered in a clear, precise, and controllable mode.
Micro- andnanotechnology platforms, which use precise fabricationtechniques and the physical properties of flow and operate at the mi-crometer scale, provide enough precision and controllability for livingcell study (10, 11). These techniques should allow the production of ahighly ordered neuron array and the high-throughput study of neuralconduction or signal transmission between single neurons (12, 13).Here, we developed a platformusing a uniquemicrowell array intercon-nected bymicrochannels that can rapidly load single neurons in a high-throughput, user-friendly manner (Fig. 1B). Although the microwelltechnology has been widely used in many biological systems, it isthe first time that it is perfectly implemented to neural network studyand bystander killing effect exploration. To study the bystander effectat the single-cell level, we loaded single neurons into microwells toisolate neural cell bodies. Each microwell was connected to thesurrounding microwells with microchannels that allowed neuralcommunications via their synapses. To our knowledge, this platformcan achieve the highest efficiency in cell loading in an up-open systemand with cultured cells on a chip. Because this device created a neuralnetwork guided by microchannels, we named it neural network chip,or NN-Chip.
To investigate the bystander effect in cones, we loaded cone photo-receptor–derived 661W cells onto the NN-Chip. The 661W cells ex-press the blue and green opsins, cone pigments, and arrestin but norod-specific antigens, which characterize the cell line as a proper conemodel for the bystander effect study (14–16). We induced apoptosisusing blue light irradiation and monitored the apoptosis propagation
1Department of Nanomedicine, Houston Methodist Research Institute, Houston, TX77030, USA. 2College of Materials Sciences and Optoelectronics, University of ChineseAcademy of Sciences, Beijing 100049, China. 3Department of Cell and DevelopmentalBiology, Weill Cornell Medical College, New York, NY 10065, USA. 4College of Engineer-ing, Swansea University, Singleton Park, Swansea SA2 8PP, UK.*Corresponding author. Email: [email protected]
S C I ENCE ADVANCES | R E S EARCH ART I C L E
Ma et al., Sci. Adv. 2018;4 : eaas9274 9 May 2018 1 of 9
on August 14, 2018http://advances.sciencem
ag.org/D
ownloaded from
Originally published 9 May 2018 in SCIENCE ADVANCES
RESEARCH ARTICLES
7SCIENCE | sciencemag.org
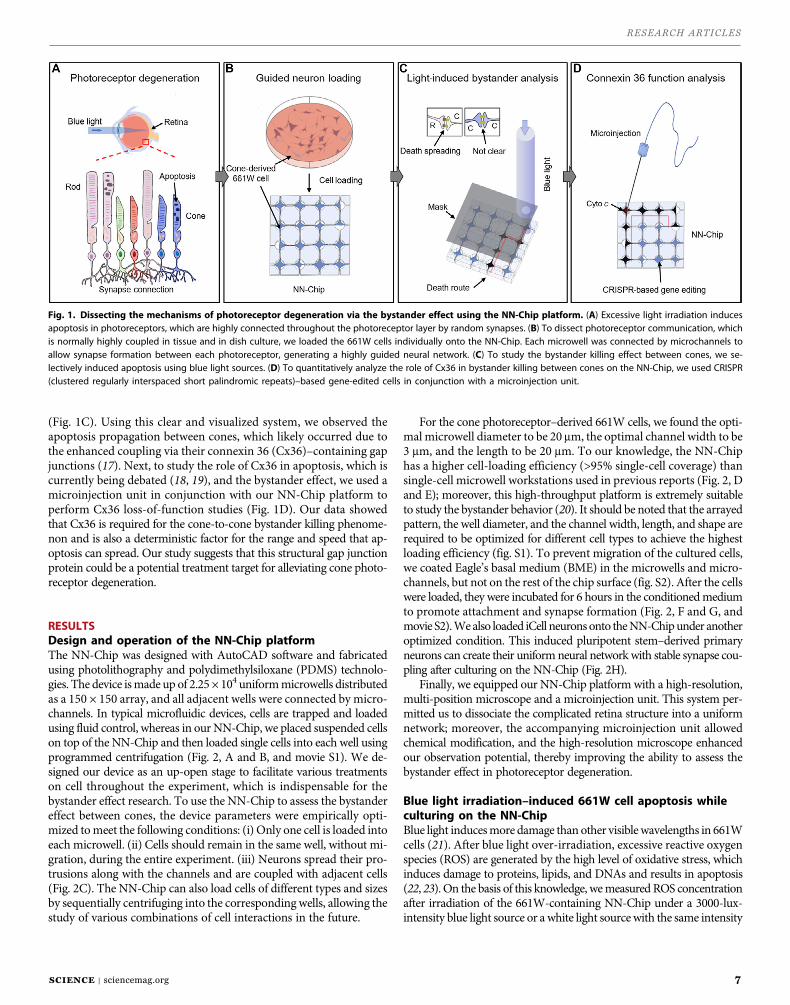
(Fig. 1C). Using this clear and visualized system, we observed theapoptosis propagation between cones, which likely occurred due tothe enhanced coupling via their connexin 36 (Cx36)–containing gapjunctions (17). Next, to study the role of Cx36 in apoptosis, which iscurrently being debated (18, 19), and the bystander effect, we used amicroinjection unit in conjunction with our NN-Chip platform toperform Cx36 loss-of-function studies (Fig. 1D). Our data showedthat Cx36 is required for the cone-to-cone bystander killing phenome-non and is also a deterministic factor for the range and speed that ap-optosis can spread. Our study suggests that this structural gap junctionprotein could be a potential treatment target for alleviating cone photo-receptor degeneration.
RESULTSDesign and operation of the NN-Chip platformThe NN-Chip was designed with AutoCAD software and fabricatedusing photolithography and polydimethylsiloxane (PDMS) technolo-gies. The device ismade up of 2.25 × 10⁴ uniformmicrowells distributedas a 150 × 150 array, and all adjacent wells were connected by micro-channels. In typical microfluidic devices, cells are trapped and loadedusing fluid control, whereas in our NN-Chip, we placed suspended cellson top of the NN-Chip and then loaded single cells into each well usingprogrammed centrifugation (Fig. 2, A and B, and movie S1). We de-signed our device as an up-open stage to facilitate various treatmentson cell throughout the experiment, which is indispensable for thebystander effect research. To use the NN-Chip to assess the bystandereffect between cones, the device parameters were empirically opti-mized tomeet the following conditions: (i) Only one cell is loaded intoeach microwell. (ii) Cells should remain in the same well, without mi-gration, during the entire experiment. (iii) Neurons spread their pro-trusions along with the channels and are coupled with adjacent cells(Fig. 2C). The NN-Chip can also load cells of different types and sizesby sequentially centrifuging into the correspondingwells, allowing thestudy of various combinations of cell interactions in the future.
For the cone photoreceptor–derived 661W cells, we found the opti-mal microwell diameter to be 20 mm, the optimal channel width to be3 mm, and the length to be 20 mm. To our knowledge, the NN-Chiphas a higher cell-loading efficiency (>95% single-cell coverage) thansingle-cell microwell workstations used in previous reports (Fig. 2, Dand E); moreover, this high-throughput platform is extremely suitableto study the bystander behavior (20). It should be noted that the arrayedpattern, the well diameter, and the channel width, length, and shape arerequired to be optimized for different cell types to achieve the highestloading efficiency (fig. S1). To prevent migration of the cultured cells,we coated Eagle’s basal medium (BME) in the microwells and micro-channels, but not on the rest of the chip surface (fig. S2). After the cellswere loaded, they were incubated for 6 hours in the conditionedmediumto promote attachment and synapse formation (Fig. 2, F and G, andmovie S2).Wealso loaded iCell neuronsonto theNN-Chipunder anotheroptimized condition. This induced pluripotent stem–derived primaryneurons can create their uniform neural network with stable synapse cou-pling after culturing on the NN-Chip (Fig. 2H).
Finally, we equipped our NN-Chip platform with a high-resolution,multi-position microscope and a microinjection unit. This system per-mitted us to dissociate the complicated retina structure into a uniformnetwork; moreover, the accompanying microinjection unit allowedchemical modification, and the high-resolution microscope enhancedour observation potential, thereby improving the ability to assess thebystander effect in photoreceptor degeneration.
Blue light irradiation–induced 661W cell apoptosis whileculturing on the NN-ChipBlue light inducesmore damage than other visiblewavelengths in 661Wcells (21). After blue light over-irradiation, excessive reactive oxygenspecies (ROS) are generated by the high level of oxidative stress, whichinduces damage to proteins, lipids, and DNAs and results in apoptosis(22, 23). On the basis of this knowledge, wemeasured ROS concentrationafter irradiation of the 661W-containing NN-Chip under a 3000-lux-intensity blue light source or a white light sourcewith the same intensity
Fig. 1. Dissecting the mechanisms of photoreceptor degeneration via the bystander effect using the NN-Chip platform. (A) Excessive light irradiation inducesapoptosis in photoreceptors, which are highly connected throughout the photoreceptor layer by random synapses. (B) To dissect photoreceptor communication, whichis normally highly coupled in tissue and in dish culture, we loaded the 661W cells individually onto the NN-Chip. Each microwell was connected by microchannels toallow synapse formation between each photoreceptor, generating a highly guided neural network. (C) To study the bystander killing effect between cones, we se-lectively induced apoptosis using blue light sources. (D) To quantitatively analyze the role of Cx36 in bystander killing between cones on the NN-Chip, we used CRISPR(clustered regularly interspaced short palindromic repeats)–based gene-edited cells in conjunction with a microinjection unit.
S C I ENCE ADVANCES | R E S EARCH ART I C L E
Ma et al., Sci. Adv. 2018;4 : eaas9274 9 May 2018 2 of 9
on August 14, 2018http://advances.sciencem
ag.org/D
ownloaded from

SMARTER IMAGING: GAINING MORE FROM YOUR MICROSCOPY EXPERIMENTS
8 sciencemag.org | SCIENCE
as control for various times. Using a dichlorodihydrofluorescein di-acetate (H2DCFDA) ROS probe, we found that ROS concentrationincreased significantly after 6 hours of blue light irradiation comparedwith that of white light (control) treatment (Fig. 3A). After 24 hours ofblue light irradiation, ROS accumulation decreased, likely because mostof the cells were completely dysfunctional. It is possible that, in the661W cells, continuous blue light absorption increases ROS accumula-tion to the levels that exceed the cells’ antioxidative ability, thus trigger-ing apoptosis. ROS accumulation has also been shown to reduce themitochondrial membrane potential (mmp), which plays an essentialrole in the antioxidant defense system (24). Thus, we evaluated themmp of blue light–treated 661W cells using the JC-1mmp assay, whichlabels healthy cells (with highmmp) red, because of the JC-1 aggregates,and apoptotic cells (with low mmp) green, because of the JC-1 mono-mers. The cells with red and green signals (merged) were considered aspre-apoptosis (Fig. 3B and fig. S3).We also used SYTOXGreen to stainthe apoptotic cells to verify the existence of the light-sensitive charac-teristics in the 661W cells while culturing on the NN-Chip. Accordingto statistical data, with increasing blue light irradiation, the number ofpre-apoptotic and apoptotic 661W cells increased (Fig. 3, C and D).This assay also demonstrated that blue light irradiation, and the accom-panying increased ROS production, resulted in a significant mmp re-duction in the 661W cells.
Short-wavelength opsin (S-opsin) is a light-sensitive, conephotoreceptor–specific protein that is, not surprisingly, highly expressedin the 661W cells (25). Some researchers have noted the S-opsin ag-gregation as an indicator of cone photoreceptor dysfunction after blue
light irradiation (26). To determinewhether this phenomenon occurs inour NN-Chip, we cultured the 661W cells on chip for 6 hours and thentreated the cells with blue light for various times (fig. S4). S-opsin aggre-gation visibly increased after blue light treatment when compared withthewhite light group (Fig. 3E, arrows).Moreover, statistical results showedan increased percentage of S-opsin–aggregated cells in the 9- and 18-hourblue light–treated groups compared with those of the correspondingwhite light (Fig. 3F). Together, the increased ROS production, mitochon-dria dysfunction, and S-opsin aggregation that we observed after bluelight irradiation demonstrated that the 661W cells, when cultured onour NN-Chip, maintain their previously documented light-sensitiveproperties; thus, the NN-Chip is a valid platform to study the bystandereffect in the 661W cone photoreceptors.
Blue light–induced apoptosis spread to adjacent cells in agap junction–dependent mannerTo test the existence of bystander killing between cones, we first vali-dated the existence of tight junctions in the connected synapses betweenadjacent 661W cells cultured on the NN-Chip (fig. S5). Then, a circulararea with a radius of approximately 200 mm in the 661W-containingNN-Chip was treated for 6 hours using a 405-nm laser. After treatment,we removed the laser and monitored the apoptotic cell distribution bySYTOX Green staining. We monitored the results for up to 24 hoursafter irradiation, and it appeared that apoptosis had spread from theirradiated area to the adjacent cells. To determine whether apoptosissignals are transported to the adjacent cells via gap junctions, we addedthe gap junction blocker octanol (1 mM) to the culture medium (27);
Fig. 2. Operation and design of the NN-Chip platform. (A) Schematic of the cell loading process. (B) Representative image of loading efficiency. The 661W cells wereincubated in the medium with calcein for 20 min before loading. (C) Cell morphology after incubation for 1 hour on chip after loading. Scale bar, 40 mm. (D) Results oflarge-area loading by using the MDA-MB-231 cells with optimized parameters. Scale bar, 40 mm. (E) A scanning electron microscopy (SEM) image shows the neuralnetwork structure, including the microwells and their connecting microchannels, of the NN-Chip at a 30° tilt angle. (F) Representative images show that the 661W cellsformed neural network on the NN-Chip. The actin (green) was labeled by phalloidin, and the nuclei (blue) was labeled with 4′,6-diamidino-2-phenylindole (DAPI).(G) A representative SEM image shows a 661W cell with synapses extending into the surrounding chambers along with the microchannel. (H) Neural networkcreated by iCell neurons. Cells were stained by calcein after culturing on chip for 12 hours. Scale bar, 20 mm.
S C I ENCE ADVANCES | R E S EARCH ART I C L E
Ma et al., Sci. Adv. 2018;4 : eaas9274 9 May 2018 3 of 9
on August 14, 2018http://advances.sciencem
ag.org/D
ownloaded from

RESEARCH ARTICLES
9SCIENCE | sciencemag.org
this treatment appeared to ameliorate the spread of apoptosis during the24-hour post-irradiation window. We also used quinine (50 mM) andmeclofenamic (100 mM), which can selectively inhibit Cx36 and Cx43individually to test the functions of different connexin types during theapoptosis propagation (28–30). Quinine also blocked apoptosisspreading, but meclofenamic did not. These results showed that, incone photoreceptors, Cx36 plays a vital role in controlling apoptosisspreading, but Cx43 only slightly affects this phenomenon (Fig. 4A).We counted the apoptotic cells every hour after irradiation in eachgroup. In the nontreated group, apoptosis increased throughout thetime course; however, this increase was inhibited in the octanol- andquinine-treated group (Fig. 4B and movie S3). Together, all these dataprovided convincing evidence for the existence of a gap junction–dependent bystander killing effect manner between cone photorecep-tors. In addition, Cx36, mainly expressed in the central neuron systemespecially in cones, could be a potential target for preventing the ap-optosis spreading.
To assess the bystander killing effect at the single-cell level, we used aphotomask with 1000 5-mm-radius transparent pinholes on top of theNN-Chip, which only allows blue light irradiation on only one cell eachtime. We first recorded the positions of the apoptotic cells after bluelight irradiation. After that, wemonitored the apoptotic cell distributionfor various times and quantified the number of the post-apoptotic cellsadjacent to the original ones. Time-lapse microscopy revealed thatapoptosis eventually occurred in cells adjacent to the blue light–treatedcells (Fig. 5A and movie S4). Next, we quantified the apoptotic celldistribution across the NN-Chip after blue light irradiation. We foundthat 80% of the subsequent apoptotic cells were adjacent to the originallytreated ones, whereas the remaining apoptotic cells seemed to reflect as
random apoptotic behavior (fig. S6). To further address the mechanism,we hypothesized that, if apoptosis spreads via paracrine, the apoptoticcells should be distributed uniformly around the blue light–treated cells,whereas if apoptosis spreads via gap junctions, the apoptotic cellsshould be distributed asymmetrically. To distinguish between thesetwo scenarios, we counted the number of post-apoptotic cells adjacentto each pretreated cell. Most pretreated cells were only adjacent to oneor two apoptotic cells (Fig. 5B), implying that apoptosis propagation isoccurring directionally, likely via gap junctions, and not uniformly asparacrine. Finally, these results demonstrated the existence of thebystander killing effect in cone-derived 661W photoreceptors. Becausecones are critical for color recognition and high visual acuity (31), treat-ments that inhibit this gap junction–mediated bystander effect betweencones could extend the visual capabilities in some retinal disease patientswith cone photoreceptor degeneration.
Cx36 is required for apoptosis spreading incone photoreceptorsGap junctions allow the passage of substances less than 1 kDa, suchas Ca2+, inositol trisphosphate, and adenosine triphosphate; however,the exact role of the gap junction protein Cx36 in the cone bystanderkilling effect remains controversial (9, 17–19, 32–34).On the basis of ourresults thatCx36mayhave crucial functions indeath signal transportationin cones, we then targeted this gap junction using a more straightforwardmethod: by knocking out Cx36 in the 661W cells (Fig. 6A and fig. S7).Next, we used a microinjection unit to inject cytochrome c into singleCx36-knockout (KO) and wild-type (WT) 661W cells cultured on theNN-Chip to measure the apoptosis spreading results. In the cytoplasm,with the release of cytochrome c, several downstream apoptotic signals
Fig. 3. Maintaining the blue light–sensitive characters of 661W cells after loading and culturing on the NN-Chip. (A) ROS production accumulation, as measuredby the mean florescence intensity (MFI) of H2DCFDA, was assessed following blue or white light irradiation for various times (n = 10). (B) Representative images showJC-1–stained 661W cells after blue light irradiation. The healthy cells with high mmp appeared red (aggregates), the apoptotic cells with low mmp appeared green(monomers), and the pre-apoptotic cells appeared red and green. Scale bar, 20 mm. (C) Number of the SYTOX Green–labeled cells under blue light irradiation fordifferent time intervals. (D) Percentage of cells in each JC-1–stained group, which were counted in a 100 × 100 cell array (n = 10). (E) Representative immunostainingimages show S-opsin aggregation in 661W cells on the NN-Chip after blue light irradiation for 9 and 18 hours. The cells were stained for actin [green fluorescent protein(GFP)] and S-opsin (Alexa Flour 647), and the nuclei were stained with DAPI. Scale bar, 20 mm. (F) Quantitative analysis showed that the percentage of S-opsin–aggregated cells was increased by blue light irradiation compared with that by white light irradiation.
S C I ENCE ADVANCES | R E S EARCH ART I C L E
Ma et al., Sci. Adv. 2018;4 : eaas9274 9 May 2018 4 of 9
on August 14, 2018http://advances.sciencem
ag.org/D
ownloaded from

SMARTER IMAGING: GAINING MORE FROM YOUR MICROSCOPY EXPERIMENTS
10 sciencemag.org | SCIENCE
are activated. Comparedwith light irradiation, bothmethods can triggercell apoptosis, but cytochrome c acts as amore direct factor (35). There-fore, we chose the microinjection of cytochrome c, instead of light ir-radiation, to standardize the apoptosis time at the single-cell level.
Before performing the cytochrome c microinjection experiments,we optimized the experimental parameters. First, to minimize celldamage and satisfy that cells can still keep their normal function afterinjection, we optimized the injection pressure to 60 hPa, compensationpressure to 30 hPa, and injection time to 0.1 s (Fig. 6B and fig. S8) (36).Next, because only substances less than 1 kDa can pass through gapjunctions, we verified gap junction function in our 661W-containingNN-Chip by injecting tracers of different molecular weights and moni-toring their spread into adjacent cells. We injected solutions containing100 mM Lucifer yellow (457 Da) and 100 mM fluorescein isothio-cyanate (FITC)–dextran (10 kDa), and then analyzed their spreadingafter 15min. Lucifer yellow, but not FITC-dextran, easily passed throughthe gap junctions into adjacent cells (Fig. 6, C and D). Similarly, after
injection of both Lucifer yellow and Cascade blue dextran (3 kDa) intothe same cell, Lucifer yellow, but not blue dextran, was observed inadjacent cells (Fig. 6, E and F). These data suggest that the gap junctionsare functional between the 661W cells on the NN-Chip. These resultsare consistent with previous reports that showed that only substancesless than 1 kDa can pass through the gap junctions (37).
After optimization, we mixed cytochrome c (10 mg/ml) and bluedextran (20 mg/ml) in microinjection buffer and injected it into theCx36-KO and WT 661W cells; after 30 min, we cultured them inthe SYTOX Green–containing medium. After 6 hours, we assessed theapoptosis and dextran spreading results. The Cx36-KO cells showedvisibly less cell apoptosis spreading comparedwith theWTcells, and thedextran spreading patterns were similar to those of SYTOX in bothgroups (Fig. 6, G to J). In addition to the gap junctions remaining openafter cell apoptosis, the gap junctions may be dysfunctional because ofthe loss of membrane integration during the bystander killing process,leading the blue dextran spread to the adjacent cells to form this similarpattern (38, 39). Finally, we quantified apoptosis in cells adjacent tothe cytochrome c–microinjected cells and demonstrated that theinjected Cx36-KO cells had fewer adjacent cells undergoing apoptosisthan the injected WT cells (Fig. 6K). These data suggest that Cx36 isresponsible for the gap junction–dependent bystander effect in conephotoreceptors.
In summary, although inhibition of Cx36 may relieve the bystandereffect in retinal diseases, Cx36 also provides many important functionsin the retinal system (32, 33, 40), making it difficult to completely blockCx36 as a retinal protection mechanism (41). Thus, in the future, weaim to elucidate the importance rank of specific death signals, such as ionand microRNAs involved in the bystander effect, using the NN-Chipcombined with the microinjection technologies; this should reveal amore feasible method to remedy cone photoreceptor degeneration.
DISCUSSIONConsiderable research efforts have focused on finding the molecularmechanisms underlying the bystander effect, withmost studies focusingon the role of connexins and gap junctions. Treating cells and observing
Fig. 4. Evidence of the gap junction–mediated bystander killing effect in the 661W cells. (A) Representative bright field (BF) and fluorescence images showapoptosis distribution, detected by SYTOX staining, in different gap junction inhibitors (octanol, 1 mM; quinine, 50 mM; meclofenamic, 100 mM) after 6 hours of bluelight irradiation on the 661W-containing NN-Chip. White circles represent the initial irradiated area. Scale bar, 1 mm. (B) Schematic of the 405-mm laser spot diameterirradiation of the NN-Chip. Apoptosis was counted every hour for 24 hours after blue light irradiation (n = 10).
Fig. 5. Analysis of the bystander killing phenomenon at the single-cell level.(A) Representative time-course images of the bystander effect at the single-celllevel in SYTOX-stained 661W cells on the NN-Chip. A single cell was irradiated toblue light, and two adjacent cells eventually undergo apoptosis. Scale bar, 40 mm.(B) Schematic of the 5-mm laser spot irradiation of the NN-Chip. The number ofpost-apoptotic cells induced by each pretreated cell was quantified. The whiskersgo down to the smallest value and up to the largest. P < 0.0001 by one-way analysisof variance (ANOVA) analysis compared with zero- and four-cell group; n = 10.
S C I ENCE ADVANCES | R E S EARCH ART I C L E
Ma et al., Sci. Adv. 2018;4 : eaas9274 9 May 2018 5 of 9
on August 14, 2018http://advances.sciencem
ag.org/D
ownloaded from

RESEARCH ARTICLES
11SCIENCE | sciencemag.org
the behavior of adjacent cells have been the general methods used todissect the mechanism of the bystander effect. However, researchingthe bystander killing effect at the single-cell level is a more recent trendthat can uncover biological signals without the influence of uncertainelements associated with the complex structure and organization ofneural networks. To date, photoreceptor bystander research is fraughtwith technical challenges, including difficulties in dissociating retinalstructures and quantitatively measuring bystander killing speed, un-clear observations, and the lack of a reliable single-cell assay. Thus, theability to observe and quantify the bystander killing effect in conephotoreceptors is instrumental for further mechanistic research.
Here, we developed an innovative NN-Chip platform capable ofhigh-efficiency cell loading via a user-friendly centrifugation method,allowing the immobilization of single cells in individual microwells; thecells are connected to adjacent cells via synapses at uniform distances.Furthermore, because ourNN-Chip is an up-open platform combinedwith a microinjection unit, we can quickly treat single cells and assessthe effects on adjacent ones. Using this platform, we demonstratedseveral findings regarding the bystander effect in cone photoreceptors.First, we established the existence of the bystander killing effect be-tween cone photoreceptor–derived 661W cells by showing that bluelight–induced apoptosis in one cell can directionally spread to adja-cent cells. In our opinion, we have provided strong, clear, and, mostimportantly, quantitative evidence of a cone-to-cone bystanderkilling phenomenon. Second, we assessed the role of the gap junctionprotein Cx36, which is highly expressed in cones as a communicationchannel, in bystander killing phenomenon. Disruption of Cx36 viaCRISPR-Cas9 (CRISPR-associated protein 9 nuclease) gene editinggreatly decreased the apoptosis spreading compared with that ofWT661W cells. These data suggest that, in the cone photoreceptor layer,Cx36-containing channels act as tunnels that allow the passage of ap-optotic signals between cone photoreceptors, thus propagating apoptosisthroughout the entire photoreceptor layer.
In retina degeneration diseases, the bystander effect is an establishedmechanism to dissect apoptosis propagation from dying cells to healthyneighbors (4). As researches show, the gap junctionprovides a transmittingchannel for toxic substances from dying rods to healthy cones (10), andwe consequently analyzed the secondary bystander effect between
cones. On the basis of our results that Cx36 provides an avenue fortoxic spreading, wemay conclude that, although the Cx36-based GJICis not the only method between cones, Cx36 truly regulates the trans-mission of toxicity elements. Recently, the use of gene therapies andcombined approaches has provided promising therapeutic perspec-tives; thus, Cx36 may provide a potential treatment target to delaythe spreading of photoreceptor degeneration.
In conclusion, we created a novel platform for high-efficiency pattern-ing of neural networks, combined with a microinjection unit, which webelieve will lessen the challenges for dissecting the mechanisms of thebystander effect and gap junction functions. Moreover, this platformshould have additional applications in other types of neuron studies.
MATERIALS AND METHODSCell cultureThe 661W photoreceptor cell line was provided by M. Al-Ubaidi (De-partment of Biomedical Engineering, University of Houston). Thesecells were routinely cultured in Dulbecco’s modified Eagle’s medium(Gibco) supplemented with 10% heat-inactivated fetal bovine serum(Thermo Fisher Scientific) and 1% antibiotic-antimycotic (Gibco,15240-062) with hydrocortisone 21-hemisuccinate (40 ng/ml; Sigma,H-2270), progesterone (40 ng/ml; Sigma, P-8783), putrescine(0.032 mg/ml; Sigma, P-7505), and 0.004% (v/v) b-mercaptoethanol(Sigma, M-6250) at 37°C in a humidified atmosphere with 5% CO2.We used the conditioned medium (medium cultured with 661W cellsfor 6 hours) to culture cells on BME (Sigma)–coated NN-Chips. Wecultured the iCell neurons (Cellular Dynamics International Inc.) ontothe poly-L-ornithine/laminin (Sigma) surface-coated NN-Chip in thecomplete iCell neuronmaintenancemediumalso at 37°C in a humidifiedatmosphere with 5% CO2.
Design and fabrication of the NN-Chip moldAll designs were drawn with AutoCAD software and loaded as glassphotomasks (Photo Sciences Inc.). PDMS devices were fabricated bystandard photolithography and elastomermolding.We used SU-8 3025negative photoresist (MicroChem Corp.) to fabricate the 20-mm-deepstructures. The SU-8 3025 photoresist was spin-coated onto a 12.7-cm
Fig. 6. Assessing the effects of Cx36 on apoptosis spreading in the 661W cells. (A) Western blot analysis shows loss of Cx36 in Cx36-KO cells relative to that in WTcells. Glyceraldehyde-3-phosphate dehydrogenase (GAPDH) was used as a loading control. (B) A cell was being injected with a Femtotip (inner diameter, 0.5 mm; outerdiameter, 1 mm; Eppendorf) on the NN-Chip. (C andD) Dye distribution in 15min after injection of 100mM Lucifer yellow (457 Da) in (C) or of 100mM FITC-dextran (10 kDa)in (D). (E and F) Dye distribution in 15min after the injection of blue dextran (3 kDa) (E) and Lucifer yellow (F) and into the same cell. (G andH) Representative images showblue dextran (G) and SYTOX (H) distribution 6 hours after cytochrome c (10 mg/ml) and blue dextran (20 mg/ml) co-injection into a single WT cell. (I and J) Representativeimages showblue dextran (I) and SYTOX (J) distribution 6hours after cytochrome c (10mg/ml) andblue dextran (20mg/ml) co-injection into a single Cx36-KO cell. (K) Quantitativeanalysis of apoptosis in WT and Cx36-KO groups. The results are calculated from 50 single-cell injections per group. Scale bars, 20 mm (B to J).
S C I ENCE ADVANCES | R E S EARCH ART I C L E
Ma et al., Sci. Adv. 2018;4 : eaas9274 9 May 2018 6 of 9
on August 14, 2018http://advances.sciencem
ag.org/D
ownloaded from
SMARTER IMAGING: GAINING MORE FROM YOUR MICROSCOPY EXPERIMENTS
12 sciencemag.org | SCIENCE
silicon wafer at 500 rpm (Laurell Technologies Corp., model WS-400B-6NPP/LITE/AS) for 10 s with an acceleration of 100 rpm/s to spreadout the photoresist and then at 3500 rpm for 60 s with an acceleration of500 rpm/s. After soft baking at 65°C for 3 min and hard baking at 95°Cfor 10 min, the wafer was exposed under ultraviolet light with an expo-sure dose of 150 mJ/cm2 for 3 s. It was then heated for post-exposurebaking at 65°C for 1min andhard baking at 95°C for 3min. After 135°Cheating for 30min, the wafer was hydrophobic-processed by trimethyl-chlorosilane for 30 min. The modified wafer served as an SU-8 moldstructure. The PDMS oligomer and cross-linking pre-polymer of thePDMS agent from a Sylgard 184 kit (Dow Corning) were mixed in aweight ratio of 10:1. After degassing in vacuum, the appropriate weightmixture was poured onto the SU-8 mold to form a 2-mm-thick layerand cured at 85°C for 40 min. After the PDMS replica was peeled offfrom the SU-8 mold, we cut the PDMS into several 6 × 6 mm squares.For better imaging and cell culturing method, we bonded the PDMSflat surface side to 12-mm glass-based 35-mm dish (Thermo FisherScientific) by oxygen plasma [1min at an oxygen flow rate of 20 SCCM(standard cubic centimeter perminute), a chamber pressure of 500mtorr,and a power of 50 W].
Operation of the NN-ChipTo load cells into the NN-Chip, we used the Sorvall Legend X1R Cen-trifuge (ThermoFisher Scientific). First, we treated theNN-Chip surfaceby oxygen plasma (1min at an oxygen flow rate of 20 SCCM, a chamberpressure of 500 mtorr, and a power of 50 W), immediately covered itwith a BME droplet, and placed it at 37°C for 1 hour. After coating, weswiped the excessive liquid andmoved the surface onto a 95°C digitaldry bath (Bio-Rad) for 1 s to denature the BME coated on the surface.Once finished, we used a Staples invisible tape to peel off the excessiveBME. After surface modification, we dropped the 20-ml medium con-taining suspended cells onto the surface of NN-Chip. We tested severalspinning modes and chose the programmed centrifugation as follows:(i) 0 to 1000 rpm, acceleration = 1; (ii) 1000 rpm for 1 min; (iii) 1000 to600 rpm, deacceleration = 1; (iv) 600 to 0 rpm, deacceleration = 9. Afterspinning,we transferred theNN-Chip to an invertedmicroscope (EVOS)and used filter papers (Whatman) from one side to swipe away the un-loaded cells. Finally, we slightly dropped the 20-ml conditionedmediumon the NN-Chip and cultured cells at 37°C in a humidified atmospherewith 5% CO2. All the operations were finished in a culture hood to pre-vent contamination.
Creating the cone photoreceptor networkLoading single 661W cells with high efficiency is crucial for this high-throughput, single neural network platform. Correctly sizing the wellsto match the 661W cell size largely influenced the loading efficiency.Efficiency improved as the well diameters increased from 20 to 30 mm;however, well diameters >30 mmincreased the chance of two-cell loading.The density of the suspended cells also affected the loading efficiency,which was decreased by low density and cell gathering. Finally, we op-timized the distance between the 661W cells to ensure high coupling oftheir synapses. We found that 40 mm between the center of every wellwas the optimal distance to ensure synapse coupling, without large-cellmembrane contact. After all these optimizations, we routinely obtaineda loading efficiency of >95%.
Cell stainingTo have a better image, we used calcein (Thermo Fisher Scientific) tostain live cells. Cells were cultured in the calcein-containing medium
(1 mM) for 30 min and then loaded onto the NN-Chip. Stained cellscan keep the fluorescence for around 1 hour (fig. S1). We also usedphalloidin (A12379, Invitrogen) to label the actin in the 661W cells.
Light treatment to the 661W cellsWe used two kinds of blue and white light sources to treat cells under3000-lux-intensity conditions. Cells were first loaded onto theNN-Chipand incubated under a humidified atmosphere of 5% CO2 at 37°C.Then, they were treated with blue light-emitting diode (LED; 464 nm)or laser diode (405 nm) light on top of the NN-Chip, and the intensitieswere adjusted to the same lux using the Extech LT300 lightmeter (FLIRCommercial Systems Inc.). Control cells were incubated under the sameintensity white LED light (the wavelength peaks are 456 and 553 nm)with the same humidity and temperature environment.
Measurement of cellular ROS production and mmpFor ROS production measurements, 661W cells were loaded onto theNN-Chip and cultured for 6 hours. After 6, 12, 18, or 24 hours of blue orwhite light irradiation, we added 10 mM CM-H2DCFDA (Invitro-gen) to the culture medium and incubated for an additional hour.CM-H2DCFDA fluorescence was measured using a microplate reader(M33089, Thermo Fisher Scientific). Mmp was measured after the661W cells were exposed to blue light for 6, 12, or 18 hours using theJC-1 Mitochondrial Membrane Potential Assay Kit (ab11850, Abcam).The images were captured using a fluorescence microscope (EVOS FLAuto Cell Imaging System), and the numbers of fluorescent cells (red,green, and merged) were counted using ImageJ.
ImmunostainingThe 661W cells were loaded onto the NN-Chip and incubated for var-ious times. For S-opsin immunostaining, we fixed the cells with 4%paraformaldehyde (Sigma) for 10 min and blocked them in 3% bovineserum albumin (Sigma) for 30min after blue light irradiation. Then, weincubated the fixed cells overnight at 4°C with the primary antibody(sc-14363, Santa Cruz Biotechnology Inc.). After washing, the cellswere incubated for 1 hour with the secondary antibody [donkey anti-goat immunoglobulin G (IgG) H&L (Alexa Fluor 647), Abcam]; then,cell nuclei were stained with DAPI. For Cx36 immunostaining, we usedthe same procedure with the following antibodies: Cx36 polyclonal anti-body (Invitrogen), claudin-1 polyclonal antibody (Invitrogen, 71-7800),and goat anti-rabbit IgG H&L (Alexa Fluor 647, Abcam). Images weretaken using a Nikon A1 confocal microscope.
Cell apoptosis analysisSYTOX Green Dead Cell Stain (Thermo Fisher Scientific) was used tomeasure apoptosis levels in 661W cells. Medium containing SYTOX(0.5 mM) was added to the NN-Chip after blue light treatment to stainthe nucleotides of dead cells; then, we observed apoptosis spreading bytime-lapse microscope. To verify the SYTOX results, we used theAnnexin V-FITC Apoptosis Detection Kit (Abcam) per the manufac-turer’s instructions. Dead cells were counted using ImageJ.
Generation of Cx36-KO 661W cellsThe 661Wcells were cultured in six-well plates at a density of 5 × 10⁴ cellsper well for 24 hours. Then, we added 2 mg of CRISPR/Cas9–Cx36-KOplasmid with a GFP reporter (sc-420563, Santa Cruz Biotechnology) and6 ml of FuGENEHDTransfection Reagent (Promega) complex to 100 mlofOpti-MEM(Gibco). This transfection reactionwas added to the culturemedium, and after 24-hour incubation, we sorted the GFP-expressing
SC I ENCE ADVANCES | R E S EARCH ART I C L E
Ma et al., Sci. Adv. 2018;4 : eaas9274 9 May 2018 7 of 9
on August 14, 2018http://advances.sciencem
ag.org/D
ownloaded from
RESEARCH ARTICLES
13SCIENCE | sciencemag.org
cells by flow cytometry (LSRFortessa, BD Biosciences). Then, we ex-panded these cells as single-cell colonies to screen for Cx36-KO661W cells.
Western blotting analysisThe control and Cx36-KO 661W cells were seeded at a density of 5 ×10⁵ cells per well in six-well plates and incubated for 24 hours. Then, thecells were washed with phosphate-buffered saline, lysed in radioim-munoprecipitation assay buffer (Sigma), and harvested. Lysates werecentrifuged at 12,000 rpm for 10min at 4°C. The protein concentrationswere measured using the BCA Protein Assay Kit (Thermo Fisher Scien-tific) with standard bovine serum albumin. The samples were boiled for10 min at 100°C. The proteins were separated by SDS–polyacrylamidegel electrophoresis gradient electrophoresis and transferred to poly-vinylidene difluoride membranes (Bio-Rad). We used goat anti-Cx36(sc-14904, Santa Cruz Biotechnology) as the primary antibody andhorseradish peroxidase–conjugated donkey anti-goat IgG (ab97110,Abcam) as the secondary antibody.
Operation of microinjection systemThe microinjection system included a microinjector (FemtoJet 4i,Eppendorf) and amicro-manipulator (MS314,WPI) at a step resolutionof 0.5 mm. Injected liquid was loaded with a micro-loader (Eppendorf)and then injected into the cells. All the injection process was observedunder a charge-coupled device camera (C11440, Hamamatsu), whichwas a part of the Nikon eclipse Ti-based N-STORMmicroscopy system.
SUPPLEMENTARY MATERIALSSupplementary material for this article is available at http://advances.sciencemag.org/cgi/content/full/4/5/eaas9274/DC1fig. S1. Optimization of the parameters and conditions for high-efficiency 661W cell loading.fig. S2. A schematic shows the microwell BME-coating process on the NN-Chip.fig. S3. ROS production, mmp measurements, and SYTOX function test in the bluelight–treated 661W cells.fig. S4. Representative immunostaining images of S-opsin from 0 to 18 hours under blue lightirradiation.fig. S5. Existence of tight junctions in synapses and function validation of the SYTOX.fig. S6. Apoptotic cells were quantified with or without adjacent apoptotic cells (n = 10).fig. S7. Generation and verification of Cx36-KO 661W cells.fig. S8. Calibration of the microinjection volume.movie S1. Operation of NN-Chip.movie S2. Three-dimensional structural view of 661W cells cultured onto NN-Chip after6 hours.movie S3. Time lapse of the gap junction–mediated bystander killing effect in the 661W cells.movie S4. Apoptosis propagation from single cell.
REFERENCES AND NOTES1. A. F. Wright, C. F. Chakarova, M. M. A. El-Aziz, S. S. Bhattacharya, Photoreceptor
degeneration: Genetic and mechanistic dissection of a complex trait. Nat. Rev. Genet. 11,273–284 (2010).
2. A. B. Belousov, J. D. Fontes, Role of neuronal gap junctions in NMDA receptor-mediatedexcitotoxicity and ischemic neuronal death. Neural Regen. Res. 11, 75–76 (2016).
3. E. Decrock, M. Vinken, E. De Vuyst, D. V. Krysko, K. D’Herde, T. Vanhaecke,P. Vandenabeele, V. Rogiers, L. Leybaert, Connexin-related signaling in cell death: To liveor let die? Cell Death Differ. 16, 524–536 (2009).
4. H. Ripps, Cell death in retinitis pigmentosa: Gap junctions and the ‘bystander’ effect.Exp. Eye Res. 74, 327–336 (2002).
5. K. Cusato, A. Bosco, R. Rozental, C. A. Guimarães, B. E. Reese, R. Linden, D. C. Spray,Gap junctions mediate bystander cell death in developing retina. J. Neurosci. 23,6413–6422 (2003).
6. P. Kameritsch, N. Khandoga, U. Pohl, K. Pogoda, Gap junctional communication promotesapoptosis in a connexin-type-dependent manner. Cell Death Dis. 4, e584 (2013).
7. C. L. Cepko, The determination of rod and cone photoreceptor fate. Annu. Rev. Vis. Sci. 1,211–234 (2015).
8. S. Kohl, T. Marx, I. Giddings, H. Jägle, S. G. Jacobson, E. Apfelstedt-Sylla, E. Zrenner,L. T. Sharpe, B. Wissinger, Total colourblindness is caused by mutations in the geneencoding the a-subunit of the cone photoreceptor cGMP-gated cation channel.Nat. Genet. 19, 257–259 (1998).
9. D. C. Spray, R. Hanstein, S. V. Lopez-Quintero, R. F. Stout Jr., S. O. Suadicani, M. M. Thi, Gapjunctions and bystander effects: Good Samaritans and executioners. Wiley Interdiscip.Rev. Membr. Transp. Signal. 2, 1–15 (2013).
10. W. Zhang, K. Kai, D. S. Choi, T. Iwamoto, Y. H. Nguyen, H. Wong, M. D. Landis, N. T. Ueno,J. Chang, L. Qin, Microfluidics separation reveals the stem-cell–like deformability oftumor-initiating cells. Proc. Natl. Acad. Sci. U.S.A. 109, 18707–18712 (2012).
11. K. Zhang, C.-K. Chou, X. Xia, M.-C. Hung, L. Qin, Block-Cell-Printing for live single-cellprinting. Proc. Natl. Acad. Sci. U.S.A. 111, 2948–2953 (2014).
12. N. Chronis, M. Zimmer, C. I. Bargmann, Microfluidics for in vivo imaging of neuronal andbehavioral activity in Caenorhabditis elegans. Nat. Methods 4, 727–731 (2007).
13. J. W. Park, B. Vahidi, A. M. Taylor, S. W. Rhee, N. L. Jeon, Microfluidic culture platformfor neuroscience research. Nat. Protoc. 1, 2128–2136 (2006).
14. E. Tan, X.-Q. Ding, A. Saadi, N. Agarwal, M. I. Naash, M. R. Al-Ubaidi, Expression ofcone-photoreceptor–specific antigens in a cell line derived from retinal tumors intransgenic mice. Invest. Ophthalmol. Vis. Sci. 45, 764–768 (2004).
15. M. Rapp, G. Woo, M. R. Al-Ubaidi, S. P. Becerra, P. Subramanian, in Retinal DegenerativeDiseases (Springer, 2014), pp. 813–820.
16. L.-p. Yang, X.-. Zhu, M. O. M. Tso, Role of NF-kB and MAPKs in light-inducedphotoreceptor apoptosis. Invest. Ophthalmol. Vis. Sci. 48, 4766–4776 (2007).
17. J. J. O’Brien, X. Chen, P. R. MacLeish, J. O’Brien, S. C. Massey, Photoreceptor couplingmediated by connexin36 in the primate retina. J. Neurosci. 32, 4675–4687 (2012).
18. A. B. Belousov, J. D. Fontes, Neuronal gap junctions: Making and breaking connectionsduring development and injury. Trends Neurosci. 36, 227–236 (2013).
19. J. C. de Rivero Vaccari, R. A. Corriveau, A. B. Belousov, Gap junctions are required forNMDA receptor–dependent cell death in developing neurons. J. Neurophysiol. 98,2878–2886 (2007).
20. J. R. Rettig, A. Folch, Large-scale single-cell trapping and imaging using microwell arrays.Anal. Chem. 77, 5628–5634 (2005).
21. L. M. Rapp, S. C. Smith, Morphologic comparisons between rhodopsin-mediated andshort-wavelength classes of retinal light damage. Invest. Ophthalmol. Vis. Sci. 33,3367–3377 (1992).
22. E. I. Azzam, S. M. de Toledo, J. B. Little, Oxidative metabolism, gap junctions and theionizing radiation-induced bystander effect. Oncogene 22, 7050–7057 (2003).
23. Y. Kuse, K. Ogawa, K. Tsuruma, M. Shimazawa, H. Hara, Damage of photoreceptor-derivedcells in culture induced by light emitting diode-derived blue light. Sci. Rep. 4, 5223 (2014).
24. S. G. Jarrett, M. E. Boulton, Consequences of oxidative stress in age-related maculardegeneration. Mol. Aspects Med. 33, 399–417 (2012).
25. P. H. Tang, M. C. Buhusi, J.-X. Ma, R. K. Crouch, RPE65 is present in human green/red conesand promotes photopigment regeneration in an in vitro cone cell model. J. Neurosci. 31,18618–18626 (2011).
26. T. Zhang, N. Zhang, W. Baehr, Y. Fu, Cone opsin determines the time course of conephotoreceptor degeneration in Leber congenital amaurosis. Proc. Natl. Acad. Sci. U.S.A.108, 8879–8884 (2011).
27. G. R. Juszczak, A. H. Swiergiel, Properties of gap junction blockers and their behavioural,cognitive and electrophysiological effects: Animal and human studies. Prog.Neuropsychopharmacol. Biol. Psychiatry 33, 181–198 (2009).
28. M. Srinivas, M. G. Hopperstad, D. C. Spray, Quinine blocks specific gap junction channelsubtypes. Proc. Natl. Acad. Sci. U.S.A. 98, 10942–10947 (2001).
29. E. G. A. Harks, A. D. G. de Roos, P. H. Peters, L. H. de Haan, A. Brouwer, D. L. Ypey,E. J. van Zoelen, A. P. Theuvenet, Fenamates: A novel class of reversible gap junctionblockers. J. Pharmacol. Exp. Ther. 298, 1033–1041 (2001).
30. M. Srinivas, D. C. Spray, Closure of gap junction channels by arylaminobenzoates.Mol. Pharmacol. 63, 1389–1397 (2003).
31. E.-J. Lee, J.-W. Han, H.-J. Kim, I.-B. Kim, M.-Y. Lee, S.-J. Oh, J.-W. Chung, M.-H. Chun,The immunocytochemical localization of connexin 36 at rod and cone gap junctions inthe guinea pig retina. Eur. J. Neurosci. 18, 2925–2934 (2003).
32. B. Teubner, J. Degen, G. Söhl, M. Güldenagel, F. F. Bukauskas, E. B. Trexler, V. K. Verselis,C. I. De Zeeuw, C. G. Lee, C. A. Kozak, E. Petrasch-Parwez, R. Dermietzel, K. Willecke,Functional expression of the murine connexin 36 gene coding for a neuron-specific gapjunctional protein. J. Membr. Biol. 176, 249–262 (2000).
33. A. Calabrese, M. Zhang, V. Serre-Beinier, D. Caton, C. Mas, L. S. Satin, P. Meda, Connexin36 controls synchronization of Ca2+ oscillations and insulin secretion in MIN6 cells.Diabetes 52, 417–424 (2003).
34. J. Rash, W. A. Staines, T. Yasumura, D. Patel, C. S. Furman, G. L. Stelmack, J. I. Nagy,Immunogold evidence that neuronal gap junctions in adult rat brain and spinal cordcontain connexin-36 but not connexin-32 or connexin-43. Proc. Natl. Acad. Sci. U.S.A. 97,7573–7578 (2000).
S C I ENCE ADVANCES | R E S EARCH ART I C L E
Ma et al., Sci. Adv. 2018;4 : eaas9274 9 May 2018 8 of 9
on August 14, 2018http://advances.sciencem
ag.org/D
ownloaded from
REFERENCES AND NOTES1. A. F. Wright, C. F. Chakarova, M. M. A. El-Aziz, S. S. Bhattacharya, Nat. Rev. Genet. 11, 273–284 (2010). 2. A. B. Belousov, J. D. Fontes, Neural Regen. Res. 11, 75–76 (2016). 3. E. Decrock et al., Cell Death Differ. 16, 524–536 (2009). 4. H. Ripps, Exp. Eye Res. 74, 327–336 (2002). 5. K. Cusato et al., J. Neurosci. 23, 6413–6422 (2003). 6. P. Kameritsch, N. Khandoga, U. Pohl, K. Pogoda, Cell Death Dis. 4, e584 (2013). 7. C. L. Cepko, Annu. Rev. Vis. Sci. 1, 211–234 (2015). 8. S. Kohl et al., Nat. Genet. 19, 257–259 (1998).9. D. C. Spray et al., Wiley Interdiscip. Rev. Membr. Transp. Signal. 2, 1–15 (2013). 10. W. Zhang et al., Proc. Natl. Acad. Sci. U.S.A. 109, 18707–18712 (2012). 11. K. Zhang, C.-K. Chou, X. Xia, M.-C. Hung, L. Qin, Proc. Natl. Acad. Sci. U.S.A. 111, 2948–2953 (2014). 12. N. Chronis, M. Zimmer, C. I. Bargmann, Nat. Methods 4, 727–731 (2007). 13. J. W. Park, B. Vahidi, A. M. Taylor, S. W. Rhee, N. L. Jeon, Nat. Protoc. 1, 2128–2136 (2006). 14. E. Tan et al., Invest. Ophthalmol. Vis. Sci. 45, 764–768 (2004). 15. M. Rapp, G. Woo, M. R. Al-Ubaidi, S. P. Becerra, P. Subramanian, in Retinal Degenerative Diseases (Springer, 2014), pp. 813–820. 16. L.-p. Yang, X.-. Zhu, M. O. M. Tso, Invest. Ophthalmol. Vis. Sci. 48, 4766–4776 (2007). 17. J. J. O’Brien, X. Chen, P. R. MacLeish, J. O’Brien, S. C. Massey, J. Neurosci. 32, 4675–4687 (2012). 18. A. B. Belousov, J. D. Fontes, Trends Neurosci. 36, 227–236 (2013). 19. J. C. de Rivero Vaccari, R. A. Corriveau, A. B. Belousov, J. Neurophysiol. 98, 2878–2886 (2007). 20. J. R. Rettig, A. Folch, Anal. Chem. 77, 5628–5634 (2005). 21. L. M. Rapp, S. C. Smith, Invest. Ophthalmol. Vis. Sci. 33, 3367–3377 (1992). 22. E. I. Azzam, S. M. de Toledo, J. B. Little, Oncogene 22, 7050–7057 (2003). 23. Y. Kuse, K. Ogawa, K. Tsuruma, M. Shimazawa, H. Hara, Sci. Rep. 4, 5223 (2014). 24. S. G. Jarrett, M. E. Boulton, Mol. Aspects Med. 33, 399–417 (2012). 25. P. H. Tang, M. C. Buhusi, J.-X. Ma, R. K. Crouch, J. Neurosci. 31, 18618–18626 (2011). 26. T. Zhang, N. Zhang, W. Baehr, Y. Fu, Proc. Natl. Acad. Sci. U.S.A. 108, 8879–8884 (2011).
27. G. R. Juszczak, A. H. Swiergiel, Prog. Neuropsychopharmacol. Biol. Psychiatry 33, 181–198 (2009). 28. M. Srinivas, M. G. Hopperstad, D. C. Spray, Proc. Natl. Acad. Sci. U.S.A. 98, 10942–10947 (2001). 29. E. G. A. Harks et al., J. Pharmacol. Exp. Ther. 298, 1033–1041 (2001). 30. M. Srinivas, D. C. Spray, Mol. Pharmacol. 63, 1389–1397 (2003). 31. E.-J. Lee et al., Eur. J. Neurosci. 18, 2925–2934 (2003). 32. B. Teubner et al., J. Membr. Biol. 176, 249–262 (2000). 33. A. Calabrese et al., Diabetes 52, 417–424 (2003). 34. J. Rash et al., Proc. Natl. Acad. Sci. U.S.A. 97, 7573–7578 (2000). 35. A. J. Kole, E. R. Knight, M. Deshmukh, J. Vis. Exp. 52, e2773 (2011). 36. R. N. Cottle, C. M. Lee, D. Archer, G. Bao, Sci. Rep. 5, 16031 (2015). 37. S. A. Bloomfield, B. Völgyi, Nat. Rev. Neurosci. 10, 495–506 (2009). 38. K. Cusato, H. Ripps, J. Zakevicius, D. Spray, Cell Death Differ. 13, 1707–1714 (2006). 39. J. C. Goldstein, N. J. Waterhouse, P. Juin, G. I. Evan, D. R. Green, Nat. Cell Biol. 2, 156–162 (2000). 40. V. Gomez-Vicente, M. Donovan, T. Cotter, Cell Death Differ. 12, 796–804 (2005). 41. A. Akopian et al., J. Neurosci. 34, 10582–10591 (2014).
Acknowledgments: We thank M. Al-Ubaidi from the University of Houston for provid-ing the 661W cells. Funding: We are grateful for funding support from R01 CA180083, R56 AG049714, and R21 CA191179. Author contributions: Y.M., X.H., and L.Q. designed research; Y.M., X.H., and B.C.C. performed research; Y.M., B.C.C., P.Z., and K.Z. analyzed data; Y.M., B.C.C., Z.H., and L.Q. wrote the paper. Competing interests: The authors declare that they have no competing interests. Data and materials availability: All data needed to evaluate the conclusions in the paper are present in the paper and or the Supplementary Materials. Additional data related to this paper may be requested from the authors. The 661W cell can be provided by M. Al-Ubaidi from the University of Houston pending scientific review and a completed materials transfer agreement. Requests for the 661W cell should be submitted to M. Al-Ubaidi.
Submitted 10 January 2018Accepted 21 March 2018Published 9 May 201810.1126/sciadv.aas9274
Citation: Y. Ma, X. Han, R. B. de Castro, P. Zhang, K. Zhang, Z. Hu, L. Qin, Analysis of the bystander effect in cone photoreceptors via a guided neural network platform. Sci. Adv. 4, eaas9274 (2018).
SUPPLEMENTARY MATERIALSSupplementary material for this article is available at http://advances.sciencemag.org/cgi/content/full/4/5/eaas9274/DC1fig. S1. Optimization of the parameters and conditions for high-efficiency 661W cell loading.fig. S2. A schematic shows the microwell BME-coating process on the NN-Chip.fig. S3. ROS production, mmp measurements, and SYTOX function test in the bluelight–treated 661W cells.fig. S4. Representative immunostaining images of S-opsin from 0 to 18 hours under blue light irradiation.fig. S5. Existence of tight junctions in synapses and function validation of the SYTOX.fig. S6. Apoptotic cells were quantified with or without adjacent apoptotic cells (n = 10).fig. S7. Generation and verification of Cx36-KO 661W cells.fig. S8. Calibration of the microinjection volume.movie S1. Operation of NN-Chip.movie S2. Three-dimensional structural view of 661W cells cultured onto NN-Chip after6 hours.movie S3. Time lapse of the gap junction–mediated bystander killing effect in the 661W cells.movie S4. Apoptosis propagation from single cell.

SMARTER IMAGING: GAINING MORE FROM YOUR MICROSCOPY EXPERIMENTS
14 sciencemag.org | SCIENCE
B IOPHYS IC S Copyright © 2018
The Authors, some
rights reserved;
exclusive licensee
American Association
for the Advancement
of Science. No claim to
originalU.S. Government
Works. Distributed
under a Creative
Commons Attribution
NonCommercial
License 4.0 (CC BY-NC).
Bacteria as living patchy colloids:Phenotypic heterogeneity in surface adhesionTeun Vissers,1* Aidan T. Brown,1 Nick Koumakis,1 Angela Dawson,1 Michiel Hermes,1,2
Jana Schwarz-Linek,1 Andrew B. Schofield,1 Joseph M. French,1,3 Vasileios Koutsos,3 Jochen Arlt,1
Vincent A. Martinez,1 Wilson C. K. Poon1
Understanding and controlling the surface adhesion of pathogenic bacteria is of urgent biomedical importance. How-ever,many aspects of this process remain unclear (for example, microscopic details of the initial adhesion and possiblevariations between individual cells). Using a new high-throughput method, we identify and follow many single cellswithin a clonal population of Escherichia colinear a glass surface.We find strongphenotypic heterogeneities: A fractionof the cells remain in the free (planktonic) state, whereas others adhere with an adhesion strength that itself exhibitsphenotypic heterogeneity. We explain our observations using a patchy colloid model; cells bind with localized, adhe-sive patches, and the strength of adhesion is determined by the number of patches: Nonadherers have no patches,weak adherers bind with a single patch only, and strong adherers bind via a single or multiple patches. We discusspossible implications of our results for controlling bacterial adhesion in biomedical and other applications.
INTRODUCTIONBacterial colonization of myriad niches, both natural and man-made,begins with adhesion to surfaces (1, 2). The colonization of man-madesurfaces (catheters, surgical implants, etc.) causes infection (3) becauseadhering biofilms resist physical and chemical assaults (4), and it con-tributes to the emergence of antimicrobial resistance (5). Understandingand minimizing bacterial adhesion is a cross-disciplinary “grand chal-lenge” (6), in which it is key to understand the forces involved. Besidesgeneric electrostatics and dispersion forces (7), there are also forces ofbiological origin associated with various adhesins and sticky organelles(for example, fimbriae) (6, 8–10).
Biophysical studies of bacterial adhesion typically fall into twocategories (11): high-throughput, population-level work giving littlesingle-cell information or low-throughput single-cell studies.We reporta robust, generic, and high-throughput tracking and big-data analysistechnique that reveals detailed single-cell information in a large popu-lation. Applying this technique to Escherichia coli on glass, we find sub-stantial variability in the propensity for adhesion and the postadhesiondynamics. Some cells do not adhere despite repeated encounters,whereas others adhere rapidly upon contact. Among the adherers, afraction pivot freely around their own attachment points and can beremoved from the surface by gravity, whereas the remainder spend partof their time in a more strongly bound, rotationally constrained state.This variability remains in flagella- and fimbriae-deletion mutants.
From the biological perspective, such variability exemplifies pheno-typic heterogeneity in a clonal population (12) and offers a new modelfor its study (13, 14). Given the variety of surfaces that bacteria may en-counter, such adhesive phenotypic heterogeneity may be an instance of“bet hedging” (15), allowing survival when the environment changes un-predictably (for example, following fecal excretion for Enterobacteriaceae).
In soft matter terms, genetically monodisperse E. coli cells are ad-hesively polydisperse and behave as “living patchy colloids” bearing a
variable number of sticky patches on their cell bodies. Thus, the consid-erable knowledge about patchy colloids accumulated over the pastdecade (16–18) can be deployed in the design of abiotic surfaces tominimize bacterial adhesion. Bacterial adhesion to engineered patchysoft surfaces has been studied before (19), but the possibility of patch-iness on the bacteria themselves has not been considered inmuch detail.
We studied E. coli strain AB1157. Like all K-12 derivatives, it hasmu-tations in the rfb gene cluster [here, in rfbD (20)] preventing O-antigenproduction (21). Thus, one major cause of variability and molecularroughness on the cell surface is absent. Our cells display a highly con-served layer of core oligosaccharides anchored to the outer membraneby lipid A (22), although the precise terminal sugars in AB1157 are un-known. Besides the wild-type (WT), to further simplify the surface, wealso used amutant (AD19 = AB1157 fimA−, fliF−; hereafter DFF) defec-tive in producing type 1 fimbriae and flagella. In transmission electronmicrographs (fig. S1), these cells appear smooth down to≲ 10 nm. Anyheterogeneities, or “patchiness,” on the surface of this mutant are likelydue to membrane proteins.
RESULTSA high-throughput method reveals complexadhesion behaviorTo monitor surface adhesion of E. coli, we loaded cell suspensions into400-mm-high borosilicate glass capillaries at ~ 4.5 × 10⁷ cells/ml (WT)or ~ 1.5 × 10⁷ cells/ml (DFF) in phosphate motility buffer (MB) andobserved them in an inverted microscope at ca. 22°C using a 60×phase-contrast objective (focal depth ~ 3.5 mm) (Fig. 1A). From mea-surements at the lower surface at the start of the experiment, weestimate an initial motile fraction between 25 and 35% [nonadheringmotile cells swim at an average speed of≲ 20 mm s−1 (23)]; the remain-ing cells are nonmotile and diffuse as passive colloids. With 0.72 mMglucose included in the MB, the swimmers maintain their speed forat least 20 hours (23). Atomic force microscopy (AFM) measurementsreveal that the glass surface is smooth,with a root-mean-squared rough-ness of 0.25 ± 0.003 nm (fig. S2).
Time-lapse images of the bottom and top glass surfaces were takenautomatically at multiple locations to track arriving cells and theirsubsequent fate. We adapted algorithms used for colloidal rods (24)
1ScottishUniversities PhysicsAlliances andSchool of Physics andAstronomy,University ofEdinburgh, James Clerk Maxwell Building, Peter Guthrie Tait Road, Edinburgh EH9 3FD,UK. 2Department of Physics, Soft Condensed Matter Debye Institute for NanomaterialsScience, Utrecht University, Princetonplein 5, 3584 CC Utrecht, Netherlands. 3School ofEngineering, Institute for Materials and Processes, University of Edinburgh, SandersonBuilding, Robert Stevenson Road, The King’s Buildings, Edinburgh EH9 3FB, UK.*Corresponding author. Email: [email protected]
S C I ENCE ADVANCES | R E S EARCH ART I C L E
Vissers et al., Sci. Adv. 2018;4 : eaao1170 27 April 2018 1 of 8
on August 14, 2018http://advances.sciencem
ag.org/D
ownloaded from
Originally published 27 April 2018 in SCIENCE ADVANCES

RESEARCH ARTICLES
15SCIENCE | sciencemag.org
to determine the position r, orientation q, and projected length lP ofeach cell (movie S1) and track these in time. Typical analyzed trajec-tories are shown in Fig. 1B andmovie S2. Quantifying these trajectoriesallows us to classify cells’ adhesive phenotypes.
Focusing first on translation, we identified for each cell the point ofleast motion along its length axis (fig. S3), corresponding roughly to thecenter of attachment for adhered cells and to the hydrodynamic centerfor free cells, and determined its mean-squared displacement (MSD) =⟨(r(t + t) − r(t))2⟩. At short delay time (t ≤ 0.4 s), all cells showMSD ≅ CTtkT , with a range of {CT, kT} (Fig. 1C), exhibiting con-strained, diffusive, or ballistic (directed) motion with values peakedaround kT = 0, 1, or 2, respectively (25, 26).
The probability distribution of kT, P(kT), shows three well-separatedpeaks (Fig. 1D), classifying cells into adherers (A), diffusers (D), or swim-mers (S). Cells with kT ≲ 0.6 and kT ≳ 1.3 correspond to adherers andswimmers, respectively. Diffusers show 0.6 ≲ kT ≲ 1.3; the spread andskewness of the distribution in this range come from the finite, stochastictrajectories used in tracking.
The initial analysis misidentified some diffusers as adherers and viceversa, for example, because of the width of the distributions and a fewadherers that pivot around their poles and swing out of plane, showingup as rapid short-timemotion. To resolve this issue, we further requiredthat adherers be visible for at least 6 s. Trajectories with kT ≲ 0.6 and
shorter than 6 s were labeled as ambiguous. For trajectories greater than6 s, we also calculated the translational exponents for the longer delaytime of t = 4 s; we then used this exponent, k4sT , as a cell’s translationalexponent if both k4sT < 0:6 and k4sT < k0:4sT and identified the trajectoryon this basis.
Visual inspection of trajectories (movies S3 to S7) revealed correctautomated classification of≳ 95 % of all cells using this algorithm. Theshallow minimum in P(kT) demarcating the D and S subpopulationscoincides with the cutoff in P(kT) measured for the DFF mutant (Fig.1E, gray), which does not swim.
Similarly, we fitted the mean-squared orientational displacement(MSOD)¼ ⟨ðqðt þ tÞ � qðtÞÞ2⟩ ¼ CRtkR for t < 0.4 s. The probabilitydistribution of kR, P(kR), for WT adherers shows two peaks falling offto a long “tail” at kR ~ 2 (Fig. 1E). We interpret kR ~ 0 as correspondingto adhering cells that “wobble” (W) around a fixed orientation; kR ~ 1 ascorresponding to cells that “pivot” (P) around a fixed attachment pointand undergo apparently free rotational diffusion; and kR ~ 2 as corre-sponding to cells that “rotate ballistically” (R).
Only adherers show three rotational modes. Diffusing and swim-ming cells both appear only as a single mode in kR. This pattern is clearin the two-dimensional heat map of {kT, kR} (Fig. 1F), which shows threefeatures for adherers (W, P, and R), one for diffusers (D), and one forswimmers (S). Of the three different adheringmodes, the active rotators
A
B
C
E
D
F
–0.5
0.0
0.5Coordinate
on length axis
Anchoring point
Length axisExample Schematic
Most mobile point
Fig. 1. Tracking and classification of bacteria. (A) Schematic of adhering (blue), diffusing (olive), and swimming (red) bacteria in a capillary. (B) Trajectories tracingthe most mobile point on a cell. Straight red lines are fits of the length axis, squares mark anchoring points, and letters mark the type: diffuser (D), swimmer (S), wobbler(W), pivoter (P), and active rotator (R). The image is black/white-inverted and thresholded to be clear in print. Inset: Adhering cell and schematic depicting the anchoringcoordinate and most mobile coordinate ∈ [−0.5, 0.5] on its length axis. (C) MSDs as a function of time interval t from trajectories of swimming (red), diffusing (olive), andadhering (blue) bacteria; thin lines show randomly selected individual trajectories and thick lines represent the average ⟨R2(A, t)⟩i,t of each category. The insets show anexample trajectory for each category; squares denote the position in the last frame. (D) Normalized distribution of the translational exponent kT for WT cells on glassduring the first 2 hours of the experiment, showing distinct peaks for adhering (A), diffusing (D), and swimming (S) subpopulations. (E) Normalized distribution of therotational exponent kR for adhering cells, showing three peaks for wobblers (W), pivoters (P), and active rotators (R). Data in in panels D and E for the nonflagellatedmutant DFF are shown in gray. (F) Two-dimensional histogram (logarithmic scaling) of the translational (kT) and rotational (kR) exponents for WT cells, showing threepeaks for adherers (W, P, and R), one for diffusers (D), and one for swimmers (S). The distributions in panels D to F are based on 139,335 cells for WT and 10,582 cells forDFF , and data are weighted for trajectory durations.
S C I ENCE ADVANCES | R E S EARCH ART I C L E
Vissers et al., Sci. Adv. 2018;4 : eaao1170 27 April 2018 2 of 8
on August 14, 2018http://advances.sciencem
ag.org/D
ownloaded from
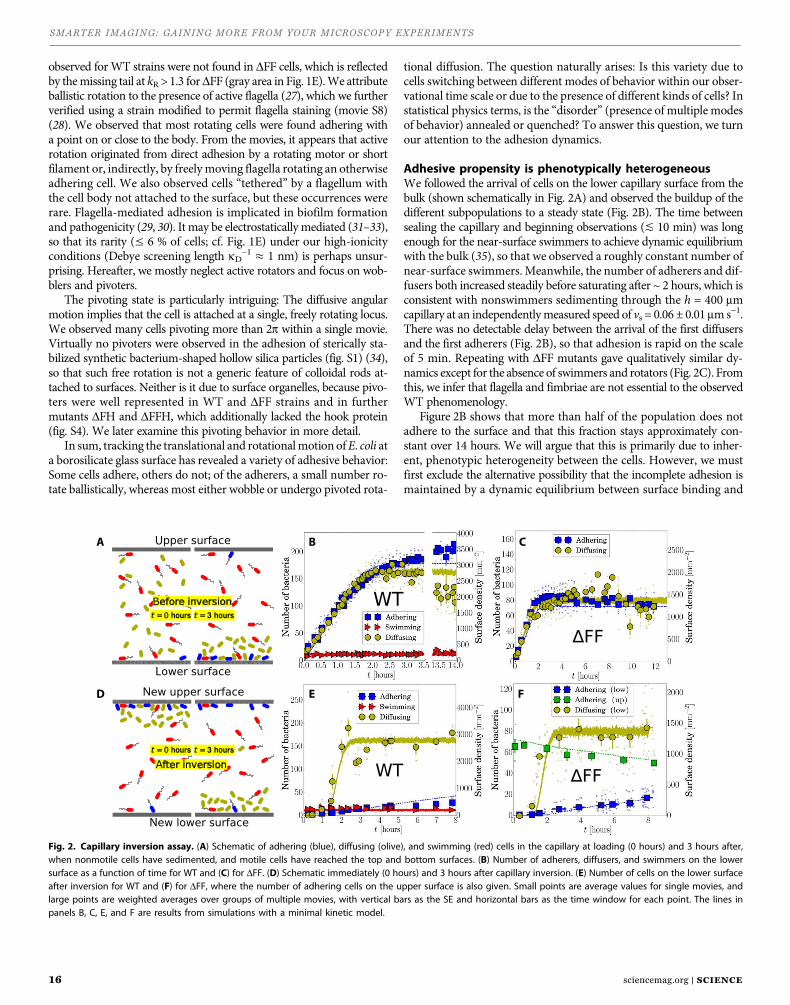
SMARTER IMAGING: GAINING MORE FROM YOUR MICROSCOPY EXPERIMENTS
16 sciencemag.org | SCIENCE
observed forWT strains were not found in DFF cells, which is reflectedby themissing tail at kR > 1.3 forDFF (gray area in Fig. 1E).We attributeballistic rotation to the presence of active flagella (27), which we furtherverified using a strain modified to permit flagella staining (movie S8)(28). We observed that most rotating cells were found adhering witha point on or close to the body. From the movies, it appears that activerotation originated from direct adhesion by a rotating motor or shortfilament or, indirectly, by freelymoving flagella rotating an otherwiseadhering cell. We also observed cells “tethered” by a flagellum withthe cell body not attached to the surface, but these occurrences wererare. Flagella-mediated adhesion is implicated in biofilm formationand pathogenicity (29, 30). It may be electrostatically mediated (31–33),so that its rarity (≤ 6 % of cells; cf. Fig. 1E) under our high-ionicityconditions (Debye screening length kD
−1 ≈ 1 nm) is perhaps unsur-prising. Hereafter, we mostly neglect active rotators and focus on wob-blers and pivoters.
The pivoting state is particularly intriguing: The diffusive angularmotion implies that the cell is attached at a single, freely rotating locus.We observed many cells pivoting more than 2p within a single movie.Virtually no pivoters were observed in the adhesion of sterically sta-bilized synthetic bacterium-shaped hollow silica particles (fig. S1) (34),so that such free rotation is not a generic feature of colloidal rods at-tached to surfaces. Neither is it due to surface organelles, because pivo-ters were well represented in WT and DFF strains and in furthermutants DFH and DFFH, which additionally lacked the hook protein(fig. S4). We later examine this pivoting behavior in more detail.
In sum, tracking the translational and rotationalmotion ofE. coli ata borosilicate glass surface has revealed a variety of adhesive behavior:Some cells adhere, others do not; of the adherers, a small number ro-tate ballistically, whereas most either wobble or undergo pivoted rota-
tional diffusion. The question naturally arises: Is this variety due tocells switching between different modes of behavior within our obser-vational time scale or due to the presence of different kinds of cells? Instatistical physics terms, is the “disorder” (presence of multiple modesof behavior) annealed or quenched? To answer this question, we turnour attention to the adhesion dynamics.
Adhesive propensity is phenotypically heterogeneousWe followed the arrival of cells on the lower capillary surface from thebulk (shown schematically in Fig. 2A) and observed the buildup of thedifferent subpopulations to a steady state (Fig. 2B). The time betweensealing the capillary and beginning observations (≲ 10 min) was longenough for the near-surface swimmers to achieve dynamic equilibriumwith the bulk (35), so that we observed a roughly constant number ofnear-surface swimmers. Meanwhile, the number of adherers and dif-fusers both increased steadily before saturating after ~ 2 hours, which isconsistent with nonswimmers sedimenting through the h = 400 mmcapillary at an independentlymeasured speed of vs = 0.06 ± 0.01 mms−1.There was no detectable delay between the arrival of the first diffusersand the first adherers (Fig. 2B), so that adhesion is rapid on the scaleof 5 min. Repeating with DFF mutants gave qualitatively similar dy-namics except for the absence of swimmers and rotators (Fig. 2C). Fromthis, we infer that flagella and fimbriae are not essential to the observedWT phenomenology.
Figure 2B shows that more than half of the population does notadhere to the surface and that this fraction stays approximately con-stant over 14 hours. We will argue that this is primarily due to inher-ent, phenotypic heterogeneity between the cells. However, we mustfirst exclude the alternative possibility that the incomplete adhesion ismaintained by a dynamic equilibrium between surface binding and
A
D E F
B CU
hours hours3
hours hours3
L
N
N
Fig. 2. Capillary inversion assay. (A) Schematic of adhering (blue), diffusing (olive), and swimming (red) cells in the capillary at loading (0 hours) and 3 hours after,when nonmotile cells have sedimented, and motile cells have reached the top and bottom surfaces. (B) Number of adherers, diffusers, and swimmers on the lowersurface as a function of time for WT and (C) for DFF. (D) Schematic immediately (0 hours) and 3 hours after capillary inversion. (E) Number of cells on the lower surfaceafter inversion for WT and (F) for DFF, where the number of adhering cells on the upper surface is also given. Small points are average values for single movies, andlarge points are weighted averages over groups of multiple movies, with vertical bars as the SE and horizontal bars as the time window for each point. The lines inpanels B, C, E, and F are results from simulations with a minimal kinetic model.
S C I ENCE ADVANCES | R E S EARCH ART I C L E
Vissers et al., Sci. Adv. 2018;4 : eaao1170 27 April 2018 3 of 8
on August 14, 2018http://advances.sciencem
ag.org/D
ownloaded from

RESEARCH ARTICLES
17SCIENCE | sciencemag.org
unbinding of otherwise identical cells. For this, we use an inversion assay(36), in which we inverted the capillary and observed that nonadheringdiffusing cells sediment toward the new lower surface, which, at thispoint, is virtually empty (Fig. 2D, left panel). When the sedimentingcells reach the new lower surface around 1 to 2 hours after inversion(Fig. 2, E and F), almost none of them adhere. This is inconsistentwith a dynamic equilibrium between otherwise identical cells, for whichwe would expect the same ratio of diffusers to adherers on the lowersurface before and after inversion. Therefore, we reason that there aredifferences between the adhesive properties of individual cells. In sta-tistical physics terms, the disorder in adhesive propensity is quenched.This inversion assay also rules out a third possibility, that the numberof adherers is limited by the availability of binding sites on the glass sur-face. In this unobserved scenario, we would expect phenotypically stickycells, which were unable to find a binding site before inversion, to ad-here post-inversion to the new, empty lower surface.
Over longer time scales, there is a slight increase in the number ofadhering cells on the new lower surface for both DFF and WT cells.This increase is due to previously adhering cells detaching slowlyfrom the new upper surface and sedimenting downward and reat-taching to the new lower surface. We can show this by monitoringthe decay in adherer numbers remaining on the (new) upper surface(green squares in Fig. 2F). Fitting the adherer number N to N(t) =N(0)e− gt returns a detachment rate of g ≈ 0.032 hour−1. After thetime it takes for detached adherers to sediment through the capillary(less than 2 hours), all of these cells appear at and re-adhere to the(new) lower surface, with the rate of this attachment being approx-imately equal to the detachment rate, as one would expect from ourpicture. This shows that the adhesion properties of individual cellsare preserved in time: Cells that were previously adhering on the(new) upper surface, detach, and sediment downward are capableof reattaching on the (new) lower surface.
Postadhesion dynamics are alsophenotypically heterogeneousWe next focus on adhering cells and distinguish between wobblers andpivoters on the basis of their MSOD. We report data for DFF mutants,for which there are no active rotators. As cells arrived on the lower cap-illary surface, the number of wobblers and pivoters increased linearlybefore saturating, showing a constant P/W ratio of 3:1 throughout(Fig. 3A). After capillary inversion, the dynamics of these two subpopu-lations diverged: Pivoters left the (new) upper surface at least an order ofmagnitude faster than wobblers, whose number remained almost con-stant (Fig. 3B). Thus, wobblers appear more tightly bound.
The rate of arrival of pivoters on the (new) lower surface (Fig. 3C)equaled the rate of their disappearance from the (new) upper surface(Fig. 3B), with a delay in arrival consistent with sedimenting through400 mm. The buildup of wobblers on the (new) lower surface com-menced≳ 1 hour after the arrival of the first pivoters, suggesting thatpivoters may become wobblers. To confirm this, we monitored ad-herers on the lower surface before inversion over 8 hours in the steadystate and measured the fraction of time Fw, each cell spent as a wobbler(Fig. 3D): ~ 70% of cells were always pivoting, whereas the remainderswitched between wobbling and pivoting.
The data in Fig. 3D are not consistent with a single population ofadherers stochastically switching between wobbling and pivotingstates, for which we expect a broad distribution peaked around someintermediate Fw. The sharp peak at Fw = 0 (always pivoting) impliesat least two populations: a stochastically switching fraction and apure pivoting fraction.
The interstate switching dynamics can be quantified (Fig. 3E) by atime-dependent transition matrix, Pab(Dt), giving the probability of acell in state “a” at time t being in state “b” at time t + Dt, where {a} ={P, W} and {b} = {P, W, O}, with P, W, and O standing for pivoting,wobbling, and off, respectively, with the latter denoting a cell detaching
A
D
E
F
B
C
DP
DPW W
Fig. 3. Polydispersity in adhering cells for DFF. (A) Number of wobbling and pivoting cells on the lower surface before capillary inversion and (B and C) on the upper andlower surface after capillary inversion. Solid lines in panels A to C are from simulations with a minimal kinetic model. Data correspond to the inversion experiments inFig. 2 (C and F). (D) Histogram showing the fraction of time cells are identified as wobbling on the lower surface before inversion, as in experiments (from a total of 117movies over six different positions recorded between 4 and 12 hours before capillary inversion) and simulations. (E) Probabilities for a cell in a wobbling (W) or pivoting (P)state at time t to be found wobbling, pivoting, or off the surface (O) at a later time t + Dt (lines are for the kinetic model). (F) Schematic of weakly and strongly adheringcells: filled red circle, bound adhesive patch; empty circles, unbound adhesive patch.
S C I ENCE ADVANCES | R E S EARCH ART I C L E
Vissers et al., Sci. Adv. 2018;4 : eaao1170 27 April 2018 4 of 8
on August 14, 2018http://advances.sciencem
ag.org/D
ownloaded from
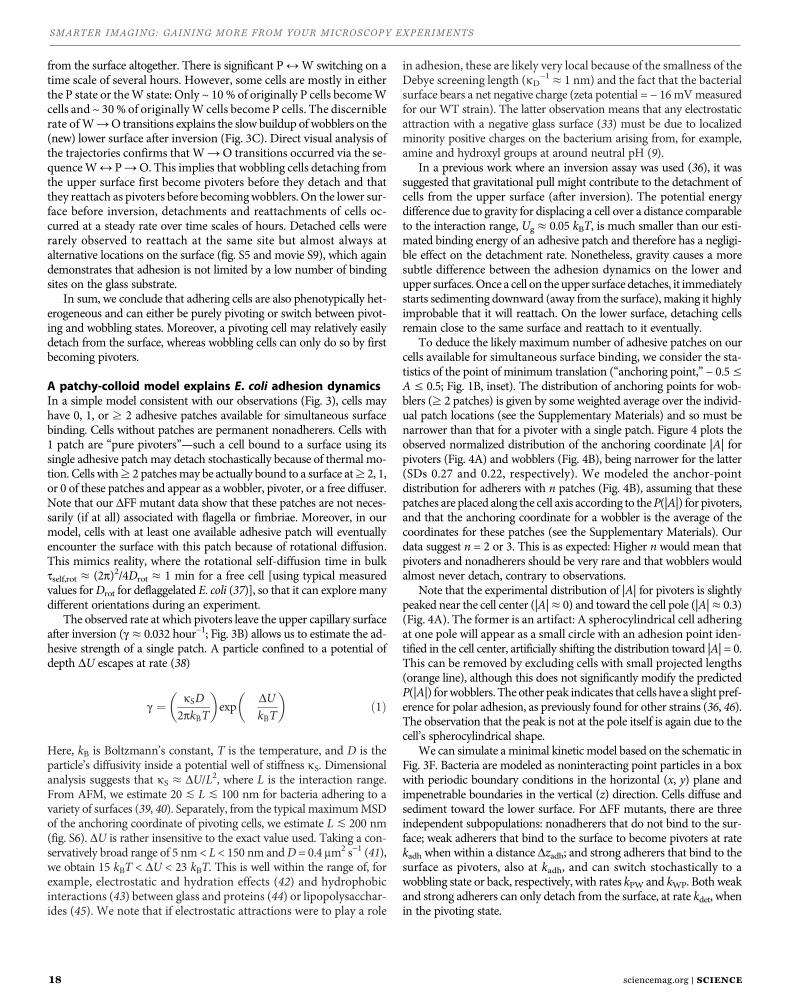
SMARTER IMAGING: GAINING MORE FROM YOUR MICROSCOPY EXPERIMENTS
18 sciencemag.org | SCIENCE
from the surface altogether. There is significant P↔W switching on atime scale of several hours. However, some cells are mostly in eitherthe P state or theW state: Only ~ 10 % of originally P cells becomeWcells and ~ 30% of originallyW cells become P cells. The discerniblerate ofW→O transitions explains the slow buildup of wobblers on the(new) lower surface after inversion (Fig. 3C). Direct visual analysis ofthe trajectories confirms that W→O transitions occurred via the se-quenceW↔ P→O. This implies that wobbling cells detaching fromthe upper surface first become pivoters before they detach and thatthey reattach as pivoters before becomingwobblers. On the lower sur-face before inversion, detachments and reattachments of cells oc-curred at a steady rate over time scales of hours. Detached cells wererarely observed to reattach at the same site but almost always atalternative locations on the surface (fig. S5 and movie S9), which againdemonstrates that adhesion is not limited by a low number of bindingsites on the glass substrate.
In sum, we conclude that adhering cells are also phenotypically het-erogeneous and can either be purely pivoting or switch between pivot-ing and wobbling states. Moreover, a pivoting cell may relatively easilydetach from the surface, whereas wobbling cells can only do so by firstbecoming pivoters.
A patchy-colloid model explains E. coli adhesion dynamicsIn a simple model consistent with our observations (Fig. 3), cells mayhave 0, 1, or ≥ 2 adhesive patches available for simultaneous surfacebinding. Cells without patches are permanent nonadherers. Cells with1 patch are “pure pivoters”—such a cell bound to a surface using itssingle adhesive patchmay detach stochastically because of thermal mo-tion. Cells with≥ 2 patchesmay be actually bound to a surface at≥ 2, 1,or 0 of these patches and appear as a wobbler, pivoter, or a free diffuser.Note that our DFF mutant data show that these patches are not neces-sarily (if at all) associated with flagella or fimbriae. Moreover, in ourmodel, cells with at least one available adhesive patch will eventuallyencounter the surface with this patch because of rotational diffusion.This mimics reality, where the rotational self-diffusion time in bulktself,rot ≈ (2p)2/4Drot ≈ 1 min for a free cell [using typical measuredvalues forDrot for deflaggelated E. coli (37)], so that it can explore manydifferent orientations during an experiment.
The observed rate at which pivoters leave the upper capillary surfaceafter inversion (g ≈ 0.032 hour−1; Fig. 3B) allows us to estimate the ad-hesive strength of a single patch. A particle confined to a potential ofdepth DU escapes at rate (38)
g ¼ kSD2pkBT
� �exp � DU
kBT
� �ð1Þ
Here, kB is Boltzmann’s constant, T is the temperature, and D is theparticle’s diffusivity inside a potential well of stiffness kS. Dimensionalanalysis suggests that kS ≈ DU/L2, where L is the interaction range.From AFM, we estimate 20 ≲ L ≲ 100 nm for bacteria adhering to avariety of surfaces (39, 40). Separately, from the typical maximumMSDof the anchoring coordinate of pivoting cells, we estimate L ≲ 200 nm(fig. S6). DU is rather insensitive to the exact value used. Taking a con-servatively broad range of 5 nm < L < 150 nm andD = 0.4 mm2 s−1 (41),we obtain 15 kBT < DU < 23 kBT. This is well within the range of, forexample, electrostatic and hydration effects (42) and hydrophobicinteractions (43) between glass and proteins (44) or lipopolysacchar-ides (45). We note that if electrostatic attractions were to play a role
in adhesion, these are likely very local because of the smallness of theDebye screening length (kD
−1≈ 1 nm) and the fact that the bacterialsurface bears a net negative charge (zeta potential = − 16mVmeasuredfor our WT strain). The latter observation means that any electrostaticattraction with a negative glass surface (33) must be due to localizedminority positive charges on the bacterium arising from, for example,amine and hydroxyl groups at around neutral pH (9).
In a previous work where an inversion assay was used (36), it wassuggested that gravitational pull might contribute to the detachment ofcells from the upper surface (after inversion). The potential energydifference due to gravity for displacing a cell over a distance comparableto the interaction range, Ug ≈ 0.05 kBT, is much smaller than our esti-mated binding energy of an adhesive patch and therefore has a negligi-ble effect on the detachment rate. Nonetheless, gravity causes a moresubtle difference between the adhesion dynamics on the lower andupper surfaces.Once a cell on the upper surface detaches, it immediatelystarts sedimenting downward (away from the surface), making it highlyimprobable that it will reattach. On the lower surface, detaching cellsremain close to the same surface and reattach to it eventually.
To deduce the likely maximum number of adhesive patches on ourcells available for simultaneous surface binding, we consider the sta-tistics of the point of minimum translation (“anchoring point,” − 0.5≤A ≤ 0.5; Fig. 1B, inset). The distribution of anchoring points for wob-blers (≥ 2 patches) is given by some weighted average over the individ-ual patch locations (see the Supplementary Materials) and so must benarrower than that for a pivoter with a single patch. Figure 4 plots theobserved normalized distribution of the anchoring coordinate |A| forpivoters (Fig. 4A) and wobblers (Fig. 4B), being narrower for the latter(SDs 0.27 and 0.22, respectively). We modeled the anchor-pointdistribution for adherers with n patches (Fig. 4B), assuming that thesepatches are placed along the cell axis according to theP(|A|) for pivoters,and that the anchoring coordinate for a wobbler is the average of thecoordinates for these patches (see the Supplementary Materials). Ourdata suggest n = 2 or 3. This is as expected: Higher n would mean thatpivoters and nonadherers should be very rare and that wobblers wouldalmost never detach, contrary to observations.
Note that the experimental distribution of |A| for pivoters is slightlypeaked near the cell center (|A|≈ 0) and toward the cell pole (|A|≈ 0.3)(Fig. 4A). The former is an artifact: A spherocylindrical cell adheringat one pole will appear as a small circle with an adhesion point iden-tified in the cell center, artificially shifting the distribution toward |A| = 0.This can be removed by excluding cells with small projected lengths(orange line), although this does not significantly modify the predictedP(|A|) forwobblers. The other peak indicates that cells have a slight pref-erence for polar adhesion, as previously found for other strains (36, 46).The observation that the peak is not at the pole itself is again due to thecell’s spherocylindrical shape.
We can simulate aminimal kinetic model based on the schematic inFig. 3F. Bacteria are modeled as noninteracting point particles in a boxwith periodic boundary conditions in the horizontal (x, y) plane andimpenetrable boundaries in the vertical (z) direction. Cells diffuse andsediment toward the lower surface. For DFF mutants, there are threeindependent subpopulations: nonadherers that do not bind to the sur-face; weak adherers that bind to the surface to become pivoters at ratekadh when within a distance Dzadh; and strong adherers that bind to thesurface as pivoters, also at kadh, and can switch stochastically to awobbling state or back, respectively, with rates kPW and kWP. Both weakand strong adherers can only detach from the surface, at rate kdet, whenin the pivoting state.
SC I ENCE ADVANCES | R E S EARCH ART I C L E
Vissers et al., Sci. Adv. 2018;4 : eaao1170 27 April 2018 5 of 8
on August 14, 2018http://advances.sciencem
ag.org/D
ownloaded from

RESEARCH ARTICLES
19SCIENCE | sciencemag.org
The model uses values of the diffusivity and sedimentation speedbased on independent measurements, and Dzadh = 100 nm, in line withthe typical interaction range. Fitting the on-surface switching dynamics(Fig. 3E) gives estimates for kPW, kWP, and the ratio of weak to strongadherers. Varying the remaining parameters, kadh, kdet, and the totalnumbers of adherers and nonadherers credibly reproduces the mainfeatures of all our observations (curves in relevant parts of Figs. 2and 3).Wemodel theWT cells in the same way, except that a fractionof cells can swim and a subfraction of those can adhere as active ro-tators. The cell numbers are fitted, but the swimming speed ismeasuredindependently. Full model details are given in the SupplementaryMaterials, including used cell numbers (table S1) and movies depictingthe simulations (movies S10 and S11).
DISCUSSIONWe investigated the adhesion of E. coli AB1157 in buffer solution toglass. Using high-throughput and big-data analysis methods, we foundstrong heterogeneities between individual cells within a clonal popula-tion that are not related to type 1 fimbriae or flagella. These heteroge-neities appear in the propensity for adhesion as well as the postadhesiondynamics. At least two types of adherers exist. Freely pivoted weak ad-herers are rotationally unconstrained anddetach relatively easily. Strongadherers switch between this pivoting state and a rotationally con-strained wobbling motion, in which they are more firmly bound tothe surface.
A model of cells with adhesive patches that bind and unbind sto-chastically to the surfaces can explain our results. In this model, whatdifferentiates subpopulations is the number of accessible patches percell. Nonadhering cells have no patches and are always freely diffusing,weak adherers have one patch, and strong adherers have multiple ad-hesive patches that can bind simultaneously. These patches are esti-mated to have an interaction range of ≲ 100 nm and contact energyof 15 to 23 kBT. A very recent directmeasurement of twoGram-positivespecies of Staphylococcus bacteria (47) shows that their adhesion tosurfaces is mediated by sticky patches of radii ~ 100 to 300 nm, fromwhich an interaction range of 20 ≲ L ≲ 120 nm is obtained. Thus,the physical mechanisms we have deduced from our experimentsfor E. coli may well be generic, even where specific details vary, forexample, the interaction strengths measured in (47) are much larger,at >103 kBT.
However, the properties of the bacterial surface depend on manyvariables. Thus, for example, the acid-base properties of the surfacesof E. coliK-12 and Bacillus brevis cells are dependent on species, growthphase, as well as the composition of the growthmedia (48). These prop-erties also change upon adhesion (9). When initial adhesion leads tothe formation of a full-blown biofilm, different adhesive proteins areinvolved in binding cells to the substrate or to each other (10, 49). Bothpopulation variations in adhesion strength (50) and the location onthe cell surface of adhesive interactions (51) are of importance. Thestudy of a variety of organisms under diverse conditions will thereforebe needed to establish a full picture.
Our work raises important questions about the biomolecular detailsof adhesion, most obviously the nature of the adhesive patches. Theirrotational freedom implicates membrane proteins, which can rotatefreely in lipid bilayers (52), whereas the interaction range of L ~ 100 nmsuggests the involvement of cell surface macromolecules, consistentwith a recent suggestion based on more direct, AFM measurements(47). Such rotational freedom raises the further question of the pos-sible translational freedom of these patches, because individual pro-teins can also translate diffusively in the bacterial outer membrane (53).Both motions are strongly dependent on temperature because of lipidicphase transitions. If future work finds these adhesive patches to havetemperature-dependent mobility, then bacteria will constitute a newclass of patchy colloids. The interaction ofmobile adhesive patches withrough (54) and patchy (19) substrates offers intriguing possibilities.
Another key question is the origin of the phenotypic heterogeneitywe observed. Thismay be an instance of phase variation—the reversibleswitching on and off of gene expression (55), often of surface structures(56). On the other hand, adhesion may trigger a process of diversifica-tion in gene expression analogous to the process discovered recentlyin biofilm formation (57). Elucidating these issues using modern toolsfor time-dependent gene and protein expression assays is now an ur-gent task.
Finally, our work has implications for the design of antiadhesionsurfaces, which is a key part of the ongoing fight against bacterial infec-tions. First, it appears that we must now think in terms of designingantiadhesion surfaces that account for the range of adhesive pheno-types. Second, designing antiadhesion technologies will involve com-puter simulations, which, however, will never be fine-grained enough toinclude all details. Our finding that bacteria are patchy colloids vis-à-vissurface adhesion canhelp to design viable coarse-graining strategies and
A B
Fig. 4. Distributions of anchoring coordinates for DFF. (A) The measured distribution of anchoring coordinates |A| for all pivoting cells (olive, 11,359 cells), only pivotingcells with lP > 2.2 mm (orange, 4338 cells) and for modeled cells with one contact point (black line). (B) The measured distribution of wobbling cells (blue, 4099 cells) fits bestwith models of cells with two or three patches. Modeled distribution of cells with 10 patches is also shown and peaks sharply close to zero. Modeled wobbler distributionswere calculated using the P(|A|) for pivoters with artifacts removed.
S C I ENCE ADVANCES | R E S EARCH ART I C L E
Vissers et al., Sci. Adv. 2018;4 : eaao1170 27 April 2018 6 of 8
on August 14, 2018http://advances.sciencem
ag.org/D
ownloaded from

SMARTER IMAGING: GAINING MORE FROM YOUR MICROSCOPY EXPERIMENTS
20 sciencemag.org | SCIENCE
provide the necessary parameters for the computational study of thisimportant phenomenon.
MATERIALS AND METHODSBacterial suspensionsAll bacterial cells (E. coliAB1157WT and variousmutants; see the Sup-plementary Materials) were initially grown on LB agar plates, theninoculated and transferred to 10 ml of liquid LB, and incubated for16 hours at 30°C. A fresh culture was inoculated as 1:100 dilution ofovernight grown cells in 35ml of tryptone broth and grown for 4 hours(to late exponential phase). Cells were washed three times with MB[6.2 mMK2HPO4 (Sigma-Aldrich), 3.8mMKH2PO4 (Fisher Chemical),67 mM NaCl (Fisher Chemical), and 0.1 mM EDTA (Sigma-Aldrich)]by careful filtration and were resuspended inMB at an optical densityof≈ 0.03 (WT) and≈ 0.01 (DFF) at 600 nm, corresponding to≈ 4.5 ×10⁷ (WT) and≈ 1.5 × 10⁷ (DFF) cells/ml (23). Just before starting theadhesion assays, glucose solution in MB was added to the dispersion(dispersion contains 0.72 mM glucose after addition). We measuredthe electrophoreticmobility of the bacteria mE using aMalvern ZetasizerNano Z.
Adhesion assaysCell suspensionswere loaded into borosilicate glass capillaries (Vitrocom,0.4 × 8.0 × 50 mm) subsequently sealed with Vaseline. We recordedmovies (1040 × 1024 pixels, 30 frames/s) focused on lower or upper cap-illary surfaces using a Mikrotron MC1362 camera on an inverted NikonTi-Umicroscope with a 60× phase-contrast objective (Nikon Plan Fluor,Ph2; numerical aperture, 0.7). Custom LabVIEW software controls thecamera, a motorized stage (H117P21N4 with ProScan III, Prior Scien-tific), and a piezo objective actuator (P-725.4CD with E-753, PhysikInstrumente) to automatically record movies at multiple locations onthe inner capillary surface in time (23).
AnalysisFor eachmovie, we filtered out background signals and noise, after whichwe determined the positions, orientations, and projected lengths of bac-terial cells using an adapted algorithm specifically developed for rod-shaped colloids (24) and tracked bacteria in successive frames to obtaincontinuous trajectories. The suspension was so dilute that cells rarely col-lided, but those sections of trajectories crossing closer than 2.5 mm wereomitted from the analysis. Other remaining misidentifications (for ex-ample, two neighboring cells recognized as one) were rare and did notaffect the results significantly. Trajectories shorter than 0.8 s were notconsidered for classification. Trajectories displaying an adhering signa-ture kT < 0.6 but shorter than 6 s were considered ambiguous.
SUPPLEMENTARY MATERIALSSupplementary material for this article is available at http://advances.sciencemag.org/cgi/content/full/4/4/eaao1170/DC1section S1. Characterizationsection S2. Synthesis and experimental details of bacterium-shaped hollow silica particlessection S3. Determining the anchoring point of a cell and classifying its dynamicssection S4. Adhesion for mutants without the flagellar hooksection S5. Pivoters, wobblers, and deserted adhesion sitessection S6. MSDs of anchoring point for wobblers and pivoterssection S7. Kinetic model detailsfig. S1. Electron microscopy images of E. coli WT and DFF and bacterium-shaped hollow silicaparticles.fig. S2. AFM images of the inner surface of the glass capillaries.fig. S3. MSDs and anchoring points on the length axis of different types of bacteria.
fig. S4. Distributions of rotational exponents kR for mutants lacking essential hook proteins.fig. S5. Pivoters, wobblers, and deserted binding sites for E. coli WT and DFF.fig. S6. MSDs versus t for pivoters and wobblers.table S1. The cell numbers used for simulating the dynamics of bacterial adhesion.movie S1. Determining positions and orientations of bacteria within the field of view.movie S2. Lower surface before inversion for WT, categorized cells.movie S3. Fifteen examples of trajectories for WT cells identified as diffusing.movie S4. Fifteen examples of trajectories for WT cells identified as swimming.movie S5. Fifteen examples of trajectories for WT cells identified as adhering and wobbling.movie S6. Fifteen examples of trajectories for WT cells identified as adhering and pivoting.movie S7. Fifteen examples of trajectories for WT cells identified as adhering and activelyrotating.movie S8. Examples of adhering cells with stained flagella (AD14) that are actively rotating.movie S9. Illustration of deserted binding sites on the surface in time for DFF.movie S10. Computer simulations of the inversion experiment for E. coli WT using a simplekinetic model.movie S11. Computer simulations of the inversion experiment for DFF using a simple kineticmodel.References (58–60)
REFERENCES AND NOTES1. O. E. Petrova, K. Sauer, Sticky situations: Key components that control bacterial surface
attachment. J. Bacteriol. 194, 2413–2425 (2012).2. W. M. Dunne Jr., Bacterial adhesion: Seen any good biofilms lately?. Clin. Microbiol. Rev.
15, 155–166 (2002).3. J. Chan, S. Wong, Biofouling: Types, Impact, and Anti-Fouling (Nova Science Publishers,
2010).4. J. W. Costerton, P. S. Stewart, E. P. Greenberg, Bacterial biofilms: A common cause of
persistent infections. Science 284, 1318–1322 (1999).5. P. S. Stewart, J. W. Costerton, Antibiotic resistance of bacteria in biofilms. Lancet 358,
135–138 (2001).6. D. Linke, A. Goldman, Bacterial Adhesion: Chemistry, Biology and Physics (Springer, 2011).7. A. T. Poortinga, R. Bos, W. Norde, H. J. Busscher, Electric double layer interactions in
bacterial adhesion to surfaces. Surf. Sci. Rep. 47, 1–32 (2002).8. H. H. Tuson, D. B. Weibel, Bacteria–surface interactions. Soft Matter 9, 4368–4380 (2013).9. Y. Hong, D. G. Brown, Alteration of bacterial surface electrostatic potential and pH
upon adhesion to a solid surface and impacts to cellular bioenergetics. Biotechnol.Bioeng. 105, 965–972 (2010).
10. C. Beloin, A. Houry, M. Froment, J.-M. Ghigo, N. Henry, A short–time scale colloidal systemreveals early bacterial adhesion dynamics. PLOS Biol. 6, e167 (2008).
11. M. Katsikogianni, Y. F. Missirlis, Concise review of mechanisms of bacterial adhesionto biomaterials and of techniques used in estimating bacteria-material interactions.Eur. Cell. Mater. 8, 37–57 (2004).
12. M. B. Elowitz, A. J. Levine, E. D. Siggia, P. S. Swain, Stochastic gene expression in a singlecell. Science 297, 1183–1186 (2002).
13. M. Ackermann, A functional perspective on phenotypic heterogeneity in microorganisms.Nat. Rev. Microbiol. 13, 497–508 (2015).
14. J. van Gestel, M. A. Nowak, Phenotypic heterogeneity and the evolution of bacterial lifecycles. PLOS Comput. Biol. 12, e1004764 (2016).
15. T. Philippi, J. Seger, Hedging one’s evolutionary bets, revisited. Trends Ecol. Evol. 4, 41–44(1989).
16. E. Bianchi, R. Blaak, C. N. Likos, Patchy colloids: State of the art and perspectives.Phys. Chem. Chem. Phys. 13, 6397–6410 (2011).
17. G. R. Yi, D. J. Pine, S. Sacanna, Recent progress on patchy colloids and their self-assembly.J. Phys. Condens. Matter 25, 193101 (2013).
18. C. N. Likos, F. Sciortino, E. Zaccarelli, Soft Matter Self-Assembly (IOS Press, 2016), vol. 193.19. S. Gon, K.-N. Kumar, K. Nüsslein, M. M. Santore, How bacteria adhere to brushy PEG
surfaces: Clinging to flaws and compressing the brush. Macromolecules 45, 8373–8381(2012).
20. B. J. Bachmann, Derivations and genotypes of some mutant derivatives of Escherichiacoli K-12, in Escherichia coli and Salmonella, F. C. Neidhardt, Ed. (ASM Press, ed. 2, 1996),pp. 2460–2488.
21. D. F. Browning, T. J. Wells, F. L. S. França, F. C. Morris, Y. R. Sevastsyanovich, J. A. Bryant,M. D. Johnson, P. A. Lund, A. F. Cunningham, J. L. Hobman, R. C. May, M. A. Webber,I. R. Henderson, Laboratory adapted Escherichia coli K-12 becomes a pathogen ofCaenorhabditis elegans upon restoration of O antigen biosynthesis. Mol. Microbiol. 87,939–950 (2013).
22. P. Prehm, G. Schmidt, B. Jann, K. Jann, The cell-wall lipopolysaccharide of Escherichia coliK-12. Structure and acceptor site for O-antigen and other substituents. Eur. J. Biochem.70, 171–177 (1976).
S C I ENCE ADVANCES | R E S EARCH ART I C L E
Vissers et al., Sci. Adv. 2018;4 : eaao1170 27 April 2018 7 of 8
on August 14, 2018http://advances.sciencem
ag.org/D
ownloaded from
9. Y. Hong, D. G. Brown, Biotechnol. Bioeng. 105, 965–972 (2010).10. C. Beloin, A. Houry, M. Froment, J.-M. Ghigo, N. Henry, PLOS Biol. 6, e167 (2008).11. M. Katsikogianni, Y. F. Missirlis, Eur. Cell. Mater. 8, 37–57 (2004).12. M. B. Elowitz, A. J. Levine, E. D. Siggia, P. S. Swain, Science 297, 1183–1186 (2002).13. M. Ackermann, Nat. Rev. Microbiol. 13, 497–508 (2015).14. J. van Gestel, M. A. Nowak, PLOS Comput. Biol. 12, e1004764 (2016).15. T. Philippi, J. Seger, Trends Ecol. Evol. 4, 41–44 (1989).16. E. Bianchi, R. Blaak, C. N. Likos, Phys. Chem. Chem. Phys. 13, 6397–6410 (2011).17. G. R. Yi, D. J. Pine, S. Sacanna, J. Phys. Condens. Matter 25, 193101 (2013).18. C. N. Likos, F. Sciortino, E. Zaccarelli, Soft Matter Self-Assembly (IOS Press, 2016), vol. 193.19. S. Gon, K.-N. Kumar, K. Nüsslein, M. M. Santore, Macromolecules 45, 8373–8381 (2012).20. B. J. Bachmann, Derivations and genotypes of some mutant derivatives of Escherichia coli K-12, in Escherichia coli and Salmonella, F. C. Neidhardt, Ed. (ASM Press, ed. 2, 1996), pp. 2460–2488.21. D. F. Browning et al., Mol. Microbiol. 87, 939–950 (2013).22. P. Prehm, G. Schmidt, B. Jann, K. Jann, Eur. J. Biochem. 70, 171–177 (1976).23. J. Schwarz-Linek et al., Colloids Surf. B Biointerfaces 137, 2–16 (2016).24. T. H. Besseling et al., J. Phys. Condens. Matter 27, 194109 (2015).25. H. Qian, M. P. Sheetz, E. L. Elson, Biophys. J. 60, 910–921 (1991).26. M. J. Saxton, K. Jacobson, Annu. Rev. Biophys. Biomol. Struct. 26, 373–399 (1997).27. M. Silverman, M. Simon, Nature 249, 73–74 (1974).28. A. T. Brown et al., Soft Matter 12, 131–140 (2016).29. R. S. Friedlander, N. Vogel, J. Aizenberg, Langmuir 31, 6137–6144 (2015).30. J. Haiko, B. Westerlund-Wikström, Biology 2, 1242–1267 (2013).31. M. A.-S. Vigeant, R. M. Ford, M. Wagner, L. K. Tamm, Appl. Environ. Microbiol. 68, 2794–2801 (2002).32. M. Hermansson, Colloids Surf. B Biointerfaces 14, 105–119 (1999).33. H. H. M. Rijnaarts, W. Norde, J. Lyklema, A. J. B. Zehnder, Colloids Surf. B Biointerfaces 14, 179–195 (1999).34. T. Nomura, Y. Morimoto, M. Ishikawa, H. Tokumoto, Y. Konishi, Adv. Powder Technol. 21, 8–12 (2010).35. I. D. Vladescu et al., Phys. Rev. Lett. 113, 268101 (2014).36. K. Agladze, X. Wang, T. Romeo, J. Bacteriol. 187, 8237–8246 (2005).37. S. Tavaddod, M. A. Charsooghi, F. Abdi, H. R. Khalesifard, R. Golestanian, Eur. Phys. J. E Soft. Matter 34, 16 (2011).38. P. Hänggi, P. Talkner, M. Borkovec, Rev. Mod. Phys. 62, 251–341 (1990).39. A. Razatos, Y.-L. Ong, M. M. Sharma, G. Georgiou, Proc. Natl. Acad. Sci. U.S.A. 95, 11059–11064 (1998).40. Y. F. Dufrêne, Trends Microbiol. 23, 376–382 (2015).41. A. Jepson, V. A. Martinez, J. Schwarz-Linek, A. Morozov, W. C. K. Poon, Phys. Rev. E 88, 041002 (2013).42. W. Trewby, D. Livesey, K. Voïtchovsky, Soft Matter 12, 2642–2651 (2016).43. D. Chandler, Nature 437, 640–647 (2005).44. M. C. M. van Loosdrecht, W. Norde, J. Lyklema, A. J. B. Zehnder, Aquat. Sci. 52, 103–114 (1990).45. N. A. Amro et al., Langmuir 16, 2789–2796 (2000).46. J. F. Jones, D. Velegol, Colloids Surf. B Biointerfaces 50, 66–71 (2006).47. C. Spengler, N. Thewes, P. Jung, M. Bischoff, K. Jacobs, Nanoscale 9, 10084–10093 (2017).48. Y. Hong, D. G. Brown, Colloids Surf. B Biointerfaces 50, 112–119 (2006).49. V. Berk et al., Science 337, 236–239 (2012).50. J. Schluter, C. D. Nadell, B. L. Bassler, K. R. Foster, ISME J. 9, 139–149 (2015).51. M.-C. Duvernoy et al., bioRxiv 2017, 104679 (2017).52. C. Aisenbrey, J. Am. Chem. Soc. 126, 16676–16683 (2004).53. A. Nenninger et al., Mol. Microbiol. 92, 1142–1153 (2014).54. S. Sharma, Y. A. Jaimes-Lizcano, R. B. McLay, P. C. Cirino, J. C. Conrad, Langmuir 32, 5422–5433 (2016).55. M. W. van der Woude, Curr. Opin. Microbiol. 14, 205–211 (2011).56. R. Jayaraman, Curr. Sci. 100, 1163–1171 (2011).57. O. Besharova, V. M. Suchanek, R. Hartmann, K. Drescher, V. Sourjik, Front. Microbiol. 7, 1568 (2016).58. S. K. DeWitt, E. A. Adelberg, Genetics 47, 577–585 (1962).
REFERENCES AND NOTES1. O. E. Petrova, K. Sauer, J. Bacteriol. 194, 2413–2425 (2012).2. W. M. Dunne Jr., Clin. Microbiol. Rev. 15, 155–166 (2002).3. J. Chan, S. Wong, Biofouling: Types, Impact, and Anti-Fouling (Nova Science Publishers, 2010).4. J. W. Costerton, P. S. Stewart, E. P. Greenberg, Science 284, 1318–1322 (1999).5. P. S. Stewart, J. W. Costerton, Lancet 358, 135–138 (2001).6. D. Linke, A. Goldman, Bacterial Adhesion: Chemistry, Biology and Physics (Springer, 2011).7. A. T. Poortinga, R. Bos, W. Norde, H. J. Busscher, Surf. Sci. Rep. 47, 1–32 (2002).8. H. H. Tuson, D. B. Weibel, Soft Matter 9, 4368–4380 (2013).

RESEARCH ARTICLES
21SCIENCE | sciencemag.org
59. M. S. Guyer, R. R. Reed, J. A. Steitz, K. B. Low, Identification of a sex-factor-affinity site in E. coli as gd, in Cold Spring Harbor Symposia on Quantitative Biology (Cold Spring Harbor Laboratory Press, 1981), vol. 45, pp. 135–140.60. T. Baba et al., Mol. Syst. Biol. 2, 2006.0008 (2006).
Acknowledgments: We thank A. Jepson, A. Morozov, J. Thijssen, M. Cates, R. di Leonardo, F. Sciortino, A. Lips, T. Pilizota, A. Lepore, and H. Berg for useful discussions. Funding: T.V. was funded by FP7-PEOPLE-2013-IEF Marie Curie fellowships (LivPaC, 623364) and N.K. through H2020-MSCA-IF-2014 (ActiDoC, 654688). J.M.F. held an Engineering and Physical Sciences Research Council (EPSRC) studentship (EP/L015536/1 SOFI CDT), and A.T.B. received funding from a University of Edinburgh Chancellor’s Fellowship. Others were funded by EPSRC program grant EP/J007404/1 and European Research Council Advanced Grant GA 340877-PHYSAPS. We acknowledge the support of the Wellcome Trust Multi-user Equipment Grant (WT104915MA) for recording the transmission electron microscopy (TEM) images. Author contributions: T.V. and W.C.K.P. designed the research. A.D. constructed the mutants. A.D. and J.S.-L. prepared the bacteria. A.B.S. prepared the silica-coated bacteria and performed the scanning electron microscopy measurements. T.V. performed the adhesion experiments. V.A.M. assisted in the preliminary experiments, microscopy setup, and measurement protocols. J.M.F. and V.K. performed the AFM measurements. J.M.F. and T.V. performed TEM measurements. T.V., A.T.B., N.K., M.H., and W.C.K.P. analyzed the data. A.T.B. and T.V. performed the modeling. V.A.M., J.A., and N.K. assisted with the experiments. T.V., A.T.B., and W.C.K.P. wrote the paper. All authors discussed the results and commented on the manuscript. Competing interests: The authors declare that they have no competing interests. Data and materials availability: Data used in this publication are available on the Edinburgh DataShare repository (DOI: http://dx.doi.org/10.7488/ds/2315). All other data needed to evaluate the conclusions in the paper are present in the paper and/or the
Supplementary Materials. Additional data related to this paper may be requested from the authors.
Submitted 29 June 2017Accepted 7 March 2018Published 27 April 201810.1126/sciadv.aao1170
Citation: T. Vissers, A. T. Brown, N. Koumakis, A. Dawson, M. Hermes, J. Schwarz-Linek, A. B. Schofield, J. M. French, V. Koutsos, J. Arlt, V. A. Martinez, W. C. K. Poon, Bacteria as living patchy colloids: Phenotypic heterogeneity in surface adhesion. Sci. Adv. 4, eaao1170 (2018).
SUPPLEMENTARY MATERIALSSupplementary material for this article is available at http://advances.sciencemag.org/cgi/ content/full/4/4/eaao1170/DC1section S1. Characterizationsection S2. Synthesis and experimental details of bacterium-shaped hollow silica particlessection S3. Determining the anchoring point of a cell and classifying its dynamicssection S4. Adhesion for mutants without the flagellar hooksection S5. Pivoters, wobblers, and deserted adhesion sitessection S6. MSDs of anchoring point for wobblers and pivoterssection S7. Kinetic model detailsfig. S1. Electron microscopy images of E. coli WT and DFF and bacterium-shaped hollow silica particles.fig. S2. AFM images of the inner surface of the glass capillaries.fig. S3. MSDs and anchoring points on the length axis of different types of bacteria.
SMARTER IMAGING: GAINING MORE FROM YOUR MICROSCOPY EXPERIMENTS
22 sciencemag.org | SCIENCEOriginally published 13 July 2018 in SCIENCE
SYNTHETIC BIOLOGY
Programming self-organizingmulticellular structures withsynthetic cell-cell signalingSatoshi Toda1, Lucas R. Blauch2, Sindy K. Y. Tang2,
Leonardo Morsut1*†, Wendell A. Lim1†
A common theme in the self-organization of multicellular tissues is the use of cell-cell
signaling networks to induce morphological changes. We used the modular synNotch
juxtacrine signaling platform to engineer artificial genetic programs in which specific
cell-cell contacts induced changes in cadherin cell adhesion. Despite their simplicity, these
minimal intercellular programs were sufficient to yield assemblies with hallmarks of
natural developmental systems: robust self-organization into multidomain structures,
well-choreographed sequential assembly, cell type divergence, symmetry breaking, and the
capacity for regeneration upon injury. The ability of these networks to drive complex
structure formation illustrates the power of interlinking cell signaling with cell sorting:
Signal-induced spatial reorganization alters the local signals received by each cell,
resulting in iterative cycles of cell fate branching. These results provide insights into
the evolution of multicellularity and demonstrate the potential to engineer customized
self-organizing tissues or materials.
During the development of multicellular
organisms, tissues self-organize into the
complex architectures essential for proper
function. Even with minimal external in-
structions, cells proliferate, diverge into
distinct cell types, and spatially self-organize
into complex structures and patterns. Such self-
organized structures are radically different from
most human-made structures, because they are
not assembled from preexisting parts that are
physically linked according to a defined Carte-
sian blueprint. Rather, these structures emerge
through a series of genetically programmed se-
quential events. To test and better develop our
understanding of the principles governing mul-
ticellular self-organization, it would be power-
ful to design synthetic genetic programs that
could direct the formation of custommulticellu-
lar structures (1–7).
Extensive studies of natural developmental
programs have implicated many genes that
control cell-cell signaling and cell morphology.
Despite their molecular diversity, a common
theme in these developmental systems is the
use of cell-cell signaling interactions to condi-
tionally induce morphological responses (8, 9).
Thus, we explored whether simple synthetic
circuits in which morphological changes are
driven by cell-cell signaling interactions could
suffice to generate self-organizing multicellular
structures.
A simple toolkit for engineering
morphological programs
As a modular platform for engineering new, or-
thogonal cell-cell signaling networks, we focused
on using the synthetic notch (synNotch) receptor
system (Fig. 1A). SynNotch receptors contain the
core regulatory domain of the juxtacrine signal-
ing receptor Notch, linked to a chimeric extra-
cellular recognition domain (e.g., single-chain
antibody) and a chimeric intracellular transcrip-
tional domain (10). When it recognizes its cog-
nate ligand on a neighboring cell, the synNotch
receptor undergoes cleavage of the transmem-
brane region, releasing the intracellular tran-
scriptional domain to enter the nucleus and drive
the expression of user-specified target genes.
Thus, we can design synthetic cell-cell com-
munication programs using synNotch circuits.
SynNotch receptor-ligand pairs do not cross-talk
with native signaling pathways such as Notch-
Delta, or with one another, as long as they have
different recognition and transcriptional do-
mains. Here, we used two synNotch receptor-
ligand pairs—an anti-CD19 single-chain antibody
(scFv) receptor paired with CD19 ligand, and an
anti–green fluorescent protein (GFP) nanobody
receptor paired with surface GFP ligand—as or-
thogonal cell-cell communication channels.
We created potential developmental programs
by linking synNotch signaling to two possible
transcriptional outputs: (i) expression of specific
cadherinmolecules (E-, N-, andP-cadherins), which
lead to homotypic cell-cell adhesion and differ-
ential sorting of cells expressing different classes
of adhesionmolecules (11–13); and (ii) expression
of new synNotch ligands (Fig. 1A).Morphological
sorting driven by cadherin expression can change
what cells are next to each other, thus altering
what synNotch signals will or will not be trans-
mitted. Similarly, expression of new synNotch
ligands can also create a subsequent stage of new
cell-cell signals. Consequently, both of these out-
puts can propagate regulatory cascades by gen-
erating new signaling interactions between cells
in the collective assembly.
We also constructed the synNotch circuits so
that they drive expression of different fluorescent
proteins, allowing color to indicate “differentia-
tion” into new cell types (Fig. 1B). We expressed
these synNotch circuits inmouse L929 fibroblasts,
placed the cells in a low-adhesion U-bottom well
(14), and followed their organization over time by
fluorescence microscopy. L929 cells do not self-
organize; normally, they only form a loose and
randomly organized multicellular aggregate. We
then tested whether any of the synthetic circuits
we constructed from this small set of components
could drive higher-order self-organization.
Engineering interacting cells that
self-organize into a two-layer structure
We first focused on engineering two cell types
that, when mixed, might communicate with and
activate one another to induce the formation of a
self-organized structure.We engineered a sender
cell that expresses the synNotch ligand CD19 and
blue fluorescent protein (BFP) (cell A) and a re-
ceiver cell that expresses the cognate anti-CD19
synNotch receptor and its response element
(cell B). To induce cell sorting as an output of
synNotch signaling, we placed the E-cadherin
(Ecad) and GFP genes under the control of the
synNotch-responsive promoter in the receiver
cells (cell B in Fig. 2A). The circuit is represented
by the following scheme:
[cell A: CD19] → [cell B: aCD19 synNotch
→ Ecadhi+ GFP]
As predicted, when cocultured with A-type
sender cells, B-type receiver cells were acti-
vated to express Ecad and GFP (C-type cell
phenotype). Subsequently, the green (GFP)
C-type cells self-sorted to form a tight inner
core, resulting in a well-defined two-layer struc-
ture (Fig. 2, B and C). Without induction of
Ecad, the A- and B-type cells remained well-
mixed (fig. S1A). When the synNotch signaling
was inhibited by the g-secretase inhibitor (2S)-
N-[(3,5-difluorophenyl)acetyl]-L-alanyl-2-
phenylglycine 1,1-dimethylethyl ester (DAPT),
which blocks synNotch cleavage and signaling,
sorting into two layers did not occur, as the in-
hibitor blocked the Ecad induction response in
B-type cells (fig. S1B).
Using a bidirectional signaling cascade
to engineer a self-organizing
three-layer structure
To createmore a complex structure, we added an
additional layer of reciprocal cell-cell signaling to
the above two-layer circuit (Fig. 2D).Weengineered
156 13 JULY 2018 • VOL 361 ISSUE 6398 sciencemag.org SCIENCE
1Department of Cellular and Molecular Pharmacology,Howard Hughes Medical Institute, and Center forSystems and Synthetic Biology, University of California,San Francisco, CA 94158, USA. 2Department ofMechanical Engineering, Stanford University, Stanford,CA 94305, USA.*Present address: Eli and Edythe Broad CIRM Center forRegenerative Medicine and Stem Cell Research, University ofSouthern California, Los Angeles, CA 90033, USA.†Corresponding author. Email: [email protected] (L.M.);
[email protected] (W.A.L.)
RESEARCH | RESEARCH ARTICLES
B IOPHYS IC S Copyright © 2018
The Authors, some
rights reserved;
exclusive licensee
American Association
for the Advancement
of Science. No claim to
originalU.S. Government
Works. Distributed
under a Creative
Commons Attribution
NonCommercial
License 4.0 (CC BY-NC).
Bacteria as living patchy colloids:Phenotypic heterogeneity in surface adhesionTeun Vissers,1* Aidan T. Brown,1 Nick Koumakis,1 Angela Dawson,1 Michiel Hermes,1,2
Jana Schwarz-Linek,1 Andrew B. Schofield,1 Joseph M. French,1,3 Vasileios Koutsos,3 Jochen Arlt,1
Vincent A. Martinez,1 Wilson C. K. Poon1
Understanding and controlling the surface adhesion of pathogenic bacteria is of urgent biomedical importance. How-ever,many aspects of this process remain unclear (for example, microscopic details of the initial adhesion and possiblevariations between individual cells). Using a new high-throughput method, we identify and follow many single cellswithin a clonal population of Escherichia colinear a glass surface.We find strongphenotypic heterogeneities: A fractionof the cells remain in the free (planktonic) state, whereas others adhere with an adhesion strength that itself exhibitsphenotypic heterogeneity. We explain our observations using a patchy colloid model; cells bind with localized, adhe-sive patches, and the strength of adhesion is determined by the number of patches: Nonadherers have no patches,weak adherers bind with a single patch only, and strong adherers bind via a single or multiple patches. We discusspossible implications of our results for controlling bacterial adhesion in biomedical and other applications.
INTRODUCTIONBacterial colonization of myriad niches, both natural and man-made,begins with adhesion to surfaces (1, 2). The colonization of man-madesurfaces (catheters, surgical implants, etc.) causes infection (3) becauseadhering biofilms resist physical and chemical assaults (4), and it con-tributes to the emergence of antimicrobial resistance (5). Understandingand minimizing bacterial adhesion is a cross-disciplinary “grand chal-lenge” (6), in which it is key to understand the forces involved. Besidesgeneric electrostatics and dispersion forces (7), there are also forces ofbiological origin associated with various adhesins and sticky organelles(for example, fimbriae) (6, 8–10).
Biophysical studies of bacterial adhesion typically fall into twocategories (11): high-throughput, population-level work giving littlesingle-cell information or low-throughput single-cell studies.We reporta robust, generic, and high-throughput tracking and big-data analysistechnique that reveals detailed single-cell information in a large popu-lation. Applying this technique to Escherichia coli on glass, we find sub-stantial variability in the propensity for adhesion and the postadhesiondynamics. Some cells do not adhere despite repeated encounters,whereas others adhere rapidly upon contact. Among the adherers, afraction pivot freely around their own attachment points and can beremoved from the surface by gravity, whereas the remainder spend partof their time in a more strongly bound, rotationally constrained state.This variability remains in flagella- and fimbriae-deletion mutants.
From the biological perspective, such variability exemplifies pheno-typic heterogeneity in a clonal population (12) and offers a new modelfor its study (13, 14). Given the variety of surfaces that bacteria may en-counter, such adhesive phenotypic heterogeneity may be an instance of“bet hedging” (15), allowing survival when the environment changes un-predictably (for example, following fecal excretion for Enterobacteriaceae).
In soft matter terms, genetically monodisperse E. coli cells are ad-hesively polydisperse and behave as “living patchy colloids” bearing a
variable number of sticky patches on their cell bodies. Thus, the consid-erable knowledge about patchy colloids accumulated over the pastdecade (16–18) can be deployed in the design of abiotic surfaces tominimize bacterial adhesion. Bacterial adhesion to engineered patchysoft surfaces has been studied before (19), but the possibility of patch-iness on the bacteria themselves has not been considered inmuch detail.
We studied E. coli strain AB1157. Like all K-12 derivatives, it hasmu-tations in the rfb gene cluster [here, in rfbD (20)] preventing O-antigenproduction (21). Thus, one major cause of variability and molecularroughness on the cell surface is absent. Our cells display a highly con-served layer of core oligosaccharides anchored to the outer membraneby lipid A (22), although the precise terminal sugars in AB1157 are un-known. Besides the wild-type (WT), to further simplify the surface, wealso used amutant (AD19 = AB1157 fimA−, fliF−; hereafter DFF) defec-tive in producing type 1 fimbriae and flagella. In transmission electronmicrographs (fig. S1), these cells appear smooth down to≲ 10 nm. Anyheterogeneities, or “patchiness,” on the surface of this mutant are likelydue to membrane proteins.
RESULTSA high-throughput method reveals complexadhesion behaviorTo monitor surface adhesion of E. coli, we loaded cell suspensions into400-mm-high borosilicate glass capillaries at ~ 4.5 × 10⁷ cells/ml (WT)or ~ 1.5 × 10⁷ cells/ml (DFF) in phosphate motility buffer (MB) andobserved them in an inverted microscope at ca. 22°C using a 60×phase-contrast objective (focal depth ~ 3.5 mm) (Fig. 1A). From mea-surements at the lower surface at the start of the experiment, weestimate an initial motile fraction between 25 and 35% [nonadheringmotile cells swim at an average speed of≲ 20 mm s−1 (23)]; the remain-ing cells are nonmotile and diffuse as passive colloids. With 0.72 mMglucose included in the MB, the swimmers maintain their speed forat least 20 hours (23). Atomic force microscopy (AFM) measurementsreveal that the glass surface is smooth,with a root-mean-squared rough-ness of 0.25 ± 0.003 nm (fig. S2).
Time-lapse images of the bottom and top glass surfaces were takenautomatically at multiple locations to track arriving cells and theirsubsequent fate. We adapted algorithms used for colloidal rods (24)
1ScottishUniversities PhysicsAlliances andSchool of Physics andAstronomy,University ofEdinburgh, James Clerk Maxwell Building, Peter Guthrie Tait Road, Edinburgh EH9 3FD,UK. 2Department of Physics, Soft Condensed Matter Debye Institute for NanomaterialsScience, Utrecht University, Princetonplein 5, 3584 CC Utrecht, Netherlands. 3School ofEngineering, Institute for Materials and Processes, University of Edinburgh, SandersonBuilding, Robert Stevenson Road, The King’s Buildings, Edinburgh EH9 3FB, UK.*Corresponding author. Email: [email protected]
S C I ENCE ADVANCES | R E S EARCH ART I C L E
Vissers et al., Sci. Adv. 2018;4 : eaao1170 27 April 2018 1 of 8
on August 14, 2018http://advances.sciencem
ag.org/D
ownloaded from
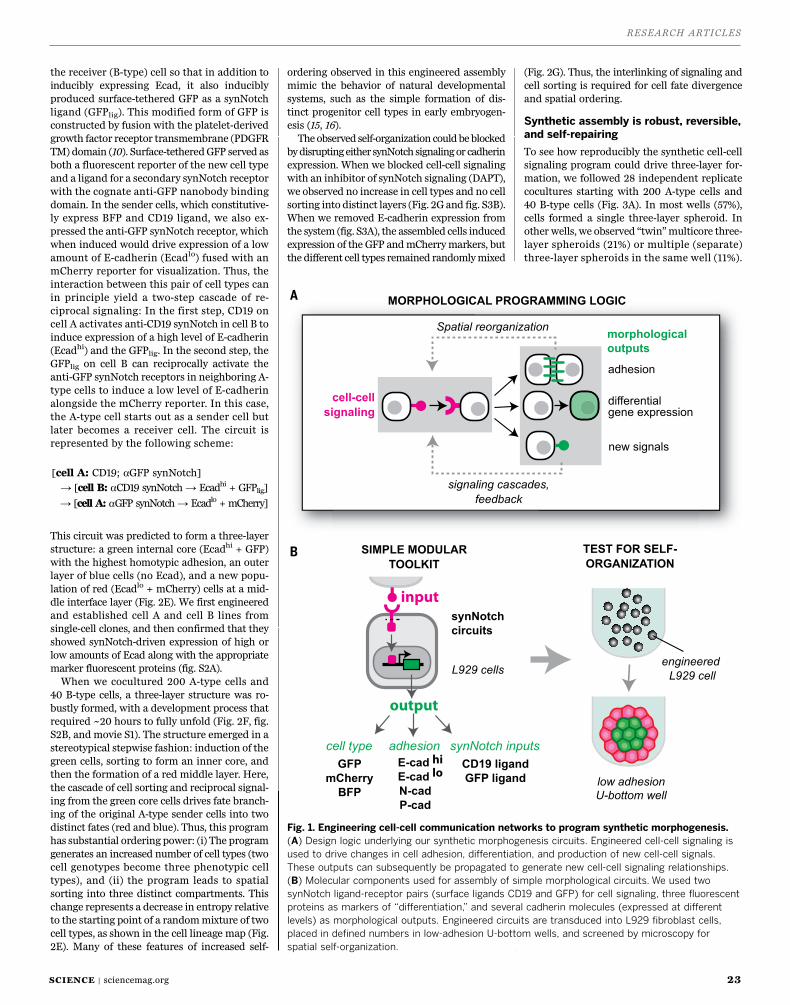
RESEARCH ARTICLES
23SCIENCE | sciencemag.org
the receiver (B-type) cell so that in addition to
inducibly expressing Ecad, it also inducibly
produced surface-tethered GFP as a synNotch
ligand (GFPlig). This modified form of GFP is
constructed by fusion with the platelet-derived
growth factor receptor transmembrane (PDGFR
TM) domain (10). Surface-tetheredGFP served as
both a fluorescent reporter of the new cell type
and a ligand for a secondary synNotch receptor
with the cognate anti-GFP nanobody binding
domain. In the sender cells, which constitutive-
ly express BFP and CD19 ligand, we also ex-
pressed the anti-GFP synNotch receptor, which
when induced would drive expression of a low
amount of E-cadherin (Ecadlo) fused with an
mCherry reporter for visualization. Thus, the
interaction between this pair of cell types can
in principle yield a two-step cascade of re-
ciprocal signaling: In the first step, CD19 on
cell A activates anti-CD19 synNotch in cell B to
induce expression of a high level of E-cadherin
(Ecadhi) and the GFPlig. In the second step, the
GFPlig on cell B can reciprocally activate the
anti-GFP synNotch receptors in neighboring A-
type cells to induce a low level of E-cadherin
alongside the mCherry reporter. In this case,
the A-type cell starts out as a sender cell but
later becomes a receiver cell. The circuit is
represented by the following scheme:
[cell A: CD19; aGFP synNotch]
→ [cell B: aCD19 synNotch→ Ecadhi+ GFPlig]
→ [cell A: aGFP synNotch→ Ecadlo+ mCherry]
This circuit was predicted to form a three-layer
structure: a green internal core (Ecadhi+ GFP)
with the highest homotypic adhesion, an outer
layer of blue cells (no Ecad), and a new popu-
lation of red (Ecadlo+ mCherry) cells at a mid-
dle interface layer (Fig. 2E). We first engineered
and established cell A and cell B lines from
single-cell clones, and then confirmed that they
showed synNotch-driven expression of high or
low amounts of Ecad along with the appropriate
marker fluorescent proteins (fig. S2A).
When we cocultured 200 A-type cells and
40 B-type cells, a three-layer structure was ro-
bustly formed, with a development process that
required ~20 hours to fully unfold (Fig. 2F, fig.
S2B, and movie S1). The structure emerged in a
stereotypical stepwise fashion: induction of the
green cells, sorting to form an inner core, and
then the formation of a red middle layer. Here,
the cascade of cell sorting and reciprocal signal-
ing from the green core cells drives fate branch-
ing of the original A-type sender cells into two
distinct fates (red and blue). Thus, this program
has substantial ordering power: (i) The program
generates an increased number of cell types (two
cell genotypes become three phenotypic cell
types), and (ii) the program leads to spatial
sorting into three distinct compartments. This
change represents a decrease in entropy relative
to the starting point of a randommixture of two
cell types, as shown in the cell lineage map (Fig.
2E). Many of these features of increased self-
ordering observed in this engineered assembly
mimic the behavior of natural developmental
systems, such as the simple formation of dis-
tinct progenitor cell types in early embryogen-
esis (15, 16).
The observed self-organization could beblocked
bydisruptingeither synNotch signalingor cadherin
expression. When we blocked cell-cell signaling
with an inhibitor of synNotch signaling (DAPT),
we observed no increase in cell types and no cell
sorting into distinct layers (Fig. 2G and fig. S3B).
When we removed E-cadherin expression from
the system (fig. S3A), the assembled cells induced
expression of the GFP andmCherrymarkers, but
the different cell types remained randomlymixed
(Fig. 2G). Thus, the interlinking of signaling and
cell sorting is required for cell fate divergence
and spatial ordering.
Synthetic assembly is robust, reversible,
and self-repairing
To see how reproducibly the synthetic cell-cell
signaling program could drive three-layer for-
mation, we followed 28 independent replicate
cocultures starting with 200 A-type cells and
40 B-type cells (Fig. 3A). In most wells (57%),
cells formed a single three-layer spheroid. In
other wells, we observed “twin”multicore three-
layer spheroids (21%) or multiple (separate)
three-layer spheroids in the same well (11%).
SCIENCE sciencemag.org 13 JULY 2018 • VOL 361 ISSUE 6398 157
Fig. 1. Engineering cell-cell communication networks to program synthetic morphogenesis.
(A) Design logic underlying our synthetic morphogenesis circuits. Engineered cell-cell signaling is
used to drive changes in cell adhesion, differentiation, and production of new cell-cell signals.
These outputs can subsequently be propagated to generate new cell-cell signaling relationships.
(B) Molecular components used for assembly of simple morphological circuits. We used two
synNotch ligand-receptor pairs (surface ligands CD19 and GFP) for cell signaling, three fluorescent
proteins as markers of “differentiation,” and several cadherin molecules (expressed at different
levels) as morphological outputs. Engineered circuits are transduced into L929 fibroblast cells,
placed in defined numbers in low-adhesion U-bottom wells, and screened by microscopy for
spatial self-organization.
RESEARCH | RESEARCH ARTICLES
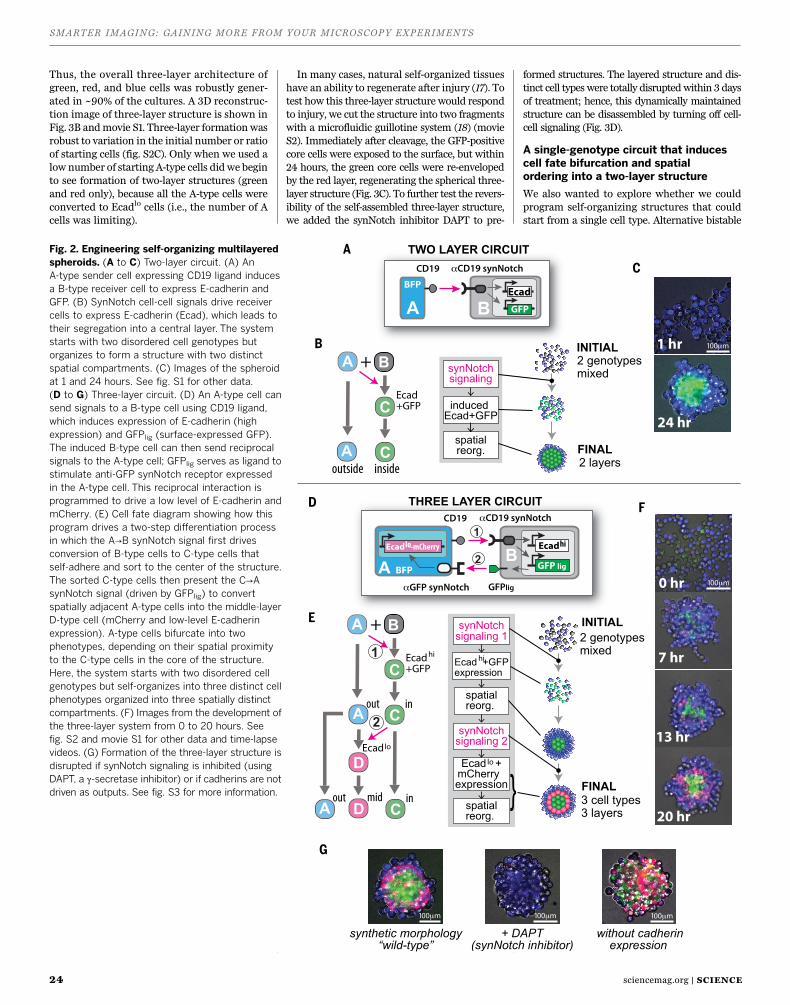
SMARTER IMAGING: GAINING MORE FROM YOUR MICROSCOPY EXPERIMENTS
24 sciencemag.org | SCIENCE
Thus, the overall three-layer architecture of
green, red, and blue cells was robustly gener-
ated in ~90% of the cultures. A 3D reconstruc-
tion image of three-layer structure is shown in
Fig. 3B andmovie S1. Three-layer formation was
robust to variation in the initial number or ratio
of starting cells (fig. S2C). Only when we used a
low number of starting A-type cells did we begin
to see formation of two-layer structures (green
and red only), because all the A-type cells were
converted to Ecadlocells (i.e., the number of A
cells was limiting).
In many cases, natural self-organized tissues
have an ability to regenerate after injury (17). To
test how this three-layer structure would respond
to injury, we cut the structure into two fragments
with a microfluidic guillotine system (18) (movie
S2). Immediately after cleavage, the GFP-positive
core cells were exposed to the surface, but within
24 hours, the green core cells were re-enveloped
by the red layer, regenerating the spherical three-
layer structure (Fig. 3C). To further test the revers-
ibility of the self-assembled three-layer structure,
we added the synNotch inhibitor DAPT to pre-
formed structures. The layered structure and dis-
tinct cell types were totally disruptedwithin 3 days
of treatment; hence, this dynamically maintained
structure can be disassembled by turning off cell-
cell signaling (Fig. 3D).
A single-genotype circuit that induces
cell fate bifurcation and spatial
ordering into a two-layer structure
We also wanted to explore whether we could
program self-organizing structures that could
start from a single cell type. Alternative bistable
158 13 JULY 2018 • VOL 361 ISSUE 6398 sciencemag.org SCIENCE
Fig. 2. Engineering self-organizing multilayered
spheroids. (A to C) Two-layer circuit. (A) An
A-type sender cell expressing CD19 ligand induces
a B-type receiver cell to express E-cadherin and
GFP. (B) SynNotch cell-cell signals drive receiver
cells to express E-cadherin (Ecad), which leads to
their segregation into a central layer. The system
starts with two disordered cell genotypes but
organizes to form a structure with two distinct
spatial compartments. (C) Images of the spheroid
at 1 and 24 hours. See fig. S1 for other data.
(D to G) Three-layer circuit. (D) An A-type cell can
send signals to a B-type cell using CD19 ligand,
which induces expression of E-cadherin (high
expression) and GFPlig (surface-expressed GFP).
The induced B-type cell can then send reciprocal
signals to the A-type cell; GFPlig serves as ligand to
stimulate anti-GFP synNotch receptor expressed
in the A-type cell. This reciprocal interaction is
programmed to drive a low level of E-cadherin and
mCherry. (E) Cell fate diagram showing how this
program drives a two-step differentiation process
in which the A→B synNotch signal first drives
conversion of B-type cells to C-type cells that
self-adhere and sort to the center of the structure.
The sorted C-type cells then present the C→A
synNotch signal (driven by GFPlig) to convert
spatially adjacent A-type cells into the middle-layer
D-type cell (mCherry and low-level E-cadherin
expression). A-type cells bifurcate into two
phenotypes, depending on their spatial proximity
to the C-type cells in the core of the structure.
Here, the system starts with two disordered cell
genotypes but self-organizes into three distinct cell
phenotypes organized into three spatially distinct
compartments. (F) Images from the development of
the three-layer system from 0 to 20 hours. See
fig. S2 and movie S1 for other data and time-lapse
videos. (G) Formation of the three-layer structure is
disrupted if synNotch signaling is inhibited (using
DAPT, a g-secretase inhibitor) or if cadherins are not
driven as outputs. See fig. S3 for more information.
RESEARCH | RESEARCH ARTICLES

RESEARCH ARTICLES
25SCIENCE | sciencemag.orgSCIENCE sciencemag.org 13 JULY 2018 • VOL 361 ISSUE 6398 159
Fig. 3. Three-layer self-organized structure is robust, reversible, and
self-repairing. (A) Distribution of structures generated in 28 independent
wells (starting with 200 A-type cells and 40 B-type cells). About 90% of
the wells showed formation of three-layer structures; the majority of these
showed one spheroid per well, with the remainder showing either twinned
spheroids or multiple independent three-layer spheroids. Example images of
these structural subtypes are shown at the right. (B) Three-dimensional
confocal reconstruction of a three-layer structure cross section, shown
from two views. See movie S1 for full rotational view of the 3D structure.
(C) Self-repair of a cleaved three-layer structure. The preformed spheroid
was cleaved using a microfluidic guillotine, and the two resulting fragments
were observed for 25 hours. The frames at 0 hours show the two
fragments, with a dotted line indicating the cleavage plane that exposes
the internal core of the spheroid. Images at 25 hours show self-repair
of the spherical three-layer structure. (D) The structure is reversible
if treated with the synNotch inhibitor DAPT.Within 3 days, the differentiation
and spatial organization of cells disappeared. Original A- and B-type cells
became randomly organized.
Fig. 4. Single-genotype
circuit that induces fate
bifurcation and spatial
ordering into a two-layer
structure. (A) Design of
single-genotype circuit
with lateral inhibition
between sender (CD19+)
and receiver (antiCD19-
synNotch–activated)
states. The cell encodes
both CD19 and anti-CD19
synNotch, but activated
synNotch receptor drives
expression of tet repressor
(tTS), which inhibits
CD19 expression. Thus,
neighboring cells will drive
each other into opposite
states indicated by red and
green fluorescent markers
(fate RED and GREEN).
(B) E-cadherin expression
driven from the synNotch-
activated promoter. An
initially homogeneous
population of red cells
undergoes bifurcation into
RED fate and Ecad-positive GREEN fate by lateral inhibition, and GREEN-fate
cells are finally sorted inside to form an inner core. The system starts with
a single-genotype population but is expected to organize into a two-layer
structure. (C) Purification of a homogeneous population by sorting for
mCherryhigh/GFPlow cells. When allowed to communicate through lateral
inhibition, the cells rebifurcate into two distinct fluorescently labeled
populations (bottom). See fig. S4 and supplementary materials for more
information on how the lateral inhibition circuit was constructed and
executed. (D) Development of the single-genotype two-layer structure.
Time frames are shown at 1, 25, and 50 hours, showing initial cell
fate bifurcation followed by formation of a stable two-layer structure.
See fig. S5 for more information and movie S3 for time-lapse video.
RESEARCH | RESEARCH ARTICLES

SMARTER IMAGING: GAINING MORE FROM YOUR MICROSCOPY EXPERIMENTS
26 sciencemag.org | SCIENCE
cell fates can be generated from a single start-
ing cell genotype through a mechanism known
as lateral inhibition (19). For example, cross-
repression between Notch receptor and its lig-
and in neighboring cells can result in a bistable,
checkerboard fate pattern, where individual
cells bifurcate into either Notchactive
-ligandlow
or
Notchinactive
-ligandhigh
states (20, 21). We built
an analogous lateral inhibition circuit using
synNotch cross-repression in L929 cells (fig.
S4B). Each cell encoded both CD19 (ligand) and
the anti-CD19 synNotch receptor, but these are
antagonistic to each other because the synNotch
receptor induces expression of the Tet repressor
(tTS), which can repress CD19 expression (con-
trolled by a TetO promoter). Thus, if synNotch
is stimulated by a neighboring cell with high
CD19 expression, it will repress CD19 ligand
expression, thereby forcing cells to choose be-
tween either a sender or receiver fate. CD19 and
tTS expression were monitored by mCherry and
GFP, respectively (expressed in linked transcrip-
tional cassettes through a ribosomal skipping
porcine teschovirus-1 2A sequence). We es-
tablished multiple clones that bifurcated spon-
taneously into two populations of mCherry or
GFP-positive cells (fig. S4B; see supplementary
materials for details of how we established lat-
eral inhibition lines). These cell lines consist-
ently reestablished the two phenotypic states,
even when starting with a pure sorted popula-
tion of either the red or green state (Fig. 4C and
fig. S4B).
To produce a spatially ordered structure from
a single cell type, we then functionally combined
two different organizational circuitmodules: this
bifurcating cell fate circuit and the self-organized
E-cadherin–driven two-layer circuit (Fig. 2A). To
construct such a composite circuit, we expressed
E-cadherin from the synNotch-driven promoter
(in addition to inducing expression of the tet
repressor) (Fig. 4A and fig. S5A). The objective
was to start with a single cell type and observe
self-driven fate bifurcation followed by self-
driven sorting into two layers.
To track how the system developed from a
single cellular phenotype, we sorted red-fate
cells (CD19 high), placed 100 cells in each well,
and followed the development of the spheroid
by time-lapsemicroscopy. These cells developed
into a spheroid inwhich the cells first underwent
bifurcation into a red-green checkerboard pat-
tern and then, over the course of hours, formed
a two-layer structure with green cells inside and
red cells outside (fig. S5, B and C). These two-
layer structures were stable for 100 hours.
Addition of the Notch signaling inhibitor DAPT
prevented fate bifurcation (fig. S5C). But after
removal of the drug and re-sorting, the cells re-
mained bipotent; they could still bifurcate and
160 13 JULY 2018 • VOL 361 ISSUE 6398 sciencemag.org SCIENCE
Fig. 5. Programming spherically asymmetric
structures by inducing differentially sorting
adhesion molecules. (A) Logic of deploying
alternative adhesion outputs to generate different
spatial structures. In the spherically symmetric
structures of Figs. 2 to 4, we used high and low
levels of Ecad expression to define different
populations of cells. High- and low-Ecad
populations lead to sorting into concentric shells,
because Ecadlo cells still prefer to bind Ecadhi cells.
In contrast, two cell populations that express
either Ncad or Pcad will sort into distinct com-
partments (nonconcentric) because each of these
cadherins prefers homotypic self-association to
heterotypic cross-association. (B) Three-layer
asymmetric circuit I, with the same architecture as
that shown in Fig. 2, except that B-type cells are
induced to express Ncad and A-type cells are
induced to express Pcad. In phase II of the
development (reciprocal B→A signaling), the
A-type cells become red and self-sort to form one
to three external poles (with unactivated A-type
cells associated at their periphery). The starting
population included 100 cells of each type.
When we started with only 30 cells of each type
(right image), we reproducibly generated single-
pole structures. See fig. S7 and movie S4 for
more information, time-lapse videos, and 3D
structure. (C) Three-layer asymmetric circuit II.
An A-type cell constitutively expresses Pcad and
mCherry as well as CD19 ligand. B-type cells
recognize CD19 with anti-CD19 synNotch recep-
tor, which drives expression of Ncad and GFPlig. In
reciprocal signaling, GFPlig drives induction of a
BFP marker in A-type cells. Here, the red A-type
cells first form a central core and the induced
green B-type cells form polar protrusions. A third
cell type (blue) forms at the boundary between
the red core and the green protrusions. See fig.
S8 and movie S5 for more information, time-
lapse video, and 3D structure. Information on
other structures using different cadherin pairs is
shown in figs. S9 and S10 and movies S6 and S7.
RESEARCH | RESEARCH ARTICLES
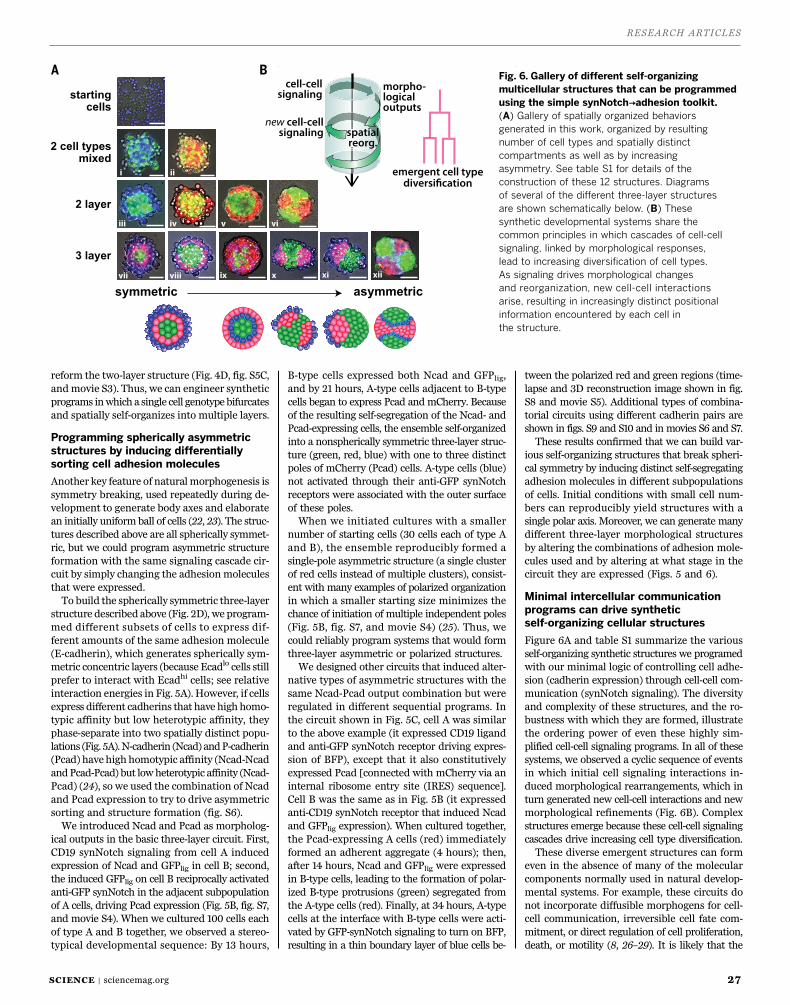
RESEARCH ARTICLES
27SCIENCE | sciencemag.org
reform the two-layer structure (Fig. 4D, fig. S5C,
andmovie S3). Thus, we can engineer synthetic
programs inwhich a single cell genotype bifurcates
and spatially self-organizes into multiple layers.
Programming spherically asymmetric
structures by inducing differentially
sorting cell adhesion molecules
Another key feature of naturalmorphogenesis is
symmetry breaking, used repeatedly during de-
velopment to generate body axes and elaborate
an initially uniform ball of cells (22, 23). The struc-
tures described above are all spherically symmet-
ric, but we could program asymmetric structure
formation with the same signaling cascade cir-
cuit by simply changing the adhesionmolecules
that were expressed.
To build the spherically symmetric three-layer
structure described above (Fig. 2D), we program-
med different subsets of cells to express dif-
ferent amounts of the same adhesion molecule
(E-cadherin), which generates spherically sym-
metric concentric layers (because Ecadlocells still
prefer to interact with Ecadhicells; see relative
interaction energies in Fig. 5A). However, if cells
express different cadherins that have high homo-
typic affinity but low heterotypic affinity, they
phase-separate into two spatially distinct popu-
lations (Fig. 5A).N-cadherin (Ncad) andP-cadherin
(Pcad) have high homotypic affinity (Ncad-Ncad
andPcad-Pcad) but lowheterotypic affinity (Ncad-
Pcad) (24), so we used the combination of Ncad
and Pcad expression to try to drive asymmetric
sorting and structure formation (fig. S6).
We introduced Ncad and Pcad as morpholog-
ical outputs in the basic three-layer circuit. First,
CD19 synNotch signaling from cell A induced
expression of Ncad and GFPlig in cell B; second,
the induced GFPlig on cell B reciprocally activated
anti-GFP synNotch in the adjacent subpopulation
of A cells, driving Pcad expression (Fig. 5B, fig. S7,
and movie S4). When we cultured 100 cells each
of type A and B together, we observed a stereo-
typical developmental sequence: By 13 hours,
B-type cells expressed both Ncad and GFPlig,
and by 21 hours, A-type cells adjacent to B-type
cells began to express Pcad andmCherry. Because
of the resulting self-segregation of the Ncad- and
Pcad-expressing cells, the ensemble self-organized
into a nonspherically symmetric three-layer struc-
ture (green, red, blue) with one to three distinct
poles of mCherry (Pcad) cells. A-type cells (blue)
not activated through their anti-GFP synNotch
receptors were associated with the outer surface
of these poles.
When we initiated cultures with a smaller
number of starting cells (30 cells each of type A
and B), the ensemble reproducibly formed a
single-pole asymmetric structure (a single cluster
of red cells instead of multiple clusters), consist-
ent with many examples of polarized organization
in which a smaller starting size minimizes the
chance of initiation of multiple independent poles
(Fig. 5B, fig. S7, and movie S4) (25). Thus, we
could reliably program systems that would form
three-layer asymmetric or polarized structures.
We designed other circuits that induced alter-
native types of asymmetric structures with the
same Ncad-Pcad output combination but were
regulated in different sequential programs. In
the circuit shown in Fig. 5C, cell A was similar
to the above example (it expressed CD19 ligand
and anti-GFP synNotch receptor driving expres-
sion of BFP), except that it also constitutively
expressed Pcad [connected with mCherry via an
internal ribosome entry site (IRES) sequence].
Cell B was the same as in Fig. 5B (it expressed
anti-CD19 synNotch receptor that induced Ncad
and GFPlig expression). When cultured together,
the Pcad-expressing A cells (red) immediately
formed an adherent aggregate (4 hours); then,
after 14 hours, Ncad and GFPlig were expressed
in B-type cells, leading to the formation of polar-
ized B-type protrusions (green) segregated from
the A-type cells (red). Finally, at 34 hours, A-type
cells at the interface with B-type cells were acti-
vated by GFP-synNotch signaling to turn on BFP,
resulting in a thin boundary layer of blue cells be-
tween the polarized red and green regions (time-
lapse and 3D reconstruction image shown in fig.
S8 and movie S5). Additional types of combina-
torial circuits using different cadherin pairs are
shown in figs. S9 and S10 and in movies S6 and S7.
These results confirmed that we can build var-
ious self-organizing structures that break spheri-
cal symmetry by inducing distinct self-segregating
adhesion molecules in different subpopulations
of cells. Initial conditions with small cell num-
bers can reproducibly yield structures with a
single polar axis. Moreover, we can generate many
different three-layer morphological structures
by altering the combinations of adhesion mole-
cules used and by altering at what stage in the
circuit they are expressed (Figs. 5 and 6).
Minimal intercellular communication
programs can drive synthetic
self-organizing cellular structures
Figure 6A and table S1 summarize the various
self-organizing synthetic structures we programed
with our minimal logic of controlling cell adhe-
sion (cadherin expression) through cell-cell com-
munication (synNotch signaling). The diversity
and complexity of these structures, and the ro-
bustness with which they are formed, illustrate
the ordering power of even these highly sim-
plified cell-cell signaling programs. In all of these
systems, we observed a cyclic sequence of events
in which initial cell signaling interactions in-
duced morphological rearrangements, which in
turn generated new cell-cell interactions and new
morphological refinements (Fig. 6B). Complex
structures emerge because these cell-cell signaling
cascades drive increasing cell type diversification.
These diverse emergent structures can form
even in the absence of many of the molecular
components normally used in natural develop-
mental systems. For example, these circuits do
not incorporate diffusible morphogens for cell-
cell communication, irreversible cell fate com-
mitment, or direct regulation of cell proliferation,
death, or motility (8, 26–29). It is likely that the
SCIENCE sciencemag.org 13 JULY 2018 • VOL 361 ISSUE 6398 161
Fig. 6. Gallery of different self-organizing
multicellular structures that can be programmed
using the simple synNotch→adhesion toolkit.
(A) Gallery of spatially organized behaviors
generated in this work, organized by resulting
number of cell types and spatially distinct
compartments as well as by increasing
asymmetry. See table S1 for details of the
construction of these 12 structures. Diagrams
of several of the different three-layer structures
are shown schematically below. (B) These
synthetic developmental systems share the
common principles in which cascades of cell-cell
signaling, linked by morphological responses,
lead to increasing diversification of cell types.
As signaling drives morphological changes
and reorganization, new cell-cell interactions
arise, resulting in increasingly distinct positional
information encountered by each cell in
the structure.
RESEARCH | RESEARCH ARTICLES

SMARTER IMAGING: GAINING MORE FROM YOUR MICROSCOPY EXPERIMENTS
28 sciencemag.org | SCIENCE
synthetic platforms used here could be extended
to include many of these additional elements to
generate even more sophisticated engineered self-
organizing multicellular structures (30–35).
The observation that even minimal circuits
that link cell-cell signaling to adhesion can lead
to the formation of defined self-organizing struc-
tures may help to explain the general principles
by which multicellular organisms could have
evolved. Choanoflagellates, the closest single-
cell relatives of metazoans, have both primitive
cadherin and notch genes (36). The cadherin
genes are thought to have originally functioned
to trap prey bacteria in the environment and
may have later been co-opted for cell-cell adhe-
sion (37, 38). In some choanoflagellate species,
environmental signals from prey bacteria can
induce the formation of multicellular assemblies
(39, 40). It seems plausible that cell-to-bacteria
adhesion transitioned to cell-cell adhesion, and
that bacteria-to-cell signaling transitioned to
cell-cell signaling. During the course of evolu-
tion, these systems may have begun to regulate
one another, providing a starting point for cir-
cuits capable of driving formation of complex
multicellular structures.
More generally, these findings suggest that
it may be possible to program the formation of
synthetic tissues, organs, and other non-native
types of dynamic, multicellular materials. We may
be able to apply tools like synNotch, perhaps
enhanced by an even larger toolkit of modular
developmental signals, to construct customized
self-assembling tissue-like biomaterials of di-
verse types. These tools and approaches also pro-
vide powerful tools to systematically probe and
better understand the principles governing self-
organization and development.
REFERENCES AND NOTES
1. J. Davies, Development 144, 1146–1158 (2017).
2. M. Elowitz, W. A. Lim, Nature 468, 889–890 (2010).
3. B. P. Teague, P. Guye, R. Weiss, Cold Spring Harb.
Perspect. Biol. 8, a023929 (2016).
4. A. Kicheva, N. C. Rivron, Development 144, 733–736 (2017).
5. S. Basu, Y. Gerchman, C. H. Collins, F. H. Arnold, R. Weiss,
Nature 434, 1130–1134 (2005).
6. S. S. Jang, K. T. Oishi, R. G. Egbert, E. Klavins, ACS Synth. Biol.
1, 365–374 (2012).
7. M. Rubenstein, A. Cornejo, R. Nagpal, Science 345, 795–799
(2014).
8. L. Wolpert, J. Theor. Biol. 25, 1–47 (1969).
9. D. Gilmour, M. Rembold, M. Leptin, Nature 541, 311–320
(2017).
10. L. Morsut et al., Cell 164, 780–791 (2016).
11. A. Nose, A. Nagafuchi, M. Takeichi, Cell 54, 993–1001
(1988).
12. D. Duguay, R. A. Foty, M. S. Steinberg, Dev. Biol. 253, 309–323
(2003).
13. R. A. Foty, M. S. Steinberg, Dev. Biol. 278, 255–263 (2005).
14. M. Vinci et al., BMC Biol. 10, 29 (2012).
15. C. Chazaud, Y. Yamanaka, Development 143, 1063–1074
(2016).
16. S. E. Harrison, B. Sozen, N. Christodoulou, C. Kyprianou,
M. Zernicka-Goetz, Science 356, eaal1810 (2017).
17. A. Sánchez Alvarado, P. A. Tsonis, Nat. Rev. Genet. 7, 873–884
(2006).
18. L. R. Blauch et al., Proc. Natl. Acad. Sci. U.S.A. 114, 7283–7288
(2017).
19. J. R. Collier, N. A. M. Monk, P. K. Maini, J. H. Lewis,
J. Theor. Biol. 183, 429–446 (1996).
20. S. J. Bray, Nat. Rev. Mol. Cell Biol. 7, 678–689 (2006).
21. M. Matsuda, M. Koga, K. Woltjen, E. Nishida, M. Ebisuya,
Nat. Commun. 6, 6195 (2015).
22. S. Wennekamp, S. Mesecke, F. Nédélec, T. Hiiragi,
Nat. Rev. Mol. Cell Biol. 14, 452–459 (2013).
23. S. C. van den Brink et al., Development 141, 4231–4242 (2014).
24. J. Vendome et al., Proc. Natl. Acad. Sci. U.S.A. 111,
E4175–E4184 (2014).
25. E. Cachat et al., Sci. Rep. 6, 20664 (2016).
26. A. M. Turing, Philos. Trans. R. Soc. London Ser. B 237, 37–72
(1952).
27. M. D. Jacobson, M. Weil, M. C. Raff, Cell 88, 347–354 (1997).
28. E. Scarpa, R. Mayor, J. Cell Biol. 212, 143–155 (2016).
29. E. Li, Nat. Rev. Genet. 3, 662–673 (2002).
30. J. A. Davies, J. Anat. 212, 707–719 (2008).
31. S. A. Newman, R. Bhat, Int. J. Dev. Biol. 53, 693–705 (2009).
32. Y. E. Antebi, N. Nandagopal, M. B. Elowitz, Curr. Opin.
Syst. Biol. 1, 16–24 (2017).
33. J. B. A. Green, J. Sharpe, Development 142, 1203–1211 (2015).
34. Y. Hart et al., Cell 158, 1022–1032 (2014).
35. Y. Okabe, R. Medzhitov, Nat. Immunol. 17, 9–17 (2016).
36. N. King et al., Nature 451, 783–788 (2008).
37. M. Abedin, N. King, Science 319, 946–948 (2008).
38. S. A. Nichols, B. W. Roberts, D. J. Richter, S. R. Fairclough,
N. King, Proc. Natl. Acad. Sci. U.S.A. 109, 13046–13051 (2012).
39. R. A. Alegado et al., eLife 1, e00013 (2012).
40. A. Woznica et al., Proc. Natl. Acad. Sci. U.S.A. 113, 7894–7899
(2016).
ACKNOWLEDGMENTS
We thank B. Honig and L. Shapiro for discussions regarding
cadherin sorting and for providing cadherin plasmids, O. Klein
for comments, members of the Lim Lab and the Morsut lab for
discussion and assistance, and K. Roybal, M. Thomson, Z. Gartner,
W. Marshall, J. Fung, and members of the UCSF Center for
Systems and Synthetic Biology and the NSF Center for Cellular
Construction. Funding: Supported by Japan Society for the
Promotion of Science (JSPS) Overseas Research Fellowships
(S.T.); a Human Frontiers of Science Program (HFSP) (S.T. and
L.M.); a European Molecular Biology Organization (EMBO)
Postdoctoral Fellowship (L.M.); NIH grants K99 1K99EB021030
(L.M.), 5P50GM081879 (W.A.L.), and T32GM008412 (L.R.B.);
NSF DBI-1548297 Center for Cellular Construction (W.A.L. and
S.K.Y.T.); the DARPA Engineered Living Materials program; and
the Howard Hughes Medical Institute (W.A.L.). Author
contributions: S.T. developed and planned research, carried out
the design, construction, and testing of self-organizing circuits, and
wrote the manuscript; L.R.B. designed and built the microfluidic
guillotine and executed experiments for testing regeneration;
S.K.Y.T. designed and conceptualized the microfluidic guillotine;
L.M. developed and planned research and wrote and edited the
manuscript; and W.A.L. developed, planned, and oversaw research
and wrote and edited the manuscript. Competing interests:
The synNotch platform has been patented (U.S. Patent 9,670,281)
by the Regents of the University of California and is licensed by
Gilead Biosciences. W.A.L. has a financial interest in Gilead
Biosciences. Data and materials availability: All constructs will be
made available on Addgene, and all relevant data are included within
the main paper or the supplementary materials.
SUPPLEMENTARY MATERIALS
www.sciencemag.org/content/361/6398/156/suppl/DC1
Materials and Methods
Figs. S1 to S10
Table S1
Movies S1 to S7
References (41, 42)
17 January 2018; accepted 22 May 2018
Published online 31 May 2018
10.1126/science.aat0271
REPORTS◥
PHYSICS
Phase transitions in a programmablequantum spin glass simulatorR. Harris1*, Y. Sato1, A. J. Berkley1, M. Reis1, F. Altomare1, M. H. Amin1,2, K. Boothby1,
P. Bunyk1, C. Deng1, C. Enderud1, S. Huang1, E. Hoskinson1, M. W. Johnson1,
E. Ladizinsky1, N. Ladizinsky1, T. Lanting1, R. Li1, T. Medina1, R. Molavi1,3, R. Neufeld1,
T. Oh1, I. Pavlov1, I. Perminov1, G. Poulin-Lamarre1, C. Rich1, A. Smirnov1, L. Swenson1,
N. Tsai1, M. Volkmann1, J. Whittaker1, J. Yao1
Understanding magnetic phases in quantum mechanical systems is one of the essential goals
in condensed matter physics, and the advent of prototype quantum simulation hardware
has provided new tools for experimentally probing such systems.We report on the
experimental realization of a quantum simulation of interacting Ising spins on three-
dimensional cubic lattices up to dimensions 8 × 8 × 8 on a D-Wave processor (D-Wave
Systems, Burnaby, Canada).The ability to control and read out the state of individual
spins provides direct access to several order parameters, which we used to determine the
lattice’s magnetic phases as well as critical disorder and one of its universal exponents. By
tuning the degree of disorder and effective transverse magnetic field, we observed phase
transitions between a paramagnetic, an antiferromagnetic, and a spin-glass phase.
Can quantum physics be efficiently simu-
lated on a computer? What kind of com-
puter would one need to do so? Feynman
posed these questions to motivate the con-
cept of a probabilistic quantum mechanical
computer that could be used to simulate nature
(1). Whereas the implementation of such com-
puters seemed daunting in Feynman’s time, sub-
sequent progress in the laboratory has made
small-scale quantum simulation possible today
(2–9). Although the field of quantum simulation
is still in its infancy, the scale and the control of
162 13 JULY 2018 • VOL 361 ISSUE 6398 sciencemag.org SCIENCE
RESEARCH

NEW
See the Bigger PictureIntroducing the A1R HD25, a high-definition, advanced confocal
system with twice the field of view of conventional point scanners.
For more information, go to www.microscope.healthcare.nikon.com/a1hd25 or call 1-800-52-NIKON
LARGE IMAGES REDEFINEDFaster image stitching with fewer frames.
2X THE DATA IN EVERY SHOTAcquire twice the data in each frame for faster experiments and better statistics.
STUNNING HIGH DEFINITION IMAGES AT RESONANT SPEEDHigh-resolution imaging up to 1K x 1K.
Capturing images of large samples such as tissues, organs and whole organisms requires extending both the detectable area as well as increasing image capture speed. Nikon’s new A1R HD25 confocal microscope has the largest field of view (25 mm) on the market, enabling users to explore beyond the traditional boundaries of confocal imaging.
Nikon Instruments Inc. | www.microscope.healthcare.nikon.com | [email protected]
25MM FOV Largest FOV of any commercial point-scanning confocal microscope.
MORE DATA, FASTEREnlarged FOV + high quality resonant scans = more data in less time
OPTICAL SUPERIORITYThe A1R HD25 was produced through a full redesign with optical performance as the focus.
HD RESONANT SCANNER With redesigned electronics, the HD scanner produces beautiful images at incredible speeds.
ENHANCED DECONVOLUTIONExclusive deconvolution algorithms based on real data from Nikon optics.
NIS-ELEMENTS SOFTWAREPowerful tools for acquisition, analysis and data sharing.
NISNISNISNISNISNIS
NIK-6377 Science ebook Ad_A1R HD25_FINAL.indd 1 10/13/18 7:10 PM

Capture 2x More Data in a Single FOV
See More Than Before
Inverted Microscope
25mm
18mm
Nikon has raised the bar for core imaging capability
with the Eclipse Ti2 Inverted Research Microscope.
With its unprecedented 25mm field of view, the Ti2
captures twice as much data with a single image.
There’s so much more! For more information,
go to www.microscope.healthcare.nikon.com/ti2
or call 1-800-52-NIKON
Nikon Instruments Inc. | www.microscope.healthcare.nikon.com | [email protected]
NIK-6377 Science ebook Ad_Ti2.indd 1 10/13/18 7:18 PM