Embed Size (px)
Citation preview
A STANDARD TENSILE TESTING PROCEDURE FOR FIBER-REINFORCED
CONCRETE (FRC) AND ULTRA-HIGH-PERFORMANCE
FIBER-REINFORCED CONCRETE (UHP-FRC)
BASED ON DOUBLE PUNCH TEST (DPT)
by
SHUVEKSHA TULADHAR
Presented to the Faculty of the Graduate School of
The University of Texas at Arlington in Partial Fulfillment
of the Requirements
for the Degree of
MASTER OF SCIENCE IN CIVIL ENGINEERING
THE UNIVERSITY OF TEXAS AT ARLINGTON
DECEMBER 2017

ii
Copyright © by Shuveksha Tuladhar 2017
All Rights Reserved
iii
Acknowledgements
I would like to express my sincere gratitude to my advisor, Dr. Shih-Ho Chao for
his continuous support, motivation, and guidance for driving me into research for my thesis
throughout my Master’s program in the University of Texas at Arlington. It would not have
been possible without his guidance and priceless advice. I would also like to thank Dr.
Suyun Ham and Dr. Xinbao Yu for spending their valuable time serving on my committee.
I would like to thank Bekaert Company for providing steel fibers and Extensometer
needed for this research and Mr. Varthan Babakhanian, Technical Services Lab Manager
at Forterra Pipe & Precast in Grand Prairie, TX, for providing cement, fly ash and
construction materials. I am truly grateful to Ashish Karmacharya for helping me in this
research with all the experimental works. I am very much thankful to graduate students
Santosh Gurjar, Santosh Maney, Akshay Suryawanshi, Nisarg Patel and Venkata Rahul
Chandra for their help in casting and specimen preparation. I would also like to thank all
the members of Dr. Chao’s research group Venkatesh Babu Kaka, Nga Thuy Phan, Carlos
Leyva, Dr. Kyoung-Sub Park, Dr. Hyunsu Seo, Chatchai Jiansinlapadamrong, Young-Jae
Choi, Ghassan Almasabha, Ra'ed Al-Mazaidh and Seyed Missagh Shamshiri Guilvayi for
the support. I would also like to acknowledge the UTA CELB technician, Mr. Timothy
Andrew Kruzic, for the technical support in the lab.
I am greatly indebted to my father Amrit Man Tuladhar, my mother Ramila Tuladhar
and my sister Lasata Tuladhar for their cooperation, understanding and moral support
during my stay in UTA. My special thanks to Ashish Tamrakar for his unconditional love,
support, and encouragement throughout my study. Last but not the least, I would like to
extend my deepest gratitude to all my friends for their constant encouragement.
November 20, 2017
iv
Abstract
A STANDARD TENSILE TESTING PROCEDURE FOR FIBER-REINFORCED
CONCRETE (FRC) AND ULTRA-HIGH-PERFORMANCE
FIBER-REINFORCED CONCRETE (UHP-FRC)
BASED ON DOUBLE PUNCH TEST (DPT)
Shuveksha Tuladhar, MS
The University of Texas at Arlington, 2017
Supervising Professor: Shih-Ho Chao
Current test methods such as ASTM 1609, ASTM 1550 and direct tensile test are
used for evaluating the mechanical properties of Fiber Reinforced Concrete (FRC) and to
determine the quality of mixture in design and construction practice. These test methods
show high variability in the results, requires large specimen and complicated test setup. An
ideal material test method for FRC should give consistent results in determining
mechanical properties such as peak strength and residual strengths. Moreover, current
test methods are expensive and time-consuming as more specimens are needed to
acquire reliable test results. Double Punch Test (DPT) is a simple, reliable and consistent
test method for evaluating the post-cracking behavior of FRC. DPT originally developed to
determine the tensile strength of plain concrete, can also be used for evaluation of peak
load and post-peak behavior of FRC and Ultra-High-Performance Fiber Reinforced
Concrete (UHP-FRC). This method has a simple test setup and is easier to conduct in
comparison to other test methods. DPT experimental test results are seen to be more
consistent than the other test methods currently in practice. The simplicity of test setup,
reliability of results (low scatter due to the higher cracking surface) and smaller specimens
(fewer materials used) are the major advantages of using DPT method for evaluation of

v
post cracking response of FRC and UHP-FRC. In this research, the application of double
punch test is validated for FRC and the same method has been used and developed to
confirm the suitability for UHP-FRC material in determining tensile strength and behavior
in post cracking phase.
However, there still exist some potential issue in the DPT method that needs to be
resolved. The circumferential extensometer that is used to determine the total crack
opening displacement in DPT is an expensive instrument. This limits the use of DPT
method in most of the industrial and research laboratories. The measurement of crack
width and inspection of a number of cracks are the important parameter for evaluating the
characteristics of any concrete material. It is time-consuming to measure the crack width
in a test by conventional visual inspection and automated crack width measurement is
indispensable. This research mainly focuses on the deriving a simple formula for estimating
average and maximum crack width using the axial deformation data and optimize the time
taken for each DPT test. The relation would remove the need of using the expensive
circumferential extensometer for the test. Thus, DPT could be used to evaluate and
compare the quality of mixture for FRC and UHP-FRC by using a simple arrangement of
LVDTs.
vi
Table of Contents
Acknowledgements ........................................................................................................ iii
Abstract ......................................................................................................................... iv
List of Illustrations ........................................................................................................... x
Chapter 1 Introduction .................................................................................................... 1
1.1 Background .................................................................................................. 1
1.2 Scope and Objectives ................................................................................... 2
1.3 Thesis Organization ...................................................................................... 3
Chapter 2 Literature Review ........................................................................................... 4
2.1 Overview of FRC .......................................................................................... 4
2.1.1 Effects of Fiber in Concrete ................................................................... 4
2.1.2 Fiber geometry, distribution, and orientation .......................................... 5
2.2 UHP-FRC Definition ...................................................................................... 5
2.3 Compressive Properties of UHP-FRC ........................................................... 7
2.4 Tensile Properties FRC and UHP-FRC ......................................................... 9
2.5 Existing Standard Material Test Method for FRC ......................................... 12
2.5.1 ASTM C496 - 2017: Standard Test Method for Splitting
Tensile Strength of Cylindrical Concrete Specimens ............................ 14
2.5.2 ASTM C1609 - 2012 Standard Test Method for Flexural
Performance of Fiber-Reinforced Concrete (Using Beam
with Third-Point Loading) .................................................................... 15
2.5.3 ASTM C1550 – 2012 Standard Test Method for Flexural
Toughness of Fiber Reinforced Concrete (Using Centrally
Loaded Round Panel) ......................................................................... 20
2.5.4 Uniaxial Direct Tensile Test ................................................................. 23
vii
2.6 Comparison of Existing Test Method ........................................................... 27
2.7 Introduction to Double Punch Test (DPT) .................................................... 28
2.8 Theory of Double Punch Test ...................................................................... 29
2.9 Fracture Mechanics of DPT ......................................................................... 36
2.10 FEM analysis for DPT ................................................................................. 38
2.11 Comparison between DPT and existing test methods. ................................. 42
2.12 Potential issue in DPT ................................................................................. 45
2.13 Research Objectives ................................................................................... 46
Chapter 3 Double Punch Test – Experimental Program ................................................ 47
3.1 Experimental Program Overview ................................................................. 47
Phase 1 ........................................................................................................... 47
Phase 2 ........................................................................................................... 50
3.2 Fiber Type and geometry ............................................................................ 51
3.2.1 Phase 1: SFRC ................................................................................... 51
3.2.2 Phase 2: UHP-FRC ............................................................................. 52
3.3 Mix Design .................................................................................................. 53
3.3.1 SFRC Mix Design ............................................................................... 53
3.3.2 UHP-FRC Mix Design ......................................................................... 54
3.4 Formwork for the specimen ......................................................................... 55
3.5 Mixing of concrete, casting and curing of the specimen ............................... 56
3.6 Specimen Preparation ................................................................................ 59
3.7 Material test and instrumentation ................................................................ 59
3.7.1 Compressive strength test ................................................................... 59
3.7.2 Direct Tensile Test .............................................................................. 64
3.7.3 Double punch test setup ...................................................................... 66
viii
3.8 Test procedure of Double Punch Test ......................................................... 69
Chapter 4 Experimental Results ................................................................................... 71
4.1 General ...................................................................................................... 71
4.2 Double Punch Test with FRC (Phase 1) ...................................................... 71
4.2.1 Different fiber dosage for FRC ............................................................. 72
4.2.2 Determination of relation between deformation and
circumferential strain ........................................................................... 78
4.2.3 Computation of average crack width: ................................................... 83
4.2.4 Verification from measured maximum crack width ............................... 85
4.2.5 Effects of displacement rate ................................................................ 89
4.2.6 Effects of specimen sizes .................................................................... 96
4.2.7 Comparison with Direct Tensile Test .................................................. 102
4.3 Double Punch Test with UHP-FRC (Phase 2) ............................................. 104
4.3.1 Effects of displacement rates and influence of fiber type ..................... 104
4.3.2 Effects of specimen height ................................................................. 110
4.3.3 Determination of relation between deformation and
circumferential strain .......................................................................... 114
4.3.4 Computation of average crack width ................................................... 119
4.3.5 Verification from measured maximum crack width .............................. 121
4.3.6 Comparison with Direct Tensile Test .................................................. 124
4.4 Comparison between Double Punch Test (DPT) and Direct
Tensile Test (DTT) for FRC and UHP-FRC ......................................................... 125
4.5 Comparison between formula in DPT ......................................................... 127
Chapter 5 Summary and conclusion ............................................................................ 130
Recommendation for DPT: .................................................................................. 132

ix
Appendix A Detail calculation and graphs for Phase 1 ................................................ 134
Appendix B Detail calculation and graphs for Phase 2 ................................................ 155
Appendix C ASTM Draft Ballot for Standardization of Double Punch Test .................... 169
References ................................................................................................................. 184
Biographical Information .............................................................................................. 189
x
List of Illustrations
Figure 2-1: Compressive stress-strain of UHPC without fibers (Fehling et.al. 2004) ........ 7
Figure 2-2 Compressive stress-strain curve for UHP-FRC (Parham et. al 2016) ............. 8
Figure 2-3 Stress-strain curve for steel fiber reinforced concrete with various type
of steel fibers (Shah et. al 1978, ACI Committee 544 [1988]) .......................................... 9
Figure 2-4 Idealized tensile response for UHP-FRC (Greybeal 2014) ........................... 10
Figure 2-5: Tensile stress-strain curve of UHP-FRC and multiple cracking
(Wille et. al 2011) ........................................................................................................ 11
Figure 2-6: Tensile stress-strain curve of UHP-FRC (Parham et. al 2016) ..................... 11
Figure 2-7 Split Cylinder Test [ASTM C496] ................................................................. 14
Figure 2-8 Three-Point Loading Test Setup (ASTM C1609) .......................................... 16
Figure 2-9 Typical load vs mid-span deflection relationships for FRC specimen
under third-point loading test (first peak load matching the peak load)
[ASTM 1609-2012] ...................................................................................................... 18
Figure 2-10 Typical load vs mid-span deflection relationships for FRC specimen
under third-point loading test (first peak load lower than the peak load)
[ASTM 1609-2012] ....................................................................................................... 18
Figure 2-11 (a) Test setup and (b) Specimen (ASTM C1550 - 2012) ............................. 20
Figure 2-12 (a) Specimen (b) Setup (d) Location of major cracks for ASTM C1550
Round Panel Test (Chao 2011) ................................................................................... 22
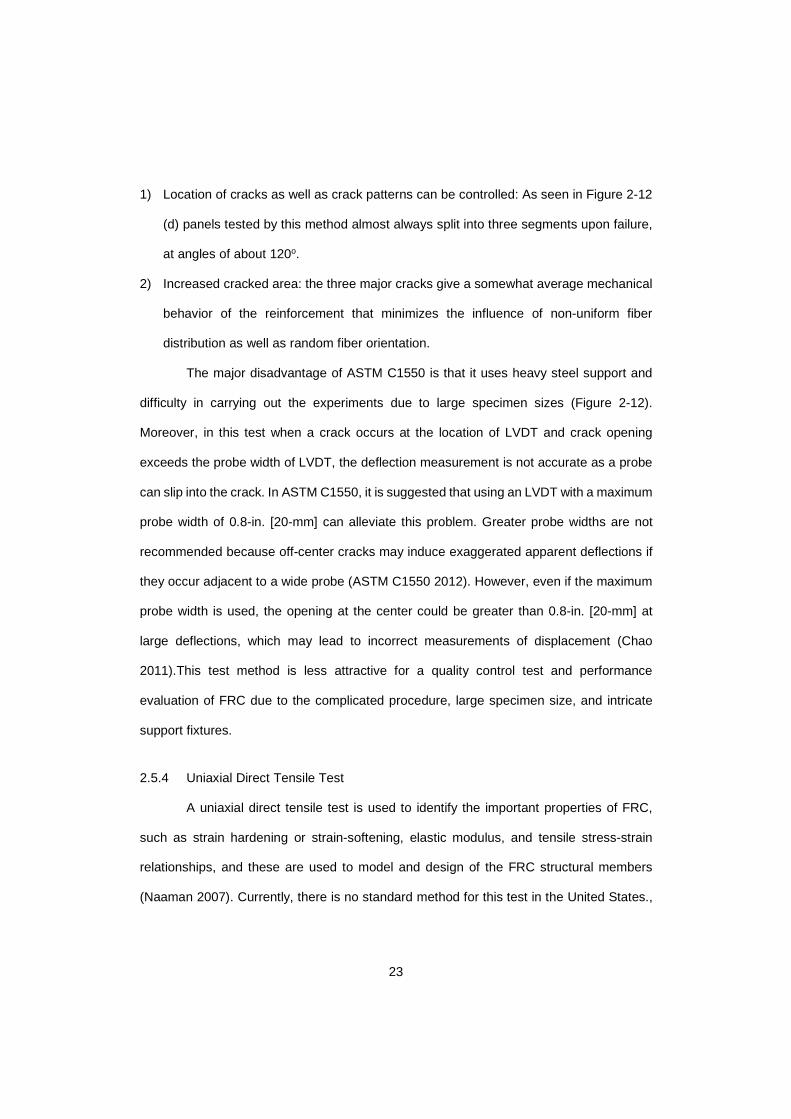
Figure 2-13 Uniaxial Direct Tensile Test ....................................................................... 25
Figure 2-14 Formation of crack beyond gauge length and at gripping positon ............... 26
Figure 2-15 Double punch test layout ........................................................................... 29
Figure 2-16 Bearing Capacity of Double Punch Test (Chen 1970) ................................ 30
xi
Figure 2-17 (a) Front view of specimen after cracking (b) Top view of specimen
after cracking (Blanco et. al 2014) ............................................................................... 33
Figure 2-18 (a) Details of forces at conical block (b) balance of forces at conical
block (c) details of forces at the specimen (d) balance of forces at the specimen. ......... 34
Figure 2-19 Simplified σ-ε diagram (Blanco et.al 2014) ................................................. 36
Figure 2-20 (a) DPT with three radial fracture plane (b) DPT with four radial
fracture planes (Pros et. al 2011) ................................................................................. 38
Figure 2-21 Plan view for principal stress in tension (a) at mid height (b) 1.5 inch
above mid-height (Karki 2011) ..................................................................................... 39
Figure 2-22 Elevation view for principal stresses in tension (a) at centerline (b) 1.5
inch from center along height (Karki 2011) .................................................................. 39
Figure 2-23 Distribution of stress at various distance from centerline along height
of specimen (Karki 2011) ............................................................................................ 40
Figure 2-24 Distribution of stress at various distance from top of specimen along
the diameter of cylinder ................................................................................................ 41
Figure 2-25 Damage profile for DPT on plain concrete (Pros et. al 2011)
(a) Top view (b) Bottom view (c) Inside view ................................................................. 42
Figure 3-1: Experimental program ................................................................................ 47
Figure 3-2: Experimental program for Phase 1 (FRC) ................................................... 48
Figure 3-3: Experimental program for Phase 2 (UHP-FRC) .......................................... 50
Figure 3-4 Dramix® 5D steel fibers............................................................................... 52
Figure 3-5 (a) Micro-straight steel fibers (b) Polyethylene (PE) fibers ............................ 52
Figure 3-6: Mold for DPT specimens (a) 6 x 12 cylinder (b) 8 x 16 cylinder ................... 55
Figure 3-7 Formwork for Direct Tensile Testing specimen ............................................ 55
Figure 3-8: Concrete mixing using (a) drum mixer (b) pan mixer ................................... 56
xii
Figure 3-9: Mixer used for UHP-FRC (a) Rotating pan mixer (b) Self-loading
concrete mixer ............................................................................................................. 57
Figure 3-10: DPT cylinders after casting (a) 6in. x 12in. cylinder
(b) 8in. x 16in. cylinder ................................................................................................. 58
Figure 3-11: DTT specimen (a) During casting (b) After casting .................................... 58
Figure 3-12 Preparation of DPT specimen using a concrete saw .................................. 59
Figure 3-13: Preparation of 2.78 in. cube for UHP-FRC mix .......................................... 60
Figure 3-14 Compressive strength test of UHP-FRC (2.78 in. cube) ............................. 61
Figure 3-15 (a) 4 x 8 in. cylinder after testing for FRC (b) Typical 2.78 in.
cube after testing for UHP-FRC (steel fiber) (c) 2.78 in. cube after testing for
UHP-FRC (PE fiber) ..................................................................................................... 61
Figure 3-16 Flow table apparatus in accordance to ASTM C230 (2014) ....................... 62
Figure 3-17 Determination of spread value (flow diameter) in accordance to
ASTM C230 (2014) (a) UHP-FRC with steel fiber (b) UHP-FRC with PE fiber ............... 62
Figure 3-18: Compressive stress-strain curve for UHP-FRC
(at 14 days from Trial mix) ............................................................................................ 63
Figure 3-19: Compressive stress-strain curve for UHP-FRC
(after 28 days from DPT casting) .................................................................................. 63
Figure 3-20: Dimension of DTT specimen..................................................................... 64
Figure 3-21 Direct tensile test (a) UHP-FRC with steel fibers (b) UHP-FRC
with PE fibers ............................................................................................................... 65
Figure 3-22: Crack location in direct tensile test ............................................................ 65
Figure 3-23: Specimen after testing (a) FRC (b) UHP-FRC ........................................... 66
Figure 3-24: DPT test setup for (a) SFRC (b) UHP-FRC ............................................... 67
xiii
Figure 3-25: Dimensions of centering disk and steel punch for 6 inch
diameter DPT. .............................................................................................................. 68
Figure 3-26 (a) Centering disk on specimen (b) centering disk and two punches. ......... 68
Figure 3-27: DPT preparation and testing process ........................................................ 70
Figure 4-1 Load vs deformation for different fiber volume fraction ................................. 74
Figure 4-2 Tensile stress versus circumferential strain for different fiber
volume fraction ............................................................................................................ 74
Figure 4-3: (a) A bottom sample (Set 4) (b) A top sample (Set 1) .................................. 75
Figure 4-4: (a) Crack pattern (Set 2) (b) Crack along the length (Set 4)......................... 76
Figure 4-5: Bottom and Top specimen (Set 4) .............................................................. 76
Figure 4-6: Load vs. deformation for bottom samples with 0.35% Vf (Set 1) .................. 77
Figure 4-7: Load vs. deformation for top samples with 0.35% Vf (Set 1) ........................ 77
Figure 4-8 (a) Typical load vs deformation for FRC (b) Typical tensile
stress vs circumferential strain for FRC ........................................................................ 78
Figure 4-9: Total Deformation vs circumferential strain ................................................. 79
Figure 4-10: Post-peak Deformation vs circumferential strain (after peak only) ............. 80
Figure 4-11: δ vs ε (before and after peak) ................................................................... 81
Figure 4-12 δP vs εP (after peak only) ............................................................................ 81
Figure 4-13: Distribution of values for different fiber dosage ......................................... 83
Figure 4-14: Post-peak deformation vs maximum crack width (48 samples) .................. 89
Figure 4-15 Load vs deformation for comparing various displacement
rate (0.55% Vf) ............................................................................................................. 91
Figure 4-16 Tensile stress vs circumferential strain for comparing various
displacement rate (0.55% Vf) ....................................................................................... 92

xiv
Figure 4-17 Load vs deformation with Vf of 0.35% for 0.02 in/min and
0.04 in/min rates ......................................................................................................... 94
Figure 4-18 Tensile stress vs circumferential strain with Vf of 0.35% for 0.02
in/min and 0.04 in/min rates ........................................................................................ 95
Figure 4-19: (a) Crack pattern (b) Specimen (Set 5) ..................................................... 95
Figure 4-20 Load vs deformation for comparing specimen height (0.55% Vf) ................ 99
Figure 4-21 Tensile stress vs circumferential strain for comparing specimen
height (0.55% Vf) ......................................................................................................... 99
Figure 4-22 Load vs deformation for comparing specimen diameter
(0.55% Vf) ................................................................................................................... 100
Figure 4-23 Tensile stress vs circumferential strain for comparing specimen
diameter (0.55% Vf).................................................................................................... 100
Figure 4-24 Plan view (a) 6 x 6 in. bottom (b) 6 x 4 in. bottom (c) 8 x 8 in.
bottom ........................................................................................................................ 101
Figure 4-25 Side view (a) 6 x 6 in. bottom (b) 6 x 4 in. bottom (c) 8 x 8 in.
bottom ........................................................................................................................ 102
Figure 4-26: 6 x 6 in., 6 x 4in. and 8x 8 in. specimen .................................................. 102
Figure 4-27 Comparison between double punch test and direct tensile test
for FRC ....................................................................................................................... 103
Figure 4-28: Plan view (a) 6x6 in. with steel fiber (b) 6x6 in. with PE fiber .................... 107
Figure 4-29: Side view (a) 6x6 in. with steel fiber (b) 6x6 in. with PE fiber .................... 107
Figure 4-30: Crack pattern (a) UHP-FRC with steel fibers (b) UHP-FRC
with PE fibers .............................................................................................................. 108
Figure 4-31 Load vs deformation for UHP-FRC with 3% Steel and 0.75%
PE fiber and 6x6 specimen.......................................................................................... 109

xv
Figure 4-32 Tensile stress vs circumferential strain for UHP-FRC with 3%
Steel and 0.75% PE fiber and 6x6 specimen ............................................................... 109
Figure 4-33 Tested specimen (UHP-FRC) ................................................................... 110
Figure 4-34: Load vs deformation for UHP-FRC with 3% Steel and 0.75%
PE fiber for 6x6 and 6x4 specimen .............................................................................. 113
Figure 4-35: Tensile stress vs circumferential strain for UHP-FRC with 3%
Steel and 0.75% PE fiber for 6x6 and 6x4 specimen ................................................... 113
Figure 4-36: Plan view (a) 6 x 4 in. (UHP-FRC with steel fibers (b) 6 x 4 in.
(UHP-FRC with PE fibers) ........................................................................................... 114
Figure 4-37: Side view (a) 6 x 4 in. (UHP-FRC with steel fibers (b) 6 x 4 in.
(UHP-FRC with PE fibers) ........................................................................................... 114
Figure 4-38 Typical load vs deformation for UHP-FRC (b) Typical tensile stress vs
circumferential strain for FRC ...................................................................................... 115
Figure 4-39 Typical tensile stress vs circumferential strain for UHP-FRC ..................... 115
Figure 4-40: Total Deformation vs circumferential strain (UHP-FRC) ........................... 116
Figure 4-41 Post-peak Deformation vs circumferential strain for UHP-FRC
(after peak only) ......................................................................................................... 116
Figure 4-42: Post-peak Deformation vs circumferential strain for UHP-FRC
with steel and PE fiber (after peak only) ..................................................................... 117
Figure 4-43: Determination of α values for UHP-FRC ................................................... 119
Figure 4-44: Comparison between DPT and DTT for UHP-FRC................................... 124
Figure 4-45: Comparison between peak tensile strength obtained from
DPT and DTT .............................................................................................................. 125
Figure 4-46: Tensile stress vs. circumferential strain from DPT for FRC
and UHP-FRC ............................................................................................................. 126
xvi
Figure 4-47: Comparison between available expression in the literature ...................... 128
Figure 4-48: Tensile stress vs. circumferential strain (UHP-FRC with steel
fibers) with different stress formulas ............................................................................ 128
Figure 4-49: Tensile stress vs. circumferential strain (UHP-FRC with PE
fibers) with different stress formulas ............................................................................ 129
Figure A-1: Load vs. Deformation - Set 1 (With 0.35% Bottom and Top Cylinders) ....... 136
Figure A-2:Tensile Stress vs. Circumferential Strain – Set 1 (With 0.35% Bottom
and Top Cylinders) ...................................................................................................... 136
Figure A-3: Post-peak deformation vs. Circumferential Strain – Set 1 (With
0.35% Bottom and Top Cylinders) ............................................................................... 137
Figure A-4: Load vs. Deformation – Set 2 (With 0.45% Bottom and Top
Cylinders) .................................................................................................................. 139
Figure A-5:Tensile Stress vs. Circumferential Strain – Set 2 (With 0.45% Bottom
and Top Cylinders) ..................................................................................................... 139
Figure A-6: Post-peak deformation vs. Circumferential Strain – Set 2 (With
0.45% Bottom and Top Cylinders) ............................................................................... 140
Figure A-7: Load vs. Deformation – Set 3 (With 0.55% Bottom and Top
Cylinders) .................................................................................................................. 142
Figure A-8:Tensile Stress vs. Circumferential Strain – Set 3 (With 0.55% Bottom
and Top Cylinders) ...................................................................................................... 142
Figure A-9: Post-peak deformation vs. Circumferential Strain – Set 3 (With
0.55% Bottom and Top Cylinders) ............................................................................... 143
Figure A-10: Load vs. Deformation – Set 4 (With 0.75% Bottom and
Top Cylinders) ............................................................................................................ 145
xvii
Figure A-11:Tensile Stress vs. Circumferential Strain – Set 4 (With 0.75%
Bottom and Top Cylinders) ......................................................................................... 145
Figure A-12: Post-peak deformation vs. Circumferential Strain – Set 4 (With
0.75% Bottom and Top Cylinders) ............................................................................... 146
Figure A-13: Load vs. Deformation – Set 6 (With 0.35% Bottom and
Top Cylinders) ............................................................................................................ 148
Figure A-14:Tensile Stress vs. Circumferential Strain – Set 6 (With 0.35%
Bottom and Top Cylinders) .......................................................................................... 148
Figure A-15: Load vs. Deformation – Set 7 (With 0.55% Bottom and Top
Cylinders and 6x6 in.) ................................................................................................. 150
Figure A-16:Tensile Stress vs. Circumferential Strain – Set 7 (With 0.55%
Bottom and Top Cylinders and 6x6 in.) ........................................................................ 150
Figure A-17: Load vs. Deformation – Set 8 (With 0.55% Bottom and Top
Cylinders and 6x4 in.) ................................................................................................. 152
Figure A-18:Tensile Stress vs. Circumferential Strain – Set 8 (With 0.55%
Bottom and Top Cylinders and 6x4 in.) ........................................................................ 152
Figure A-19: Load vs. Deformation- Set 9 (With 0.55% Bottom and Top
Cylinders and 8x8 in.) ................................................................................................. 154
Figure A-20:Tensile Stress vs. Circumferential Strain – Set 9 (With 0.55%
Bottom and Top Cylinders and 8x8 in.) ........................................................................ 154
Figure B-1: Load vs. Deformation – Set 10 (With 3% Steel fibers
Bottom and Top Cylinders) .......................................................................................... 157
Figure B-2:Tensile Stress vs. Circumferential Strain – Set 10 (With 3%
steel fibers Bottom and Top Cylinders) ........................................................................ 157
xviii
Figure B-3: Load vs. Deformation – Set 11 (With 3% Steel fibers Bottom
and Top Cylinders) ...................................................................................................... 159
Figure B-4:Tensile Stress vs. Circumferential Strain – Set 11 (With 3% steel
fibers Bottom and Top Cylinders) ............................................................................... 159
Figure B-5: Load vs. Deformation – Set 12 (With 3% Steel fibers Bottom and
Top Cylinders) ............................................................................................................ 161
Figure B-6:Tensile Stress vs. Circumferential Strain and Post-peak deformation
vs. Circumferential Strain – Set 12 (With 3% steel fibers Bottom and
Top Cylinders) ........................................................................................................... 161
Figure B-7: Load vs. Deformation – Set 13 (With 0.75% PE fibers Bottom
and Top Cylinders) ...................................................................................................... 163
Figure B-8:Tensile Stress vs. Circumferential Strain – Set 13 (With 0.75%
PE fibers Bottom and Top Cylinders) ........................................................................... 163
Figure B-9: Post-peak deformation vs. Circumferential Strain – Set 13
(With 0.75% PE fiber and 6x6 in.) ................................................................................ 164
Figure B-10: Load vs. Deformation – Set 14 (With 3% Steel fibers 6x4 in.
Bottom, Middle and Top Cylinders) .............................................................................. 166
Figure B-11:Tensile Stress vs. Circumferential Strain – Set 14 (With 3%
steel fibers 6 x4 in. Bottom, Middle and Top Cylinders) ................................................ 166
Figure B-12: Load vs. Deformation – Set 15 (With 0.75% PE fibers 6x4 in.
Bottom, Middle and Top Cylinders) .............................................................................. 168
Figure B-13:Tensile Stress vs. Circumferential Strain – Set 15 (With 0.75% PE
fibers 6x4 in. Bottom, Middle and Top Cylinders) ........................................................ 168
xix
List of Tables
Table 2-1: Comparison of typical conventional concrete and UHP-FRC ........................ 12
Table 2-2 Net Deflection testing rates (ASTM 1609 - 2012) .......................................... 16
Table 2-3 Comparison between existing standard test methods (Woods 2012) ............. 27
Table 2-4 Parameters for simplified model using DPT (Blanco et. al 2014) ................... 35
Table 2-5 Comparison between existing standard test methods with DPT
(Woods 2012) .............................................................................................................. 44
Table 2-6 Simplicity, Reliability, and Reproducibility of Current FRC Testing
Procedures vs. Double-Punch Test (Woods 2012) ...................................................... 45
Table 3-1 Summary of Specimens for the experimental program for Phase 1. .............. 49
Table 3-2 Experimental program details for Phase 2. .................................................... 51
Table 3-3: Fiber type and geometry .............................................................................. 53
Table 3-4: Mix Proportion by weight for SFRC .............................................................. 53
Table 3-5 : Mix Proportions by weight for UHP-FRC (developed at UTA) ...................... 54
Table 3-6: Test results from direct tensile test ............................................................... 64
Table 4-1: Test parameter for FRC with various fiber dosages ...................................... 72
Table 4-2: Comparison of peak load, peak tensile strength and residual tensile
strength at 0.3%, 1%, 2.5% and 5% circumferential strain for various fiber volume
fraction ......................................................................................................................... 73
Table 4-3 Comparison of COV for Set 1, 2, 3 and 4 (including top and bottom
samples). ..................................................................................................................... 75
Table 4-4: Determination of α ....................................................................................... 82
Table 4-5: Percentage of samples with respective crack number .................................. 85
Table 4-6: Measurement of crack width during experiments for one randomly
selected sample from sets of 0.35% and 0.45% Vf ........................................................ 86

xx
Table 4-7: Measurement of crack width during experiments for one selected
sample from sets of 0.55% and 0.75% Vf ..................................................................... 86
Table 4-8: Relation between deformation and measured maximum crack width
(48 samples) ................................................................................................................ 87
Table 4-9: Average values of coefficient λ and β ........................................................... 87
Table 4-10 Comparison for various displacement rate with 0.55% Vf ............................ 91
Table 4-11 : Test parameter for FRC with 0.35% fiber volume fraction for rate
0.02 in./min and 0.04 in./min ........................................................................................ 92
Table 4-12 Comparison of peak load, peak tensile strength and residual tensile
strength with 0.35% fiber volume fraction for rate 0.02 in./min and 0.04 in./min ............ 93
Table 4-13 Comparison of COV for Set 1 and Set 6. .................................................... 94
Table 4-14 Ratio of b/a for 6 in. and 8 in. specimen ...................................................... 96
Table 4-15: Test parameter for FRC with different specimen size ................................. 97
Table 4-16 Comparison of peak load, peak tensile strength and residual tensile
strength at 0.3% , 1%, 2.5% and 5% circumferential strain for 6 x 6 , 6 x 4 and
8 x 8 specimen. ............................................................................................................ 98
Table 4-17: Comparison of COV for Set 7, 8 and 9 ...................................................... 101
Table 4-18 Comparison between double punch test (DPT) and direct tensile test
(DTT) ......................................................................................................................... 103
Table 4-19 Comparison of testing time for UHP-FRC................................................... 105
Table 4-20: Test parameter for UHP-FRC with different fiber type ............................... 105
Table 4-21: Comparison of peak load, peak tensile strength and residual tensile
strength at 0.3%, 1%, 2.5% and 5% circumferential strain for set 10, set 11,
set 12 and set 13. ....................................................................................................... 106
Table 4-22 Comparison of COV for set 10, set 11, set 12 and set 13. .......................... 106
xxi
Table 4-23 Test parameter for UHP-FRC with different specimen size
and fiber type .............................................................................................................. 111
Table 4-24: Comparison of peak load, peak tensile strength and residual tensile
strength at 0.3% , 1%, 2.5% and 5% circumferential strain for UHP-FRC with
6 x 6 and 6 x 4 specimen. ........................................................................................... 111
Table 4-25 Comparison of COV for set 11, set 12, set 13 and set 14. .......................... 112
Table 4-26: Determination of α for UHP-FRC .............................................................. 118
Table 4-27: Percentage of samples with respective crack number
(UHP-FRC with steel and PE fiber) ............................................................................. 121
Table 4-28: Measurement of crack width during experiments for one selected
sample from sets of UHP-FRC with steel and PE fibers. .............................................. 122
Table 4-29: Relation between deformation and measured maximum
crack width .................................................................................................................. 123
Table 4-30: Average values of coefficient λ and β for the 6x6 specimen and
rate 0.04 in./min. ........................................................................................................ 123
Table 4-31 Comparison between double punch test (DPT) and direct tensile
test (DTT) for UHP-FRC ............................................................................................. 124
Table 4-32: Difference in peak tensile strength from DPT and DTT .............................. 126
Table 4-33 Expression for tensile strength using DPT .................................................. 127
Table A-1 Calculation of Coefficient of Variation for set 1 (0.35% Vf)............................ 135
Table A-2 Calculation of Coefficient of Variation for set 2 (0.45% Vf)............................ 138
Table A-3 Calculation of Coefficient of Variation for set 3 (0.55% Vf)............................ 141
Table A-4 Calculation of Coefficient of Variation for set 4 (0.75% Vf) ........................... 144
Table A-5 Calculation of Coefficient of Variation for set 6 (0.35% Vf and
0.04 in./min displacement rate) ................................................................................... 147
xxii
Table A-6 Calculation of Coefficient of Variation for set 7 (0.55% Vf, 0.04 in./min
displacement rate and 6x6 in. size) ............................................................................. 149
Table A-7 Calculation of Coefficient of Variation for set 8 (0.55% Vf, 0.04 in./min
displacement rate and 6x4 in. size) ............................................................................. 151
Table A-8 Calculation of Coefficient of Variation for set 9 (0.55% Vf, 0.04 in./min
displacement rate and 8x8 in. size) ............................................................................. 153
Table B-1 Calculation of Coefficient of Variation for set 10 (UHP-FRC with 3%
steel fiber and 6 x 6 in. size) ........................................................................................ 156
Table B-2 Calculation of Coefficient of Variation for set 11 (UHP-FRC with 3%
steel fiber and 6 x 6 in. size) ........................................................................................ 158
Table B-3 Calculation of Coefficient of Variation for set 12 (UHP-FRC with 3%
steel fiber, 0.04 in./min and 6 x 6 in. size) ................................................................... 160
Table B-4 Calculation of Coefficient of Variation for set 13 ((UHP-FRC with 0.75%
PE fiber, 0.04 in./min and 6 x 6 in. size) ...................................................................... 162
Table B-5 Calculation of Coefficient of Variation for set 14 (UHP-FRC with 3%
steel fiber and 6 x 4 in. size) ....................................................................................... 165
Table B-6: Calculation of Coefficient of Variation for set 15 (UHP-FRC with 0.75%
PE fiber and 6 x 4 in. size).......................................................................................... 167
1
Chapter 1
Introduction
1.1 Background
Several methods have been developed to determine the tensile strength of
concrete and analyze the post-cracking stage of Fiber Reinforced Concrete (FRC). As of
now, there is no standard method to determine tensile strength and characterization of the
tensile behavior of Ultra-High-Performance Fiber Reinforced Concrete (UHP-FRC). The
various standard methods for the tensile test such as the split cylinder, round panel, third
point bending and the customized uniaxial tensile test, are being used for FRC. Non-
standard tests for tensile strength of UHP-FRC such as direct tensile test (DTT), notched
cylinder or dog-bone shaped specimen, and modified pull off test are being used in the
research fields and commercial industry. Among these, the uniaxial direct tension method
can more realistically predict the tensile strength and ductile behavior of UHP-FRC.
However, there are some limitations and difficulties in performing direct tension test with
dog bone specimens which include difficulty in gripping the specimen, complicated test
setup, a localized crack formed beyond the gauge length and the inconsistency in crack
formation which causes the higher variability in post cracking stages. Moreover, in DTT
with notches, the fractures do not always occur at the notch and cannot accurately predict
the tensile strength due to local stress concentration caused by the notch.
UHP-FRC is an extrinsic concrete material, the material properties depend on the
geometry of its components, methods of casting and alignment, type, distribution and
orientation of fiber. Considering these factors, a new easy and candid method is essential
for systematic characterization of tensile behavior that is suitable for both SFRC and UHP-
FRC. The double punch test has proven to be simple, effective and reliable to determine
the tensile strength of SFRC which was originally developed by Chen in 1970. In this

2
research, the application of double punch test is validated for SFRC and the same method
has been used and developed to confirm the suitability for UHP-FRC material in
determining tensile strength and behavior in post cracking phase.
Circumferential extensometer, an expensive equipment, limits the application of
double punch test as it is not common in most of the laboratories. To make the test simpler,
an alternative measuring procedure was proposed by Malatesta et.al (2012) by determining
the theoretical relationship between axial displacement and total crack opening
displacement (TCOD) to evaluate the FRC toughness. However, the correlations proposed
are only valid for axial displacement ranging from 1 mm to 4 mm and are empirical. Blanco
et. al (2014) proposed another formulation to estimate the stress and associated strain
using physical mechanism involved in the tensile failure. The analytical formulation requires
a reliable value of kinetic friction coefficient and the strain values are predefined. A simpler
form of the relationship between axial displacement and strain is of prime importance.
1.2 Scope and Objectives
Double-Punch Test characterizes the elastic and inelastic behavior (toughness)
of fiber-reinforced concrete composites better than current testing procedures for FRC. It
has been proved that this method is very suitable for the systematic control of the tensile
behavior of FRC (Mollins et.al. 2009, Chao et. al 2011, Pujadas et.al. 2012, Blanco et.al
2014). The main objectives of this study are:
1. To develop simple and reliable test protocols by comparing the influence of fiber
volume fractions for FRC and UHP-FRC.
2. To assess the suitability of DPT method for UHP-FRC material in determining tensile
strength and behavior in post cracking phase.
3
3. To determine the relation between axial deformation and circumferential strain using
double punch test method applicable to FRC and UHP-FRC.
4. To derive a simple formula to estimate the average crack width.
1.3 Thesis Organization
The thesis is divided into six chapters that are summarized below
Chapter 1 provides an introduction, presents the research scope and objectives of
the study.
Chapter 2 presents the literature review on the importance of tensile testing and
the different existing standard tensile testing methods for FRC. This chapter also describes
the details of double punch method that includes theory, fracture mechanics, and test
procedure.
Chapter 3 mainly focuses on the details of the experiment for developing a simple
and reliable test method for FRC and UHP-FRC. This chapter also describes the mix
design used, preparation of specimen, instrumentation, test setup and the potential issue
of the DPT method.
Chapter 4 summarizes the test results obtained from the study. The results have
been used to formulate an equation to calculate the average crack width.
Chapter 5 includes the summary of this experimental investigation and conclusion
are presented in this chapter.

4
Chapter 2
Literature Review
2.1 Overview of FRC
The plain concrete is relatively brittle and has tensile strength typically only about
one-tenth of its compressive strength. It is alluring to reinforce the concrete with randomly
distributed small fibers instead of normally reinforced with steel reinforcing bars for different
applications. However, fiber reinforcement is not a substitute for conventional steel
reinforcement as fibers and reinforcing bars play different roles in concrete. Reinforcing
bars are used to increase the load-bearing capacity of structural concrete elements while
fibers are more effective for crack control. The various types of fiber are used in the
commercial industry such as steel, glass, synthetic, polypropylene, asbestos, organic and
carbon. The steel fibers are the most commonly used for various structural and
nonstructural applications. It has been observed that the steel fibers can improve the
structural strength, reduce the reinforcement requirements and can improve explosive
spalling of concrete.
2.1.1 Effects of Fiber in Concrete
The fibers are mainly used in concrete to control crack and shrinkage that
enhances the durability of concrete. They are also used to increase the energy absorption
capacity (toughness) of the material, and also increase the tensile and flexural strength of
concrete. There is considerable improvement in the mechanical properties of the concrete
mix in terms of post-cracking strength, toughness, and ductility compared to plain concrete
due to the addition of steel fibers.
5
2.1.2 Fiber geometry, distribution, and orientation
The geometry, type, and distribution are the key parameters for the evaluation of
performance and efficiency of FRC. The efficiency of fiber reinforcement is based on the
enhancement of strength and toughness of composite matrix. The effects depend upon the
fiber length, the orientation of fibers and fiber-matrix bond strength. It is assumed that the
fibers are uniformly distributed throughout the concrete matrix and are randomly oriented.
The orientation of fiber relative to the plane of a crack in concrete influences the reinforcing
capacity of the fiber.
2.2 UHP-FRC Definition
Ultra-high performance fiber-reinforced concrete (UHP-FRC) is an advanced
reinforced cementitious material, with improved mechanical properties, fractural
toughness, and durability properties compared to normal or high-performance concrete.
According to Rossi (2000, 2008), UHPC can be defined as a concrete or cementitious
composite with a relatively high binder ratio, a water to the cementitious ratio (w/c) less
than 0.2, and compressive strength of more than 21.8 ksi (150 MPa). The ACI Concrete
Terminology defines UHPC as “concrete that has a minimum specified the compressive
strength of 22 ksi (150 MPa) with specified durability, tensile ductility, and toughness
requirements; fibers are generally included to achieve specified requirements” (ACI
Committee 239).
According to the French Recommendations on UHP-FRC (AFGC 2013), UHP-
FRC is a material with a cement matrix having
o A characteristic compressive strength more than 21.8 ksi (150 MPa) and
a maximum of 36.3 ksi (250 Mpa).
6
o Sufficient fiber content to achieve ductile behavior under tension, with high
post-cracking tensile strength.
o Highbinder content which decreases capillary porosity that improves the
durability of the fibers inside UHP-FRC.
The main characteristics of UHP-FRC are achieved through the following three
principles (Richard and Cheyrezy 1995):
i. Homogeneity enhancement by eliminating coarse aggregates in the matrix,
ii. Density enhancement by optimizing the packing density of the matrix. This is
achieved by optimizing gradation and mix proportions between the main matrix
constituents.
iii. Ductility enhancement by the introduction of fibers. As the matrix is very brittle,
fiber reinforcement is added to obtain elastic-plastic or strain-hardening behavior
in tension.
Typically, UHP-FRC has fiber contents of more than 2-3 % by volume. The
maximum fiber content is a function of the fiber aspect ratio and fiber shape as well as
production issues such as workability.
The UHP-FRC mixture design used in this research is a proprietary product
developed at the University of Texas at Arlington (Aghdasi et al., 2015). The UHP-FRC mix
design was developed using a dense particle-packing concept without any special material,
mixing, or treatment and has a compressive strength of 25-30 ksi (207 MPa). All the
materials used are locally available in the U.S. market. The research has proven a much
higher strength and ductility than conventional concrete or ultra-high-performance
concrete.
7
2.3 Compressive Properties of UHP-FRC
UHPC without fibers: Unlike conventional concrete and high-performance
concrete, UHPC does not have a distinctive mix proportion so the mechanical properties
of UHPC depend on the composition of the mix. The increase in compressive strength can
be attributed to selection of specific components and dense particle packing concept.
Typically, UHPC mix without fibers has a characteristic compressive strength of higher than
22 ksi (150 MPa), with a high modulus of elasticity in the range of 6,500 ksi to 8,000 ksi
(45 GPa to 55 GPa) and exhibiting extremely brittle failure after peak strength. Due to the
explosive failure after peak compressive strength, the descending curve cannot be
recorded. It has been observed with the increase in compressive strength in UHPC,
brittleness in UHPC increases as well. This has already been experimental observed in
conventional and high-strength concretes. The higher modulus of elasticity of UHPC is due
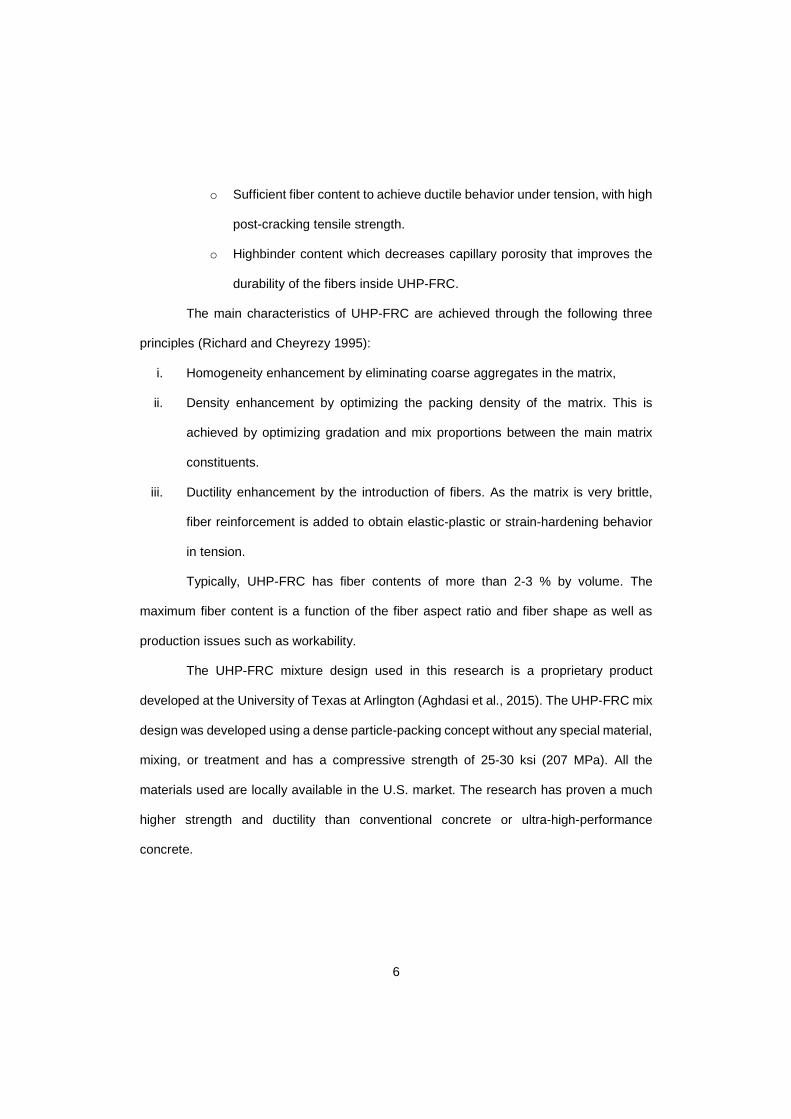
to increased density of the hardened cement paste. Figure 2-1 shows the compressive
stress-strain curve of UHPC without fibers. (Fehling et.al 2004)
Figure 2-1: Compressive stress-strain of UHPC without fibers (Fehling et.al. 2004)
UHPC with fibers: Addition of fibers to the matrix decreases the brittleness and
increases the maximum useable compressive strain. Addition of fibers slightly increases
the compressive strength. With the addition of fibers up to 4% by volume fraction
8
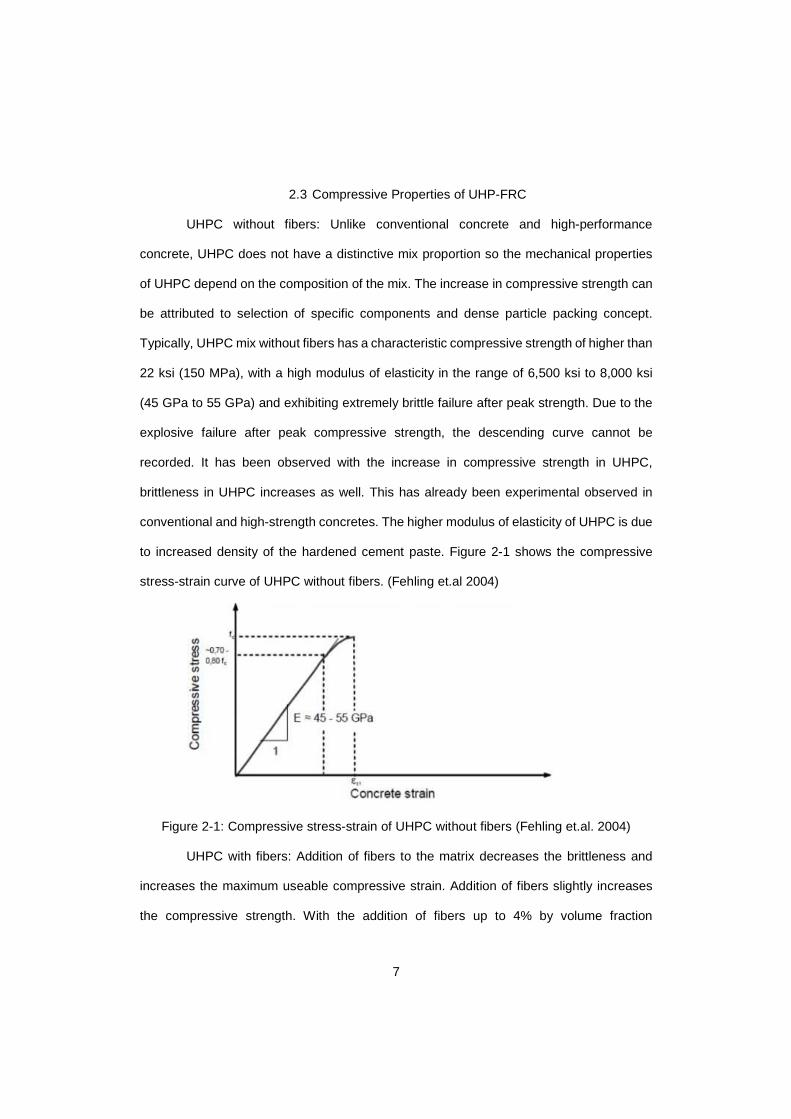
compressive strength increased by 5 – 10% [Nielson, 1995 and Behloul, 1996]. Compared
to UHPC without fibers, a matrix with fibers have more noticeable non-linear behavior
before the peak compressive strength. Compressive stress-strain relations presented by
different researchers in Figure 2-2 has shown that the compressive strength is attained at
a compressive strain of 0.35 – 0.5%. Whereas mix presented by Parham et al., 2016
reached an ultimate compressive strength at a strain range of approximately 1.2 – 1.4%.
Post-peak behavior is affected by several reasons attributing to fiber content, fiber type
and distribution and size of the specimen. Figure 2-2 shows compressive stress-strain
behavior of different UHP-FRC mixes and mix developed at UTA research (Parham et al.,
2016).
0 1 2 3 40
5
10
15
20
25
30
0
40
80
120
160
200
Compressive Strain (%)
Co
mpr
essi
ve S
tres
s, k
si
Co
mpr
essi
ve S
tres
s, M
Pa
7-day14-day24-day28-day28-day 6-month
2.78 in.
2.7
8 in
.
Small-Scale Batch (0.09 Cubic Feet)
Large-Scale Casting (22 Cubic Feet)
• 1 in. = 25.4 mm• 1 Cubic Feet = 0.0283 Cubic Meter• Each curve is based on average of two 2.78-in.-cubes• 24-day was when the full-scale column was tested
Figure 2-2 Compressive stress-strain curve for UHP-FRC (Parham et. al 2016)
9
2.4 Tensile Properties FRC and UHP-FRC
The tensile properties of concrete are an important parameter for understanding
the behavior of the concrete member. These properties are utilized in analysis and design
of structural member. It is generally known that conventional concrete is weak in tension,
and the tensile strength of conventional concrete is generally about 1/10 to 1/12 of their
compressive strength. Hence, the tensile strength of conventional concrete is considerably
influenced by the fracture strength of the matrix. It is very difficult to assess the tensile
behavior of FRC as standard test methods are not available to date and in order to evaluate
the fiber distribution in real structures, sufficiently large specimen should be assessed.
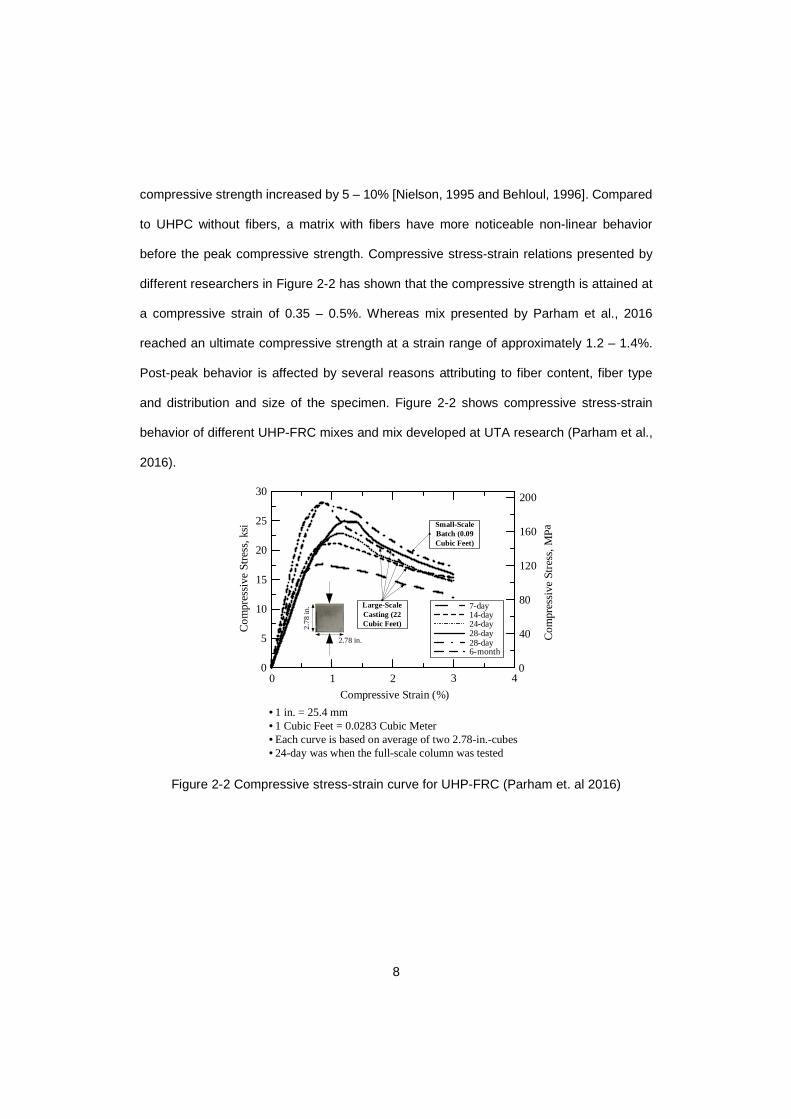
From the Direct Tensile Test (DTT), the results obtained are scattered and it is difficult to
grip the large specimen. Figure 2-3 shows an example of a stress-strain curve for steel
fiber reinforced concrete with a straight, hooked and enlarged type of steel fibers resulted
from the Direct Tensile Test (Shah et.al. 1978, ACI Committee 544 [1988]).
Figure 2-3 Stress-strain curve for steel fiber reinforced concrete with various type of steel
fibers (Shah et. al 1978, ACI Committee 544 [1988])
Since the UHP-FRC mixes have very high compressive strengths compared to
conventional concrete (nearly 5 times), the tensile strength of UHP-FRC matrix is also
presumed to be higher. The addition of fibers in UHP-FRC mix helps in redistribution of
tensile stresses after the initial cracking, resulting in strain hardening after the first cracking.
10
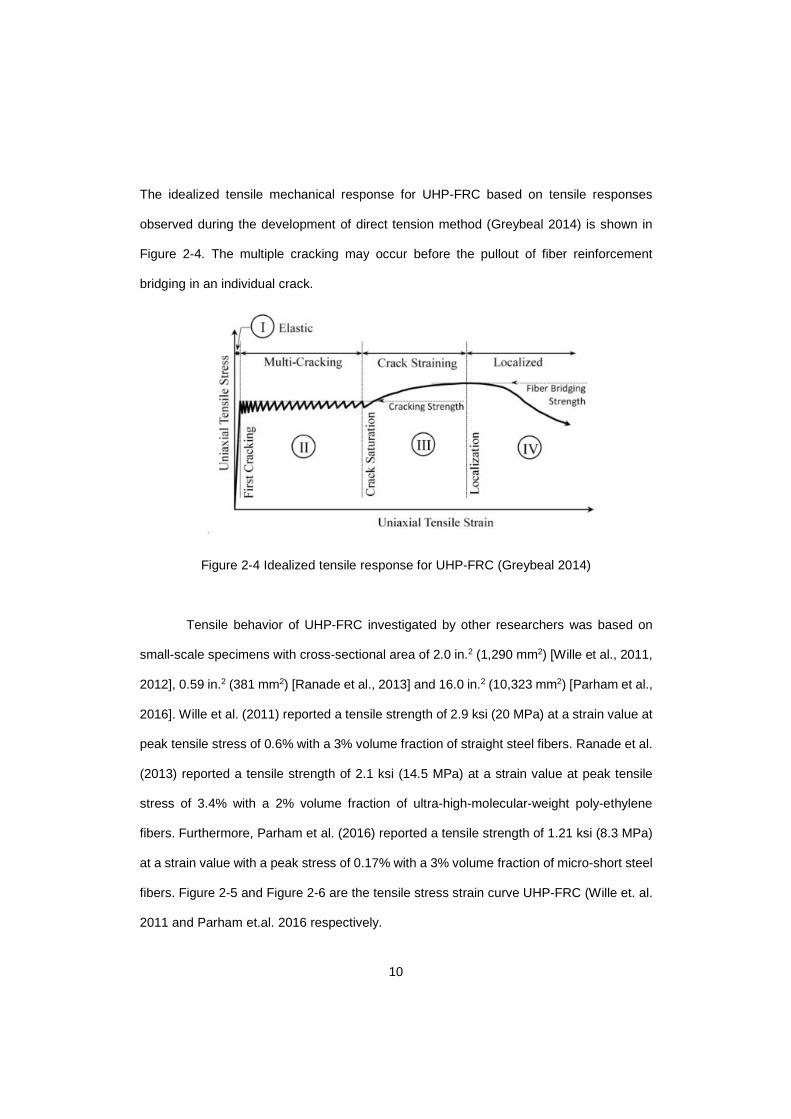
The idealized tensile mechanical response for UHP-FRC based on tensile responses
observed during the development of direct tension method (Greybeal 2014) is shown in
Figure 2-4. The multiple cracking may occur before the pullout of fiber reinforcement
bridging in an individual crack.
Figure 2-4 Idealized tensile response for UHP-FRC (Greybeal 2014)
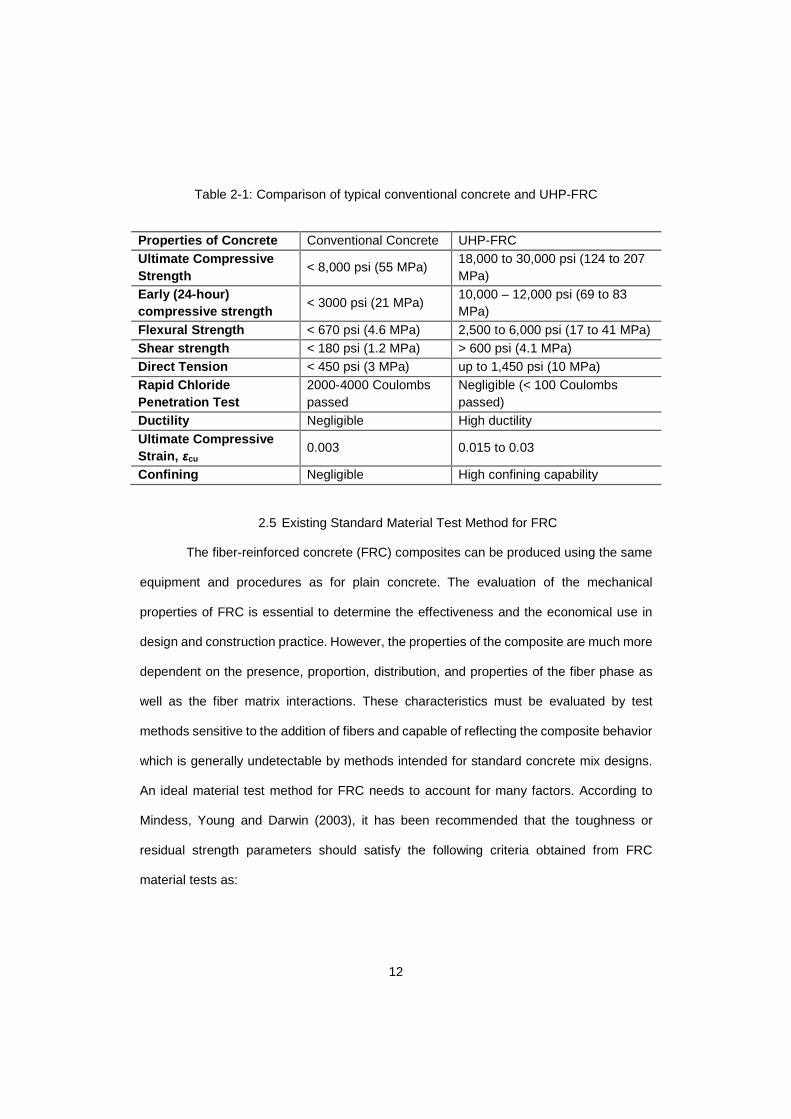
Tensile behavior of UHP-FRC investigated by other researchers was based on
small-scale specimens with cross-sectional area of 2.0 in.2 (1,290 mm2) [Wille et al., 2011,
2012], 0.59 in.2 (381 mm2) [Ranade et al., 2013] and 16.0 in.2 (10,323 mm2) [Parham et al.,
2016]. Wille et al. (2011) reported a tensile strength of 2.9 ksi (20 MPa) at a strain value at
peak tensile stress of 0.6% with a 3% volume fraction of straight steel fibers. Ranade et al.
(2013) reported a tensile strength of 2.1 ksi (14.5 MPa) at a strain value at peak tensile
stress of 3.4% with a 2% volume fraction of ultra-high-molecular-weight poly-ethylene
fibers. Furthermore, Parham et al. (2016) reported a tensile strength of 1.21 ksi (8.3 MPa)
at a strain value with a peak stress of 0.17% with a 3% volume fraction of micro-short steel
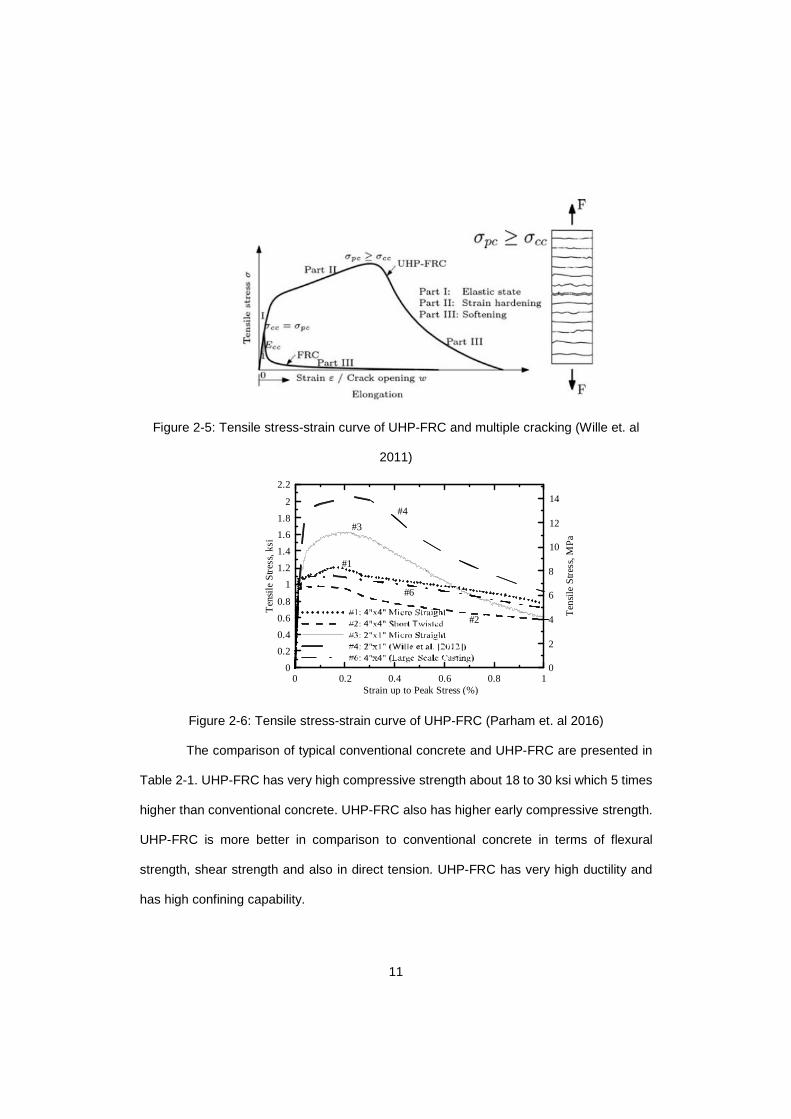
fibers. Figure 2-5 and Figure 2-6 are the tensile stress strain curve UHP-FRC (Wille et. al.
2011 and Parham et.al. 2016 respectively.
11
Figure 2-5: Tensile stress-strain curve of UHP-FRC and multiple cracking (Wille et. al
2011)
0 0.2 0.4 0.6 0.8 1Strain up to Peak Stress (%)
0
0.2
0.4
0.6
0.8
1
1.2
1.4
1.6
1.8
2
2.2
Ten
sile
Str
ess,
ksi
0
2
4
6
8
10
12
14
Ten
sile
Str
ess,
MP
a#1
#6
#2
#3
#4
Figure 2-6: Tensile stress-strain curve of UHP-FRC (Parham et. al 2016)
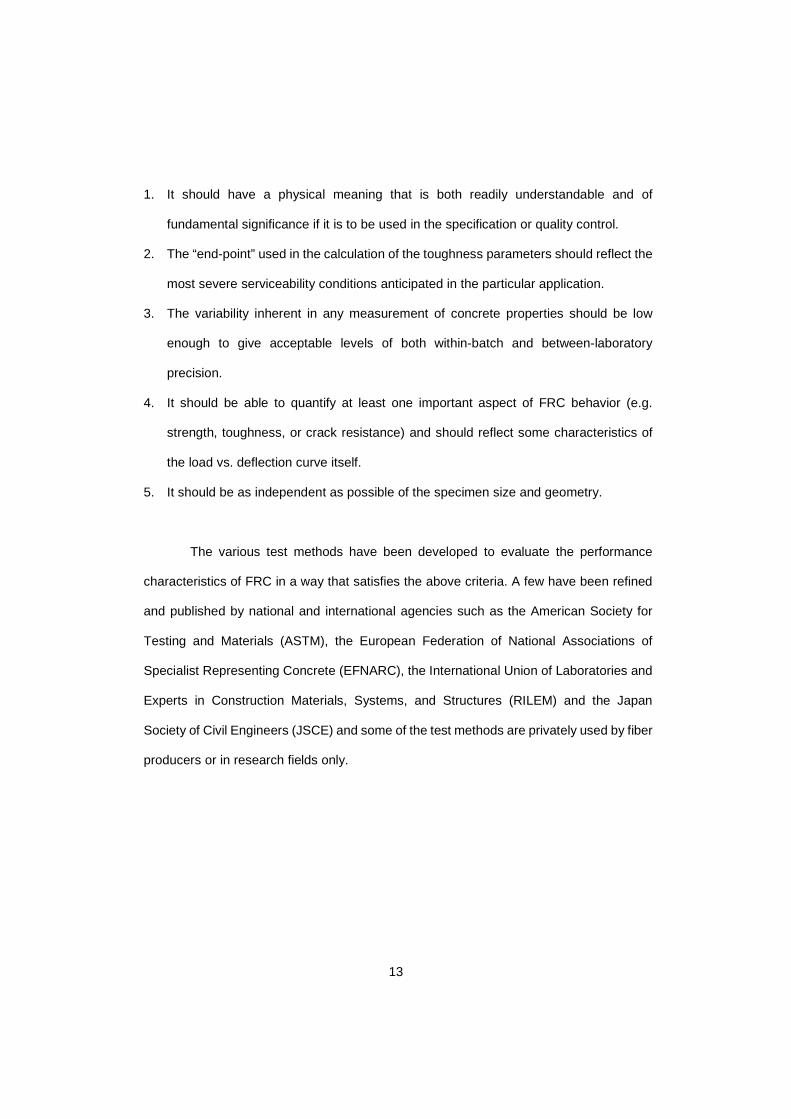
The comparison of typical conventional concrete and UHP-FRC are presented in
Table 2-1. UHP-FRC has very high compressive strength about 18 to 30 ksi which 5 times
higher than conventional concrete. UHP-FRC also has higher early compressive strength.
UHP-FRC is more better in comparison to conventional concrete in terms of flexural
strength, shear strength and also in direct tension. UHP-FRC has very high ductility and
has high confining capability.
12
Table 2-1: Comparison of typical conventional concrete and UHP-FRC
Properties of Concrete Conventional Concrete UHP-FRC Ultimate Compressive Strength
< 8,000 psi (55 MPa) 18,000 to 30,000 psi (124 to 207 MPa)
Early (24-hour) compressive strength
< 3000 psi (21 MPa) 10,000 – 12,000 psi (69 to 83 MPa)
Flexural Strength < 670 psi (4.6 MPa) 2,500 to 6,000 psi (17 to 41 MPa) Shear strength < 180 psi (1.2 MPa) > 600 psi (4.1 MPa) Direct Tension < 450 psi (3 MPa) up to 1,450 psi (10 MPa) Rapid Chloride Penetration Test
2000-4000 Coulombs passed
Negligible (< 100 Coulombs passed)
Ductility Negligible High ductility Ultimate Compressive Strain, εcu
0.003 0.015 to 0.03
Confining Negligible High confining capability
2.5 Existing Standard Material Test Method for FRC
The fiber-reinforced concrete (FRC) composites can be produced using the same
equipment and procedures as for plain concrete. The evaluation of the mechanical
properties of FRC is essential to determine the effectiveness and the economical use in
design and construction practice. However, the properties of the composite are much more
dependent on the presence, proportion, distribution, and properties of the fiber phase as
well as the fiber matrix interactions. These characteristics must be evaluated by test
methods sensitive to the addition of fibers and capable of reflecting the composite behavior
which is generally undetectable by methods intended for standard concrete mix designs.
An ideal material test method for FRC needs to account for many factors. According to
Mindess, Young and Darwin (2003), it has been recommended that the toughness or
residual strength parameters should satisfy the following criteria obtained from FRC
material tests as:
13
1. It should have a physical meaning that is both readily understandable and of
fundamental significance if it is to be used in the specification or quality control.
2. The “end-point” used in the calculation of the toughness parameters should reflect the
most severe serviceability conditions anticipated in the particular application.
3. The variability inherent in any measurement of concrete properties should be low
enough to give acceptable levels of both within-batch and between-laboratory
precision.
4. It should be able to quantify at least one important aspect of FRC behavior (e.g.
strength, toughness, or crack resistance) and should reflect some characteristics of
the load vs. deflection curve itself.
5. It should be as independent as possible of the specimen size and geometry.
The various test methods have been developed to evaluate the performance
characteristics of FRC in a way that satisfies the above criteria. A few have been refined
and published by national and international agencies such as the American Society for
Testing and Materials (ASTM), the European Federation of National Associations of
Specialist Representing Concrete (EFNARC), the International Union of Laboratories and
Experts in Construction Materials, Systems, and Structures (RILEM) and the Japan
Society of Civil Engineers (JSCE) and some of the test methods are privately used by fiber
producers or in research fields only.
14
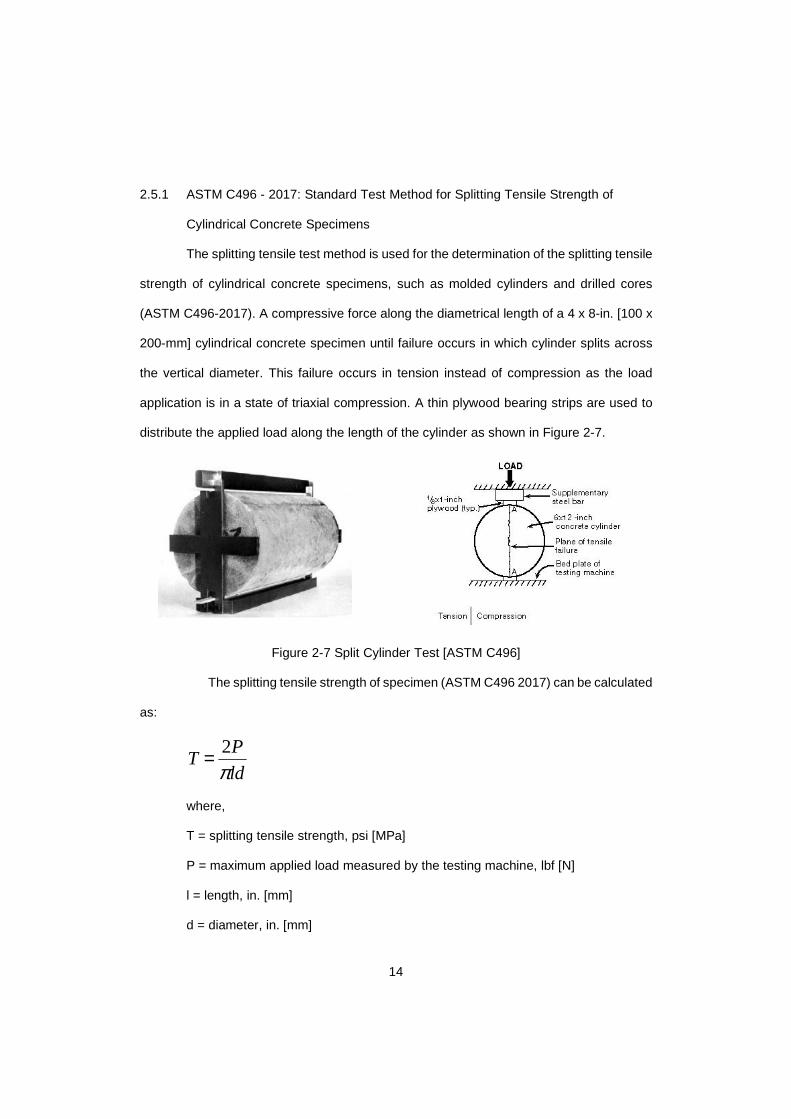
2.5.1 ASTM C496 - 2017: Standard Test Method for Splitting Tensile Strength of
Cylindrical Concrete Specimens
The splitting tensile test method is used for the determination of the splitting tensile
strength of cylindrical concrete specimens, such as molded cylinders and drilled cores
(ASTM C496-2017). A compressive force along the diametrical length of a 4 x 8-in. [100 x
200-mm] cylindrical concrete specimen until failure occurs in which cylinder splits across
the vertical diameter. This failure occurs in tension instead of compression as the load
application is in a state of triaxial compression. A thin plywood bearing strips are used to
distribute the applied load along the length of the cylinder as shown in Figure 2-7.
Figure 2-7 Split Cylinder Test [ASTM C496]
The splitting tensile strength of specimen (ASTM C496 2017) can be calculated
as:
2PT
ldπ=
where,
T = splitting tensile strength, psi [MPa]
P = maximum applied load measured by the testing machine, lbf [N]
l = length, in. [mm]
d = diameter, in. [mm]
15
The splitting tensile strength is a good indicator of tensile capacity and correlates
well with the performance of conventional concrete structures stressed in tension (ASTM
C496 2017). However, the major drawback of this test is as the cylinder is loaded in a
predetermined position, failure occurs at that predetermined plane. This method is not
suitable for FRC as fibers are randomly oriented and distributed within a given concrete
specimen. The probability that crack plane will coincide with the plane of a sample of fiber
content is very low. Moreover, there is no guarantee that the fibers will be oriented
perpendicular to the crack plane and consequently, the true properties of the material
obtained may not be accurate. ASTM C496 does not provide the means of obtaining load-
deflection curve and cannot be used comparing post tensile behavior for the different types
of fibers and volume fractions except only for ultimate tensile capacity.
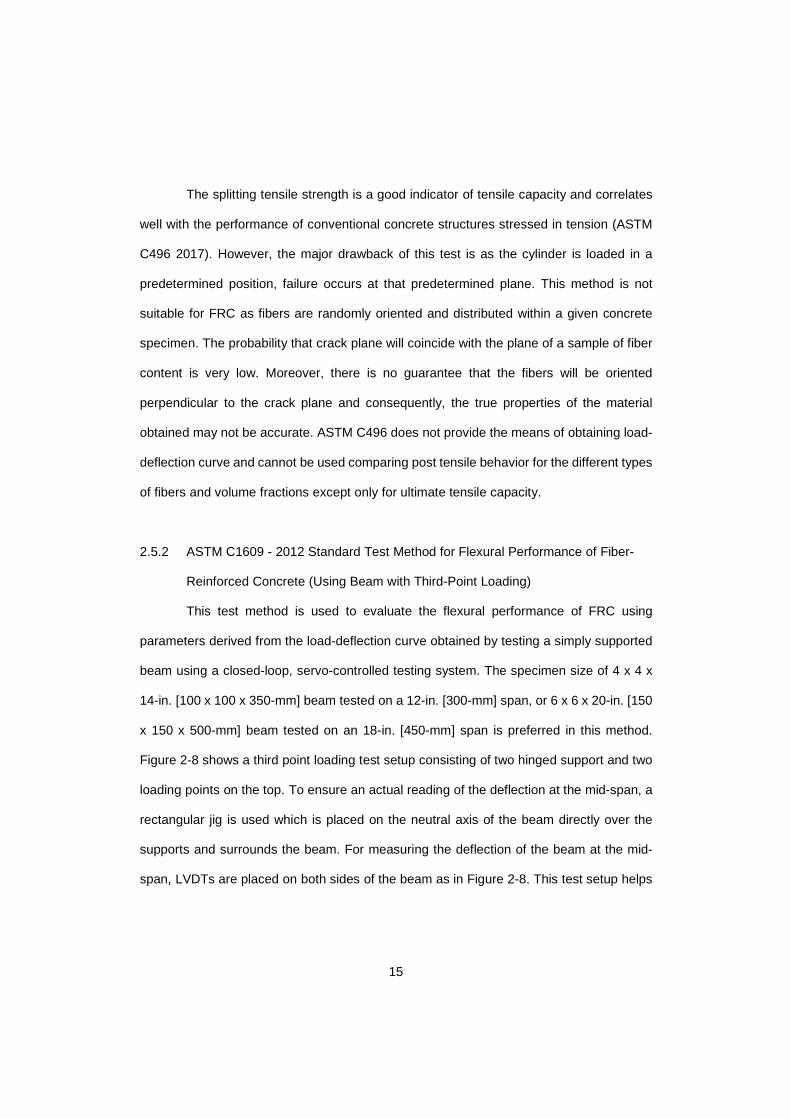
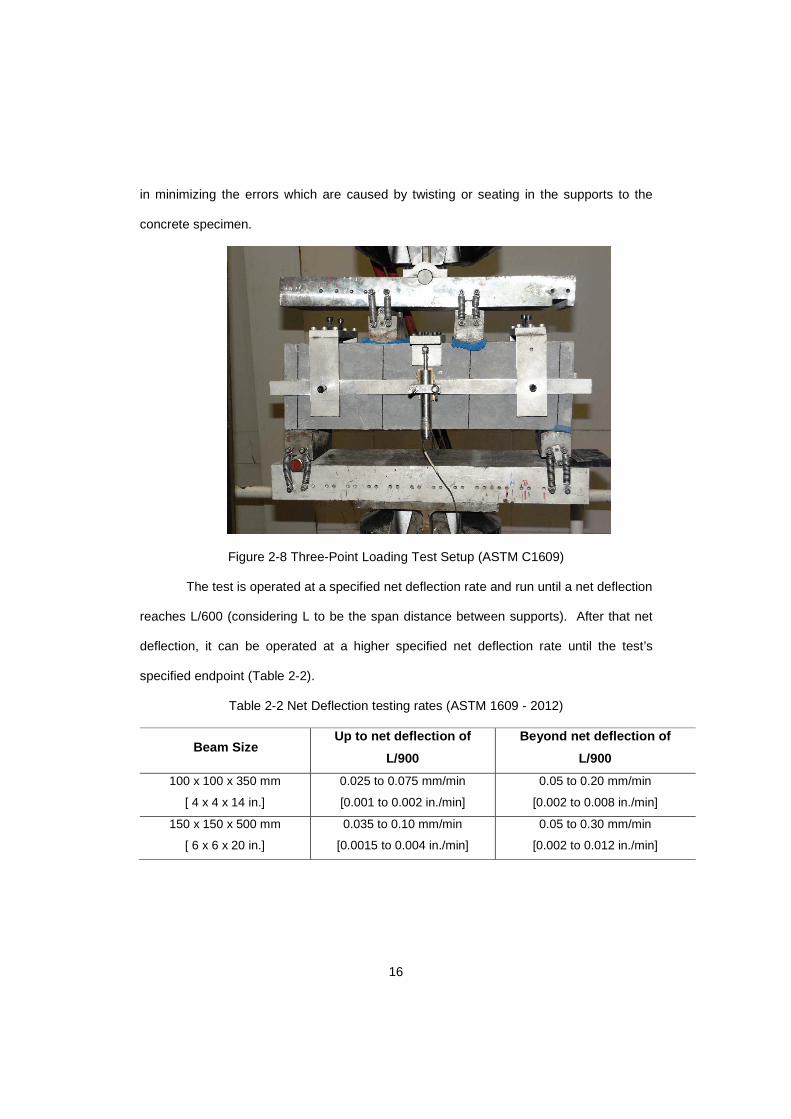
2.5.2 ASTM C1609 - 2012 Standard Test Method for Flexural Performance of Fiber-
Reinforced Concrete (Using Beam with Third-Point Loading)
This test method is used to evaluate the flexural performance of FRC using
parameters derived from the load-deflection curve obtained by testing a simply supported
beam using a closed-loop, servo-controlled testing system. The specimen size of 4 x 4 x
14-in. [100 x 100 x 350-mm] beam tested on a 12-in. [300-mm] span, or 6 x 6 x 20-in. [150
x 150 x 500-mm] beam tested on an 18-in. [450-mm] span is preferred in this method.
Figure 2-8 shows a third point loading test setup consisting of two hinged support and two
loading points on the top. To ensure an actual reading of the deflection at the mid-span, a
rectangular jig is used which is placed on the neutral axis of the beam directly over the
supports and surrounds the beam. For measuring the deflection of the beam at the mid-
span, LVDTs are placed on both sides of the beam as in Figure 2-8. This test setup helps
16
in minimizing the errors which are caused by twisting or seating in the supports to the
concrete specimen.
Figure 2-8 Three-Point Loading Test Setup (ASTM C1609)
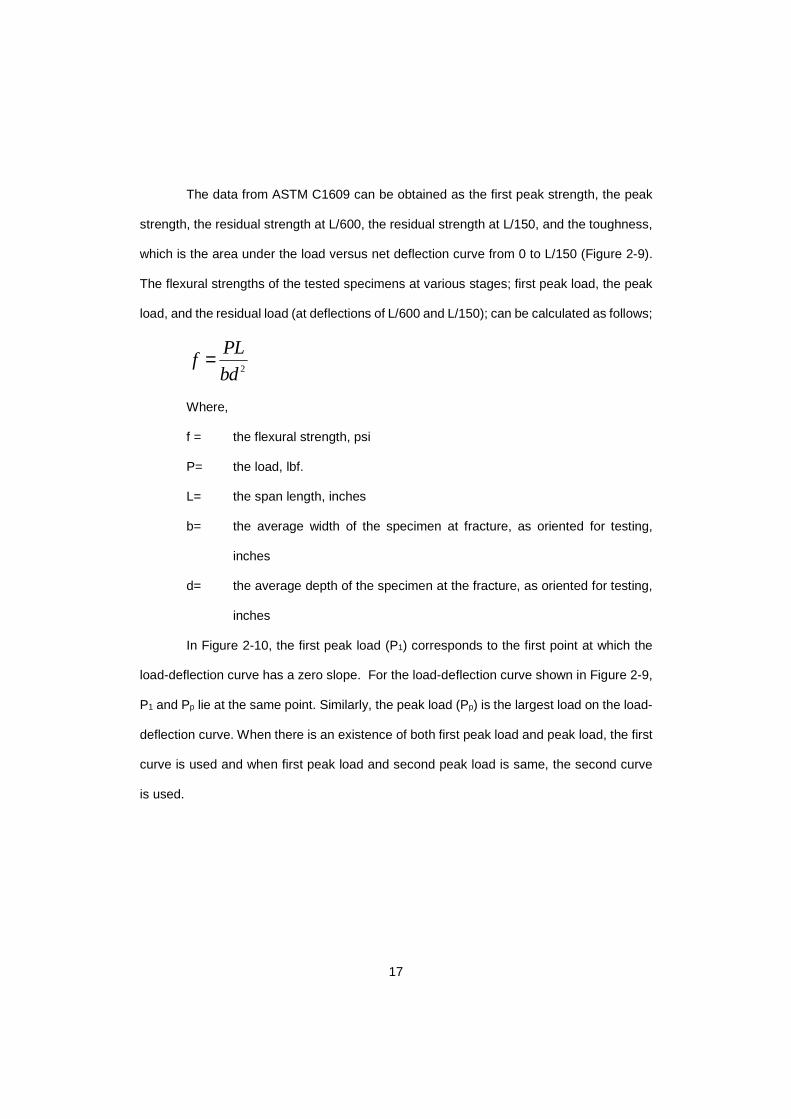
The test is operated at a specified net deflection rate and run until a net deflection
reaches L/600 (considering L to be the span distance between supports). After that net
deflection, it can be operated at a higher specified net deflection rate until the test’s
specified endpoint (Table 2-2).
Table 2-2 Net Deflection testing rates (ASTM 1609 - 2012)
Beam Size Up to net deflection of
L/900
Beyond net deflection of
L/900
100 x 100 x 350 mm
[ 4 x 4 x 14 in.]
0.025 to 0.075 mm/min
[0.001 to 0.002 in./min]
0.05 to 0.20 mm/min
[0.002 to 0.008 in./min]
150 x 150 x 500 mm
[ 6 x 6 x 20 in.]
0.035 to 0.10 mm/min
[0.0015 to 0.004 in./min]
0.05 to 0.30 mm/min
[0.002 to 0.012 in./min]
17
The data from ASTM C1609 can be obtained as the first peak strength, the peak
strength, the residual strength at L/600, the residual strength at L/150, and the toughness,
which is the area under the load versus net deflection curve from 0 to L/150 (Figure 2-9).
The flexural strengths of the tested specimens at various stages; first peak load, the peak
load, and the residual load (at deflections of L/600 and L/150); can be calculated as follows;
2
PLf
bd=
Where,
f = the flexural strength, psi
P= the load, lbf.
L= the span length, inches
b= the average width of the specimen at fracture, as oriented for testing,
inches
d= the average depth of the specimen at the fracture, as oriented for testing,
inches
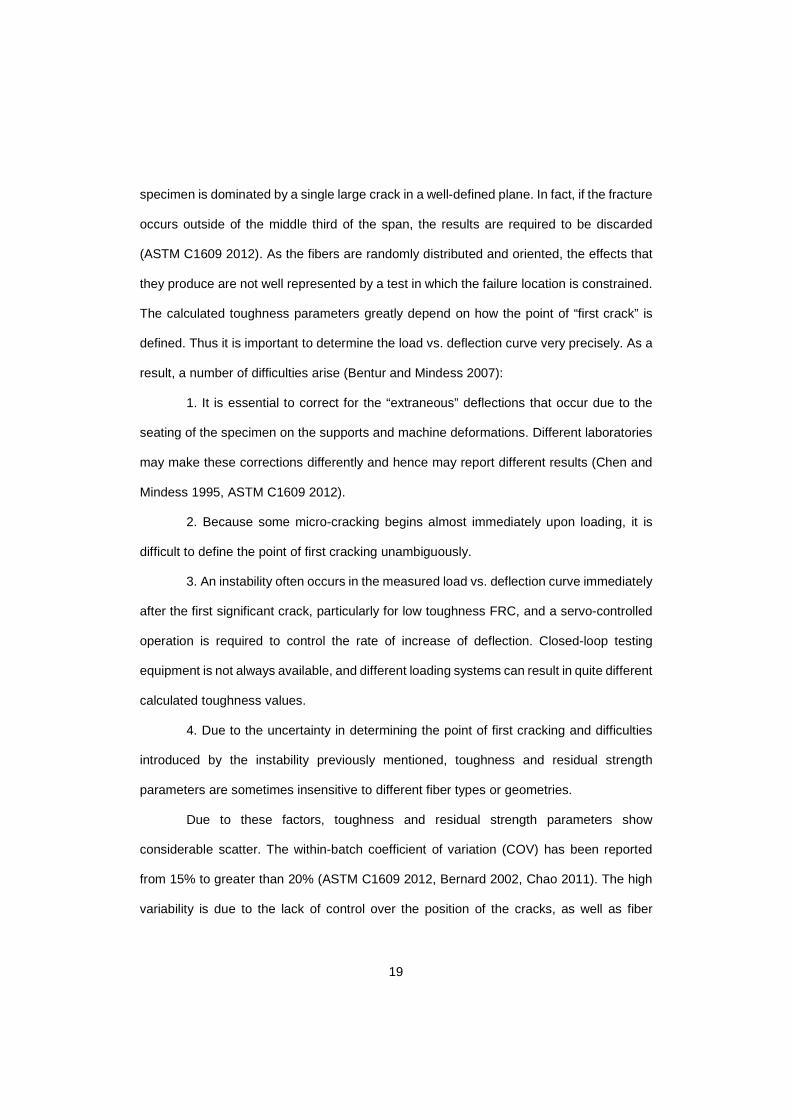
In Figure 2-10, the first peak load (P1) corresponds to the first point at which the
load-deflection curve has a zero slope. For the load-deflection curve shown in Figure 2-9,
P1 and Pp lie at the same point. Similarly, the peak load (Pp) is the largest load on the load-
deflection curve. When there is an existence of both first peak load and peak load, the first
curve is used and when first peak load and second peak load is same, the second curve
is used.
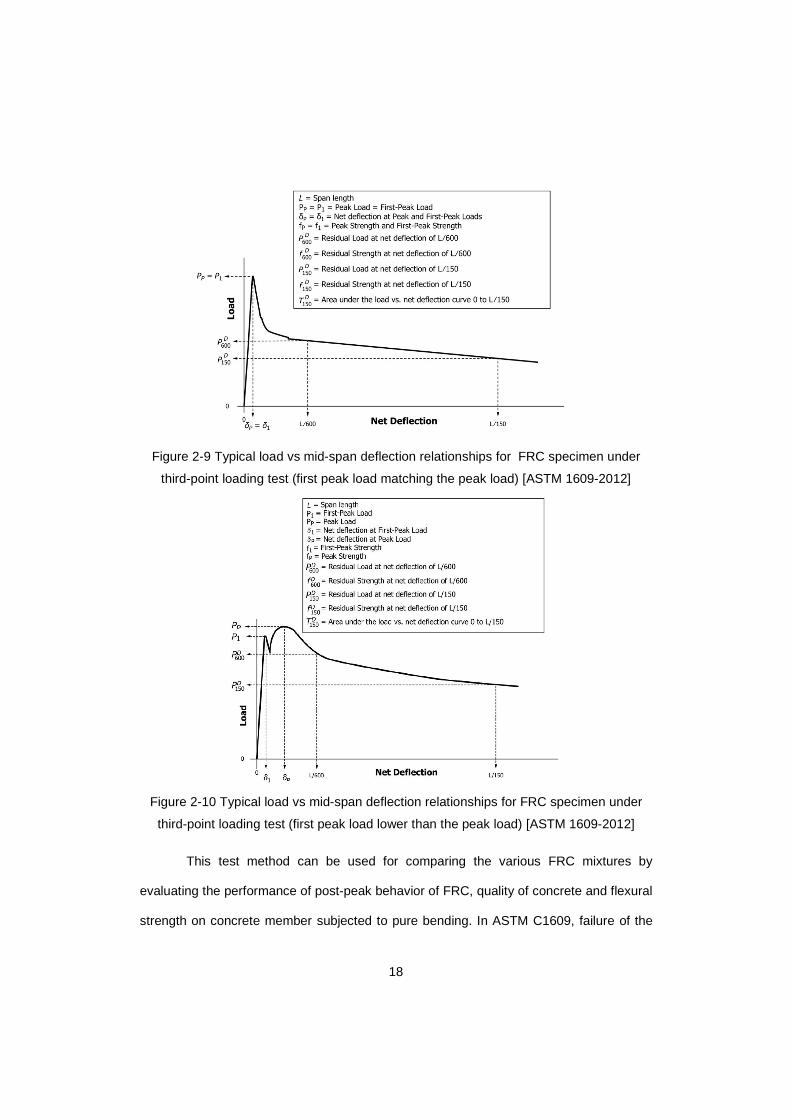
18
Figure 2-9 Typical load vs mid-span deflection relationships for FRC specimen under
third-point loading test (first peak load matching the peak load) [ASTM 1609-2012]
Figure 2-10 Typical load vs mid-span deflection relationships for FRC specimen under
third-point loading test (first peak load lower than the peak load) [ASTM 1609-2012]
This test method can be used for comparing the various FRC mixtures by
evaluating the performance of post-peak behavior of FRC, quality of concrete and flexural
strength on concrete member subjected to pure bending. In ASTM C1609, failure of the
19
specimen is dominated by a single large crack in a well-defined plane. In fact, if the fracture
occurs outside of the middle third of the span, the results are required to be discarded
(ASTM C1609 2012). As the fibers are randomly distributed and oriented, the effects that
they produce are not well represented by a test in which the failure location is constrained.
The calculated toughness parameters greatly depend on how the point of “first crack” is
defined. Thus it is important to determine the load vs. deflection curve very precisely. As a
result, a number of difficulties arise (Bentur and Mindess 2007):
1. It is essential to correct for the “extraneous” deflections that occur due to the
seating of the specimen on the supports and machine deformations. Different laboratories
may make these corrections differently and hence may report different results (Chen and
Mindess 1995, ASTM C1609 2012).
2. Because some micro-cracking begins almost immediately upon loading, it is
difficult to define the point of first cracking unambiguously.
3. An instability often occurs in the measured load vs. deflection curve immediately
after the first significant crack, particularly for low toughness FRC, and a servo-controlled
operation is required to control the rate of increase of deflection. Closed-loop testing
equipment is not always available, and different loading systems can result in quite different
calculated toughness values.
4. Due to the uncertainty in determining the point of first cracking and difficulties
introduced by the instability previously mentioned, toughness and residual strength
parameters are sometimes insensitive to different fiber types or geometries.
Due to these factors, toughness and residual strength parameters show
considerable scatter. The within-batch coefficient of variation (COV) has been reported
from 15% to greater than 20% (ASTM C1609 2012, Bernard 2002, Chao 2011). The high
variability is due to the lack of control over the position of the cracks, as well as fiber
20
orientation relative to the major crack plane (Chao 2011). Despite the considerable
improvements that have been made in ASTM C1609 over the years, this testing procedure
still presents major difficulties in accurately describing the behavior of FRC.
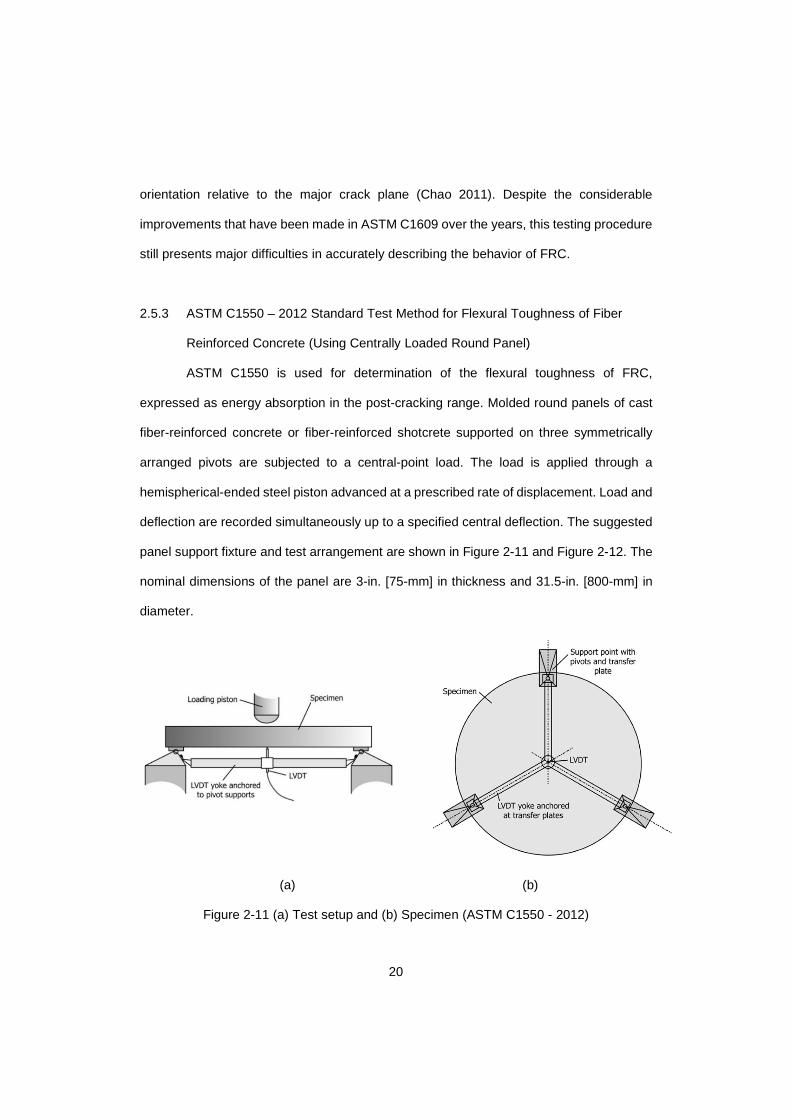
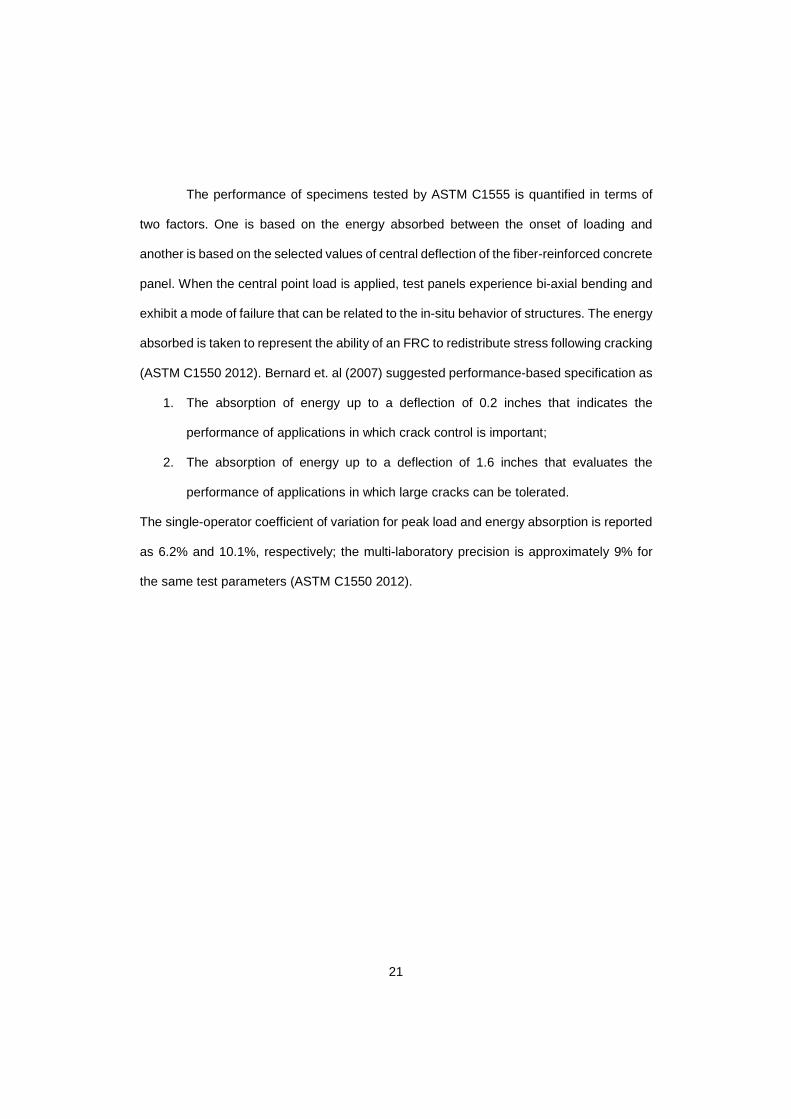
2.5.3 ASTM C1550 – 2012 Standard Test Method for Flexural Toughness of Fiber
Reinforced Concrete (Using Centrally Loaded Round Panel)
ASTM C1550 is used for determination of the flexural toughness of FRC,
expressed as energy absorption in the post-cracking range. Molded round panels of cast
fiber-reinforced concrete or fiber-reinforced shotcrete supported on three symmetrically
arranged pivots are subjected to a central-point load. The load is applied through a
hemispherical-ended steel piston advanced at a prescribed rate of displacement. Load and
deflection are recorded simultaneously up to a specified central deflection. The suggested
panel support fixture and test arrangement are shown in Figure 2-11 and Figure 2-12. The
nominal dimensions of the panel are 3-in. [75-mm] in thickness and 31.5-in. [800-mm] in
diameter.
(a) (b)
Figure 2-11 (a) Test setup and (b) Specimen (ASTM C1550 - 2012)
21
The performance of specimens tested by ASTM C1555 is quantified in terms of
two factors. One is based on the energy absorbed between the onset of loading and
another is based on the selected values of central deflection of the fiber-reinforced concrete
panel. When the central point load is applied, test panels experience bi-axial bending and
exhibit a mode of failure that can be related to the in-situ behavior of structures. The energy
absorbed is taken to represent the ability of an FRC to redistribute stress following cracking
(ASTM C1550 2012). Bernard et. al (2007) suggested performance-based specification as
1. The absorption of energy up to a deflection of 0.2 inches that indicates the
performance of applications in which crack control is important;
2. The absorption of energy up to a deflection of 1.6 inches that evaluates the
performance of applications in which large cracks can be tolerated.
The single-operator coefficient of variation for peak load and energy absorption is reported
as 6.2% and 10.1%, respectively; the multi-laboratory precision is approximately 9% for
the same test parameters (ASTM C1550 2012).
22
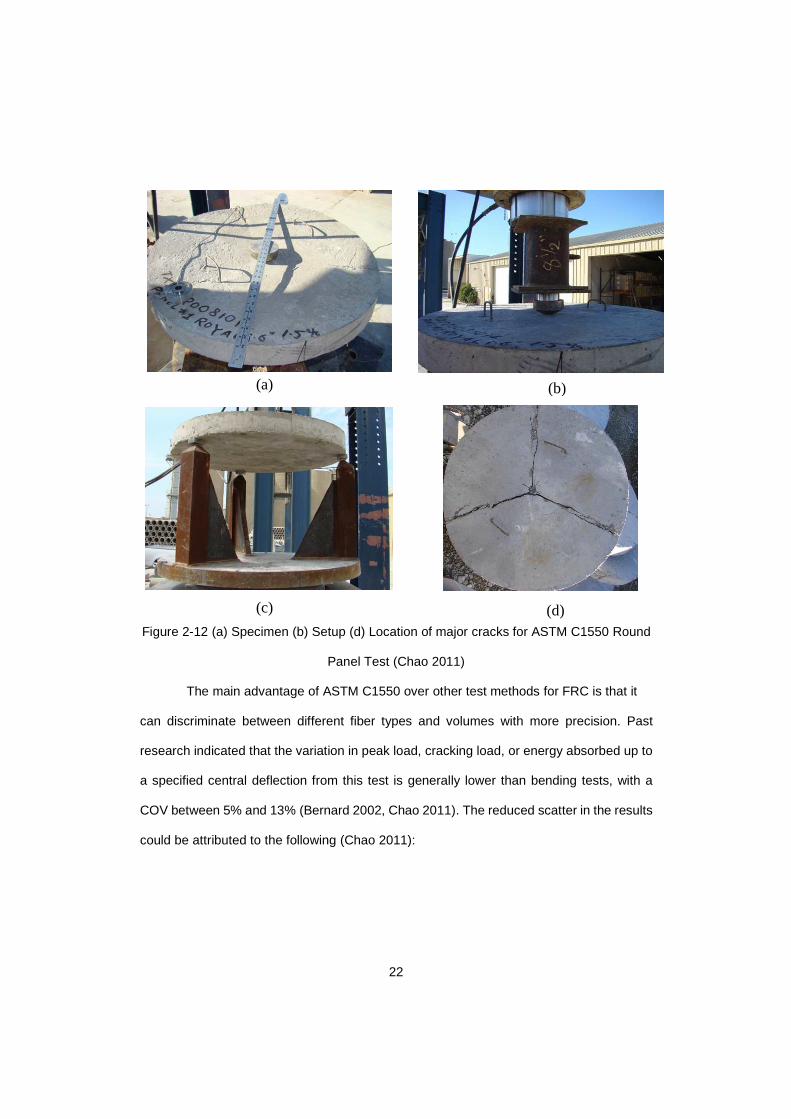
Figure 2-12 (a) Specimen (b) Setup (d) Location of major cracks for ASTM C1550 Round
Panel Test (Chao 2011)
The main advantage of ASTM C1550 over other test methods for FRC is that it
can discriminate between different fiber types and volumes with more precision. Past
research indicated that the variation in peak load, cracking load, or energy absorbed up to
a specified central deflection from this test is generally lower than bending tests, with a
COV between 5% and 13% (Bernard 2002, Chao 2011). The reduced scatter in the results
could be attributed to the following (Chao 2011):
(a) (b)
(c) (d)
23
1) Location of cracks as well as crack patterns can be controlled: As seen in Figure 2-12
(d) panels tested by this method almost always split into three segments upon failure,
at angles of about 120o.
2) Increased cracked area: the three major cracks give a somewhat average mechanical
behavior of the reinforcement that minimizes the influence of non-uniform fiber
distribution as well as random fiber orientation.
The major disadvantage of ASTM C1550 is that it uses heavy steel support and
difficulty in carrying out the experiments due to large specimen sizes (Figure 2-12).
Moreover, in this test when a crack occurs at the location of LVDT and crack opening
exceeds the probe width of LVDT, the deflection measurement is not accurate as a probe
can slip into the crack. In ASTM C1550, it is suggested that using an LVDT with a maximum
probe width of 0.8-in. [20-mm] can alleviate this problem. Greater probe widths are not
recommended because off-center cracks may induce exaggerated apparent deflections if
they occur adjacent to a wide probe (ASTM C1550 2012). However, even if the maximum
probe width is used, the opening at the center could be greater than 0.8-in. [20-mm] at
large deflections, which may lead to incorrect measurements of displacement (Chao
2011).This test method is less attractive for a quality control test and performance
evaluation of FRC due to the complicated procedure, large specimen size, and intricate
support fixtures.
2.5.4 Uniaxial Direct Tensile Test
A uniaxial direct tensile test is used to identify the important properties of FRC,
such as strain hardening or strain-softening, elastic modulus, and tensile stress-strain
relationships, and these are used to model and design of the FRC structural members
(Naaman 2007). Currently, there is no standard method for this test in the United States.,
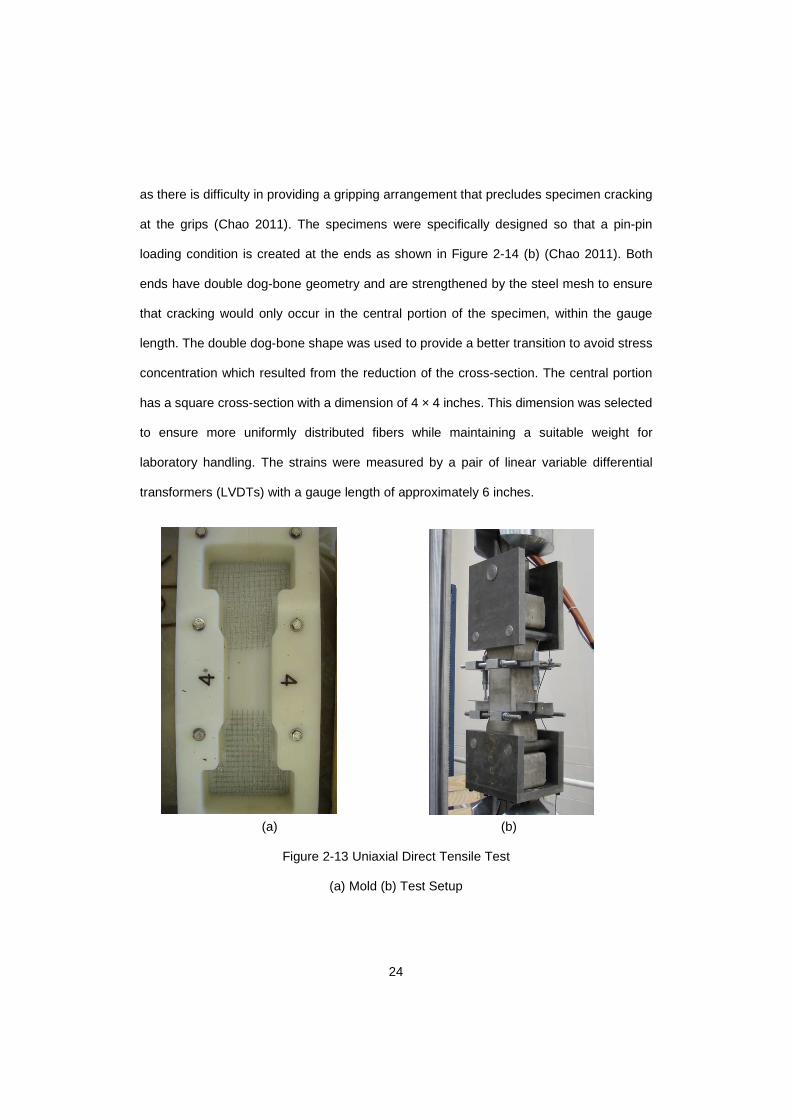
24
as there is difficulty in providing a gripping arrangement that precludes specimen cracking
at the grips (Chao 2011). The specimens were specifically designed so that a pin-pin
loading condition is created at the ends as shown in Figure 2-14 (b) (Chao 2011). Both
ends have double dog-bone geometry and are strengthened by the steel mesh to ensure
that cracking would only occur in the central portion of the specimen, within the gauge
length. The double dog-bone shape was used to provide a better transition to avoid stress
concentration which resulted from the reduction of the cross-section. The central portion
has a square cross-section with a dimension of 4 × 4 inches. This dimension was selected
to ensure more uniformly distributed fibers while maintaining a suitable weight for
laboratory handling. The strains were measured by a pair of linear variable differential
transformers (LVDTs) with a gauge length of approximately 6 inches.
(a) (b)
Figure 2-13 Uniaxial Direct Tensile Test
(a) Mold (b) Test Setup
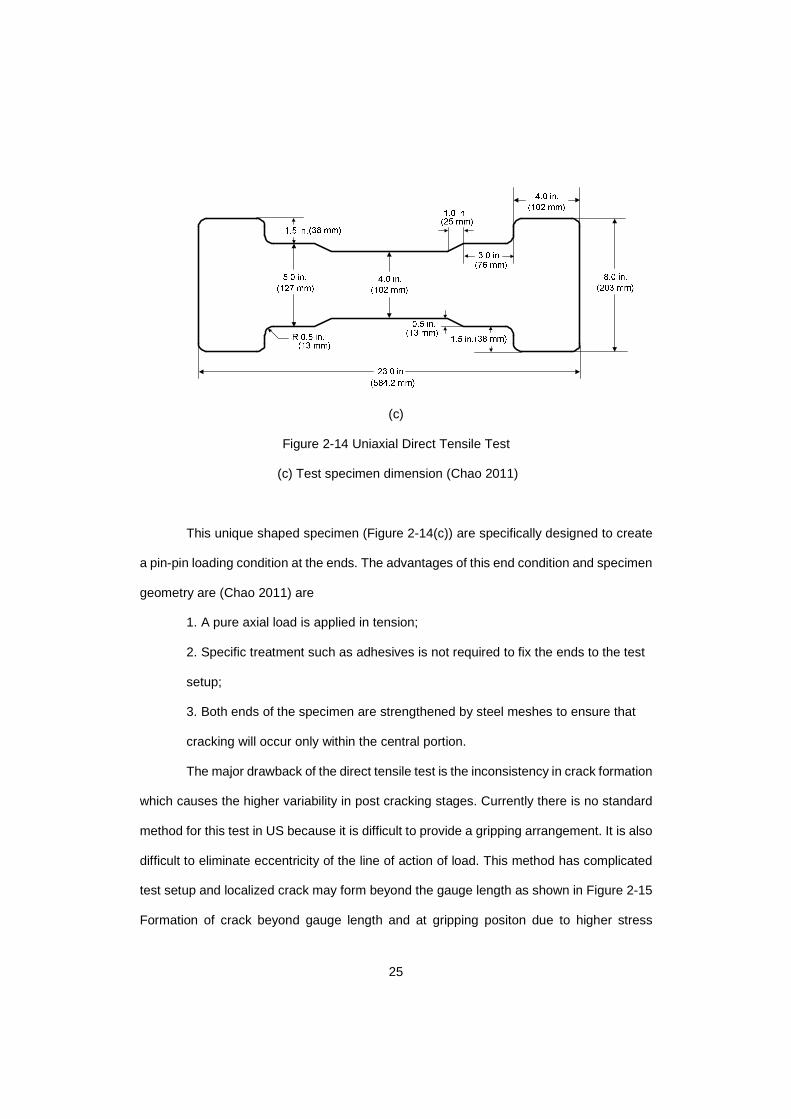
25
(c)
Figure 2-14 Uniaxial Direct Tensile Test
(c) Test specimen dimension (Chao 2011)
This unique shaped specimen (Figure 2-14(c)) are specifically designed to create
a pin-pin loading condition at the ends. The advantages of this end condition and specimen
geometry are (Chao 2011) are
1. A pure axial load is applied in tension;
2. Specific treatment such as adhesives is not required to fix the ends to the test
setup;
3. Both ends of the specimen are strengthened by steel meshes to ensure that
cracking will occur only within the central portion.
The major drawback of the direct tensile test is the inconsistency in crack formation
which causes the higher variability in post cracking stages. Currently there is no standard
method for this test in US because it is difficult to provide a gripping arrangement. It is also
difficult to eliminate eccentricity of the line of action of load. This method has complicated
test setup and localized crack may form beyond the gauge length as shown in Figure 2-15
Formation of crack beyond gauge length and at gripping positon due to higher stress
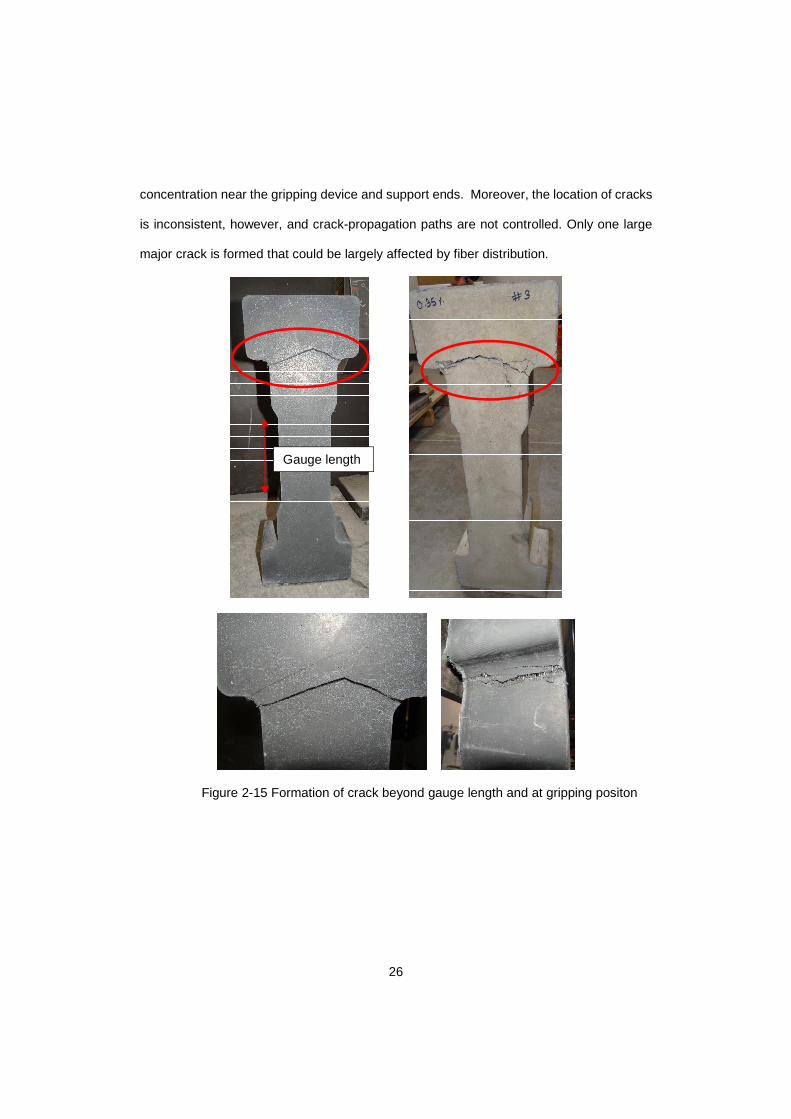
26
concentration near the gripping device and support ends. Moreover, the location of cracks
is inconsistent, however, and crack-propagation paths are not controlled. Only one large
major crack is formed that could be largely affected by fiber distribution.
Figure 2-15 Formation of crack beyond gauge length and at gripping positon
Gauge length
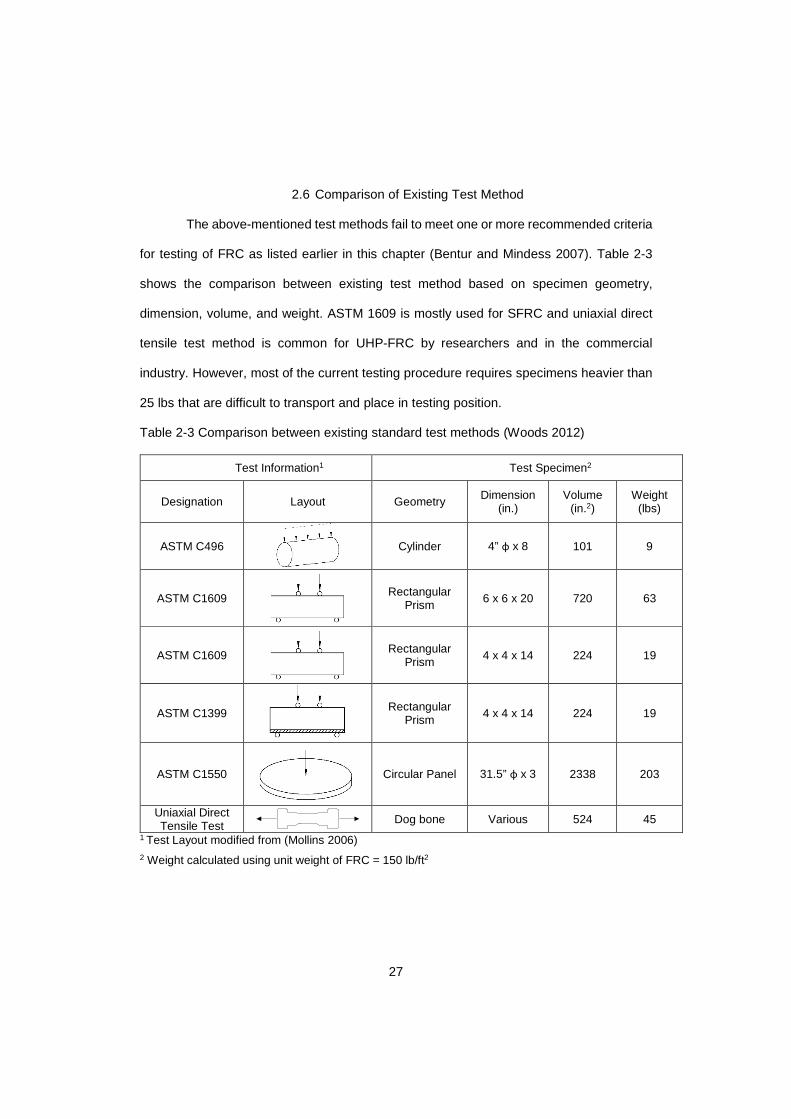
27
2.6 Comparison of Existing Test Method
The above-mentioned test methods fail to meet one or more recommended criteria
for testing of FRC as listed earlier in this chapter (Bentur and Mindess 2007). Table 2-3
shows the comparison between existing test method based on specimen geometry,
dimension, volume, and weight. ASTM 1609 is mostly used for SFRC and uniaxial direct
tensile test method is common for UHP-FRC by researchers and in the commercial
industry. However, most of the current testing procedure requires specimens heavier than
25 lbs that are difficult to transport and place in testing position.
Table 2-3 Comparison between existing standard test methods (Woods 2012)
Test Information1 Test Specimen2
Designation Layout Geometry Dimension (in.)
Volume (in.2)
Weight (lbs)
ASTM C496
Cylinder 4” φ x 8 101 9
ASTM C1609
Rectangular Prism 6 x 6 x 20 720 63
ASTM C1609
Rectangular Prism 4 x 4 x 14 224 19
ASTM C1399
Rectangular Prism 4 x 4 x 14 224 19
ASTM C1550
Circular Panel 31.5” φ x 3 2338 203
Uniaxial Direct Tensile Test Dog bone Various 524 45
1 Test Layout modified from (Mollins 2006) 2 Weight calculated using unit weight of FRC = 150 lb/ft2
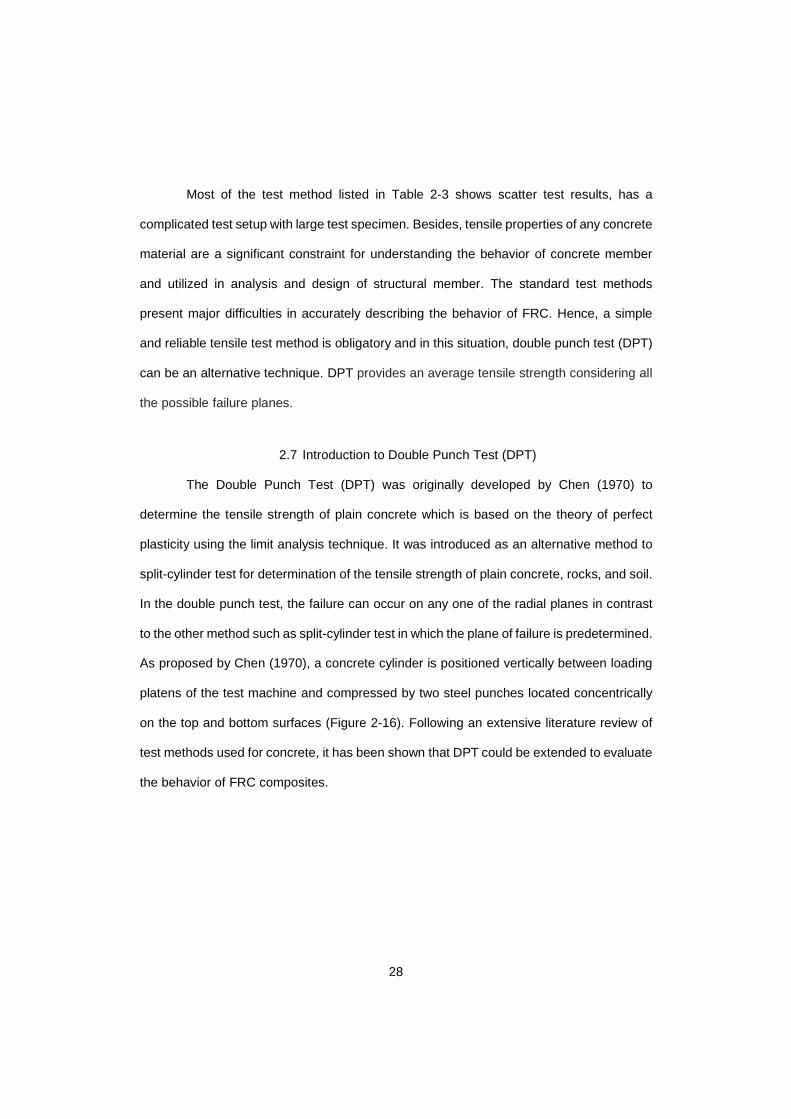
28
Most of the test method listed in Table 2-3 shows scatter test results, has a
complicated test setup with large test specimen. Besides, tensile properties of any concrete
material are a significant constraint for understanding the behavior of concrete member
and utilized in analysis and design of structural member. The standard test methods
present major difficulties in accurately describing the behavior of FRC. Hence, a simple
and reliable tensile test method is obligatory and in this situation, double punch test (DPT)
can be an alternative technique. DPT provides an average tensile strength considering all
the possible failure planes.
2.7 Introduction to Double Punch Test (DPT)
The Double Punch Test (DPT) was originally developed by Chen (1970) to
determine the tensile strength of plain concrete which is based on the theory of perfect
plasticity using the limit analysis technique. It was introduced as an alternative method to
split-cylinder test for determination of the tensile strength of plain concrete, rocks, and soil.
In the double punch test, the failure can occur on any one of the radial planes in contrast
to the other method such as split-cylinder test in which the plane of failure is predetermined.
As proposed by Chen (1970), a concrete cylinder is positioned vertically between loading
platens of the test machine and compressed by two steel punches located concentrically
on the top and bottom surfaces (Figure 2-16). Following an extensive literature review of
test methods used for concrete, it has been shown that DPT could be extended to evaluate
the behavior of FRC composites.
29
Figure 2-16 Double punch test layout
This method can also be used as an alternative method to characterize the post-
cracking behavior of fiber reinforced concrete and improve the material assessment
procedure. The experimental results have shown that DPT method can identify various
FRC characteristics such as tensile strength, strain-hardening, toughness, and stiffness.
This method can be extended to the concrete matrix containing fibers as a quality control
test which is an important factor in the structural applications. The study investigates the
feasibility of DPT method for UHP-FRC as this method can be carried out using a simple
test setup and a compression test machine.
2.8 Theory of Double Punch Test
The basic theory of the Double-Punch Test is based on the bearing capacity of concrete
blocks (Chen 1970). This approach was based on the assumption that sufficient local
deformability of concrete in tension and in compression existed such that generalized
theorems of limit analysis could be applied to concrete idealized as a perfectly plastic
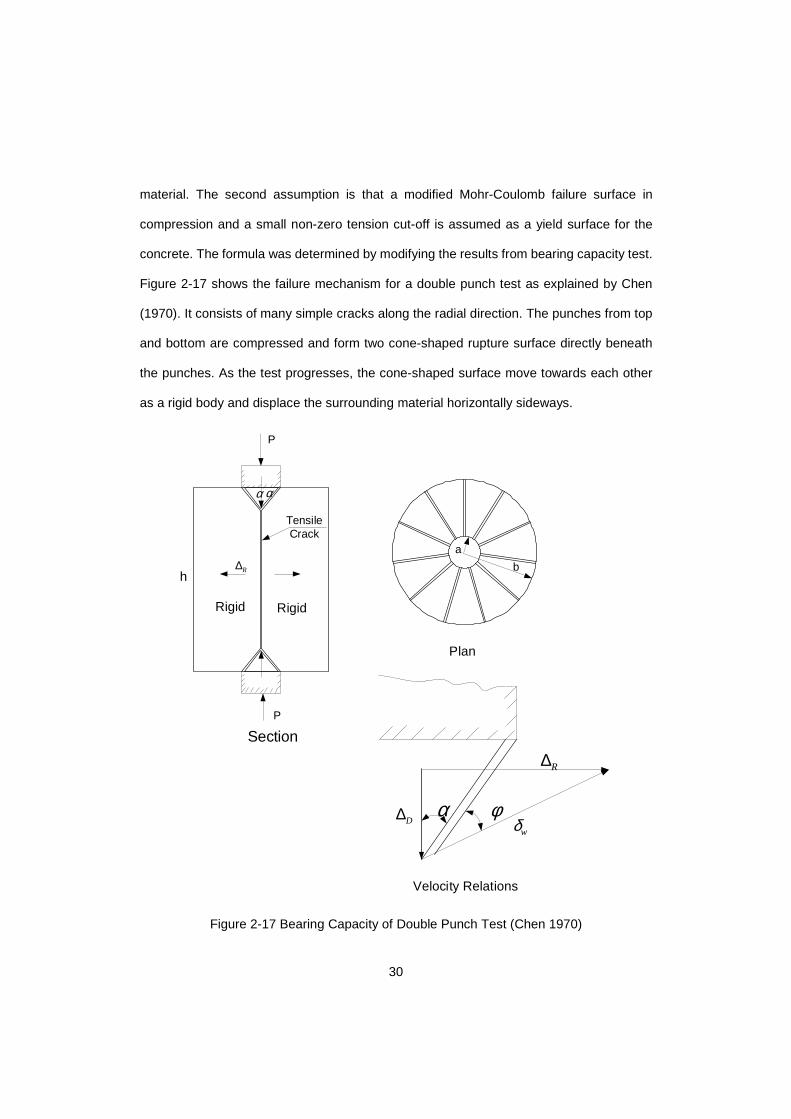
30
material. The second assumption is that a modified Mohr-Coulomb failure surface in
compression and a small non-zero tension cut-off is assumed as a yield surface for the
concrete. The formula was determined by modifying the results from bearing capacity test.
Figure 2-17 shows the failure mechanism for a double punch test as explained by Chen
(1970). It consists of many simple cracks along the radial direction. The punches from top
and bottom are compressed and form two cone-shaped rupture surface directly beneath
the punches. As the test progresses, the cone-shaped surface move towards each other
as a rigid body and displace the surrounding material horizontally sideways.
Section
Rigid
Plan
Tensile Crack
a
bh
wδφα
D∆
R∆
R∆
P
α α
P
Velocity Relations
Rigid
Figure 2-17 Bearing Capacity of Double Punch Test (Chen 1970)
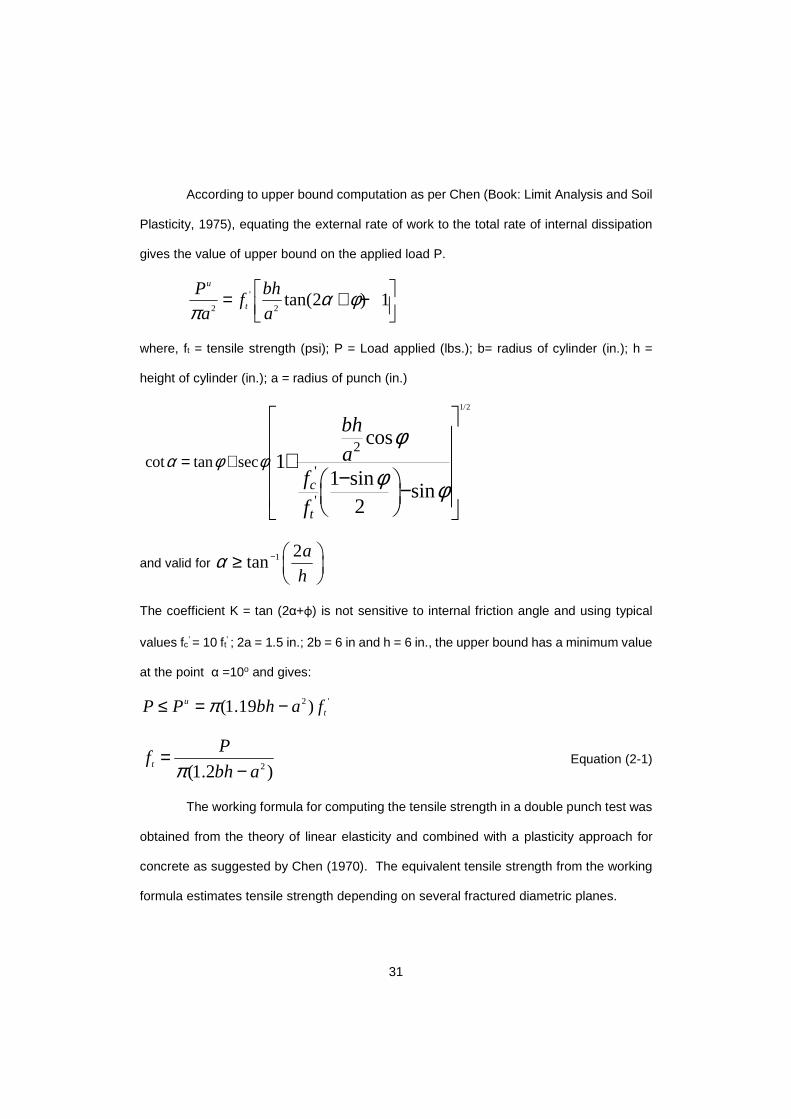
31
According to upper bound computation as per Chen (Book: Limit Analysis and Soil
Plasticity, 1975), equating the external rate of work to the total rate of internal dissipation
gives the value of upper bound on the applied load P.
'
2 2tan(2 ) 1
u
t
P bhf
a aα φ
π = + −
where, ft = tensile strength (psi); P = Load applied (lbs.); b= radius of cylinder (in.); h =
height of cylinder (in.); a = radius of punch (in.)
1/2
2
'
'
cot tan sec
cos1
1 sinsin
2c
t
bh
af
f
α φ φφ
φ φ= +
+
− −
and valid for 1 2
tana
hα − ≥
The coefficient K = tan (2α+φ) is not sensitive to internal friction angle and using typical
values fc’ = 10 ft’ ; 2a = 1.5 in.; 2b = 6 in and h = 6 in., the upper bound has a minimum value
at the point α =10o and gives:
2 '(1.19 )utP P bh a fπ≤ = −
2(1.2 )t
Pf
bh aπ=
− Equation (2-1)
The working formula for computing the tensile strength in a double punch test was
obtained from the theory of linear elasticity and combined with a plasticity approach for
concrete as suggested by Chen (1970). The equivalent tensile strength from the working
formula estimates tensile strength depending on several fractured diametric planes.
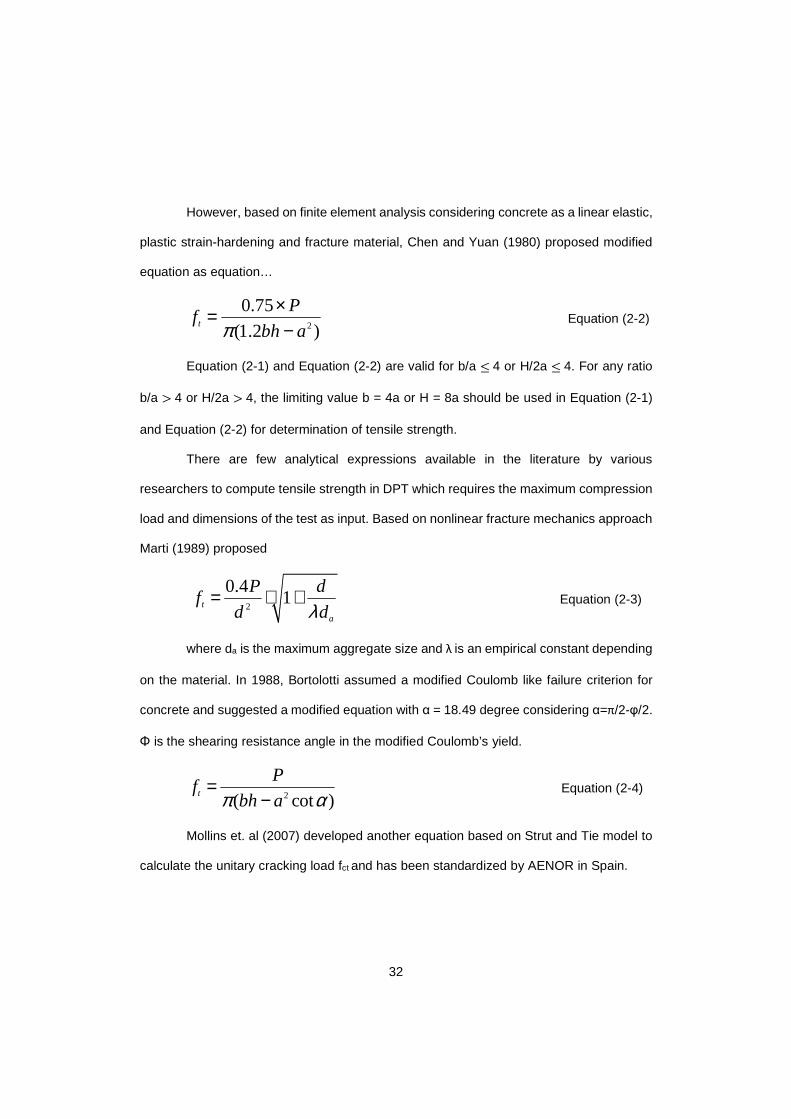
32
However, based on finite element analysis considering concrete as a linear elastic,
plastic strain-hardening and fracture material, Chen and Yuan (1980) proposed modified
equation as equation…
2
0.75
(1.2 )t
Pf
bh aπ×=−
Equation (2-2)
Equation (2-1) and Equation (2-2) are valid for b/a ≤ 4 or H/2a ≤ 4. For any ratio
b/a > 4 or H/2a > 4, the limiting value b = 4a or H = 8a should be used in Equation (2-1)
and Equation (2-2) for determination of tensile strength.
There are few analytical expressions available in the literature by various
researchers to compute tensile strength in DPT which requires the maximum compression
load and dimensions of the test as input. Based on nonlinear fracture mechanics approach
Marti (1989) proposed
2
0.41t
a
P df
d dλ= ⋅ + Equation (2-3)
where da is the maximum aggregate size and λ is an empirical constant depending
on the material. In 1988, Bortolotti assumed a modified Coulomb like failure criterion for
concrete and suggested a modified equation with α = 18.49 degree considering α=π/2-φ/2.
Φ is the shearing resistance angle in the modified Coulomb’s yield.
2( cot )t
Pf
bh aπ α=
− Equation (2-4)
Mollins et. al (2007) developed another equation based on Strut and Tie model to
calculate the unitary cracking load fct and has been standardized by AENOR in Spain.
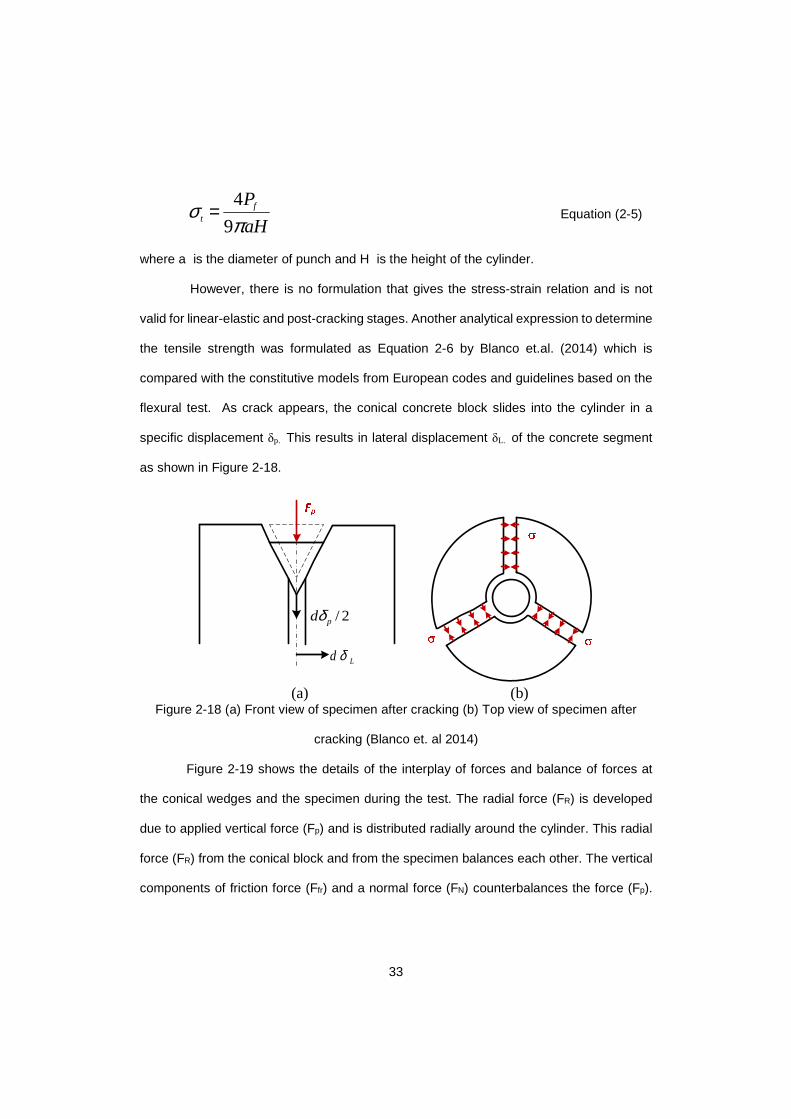
33
4
9f
t
P
aHσ
π= Equation (2-5)
where a is the diameter of punch and H is the height of the cylinder.
However, there is no formulation that gives the stress-strain relation and is not
valid for linear-elastic and post-cracking stages. Another analytical expression to determine
the tensile strength was formulated as Equation 2-6 by Blanco et.al. (2014) which is
compared with the constitutive models from European codes and guidelines based on the
flexural test. As crack appears, the conical concrete block slides into the cylinder in a
specific displacement δp. This results in lateral displacement δL. of the concrete segment
as shown in Figure 2-18.
2/pdδ
Ld δ
(a) (b) Figure 2-18 (a) Front view of specimen after cracking (b) Top view of specimen after
cracking (Blanco et. al 2014)
Figure 2-19 shows the details of the interplay of forces and balance of forces at
the conical wedges and the specimen during the test. The radial force (FR) is developed
due to applied vertical force (Fp) and is distributed radially around the cylinder. This radial
force (FR) from the conical block and from the specimen balances each other. The vertical
components of friction force (Ffr) and a normal force (FN) counterbalances the force (Fp).
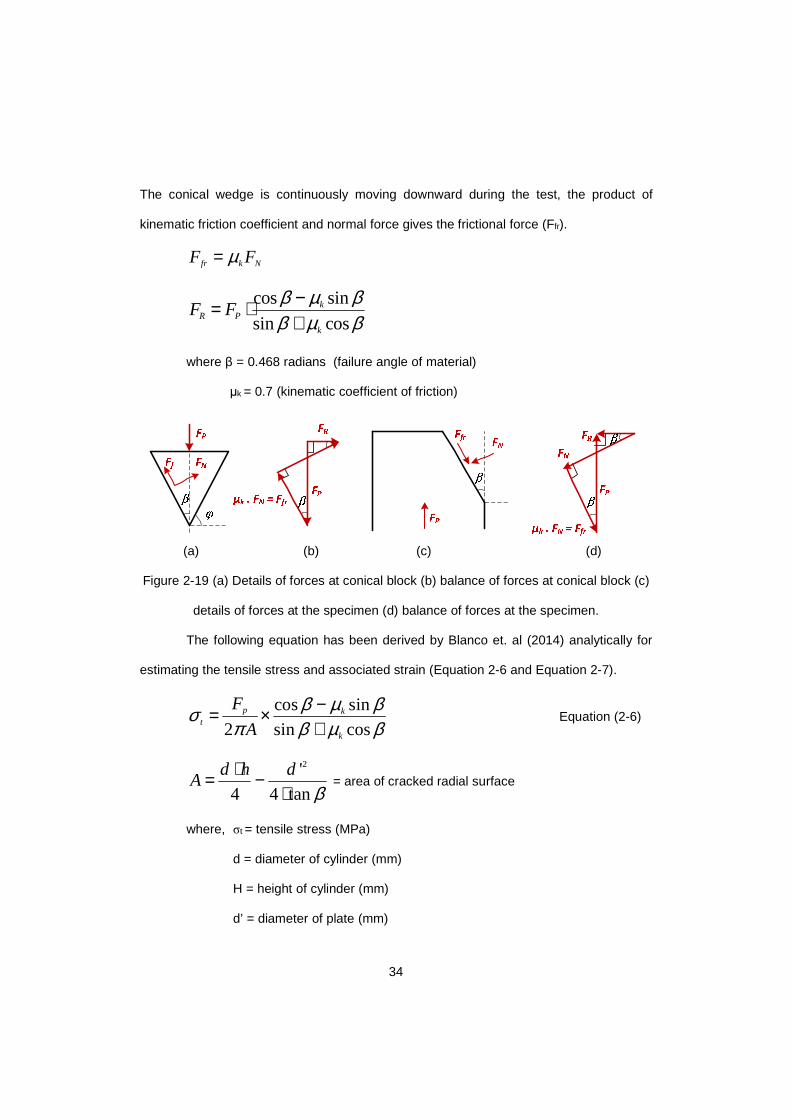
34
The conical wedge is continuously moving downward during the test, the product of
kinematic friction coefficient and normal force gives the frictional force (Ffr).
fr k NF Fµ=
cos sin
sin cosk
R P
k
F Fβ µ ββ µ β
−= ⋅+
where β = 0.468 radians (failure angle of material)
μk = 0.7 (kinematic coefficient of friction)
(a) (b) (c) (d)
Figure 2-19 (a) Details of forces at conical block (b) balance of forces at conical block (c)
details of forces at the specimen (d) balance of forces at the specimen.
The following equation has been derived by Blanco et. al (2014) analytically for
estimating the tensile stress and associated strain (Equation 2-6 and Equation 2-7).
cos sin
2 sin cosp k
t
k
F
A
β µ βσπ β µ β
−= ×+
Equation (2-6)
2'
4 4 tan
d h dA
β⋅= −
⋅ = area of cracked radial surface
where, σt = tensile stress (MPa)
d = diameter of cylinder (mm)
H = height of cylinder (mm)
d’ = diameter of plate (mm)
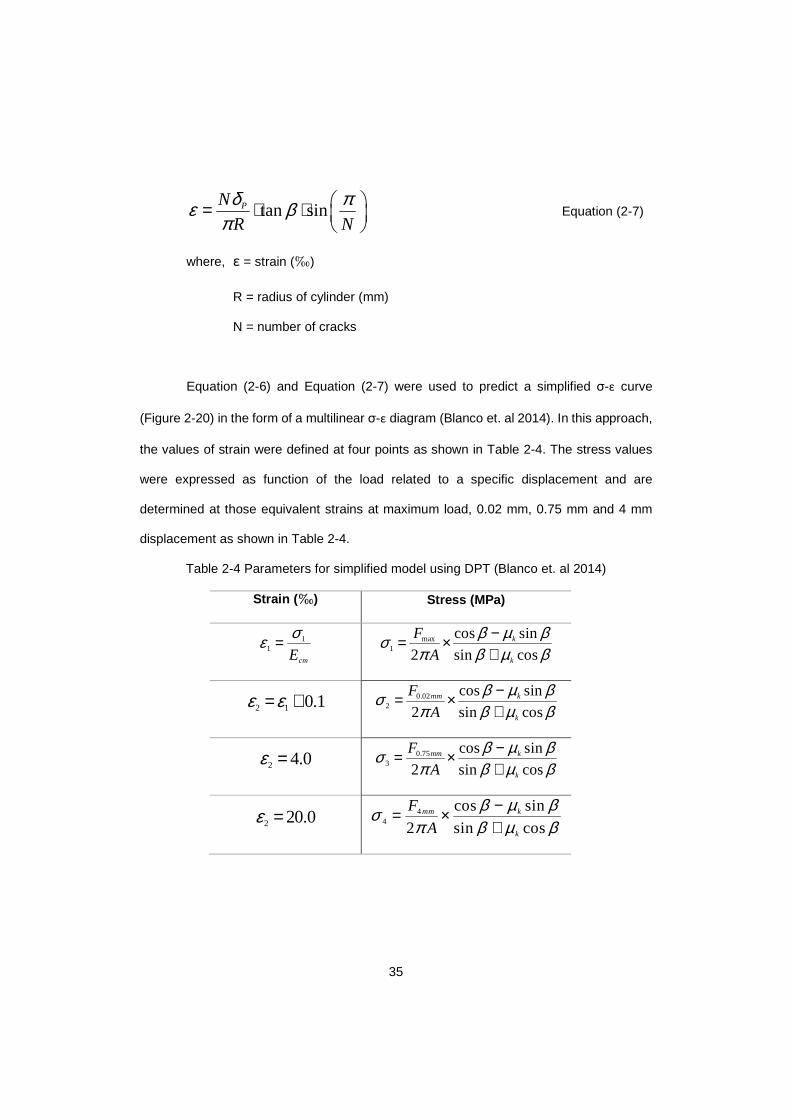
35
tan sinPN
R N
δ πε βπ
= ⋅ ⋅
Equation (2-7)
where, ε = strain (‰)
R = radius of cylinder (mm)
N = number of cracks
Equation (2-6) and Equation (2-7) were used to predict a simplified σ-ε curve
(Figure 2-20) in the form of a multilinear σ-ε diagram (Blanco et. al 2014). In this approach,
the values of strain were defined at four points as shown in Table 2-4. The stress values
were expressed as function of the load related to a specific displacement and are
determined at those equivalent strains at maximum load, 0.02 mm, 0.75 mm and 4 mm
displacement as shown in Table 2-4.
Table 2-4 Parameters for simplified model using DPT (Blanco et. al 2014)
Strain ( ‰) Stress (MPa)
11
cmE
σε = max1
cos sin
2 sin cosk
k
F
A
β µ βσπ β µ β
−= ×+
2 1 0.1ε ε= + 0.02
2
cos sin
2 sin cosmm k
k
F
A
β µ βσπ β µ β
−= ×+
2 4.0ε = 0.75
3
cos sin
2 sin cosmm k
k
F
A
β µ βσπ β µ β
−= ×+
2 20.0ε = 4
4
cos sin
2 sin cosmm k
k
F
A
β µ βσπ β µ β
−= ×+
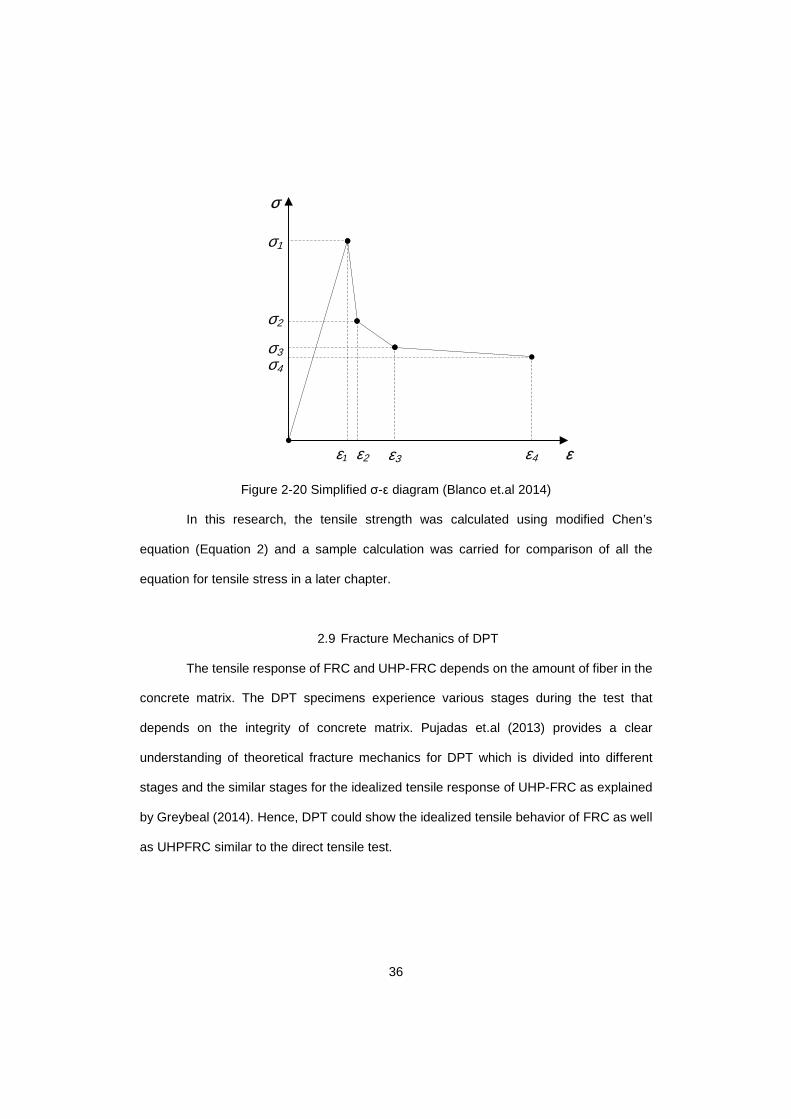
36
εε1 ε2 ε3 ε4
σ
σ4
σ3
σ2
σ1
Figure 2-20 Simplified σ-ε diagram (Blanco et.al 2014)
In this research, the tensile strength was calculated using modified Chen’s
equation (Equation 2) and a sample calculation was carried for comparison of all the
equation for tensile stress in a later chapter.
2.9 Fracture Mechanics of DPT
The tensile response of FRC and UHP-FRC depends on the amount of fiber in the
concrete matrix. The DPT specimens experience various stages during the test that
depends on the integrity of concrete matrix. Pujadas et.al (2013) provides a clear
understanding of theoretical fracture mechanics for DPT which is divided into different
stages and the similar stages for the idealized tensile response of UHP-FRC as explained
by Greybeal (2014). Hence, DPT could show the idealized tensile behavior of FRC as well
as UHPFRC similar to the direct tensile test.
37
Stage 1: When a compressive load is applied through the punch, the internal stresses are
developed and are resisted by the concrete matrix. In FRC, the minor circumferential strain
is observed until the peak load is reached. This circumferential strain is associated to the
Poisson effect and the microcracking and is assumed to be zero This stage includes the
linear elastic phase to the point of first cracking which gives values of axial deformation
and total crack opening displacement (TCOD), circumferential deformation as zero. In the
case of UHP-FRC, a prominent circumferential deformation can be observed before
reaching the peak load. The reaching of peak load marks the end of stage 1 for both FRC
and UHP-FRC.
Stage 2: This stage is a multi-cracking phase for the UHP-FRC where the concrete matrix
cracks repeatedly and fibers bridge the crack opening until the peak strength is reached.
The conical wedges having the same base diameter as the punches are abruptly formed
at the upper and lower punch. The multiple cracking may not be seen in case of SFRC due
to a less ductile nature.
.
Stage 3: After the peak point, the crack straining and hardening behavior occur. The conical
wedges slide in between concrete matrix forming radial cracks and may continue along the
height of specimen. The crack opening increases gradually producing a uniform
displacement radially where the number of cracks depends on the type of concrete matrix.
Due to saturation in crack formation, additional cracks are less likely at this stage.
Stage 4: With the decrease in fiber bridging strength, the localization phase will begin
where major cracks stabilize, and residual strength will appear. The crack opening will bring
out the fragmented concrete blocks due to radial cracks and behaves as a rigid body. The
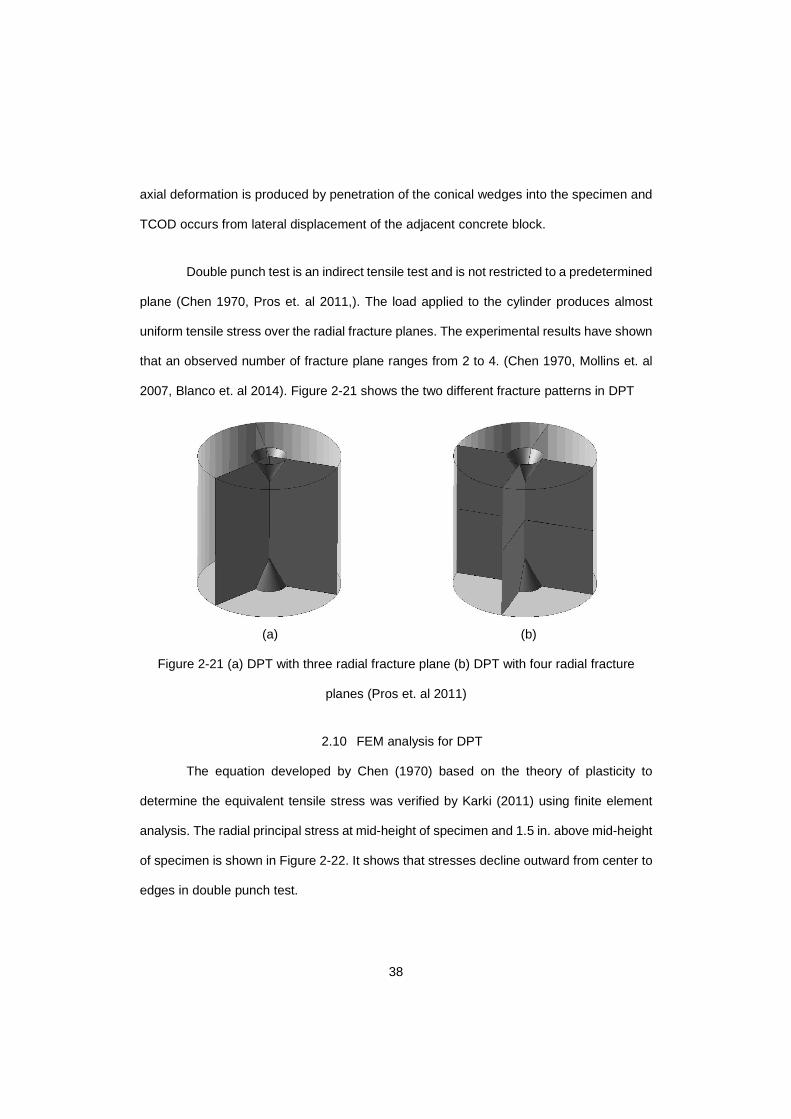
38
axial deformation is produced by penetration of the conical wedges into the specimen and
TCOD occurs from lateral displacement of the adjacent concrete block.
Double punch test is an indirect tensile test and is not restricted to a predetermined
plane (Chen 1970, Pros et. al 2011,). The load applied to the cylinder produces almost
uniform tensile stress over the radial fracture planes. The experimental results have shown
that an observed number of fracture plane ranges from 2 to 4. (Chen 1970, Mollins et. al
2007, Blanco et. al 2014). Figure 2-21 shows the two different fracture patterns in DPT
(a) (b)
Figure 2-21 (a) DPT with three radial fracture plane (b) DPT with four radial fracture
planes (Pros et. al 2011)
2.10 FEM analysis for DPT
The equation developed by Chen (1970) based on the theory of plasticity to
determine the equivalent tensile stress was verified by Karki (2011) using finite element
analysis. The radial principal stress at mid-height of specimen and 1.5 in. above mid-height
of specimen is shown in Figure 2-22. It shows that stresses decline outward from center to
edges in double punch test.
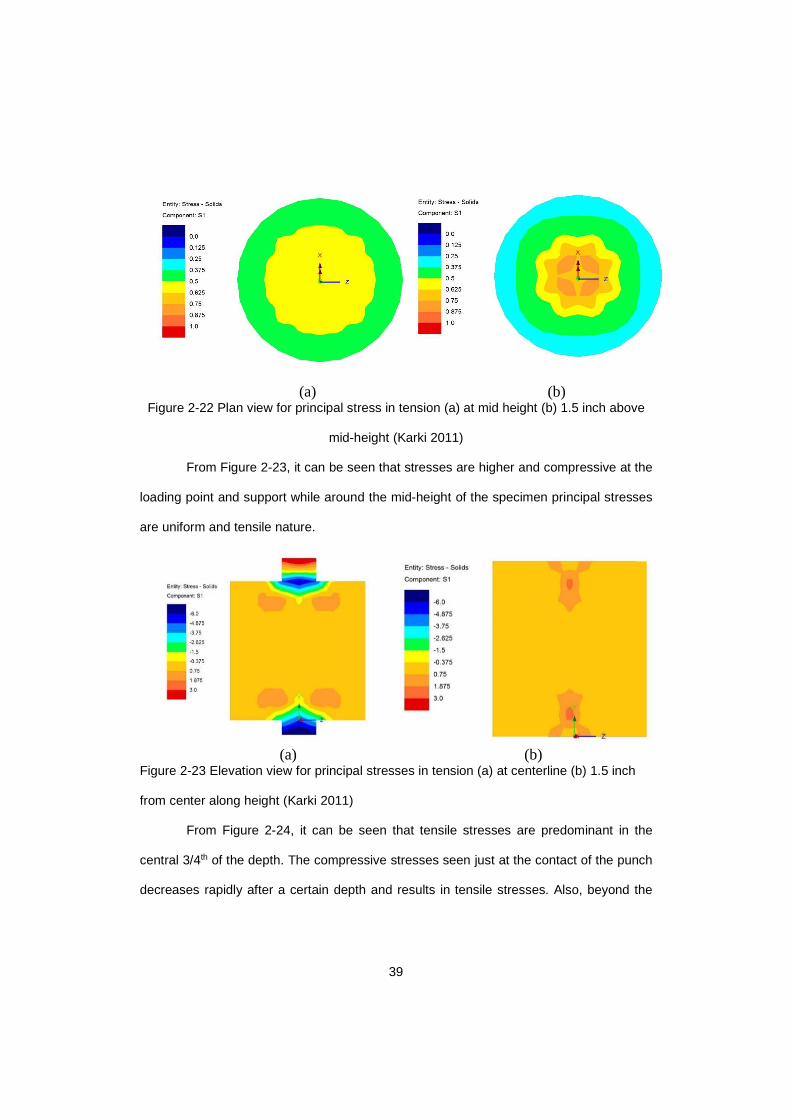
39
(a) (b) Figure 2-22 Plan view for principal stress in tension (a) at mid height (b) 1.5 inch above
mid-height (Karki 2011)
From Figure 2-23, it can be seen that stresses are higher and compressive at the
loading point and support while around the mid-height of the specimen principal stresses
are uniform and tensile nature.
(a) (b)
Figure 2-23 Elevation view for principal stresses in tension (a) at centerline (b) 1.5 inch
from center along height (Karki 2011)
From Figure 2-24, it can be seen that tensile stresses are predominant in the
central 3/4th of the depth. The compressive stresses seen just at the contact of the punch
decreases rapidly after a certain depth and results in tensile stresses. Also, beyond the
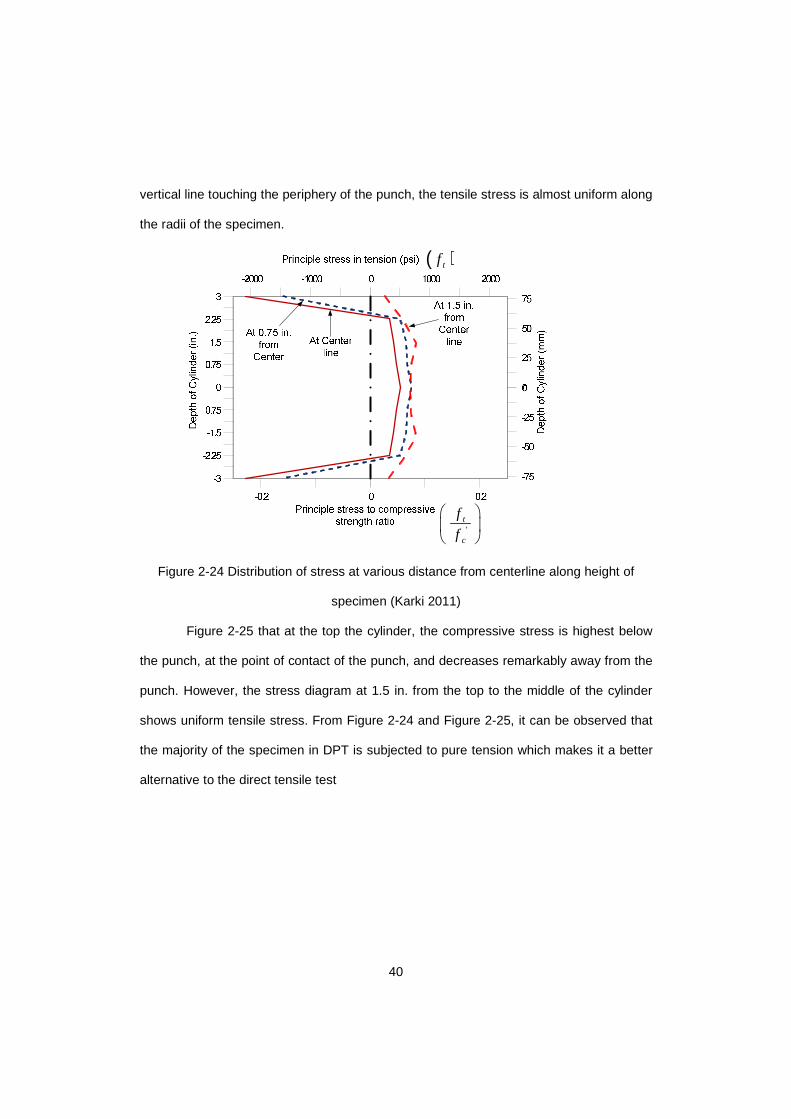
40
vertical line touching the periphery of the punch, the tensile stress is almost uniform along
the radii of the specimen.
't
c
f
f
( )tf
Figure 2-24 Distribution of stress at various distance from centerline along height of
specimen (Karki 2011)
Figure 2-25 that at the top the cylinder, the compressive stress is highest below
the punch, at the point of contact of the punch, and decreases remarkably away from the
punch. However, the stress diagram at 1.5 in. from the top to the middle of the cylinder
shows uniform tensile stress. From Figure 2-24 and Figure 2-25, it can be observed that
the majority of the specimen in DPT is subjected to pure tension which makes it a better
alternative to the direct tensile test
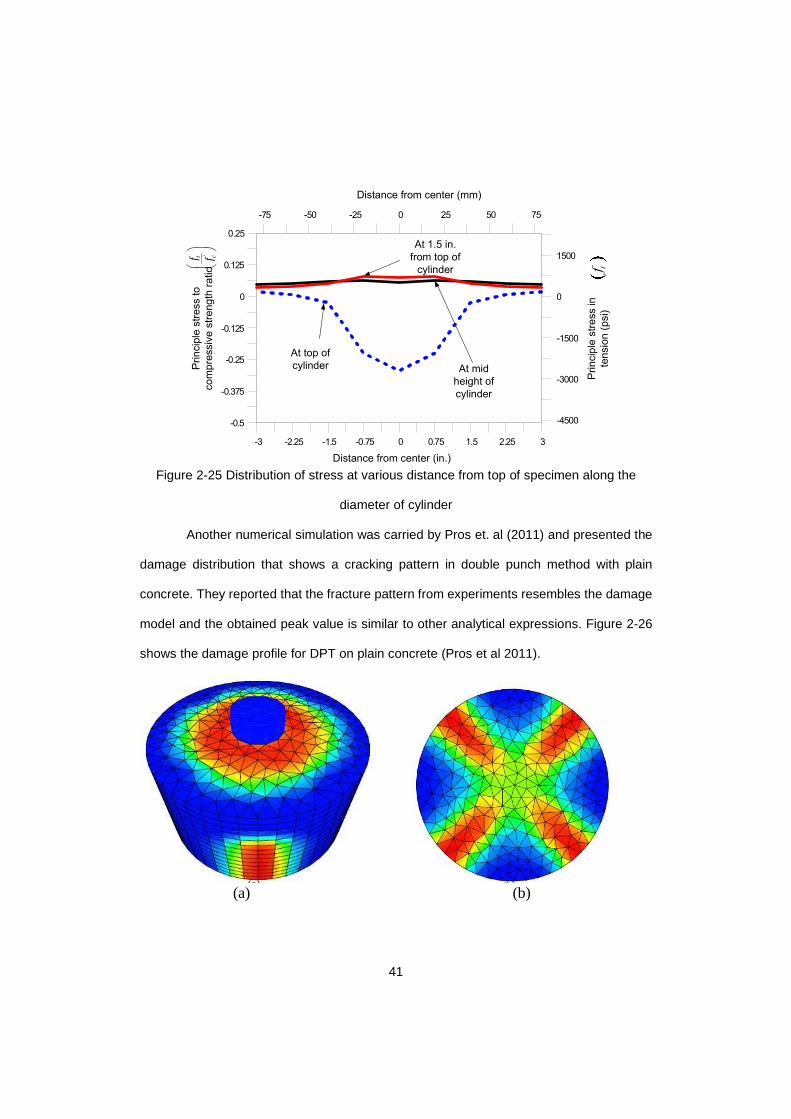
41
At mid
height of
cylinder
At top of
cylinder
At 1.5 in.
from top of
cylinder
-3 -2.25 -1.5 -0.75 0 0.75 1.5 2.25 3
-0.5
-0.375
-0.25
-0.125
0
0.125
0.25
-75 -50 -25 0 25 50 75
-4500
-3000
-1500
0
1500
Distance from center (in.)
Distance from center (mm)
tfP
rin
cip
le s
tre
ss in
ten
sio
n (
psi)
Prin
cip
le s
tre
ss to
co
mp
ressiv
e s
tre
ng
th r
atio
't cf f
Figure 2-25 Distribution of stress at various distance from top of specimen along the
diameter of cylinder
Another numerical simulation was carried by Pros et. al (2011) and presented the
damage distribution that shows a cracking pattern in double punch method with plain
concrete. They reported that the fracture pattern from experiments resembles the damage
model and the obtained peak value is similar to other analytical expressions. Figure 2-26
shows the damage profile for DPT on plain concrete (Pros et al 2011).
(a) (b)
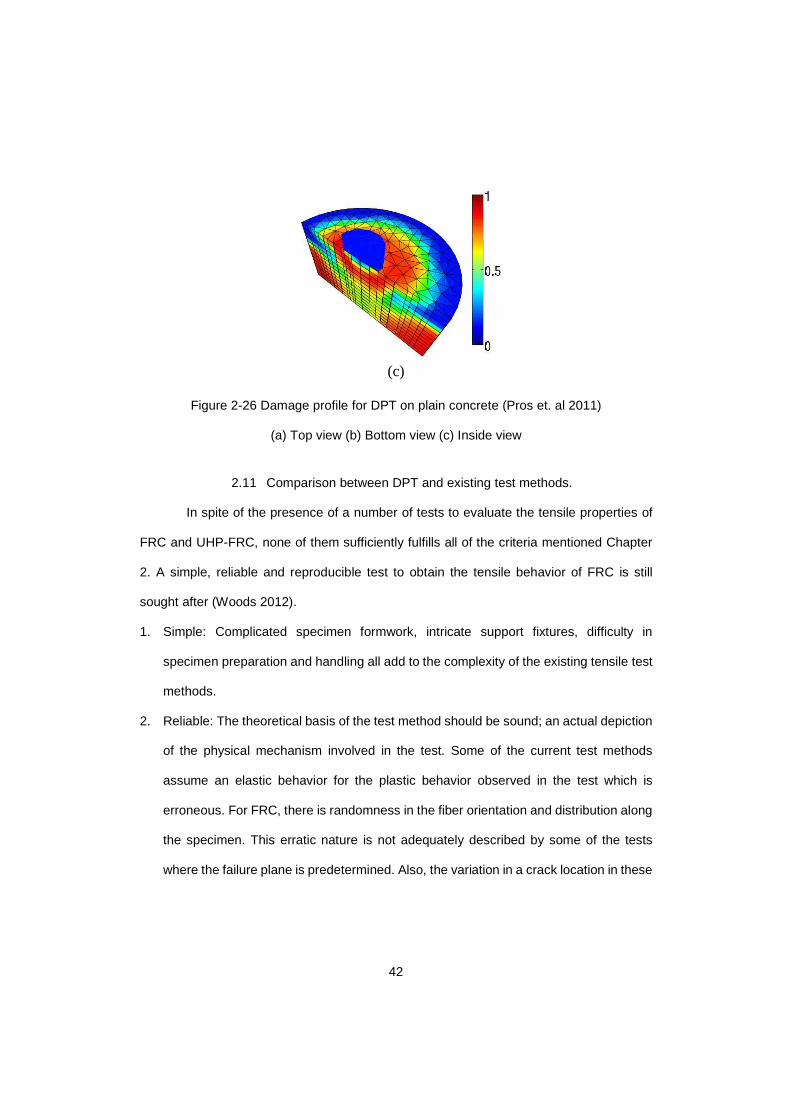
42
(c)
Figure 2-26 Damage profile for DPT on plain concrete (Pros et. al 2011)
(a) Top view (b) Bottom view (c) Inside view
2.11 Comparison between DPT and existing test methods.
In spite of the presence of a number of tests to evaluate the tensile properties of
FRC and UHP-FRC, none of them sufficiently fulfills all of the criteria mentioned Chapter
2. A simple, reliable and reproducible test to obtain the tensile behavior of FRC is still
sought after (Woods 2012).
1. Simple: Complicated specimen formwork, intricate support fixtures, difficulty in
specimen preparation and handling all add to the complexity of the existing tensile test
methods.
2. Reliable: The theoretical basis of the test method should be sound; an actual depiction
of the physical mechanism involved in the test. Some of the current test methods
assume an elastic behavior for the plastic behavior observed in the test which is
erroneous. For FRC, there is randomness in the fiber orientation and distribution along
the specimen. This erratic nature is not adequately described by some of the tests
where the failure plane is predetermined. Also, the variation in a crack location in these

43
tests intensifies the disadvantage mentioned. Furthermore, an increased single
operator coefficient of variation observed between batches adds to the unreliability.
3. Reproducing: A test needs be able to be reproduced between laboratories with an
acceptable degree of variation. However, the current test methods have a high
interlaboratory and multiple operator coefficients of variation. Also, a complicated
specimen and test procedures make it difficult to conduct a number of tests to obtain
sufficient data to be able to emulate the test between laboratories.
The double punch method is attractive to use for FRC due to the basic testing
arrangement and straightforward technique. The same testing machine and similar
instrumentation can be used for both compressive strength and tensile strength test. DPT
is conducted by loading the specimen under compression. As a result, the complications
seen in direct tensile tests such as eccentricity and complicated test setup can be avoided.
Apart from other tensile tests, DPT specimen is small and light, a 6x6 in. specimen about
15 lbs, and the test can be conducted using a simple arrangement of LVDTs, with
appropriate stroke, and a load cell for measuring the axial deformation and compressive
force respectively. Moreover, results obtained from indirect tensile tests are more
consistent and comparable to results from bending and tensile tests. DPT also takes
advantage of the absence of predetermined failure plane in the test setup. It results in
multiple possible fracture planes which help to take into account the random fiber
dispersion and orientation within the specimen giving an actual depiction of the fiber-
reinforcement effect which the characteristic feature of FRC. The comparison between the
existing test method and double punch test are presented in Table 2-5 and Table 2-6.
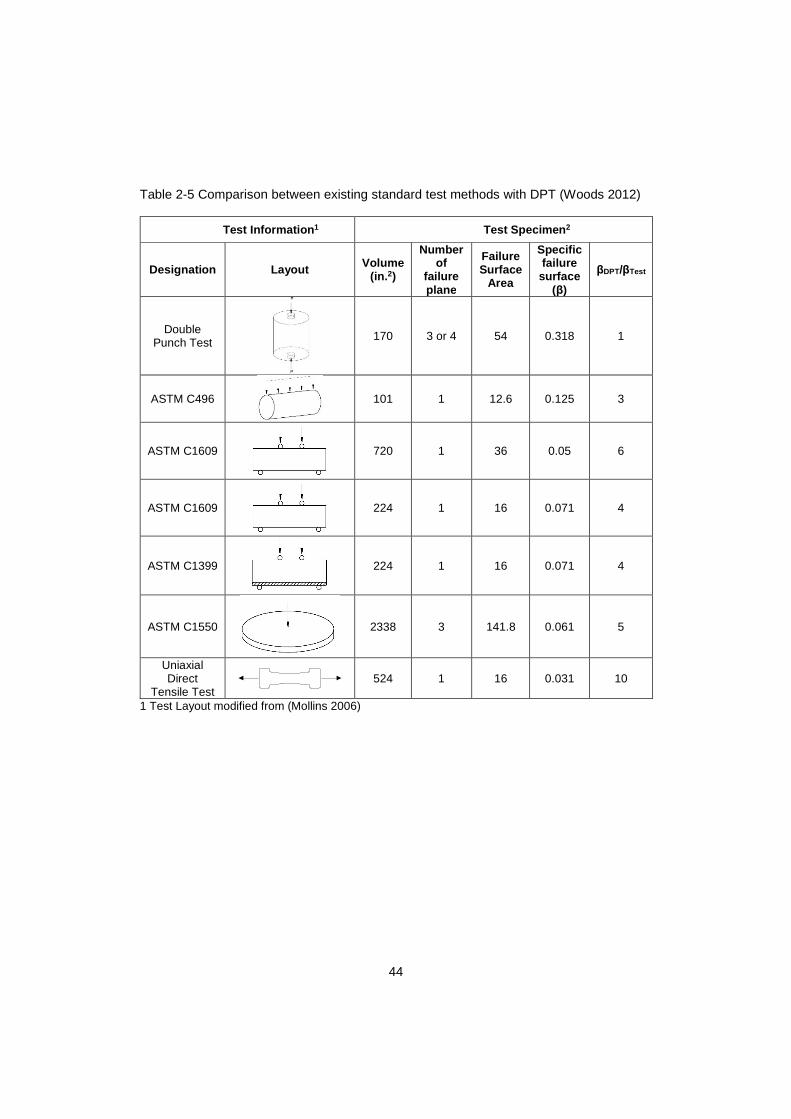
44
Table 2-5 Comparison between existing standard test methods with DPT (Woods 2012)
Test Information 1 Test Specimen 2
Designation Layout Volume (in.2)
Number of
failure plane
Failure Surface
Area
Specific failure surface
(β)
βDPT/βTest
Double Punch Test
170 3 or 4 54 0.318 1
ASTM C496
101 1 12.6 0.125 3
ASTM C1609
720 1 36 0.05 6
ASTM C1609
224 1 16 0.071 4
ASTM C1399
224 1 16 0.071 4
ASTM C1550
2338 3 141.8 0.061 5
Uniaxial Direct
Tensile Test 524 1 16 0.031 10
1 Test Layout modified from (Mollins 2006)
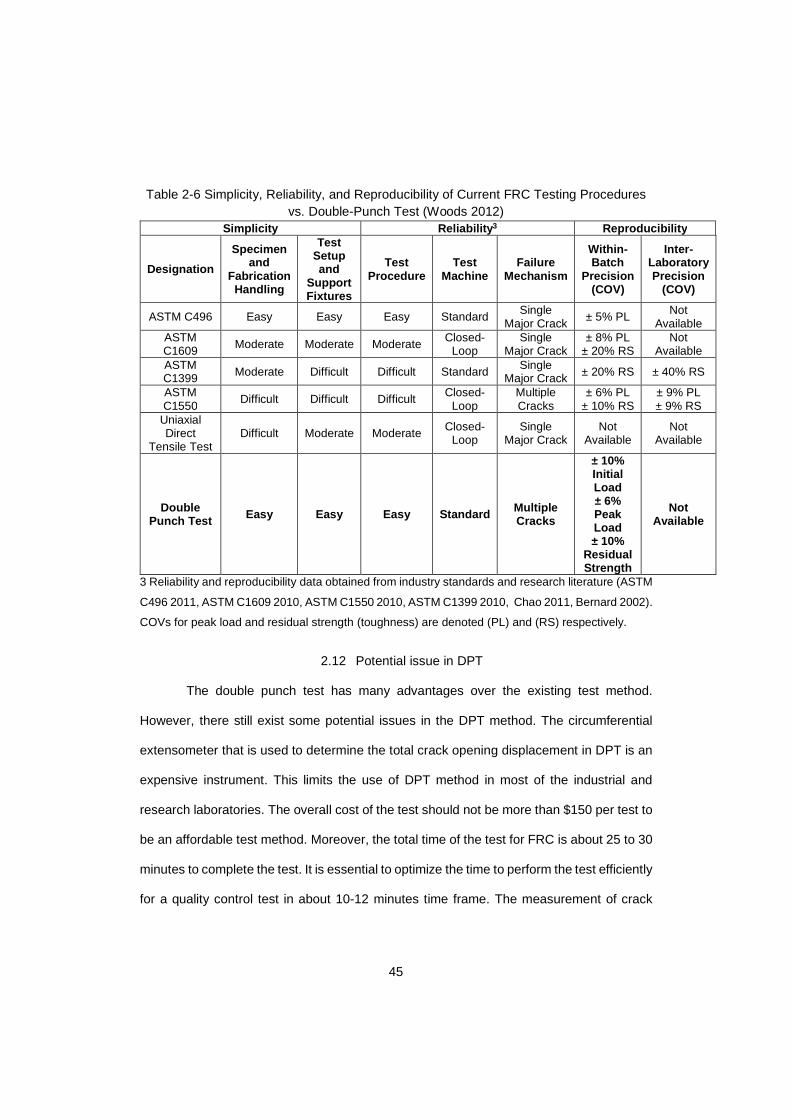
45
Table 2-6 Simplicity, Reliability, and Reproducibility of Current FRC Testing Procedures vs. Double-Punch Test (Woods 2012)
Simplicity Reliability 3 Reproducibility
Designation
Specimen and
Fabrication Handling
Test Setup and
Support Fixtures
Test Procedure
Test Machine
Failure Mechanism
Within-Batch
Precision (COV)
Inter-Laboratory Precision
(COV)
ASTM C496 Easy Easy Easy Standard Single Major Crack
± 5% PL Not Available
ASTM C1609 Moderate Moderate Moderate Closed-
Loop Single
Major Crack ± 8% PL
± 20% RS Not
Available ASTM C1399 Moderate Difficult Difficult Standard Single
Major Crack ± 20% RS ± 40% RS
ASTM C1550
Difficult Difficult Difficult Closed-Loop
Multiple Cracks
± 6% PL ± 10% RS
± 9% PL ± 9% RS
Uniaxial Direct
Tensile Test Difficult Moderate Moderate Closed-
Loop Single
Major Crack Not
Available Not
Available
Double Punch Test Easy Easy Easy Standard Multiple
Cracks
± 10% Initial Load ± 6% Peak Load ± 10%
Residual Strength
Not Available
3 Reliability and reproducibility data obtained from industry standards and research literature (ASTM
C496 2011, ASTM C1609 2010, ASTM C1550 2010, ASTM C1399 2010, Chao 2011, Bernard 2002).
COVs for peak load and residual strength (toughness) are denoted (PL) and (RS) respectively.
2.12 Potential issue in DPT
The double punch test has many advantages over the existing test method.
However, there still exist some potential issues in the DPT method. The circumferential
extensometer that is used to determine the total crack opening displacement in DPT is an
expensive instrument. This limits the use of DPT method in most of the industrial and
research laboratories. The overall cost of the test should not be more than $150 per test to
be an affordable test method. Moreover, the total time of the test for FRC is about 25 to 30
minutes to complete the test. It is essential to optimize the time to perform the test efficiently
for a quality control test in about 10-12 minutes time frame. The measurement of crack
46
width and inspection of a number of cracks are the important parameter for evaluating the
characteristics of any concrete material. It is time-consuming to measure the crack width
in a test by conventional visual inspection and automated crack width measurement is
indispensable.
2.13 Research Objectives
The current standardized test methods have one or more limitations that make it
unfeasible, unreliable, or inconsistent for evaluating the performance of FRC. This has
negatively affected the acceptance of FRC applications into structural design codes. A
more practical, reliable, and consistent test method is needed for evaluating the
characteristics of FRC with different fiber types, fiber volume fractions, and mixture
designs. The following are the objectives of this research:
1. To develop a standard systematic test procedure with the optimum rate for the
DPT and examine consistency between accuracy, efficiency and time for the test.
2. To determine the relationship between axial deformation and circumferential strain
using double punch test (DPT) method applicable to FRC and UHP-FRC.
3. To derive a simple formula to estimate the average and maximum crack widths,
which allows DPT to only use LVDTs without using circumferential extensometer
and other instrumentation.
4. To assess the suitability of DPT method for UHP-FRC material in determining
tensile strength and behavior in post cracking phase.
5. To evaluate the qualitative and comparative assessment of the influence of fiber
dosage from the nature of the cracks (number and crack width) for FRC and UHP-
FRC for long fibers.
6. To investigate the effect of specimen sizes in DPT for FRC and UHP-FRC when
long fibers are used.

47
Chapter 3
Double Punch Test – Experimental Program
The main purpose of this research is to unify and develop a tensile test method
which is suitable for both FRC and UHPFRC. This Double Punch Test has been proven to
be easier, more reliable and faster than the current test method for FRC. The experimental
programs are divided into following stages as shown in Figure 3-1:
3.1 Experimental Program Overview
Figure 3-1: Experimental program
Phase 1
For the first phase of this research,48 FRC samples, with six number of cylinders
in each set, set 1, 2, 3, 4, were cast with 0.35%, 0.45%, 0.55% and 0.75% fiber by volume
respectively to analyze the effects of fiber volume fraction on coefficient of variation and
DOUBLE PUNCH TEST
FRC (PHASE 1)
Fiber dosage(48 samples)
Displacement rates (20 samples)
Specimen sizes (29 samples)
Direct Tensile Test (6 samples)
UHP-FRC (PHASE 2)
Fiber type(18 samples)
Displacement rates(18 samples)
Specimen height(36 samples)
Direct Tensile Test(6 samples)

48
average value of key parameters of DPT. For this, the 48 samples were tested at the
displacement rate of 0.02 in./min with 12 specimens for each fiber dosage. For the next set
(Set 5) eight cylinders (6x12) with 0.55% fibers by volume were cast and among them, four
6x6 specimens were tested at the displacement rate of 0.012 in./min, 0.02 in./min, 0.04
in./min and 0.05 in./min each to investigate post-cracking behavior in various displacement
rate in each case. Another purpose was to explore the behavior of post-peak behavior and
tensile strength by change the height and diameter of the specimen. In the next step, the
post-peak behavior and tensile strength with the change in height and diameter of the
specimen were studied. In the set 6, six DPT samples and three DTT samples were cast
with 0.35% Vf. Figure 3-2 is the detailed experimental program for FRC.
Figure 3-2: Experimental program for Phase 1 (FRC)
DOUBLE PUNCH TEST
FRC (PHASE 1)
Fiber volume fraction (dosage)
0.35 % (28 kg/m3)
0.45 %(36 kg/m3)
0.55 % (44 kg/m3)
0.75 % (60 kg/m3)
Displacement rates
0.012 in./min
0.02 in./min
0.04 in./min
0.05 in./min
Specimen sizes(Diameter x Height)
6 x 6 in.
6 x 4 in.
8 x 8 in.
Direct Tensile Test
0.35 %0.04 in./min
6 x 6 in.
0.75 %0.04 in./min
6 x 6 in.
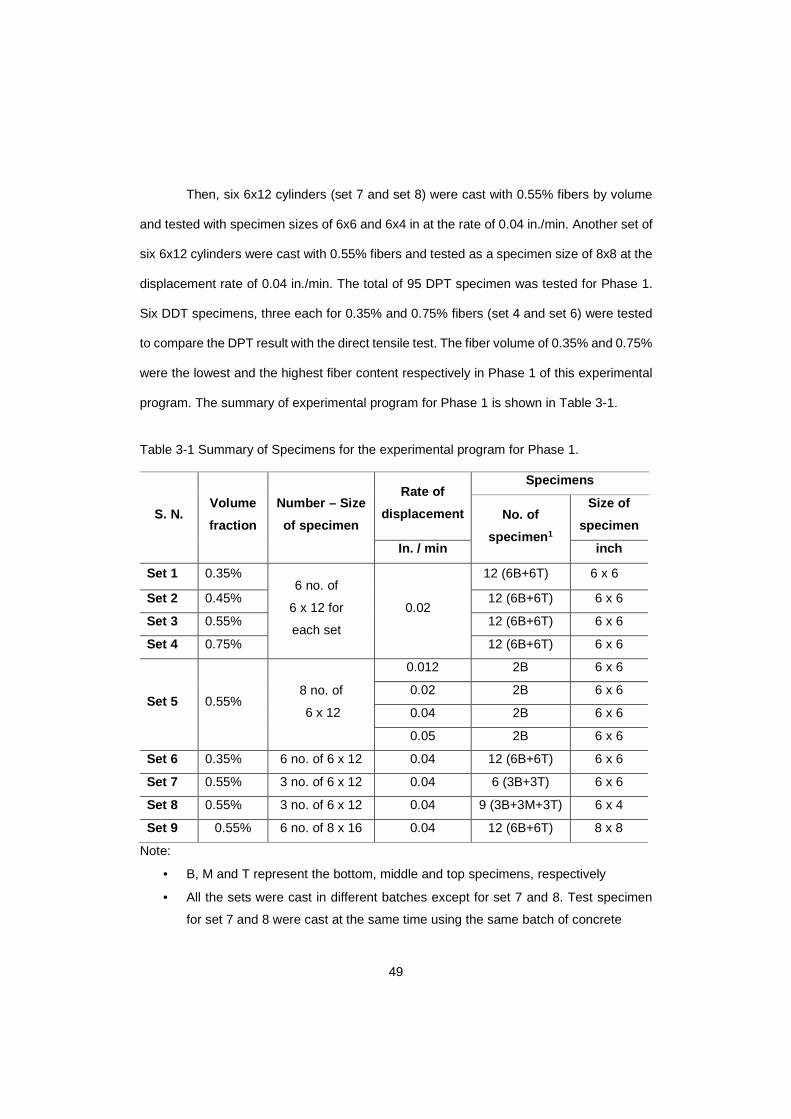
49
Then, six 6x12 cylinders (set 7 and set 8) were cast with 0.55% fibers by volume
and tested with specimen sizes of 6x6 and 6x4 in at the rate of 0.04 in./min. Another set of
six 6x12 cylinders were cast with 0.55% fibers and tested as a specimen size of 8x8 at the
displacement rate of 0.04 in./min. The total of 95 DPT specimen was tested for Phase 1.
Six DDT specimens, three each for 0.35% and 0.75% fibers (set 4 and set 6) were tested
to compare the DPT result with the direct tensile test. The fiber volume of 0.35% and 0.75%
were the lowest and the highest fiber content respectively in Phase 1 of this experimental
program. The summary of experimental program for Phase 1 is shown in Table 3-1.
Table 3-1 Summary of Specimens for the experimental program for Phase 1.
S. N. Volume
fraction
Number – Size
of specimen
Rate of
displacement
Specimens
No. of
specimen 1
Size of
specimen
In. / min inch
Set 1 0.35% 6 no. of
6 x 12 for
each set
0.02
12 (6B+6T) 6 x 6
Set 2 0.45% 12 (6B+6T) 6 x 6
Set 3 0.55% 12 (6B+6T) 6 x 6
Set 4 0.75% 12 (6B+6T) 6 x 6
Set 5 0.55% 8 no. of
6 x 12
0.012 2B 6 x 6
0.02 2B 6 x 6
0.04 2B 6 x 6
0.05 2B 6 x 6
Set 6 0.35% 6 no. of 6 x 12 0.04 12 (6B+6T) 6 x 6
Set 7 0.55% 3 no. of 6 x 12 0.04 6 (3B+3T) 6 x 6
Set 8 0.55% 3 no. of 6 x 12 0.04 9 (3B+3M+3T) 6 x 4
Set 9 0.55% 6 no. of 8 x 16 0.04 12 (6B+6T) 8 x 8
Note:
• B, M and T represent the bottom, middle and top specimens, respectively
• All the sets were cast in different batches except for set 7 and 8. Test specimen
for set 7 and 8 were cast at the same time using the same batch of concrete
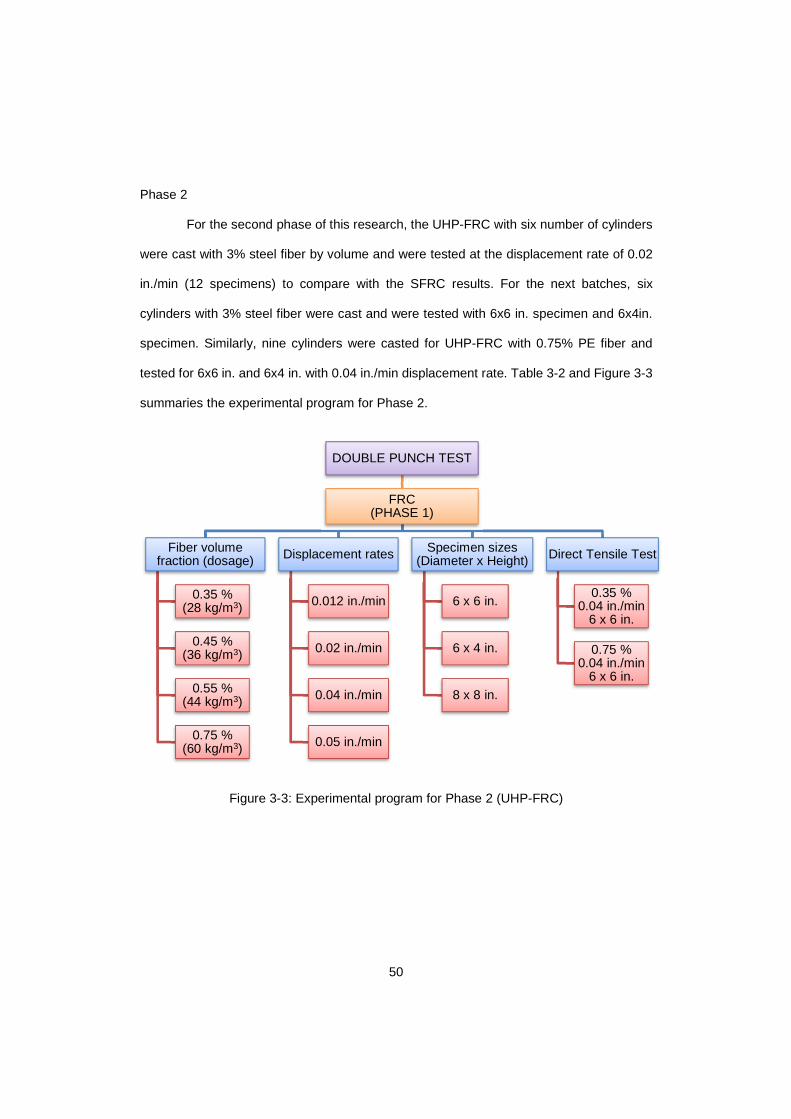
50
Phase 2
For the second phase of this research, the UHP-FRC with six number of cylinders
were cast with 3% steel fiber by volume and were tested at the displacement rate of 0.02
in./min (12 specimens) to compare with the SFRC results. For the next batches, six
cylinders with 3% steel fiber were cast and were tested with 6x6 in. specimen and 6x4in.
specimen. Similarly, nine cylinders were casted for UHP-FRC with 0.75% PE fiber and
tested for 6x6 in. and 6x4 in. with 0.04 in./min displacement rate. Table 3-2 and Figure 3-3
summaries the experimental program for Phase 2.
Figure 3-3: Experimental program for Phase 2 (UHP-FRC)
DOUBLE PUNCH TEST
FRC (PHASE 1)
Fiber volume fraction (dosage)
0.35 % (28 kg/m3)
0.45 %(36 kg/m3)
0.55 % (44 kg/m3)
0.75 % (60 kg/m3)
Displacement rates
0.012 in./min
0.02 in./min
0.04 in./min
0.05 in./min
Specimen sizes(Diameter x Height)
6 x 6 in.
6 x 4 in.
8 x 8 in.
Direct Tensile Test
0.35 %0.04 in./min
6 x 6 in.
0.75 %0.04 in./min
6 x 6 in.
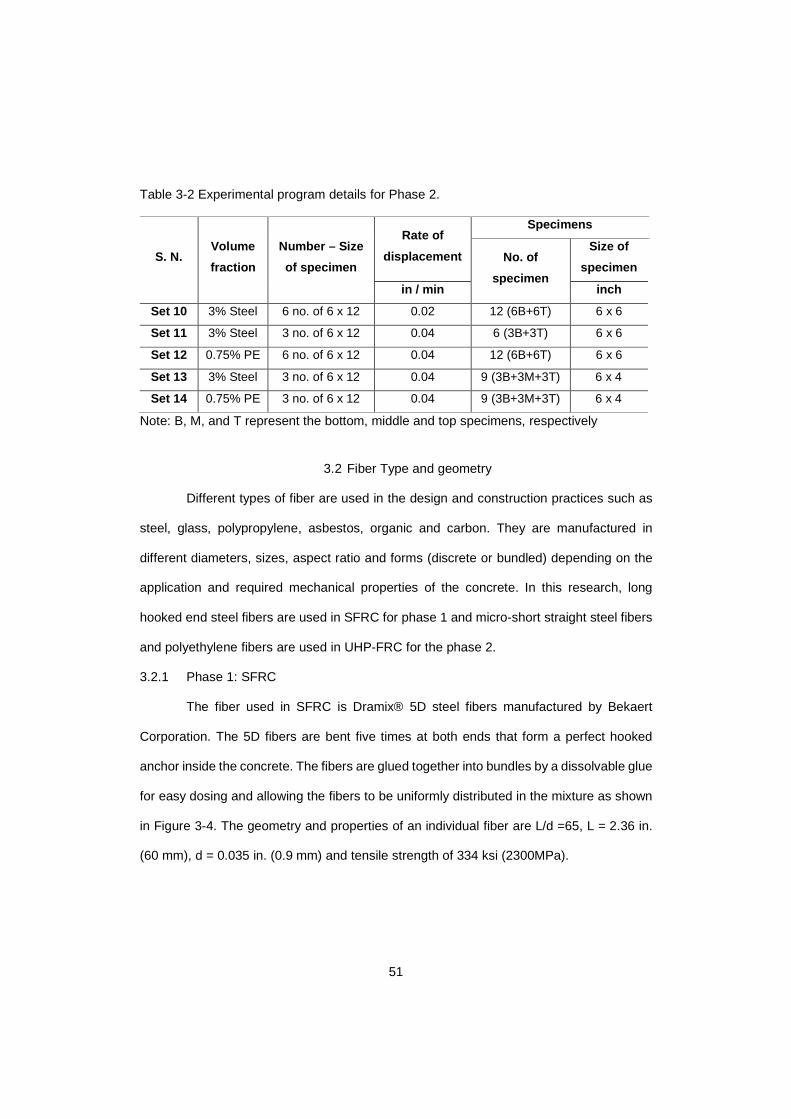
51
Table 3-2 Experimental program details for Phase 2.
S. N. Volume
fraction
Number – Size
of specimen
Rate of
displacement
Specimens
No. of
specimen
Size of
specimen
in / min inch
Set 10 3% Steel 6 no. of 6 x 12 0.02 12 (6B+6T) 6 x 6
Set 11 3% Steel 3 no. of 6 x 12 0.04 6 (3B+3T) 6 x 6
Set 12 0.75% PE 6 no. of 6 x 12 0.04 12 (6B+6T) 6 x 6
Set 13 3% Steel 3 no. of 6 x 12 0.04 9 (3B+3M+3T) 6 x 4
Set 14 0.75% PE 3 no. of 6 x 12 0.04 9 (3B+3M+3T) 6 x 4
Note: B, M, and T represent the bottom, middle and top specimens, respectively
3.2 Fiber Type and geometry
Different types of fiber are used in the design and construction practices such as
steel, glass, polypropylene, asbestos, organic and carbon. They are manufactured in
different diameters, sizes, aspect ratio and forms (discrete or bundled) depending on the
application and required mechanical properties of the concrete. In this research, long
hooked end steel fibers are used in SFRC for phase 1 and micro-short straight steel fibers
and polyethylene fibers are used in UHP-FRC for the phase 2.
3.2.1 Phase 1: SFRC
The fiber used in SFRC is Dramix® 5D steel fibers manufactured by Bekaert
Corporation. The 5D fibers are bent five times at both ends that form a perfect hooked
anchor inside the concrete. The fibers are glued together into bundles by a dissolvable glue
for easy dosing and allowing the fibers to be uniformly distributed in the mixture as shown
in Figure 3-4. The geometry and properties of an individual fiber are L/d =65, L = 2.36 in.
(60 mm), d = 0.035 in. (0.9 mm) and tensile strength of 334 ksi (2300MPa).
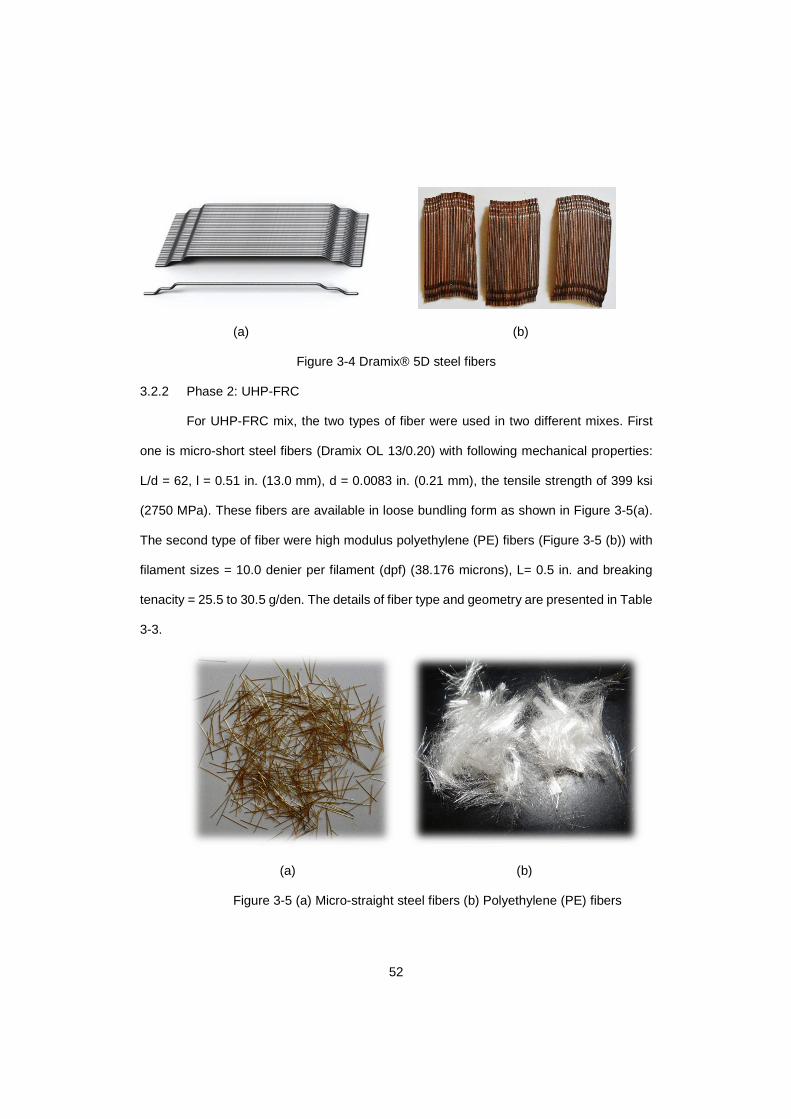
52
(a) (b)
Figure 3-4 Dramix® 5D steel fibers
3.2.2 Phase 2: UHP-FRC
For UHP-FRC mix, the two types of fiber were used in two different mixes. First
one is micro-short steel fibers (Dramix OL 13/0.20) with following mechanical properties:
L/d = 62, l = 0.51 in. (13.0 mm), d = 0.0083 in. (0.21 mm), the tensile strength of 399 ksi
(2750 MPa). These fibers are available in loose bundling form as shown in Figure 3-5(a).
The second type of fiber were high modulus polyethylene (PE) fibers (Figure 3-5 (b)) with
filament sizes = 10.0 denier per filament (dpf) (38.176 microns), L= 0.5 in. and breaking
tenacity = 25.5 to 30.5 g/den. The details of fiber type and geometry are presented in Table
3-3.
(a) (b)
Figure 3-5 (a) Micro-straight steel fibers (b) Polyethylene (PE) fibers
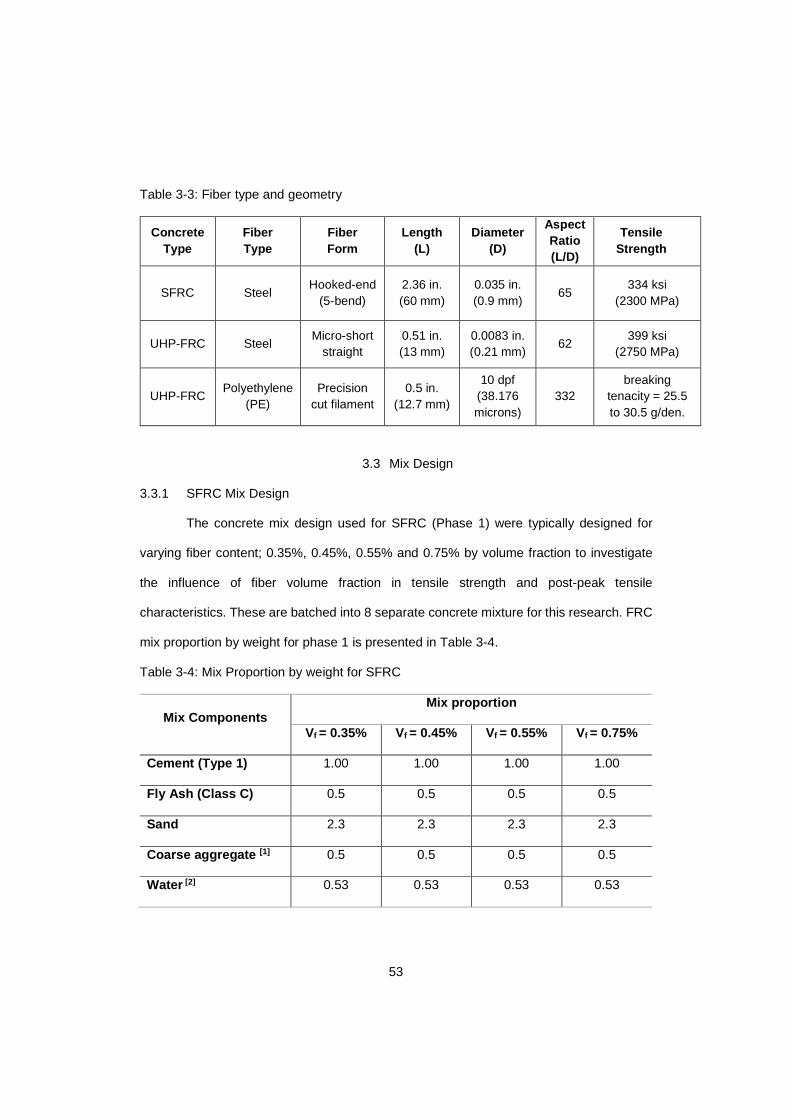
53
Table 3-3: Fiber type and geometry
Concrete Type
Fiber Type
Fiber Form
Length (L)
Diameter (D)
Aspect Ratio (L/D)
Tensile Strength
SFRC Steel Hooked-end
(5-bend) 2.36 in. (60 mm)
0.035 in. (0.9 mm)
65 334 ksi
(2300 MPa)
UHP-FRC Steel Micro-short
straight 0.51 in. (13 mm)
0.0083 in. (0.21 mm)
62 399 ksi
(2750 MPa)
UHP-FRC Polyethylene
(PE) Precision
cut filament 0.5 in.
(12.7 mm)
10 dpf (38.176 microns)
332 breaking
tenacity = 25.5 to 30.5 g/den.
3.3 Mix Design
3.3.1 SFRC Mix Design
The concrete mix design used for SFRC (Phase 1) were typically designed for
varying fiber content; 0.35%, 0.45%, 0.55% and 0.75% by volume fraction to investigate
the influence of fiber volume fraction in tensile strength and post-peak tensile
characteristics. These are batched into 8 separate concrete mixture for this research. FRC
mix proportion by weight for phase 1 is presented in Table 3-4.
Table 3-4: Mix Proportion by weight for SFRC
Mix Components Mix proportion
Vf = 0.35% Vf = 0.45% Vf = 0.55% Vf = 0.75%
Cement (Type 1) 1.00 1.00 1.00 1.00
Fly Ash (Class C) 0.5 0.5 0.5 0.5
Sand 2.3 2.3 2.3 2.3
Coarse aggregate [1] 0.5 0.5 0.5 0.5
Water [2] 0.53 0.53 0.53 0.53
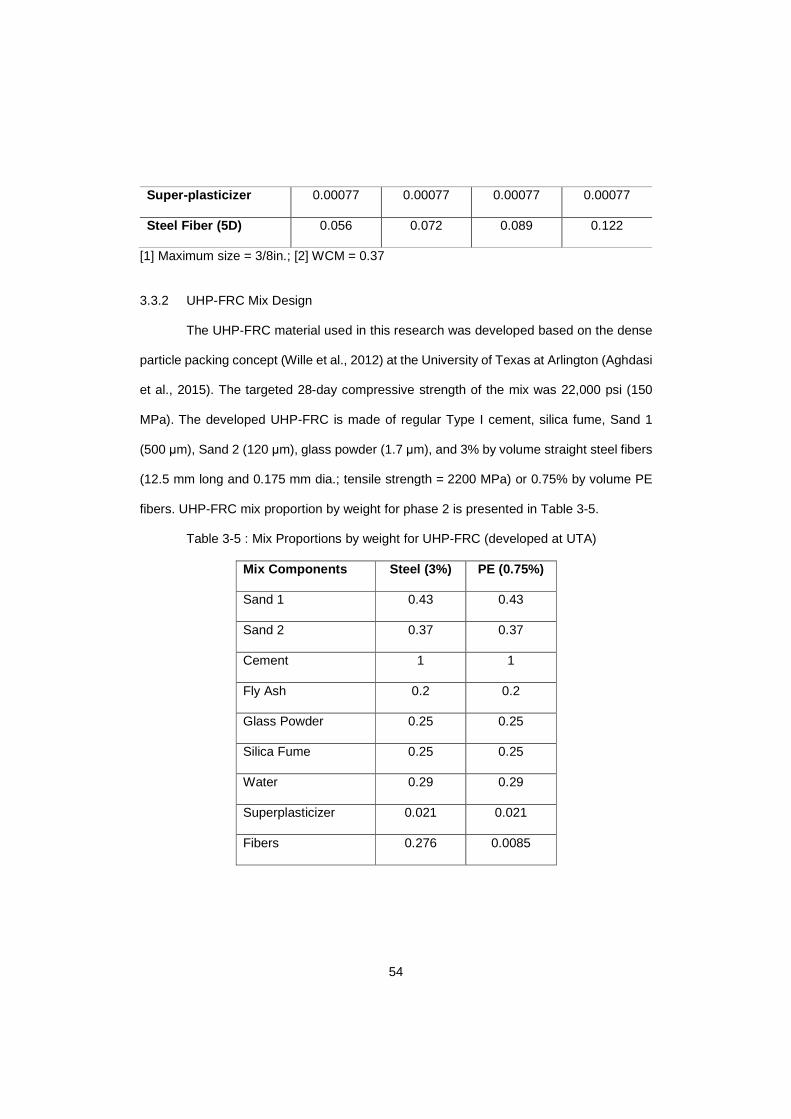
54
Super-plasticizer 0.00077 0.00077 0.00077 0.00077
Steel Fiber (5D) 0.056 0.072 0.089 0.122
[1] Maximum size = 3/8in.; [2] WCM = 0.37
3.3.2 UHP-FRC Mix Design
The UHP-FRC material used in this research was developed based on the dense
particle packing concept (Wille et al., 2012) at the University of Texas at Arlington (Aghdasi
et al., 2015). The targeted 28-day compressive strength of the mix was 22,000 psi (150
MPa). The developed UHP-FRC is made of regular Type I cement, silica fume, Sand 1
(500 μm), Sand 2 (120 μm), glass powder (1.7 μm), and 3% by volume straight steel fibers
(12.5 mm long and 0.175 mm dia.; tensile strength = 2200 MPa) or 0.75% by volume PE
fibers. UHP-FRC mix proportion by weight for phase 2 is presented in Table 3-5.
Table 3-5 : Mix Proportions by weight for UHP-FRC (developed at UTA)
Mix Components Steel (3%) PE (0.75%)
Sand 1 0.43 0.43
Sand 2 0.37 0.37
Cement 1 1
Fly Ash 0.2 0.2
Glass Powder 0.25 0.25
Silica Fume 0.25 0.25
Water 0.29 0.29
Superplasticizer 0.021 0.021
Fibers 0.276 0.0085

55
3.4 Formwork for the specimen
The reusable 6in. x 12in. steel or plastic concrete cylinder molds were used to
prepare the specimens for both phase 1 and phase 2 (Figure 3-6(a)). For the preparation
of 8in. x16in. cylinder specimen, the formwork was made by using ¾ in. PVC pipe and ¾
in. PVC board which was glued together and made water-tight by using sealant (Figure 3-6
(b)). The formwork for dog bone specimen for the direct tensile test is as shown in Figure
3-7.
(a) (b)
Figure 3-6: Mold for DPT specimens (a) 6 x 12 cylinder (b) 8 x 16 cylinder
Figure 3-7 Formwork for Direct Tensile Testing specimen
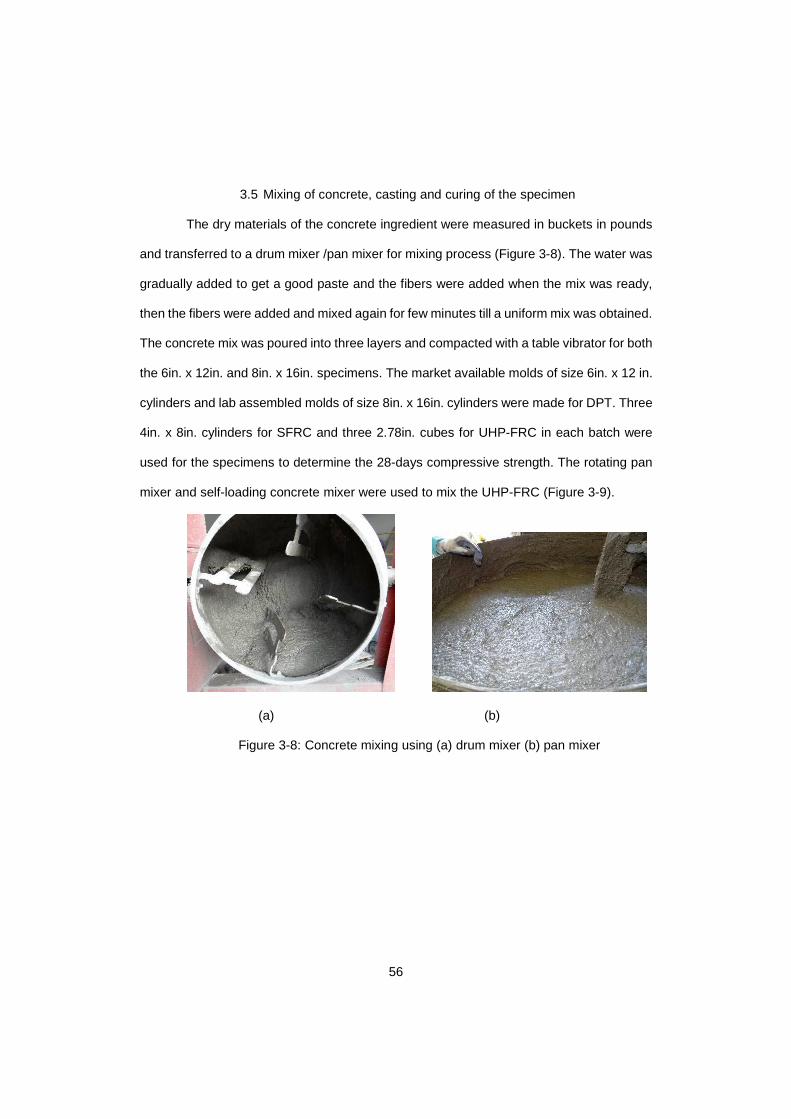
56
3.5 Mixing of concrete, casting and curing of the specimen
The dry materials of the concrete ingredient were measured in buckets in pounds
and transferred to a drum mixer /pan mixer for mixing process (Figure 3-8). The water was
gradually added to get a good paste and the fibers were added when the mix was ready,
then the fibers were added and mixed again for few minutes till a uniform mix was obtained.
The concrete mix was poured into three layers and compacted with a table vibrator for both
the 6in. x 12in. and 8in. x 16in. specimens. The market available molds of size 6in. x 12 in.
cylinders and lab assembled molds of size 8in. x 16in. cylinders were made for DPT. Three
4in. x 8in. cylinders for SFRC and three 2.78in. cubes for UHP-FRC in each batch were
used for the specimens to determine the 28-days compressive strength. The rotating pan
mixer and self-loading concrete mixer were used to mix the UHP-FRC (Figure 3-9).
(a) (b)
Figure 3-8: Concrete mixing using (a) drum mixer (b) pan mixer

57
(a)
(b)
Figure 3-9: Mixer used for UHP-FRC (a) Rotating pan mixer (b) Self-loading concrete
mixer
In this research, large-scale dog bone specimens with a cross-section area of 16.0
in.2 (10,323 mm2), 8 and 27 times larger than that of tested by Wille et al. (2011b) and
Ranade et al. (2013), respectively, were made for the direct tensile test. After casting, all
the specimens, DPT specimens, dog bone specimens, 2.78 in. cubes and 4in. x 8in.
cylinders were stored in a curing room with the controlled environment at 27o C (80o F) and
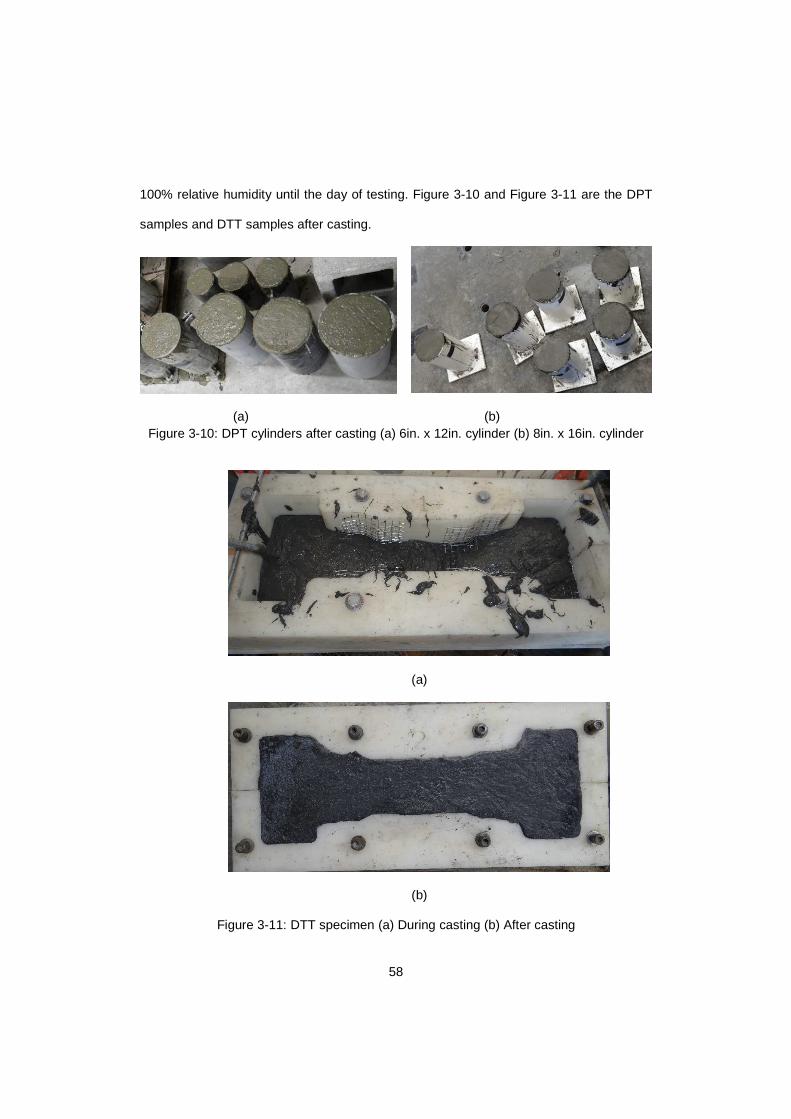
58
100% relative humidity until the day of testing. Figure 3-10 and Figure 3-11 are the DPT
samples and DTT samples after casting.
(a) (b) Figure 3-10: DPT cylinders after casting (a) 6in. x 12in. cylinder (b) 8in. x 16in. cylinder
(a)
(b)
Figure 3-11: DTT specimen (a) During casting (b) After casting
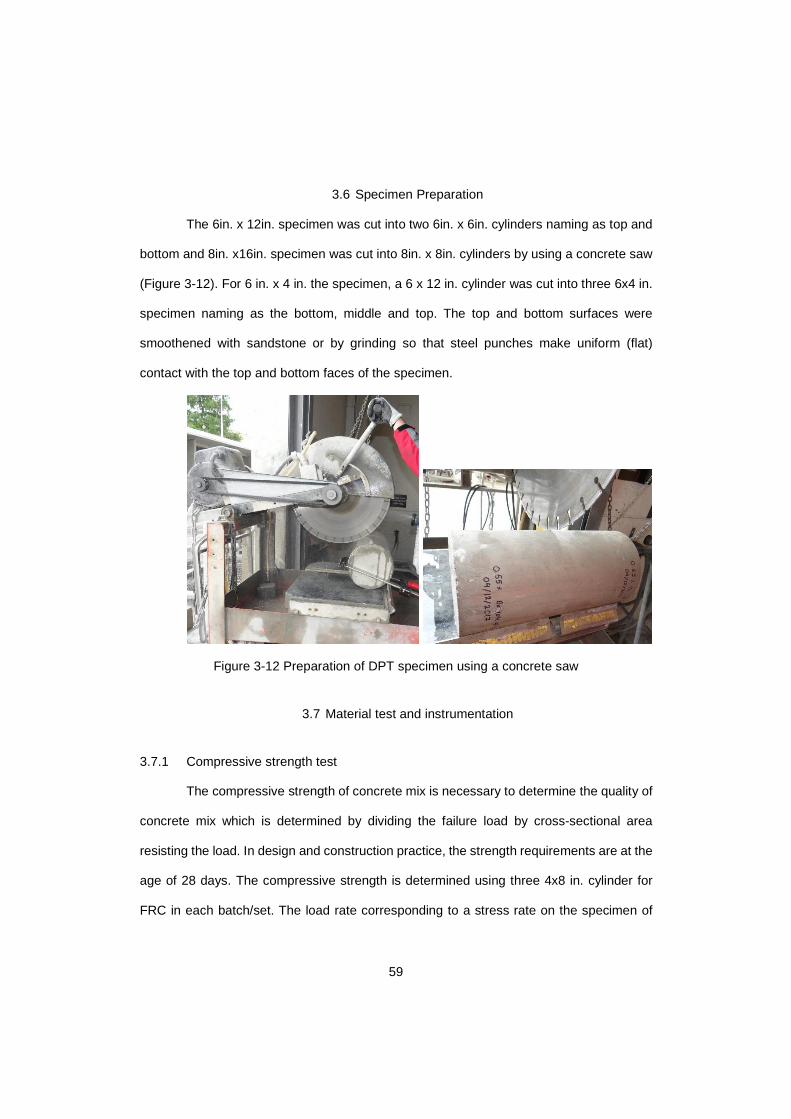
59
3.6 Specimen Preparation
The 6in. x 12in. specimen was cut into two 6in. x 6in. cylinders naming as top and
bottom and 8in. x16in. specimen was cut into 8in. x 8in. cylinders by using a concrete saw
(Figure 3-12). For 6 in. x 4 in. the specimen, a 6 x 12 in. cylinder was cut into three 6x4 in.
specimen naming as the bottom, middle and top. The top and bottom surfaces were
smoothened with sandstone or by grinding so that steel punches make uniform (flat)
contact with the top and bottom faces of the specimen.
Figure 3-12 Preparation of DPT specimen using a concrete saw
3.7 Material test and instrumentation
3.7.1 Compressive strength test
The compressive strength of concrete mix is necessary to determine the quality of
concrete mix which is determined by dividing the failure load by cross-sectional area
resisting the load. In design and construction practice, the strength requirements are at the
age of 28 days. The compressive strength is determined using three 4x8 in. cylinder for
FRC in each batch/set. The load rate corresponding to a stress rate on the specimen of
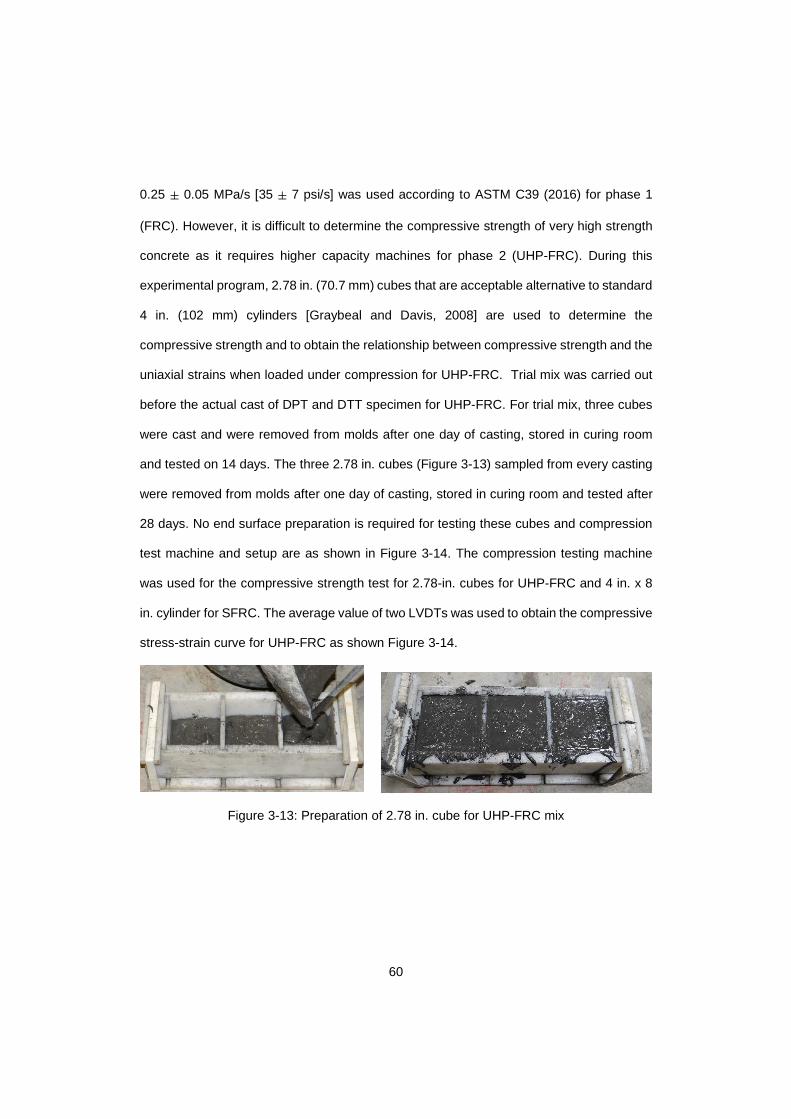
60
0.25 ± 0.05 MPa/s [35 ± 7 psi/s] was used according to ASTM C39 (2016) for phase 1
(FRC). However, it is difficult to determine the compressive strength of very high strength
concrete as it requires higher capacity machines for phase 2 (UHP-FRC). During this
experimental program, 2.78 in. (70.7 mm) cubes that are acceptable alternative to standard
4 in. (102 mm) cylinders [Graybeal and Davis, 2008] are used to determine the
compressive strength and to obtain the relationship between compressive strength and the
uniaxial strains when loaded under compression for UHP-FRC. Trial mix was carried out
before the actual cast of DPT and DTT specimen for UHP-FRC. For trial mix, three cubes
were cast and were removed from molds after one day of casting, stored in curing room
and tested on 14 days. The three 2.78 in. cubes (Figure 3-13) sampled from every casting
were removed from molds after one day of casting, stored in curing room and tested after
28 days. No end surface preparation is required for testing these cubes and compression
test machine and setup are as shown in Figure 3-14. The compression testing machine
was used for the compressive strength test for 2.78-in. cubes for UHP-FRC and 4 in. x 8
in. cylinder for SFRC. The average value of two LVDTs was used to obtain the compressive
stress-strain curve for UHP-FRC as shown Figure 3-14.
Figure 3-13: Preparation of 2.78 in. cube for UHP-FRC mix
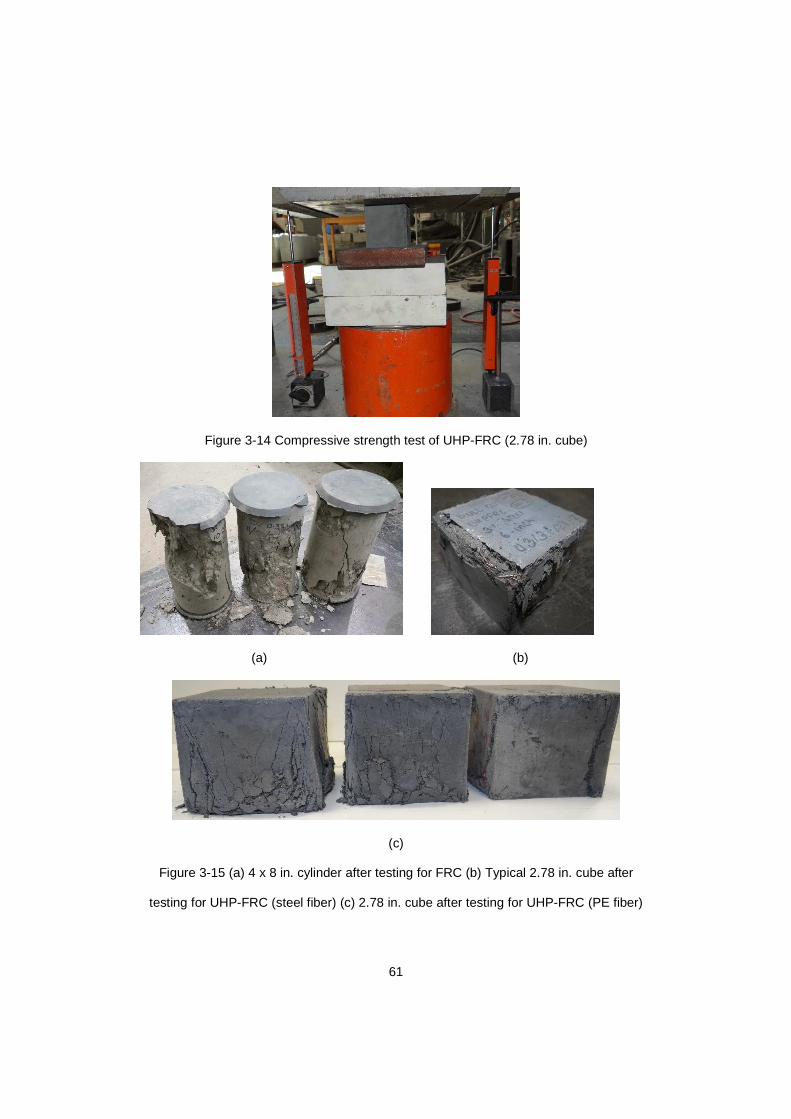
61
Figure 3-14 Compressive strength test of UHP-FRC (2.78 in. cube)
(a) (b)
(c)
Figure 3-15 (a) 4 x 8 in. cylinder after testing for FRC (b) Typical 2.78 in. cube after
testing for UHP-FRC (steel fiber) (c) 2.78 in. cube after testing for UHP-FRC (PE fiber)
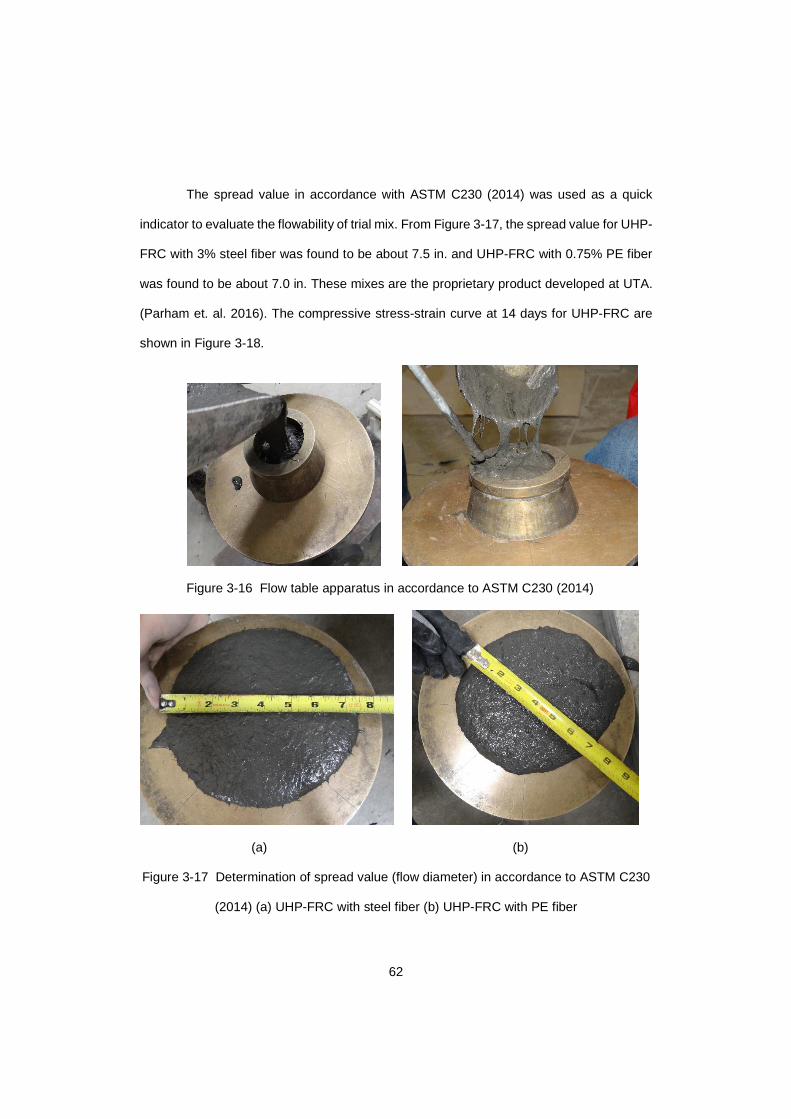
62
The spread value in accordance with ASTM C230 (2014) was used as a quick
indicator to evaluate the flowability of trial mix. From Figure 3-17, the spread value for UHP-
FRC with 3% steel fiber was found to be about 7.5 in. and UHP-FRC with 0.75% PE fiber
was found to be about 7.0 in. These mixes are the proprietary product developed at UTA.
(Parham et. al. 2016). The compressive stress-strain curve at 14 days for UHP-FRC are
shown in Figure 3-18.
Figure 3-16 Flow table apparatus in accordance to ASTM C230 (2014)
(a) (b)
Figure 3-17 Determination of spread value (flow diameter) in accordance to ASTM C230
(2014) (a) UHP-FRC with steel fiber (b) UHP-FRC with PE fiber
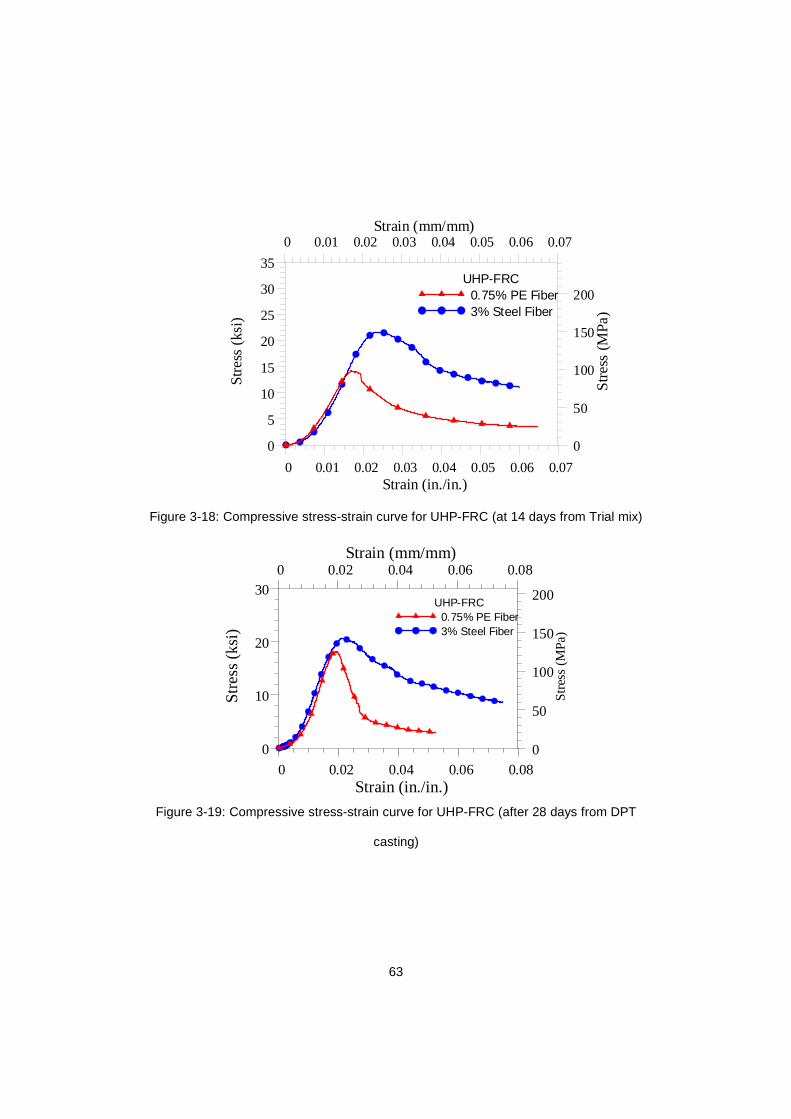
63
0 0.01 0.02 0.03 0.04 0.05 0.06 0.07Strain (in./in.)
0
5
10
15
20
25
30
35
Str
ess
(ksi
)0 0.01 0.02 0.03 0.04 0.05 0.06 0.07
Strain (mm/mm)
0
50
100
150
200
Str
ess
(MP
a)
UHP-FRC0.75% PE Fiber3% Steel Fiber
Figure 3-18: Compressive stress-strain curve for UHP-FRC (at 14 days from Trial mix)
Figure 3-19: Compressive stress-strain curve for UHP-FRC (after 28 days from DPT
casting)
0 0.02 0.04 0.06 0.08Strain (in./in.)
0
10
20
30
Str
ess
(ksi
)
0 0.02 0.04 0.06 0.08Strain (mm/mm)
0
50
100
150
200
Str
ess
(MP
a)
UHP-FRC0.75% PE Fiber3% Steel Fiber
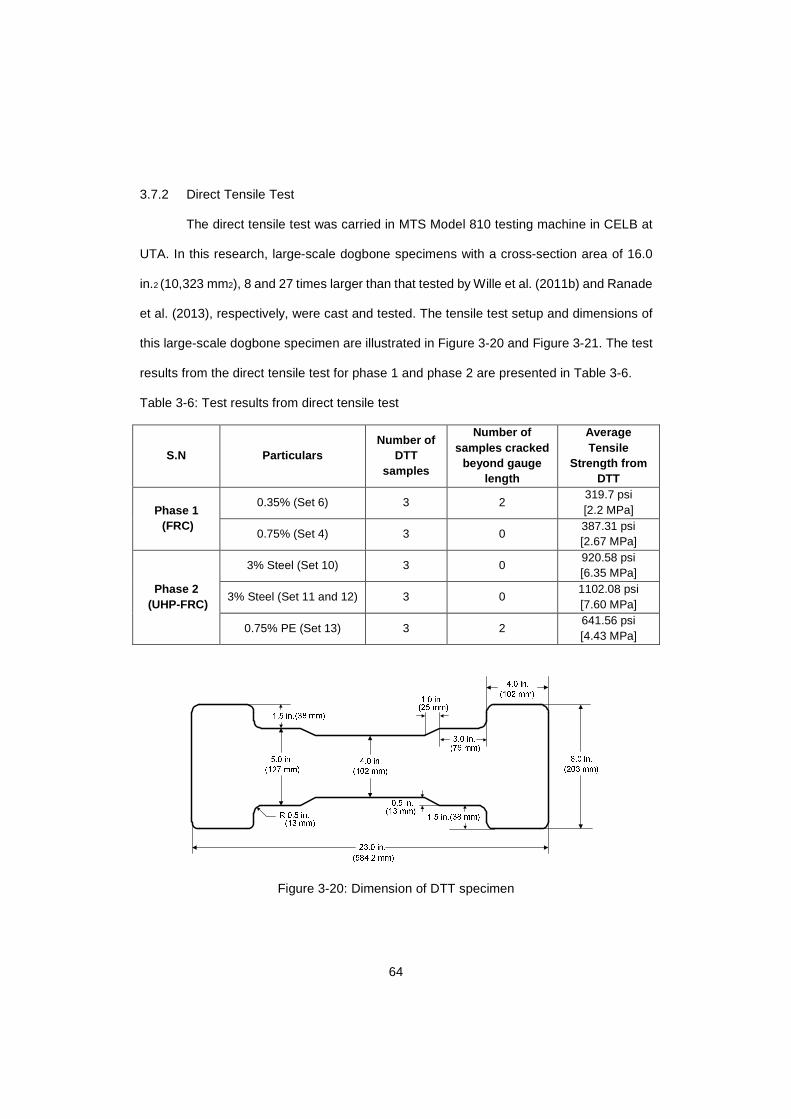
64
3.7.2 Direct Tensile Test
The direct tensile test was carried in MTS Model 810 testing machine in CELB at
UTA. In this research, large-scale dogbone specimens with a cross-section area of 16.0
in.2 (10,323 mm2), 8 and 27 times larger than that tested by Wille et al. (2011b) and Ranade
et al. (2013), respectively, were cast and tested. The tensile test setup and dimensions of
this large-scale dogbone specimen are illustrated in Figure 3-20 and Figure 3-21. The test
results from the direct tensile test for phase 1 and phase 2 are presented in Table 3-6.
Table 3-6: Test results from direct tensile test
S.N Particulars Number of
DTT samples
Number of samples cracked
beyond gauge length
Average Tensile
Strength from DTT
Phase 1 (FRC)
0.35% (Set 6) 3 2 319.7 psi [2.2 MPa]
0.75% (Set 4) 3 0 387.31 psi [2.67 MPa]
Phase 2 (UHP-FRC)
3% Steel (Set 10) 3 0 920.58 psi [6.35 MPa]
3% Steel (Set 11 and 12) 3 0 1102.08 psi [7.60 MPa]
0.75% PE (Set 13) 3 2 641.56 psi [4.43 MPa]
Figure 3-20: Dimension of DTT specimen
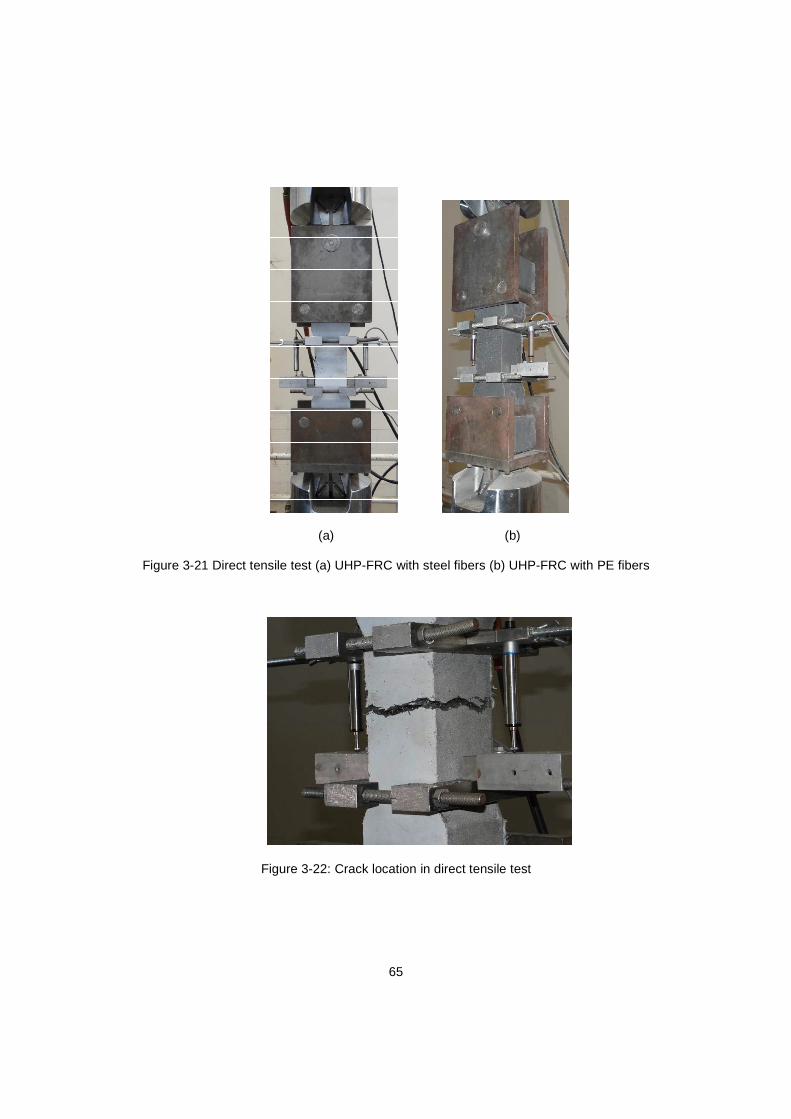
65
(a) (b)
Figure 3-21 Direct tensile test (a) UHP-FRC with steel fibers (b) UHP-FRC with PE fibers
Figure 3-22: Crack location in direct tensile test
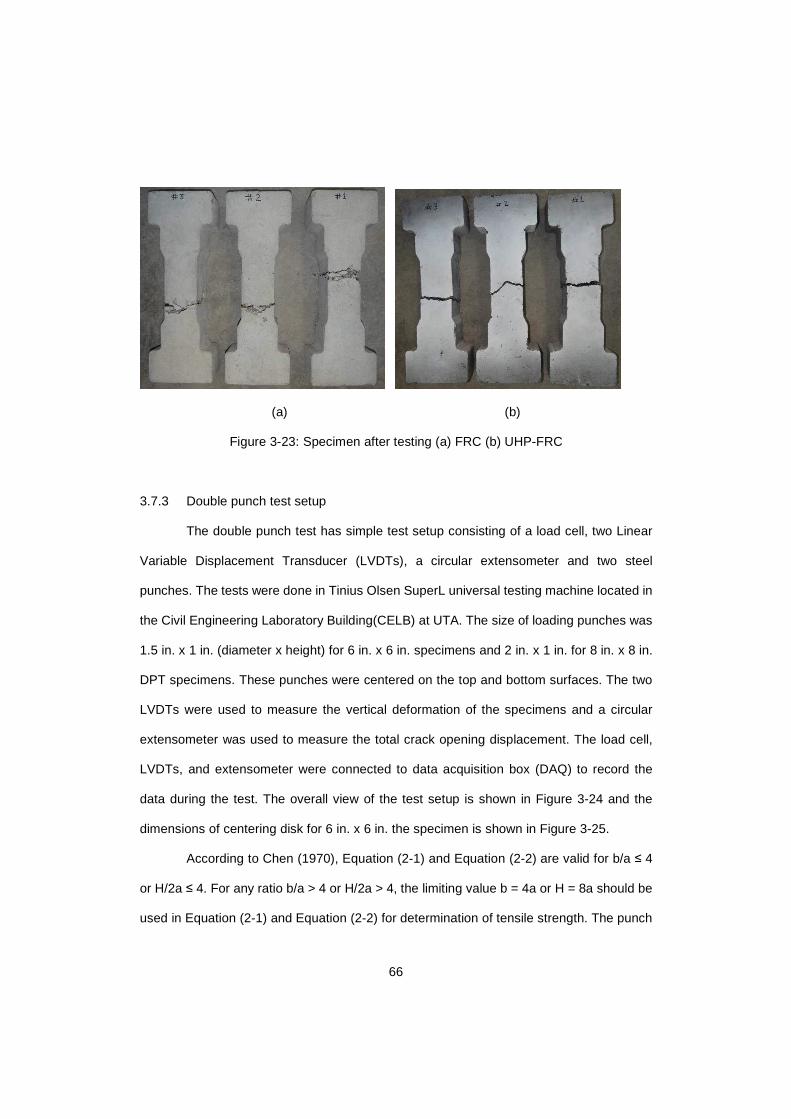
66
(a) (b)
Figure 3-23: Specimen after testing (a) FRC (b) UHP-FRC
3.7.3 Double punch test setup
The double punch test has simple test setup consisting of a load cell, two Linear
Variable Displacement Transducer (LVDTs), a circular extensometer and two steel
punches. The tests were done in Tinius Olsen SuperL universal testing machine located in
the Civil Engineering Laboratory Building(CELB) at UTA. The size of loading punches was
1.5 in. x 1 in. (diameter x height) for 6 in. x 6 in. specimens and 2 in. x 1 in. for 8 in. x 8 in.
DPT specimens. These punches were centered on the top and bottom surfaces. The two
LVDTs were used to measure the vertical deformation of the specimens and a circular
extensometer was used to measure the total crack opening displacement. The load cell,
LVDTs, and extensometer were connected to data acquisition box (DAQ) to record the
data during the test. The overall view of the test setup is shown in Figure 3-24 and the
dimensions of centering disk for 6 in. x 6 in. the specimen is shown in Figure 3-25.
According to Chen (1970), Equation (2-1) and Equation (2-2) are valid for b/a ≤ 4
or H/2a ≤ 4. For any ratio b/a > 4 or H/2a > 4, the limiting value b = 4a or H = 8a should be
used in Equation (2-1) and Equation (2-2) for determination of tensile strength. The punch
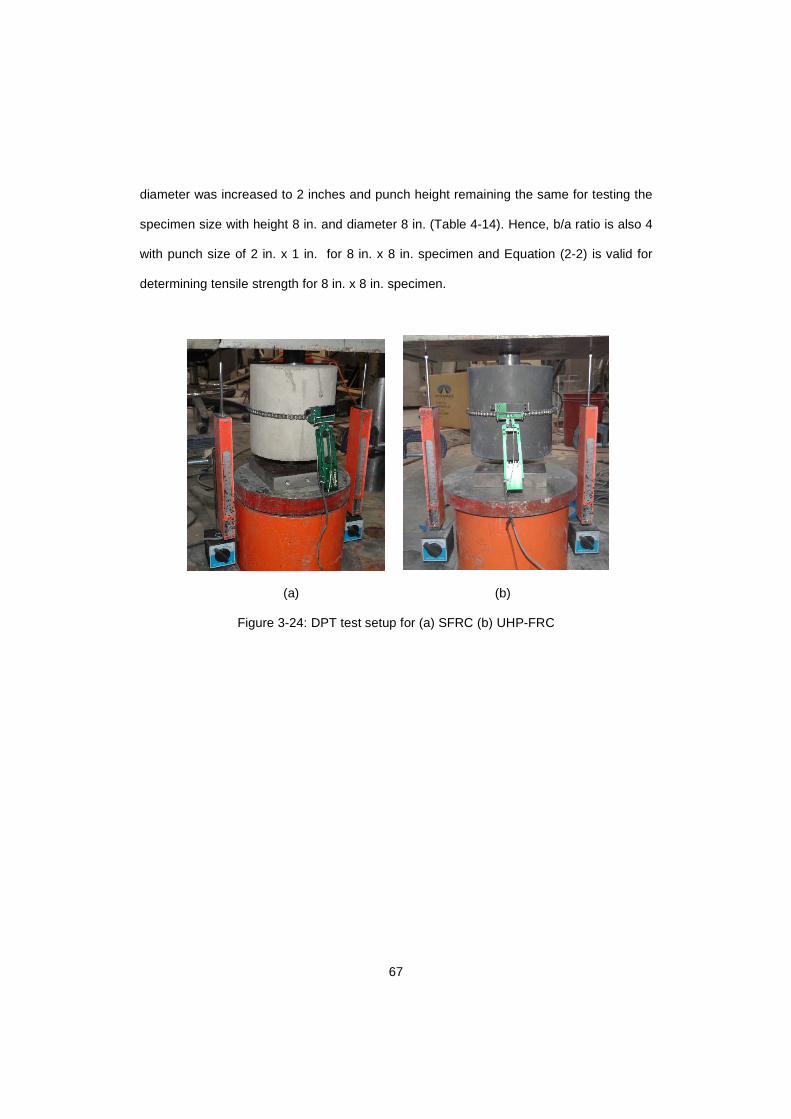
67
diameter was increased to 2 inches and punch height remaining the same for testing the
specimen size with height 8 in. and diameter 8 in. (Table 4-14). Hence, b/a ratio is also 4
with punch size of 2 in. x 1 in. for 8 in. x 8 in. specimen and Equation (2-2) is valid for
determining tensile strength for 8 in. x 8 in. specimen.
(a) (b)
Figure 3-24: DPT test setup for (a) SFRC (b) UHP-FRC
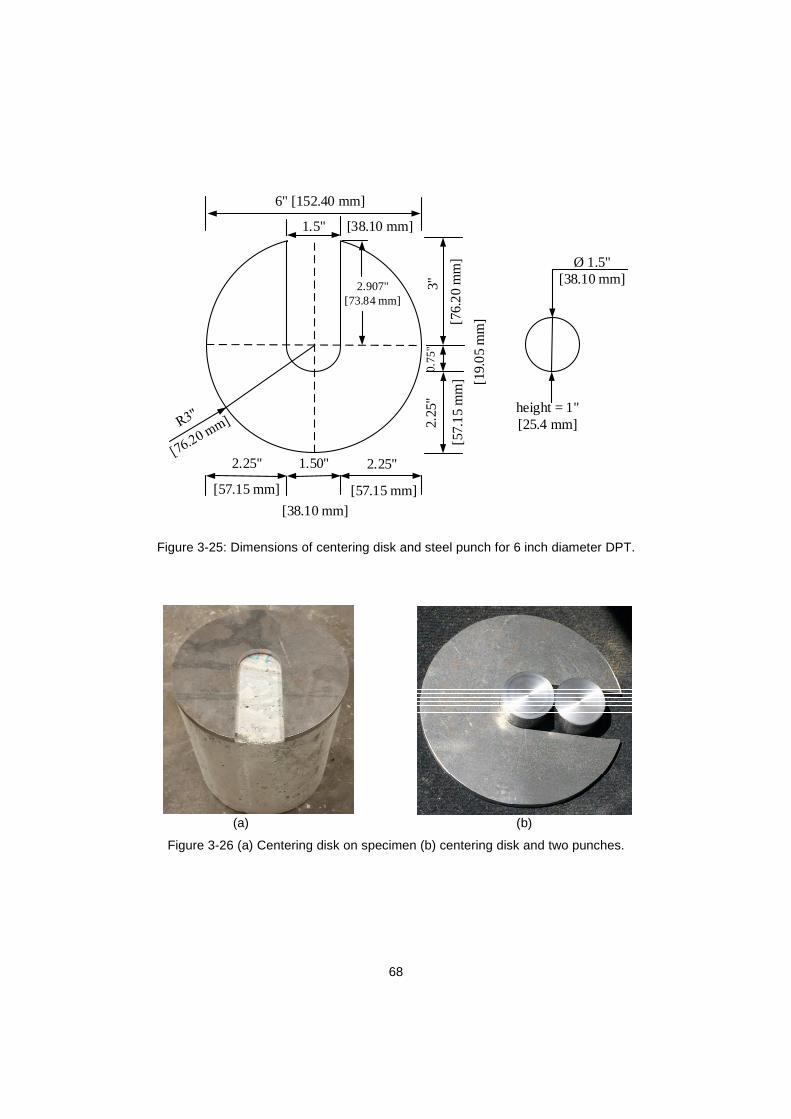
68
6" [152.40 mm]
1.5" [38.10 mm]
2.907"[73.84 mm]
2.25"2.25" 1.50"
3"
2.25
"0.
75"
Ø 1.5" [38.10 mm]
height = 1" [25.4 mm]
[76.
20
mm
]
[57.15 mm] [57.15 mm]
[38.10 mm]
[57.
15
mm
] [19.
05
mm
]
Figure 3-25: Dimensions of centering disk and steel punch for 6 inch diameter DPT.
(a) (b)
Figure 3-26 (a) Centering disk on specimen (b) centering disk and two punches.

69
3.8 Test procedure of Double Punch Test
The double punch test is a simple and easy test to determine the tensile strength
compared to the prevailing standard and non-standard methods. The typical test setup
consists of a load cell, compression testing machine, two punches, two LVDTs (Linear
Variable Differential Transducer) and a circumferential extensometer. The load cell is used
to record the applied load, two LVDTs (Linear Variable Differential Transducer) are used
to measure vertical axial deformation, the circumferential extensometer is used to measure
the total crack opening displacement and all the instruments are connected to data
acquisition system (DAQ) for recording.
The concrete cylinders of diameter 6 in. and height 12 in. are prepared and cured
as per standard practice. The cylinders are cut into half and specimen size of 6 in. x 6 in.
are prepared. So, there are two specimens as the bottom and a top portion of a cylinder of
6 in. x 12 in. Both top and bottom surfaces are smoothened and with sandstones. The
loading punches, 1 in. height and 1.5 in. diameter for 6 in. x 6 in. and of 1 in. height and 2
in. diameter, are centered using a centering plate. At first, the bottom punch is centered
and position in a compression testing machine followed by the top punch. The centering of
the punch is necessary to avoid moment produced by eccentric loading. The specimens
are placed in the direction of casting to make the uniformity in the test procedure.
The compressive force was applied at the rate 0.02 in./min and later changed to
0.04 in./min as explained in chapter 5. The slight modification in the testing procedure,
shakedown, is suggested by Karki (2011) so that a more accurate stiffness of specimens
could be gained at an early stage of the test. For this, the load is applied up to 2 kips and
then unloaded down to 0.5 kips, and again reloaded to failure. The rate of the machine is
kept constant for all stages i.e. from the starting of the test to the end.
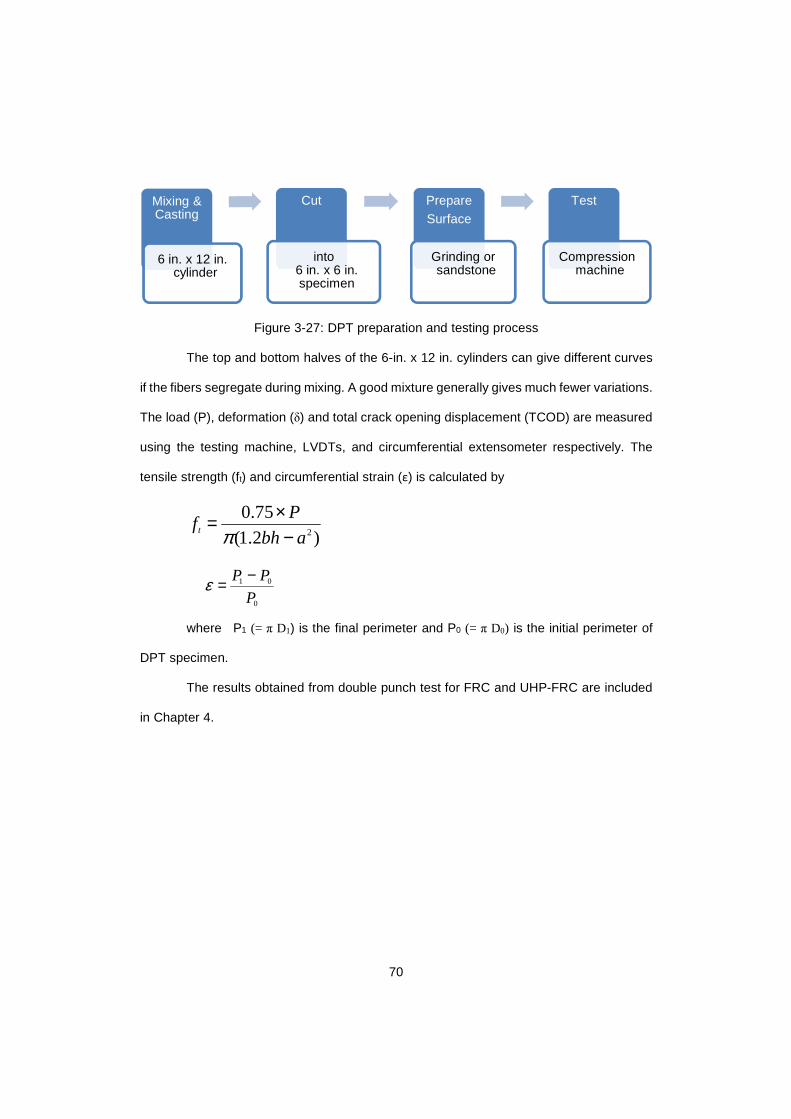
70
Figure 3-27: DPT preparation and testing process
The top and bottom halves of the 6-in. x 12 in. cylinders can give different curves
if the fibers segregate during mixing. A good mixture generally gives much fewer variations.
The load (P), deformation (δ) and total crack opening displacement (TCOD) are measured
using the testing machine, LVDTs, and circumferential extensometer respectively. The
tensile strength (ft) and circumferential strain (ε) is calculated by
2
0.75
(1.2 )t
Pf
bh aπ×=−
1 0
0
P P
Pε −=
where P1 (= π D1) is the final perimeter and P0 (= π D0) is the initial perimeter of
DPT specimen.
The results obtained from double punch test for FRC and UHP-FRC are included
in Chapter 4.
Mixing & Casting
6 in. x 12 in. cylinder
Cut
into 6 in. x 6 in.specimen
PrepareSurface
Grinding or sandstone
Test
Compression machine
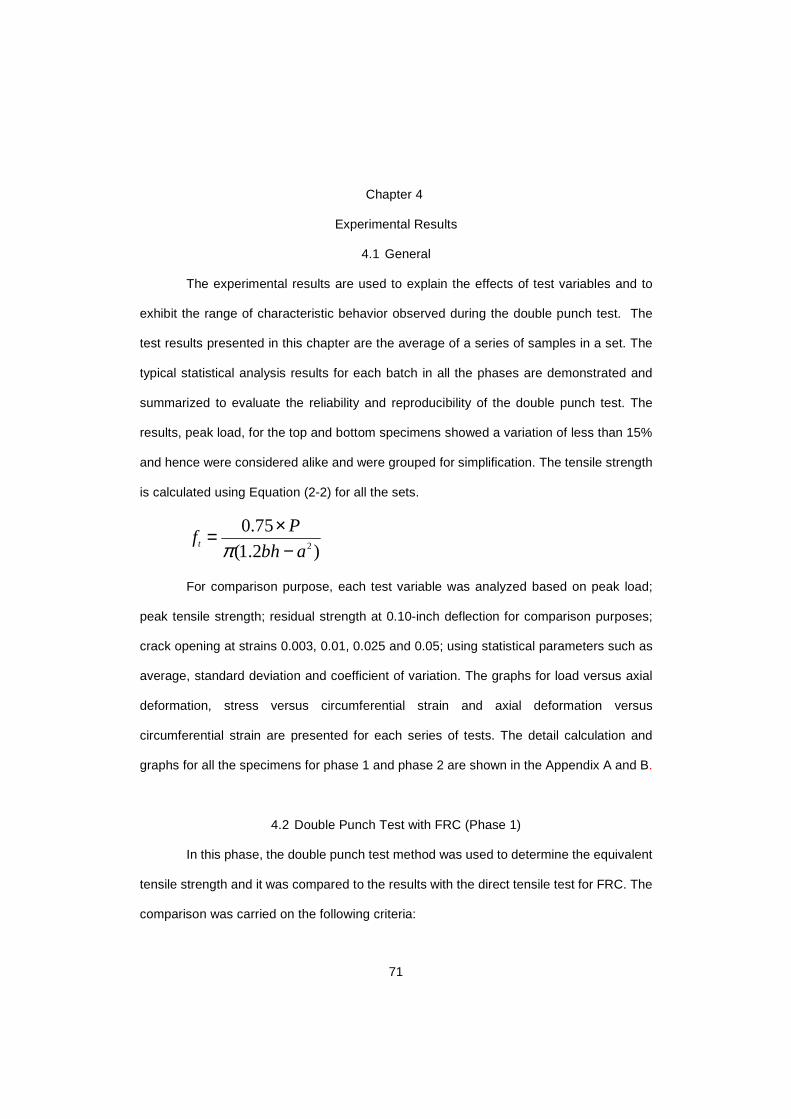
71
Chapter 4
Experimental Results
4.1 General
The experimental results are used to explain the effects of test variables and to
exhibit the range of characteristic behavior observed during the double punch test. The
test results presented in this chapter are the average of a series of samples in a set. The
typical statistical analysis results for each batch in all the phases are demonstrated and
summarized to evaluate the reliability and reproducibility of the double punch test. The
results, peak load, for the top and bottom specimens showed a variation of less than 15%
and hence were considered alike and were grouped for simplification. The tensile strength
is calculated using Equation (2-2) for all the sets.
2
0.75
(1.2 )t
Pf
bh aπ×=−
For comparison purpose, each test variable was analyzed based on peak load;
peak tensile strength; residual strength at 0.10-inch deflection for comparison purposes;
crack opening at strains 0.003, 0.01, 0.025 and 0.05; using statistical parameters such as
average, standard deviation and coefficient of variation. The graphs for load versus axial
deformation, stress versus circumferential strain and axial deformation versus
circumferential strain are presented for each series of tests. The detail calculation and
graphs for all the specimens for phase 1 and phase 2 are shown in the Appendix A and B.
4.2 Double Punch Test with FRC (Phase 1)
In this phase, the double punch test method was used to determine the equivalent
tensile strength and it was compared to the results with the direct tensile test for FRC. The
comparison was carried on the following criteria:

72
1) To examine the influence of fiber dosage in conventional SFRC.
2) To explore the effect of displacement rate for the experiment.
3) To investigate the effect of specimen sizes in DPT.
4) To compare the results obtained from DPT with the direct tensile test.
4.2.1 Different fiber dosage for FRC
6x12 in. cylinders were casted with 0.35%, 0.45%, 0.55% and 0.75% fiber volume
fraction, six in each batch. The 6x12 in. specimens were cut into two 6x6 in. cylinders,
named as top and bottom, by using a concrete saw. The top and bottom surfaces were
smoothened with sandstone or by grinding. The test was operated at the displacement rate
of 0.02 in/min (Mollins et. al. 2007, Pujadas et. al 2012 and Blanco et. al. 2014). The
equivalent tensile strength was calculated using modified Chen’s equation (2-2). The same
procedure of DPT method as mentioned in section 3.8 was used. Table 4-1 shows the
information of each batch for comparative assessment of SFRC with different fiber volume
fraction.
Table 4-1: Test parameter for FRC with various fiber dosages
S.N Set 1 Set 2 Set 3 Set 4
Fiber volume
fraction (Vf) 0.35% 0.45% 0.55% 0.75%
Fiber dosage 28 kg/m3 36 kg/m3 44 kg/m3 60 kg/m3
Displacement rate 0.02 in/min
[0.5 mm/min]
0.02 in/min
[0.5 mm/min]
0.02 in/min
[0.5 mm/min]
0.02 in/min
[0.5 mm/min]
Specimen size
(Diameter x Height)
6 in. x 6 in.
[152 mm x 152
mm]
6 in. x 6 in.
[152 mm x 152
mm]
6 in. x 6 in.
[152 mm x 152
mm]
6 in. x 6 in.
[152 mm x 152
mm]
Punch Size
(Diameter x Height)
1.5 in. x 1 in.
[38 mm x 25.4
mm]
1.5 in. x 1 in.
[38 mm x 25.4
mm]
1.5 in. x 1 in.
[38 mm x 25.4
mm]
1.5 in. x 1 in.
[38 mm x 25.4
mm]
Total number of
samples 12 12 12 12
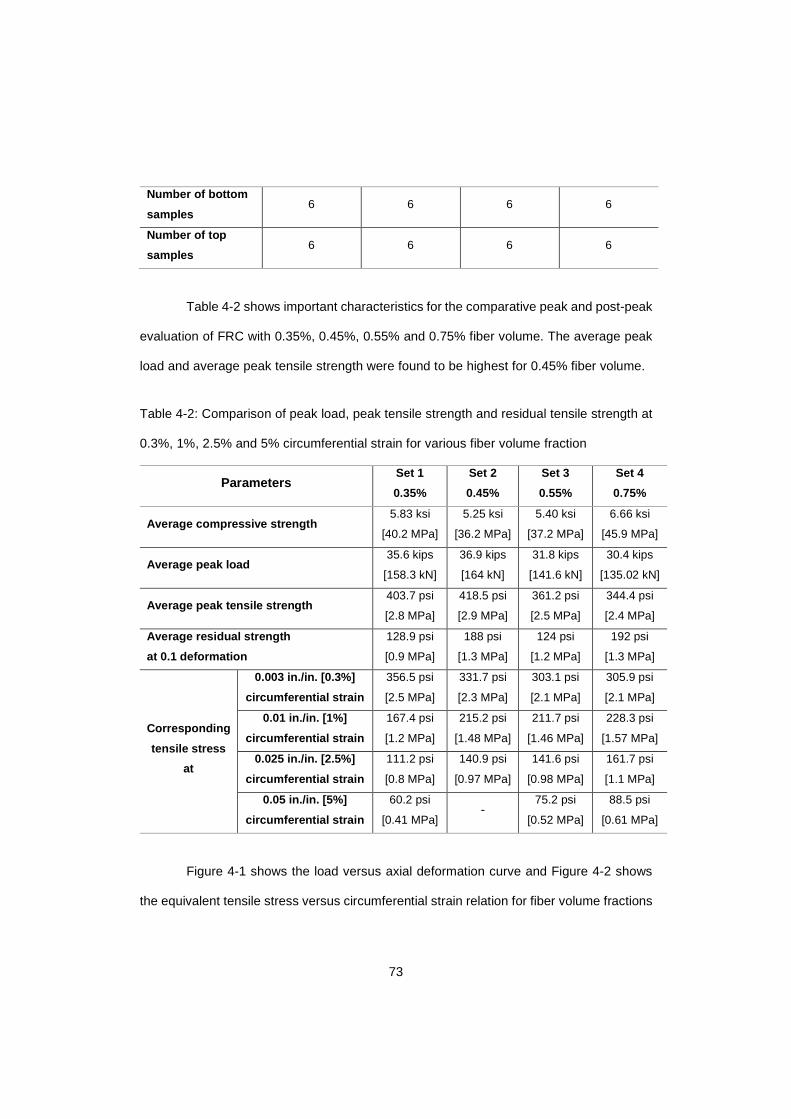
73
Number of bottom
samples 6 6 6 6
Number of top
samples 6 6 6 6
Table 4-2 shows important characteristics for the comparative peak and post-peak
evaluation of FRC with 0.35%, 0.45%, 0.55% and 0.75% fiber volume. The average peak
load and average peak tensile strength were found to be highest for 0.45% fiber volume.
Table 4-2: Comparison of peak load, peak tensile strength and residual tensile strength at
0.3%, 1%, 2.5% and 5% circumferential strain for various fiber volume fraction
Parameters Set 1
0.35%
Set 2
0.45%
Set 3
0.55%
Set 4
0.75%
Average compressive strength 5.83 ksi
[40.2 MPa]
5.25 ksi
[36.2 MPa]
5.40 ksi
[37.2 MPa]
6.66 ksi
[45.9 MPa]
Average peak load 35.6 kips
[158.3 kN]
36.9 kips
[164 kN]
31.8 kips
[141.6 kN]
30.4 kips
[135.02 kN]
Average peak tensile strength 403.7 psi
[2.8 MPa]
418.5 psi
[2.9 MPa]
361.2 psi
[2.5 MPa]
344.4 psi
[2.4 MPa]
Average residual strength
at 0.1 deformation
128.9 psi
[0.9 MPa]
188 psi
[1.3 MPa]
124 psi
[1.2 MPa]
192 psi
[1.3 MPa]
Corresponding
tensile stress
at
0.003 in./in. [0.3%]
circumferential strain
356.5 psi
[2.5 MPa]
331.7 psi
[2.3 MPa]
303.1 psi
[2.1 MPa]
305.9 psi
[2.1 MPa]
0.01 in./in. [1%]
circumferential strain
167.4 psi
[1.2 MPa]
215.2 psi
[1.48 MPa]
211.7 psi
[1.46 MPa]
228.3 psi
[1.57 MPa]
0.025 in./in. [2.5%]
circumferential strain
111.2 psi
[0.8 MPa]
140.9 psi
[0.97 MPa]
141.6 psi
[0.98 MPa]
161.7 psi
[1.1 MPa]
0.05 in./in. [5%]
circumferential strain
60.2 psi
[0.41 MPa] -
75.2 psi
[0.52 MPa]
88.5 psi
[0.61 MPa]
Figure 4-1 shows the load versus axial deformation curve and Figure 4-2 shows
the equivalent tensile stress versus circumferential strain relation for fiber volume fractions

74
0.35% (28 kg/m3), 0.45% (36 kg/m3), 0.55% (44kg/m3), and 0.75% (60 kg/m3). The slopes
in Figure 4-2 up to the peak loads in all cases are similar and after peak loads the variation
becomes significant. With the increase in dosage of fibers, the post-cracking (or post-peak)
curves drop more gradually. Note as shown in Figure 4-1and Figure 4-2, in general, for an
FRC with higher fiber dosage, it carries a higher residual load at the same circumferential
strains (or average crack openings).
.0 0.05 0.1 0.15 0.2 0.25
Deformation (in.)
0
10
20
30
40
Load
(kip
s)
0 1 2 3 4 5 6Deformation (mm)
0
50
100
150
Loa
d(k
N)
Fiber volume (Dosage)0.35% (28 kg/m3)0.45% (36 kg/m3)0.55% (44 kg/m3)0.75% (60 kg/m3)
Figure 4-1 Load vs deformation for different fiber volume fraction
0 0.01 0.02 0.03 0.04 0.05 0.06Circumferential Strain (in./in.)
0
100
200
300
400
500
Ten
sile
Str
ess
(psi
)
0 0.01 0.02 0.03 0.04 0.05 0.06Circumferential Strain (mm/mm)
0
0.5
1
1.5
2
2.5
3
Te
nsile
Str
ess
(MP
a)Fiber volume (Dosage)0.35% (28 kg/m3)0.45% (36 kg/m3)0.55% (44 kg/m3)0.75% (60 kg/m3)
Figure 4-2 Tensile stress versus circumferential strain for different fiber volume fraction
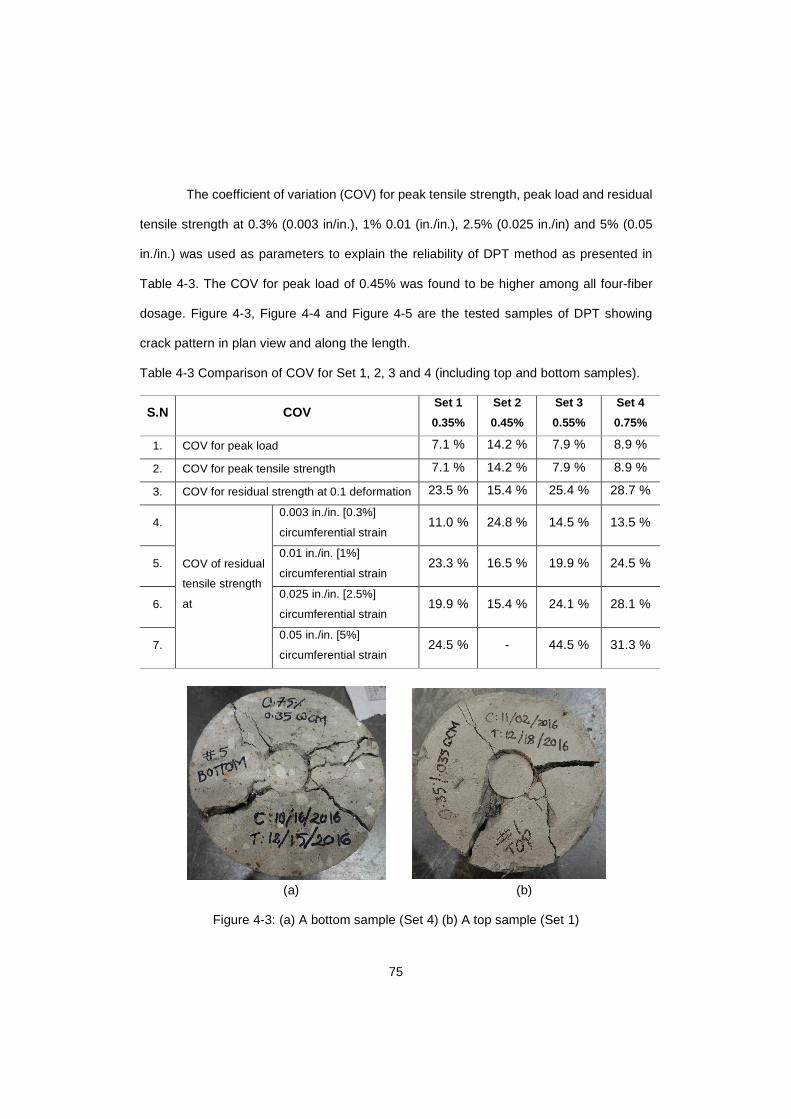
75
The coefficient of variation (COV) for peak tensile strength, peak load and residual
tensile strength at 0.3% (0.003 in/in.), 1% 0.01 (in./in.), 2.5% (0.025 in./in) and 5% (0.05
in./in.) was used as parameters to explain the reliability of DPT method as presented in
Table 4-3. The COV for peak load of 0.45% was found to be higher among all four-fiber
dosage. Figure 4-3, Figure 4-4 and Figure 4-5 are the tested samples of DPT showing
crack pattern in plan view and along the length.
Table 4-3 Comparison of COV for Set 1, 2, 3 and 4 (including top and bottom samples).
S.N COV Set 1
0.35%
Set 2
0.45%
Set 3
0.55%
Set 4
0.75%
1. COV for peak load 7.1 % 14.2 % 7.9 % 8.9 %
2. COV for peak tensile strength 7.1 % 14.2 % 7.9 % 8.9 %
3. COV for residual strength at 0.1 deformation 23.5 % 15.4 % 25.4 % 28.7 %
4.
COV of residual
tensile strength
at
0.003 in./in. [0.3%]
circumferential strain 11.0 % 24.8 % 14.5 % 13.5 %
5. 0.01 in./in. [1%]
circumferential strain 23.3 % 16.5 % 19.9 % 24.5 %
6. 0.025 in./in. [2.5%]
circumferential strain 19.9 % 15.4 % 24.1 % 28.1 %
7. 0.05 in./in. [5%]
circumferential strain 24.5 % - 44.5 % 31.3 %
(a) (b)
Figure 4-3: (a) A bottom sample (Set 4) (b) A top sample (Set 1)
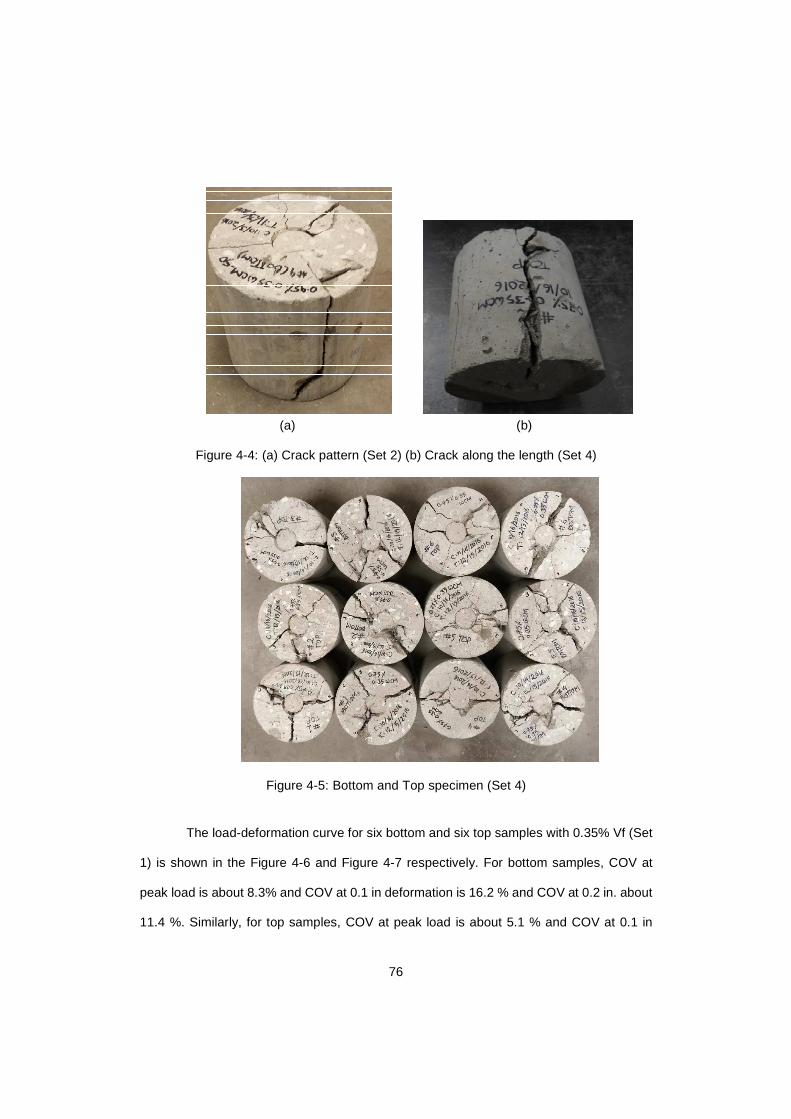
76
(a) (b)
Figure 4-4: (a) Crack pattern (Set 2) (b) Crack along the length (Set 4)
Figure 4-5: Bottom and Top specimen (Set 4)
The load-deformation curve for six bottom and six top samples with 0.35% Vf (Set
1) is shown in the Figure 4-6 and Figure 4-7 respectively. For bottom samples, COV at
peak load is about 8.3% and COV at 0.1 in deformation is 16.2 % and COV at 0.2 in. about
11.4 %. Similarly, for top samples, COV at peak load is about 5.1 % and COV at 0.1 in
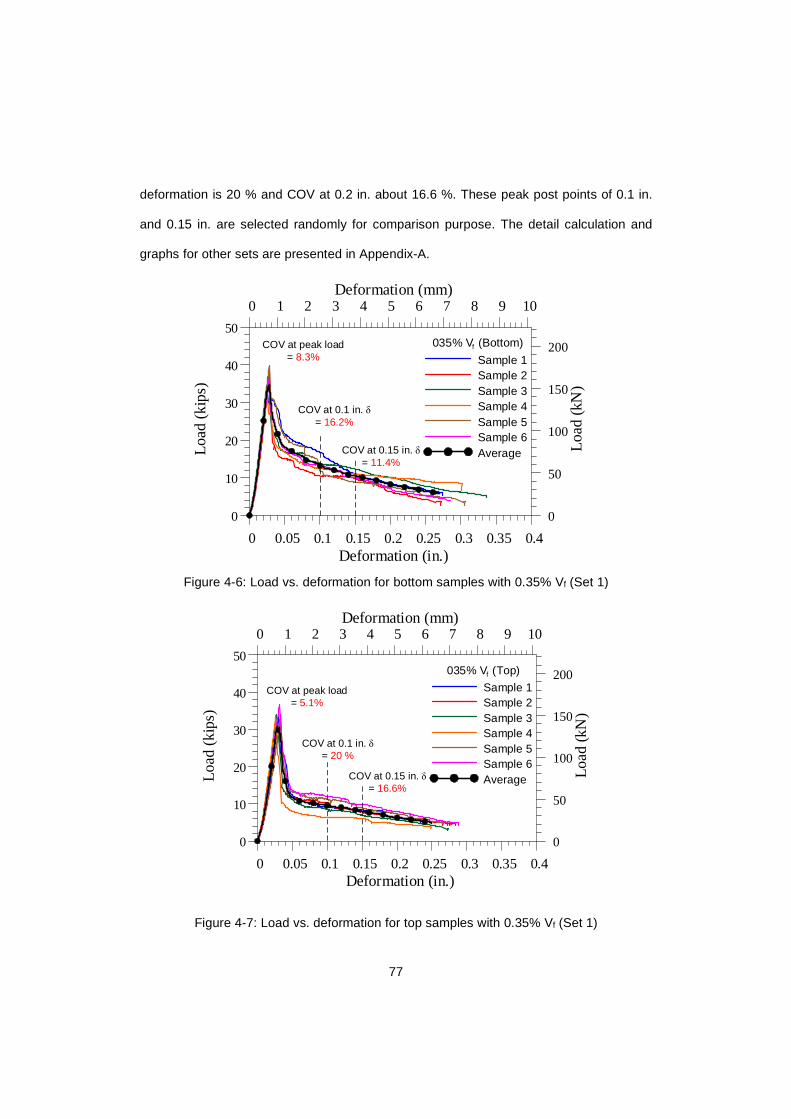
77
deformation is 20 % and COV at 0.2 in. about 16.6 %. These peak post points of 0.1 in.
and 0.15 in. are selected randomly for comparison purpose. The detail calculation and
graphs for other sets are presented in Appendix-A.
Figure 4-6: Load vs. deformation for bottom samples with 0.35% Vf (Set 1)
Figure 4-7: Load vs. deformation for top samples with 0.35% Vf (Set 1)
0 0.05 0.1 0.15 0.2 0.25 0.3 0.35 0.4Deformation (in.)
0
10
20
30
40
50
Load
(kip
s)
0 1 2 3 4 5 6 7 8 9 10Deformation (mm)
0
50
100
150
200
Load
(kN
)
035% Vf (Bottom)
Sample 1Sample 2Sample 3Sample 4Sample 5Sample 6Average
COV at peak load = 8.3%
COV at 0.1 in. δ = 16.2%
COV at 0.15 in. δ = 11.4%
0 0.05 0.1 0.15 0.2 0.25 0.3 0.35 0.4Deformation (in.)
0
10
20
30
40
50
Loa
d(k
ips)
0 1 2 3 4 5 6 7 8 9 10Deformation (mm)
0
50
100
150
200
Loa
d (k
N)
035% Vf (Top)
Sample 1Sample 2Sample 3Sample 4Sample 5Sample 6Average
COV at peak load = 5.1%
COV at 0.1 in. δ = 20 %
COV at 0.15 in. δ = 16.6%
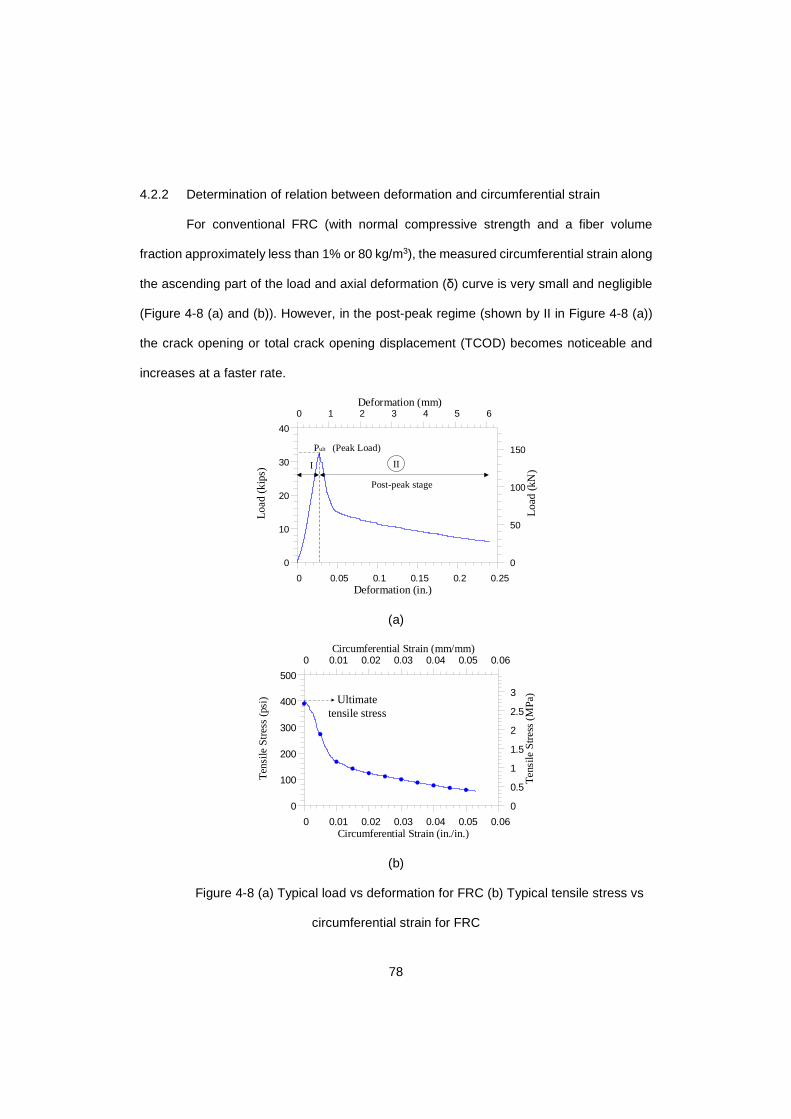
78
4.2.2 Determination of relation between deformation and circumferential strain
For conventional FRC (with normal compressive strength and a fiber volume
fraction approximately less than 1% or 80 kg/m3), the measured circumferential strain along
the ascending part of the load and axial deformation (δ) curve is very small and negligible
(Figure 4-8 (a) and (b)). However, in the post-peak regime (shown by II in Figure 4-8 (a))
the crack opening or total crack opening displacement (TCOD) becomes noticeable and
increases at a faster rate.
0 0.05 0.1 0.15 0.2 0.25
0
10
20
30
40
Loa
d(k
ips)
0 1 2 3 4 5 6
0
50
100
150
Load
(kN
)II
Post-peak stage
Pult (Peak Load)
I
Deformation (mm)
Deformation (in.)
(a)
0 0.01 0.02 0.03 0.04 0.05 0.06Circumferential Strain (in./in.)
0
100
200
300
400
500
Ten
sile
Str
ess
(psi
)
0 0.01 0.02 0.03 0.04 0.05 0.06Circumferential Strain (mm/mm)
0
0.5
1
1.5
2
2.5
3
Te
nsile
Str
ess
(MP
a)
Ultimate tensile stress
(b)
Figure 4-8 (a) Typical load vs deformation for FRC (b) Typical tensile stress vs
circumferential strain for FRC
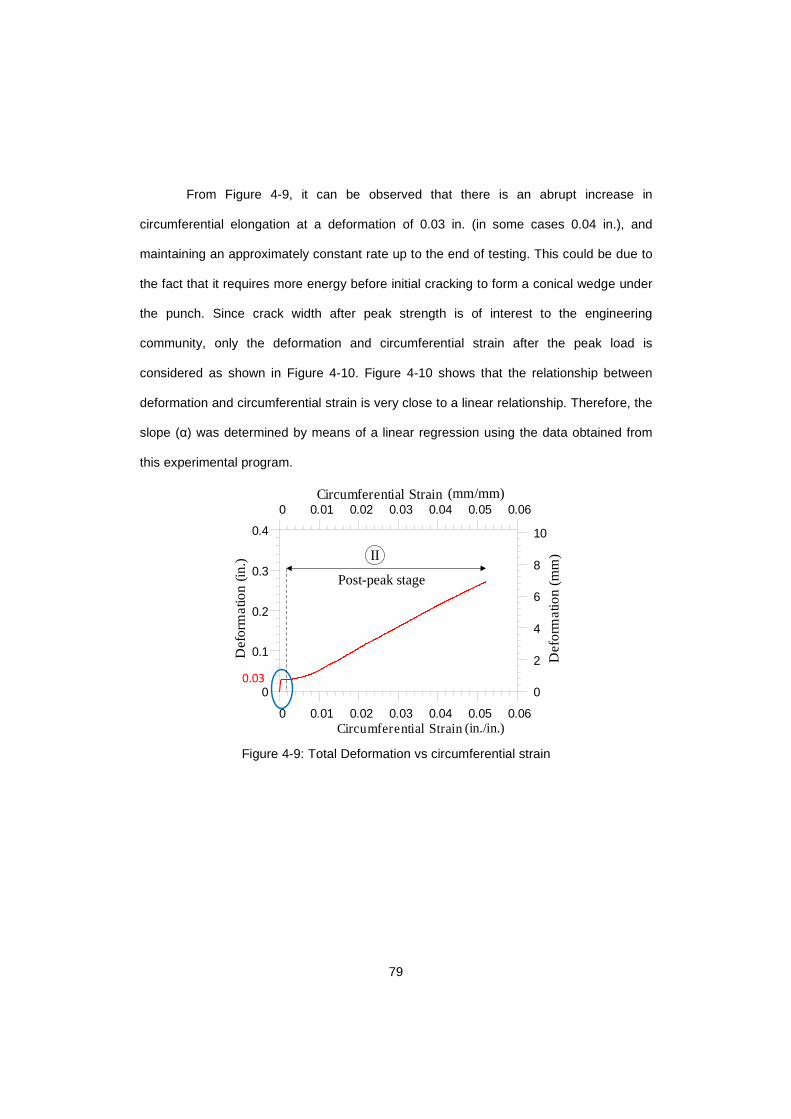
79
From Figure 4-9, it can be observed that there is an abrupt increase in
circumferential elongation at a deformation of 0.03 in. (in some cases 0.04 in.), and
maintaining an approximately constant rate up to the end of testing. This could be due to
the fact that it requires more energy before initial cracking to form a conical wedge under
the punch. Since crack width after peak strength is of interest to the engineering
community, only the deformation and circumferential strain after the peak load is
considered as shown in Figure 4-10. Figure 4-10 shows that the relationship between
deformation and circumferential strain is very close to a linear relationship. Therefore, the
slope (α) was determined by means of a linear regression using the data obtained from
this experimental program.
0 0.01 0.02 0.03 0.04 0.05 0.06
0
0.1
0.2
0.3
0.4
0 0.01 0.02 0.03 0.04 0.05 0.06
0
2
4
6
8
10
Circumferential Strain (mm/mm)
De
form
atio
n(m
m)
Circumferential Strain(in./in.)
De
form
atio
n (i
n.)
0.03
II
Post-peak stage
Figure 4-9: Total Deformation vs circumferential strain
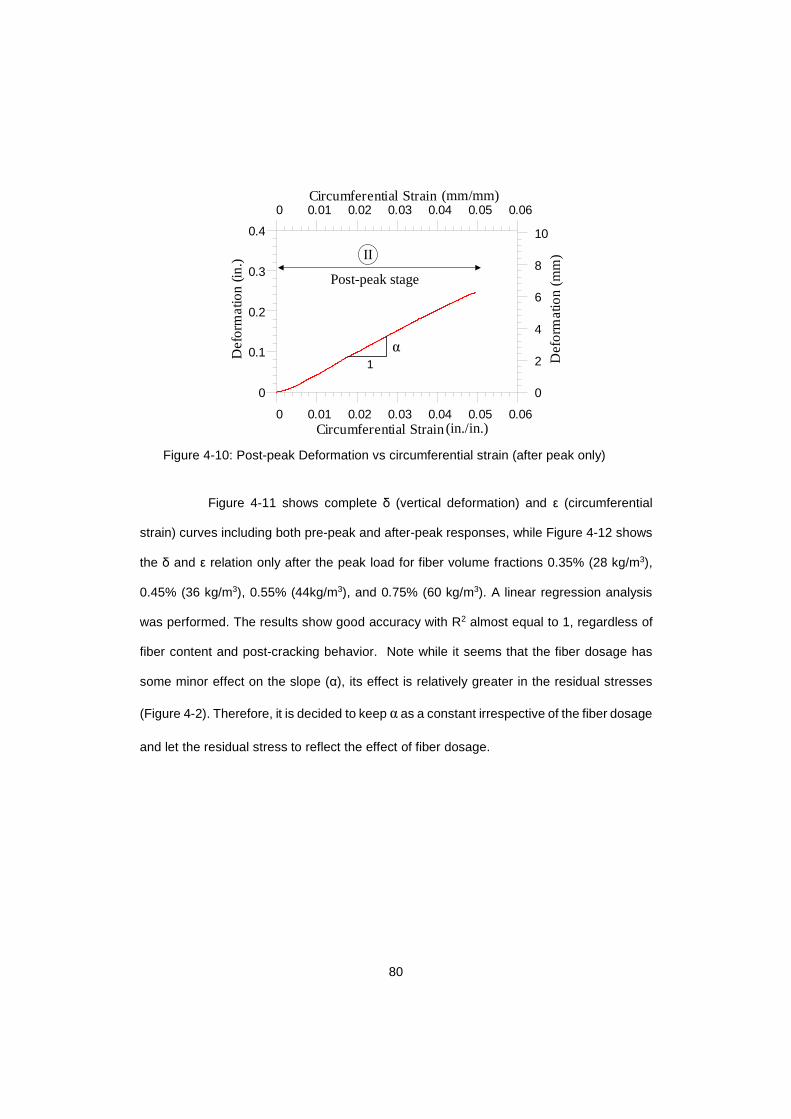
80
0 0.01 0.02 0.03 0.04 0.05 0.06
0
0.1
0.2
0.3
0.4
0 0.01 0.02 0.03 0.04 0.05 0.06
0
2
4
6
8
10
1α
Circumferential Strain (mm/mm)
De
form
atio
n(m
m)
Circumferential Strain(in./in.)
De
form
atio
n (i
n.) II
Post-peak stage
Figure 4-10: Post-peak Deformation vs circumferential strain (after peak only)
Figure 4-11 shows complete δ (vertical deformation) and ε (circumferential
strain) curves including both pre-peak and after-peak responses, while Figure 4-12 shows
the δ and ε relation only after the peak load for fiber volume fractions 0.35% (28 kg/m3),
0.45% (36 kg/m3), 0.55% (44kg/m3), and 0.75% (60 kg/m3). A linear regression analysis
was performed. The results show good accuracy with R2 almost equal to 1, regardless of
fiber content and post-cracking behavior. Note while it seems that the fiber dosage has
some minor effect on the slope (α), its effect is relatively greater in the residual stresses
(Figure 4-2). Therefore, it is decided to keep α as a constant irrespective of the fiber dosage
and let the residual stress to reflect the effect of fiber dosage.
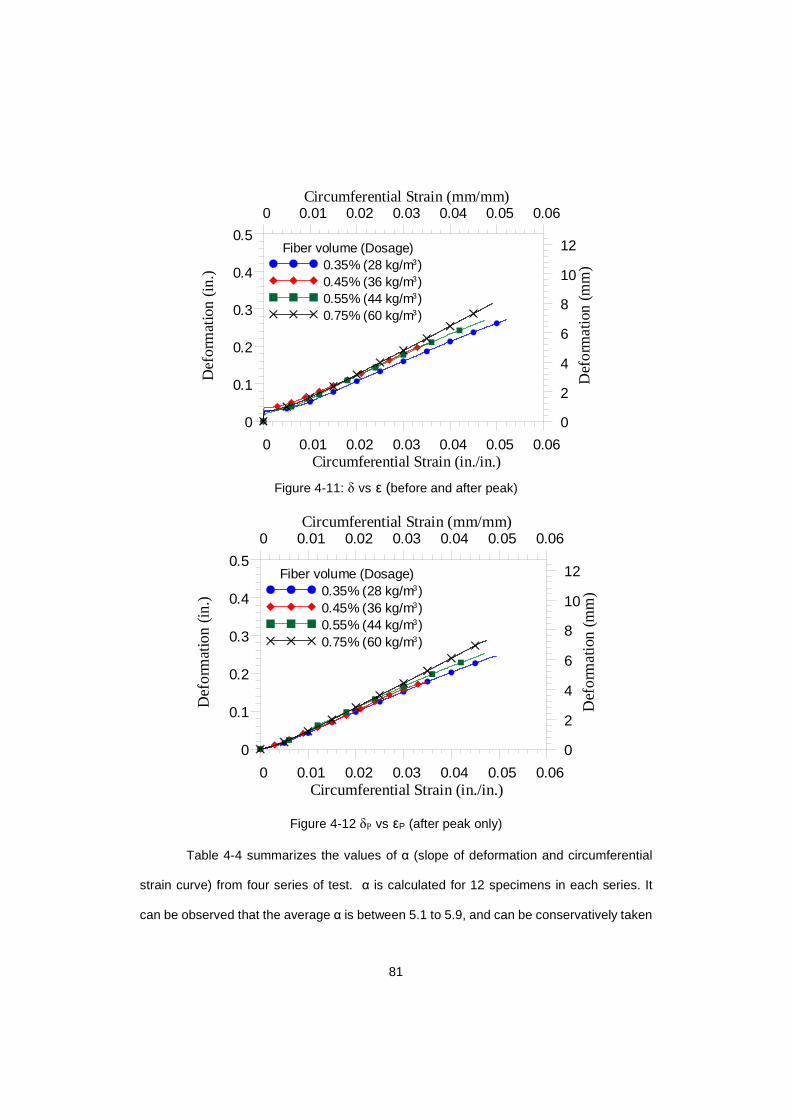
81
0 0.01 0.02 0.03 0.04 0.05 0.06Circumferential Strain (in./in.)
0
0.1
0.2
0.3
0.4
0.5
Def
orm
atio
n (i
n.)
0 0.01 0.02 0.03 0.04 0.05 0.06Circumferential Strain (mm/mm)
0
2
4
6
8
10
12
Def
orm
atio
n (m
m)
Fiber volume (Dosage)0.35% (28 kg/m3)0.45% (36 kg/m3)0.55% (44 kg/m3)0.75% (60 kg/m3)
Figure 4-11: δ vs ε (before and after peak)
0 0.01 0.02 0.03 0.04 0.05 0.06Circumferential Strain (in./in.)
0
0.1
0.2
0.3
0.4
0.5
Def
orm
atio
n (i
n.)
0 0.01 0.02 0.03 0.04 0.05 0.06Circumferential Strain (mm/mm)
0
2
4
6
8
10
12D
efo
rma
tion
(mm
)Fiber volume (Dosage)
0.35% (28 kg/m3)0.45% (36 kg/m3)0.55% (44 kg/m3)0.75% (60 kg/m3)
Figure 4-12 δP vs εP (after peak only)
Table 4-4 summarizes the values of α (slope of deformation and circumferential
strain curve) from four series of test. α is calculated for 12 specimens in each series. It
can be observed that the average α is between 5.1 to 5.9, and can be conservatively taken

82
as 5.0. α is in general independent of fiber content and displacement rate. Thus, this
provides the direct relationship between δP and εP given as:
δP = α εP where, α = 5 (Equation 4-1)
δP = δ – δ0
where δ0 = deformation at peak load
δ = total vertical deformation from beginning of test
δP = post peak deformation
εP = circumferential strain after peak
Table 4-4: Determination of α
Set Set 1 Set 2 Set 3 Set 4
Vf 0.35% 0.45% 0.55% 0.75%
Fiber Dosage 28 kg/m3 36 kg/m3 44 kg/m3 60 kg/m3
Rate (in./min) 0.02 0.02 0.02 0.02
Size (diameter x height) 6 x 6 in. 6 x 6 in. 6 x 6 in. 6 x 6 in.
Sample α values
B 1 5.40 5.17 5.83 6.79
B 2 4.66 5.21 7.20 6.43
B 3 6.26 5.50 5.76 7.03
B 4 5.39 4.82 5.83 6.79
B 5 4.64 4.82 4.12 6.35
B 6 5.40 5.36 3.55 6.31
T 1 5.31 5.92 7.64 5.26
T 2 5.33 5.94 7.14 6.42
T 3 4.30 4.58 5.07 4.95
T 4 4.62 4.77 4.55 3.80
T 5 5.36 4.90 5.03 5.40
T 6 4.71 4.55 3.79 4.92
Mean 5.12 5.13 5.5 5.9
Standard deviation 0.5 0.5 1.4 1.0
Note: B and T represent the bottom and top specimens, respectively
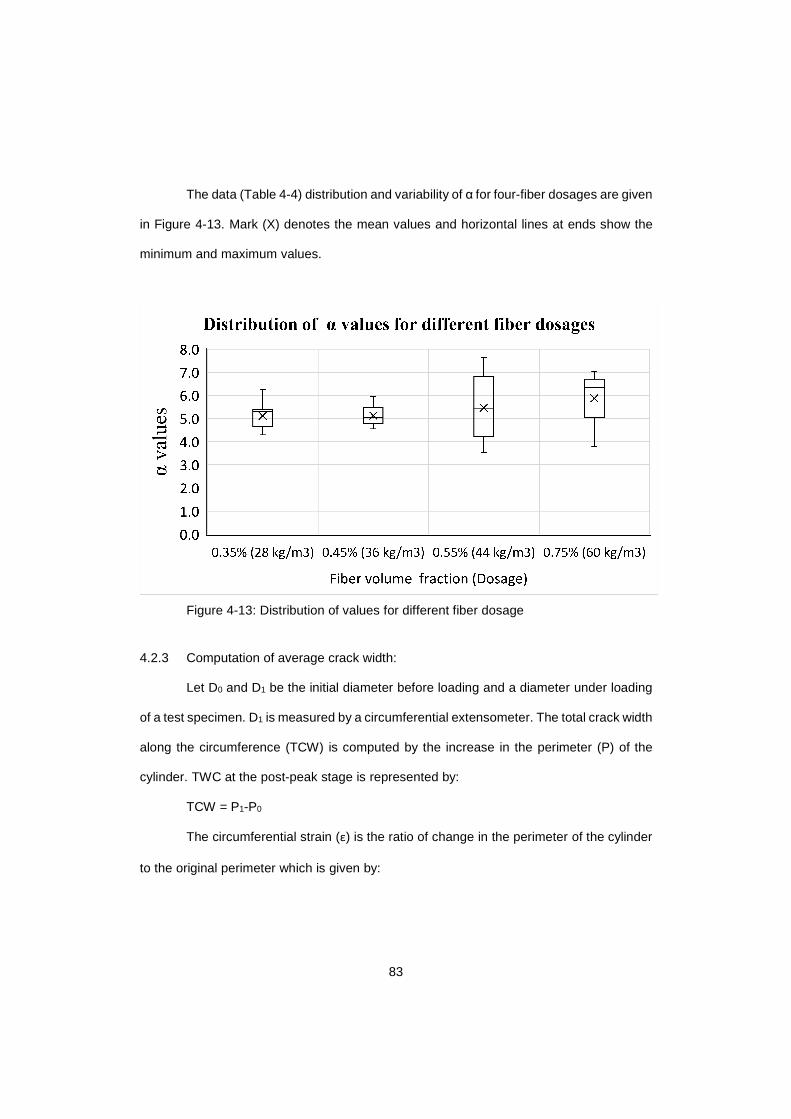
83
The data (Table 4-4) distribution and variability of α for four-fiber dosages are given
in Figure 4-13. Mark (X) denotes the mean values and horizontal lines at ends show the
minimum and maximum values.
Figure 4-13: Distribution of values for different fiber dosage
4.2.3 Computation of average crack width:
Let D0 and D1 be the initial diameter before loading and a diameter under loading
of a test specimen. D1 is measured by a circumferential extensometer. The total crack width
along the circumference (TCW) is computed by the increase in the perimeter (P) of the
cylinder. TWC at the post-peak stage is represented by:
TCW = P1-P0
The circumferential strain (ε) is the ratio of change in the perimeter of the cylinder
to the original perimeter which is given by:
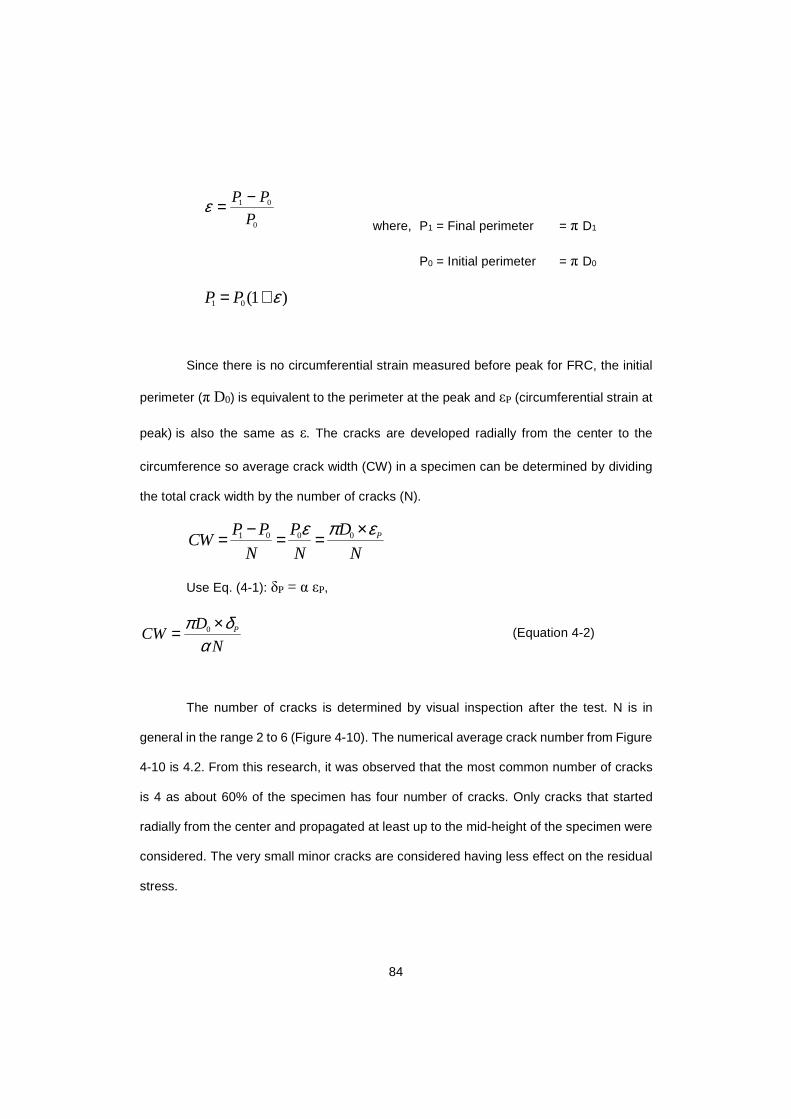
84
1 0
0
P P
Pε −=
where, P1 = Final perimeter = π D1
P0 = Initial perimeter = π D0
1 0(1 )P P ε= +
Since there is no circumferential strain measured before peak for FRC, the initial
perimeter (π D0) is equivalent to the perimeter at the peak and εP (circumferential strain at
peak) is also the same as ε. The cracks are developed radially from the center to the
circumference so average crack width (CW) in a specimen can be determined by dividing
the total crack width by the number of cracks (N).
1 0 0 0 PP P P DCW
N N N
ε π ε− ×= = =
Use Eq. (4-1): δP = α εP,
0 PDCW
N
π δα
×= (Equation 4-2)
The number of cracks is determined by visual inspection after the test. N is in
general in the range 2 to 6 (Figure 4-10). The numerical average crack number from Figure
4-10 is 4.2. From this research, it was observed that the most common number of cracks
is 4 as about 60% of the specimen has four number of cracks. Only cracks that started
radially from the center and propagated at least up to the mid-height of the specimen were
considered. The very small minor cracks are considered having less effect on the residual
stress.
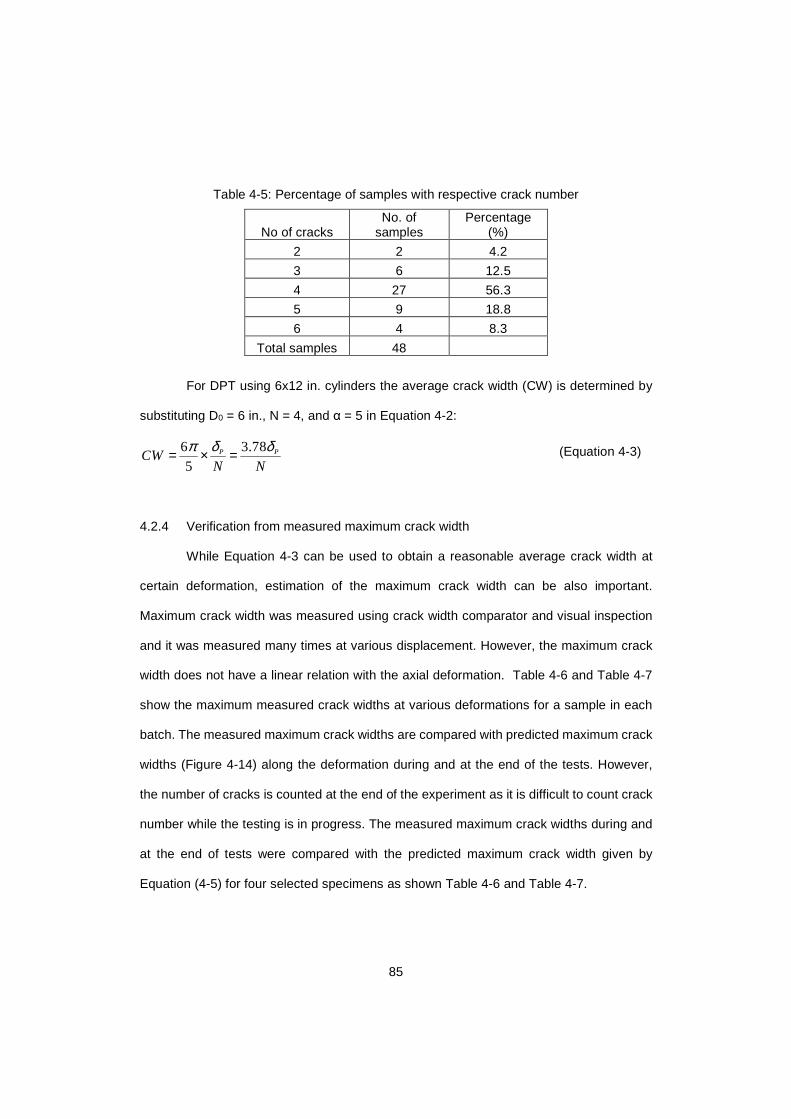
85
Table 4-5: Percentage of samples with respective crack number
No of cracks No. of
samples Percentage
(%)
2 2 4.2
3 6 12.5
4 27 56.3
5 9 18.8
6 4 8.3
Total samples 48
For DPT using 6x12 in. cylinders the average crack width (CW) is determined by
substituting D0 = 6 in., N = 4, and α = 5 in Equation 4-2:
6 3.785
P PCWN N
π δ δ= × = (Equation 4-3)
4.2.4 Verification from measured maximum crack width
While Equation 4-3 can be used to obtain a reasonable average crack width at
certain deformation, estimation of the maximum crack width can be also important.
Maximum crack width was measured using crack width comparator and visual inspection
and it was measured many times at various displacement. However, the maximum crack
width does not have a linear relation with the axial deformation. Table 4-6 and Table 4-7
show the maximum measured crack widths at various deformations for a sample in each
batch. The measured maximum crack widths are compared with predicted maximum crack
widths (Figure 4-14) along the deformation during and at the end of the tests. However,
the number of cracks is counted at the end of the experiment as it is difficult to count crack
number while the testing is in progress. The measured maximum crack widths during and
at the end of tests were compared with the predicted maximum crack width given by
Equation (4-5) for four selected specimens as shown Table 4-6 and Table 4-7.

86
Table 4-6: Measurement of crack width during experiments for one randomly selected sample from sets of 0.35% and 0.45% Vf
0.35% 0.45%
δP Measured Crack
Width
Predicted Crack width (a)/(b)
δP Measured
Crack Width
Predicted Crack width (a)/(b)
in. mm in. (a)
in. (b) in. mm in. (a) in.
(b) 0.030 0.25 0.010 0.009 1.09 0.035 0.25 0.010 0.012 0.84
0.036 0.35 0.014 0.012 1.15 0.059 0.8 0.031 0.026 1.23
0.047 0.5 0.020 0.018 1.10 0.089 1.5 0.059 0.047 1.25
0.052 0.6 0.024 0.021 1.13 0.109 2 0.079 0.064 1.24
0.061 0.8 0.031 0.027 1.18 0.168 3.5 0.138 0.123 1.12
0.079 1 0.039 0.039 1.00 0.199 5 0.197 0.158 1.25
0.109 2 0.079 0.064 1.23 0.232 6 0.236 0.199 1.19
0.168 4 0.157 0.123 1.28 0.254 7 0.276 0.228 1.21
0.240 6 0.236 0.209 1.13 0.294 8 0.315 0.284 1.11
0.263 7 0.276 0.240 1.15 0.323 9 0.354 0.327 1.08
Table 4-7: Measurement of crack width during experiments for one selected sample from
sets of 0.55% and 0.75% Vf
0.55% 0.75%
δP Measured
Crack Width
Predicted Crack width (a)/(b)
δP Measured
Crack Width
Predicted Crack width (a)/(b)
in. mm in. (a)
in. (b) in. mm in.
(a) in. (b)
0.034 0.3 0.012 0.011 1.06 0.033 0.25 0.010 0.011 0.91
0.045 0.5 0.020 0.017 1.16 0.041 0.35 0.014 0.015 0.93
0.059 0.625 0.025 0.025 0.98 0.050 0.5 0.020 0.020 0.98
0.071 0.75 0.030 0.034 0.88 0.058 0.6 0.024 0.025 0.96
0.087 1 0.039 0.046 0.86 0.065 0.8 0.031 0.030 1.06
0.101 1.25 0.049 0.057 0.86 0.075 1 0.039 0.036 1.08
0.115 1.5 0.059 0.069 0.85 0.092 1.5 0.059 0.050 1.19
0.132 1.8 0.071 0.085 0.83 0.151 3 0.118 0.104 1.13
0.141 2 0.079 0.094 0.84 0.194 4 0.157 0.152 1.03
0.171 3 0.118 0.126 0.94 0.244 7 0.276 0.215 1.28
0.238 5 0.197 0.207 0.95 0.276 8 0.315 0.258 1.22
0.267 6 0.236 0.246 0.96 0.323 8 0.315 0.327 0.96
0.286 7 0.276 0.272 1.01 0.363 10 0.394 0.389 1.01
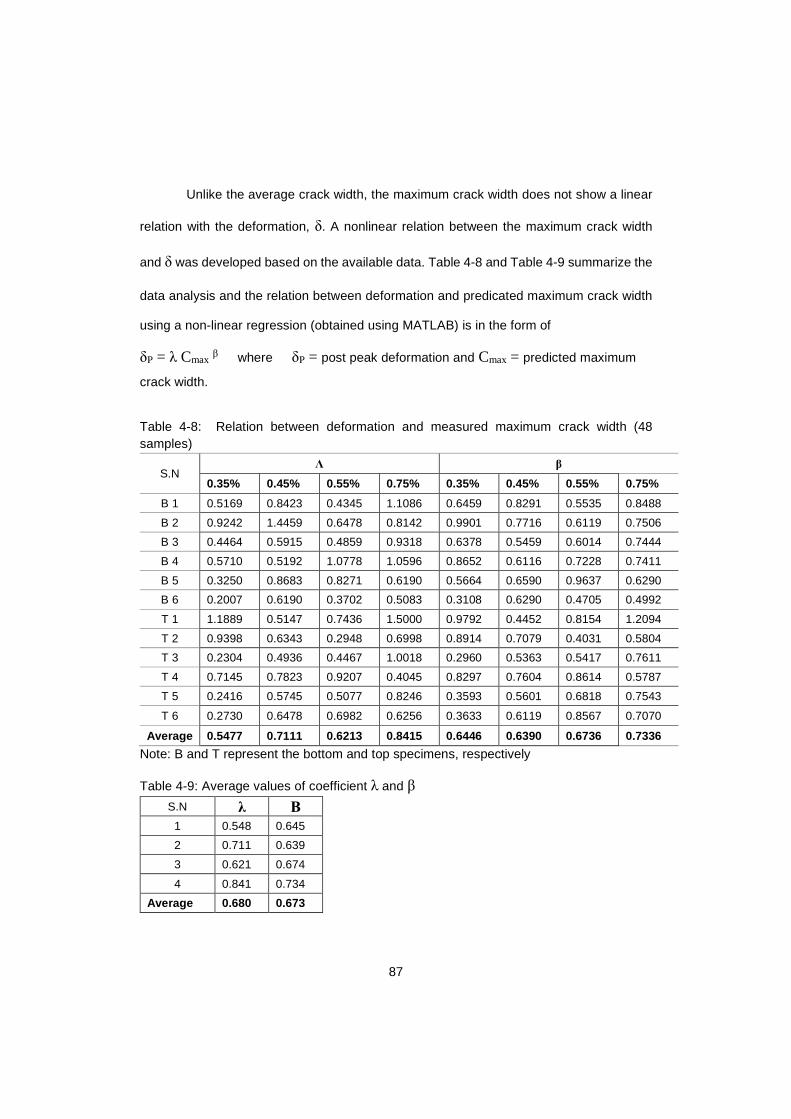
87
Unlike the average crack width, the maximum crack width does not show a linear
relation with the deformation, δ. A nonlinear relation between the maximum crack width
and δ was developed based on the available data. Table 4-8 and Table 4-9 summarize the
data analysis and the relation between deformation and predicated maximum crack width
using a non-linear regression (obtained using MATLAB) is in the form of
δP = λ Cmax β where δP = post peak deformation and Cmax = predicted maximum
crack width.
Table 4-8: Relation between deformation and measured maximum crack width (48 samples)
S.N Λ β
0.35% 0.45% 0.55% 0.75% 0.35% 0.45% 0.55% 0.75%
B 1 0.5169 0.8423 0.4345 1.1086 0.6459 0.8291 0.5535 0.8488
B 2 0.9242 1.4459 0.6478 0.8142 0.9901 0.7716 0.6119 0.7506
B 3 0.4464 0.5915 0.4859 0.9318 0.6378 0.5459 0.6014 0.7444
B 4 0.5710 0.5192 1.0778 1.0596 0.8652 0.6116 0.7228 0.7411
B 5 0.3250 0.8683 0.8271 0.6190 0.5664 0.6590 0.9637 0.6290
B 6 0.2007 0.6190 0.3702 0.5083 0.3108 0.6290 0.4705 0.4992
T 1 1.1889 0.5147 0.7436 1.5000 0.9792 0.4452 0.8154 1.2094
T 2 0.9398 0.6343 0.2948 0.6998 0.8914 0.7079 0.4031 0.5804
T 3 0.2304 0.4936 0.4467 1.0018 0.2960 0.5363 0.5417 0.7611
T 4 0.7145 0.7823 0.9207 0.4045 0.8297 0.7604 0.8614 0.5787
T 5 0.2416 0.5745 0.5077 0.8246 0.3593 0.5601 0.6818 0.7543
T 6 0.2730 0.6478 0.6982 0.6256 0.3633 0.6119 0.8567 0.7070
Average 0.5477 0.7111 0.6213 0.8415 0.6446 0.6390 0 .6736 0.7336
Note: B and T represent the bottom and top specimens, respectively
Table 4-9: Average values of coefficient λ and β
S.N λ Β 1 0.548 0.645
2 0.711 0.639
3 0.621 0.674
4 0.841 0.734
Average 0.680 0.673
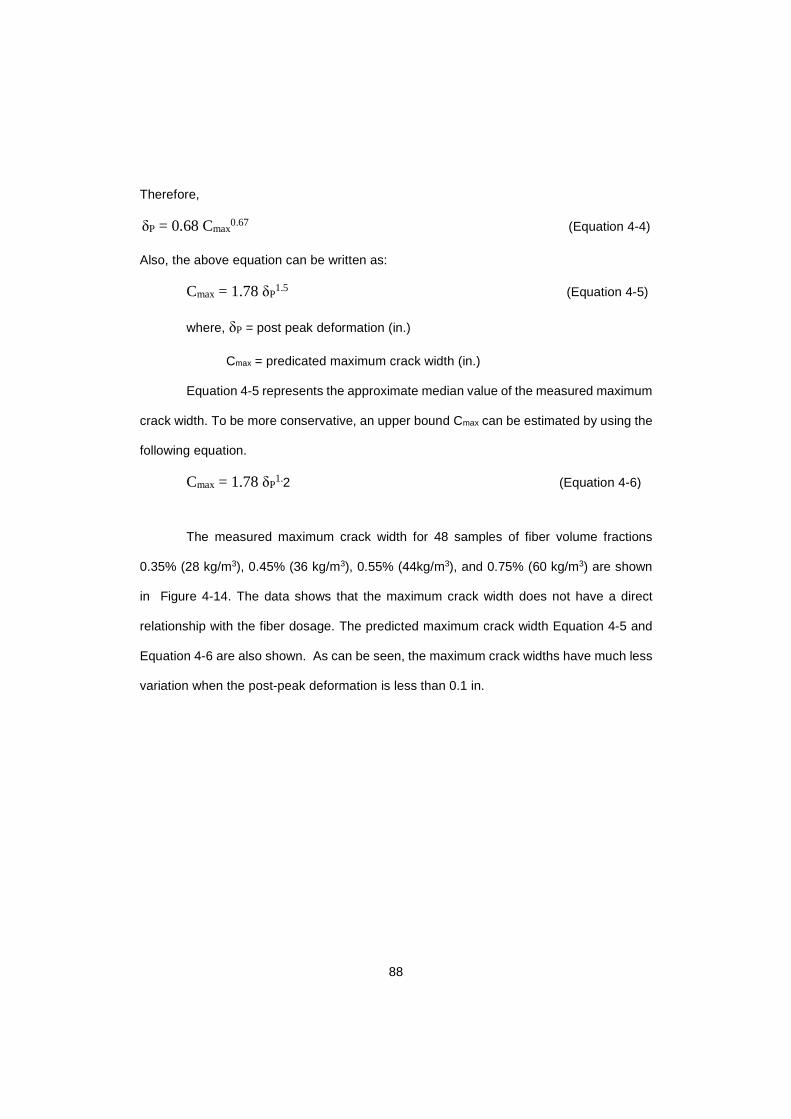
88
Therefore,
δP = 0.68 Cmax0.67 (Equation 4-4)
Also, the above equation can be written as:
Cmax = 1.78 δP1.5 (Equation 4-5)
where, δP = post peak deformation (in.)
Cmax = predicated maximum crack width (in.)
Equation 4-5 represents the approximate median value of the measured maximum
crack width. To be more conservative, an upper bound Cmax can be estimated by using the
following equation.
Cmax = 1.78 δP1.2 (Equation 4-6)
The measured maximum crack width for 48 samples of fiber volume fractions
0.35% (28 kg/m3), 0.45% (36 kg/m3), 0.55% (44kg/m3), and 0.75% (60 kg/m3) are shown
in Figure 4-14. The data shows that the maximum crack width does not have a direct
relationship with the fiber dosage. The predicted maximum crack width Equation 4-5 and
Equation 4-6 are also shown. As can be seen, the maximum crack widths have much less
variation when the post-peak deformation is less than 0.1 in.
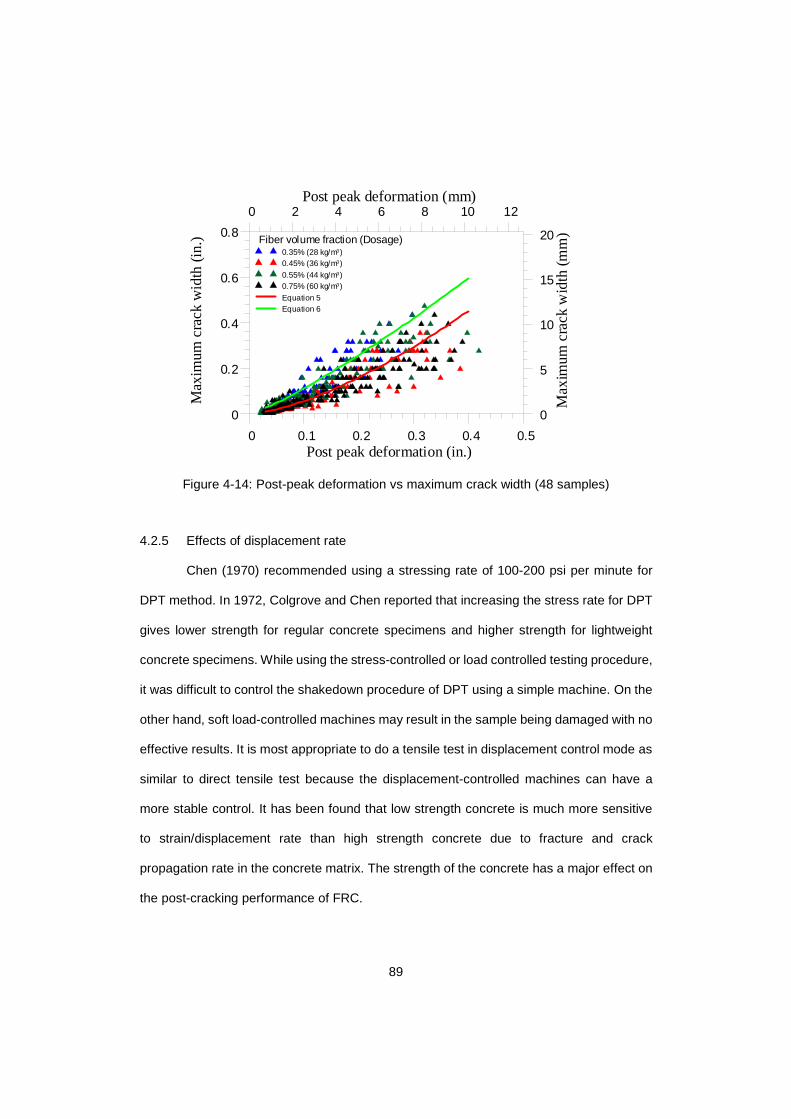
89
0 0.1 0.2 0.3 0.4 0.5Post peak deformation (in.)
0
0.2
0.4
0.6
0.8
Max
imum
cra
ck w
idth
(in.
)0 2 4 6 8 10 12
Post peak deformation (mm)
0
5
10
15
20
Ma
xim
um c
rack
wid
th (m
m)
Fiber volume fraction (Dosage)0.35% (28 kg/m3)0.45% (36 kg/m3)
0.55% (44 kg/m3)0.75% (60 kg/m3)
Equation 5Equation 6
Figure 4-14: Post-peak deformation vs maximum crack width (48 samples)
4.2.5 Effects of displacement rate
Chen (1970) recommended using a stressing rate of 100-200 psi per minute for
DPT method. In 1972, Colgrove and Chen reported that increasing the stress rate for DPT
gives lower strength for regular concrete specimens and higher strength for lightweight
concrete specimens. While using the stress-controlled or load controlled testing procedure,
it was difficult to control the shakedown procedure of DPT using a simple machine. On the
other hand, soft load-controlled machines may result in the sample being damaged with no
effective results. It is most appropriate to do a tensile test in displacement control mode as
similar to direct tensile test because the displacement-controlled machines can have a
more stable control. It has been found that low strength concrete is much more sensitive
to strain/displacement rate than high strength concrete due to fracture and crack
propagation rate in the concrete matrix. The strength of the concrete has a major effect on
the post-cracking performance of FRC.
90
The displacement rate used in the study of the influence of fiber volume fraction in
DPT was 0.02 in/min (0.5 mm/min) which was also used by various researchers (Mollins
et. al. 2007, Pujadas et. al 2012 and Blanco et. al. 2014). It is observed that the
displacement rate of 0.02 in./min (0.5 mm/min) for FRC requires about 25 to 30 minutes to
complete the test. However, the present 25-30 minutes is considered lengthy for a quality
control (QC) test. It is obligatory to alter the displacement rate for testing without affecting
the performance and results of FRC. For this purpose, another 8 bottom specimens with
displacement rate of 0.012 in/min, 0.02 in/min, 0.04 in/min and 0.05 in./min were tested
with 0.55% fiber volume (44kg/m3). ASTM 1609 permits to use 0.012 in./min for beyond
net deflection of L/900 for 6 in. x 6in. x 20 in. beam at the highest and 0.02 in./min is the
prevailing rate in DPT. In order to determine the optimal displacement rate with good
balance between accuracy and time, two more rates of 0.04 in./min and 0.05 in./min was
chosen that completes test within 10 to 12 minutes. From Figure 4-15 and Figure 4-16, it
can be observed that when 0.05 in./min was used as displacement rate for testing, the
peak load increases and the post-cracking curve drop more gradually. While the results
from 0.012 in./min, 0.02 in./min and 0.04 in./min were similar in terms of peak load and
post-cracking behavior of FRC (Table 4-10). However, difference in strength between 0.02
in./min and 0.04 in./min is minor and the faster test rate of 0.05 in./min cause the apparent
increase in strength. Hence, 0.04 in./min was determined to the optimum displacement rate
in DPT for comparative assessment of post-cracking behavior for FRC and the testing was
also completed within the desired time frame.

91
Table 4-10 Comparison for various displacement rate with 0.55% Vf
S.N Displacement
rate
Number
of
samples
Vf
Total
time for
the test
Average
Peak
Load
Average
peak
tensile
strength
Average
compressive
test
Set 5
0.012 in./min 2
0.55%
[44 kg/m3]
48 min 32.1 kips
[142.8 kN]
364.7 psi
[2.51 MPa]
6.82 ksi
[47.1 MPa]
0.02 in./min 2 27 min 34.1 kips
[151.7 kN]
387.5 psi
[2.67 MPa]
0.04 in./min 2 12.9 min 35.5 kips
[157.9 kN]
402.7 psi
[2.78 MPa]
0.05 in./min 2 11.6 min 39.4 kips
[175.3 kN]
446.9 psi
[3.1 MPa]
0 0.05 0.1 0.15 0.2 0.25 0.3 0.35Deformation (in.)
0
10
20
30
40
50
Loa
d (k
ips)
0 2 4 6 8Deformation (mm)
0
50
100
150
200Lo
ad (k
N)
Effects of displacement rate (For Vf = 0.55%)
R = 0.012 in/minR = 0.02 in/minR = 0.04 in/minR = 0.05 in/min
Figure 4-15 Load vs deformation for comparing various displacement rate (0.55% Vf)

92
0 0.01 0.02 0.03 0.04 0.05 0.06Circumferential Strain (in./in.)
0
100
200
300
400
500
600T
ens
ile S
tre
ss(p
si)
0 0.01 0.02 0.03 0.04 0.05 0.06Circumferential Strain (mm/mm)
0
1
2
3
4
Ten
sile
Str
ess
(MP
a)Effects of displacement rate
(For Vf= 0.55%)
R = 0.012 in/minR = 0.02 in/minR = 0.04 in/minR = 0.05 in/min
Figure 4-16 Tensile stress vs circumferential strain for comparing various displacement rate (0.55% Vf)
Another set consisting of 12 samples with 0.35% Vf were examined to verify the
consistency of post-peak residual strength for displacement rate of 0.02 in./min and 0.04
in./min. Table 4-11 shows the information of each batch for Set 1 and Set 6.
Table 4-11 : Test parameter for FRC with 0.35% fiber volume fraction for rate 0.02 in./min
and 0.04 in./min
S.N. Set 1 Set 6
Specimen size
(Diameter x Height)
6 in. x 6 in.
[152 mm x 152 mm]
6 in. x 6 in.
[152 mm x 152 mm]
Fiber volume fraction (V f) 0.35% 0.35%
Fiber dosage 28 kg/m3 28 kg/m3
Displacement rate 0.02 in./min
[0.5 mm/min]
0.04 in./min
[1.0 mm/min]
Punch Size
(Diameter x Height)
1.5 in. x 1 in.
[38 mm x 25.4 mm]
1.5 in. x 1 in.
[38 mm x 25.4 mm]
Total number of samples 12 12
Number of bottom samples 6 6
Number of top samples 6 6
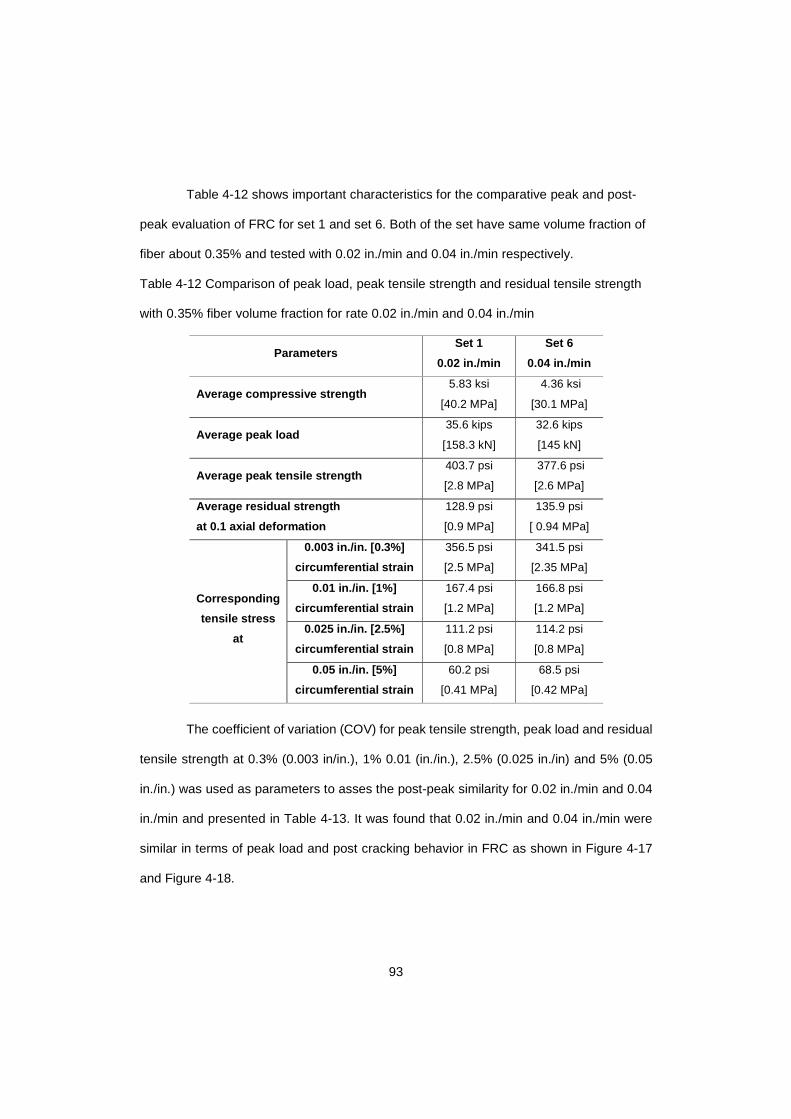
93
Table 4-12 shows important characteristics for the comparative peak and post-
peak evaluation of FRC for set 1 and set 6. Both of the set have same volume fraction of
fiber about 0.35% and tested with 0.02 in./min and 0.04 in./min respectively.
Table 4-12 Comparison of peak load, peak tensile strength and residual tensile strength
with 0.35% fiber volume fraction for rate 0.02 in./min and 0.04 in./min
Parameters Set 1
0.02 in./min
Set 6
0.04 in./min
Average compressive strength 5.83 ksi
[40.2 MPa]
4.36 ksi
[30.1 MPa]
Average peak load 35.6 kips
[158.3 kN]
32.6 kips
[145 kN]
Average peak tensile strength 403.7 psi
[2.8 MPa]
377.6 psi
[2.6 MPa]
Average residual strength
at 0.1 axial deformation
128.9 psi
[0.9 MPa]
135.9 psi
[ 0.94 MPa]
Corresponding
tensile stress
at
0.003 in./in. [0.3%]
circumferential strain
356.5 psi
[2.5 MPa]
341.5 psi
[2.35 MPa]
0.01 in./in. [1%]
circumferential strain
167.4 psi
[1.2 MPa]
166.8 psi
[1.2 MPa]
0.025 in./in. [2.5%]
circumferential strain
111.2 psi
[0.8 MPa]
114.2 psi
[0.8 MPa]
0.05 in./in. [5%]
circumferential strain
60.2 psi
[0.41 MPa]
68.5 psi
[0.42 MPa]
The coefficient of variation (COV) for peak tensile strength, peak load and residual
tensile strength at 0.3% (0.003 in/in.), 1% 0.01 (in./in.), 2.5% (0.025 in./in) and 5% (0.05
in./in.) was used as parameters to asses the post-peak similarity for 0.02 in./min and 0.04
in./min and presented in Table 4-13. It was found that 0.02 in./min and 0.04 in./min were
similar in terms of peak load and post cracking behavior in FRC as shown in Figure 4-17
and Figure 4-18.

94
Table 4-13 Comparison of COV for Set 1 and Set 6.
S.N COV
Set 1
0.35%
0.02 in./min
Set 6
0.35%
0.04 in./min
1. COV for peak load 7.1 % 9.6 %
2. COV for peak tensile strength 7.1 % 9.6 %
3. COV for residual strength at 0.1 deformation 23.5 % 28.9 %
4.
COV of residual
tensile strength
at
0.003 in./in. [0.3%]
circumferential strain 11.0 % 21.9 %
5. 0.01 in./in. [1%]
circumferential strain 23.3 % 20.7 %
6. 0.025 in./in. [2.5%]
circumferential strain 19.9 % 32.1 %
7. 0.05 in./in. [5%]
circumferential strain 24.5 % 30.1 %
0 0.05 0.1 0.15 0.2 0.25 0.3 0.35Deformation (in.)
0
10
20
30
40
50
Loa
d (k
ips)
0 2 4 6 8Deformation (mm)
0
50
100
150
200
Load
(kN
)
Effects of displacement rate (For Vf = 0.35%)
R = 0.02 in/minR = 0.04 in/min
Figure 4-17 Load vs deformation with Vf of 0.35% for 0.02 in/min and 0.04 in/min rates
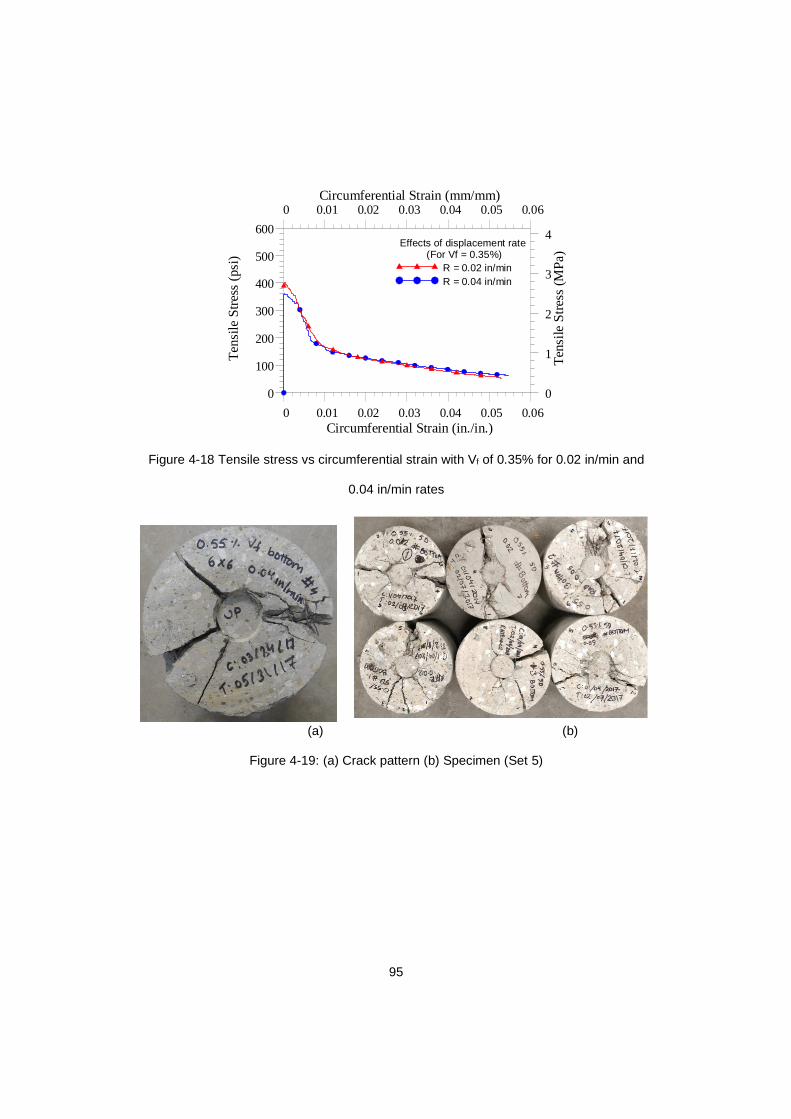
95
0 0.01 0.02 0.03 0.04 0.05 0.06Circumferential Strain (in./in.)
0
100
200
300
400
500
600T
ensi
le S
tres
s(p
si)
0 0.01 0.02 0.03 0.04 0.05 0.06Circumferential Strain (mm/mm)
0
1
2
3
4
Ten
sile
Str
ess
(MP
a)Effects of displacement rate
(For Vf = 0.35%)R = 0.02 in/minR = 0.04 in/min
Figure 4-18 Tensile stress vs circumferential strain with Vf of 0.35% for 0.02 in/min and
0.04 in/min rates
(a) (b)
Figure 4-19: (a) Crack pattern (b) Specimen (Set 5)

96
4.2.6 Effects of specimen sizes
Another three sets of FRC were cast to study the effects of specimen sizes with
the same volume fraction of 0.55% and the parameters are in Table 4-15. The test was
carried with a displacement rate of 0.04 in/min. Some of the fibers are long and fiber
distribution might be an issue as fibers may tend to align in small cylinder. Larger cylinder
8 x 16 in. to inspect fiber length effect with the size of the specimen when long fibers are
used. There is no standard formwork available in market and customized formwork were
fabricated in CELB using PVC pipes and PVC boards. Larger cylinder size of 8x16 in. were
difficult to work as it was heavier.
According to Chen (1970), Equation (2-1) and Equation (2-2) are valid for b/a ≤ 4
or H/2a ≤ 4. For any ratio b/a > 4 or H/2a > 4, the limiting value b = 4a or H = 8a should be
used in Equation (2-1) and Equation (2-2) for determination of tensile strength. The punch
diameter was increased to 2 inches and punch height remaining the same (1 in.) for testing
the specimen size with height 8 in. and diameter 8 in. (Table 4-14). Hence, b/a ratio is also
4 with punch size of 2 in. x 1 in. (diameter x height) for 8x8 specimen and Equation (2-2)
is valid for determining tensile strength for 8 x 8 specimen.
Table 4-14 Ratio of b/a for 6 in. and 8 in. specimen
Specimen size
(Diameter x
Height)
Diameter of
specimen
2b
Punch
diameter
2a
b/a
Height of
specimen
h
2b/h
6 x 6 6 in. 1.5 in. 4 6 in. 1
6 x 4 6 in. 1.5 in. 4 4 in. 1.5
8 x 8 8 in. 2 in. 4 8 in. 1
For FRC, in some samples crack may not go all the way through length, it is
necessary to investigate that crack length would affect the results or not. Sometimes cracks
may start from bottom to top halfway, sometimes from top to bottom halfway. So, some
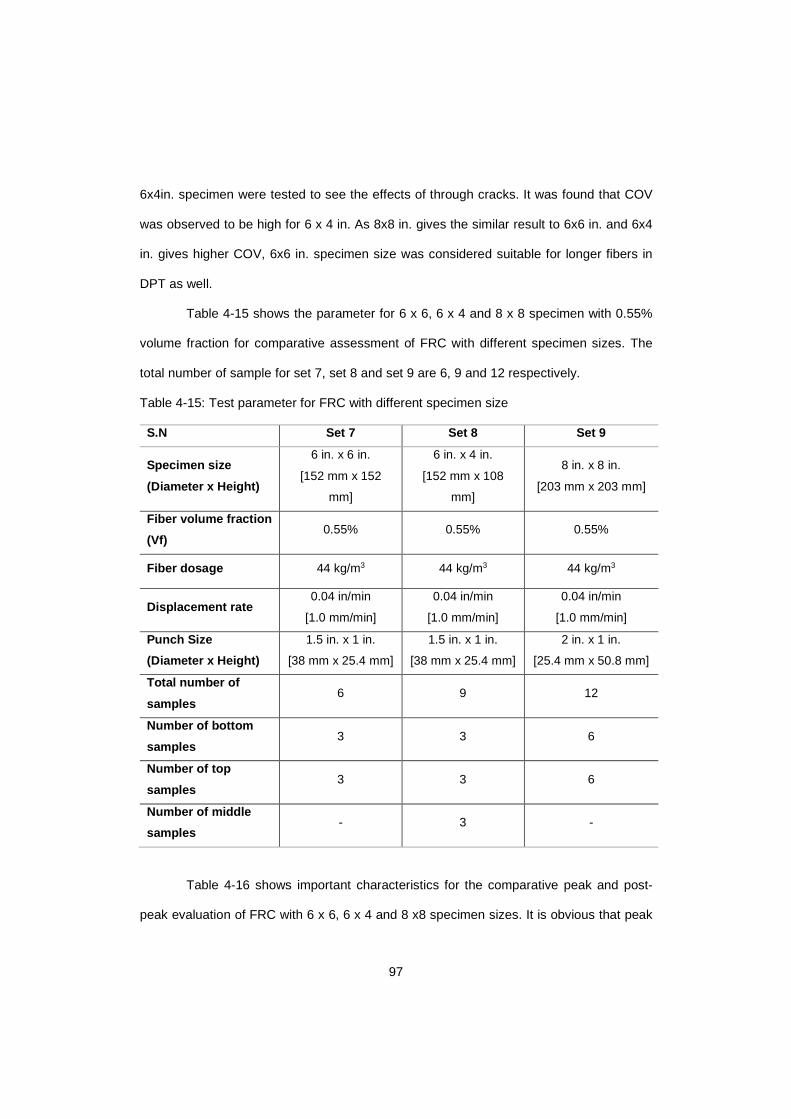
97
6x4in. specimen were tested to see the effects of through cracks. It was found that COV
was observed to be high for 6 x 4 in. As 8x8 in. gives the similar result to 6x6 in. and 6x4
in. gives higher COV, 6x6 in. specimen size was considered suitable for longer fibers in
DPT as well.
Table 4-15 shows the parameter for 6 x 6, 6 x 4 and 8 x 8 specimen with 0.55%
volume fraction for comparative assessment of FRC with different specimen sizes. The
total number of sample for set 7, set 8 and set 9 are 6, 9 and 12 respectively.
Table 4-15: Test parameter for FRC with different specimen size
S.N Set 7 Set 8 Set 9
Specimen size
(Diameter x Height)
6 in. x 6 in.
[152 mm x 152
mm]
6 in. x 4 in.
[152 mm x 108
mm]
8 in. x 8 in.
[203 mm x 203 mm]
Fiber volume fraction
(Vf) 0.55% 0.55% 0.55%
Fiber dosage 44 kg/m3 44 kg/m3 44 kg/m3
Displacement rate 0.04 in/min
[1.0 mm/min]
0.04 in/min
[1.0 mm/min]
0.04 in/min
[1.0 mm/min]
Punch Size
(Diameter x Height)
1.5 in. x 1 in.
[38 mm x 25.4 mm]
1.5 in. x 1 in.
[38 mm x 25.4 mm]
2 in. x 1 in.
[25.4 mm x 50.8 mm]
Total number of
samples 6 9 12
Number of bottom
samples 3 3 6
Number of top
samples 3 3 6
Number of middle
samples - 3 -
Table 4-16 shows important characteristics for the comparative peak and post-
peak evaluation of FRC with 6 x 6, 6 x 4 and 8 x8 specimen sizes. It is obvious that peak
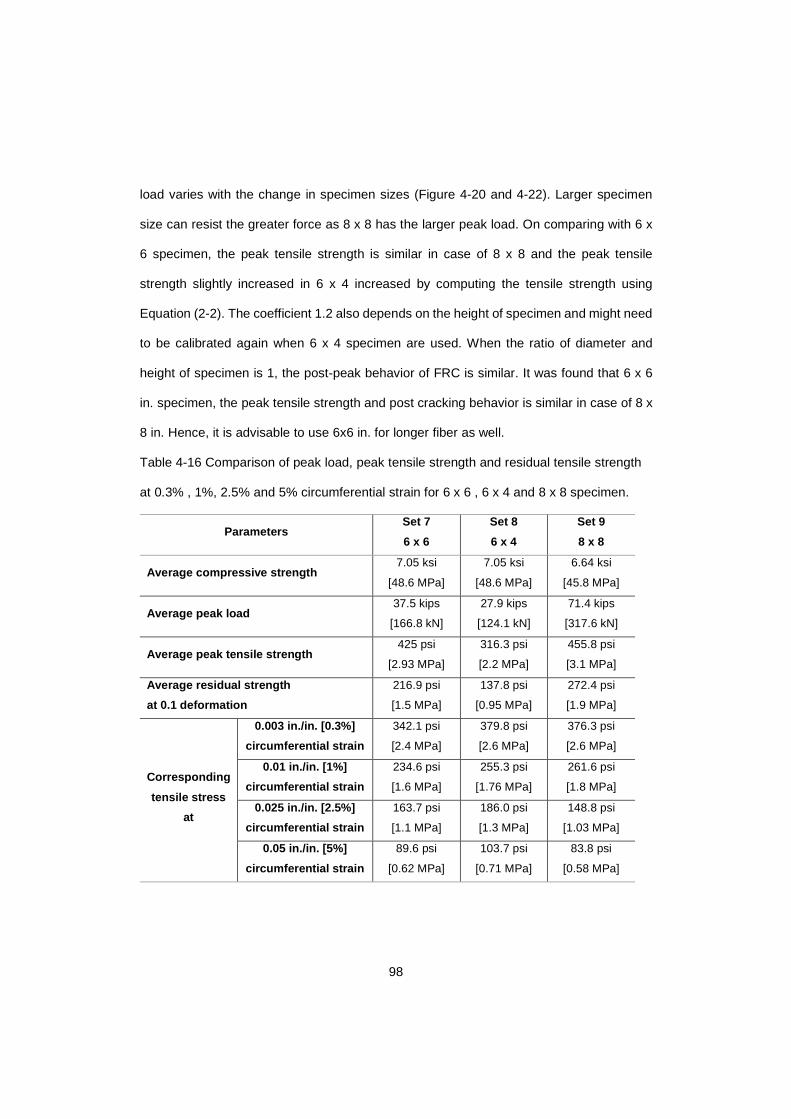
98
load varies with the change in specimen sizes (Figure 4-20 and 4-22). Larger specimen
size can resist the greater force as 8 x 8 has the larger peak load. On comparing with 6 x
6 specimen, the peak tensile strength is similar in case of 8 x 8 and the peak tensile
strength slightly increased in 6 x 4 increased by computing the tensile strength using
Equation (2-2). The coefficient 1.2 also depends on the height of specimen and might need
to be calibrated again when 6 x 4 specimen are used. When the ratio of diameter and
height of specimen is 1, the post-peak behavior of FRC is similar. It was found that 6 x 6
in. specimen, the peak tensile strength and post cracking behavior is similar in case of 8 x
8 in. Hence, it is advisable to use 6x6 in. for longer fiber as well.
Table 4-16 Comparison of peak load, peak tensile strength and residual tensile strength
at 0.3% , 1%, 2.5% and 5% circumferential strain for 6 x 6 , 6 x 4 and 8 x 8 specimen.
Parameters Set 7
6 x 6
Set 8
6 x 4
Set 9
8 x 8
Average compressive strength 7.05 ksi
[48.6 MPa]
7.05 ksi
[48.6 MPa]
6.64 ksi
[45.8 MPa]
Average peak load 37.5 kips
[166.8 kN]
27.9 kips
[124.1 kN]
71.4 kips
[317.6 kN]
Average peak tensile strength 425 psi
[2.93 MPa]
316.3 psi
[2.2 MPa]
455.8 psi
[3.1 MPa]
Average residual strength
at 0.1 deformation
216.9 psi
[1.5 MPa]
137.8 psi
[0.95 MPa]
272.4 psi
[1.9 MPa]
Corresponding
tensile stress
at
0.003 in./in. [0.3%]
circumferential strain
342.1 psi
[2.4 MPa]
379.8 psi
[2.6 MPa]
376.3 psi
[2.6 MPa]
0.01 in./in. [1%]
circumferential strain
234.6 psi
[1.6 MPa]
255.3 psi
[1.76 MPa]
261.6 psi
[1.8 MPa]
0.025 in./in. [2.5%]
circumferential strain
163.7 psi
[1.1 MPa]
186.0 psi
[1.3 MPa]
148.8 psi
[1.03 MPa]
0.05 in./in. [5%]
circumferential strain
89.6 psi
[0.62 MPa]
103.7 psi
[0.71 MPa]
83.8 psi
[0.58 MPa]
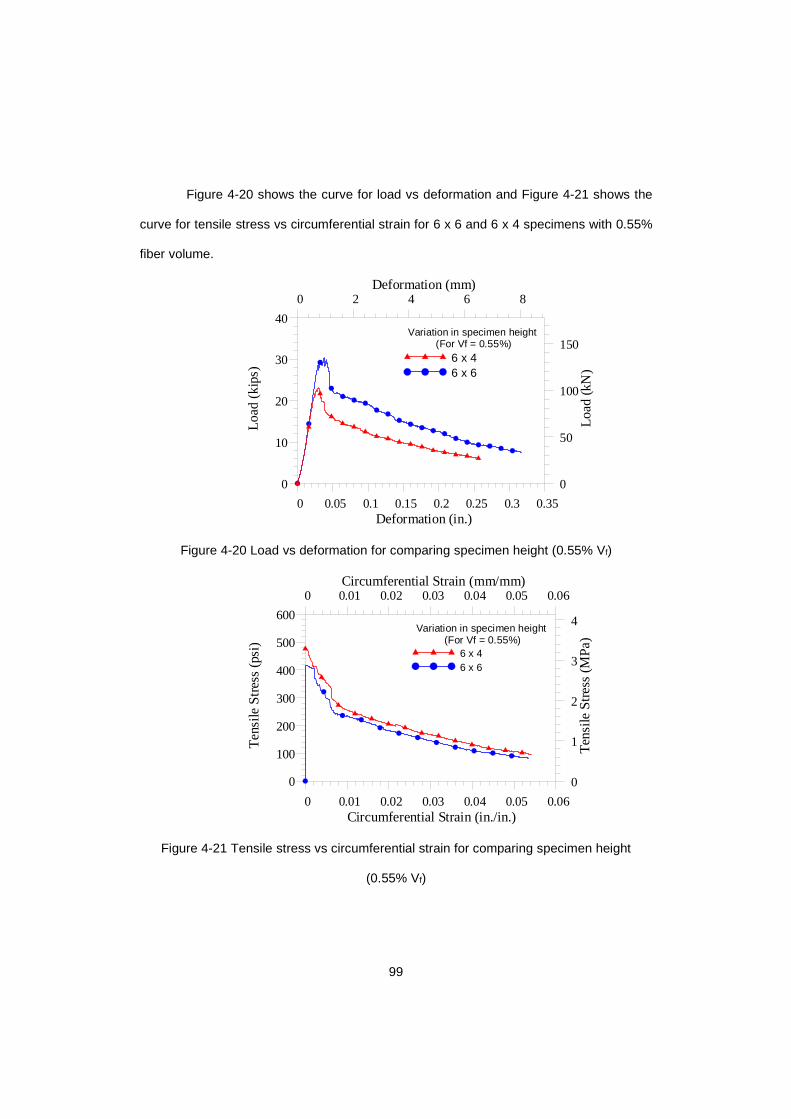
99
Figure 4-20 shows the curve for load vs deformation and Figure 4-21 shows the
curve for tensile stress vs circumferential strain for 6 x 6 and 6 x 4 specimens with 0.55%
fiber volume.
0 0.05 0.1 0.15 0.2 0.25 0.3 0.35Deformation (in.)
0
10
20
30
40
Loa
d(k
ips)
0 2 4 6 8Deformation (mm)
0
50
100
150
Loa
d (k
N)
Variation in specimen height (For Vf = 0.55%)
6 x 4 6 x 6
Figure 4-20 Load vs deformation for comparing specimen height (0.55% Vf)
0 0.01 0.02 0.03 0.04 0.05 0.06Circumferential Strain (in./in.)
0
100
200
300
400
500
600
Ten
sile
Str
ess
(psi
)
0 0.01 0.02 0.03 0.04 0.05 0.06Circumferential Strain (mm/mm)
0
1
2
3
4
Ten
sile
Str
ess
(MP
a)Variation in specimen height
(For Vf = 0.55%)6 x 4 6 x 6
Figure 4-21 Tensile stress vs circumferential strain for comparing specimen height
(0.55% Vf)
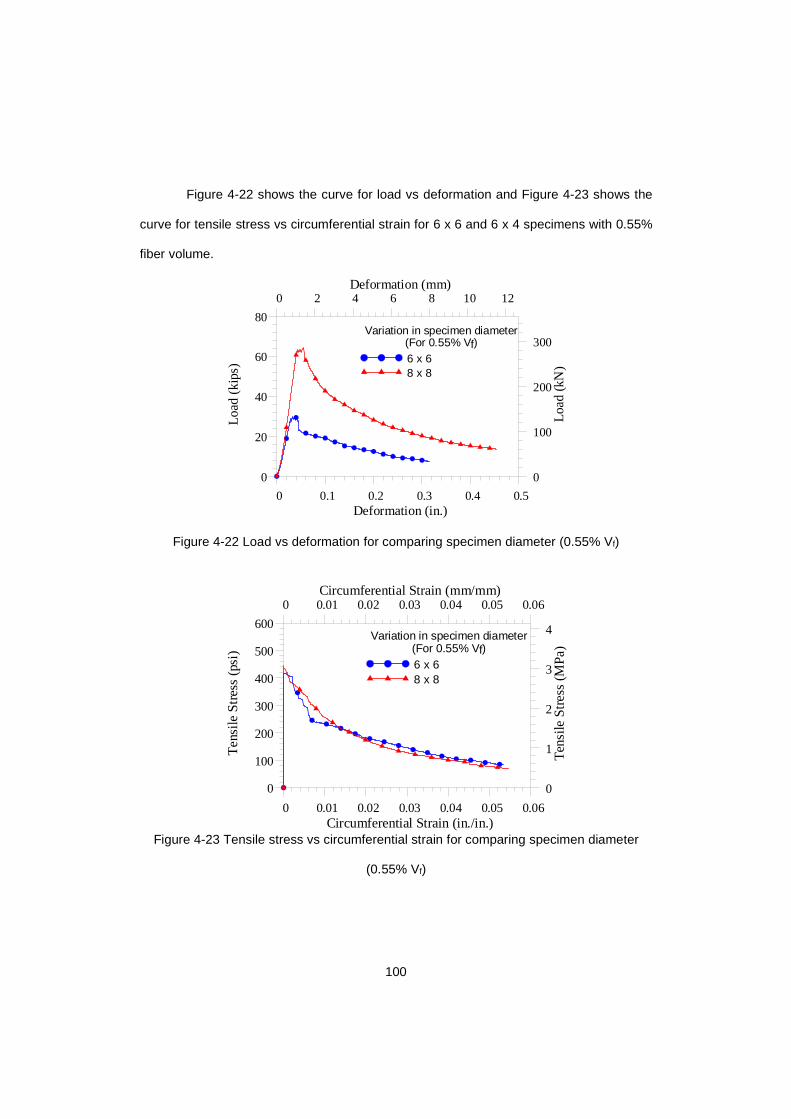
100
Figure 4-22 shows the curve for load vs deformation and Figure 4-23 shows the
curve for tensile stress vs circumferential strain for 6 x 6 and 6 x 4 specimens with 0.55%
fiber volume.
0 0.1 0.2 0.3 0.4 0.5Deformation (in.)
0
20
40
60
80
Load
(kip
s)
0 2 4 6 8 10 12Deformation (mm)
0
100
200
300
Loa
d (k
N)
Variation in specimen diameter(For 0.55% Vf)6 x 6 8 x 8
Figure 4-22 Load vs deformation for comparing specimen diameter (0.55% Vf)
0 0.01 0.02 0.03 0.04 0.05 0.06Circumferential Strain (in./in.)
0
100
200
300
400
500
600
Te
nsile
Str
ess
(psi
)
0 0.01 0.02 0.03 0.04 0.05 0.06Circumferential Strain (mm/mm)
0
1
2
3
4
Ten
sile
Str
ess
(MP
a)Variation in specimen diameter
(For 0.55% Vf)6 x 68 x 8
Figure 4-23 Tensile stress vs circumferential strain for comparing specimen diameter
(0.55% Vf)
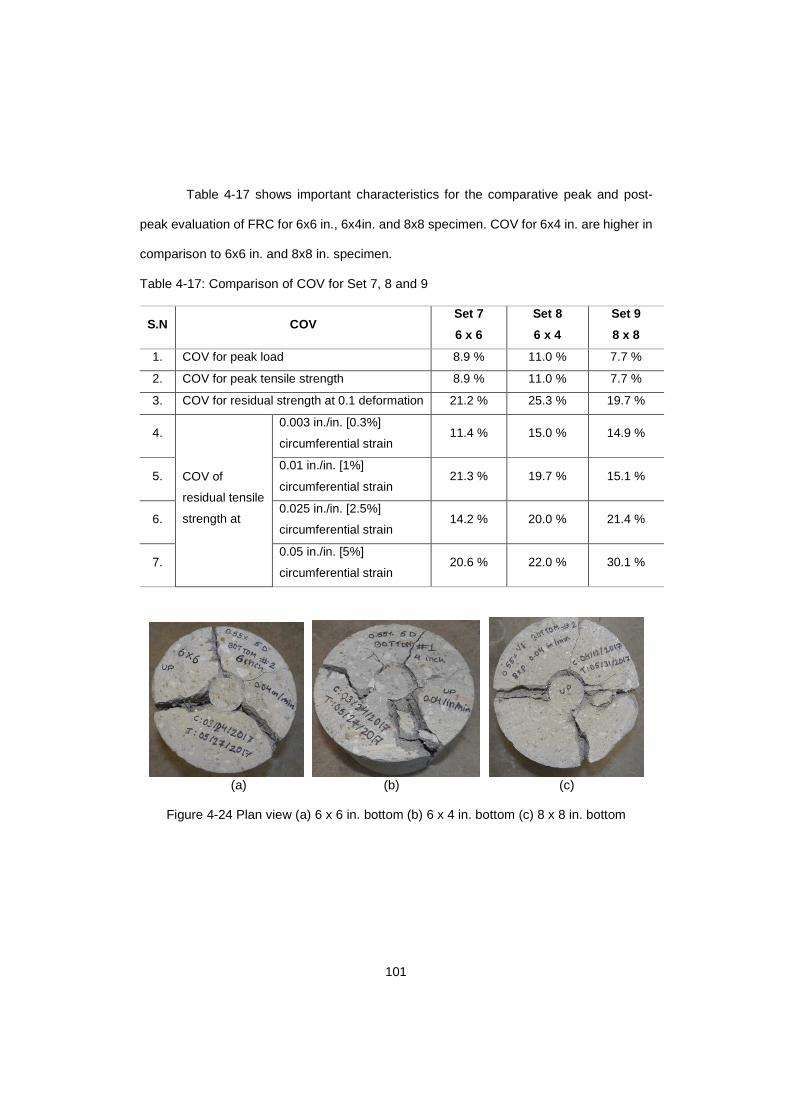
101
Table 4-17 shows important characteristics for the comparative peak and post-
peak evaluation of FRC for 6x6 in., 6x4in. and 8x8 specimen. COV for 6x4 in. are higher in
comparison to 6x6 in. and 8x8 in. specimen.
Table 4-17: Comparison of COV for Set 7, 8 and 9
S.N COV Set 7
6 x 6
Set 8
6 x 4
Set 9
8 x 8
1. COV for peak load 8.9 % 11.0 % 7.7 %
2. COV for peak tensile strength 8.9 % 11.0 % 7.7 %
3. COV for residual strength at 0.1 deformation 21.2 % 25.3 % 19.7 %
4.
COV of
residual tensile
strength at
0.003 in./in. [0.3%]
circumferential strain 11.4 % 15.0 % 14.9 %
5. 0.01 in./in. [1%]
circumferential strain 21.3 % 19.7 % 15.1 %
6. 0.025 in./in. [2.5%]
circumferential strain 14.2 % 20.0 % 21.4 %
7. 0.05 in./in. [5%]
circumferential strain 20.6 % 22.0 % 30.1 %
(a) (b) (c)
Figure 4-24 Plan view (a) 6 x 6 in. bottom (b) 6 x 4 in. bottom (c) 8 x 8 in. bottom
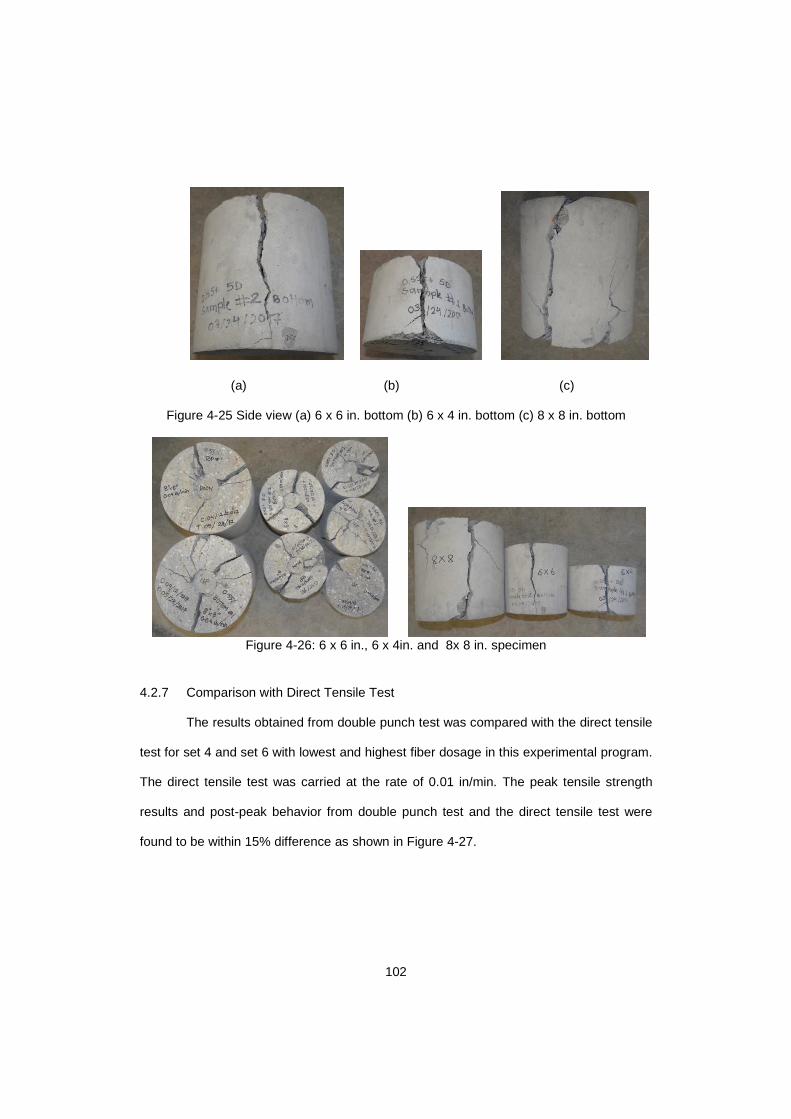
102
(a) (b) (c)
Figure 4-25 Side view (a) 6 x 6 in. bottom (b) 6 x 4 in. bottom (c) 8 x 8 in. bottom
Figure 4-26: 6 x 6 in., 6 x 4in. and 8x 8 in. specimen
4.2.7 Comparison with Direct Tensile Test
The results obtained from double punch test was compared with the direct tensile
test for set 4 and set 6 with lowest and highest fiber dosage in this experimental program.
The direct tensile test was carried at the rate of 0.01 in/min. The peak tensile strength
results and post-peak behavior from double punch test and the direct tensile test were
found to be within 15% difference as shown in Figure 4-27.
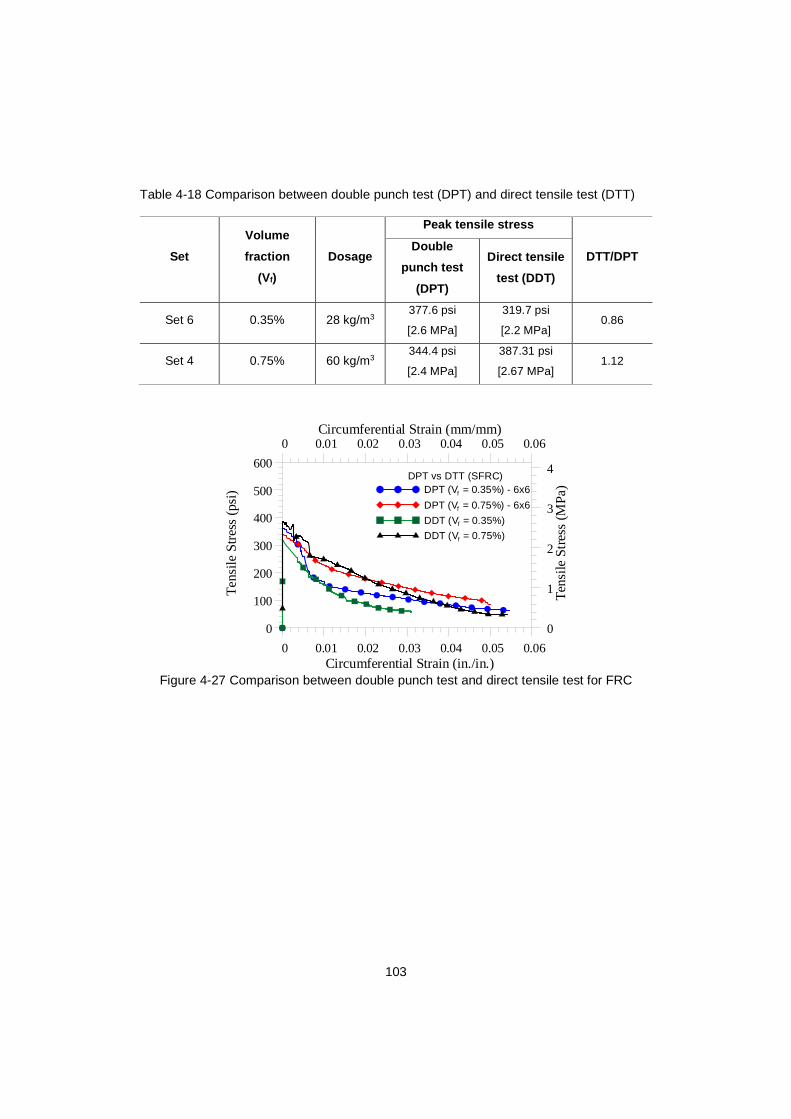
103
Table 4-18 Comparison between double punch test (DPT) and direct tensile test (DTT)
Set
Volume
fraction
(Vf)
Dosage
Peak tensile stress
DTT/DPT Double
punch test
(DPT)
Direct tensile
test (DDT)
Set 6 0.35% 28 kg/m3 377.6 psi
[2.6 MPa]
319.7 psi
[2.2 MPa] 0.86
Set 4 0.75% 60 kg/m3 344.4 psi
[2.4 MPa]
387.31 psi
[2.67 MPa] 1.12
0 0.01 0.02 0.03 0.04 0.05 0.06Circumferential Strain (in./in.)
0
100
200
300
400
500
600
Te
nsile
Str
ess
(psi
)
0 0.01 0.02 0.03 0.04 0.05 0.06Circumferential Strain (mm/mm)
0
1
2
3
4
Ten
sile
Str
ess
(MP
a)DPT vs DTT (SFRC)
DPT (Vf = 0.35%) - 6x6
DPT (Vf = 0.75%) - 6x6
DDT (Vf = 0.35%)
DDT (Vf = 0.75%)
Figure 4-27 Comparison between double punch test and direct tensile test for FRC
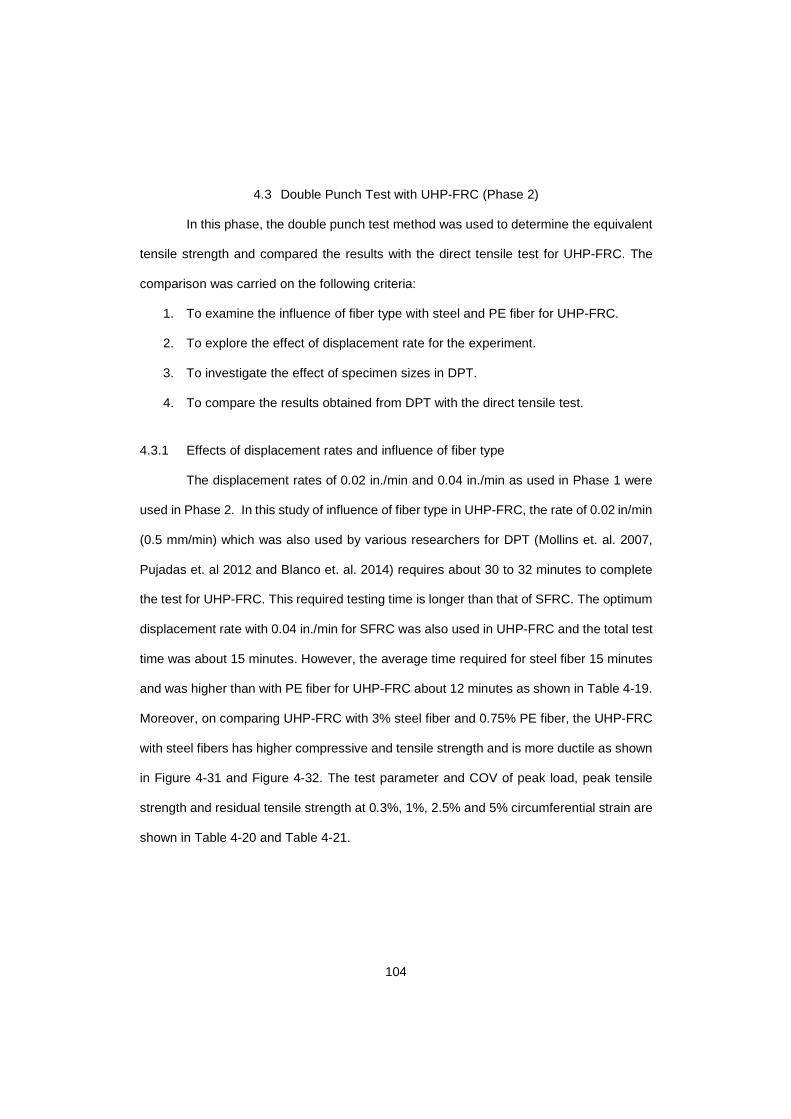
104
4.3 Double Punch Test with UHP-FRC (Phase 2)
In this phase, the double punch test method was used to determine the equivalent
tensile strength and compared the results with the direct tensile test for UHP-FRC. The
comparison was carried on the following criteria:
1. To examine the influence of fiber type with steel and PE fiber for UHP-FRC.
2. To explore the effect of displacement rate for the experiment.
3. To investigate the effect of specimen sizes in DPT.
4. To compare the results obtained from DPT with the direct tensile test.
4.3.1 Effects of displacement rates and influence of fiber type
The displacement rates of 0.02 in./min and 0.04 in./min as used in Phase 1 were
used in Phase 2. In this study of influence of fiber type in UHP-FRC, the rate of 0.02 in/min
(0.5 mm/min) which was also used by various researchers for DPT (Mollins et. al. 2007,
Pujadas et. al 2012 and Blanco et. al. 2014) requires about 30 to 32 minutes to complete
the test for UHP-FRC. This required testing time is longer than that of SFRC. The optimum
displacement rate with 0.04 in./min for SFRC was also used in UHP-FRC and the total test
time was about 15 minutes. However, the average time required for steel fiber 15 minutes
and was higher than with PE fiber for UHP-FRC about 12 minutes as shown in Table 4-19.
Moreover, on comparing UHP-FRC with 3% steel fiber and 0.75% PE fiber, the UHP-FRC
with steel fibers has higher compressive and tensile strength and is more ductile as shown
in Figure 4-31 and Figure 4-32. The test parameter and COV of peak load, peak tensile
strength and residual tensile strength at 0.3%, 1%, 2.5% and 5% circumferential strain are
shown in Table 4-20 and Table 4-21.
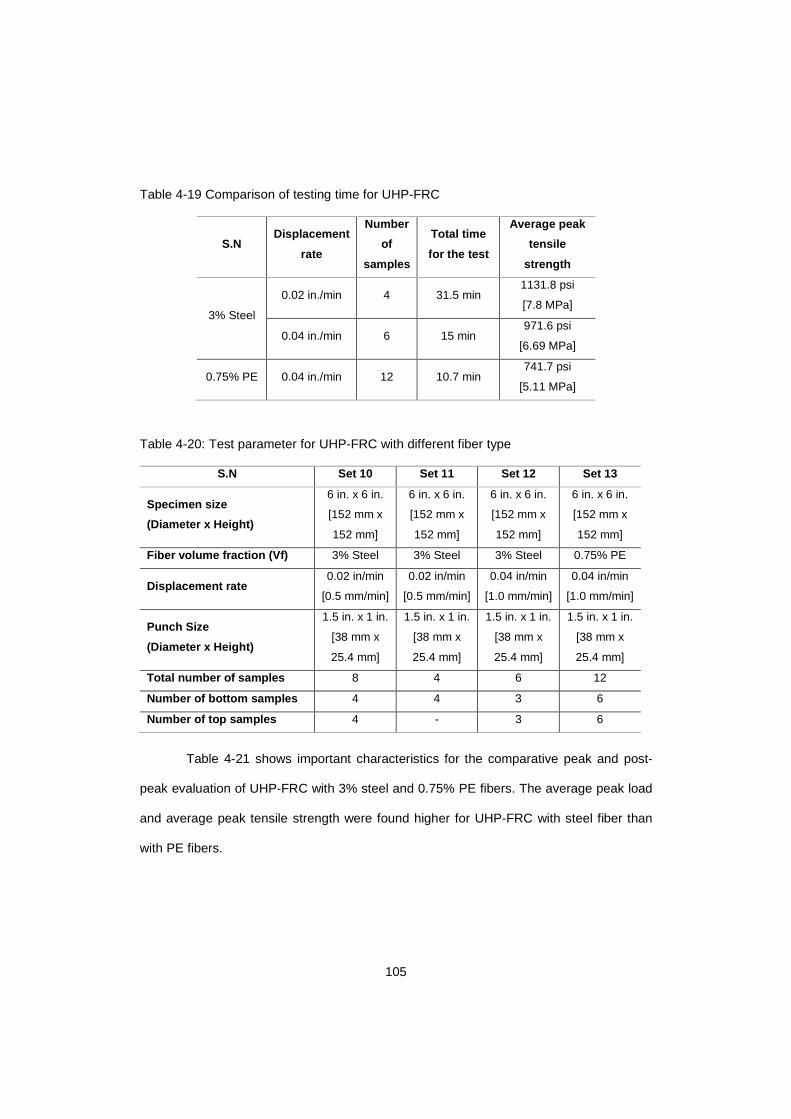
105
Table 4-19 Comparison of testing time for UHP-FRC
S.N Displacement
rate
Number
of
samples
Total time
for the test
Average peak
tensile
strength
3% Steel
0.02 in./min 4 31.5 min 1131.8 psi
[7.8 MPa]
0.04 in./min 6 15 min 971.6 psi
[6.69 MPa]
0.75% PE 0.04 in./min 12 10.7 min 741.7 psi
[5.11 MPa]
Table 4-20: Test parameter for UHP-FRC with different fiber type
S.N Set 10 Set 11 Set 12 Set 13
Specimen size
(Diameter x Height)
6 in. x 6 in.
[152 mm x
152 mm]
6 in. x 6 in.
[152 mm x
152 mm]
6 in. x 6 in.
[152 mm x
152 mm]
6 in. x 6 in.
[152 mm x
152 mm]
Fiber volume fraction (Vf) 3% Steel 3% Steel 3% Steel 0.75% PE
Displacement rate 0.02 in/min
[0.5 mm/min]
0.02 in/min
[0.5 mm/min]
0.04 in/min
[1.0 mm/min]
0.04 in/min
[1.0 mm/min]
Punch Size
(Diameter x Height)
1.5 in. x 1 in.
[38 mm x
25.4 mm]
1.5 in. x 1 in.
[38 mm x
25.4 mm]
1.5 in. x 1 in.
[38 mm x
25.4 mm]
1.5 in. x 1 in.
[38 mm x
25.4 mm]
Total number of samples 8 4 6 12
Number of bottom samples 4 4 3 6
Number of top samples 4 - 3 6
Table 4-21 shows important characteristics for the comparative peak and post-
peak evaluation of UHP-FRC with 3% steel and 0.75% PE fibers. The average peak load
and average peak tensile strength were found higher for UHP-FRC with steel fiber than
with PE fibers.
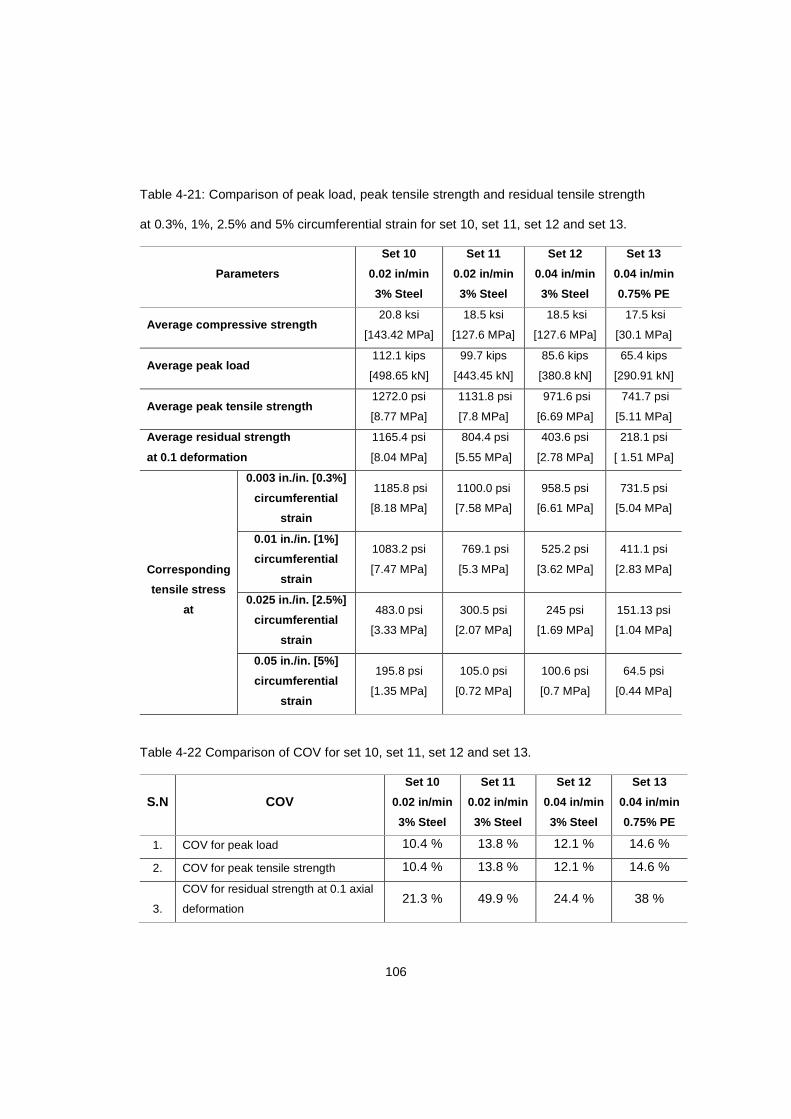
106
Table 4-21: Comparison of peak load, peak tensile strength and residual tensile strength
at 0.3%, 1%, 2.5% and 5% circumferential strain for set 10, set 11, set 12 and set 13.
Parameters
Set 10
0.02 in/min
3% Steel
Set 11
0.02 in/min
3% Steel
Set 12
0.04 in/min
3% Steel
Set 13
0.04 in/min
0.75% PE
Average compressive strength 20.8 ksi
[143.42 MPa]
18.5 ksi
[127.6 MPa]
18.5 ksi
[127.6 MPa]
17.5 ksi
[30.1 MPa]
Average peak load 112.1 kips
[498.65 kN]
99.7 kips
[443.45 kN]
85.6 kips
[380.8 kN]
65.4 kips
[290.91 kN]
Average peak tensile strength 1272.0 psi
[8.77 MPa]
1131.8 psi
[7.8 MPa]
971.6 psi
[6.69 MPa]
741.7 psi
[5.11 MPa]
Average residual strength
at 0.1 deformation
1165.4 psi
[8.04 MPa]
804.4 psi
[5.55 MPa]
403.6 psi
[2.78 MPa]
218.1 psi
[ 1.51 MPa]
Corresponding
tensile stress
at
0.003 in./in. [0.3%]
circumferential
strain
1185.8 psi
[8.18 MPa]
1100.0 psi
[7.58 MPa]
958.5 psi
[6.61 MPa]
731.5 psi
[5.04 MPa]
0.01 in./in. [1%]
circumferential
strain
1083.2 psi
[7.47 MPa]
769.1 psi
[5.3 MPa]
525.2 psi
[3.62 MPa]
411.1 psi
[2.83 MPa]
0.025 in./in. [2.5%]
circumferential
strain
483.0 psi
[3.33 MPa]
300.5 psi
[2.07 MPa]
245 psi
[1.69 MPa]
151.13 psi
[1.04 MPa]
0.05 in./in. [5%]
circumferential
strain
195.8 psi
[1.35 MPa]
105.0 psi
[0.72 MPa]
100.6 psi
[0.7 MPa]
64.5 psi
[0.44 MPa]
Table 4-22 Comparison of COV for set 10, set 11, set 12 and set 13.
S.N COV
Set 10
0.02 in/min
3% Steel
Set 11
0.02 in/min
3% Steel
Set 12
0.04 in/min
3% Steel
Set 13
0.04 in/min
0.75% PE
1. COV for peak load 10.4 % 13.8 % 12.1 % 14.6 %
2. COV for peak tensile strength 10.4 % 13.8 % 12.1 % 14.6 %
3.
COV for residual strength at 0.1 axial
deformation 21.3 % 49.9 % 24.4 % 38 %
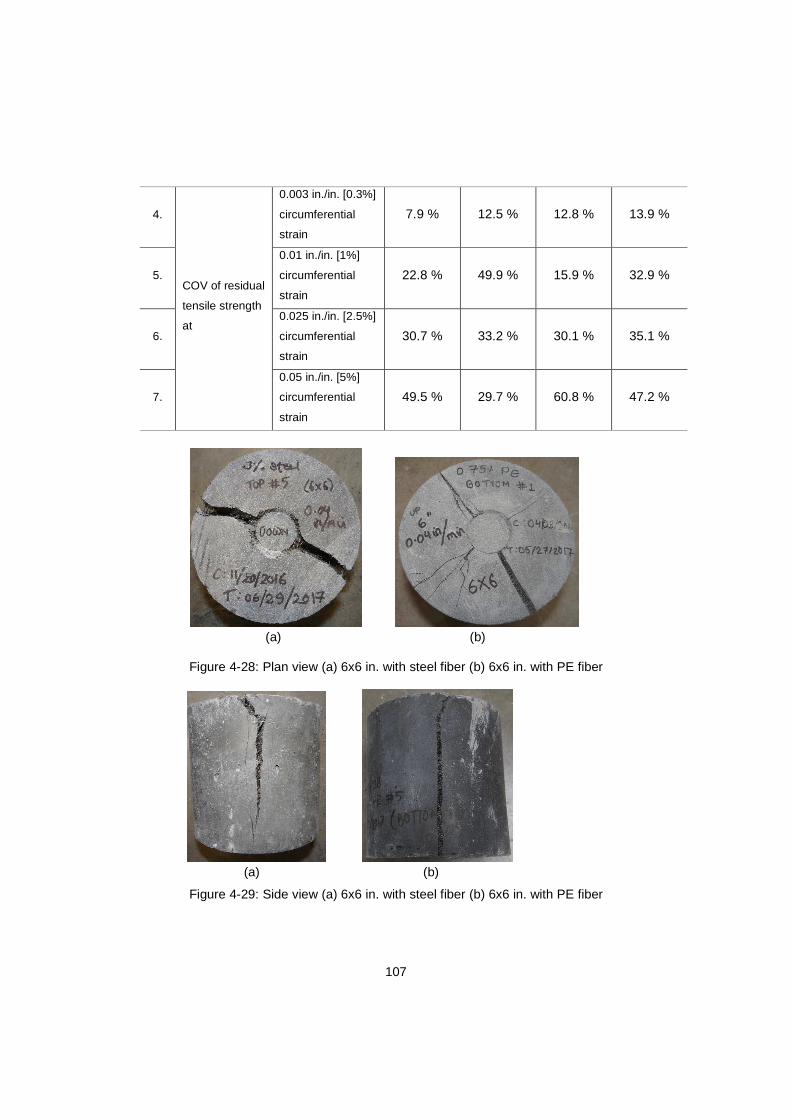
107
4.
COV of residual
tensile strength
at
0.003 in./in. [0.3%]
circumferential
strain
7.9 % 12.5 % 12.8 % 13.9 %
5.
0.01 in./in. [1%]
circumferential
strain
22.8 % 49.9 % 15.9 % 32.9 %
6.
0.025 in./in. [2.5%]
circumferential
strain
30.7 % 33.2 % 30.1 % 35.1 %
7.
0.05 in./in. [5%]
circumferential
strain
49.5 % 29.7 % 60.8 % 47.2 %
(a) (b)
Figure 4-28: Plan view (a) 6x6 in. with steel fiber (b) 6x6 in. with PE fiber
(a) (b)
Figure 4-29: Side view (a) 6x6 in. with steel fiber (b) 6x6 in. with PE fiber
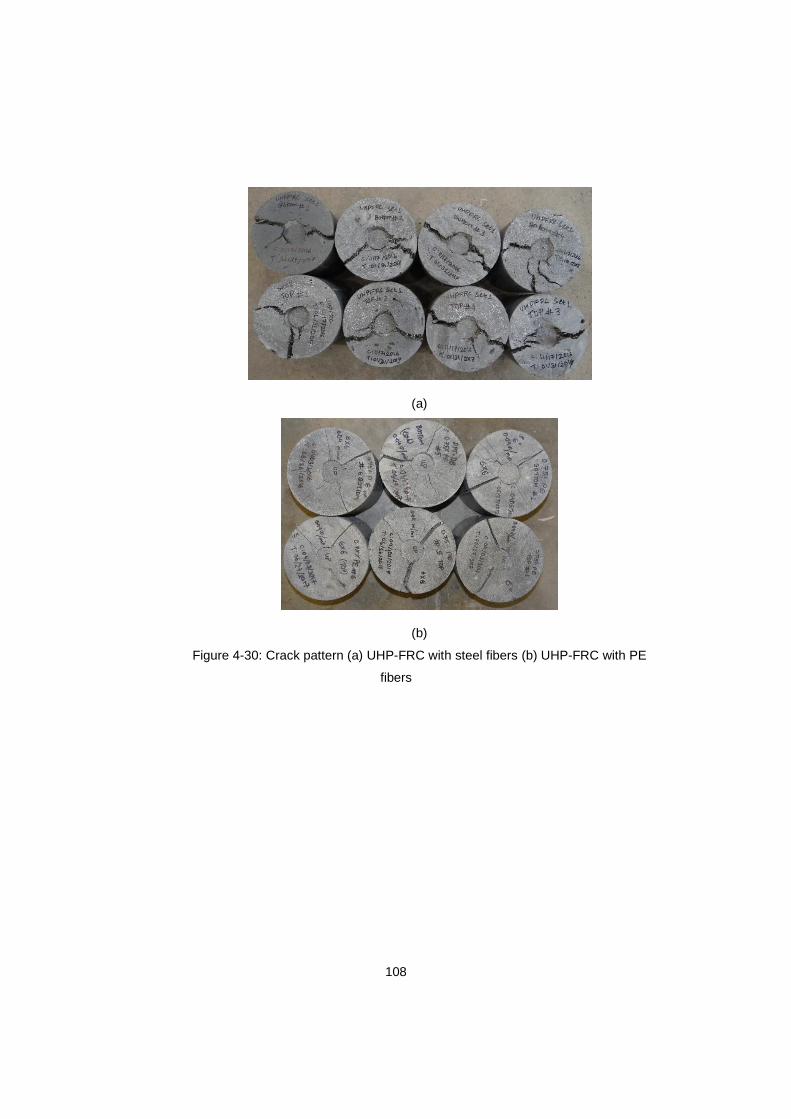
108
(a)
(b)
Figure 4-30: Crack pattern (a) UHP-FRC with steel fibers (b) UHP-FRC with PE
fibers

109
0 0.05 0.1 0.15 0.2 0.25 0.3 0.35 0.4Deformation (in.)
0
30
60
90
120Lo
ad (k
ips)
0 2 4 6 8 10Deformation (mm)
0
100
200
300
400
500
Load
(kN
)
UHP-FRC(Influence of fiber type)
Set 10Set 11Set 12Set 13
Figure 4-31 Load vs deformation for UHP-FRC with 3% Steel and 0.75% PE fiber and
6x6 specimen
0 0.01 0.02 0.03 0.04 0.05 0.06Circumferential Strain (in./in.)
0
300
600
900
1200
1500
Te
nsile
Str
ess
(psi
)
0 0.01 0.02 0.03 0.04 0.05 0.06Circumferential Strain (mm/mm)
0
2
4
6
8
10
Te
nsile
Str
ess
(MP
a)UHP-FRC
(Influence of fiber type)Set 10Set 11Set 12Set 13
Figure 4-32 Tensile stress vs circumferential strain for UHP-FRC with 3% Steel and
0.75% PE fiber and 6x6 specimen
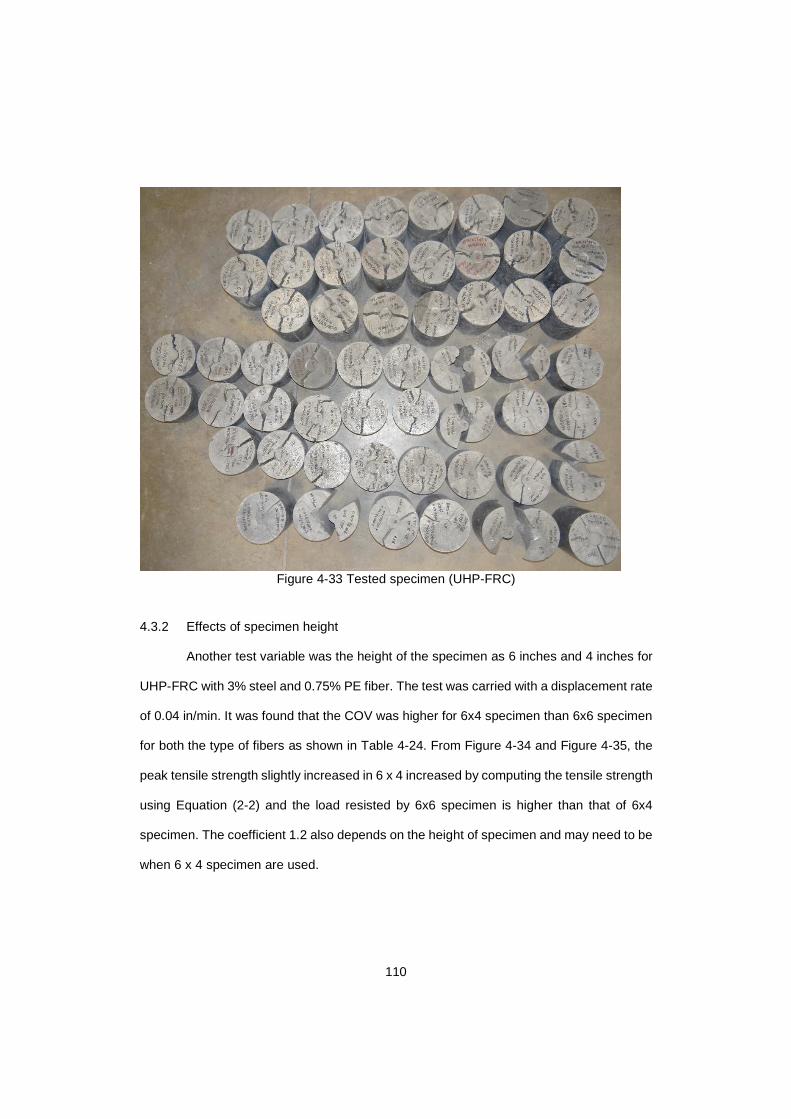
110
Figure 4-33 Tested specimen (UHP-FRC)
4.3.2 Effects of specimen height
Another test variable was the height of the specimen as 6 inches and 4 inches for
UHP-FRC with 3% steel and 0.75% PE fiber. The test was carried with a displacement rate
of 0.04 in/min. It was found that the COV was higher for 6x4 specimen than 6x6 specimen
for both the type of fibers as shown in Table 4-24. From Figure 4-34 and Figure 4-35, the
peak tensile strength slightly increased in 6 x 4 increased by computing the tensile strength
using Equation (2-2) and the load resisted by 6x6 specimen is higher than that of 6x4
specimen. The coefficient 1.2 also depends on the height of specimen and may need to be
when 6 x 4 specimen are used.
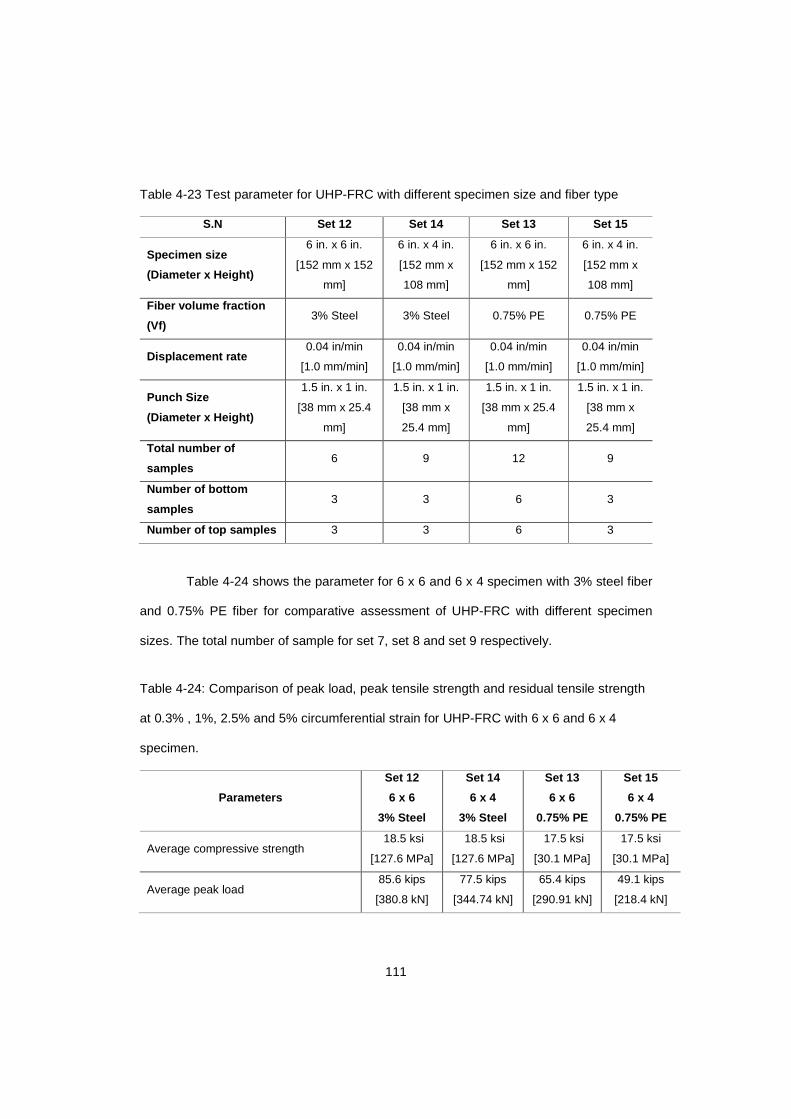
111
Table 4-23 Test parameter for UHP-FRC with different specimen size and fiber type
S.N Set 12 Set 14 Set 13 Set 15
Specimen size
(Diameter x Height)
6 in. x 6 in.
[152 mm x 152
mm]
6 in. x 4 in.
[152 mm x
108 mm]
6 in. x 6 in.
[152 mm x 152
mm]
6 in. x 4 in.
[152 mm x
108 mm]
Fiber volume fraction
(Vf) 3% Steel 3% Steel 0.75% PE 0.75% PE
Displacement rate 0.04 in/min
[1.0 mm/min]
0.04 in/min
[1.0 mm/min]
0.04 in/min
[1.0 mm/min]
0.04 in/min
[1.0 mm/min]
Punch Size
(Diameter x Height)
1.5 in. x 1 in.
[38 mm x 25.4
mm]
1.5 in. x 1 in.
[38 mm x
25.4 mm]
1.5 in. x 1 in.
[38 mm x 25.4
mm]
1.5 in. x 1 in.
[38 mm x
25.4 mm]
Total number of
samples 6 9 12 9
Number of bottom
samples 3 3 6 3
Number of top samples 3 3 6 3
Table 4-24 shows the parameter for 6 x 6 and 6 x 4 specimen with 3% steel fiber
and 0.75% PE fiber for comparative assessment of UHP-FRC with different specimen
sizes. The total number of sample for set 7, set 8 and set 9 respectively.
Table 4-24: Comparison of peak load, peak tensile strength and residual tensile strength
at 0.3% , 1%, 2.5% and 5% circumferential strain for UHP-FRC with 6 x 6 and 6 x 4
specimen.
Parameters
Set 12
6 x 6
3% Steel
Set 14
6 x 4
3% Steel
Set 13
6 x 6
0.75% PE
Set 15
6 x 4
0.75% PE
Average compressive strength 18.5 ksi
[127.6 MPa]
18.5 ksi
[127.6 MPa]
17.5 ksi
[30.1 MPa]
17.5 ksi
[30.1 MPa]
Average peak load 85.6 kips
[380.8 kN]
77.5 kips
[344.74 kN]
65.4 kips
[290.91 kN]
49.1 kips
[218.4 kN]
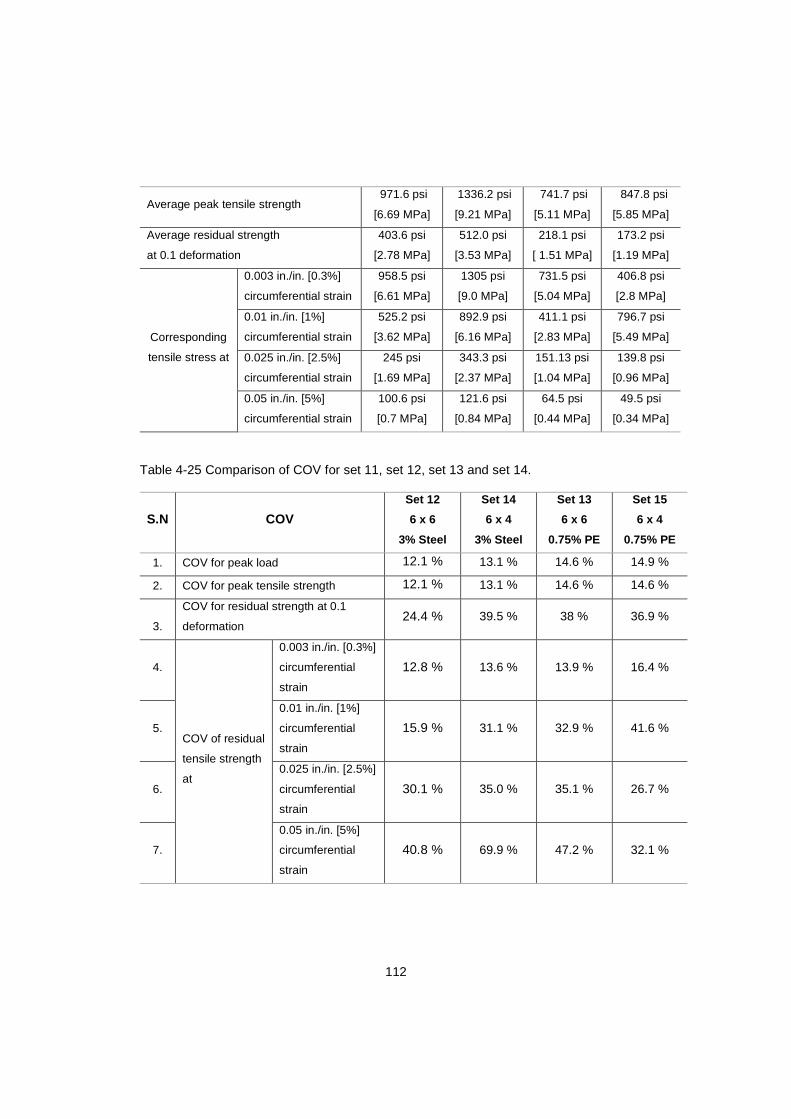
112
Average peak tensile strength 971.6 psi
[6.69 MPa]
1336.2 psi
[9.21 MPa]
741.7 psi
[5.11 MPa]
847.8 psi
[5.85 MPa]
Average residual strength
at 0.1 deformation
403.6 psi
[2.78 MPa]
512.0 psi
[3.53 MPa]
218.1 psi
[ 1.51 MPa]
173.2 psi
[1.19 MPa]
Corresponding
tensile stress at
0.003 in./in. [0.3%]
circumferential strain
958.5 psi
[6.61 MPa]
1305 psi
[9.0 MPa]
731.5 psi
[5.04 MPa]
406.8 psi
[2.8 MPa]
0.01 in./in. [1%]
circumferential strain
525.2 psi
[3.62 MPa]
892.9 psi
[6.16 MPa]
411.1 psi
[2.83 MPa]
796.7 psi
[5.49 MPa]
0.025 in./in. [2.5%]
circumferential strain
245 psi
[1.69 MPa]
343.3 psi
[2.37 MPa]
151.13 psi
[1.04 MPa]
139.8 psi
[0.96 MPa]
0.05 in./in. [5%]
circumferential strain
100.6 psi
[0.7 MPa]
121.6 psi
[0.84 MPa]
64.5 psi
[0.44 MPa]
49.5 psi
[0.34 MPa]
Table 4-25 Comparison of COV for set 11, set 12, set 13 and set 14.
S.N COV
Set 12
6 x 6
3% Steel
Set 14
6 x 4
3% Steel
Set 13
6 x 6
0.75% PE
Set 15
6 x 4
0.75% PE
1. COV for peak load 12.1 % 13.1 % 14.6 % 14.9 %
2. COV for peak tensile strength 12.1 % 13.1 % 14.6 % 14.6 %
3.
COV for residual strength at 0.1
deformation 24.4 % 39.5 % 38 % 36.9 %
4.
COV of residual
tensile strength
at
0.003 in./in. [0.3%]
circumferential
strain
12.8 % 13.6 % 13.9 % 16.4 %
5.
0.01 in./in. [1%]
circumferential
strain
15.9 % 31.1 % 32.9 % 41.6 %
6.
0.025 in./in. [2.5%]
circumferential
strain
30.1 % 35.0 % 35.1 % 26.7 %
7.
0.05 in./in. [5%]
circumferential
strain
40.8 % 69.9 % 47.2 % 32.1 %

113
0 0.05 0.1 0.15 0.2 0.25 0.3 0.35Deformation (in.)
0
30
60
90
120
Loa
d (k
ips)
0 2 4 6 8Deformation (mm)
0
100
200
300
400
500
Load
(kN
)
UHP-FRC(Influence of fiber type
and specimen size)6 x 6 (Steel) - Set 126 x 6 (PE) - Set 136 x 4 (Steel) - Set 146 x 6 (PE) - Set 15
Figure 4-34: Load vs deformation for UHP-FRC with 3% Steel and 0.75% PE fiber for 6x6
and 6x4 specimen
0 0.01 0.02 0.03 0.04 0.05 0.06Circumferential Strain (in./in.)
0
300
600
900
1200
1500
Ten
sile
Str
ess
(psi
)
0 0.01 0.02 0.03 0.04 0.05 0.06Circumferential Strain (mm/mm)
0
2
4
6
8
10
Te
nsile
Str
ess
(MP
a)UHP-FRC
(Influence of fiber type and specimen size)
6 x 6 (Steel) - Set 126 x 6 (PE) - Set 136 x 4 (Steel) - Set 146 x 6 (PE) - Set 15
Figure 4-35: Tensile stress vs circumferential strain for UHP-FRC with 3% Steel and
0.75% PE fiber for 6x6 and 6x4 specimen

114
(a) (b)
Figure 4-36: Plan view (a) 6 x 4 in. (UHP-FRC with steel fibers
(b) 6 x 4 in. (UHP-FRC with PE fibers)
Figure 4-37: Side view (a) 6 x 4 in. (UHP-FRC with steel fibers
(b) 6 x 4 in. (UHP-FRC with PE fibers)
4.3.3 Determination of relation between deformation and circumferential strain
UHP-FRC shows the crack opening or total crack opening displacement (TCOD)
even in the ascending part of the load and deformation curve in the slower rate and the
first cracking starts even before the peak load (or peak tensile strength). The total crack
opening displacement (TCOD) becomes more noticeable and increases at a faster rate
after the peak load as shown in Figure 4-38 and Figure 4-39.
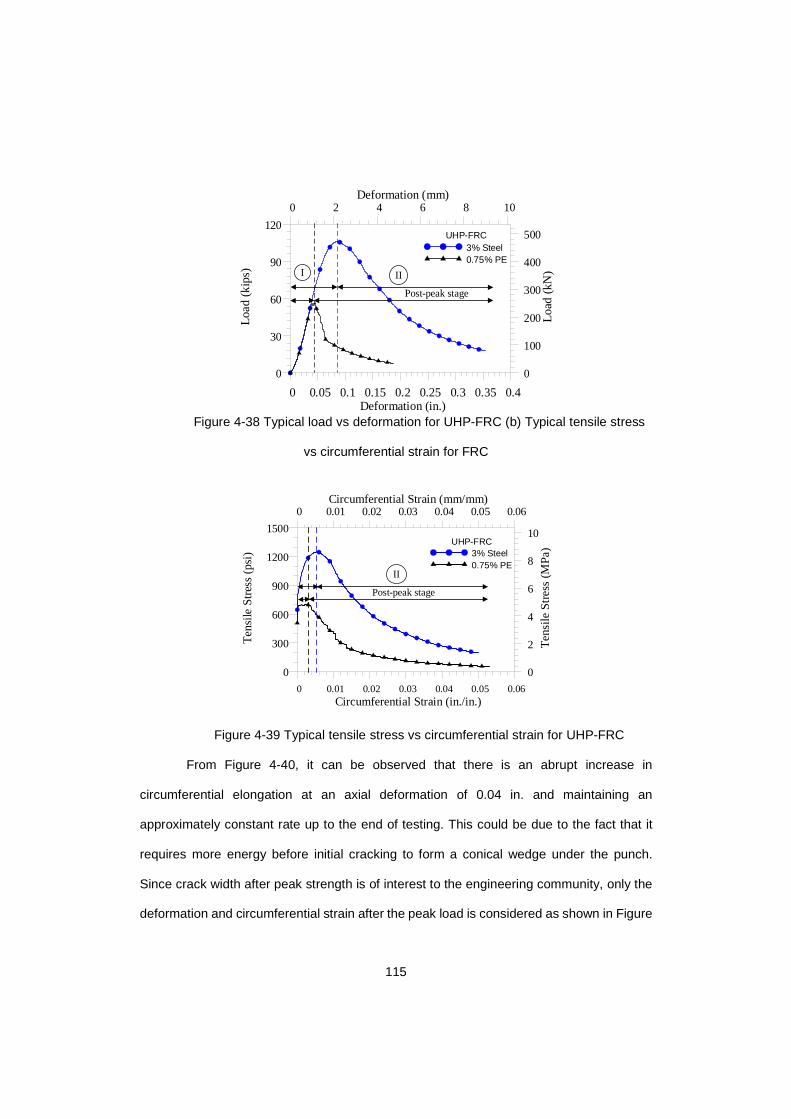
115
0 0.05 0.1 0.15 0.2 0.25 0.3 0.35 0.4Deformation (in.)
0
30
60
90
120
Loa
d (k
ips)
0 2 4 6 8 10Deformation (mm)
0
100
200
300
400
500
Load
(kN
)
UHP-FRC 3% Steel0.75% PE
II
Post-peak stage
I
Figure 4-38 Typical load vs deformation for UHP-FRC (b) Typical tensile stress
vs circumferential strain for FRC
0 0.01 0.02 0.03 0.04 0.05 0.06Circumferential Strain (in./in.)
0
300
600
900
1200
1500
Te
nsile
Str
ess
(psi
)
0 0.01 0.02 0.03 0.04 0.05 0.06Circumferential Strain (mm/mm)
0
2
4
6
8
10T
ens
ile S
tre
ss (M
Pa
)UHP-FRC3% Steel0.75% PE
II
Post-peak stage
Figure 4-39 Typical tensile stress vs circumferential strain for UHP-FRC
From Figure 4-40, it can be observed that there is an abrupt increase in
circumferential elongation at an axial deformation of 0.04 in. and maintaining an
approximately constant rate up to the end of testing. This could be due to the fact that it
requires more energy before initial cracking to form a conical wedge under the punch.
Since crack width after peak strength is of interest to the engineering community, only the
deformation and circumferential strain after the peak load is considered as shown in Figure
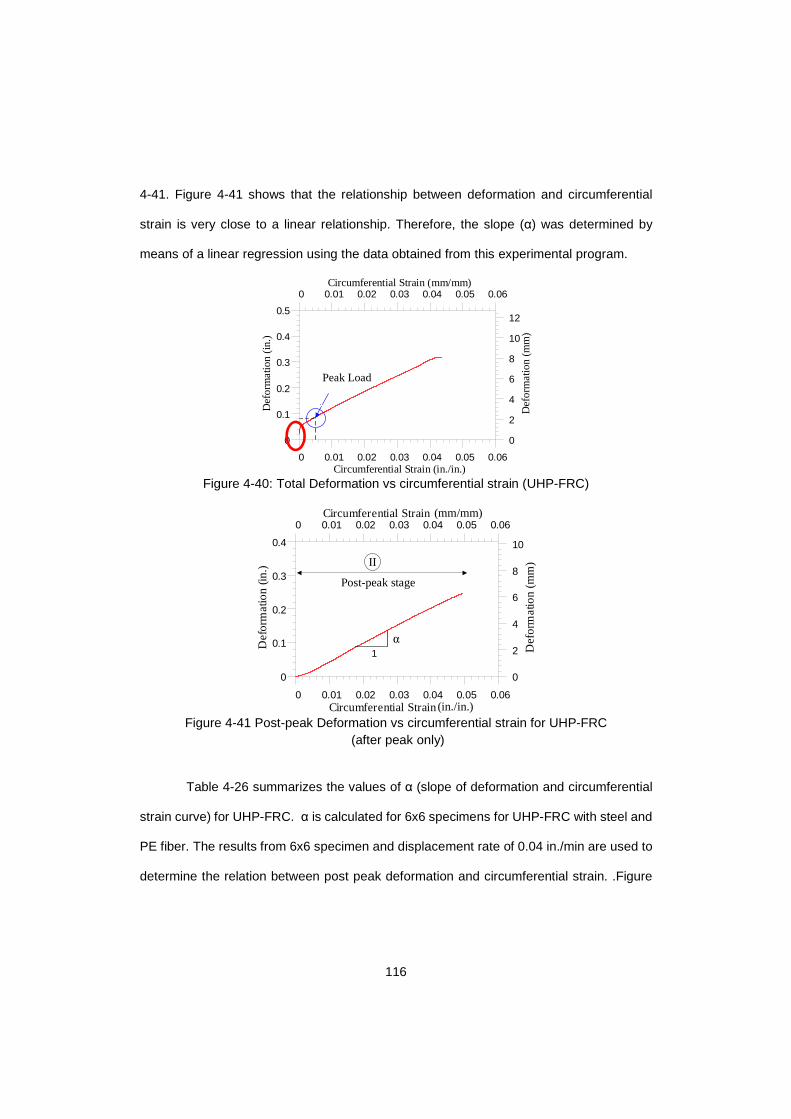
116
4-41. Figure 4-41 shows that the relationship between deformation and circumferential
strain is very close to a linear relationship. Therefore, the slope (α) was determined by
means of a linear regression using the data obtained from this experimental program.
0 0.01 0.02 0.03 0.04 0.05 0.06Circumferential Strain (in./in.)
0
0.1
0.2
0.3
0.4
0.5
Def
orm
atio
n (i
n.)
0 0.01 0.02 0.03 0.04 0.05 0.06Circumferential Strain (mm/mm)
0
2
4
6
8
10
12
Def
orm
atio
n (m
m)
Peak Load
Figure 4-40: Total Deformation vs circumferential strain (UHP-FRC)
0 0.01 0.02 0.03 0.04 0.05 0.06
0
0.1
0.2
0.3
0.4
0 0.01 0.02 0.03 0.04 0.05 0.06
0
2
4
6
8
10
Circumferential Strain (mm/mm)D
efo
rma
tion
(mm
)
Circumferential Strain(in./in.)
De
form
atio
n (i
n.) II
Post-peak stage
1α
Figure 4-41 Post-peak Deformation vs circumferential strain for UHP-FRC
(after peak only)
Table 4-26 summarizes the values of α (slope of deformation and circumferential
strain curve) for UHP-FRC. α is calculated for 6x6 specimens for UHP-FRC with steel and
PE fiber. The results from 6x6 specimen and displacement rate of 0.04 in./min are used to
determine the relation between post peak deformation and circumferential strain. .Figure
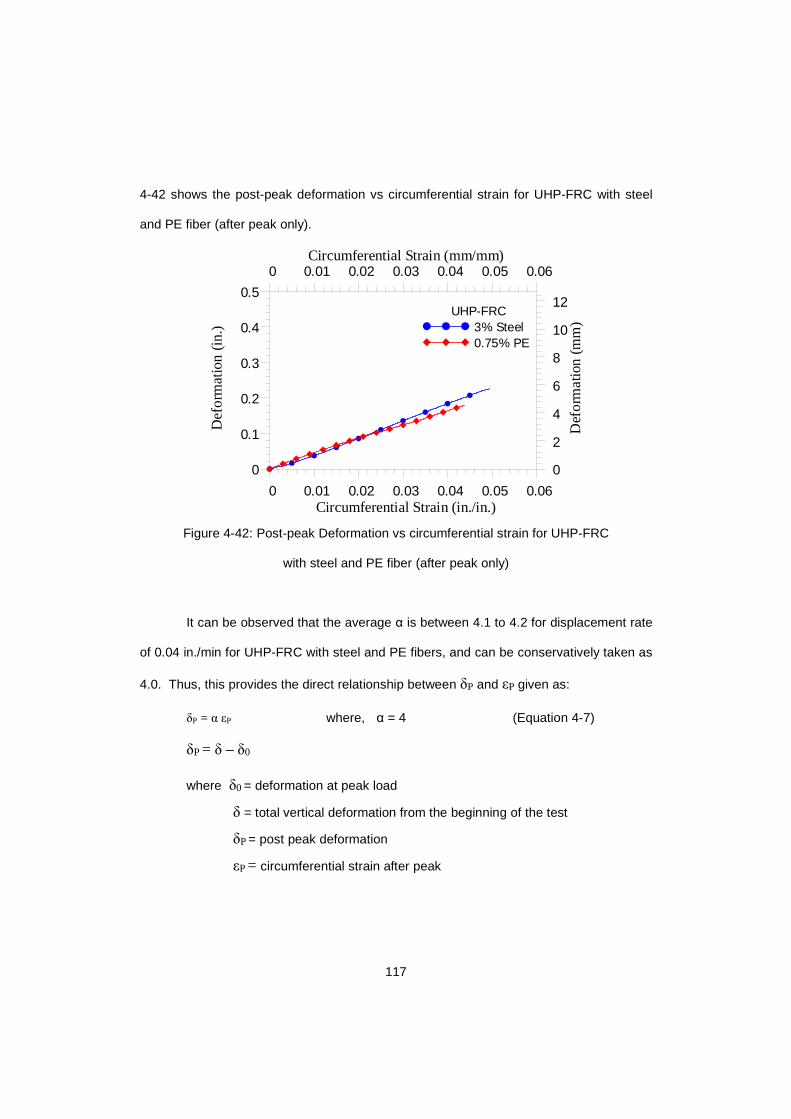
117
4-42 shows the post-peak deformation vs circumferential strain for UHP-FRC with steel
and PE fiber (after peak only).
0 0.01 0.02 0.03 0.04 0.05 0.06Circumferential Strain (in./in.)
0
0.1
0.2
0.3
0.4
0.5
Def
orm
atio
n (i
n.)
0 0.01 0.02 0.03 0.04 0.05 0.06Circumferential Strain (mm/mm)
0
2
4
6
8
10
12
Def
orm
atio
n (m
m)UHP-FRC
3% Steel 0.75% PE
Figure 4-42: Post-peak Deformation vs circumferential strain for UHP-FRC
with steel and PE fiber (after peak only)
It can be observed that the average α is between 4.1 to 4.2 for displacement rate
of 0.04 in./min for UHP-FRC with steel and PE fibers, and can be conservatively taken as
4.0. Thus, this provides the direct relationship between δP and εP given as:
δP = α εP where, α = 4 (Equation 4-7)
δP = δ – δ0
where δ0 = deformation at peak load
δ = total vertical deformation from the beginning of the test
δP = post peak deformation
εP = circumferential strain after peak
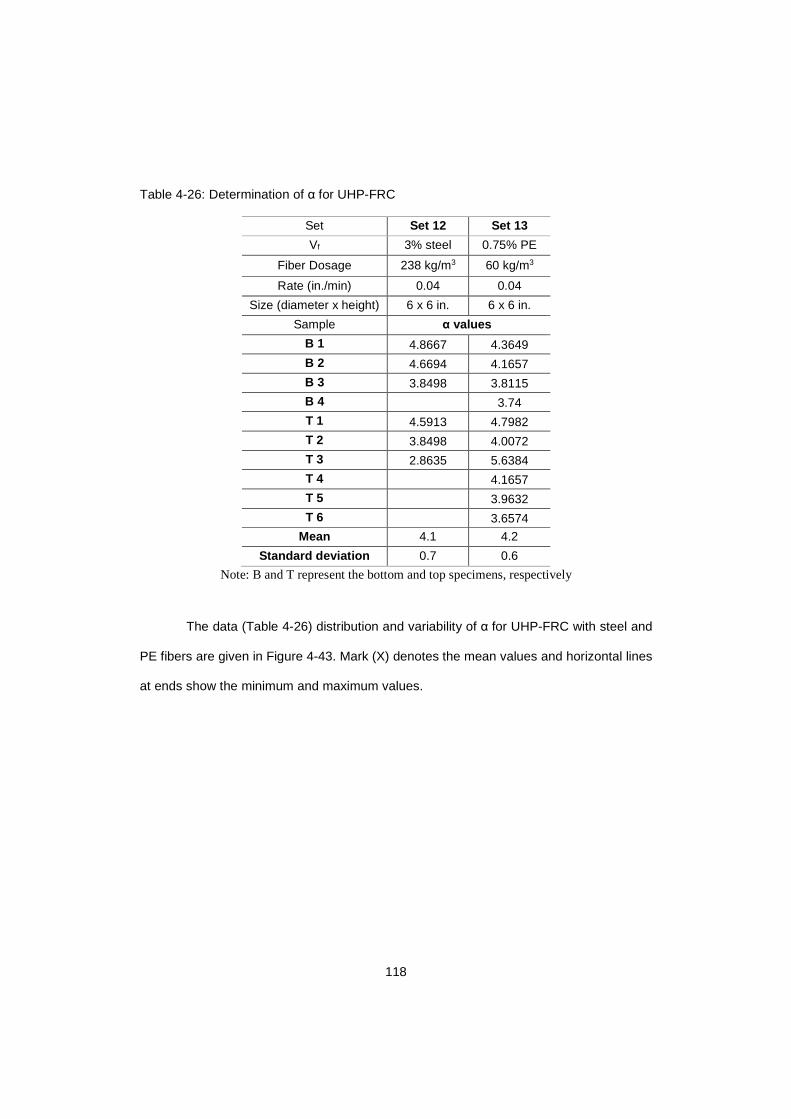
118
Table 4-26: Determination of α for UHP-FRC
Set Set 12 Set 13
Vf 3% steel 0.75% PE
Fiber Dosage 238 kg/m3 60 kg/m3
Rate (in./min) 0.04 0.04
Size (diameter x height) 6 x 6 in. 6 x 6 in.
Sample α values
B 1 4.8667 4.3649
B 2 4.6694 4.1657
B 3 3.8498 3.8115
B 4 3.74
T 1 4.5913 4.7982
T 2 3.8498 4.0072
T 3 2.8635 5.6384
T 4 4.1657
T 5 3.9632
T 6 3.6574
Mean 4.1 4.2
Standard deviation 0.7 0.6
Note: B and T represent the bottom and top specimens, respectively
The data (Table 4-26) distribution and variability of α for UHP-FRC with steel and
PE fibers are given in Figure 4-43. Mark (X) denotes the mean values and horizontal lines
at ends show the minimum and maximum values.
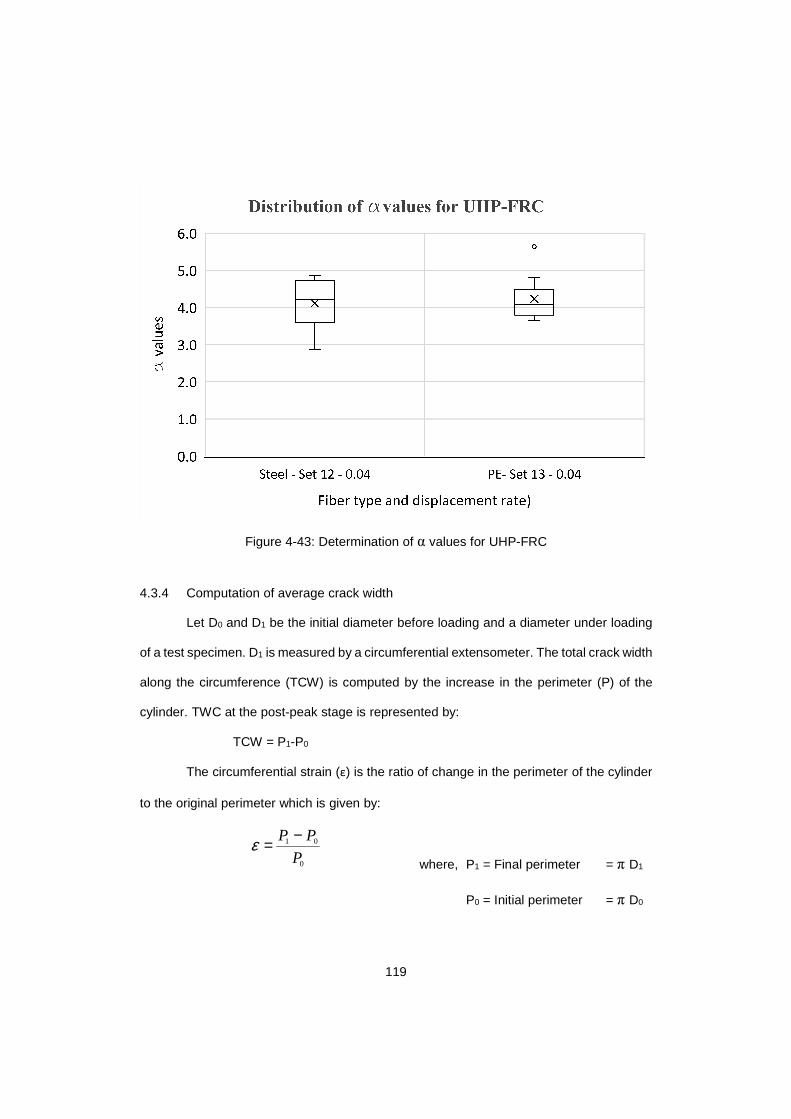
119
Figure 4-43: Determination of α values for UHP-FRC
4.3.4 Computation of average crack width
Let D0 and D1 be the initial diameter before loading and a diameter under loading
of a test specimen. D1 is measured by a circumferential extensometer. The total crack width
along the circumference (TCW) is computed by the increase in the perimeter (P) of the
cylinder. TWC at the post-peak stage is represented by:
TCW = P1-P0
The circumferential strain (ε) is the ratio of change in the perimeter of the cylinder
to the original perimeter which is given by:
1 0
0
P P
Pε −=
where, P1 = Final perimeter = π D1
P0 = Initial perimeter = π D0
120
1 0(1 )P P ε= +
Since there is no circumferential strain measured before peak for FRC, the initial
perimeter (π D0) is equivalent to the perimeter at the peak and εP (circumferential strain at
peak) is also the same as ε. The cracks are developed radially from the center to the
circumference so average crack width (CW) in a specimen can be determined by dividing
the total crack width by the number of cracks (N).
1 0 0 0 PP P P DCW
N N N
ε π ε− ×= = =
Use Eq. (4-1): δP = α εP,
0 PDCW
N
π δα
×= (Equation 4-8)
The number of cracks is determined by visual inspection after the test. N is 2 for
UHP-FRC with steel fiber (6x6) and in the range of 4 to 9 for UHP-FRC with PE fiber (6x6)
From this research, it was observed that the most common number of cracks is 2 for UHP-
FRC with steel fiber and 5 for UHP-FRC with PE fiber as about 35% of the specimen has
five number of cracks. Only cracks that started radially from the center and propagated at
least up to the mid-height of the specimen were considered. The very small minor cracks
are considered having less effect on the residual stress.

121
Table 4-27: Percentage of samples with respective crack number
(UHP-FRC with steel and PE fiber)
Fiber type No of cracks
No. of samples
Percentage (%)
UHP-FRC (Steel) 2 12 100
UHP-FRC (PE)
4 2 16.7
5 4 33.3
6 2 16.7
7 1 8.3
8 2 16.7
9 1 8.3
Total samples 12
For DPT using 6x12 in. cylinders the average crack width (CW) is determined by
substituting D0 = 6 in., N = 2 (for steel fiber) and 5 (for PE fiber) and α = 4 in
0 PDCW
N
π δα
×= (Equation 4-2)
UHP-FRC with steel and PE fibers:
6 4.72
4P PCW
N N
π δ δ= × = (Equation 4-9)
4.3.5 Verification from measured maximum crack width
While Equation 4-9 can be used to obtain a reasonable average crack width at
certain deformation, estimation of the maximum crack width can be also important.
However, the maximum crack with does not have a linear relation with the axial
deformation. Table 4-28 shows the maximum measured crack widths at various
deformations for a sample in each batch. However, the number of cracks is counted at the
end of the experiment as it is difficult to count crack number while the testing is in progress.
The measured maximum crack widths during and at the end of tests were compared with
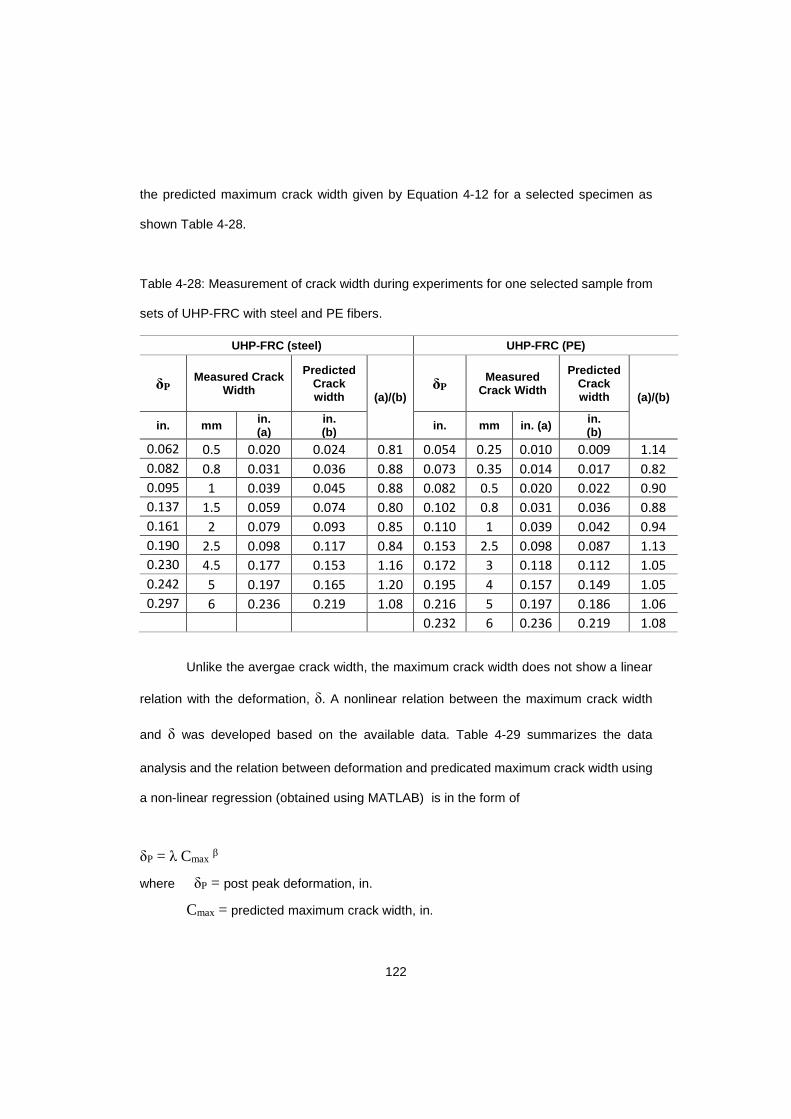
122
the predicted maximum crack width given by Equation 4-12 for a selected specimen as
shown Table 4-28.
Table 4-28: Measurement of crack width during experiments for one selected sample from
sets of UHP-FRC with steel and PE fibers.
UHP-FRC (steel) UHP-FRC (PE)
δP Measured Crack
Width
Predicted Crack width (a)/(b)
δP Measured
Crack Width
Predicted Crack width (a)/(b)
in. mm in. (a)
in. (b) in. mm in. (a) in.
(b) 0.062 0.5 0.020 0.024 0.81 0.054 0.25 0.010 0.009 1.14
0.082 0.8 0.031 0.036 0.88 0.073 0.35 0.014 0.017 0.82
0.095 1 0.039 0.045 0.88 0.082 0.5 0.020 0.022 0.90
0.137 1.5 0.059 0.074 0.80 0.102 0.8 0.031 0.036 0.88
0.161 2 0.079 0.093 0.85 0.110 1 0.039 0.042 0.94
0.190 2.5 0.098 0.117 0.84 0.153 2.5 0.098 0.087 1.13
0.230 4.5 0.177 0.153 1.16 0.172 3 0.118 0.112 1.05
0.242 5 0.197 0.165 1.20 0.195 4 0.157 0.149 1.05
0.297 6 0.236 0.219 1.08 0.216 5 0.197 0.186 1.06
0.232 6 0.236 0.219 1.08
Unlike the avergae crack width, the maximum crack width does not show a linear
relation with the deformation, δ. A nonlinear relation between the maximum crack width
and δ was developed based on the available data. Table 4-29 summarizes the data
analysis and the relation between deformation and predicated maximum crack width using
a non-linear regression (obtained using MATLAB) is in the form of
δP = λ Cmax β
where δP = post peak deformation, in.
Cmax = predicted maximum crack width, in.
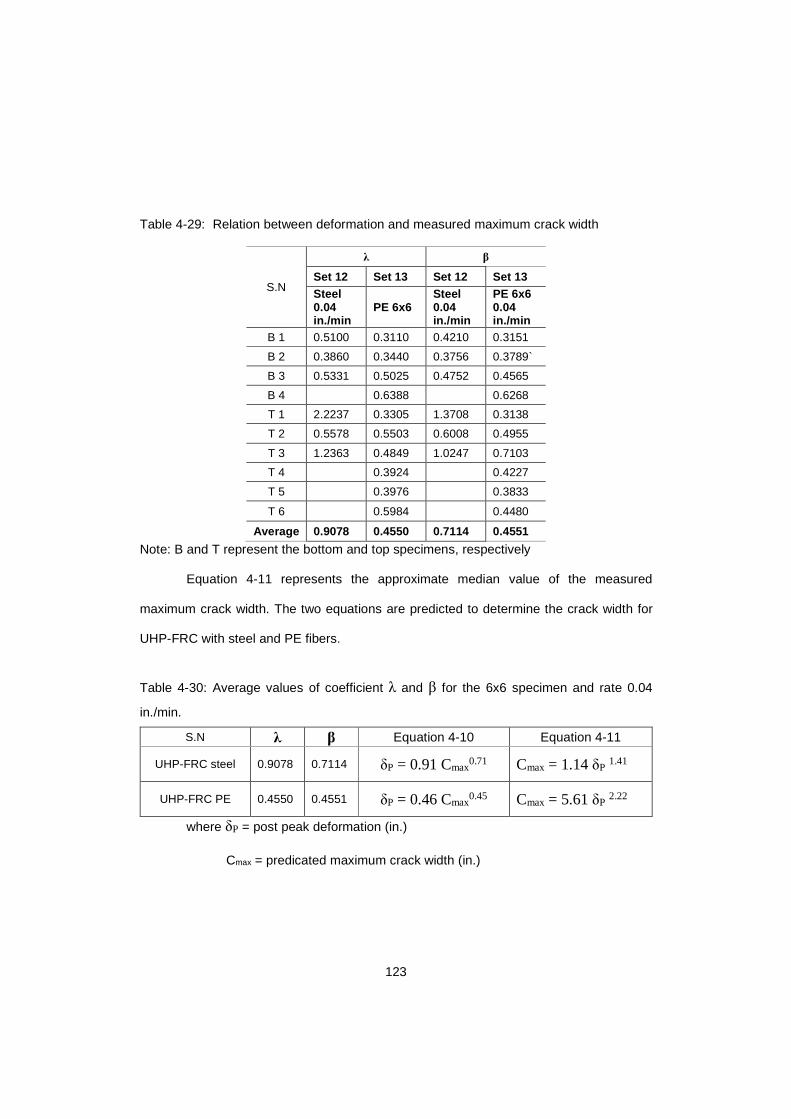
123
Table 4-29: Relation between deformation and measured maximum crack width
S.N
λ β
Set 12 Set 13 Set 12 Set 13 Steel 0.04 in./min
PE 6x6 Steel 0.04 in./min
PE 6x6 0.04 in./min
B 1 0.5100 0.3110 0.4210 0.3151
B 2 0.3860 0.3440 0.3756 0.3789`
B 3 0.5331 0.5025 0.4752 0.4565
B 4 0.6388 0.6268
T 1 2.2237 0.3305 1.3708 0.3138
T 2 0.5578 0.5503 0.6008 0.4955
T 3 1.2363 0.4849 1.0247 0.7103
T 4 0.3924 0.4227
T 5 0.3976 0.3833
T 6 0.5984 0.4480
Average 0.9078 0.4550 0.7114 0.4551
Note: B and T represent the bottom and top specimens, respectively
Equation 4-11 represents the approximate median value of the measured
maximum crack width. The two equations are predicted to determine the crack width for
UHP-FRC with steel and PE fibers.
Table 4-30: Average values of coefficient λ and β for the 6x6 specimen and rate 0.04
in./min.
S.N λ β Equation 4-10 Equation 4-11
UHP-FRC steel 0.9078 0.7114 δP = 0.91 Cmax0.71 Cmax = 1.14 δP 1.41
UHP-FRC PE 0.4550 0.4551 δP = 0.46 Cmax0.45 Cmax = 5.61 δP 2.22
where δP = post peak deformation (in.)
Cmax = predicated maximum crack width (in.)
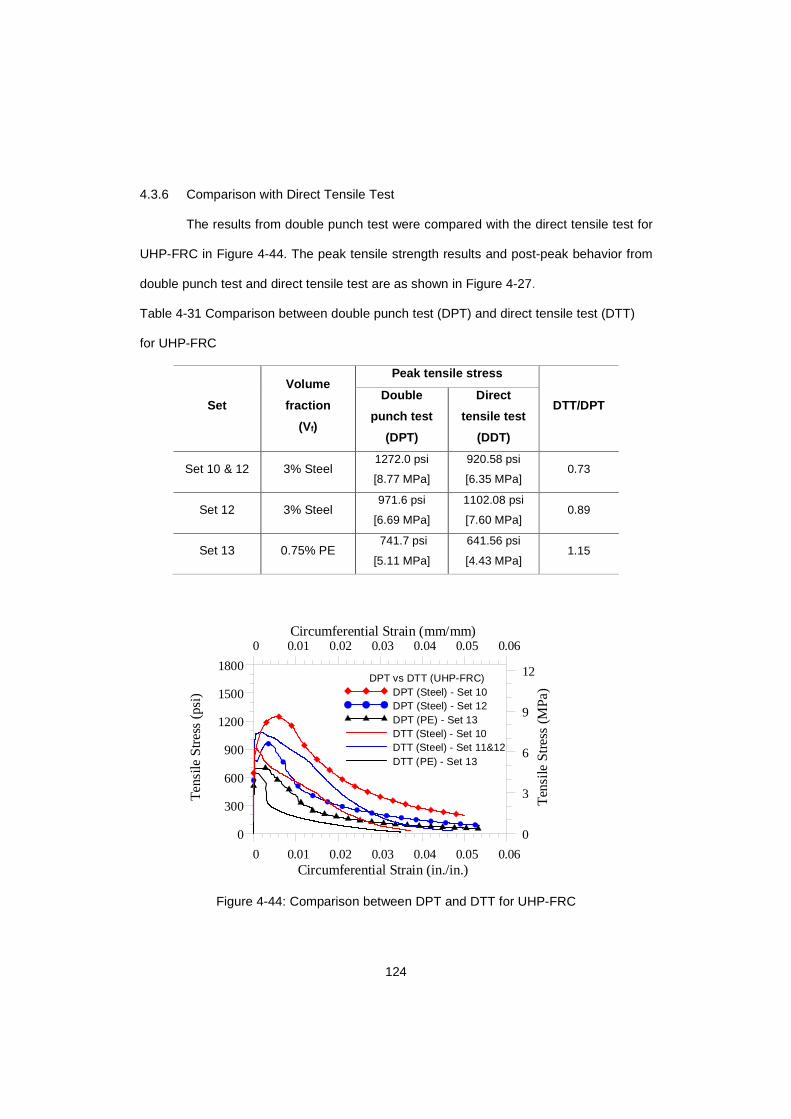
124
4.3.6 Comparison with Direct Tensile Test
The results from double punch test were compared with the direct tensile test for
UHP-FRC in Figure 4-44. The peak tensile strength results and post-peak behavior from
double punch test and direct tensile test are as shown in Figure 4-27.
Table 4-31 Comparison between double punch test (DPT) and direct tensile test (DTT)
for UHP-FRC
Set
Volume
fraction
(Vf)
Peak tensile stress
DTT/DPT Double
punch test
(DPT)
Direct
tensile test
(DDT)
Set 10 & 12 3% Steel 1272.0 psi
[8.77 MPa]
920.58 psi
[6.35 MPa] 0.73
Set 12 3% Steel 971.6 psi
[6.69 MPa]
1102.08 psi
[7.60 MPa] 0.89
Set 13 0.75% PE 741.7 psi
[5.11 MPa]
641.56 psi
[4.43 MPa] 1.15
0 0.01 0.02 0.03 0.04 0.05 0.06Circumferential Strain (in./in.)
0
300
600
900
1200
1500
1800
Te
nsile
Str
ess
(psi
)
0 0.01 0.02 0.03 0.04 0.05 0.06Circumferential Strain (mm/mm)
0
3
6
9
12
Ten
sile
Str
ess
(MP
a)DPT vs DTT (UHP-FRC)
DPT (Steel) - Set 10 DPT (Steel) - Set 12DPT (PE) - Set 13DTT (Steel) - Set 10DTT (Steel) - Set 11&12DTT (PE) - Set 13
Figure 4-44: Comparison between DPT and DTT for UHP-FRC
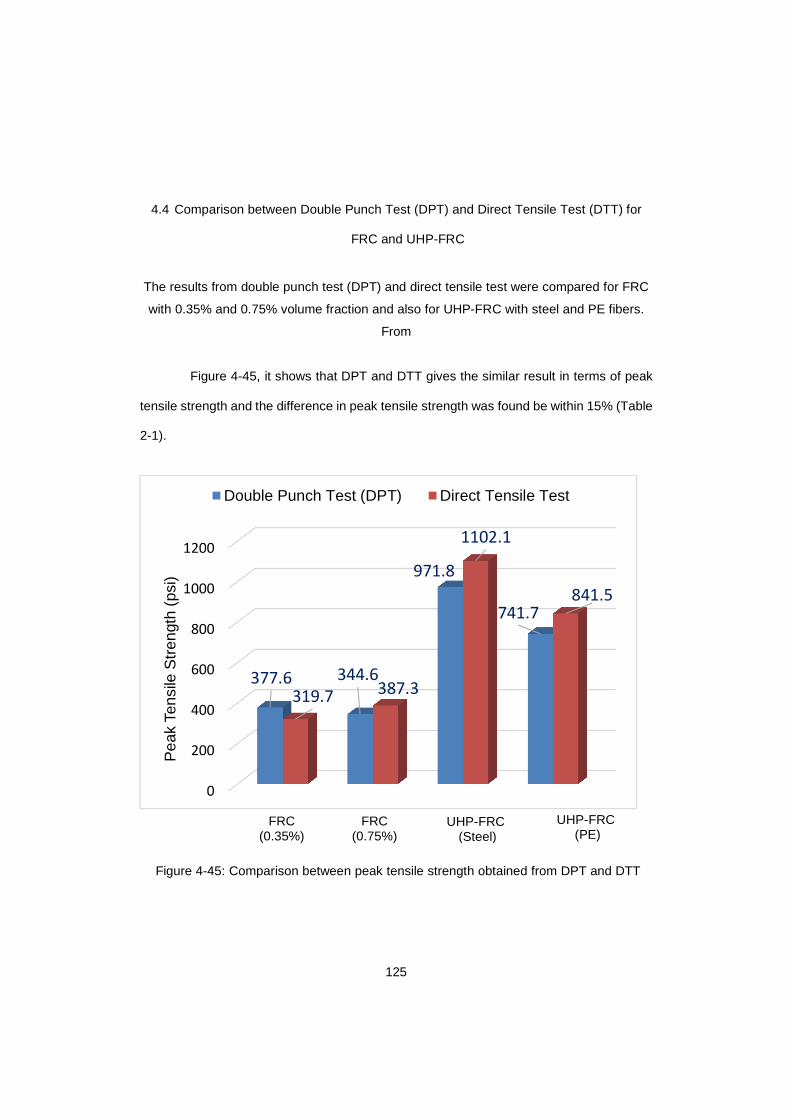
125
4.4 Comparison between Double Punch Test (DPT) and Direct Tensile Test (DTT) for
FRC and UHP-FRC
The results from double punch test (DPT) and direct tensile test were compared for FRC
with 0.35% and 0.75% volume fraction and also for UHP-FRC with steel and PE fibers.
From
Figure 4-45, it shows that DPT and DTT gives the similar result in terms of peak
tensile strength and the difference in peak tensile strength was found be within 15% (Table
2-1).
Figure 4-45: Comparison between peak tensile strength obtained from DPT and DTT
0
200
400
600
800
1000
1200
377.6 344.6
971.8
741.7
319.7387.3
1102.1
841.5
Pea
k Te
nsile
Str
engt
h (p
si)
Double Punch Test (DPT) Direct Tensile Test
FRC (0.35%)
UHP-FRC (PE)
UHP-FRC (Steel)
FRC (0.75%)
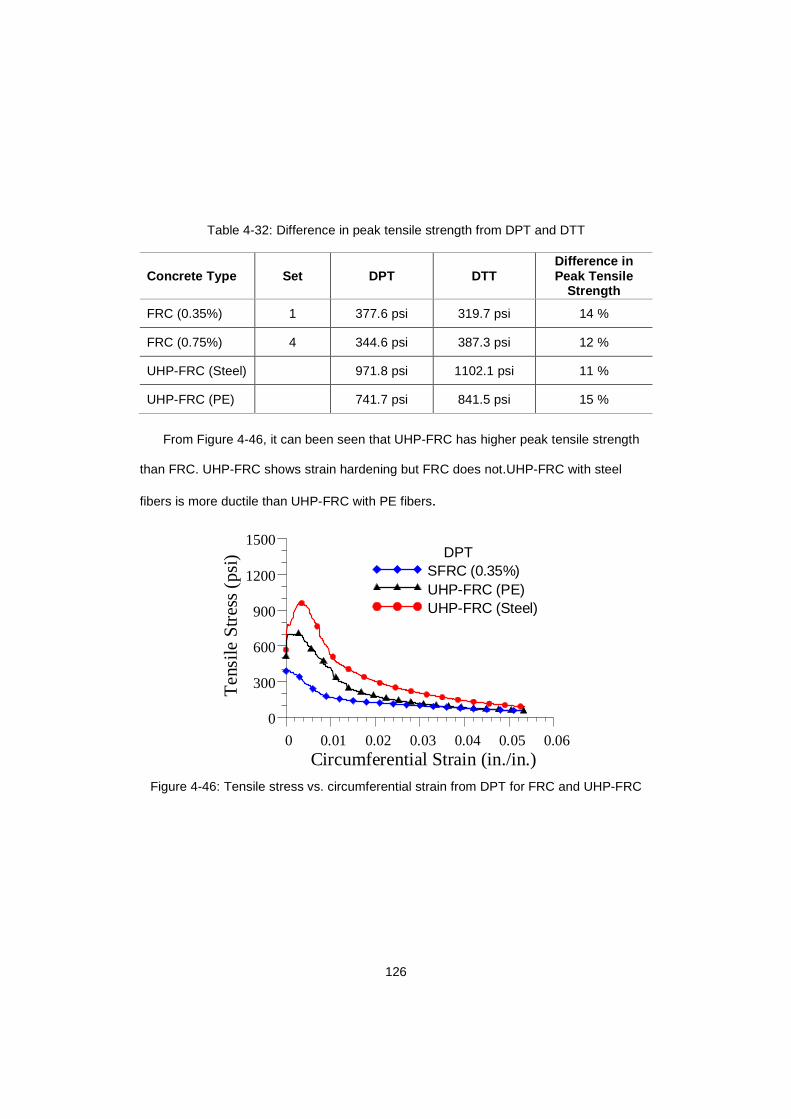
126
Table 4-32: Difference in peak tensile strength from DPT and DTT
Concrete Type Set DPT DTT Difference in Peak Tensile
Strength
FRC (0.35%) 1 377.6 psi 319.7 psi 14 %
FRC (0.75%) 4 344.6 psi 387.3 psi 12 %
UHP-FRC (Steel) 971.8 psi 1102.1 psi 11 %
UHP-FRC (PE) 741.7 psi 841.5 psi 15 %
From Figure 4-46, it can been seen that UHP-FRC has higher peak tensile strength
than FRC. UHP-FRC shows strain hardening but FRC does not.UHP-FRC with steel
fibers is more ductile than UHP-FRC with PE fibers.
Figure 4-46: Tensile stress vs. circumferential strain from DPT for FRC and UHP-FRC
0 0.01 0.02 0.03 0.04 0.05 0.06Circumferential Strain (in./in.)
0
300
600
900
1200
1500
Te
nsile
Str
ess
(psi
)
DPTSFRC (0.35%)UHP-FRC (PE)UHP-FRC (Steel)
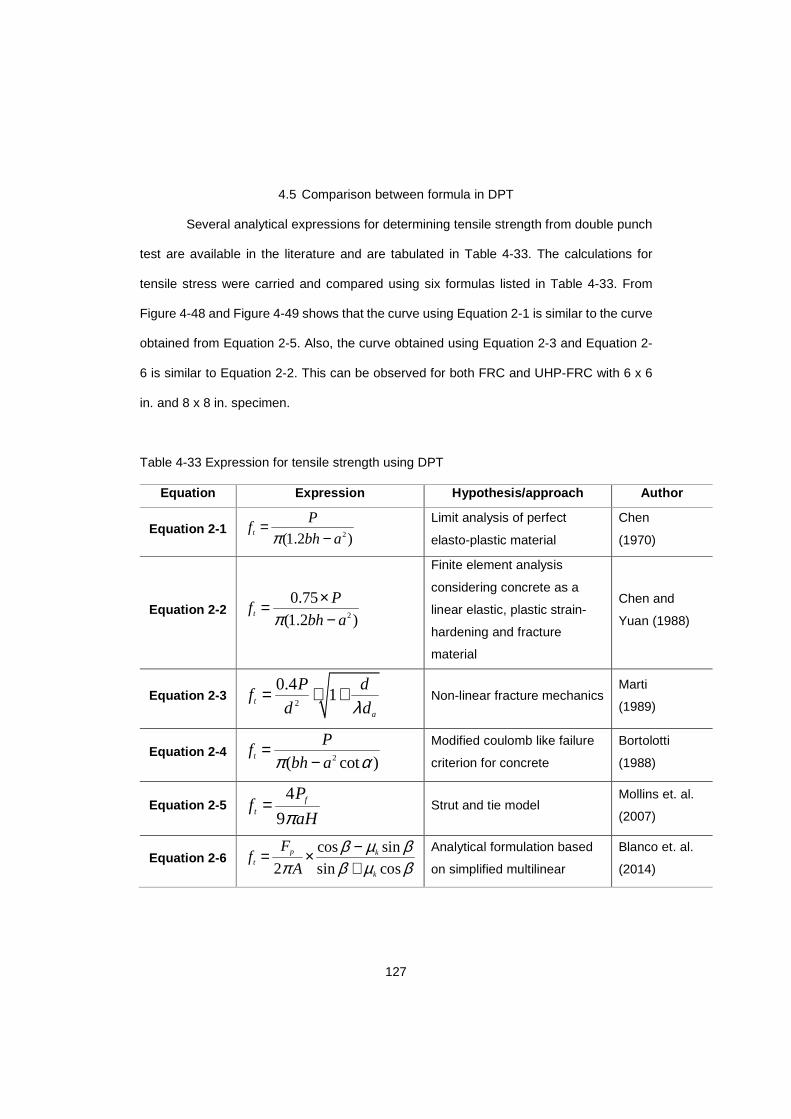
127
4.5 Comparison between formula in DPT
Several analytical expressions for determining tensile strength from double punch
test are available in the literature and are tabulated in Table 4-33. The calculations for
tensile stress were carried and compared using six formulas listed in Table 4-33. From
Figure 4-48 and Figure 4-49 shows that the curve using Equation 2-1 is similar to the curve
obtained from Equation 2-5. Also, the curve obtained using Equation 2-3 and Equation 2-
6 is similar to Equation 2-2. This can be observed for both FRC and UHP-FRC with 6 x 6
in. and 8 x 8 in. specimen.
Table 4-33 Expression for tensile strength using DPT
Equation Expression Hypothesis/approach Author
Equation 2-1 2(1.2 )t
Pf
bh aπ=
− Limit analysis of perfect
elasto-plastic material
Chen
(1970)
Equation 2-2 2
0.75
(1.2 )t
Pf
bh aπ×=−
Finite element analysis
considering concrete as a
linear elastic, plastic strain-
hardening and fracture
material
Chen and
Yuan (1988)
Equation 2-3 2
0.41t
a
P df
d dλ= ⋅ + Non-linear fracture mechanics
Marti
(1989)
Equation 2-4 2( cot )t
Pf
bh aπ α=
−
Modified coulomb like failure
criterion for concrete
Bortolotti
(1988)
Equation 2-5 4
9f
t
Pf
aHπ= Strut and tie model
Mollins et. al.
(2007)
Equation 2-6 cos sin
2 sin cosp k
t
k
Ff
A
β µ βπ β µ β
−= ×+
Analytical formulation based
on simplified multilinear
Blanco et. al.
(2014)
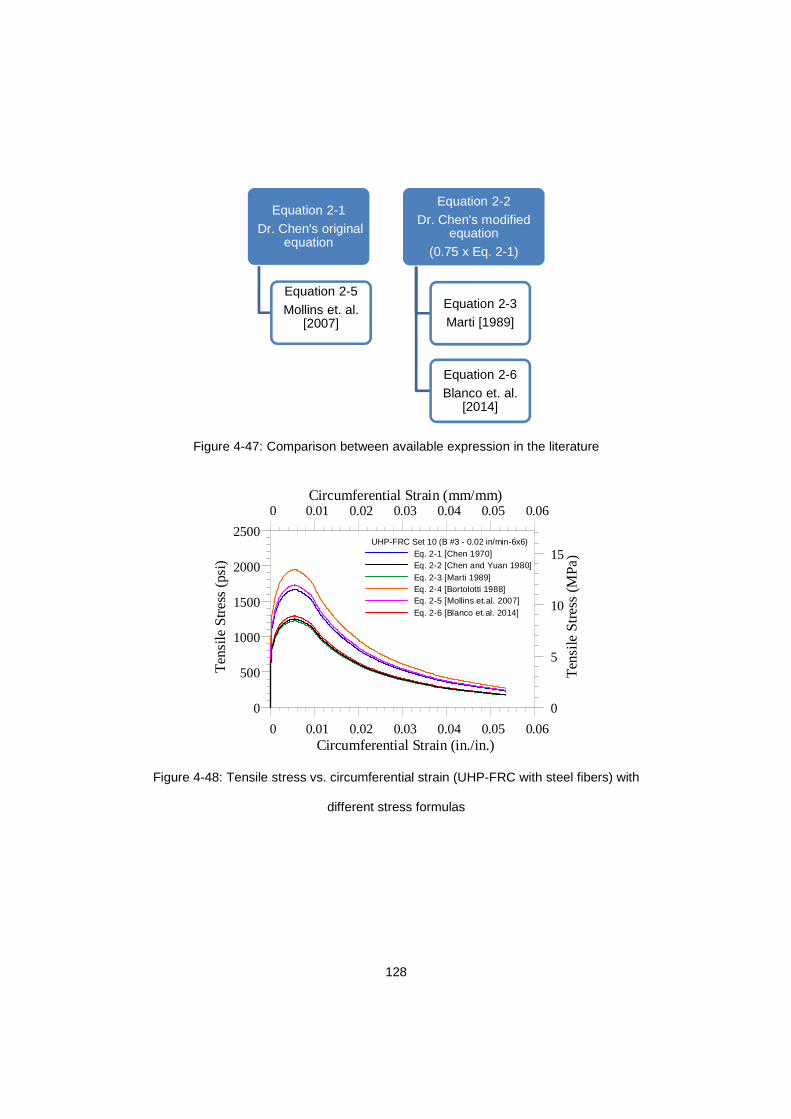
128
Figure 4-47: Comparison between available expression in the literature
0 0.01 0.02 0.03 0.04 0.05 0.06Circumferential Strain (in./in.)
0
500
1000
1500
2000
2500
Ten
sile
Str
ess
(psi
)
0 0.01 0.02 0.03 0.04 0.05 0.06Circumferential Strain (mm/mm)
0
5
10
15T
ensi
le S
tres
s (M
Pa
)UHP-FRC Set 10 (B #3 - 0.02 in/min-6x6)Eq. 2-1 [Chen 1970]Eq. 2-2 [Chen and Yuan 1980]Eq. 2-3 [Marti 1989]Eq. 2-4 [Bortolotti 1988]Eq. 2-5 [Mollins et.al. 2007]Eq. 2-6 [Blanco et.al. 2014]
Figure 4-48: Tensile stress vs. circumferential strain (UHP-FRC with steel fibers) with
different stress formulas
Equation 2-1Dr. Chen's original
equation
Equation 2-5 Mollins et. al.
[2007]
Equation 2-2Dr. Chen's modified
equation (0.75 x Eq. 2-1)
Equation 2-3Marti [1989]
Equation 2-6 Blanco et. al.
[2014]
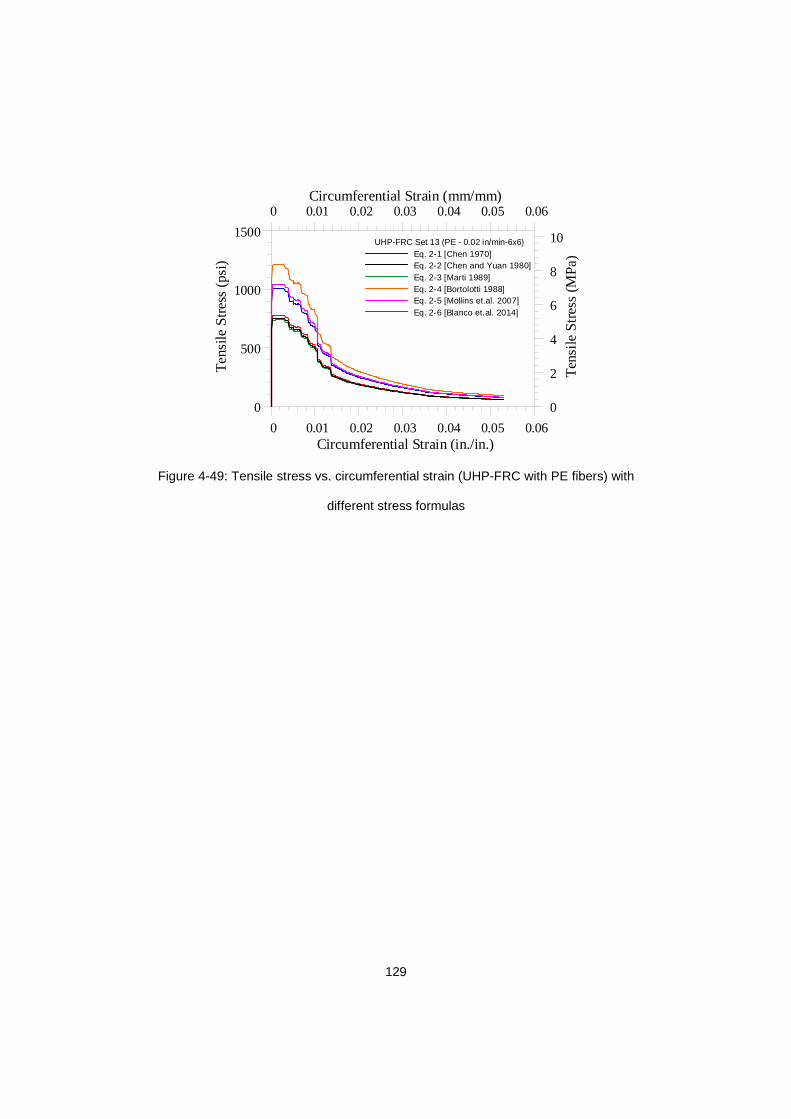
129
0 0.01 0.02 0.03 0.04 0.05 0.06Circumferential Strain (in./in.)
0
500
1000
1500T
ens
ile S
tre
ss(p
si)
0 0.01 0.02 0.03 0.04 0.05 0.06Circumferential Strain (mm/mm)
0
2
4
6
8
10
Ten
sile
Str
ess
(MP
a)UHP-FRC Set 13 (PE - 0.02 in/min-6x6)
Eq. 2-1 [Chen 1970]Eq. 2-2 [Chen and Yuan 1980]Eq. 2-3 [Marti 1989]Eq. 2-4 [Bortolotti 1988]Eq. 2-5 [Mollins et.al. 2007]Eq. 2-6 [Blanco et.al. 2014]
Figure 4-49: Tensile stress vs. circumferential strain (UHP-FRC with PE fibers) with
different stress formulas
130
Chapter 5
Summary and conclusion
The Double Punch Test is an alternative test method for evaluating the
performance of FRC and UHP-FRC. The DPT test can be carried by cutting the 6x12
cylinder into two halves. The test setup consists of two LVDTs, a load cell and two punches
through which the compressive force can be applied using a simple compression testing
machine. The experimental investigation was carried out in two phases. Phase 1 covers
the results from 95 samples for steel fiber reinforced concrete and Phase 2 covers the
results obtained from 48 samples with ultra-high performance fiber reinforced concrete
(UHP-FRC). Fiber volume fraction of 0.35%, 0.45%, 0.55% and 0.75% steel fiber was used
in the first phase and comparison based on peak load, peak tensile strength and residual
tensile strength at 0.3%, 1%, 2.5% and 5% circumferential strain was carried out. The
effects of displacement rates and specimen sizes were also investigated and compared
with the direct tensile test in the first phase. Phase 2 was carried out to assess the suitability
of DPT method for UHP-FRC material in determining tensile strength and behavior in post
cracking phase. The comparison based on peak load, peak tensile strength and residual
tensile strength at 0.3%, 1%, 2.5% and 5% circumferential strain was also carried out for
phase 2. The effects of displacement rates and specimen height were also studied similar
to phase 1.
The statistical analysis verifies the validity of the DPT for comparison purposes.
The Double Punch Test can also be used to characterize other aspects of the mechanical
performance of SFRC, such as resistance to cracking and residual strength. The simplified
testing arrangement, straightforward procedure and reliable result of the DPT makes this
method attractive for testing FRC and UHP-FRC. The following conclusions are based on
131
the results of the DPT for SFRC and UHP-FRC and statistical analysis described in this
thesis.
1. Double punch test is simple, easy, reliable and effective test method that is suitable
for both SFRC and UHP-FRC.
2. DPT can be used to compare the post-cracking ductility and performance of
mixtures containing different fiber types (manufacturer and geometry) as well as
different fiber volume fractions (fiber dosage).
3. The test results obtained from DPT represent an averaged mechanical behavior
as the failure mechanism occurs along multiple planes; the typical crack pattern is
concentrated along three or four radial planes for FRC and two to nine for UHP-
FRC.
4. DPT is able to evaluate and compare the quality of mixture from the nature of the
cracks (number and crack width) for FRC and UHP-FRC.
5. The displacement rate of 0.04 in./min is recommended for a standard systematic
test procedure of DPT. This is the optimum rate for good balance between
accuracy, efficiency and time for the test.
6. A correlation between deformation and the circumferential strain was found to be
linear for FRC and UHP-FRC. Formulas were derived to estimate the average
crack width and maximum crack width at the specified post-peak vertical
deformation of DPT samples. This allows DPT to only use LVDTs without using
circumferential extensometer and other instrumentation.
For FRC:
Average crack width: 3.78 PCWN
δ=
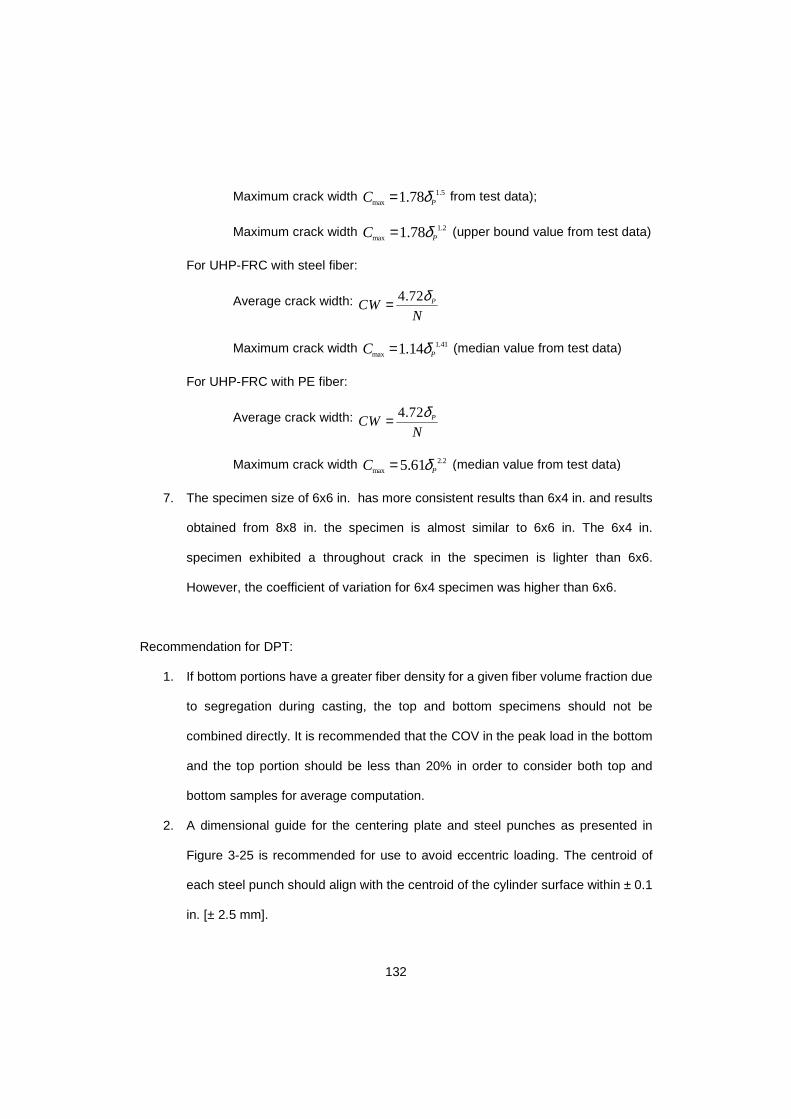
132
Maximum crack width 1.5max 1.78 PC δ= from test data);
Maximum crack width 1.2max 1.78 PC δ= (upper bound value from test data)
For UHP-FRC with steel fiber:
Average crack width: 4.72 PCWN
δ=
Maximum crack width 1.41max 1.14 PC δ= (median value from test data)
For UHP-FRC with PE fiber:
Average crack width: 4.72 PCWN
δ=
Maximum crack width 2.2max 5.61 PC δ= (median value from test data)
7. The specimen size of 6x6 in. has more consistent results than 6x4 in. and results
obtained from 8x8 in. the specimen is almost similar to 6x6 in. The 6x4 in.
specimen exhibited a throughout crack in the specimen is lighter than 6x6.
However, the coefficient of variation for 6x4 specimen was higher than 6x6.
Recommendation for DPT:
1. If bottom portions have a greater fiber density for a given fiber volume fraction due
to segregation during casting, the top and bottom specimens should not be
combined directly. It is recommended that the COV in the peak load in the bottom
and the top portion should be less than 20% in order to consider both top and
bottom samples for average computation.
2. A dimensional guide for the centering plate and steel punches as presented in
Figure 3-25 is recommended for use to avoid eccentric loading. The centroid of
each steel punch should align with the centroid of the cylinder surface within ± 0.1
in. [± 2.5 mm].

133
3. Specimen surfaces shall be smoothed so that the steel punches make uniform
(flat) contact with the top and bottom faces of the specimen. Smooth contact
surfaces can be obtained by grinding the ends of the cylinder.
4. Shakedown procedure is recommended to seat punches and avoid possible
unevenness of the surfaces of the specimen. In the shakedown procedure, the
load is applied up to 2 kips and then unloaded down to 0.5 kips, and again reloaded
to failure.
5. It is recommended to subtract the initial deformation offset from each deformation
reading during the reloading phase. The resulting deformations are termed
“corrected deformations.” Using the recorded loads and the corrected
deformations, the maximum load, and residual load/strength are calculated.

134
Appendix A
Detail calculation and graphs for Phase 1
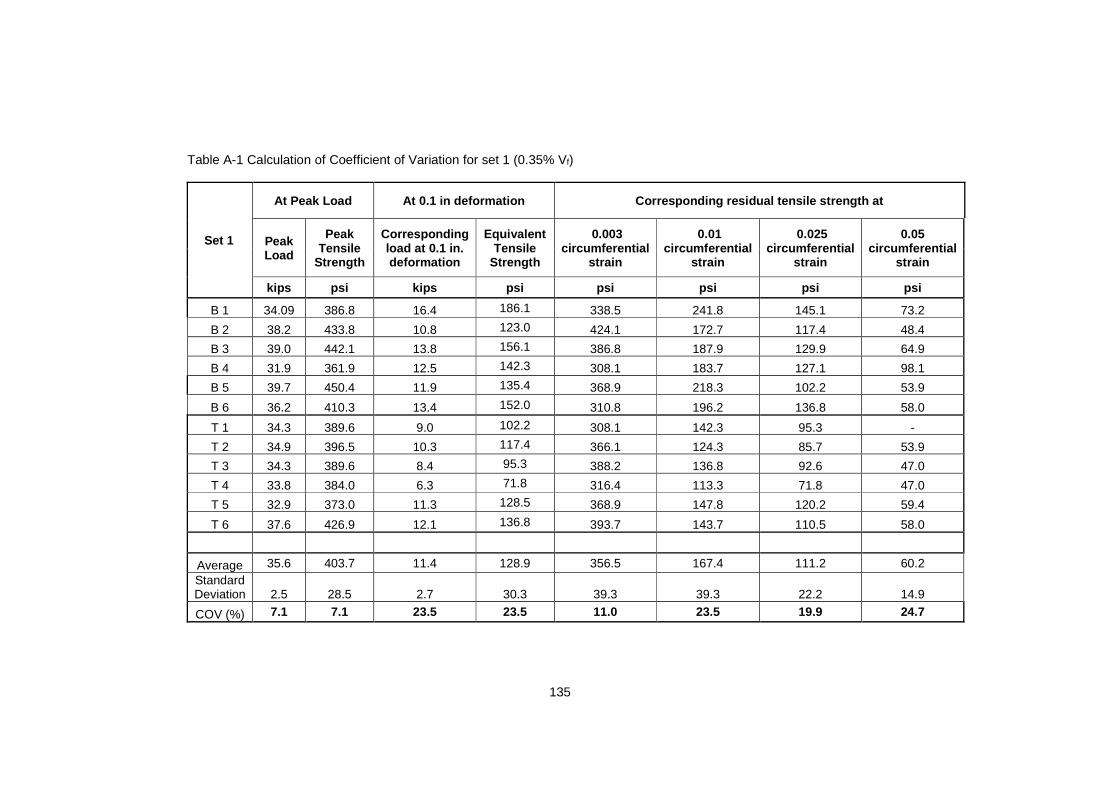
135
Table A-1 Calculation of Coefficient of Variation for set 1 (0.35% Vf)
Set 1
At Peak Load At 0.1 in deformation Corresponding re sidual tensile strength at
Peak Load
Peak Tensile
Strength
Corresponding load at 0.1 in. deformation
Equivalent Tensile
Strength
0.003 circumferential
strain
0.01 circumferential
strain
0.025 circumferential
strain
0.05 circumferential
strain
kips psi kips psi psi psi psi psi
B 1 34.09 386.8 16.4 186.1 338.5 241.8 145.1 73.2
B 2 38.2 433.8 10.8 123.0 424.1 172.7 117.4 48.4
B 3 39.0 442.1 13.8 156.1 386.8 187.9 129.9 64.9
B 4 31.9 361.9 12.5 142.3 308.1 183.7 127.1 98.1
B 5 39.7 450.4 11.9 135.4 368.9 218.3 102.2 53.9
B 6 36.2 410.3 13.4 152.0 310.8 196.2 136.8 58.0
T 1 34.3 389.6 9.0 102.2 308.1 142.3 95.3 -
T 2 34.9 396.5 10.3 117.4 366.1 124.3 85.7 53.9
T 3 34.3 389.6 8.4 95.3 388.2 136.8 92.6 47.0
T 4 33.8 384.0 6.3 71.8 316.4 113.3 71.8 47.0
T 5 32.9 373.0 11.3 128.5 368.9 147.8 120.2 59.4
T 6 37.6 426.9 12.1 136.8 393.7 143.7 110.5 58.0
Average 35.6 403.7 11.4 128.9 356.5 167.4 111.2 60.2 Standard Deviation 2.5 28.5 2.7 30.3 39.3 39.3 22.2 14.9
COV (%) 7.1 7.1 23.5 23.5 11.0 23.5 19.9 24.7
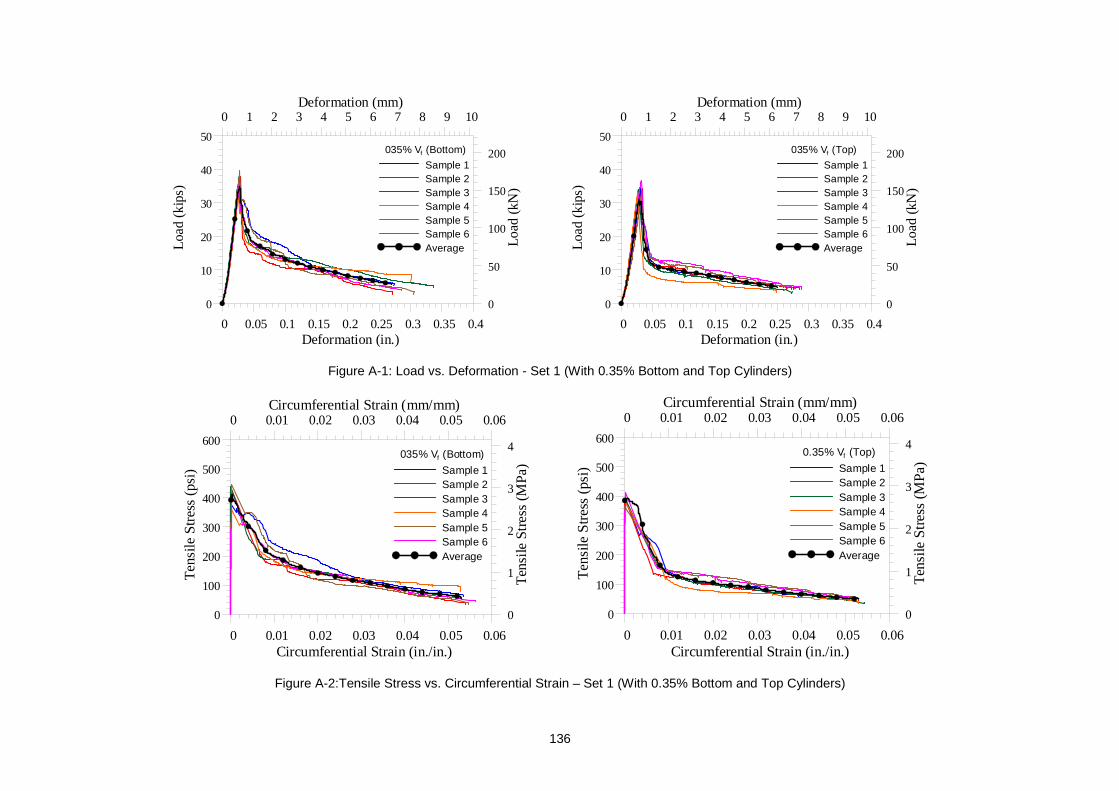
136
0 0.05 0.1 0.15 0.2 0.25 0.3 0.35 0.4Deformation (in.)
0
10
20
30
40
50
Loa
d(k
ips)
0 1 2 3 4 5 6 7 8 9 10Deformation (mm)
0
50
100
150
200
Load
(kN
)
035% Vf (Bottom)
Sample 1Sample 2Sample 3Sample 4Sample 5Sample 6Average
0 0.05 0.1 0.15 0.2 0.25 0.3 0.35 0.4Deformation (in.)
0
10
20
30
40
50
Loa
d(k
ips)
0 1 2 3 4 5 6 7 8 9 10Deformation (mm)
0
50
100
150
200
Load
(kN
)
035% Vf (Top)
Sample 1Sample 2Sample 3Sample 4Sample 5Sample 6Average
Figure A-1: Load vs. Deformation - Set 1 (With 0.35% Bottom and Top Cylinders)
0 0.01 0.02 0.03 0.04 0.05 0.06Circumferential Strain (in./in.)
0
100
200
300
400
500
600
Te
nsile
Str
ess
(psi
)
0 0.01 0.02 0.03 0.04 0.05 0.06Circumferential Strain (mm/mm)
0
1
2
3
4
Ten
sile
Str
ess
(MP
a)035% Vf (Bottom)
Sample 1Sample 2Sample 3Sample 4Sample 5Sample 6Average
0 0.01 0.02 0.03 0.04 0.05 0.06Circumferential Strain (in./in.)
0
100
200
300
400
500
600
Ten
sile
Str
ess
(psi
)
0 0.01 0.02 0.03 0.04 0.05 0.06Circumferential Strain (mm/mm)
0
1
2
3
4
Ten
sile
Str
ess
(MP
a)0.35% Vf (Top)
Sample 1Sample 2Sample 3Sample 4Sample 5Sample 6Average
Figure A-2:Tensile Stress vs. Circumferential Strain – Set 1 (With 0.35% Bottom and Top Cylinders)
137
0 0.01 0.02 0.03 0.04 0.05 0.06Circumferential Strain (in./in.)
0
0.2
0.4
0.6
Pos
t-pe
ak
def
orm
atio
n (i
n.)
0 0.01 0.02 0.03 0.04 0.05 0.06Circumferential Strain (mm/mm)
0
5
10
15
Pos
t-pe
ak
def
orm
atio
n (m
m)
035% Vf (Bottom)
Sample 1Sample 2Sample 3Sample 4Sample 5Sample 6Average
0 0.01 0.02 0.03 0.04 0.05 0.06Circumferential Strain (in./in.)
0
0.2
0.4
0.6
Pos
t-pe
ak
de
form
atio
n (i
n.)
0 0.01 0.02 0.03 0.04 0.05 0.06Circumferential Strain (mm/mm)
0
5
10
15
Pos
t-pe
ak
def
orm
atio
n (m
m)
035% Vf (Top)
Sample 1Sample 2Sample 3Sample 4Sample 5Sample 6Average
Figure A-3: Post-peak deformation vs. Circumferential Strain – Set 1 (With 0.35% Bottom and Top Cylinders)

138
Table A-2 Calculation of Coefficient of Variation for set 2 (0.45% Vf)
Set 2
At Peak Load At 0.1 in deformation Corresponding re sidual tensile strength at
Peak Load
Peak Tensile
Strength
Corresponding load at 0.1 in. deformation
Equivalent Tensile
Strength
0.003 circumferential
strain
0.01 circumferential
strain
0.025 circumferential
strain
kips psi kips psi psi psi psi
B 1 42.9 486.6 17.8 201.6 439.2 234.4 157.3
B 2 37.6 426.2 19.8 224.5 377.6 248.6 184.9
B 3 33.8 383.4 15.9 180.5 277.1 220.0 133.2
B 4 42.0 477.0 19.2 218.0 199.3 212.0 137.7
B 5 42.4 481.6 20.2 228.7 407.9 293.3 176.7
B 6 40.0 454.0 17.2 195.6 447.7 218.0 150.4
T 1 40.5 459.1 15.9 180.7 273.7 194.6 127.5
T 2 40.1 454.6 17.2 194.9 441.4 207.8 122.3
T 3 33.8 383.0 13.0 147.1 328.4 193.6 123.0
T 4 31.7 359.7 15.9 180.7 237.1 179.5 117.8
T 5 30.1 342.0 11.8 134.0 298.5 147.9 118.1
T 6 27.7 314.4 15.0 169.8 253.0 232.9 141.2
Average 36.9 418.5 16.6 188.0 331.7 215.2 140.9 Standard Deviation
5.2 59.5 2.6 29.0 87.9 36.5 22.5
COV (%) 14.2 14.2 15.4 15.4 26.5 17.0 15.9
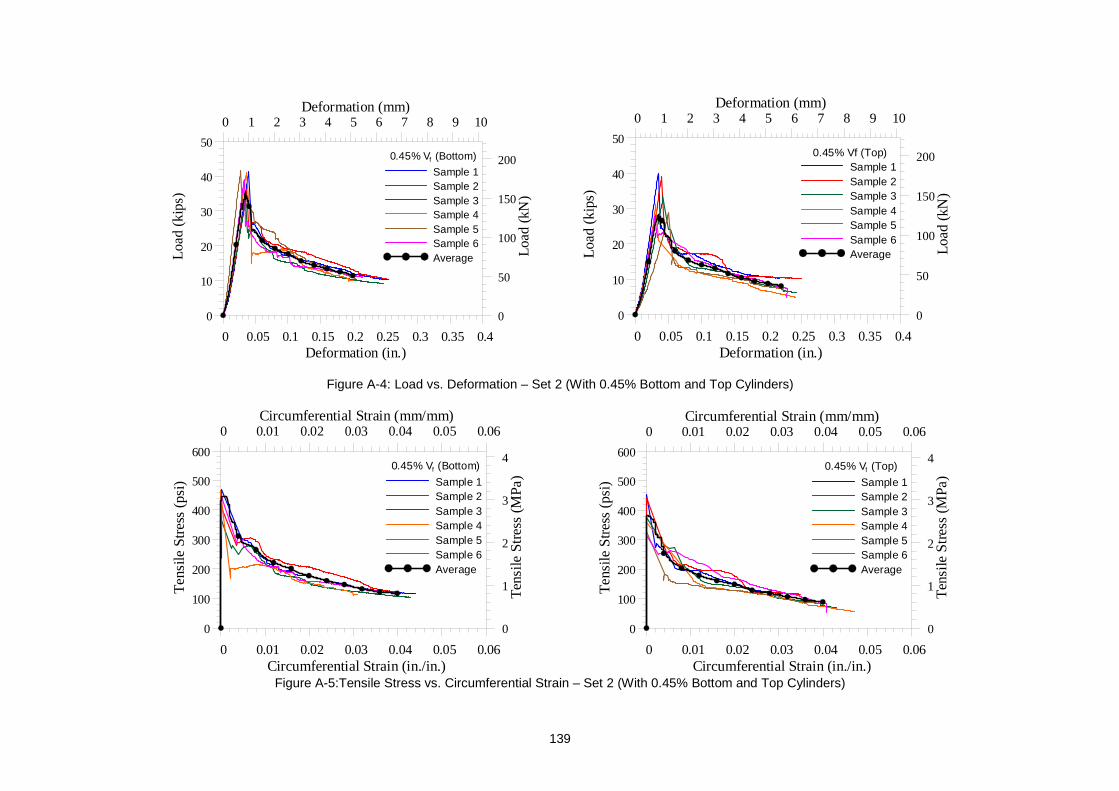
139
0 0.05 0.1 0.15 0.2 0.25 0.3 0.35 0.4Deformation (in.)
0
10
20
30
40
50
Loa
d(k
ips)
0 1 2 3 4 5 6 7 8 9 10Deformation (mm)
0
50
100
150
200
Loa
d (k
N)
0.45% Vf (Bottom)
Sample 1Sample 2Sample 3Sample 4Sample 5Sample 6Average
0 0.05 0.1 0.15 0.2 0.25 0.3 0.35 0.4
Deformation (in.)
0
10
20
30
40
50
Loa
d(k
ips)
0 1 2 3 4 5 6 7 8 9 10Deformation (mm)
0
50
100
150
200
Loa
d (k
N)
0.45% Vf (Top)Sample 1Sample 2Sample 3Sample 4Sample 5Sample 6Average
Figure A-4: Load vs. Deformation – Set 2 (With 0.45% Bottom and Top Cylinders)
0 0.01 0.02 0.03 0.04 0.05 0.06Circumferential Strain (in./in.)
0
100
200
300
400
500
600
Te
nsile
Str
ess
(psi
)
0 0.01 0.02 0.03 0.04 0.05 0.06Circumferential Strain (mm/mm)
0
1
2
3
4
Ten
sile
Str
ess
(MP
a)0.45% Vf (Bottom)
Sample 1Sample 2Sample 3Sample 4Sample 5Sample 6Average
0 0.01 0.02 0.03 0.04 0.05 0.06
Circumferential Strain (in./in.)
0
100
200
300
400
500
600
Te
nsile
Str
ess
(psi
)
0 0.01 0.02 0.03 0.04 0.05 0.06Circumferential Strain (mm/mm)
0
1
2
3
4
Ten
sile
Str
ess
(MP
a)0.45% Vf (Top)
Sample 1Sample 2Sample 3Sample 4Sample 5Sample 6Average
Figure A-5:Tensile Stress vs. Circumferential Strain – Set 2 (With 0.45% Bottom and Top Cylinders)
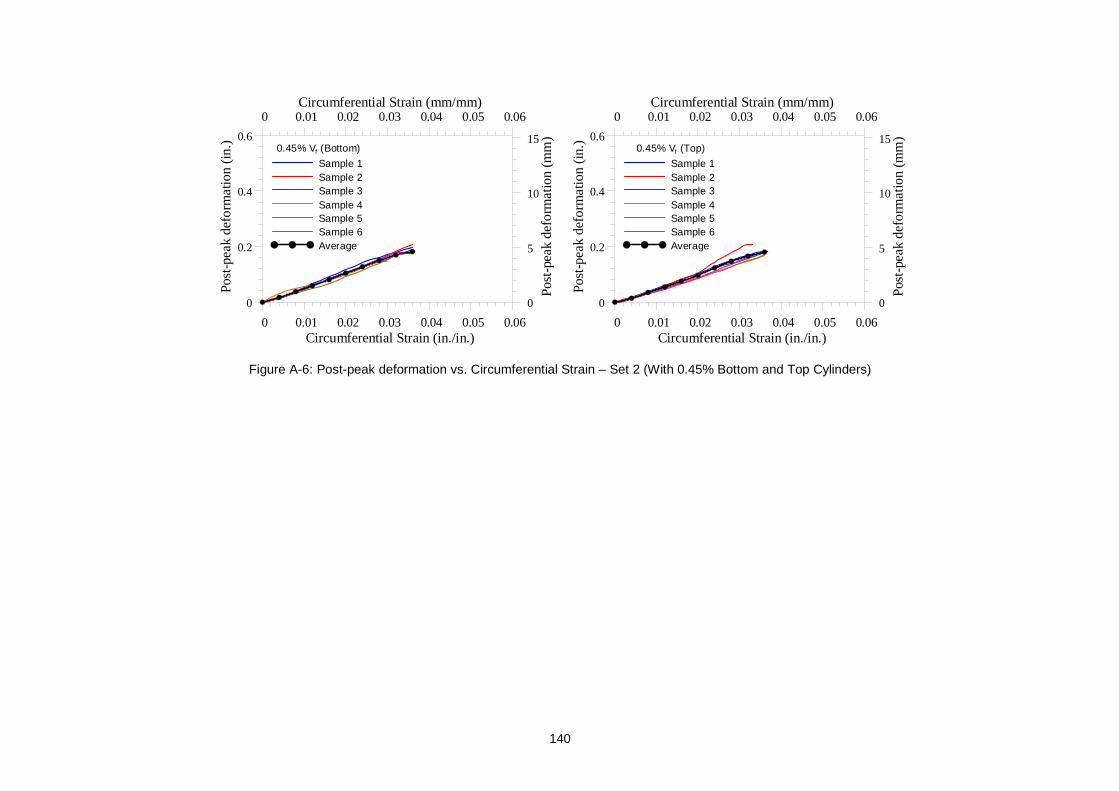
140
0 0.01 0.02 0.03 0.04 0.05 0.06Circumferential Strain (in./in.)
0
0.2
0.4
0.6
Pos
t-pe
ak
def
orm
atio
n (i
n.)
0 0.01 0.02 0.03 0.04 0.05 0.06Circumferential Strain (mm/mm)
0
5
10
15
Pos
t-pe
ak
def
orm
atio
n (m
m)
0.45% Vf (Bottom)
Sample 1Sample 2Sample 3Sample 4Sample 5Sample 6Average
0 0.01 0.02 0.03 0.04 0.05 0.06Circumferential Strain (in./in.)
0
0.2
0.4
0.6
Pos
t-pe
ak
def
orm
atio
n (i
n.)
0 0.01 0.02 0.03 0.04 0.05 0.06Circumferential Strain (mm/mm)
0
5
10
15
Pos
t-pe
ak
def
orm
atio
n (m
m)
0.45% Vf (Top)
Sample 1Sample 2Sample 3Sample 4Sample 5Sample 6Average
Figure A-6: Post-peak deformation vs. Circumferential Strain – Set 2 (With 0.45% Bottom and Top Cylinders)
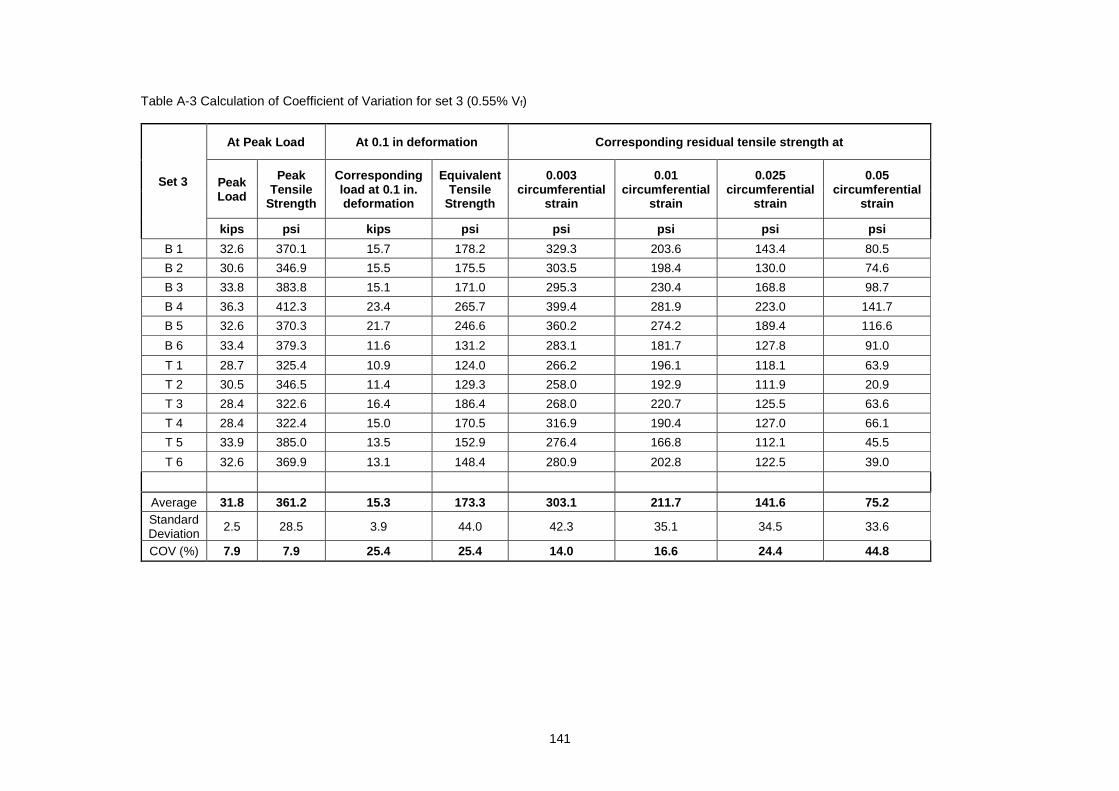
141
Table A-3 Calculation of Coefficient of Variation for set 3 (0.55% Vf)
Set 3
At Peak Load At 0.1 in deformation Corresponding re sidual tensile strength at
Peak Load
Peak Tensile
Strength
Corresponding load at 0.1 in. deformation
Equivalent Tensile
Strength
0.003 circumferential
strain
0.01 circumferential
strain
0.025 circumferential
strain
0.05 circumferential
strain
kips psi kips psi psi psi psi psi
B 1 32.6 370.1 15.7 178.2 329.3 203.6 143.4 80.5
B 2 30.6 346.9 15.5 175.5 303.5 198.4 130.0 74.6
B 3 33.8 383.8 15.1 171.0 295.3 230.4 168.8 98.7
B 4 36.3 412.3 23.4 265.7 399.4 281.9 223.0 141.7
B 5 32.6 370.3 21.7 246.6 360.2 274.2 189.4 116.6
B 6 33.4 379.3 11.6 131.2 283.1 181.7 127.8 91.0
T 1 28.7 325.4 10.9 124.0 266.2 196.1 118.1 63.9
T 2 30.5 346.5 11.4 129.3 258.0 192.9 111.9 20.9
T 3 28.4 322.6 16.4 186.4 268.0 220.7 125.5 63.6
T 4 28.4 322.4 15.0 170.5 316.9 190.4 127.0 66.1
T 5 33.9 385.0 13.5 152.9 276.4 166.8 112.1 45.5
T 6 32.6 369.9 13.1 148.4 280.9 202.8 122.5 39.0
Average 31.8 361.2 15.3 173.3 303.1 211.7 141.6 75.2 Standard Deviation
2.5 28.5 3.9 44.0 42.3 35.1 34.5 33.6
COV (%) 7.9 7.9 25.4 25.4 14.0 16.6 24.4 44.8
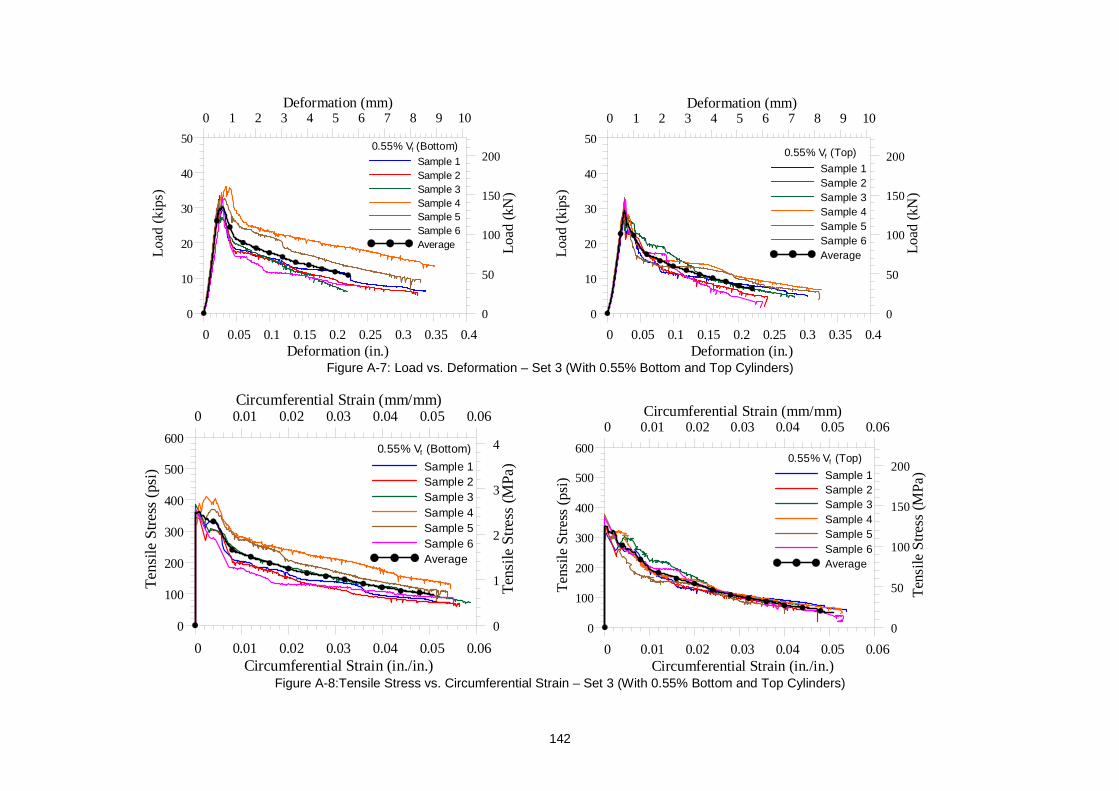
142
0 0.05 0.1 0.15 0.2 0.25 0.3 0.35 0.4
Deformation (in.)
0
10
20
30
40
50
Loa
d(k
ips)
0 1 2 3 4 5 6 7 8 9 10Deformation (mm)
0
50
100
150
200
Loa
d (k
N)
0.55% Vf (Bottom) Sample 1Sample 2Sample 3Sample 4Sample 5Sample 6Average
0 0.05 0.1 0.15 0.2 0.25 0.3 0.35 0.4
Deformation (in.)
0
10
20
30
40
50
Loa
d(k
ips)
0 1 2 3 4 5 6 7 8 9 10Deformation (mm)
0
50
100
150
200
Load
(kN
)
0.55% Vf (Top)
Sample 1Sample 2Sample 3Sample 4Sample 5Sample 6Average
Figure A-7: Load vs. Deformation – Set 3 (With 0.55% Bottom and Top Cylinders)
0 0.01 0.02 0.03 0.04 0.05 0.06Circumferential Strain (in./in.)
0
100
200
300
400
500
600
Te
nsile
Str
ess
(psi
)
0 0.01 0.02 0.03 0.04 0.05 0.06Circumferential Strain (mm/mm)
0
1
2
3
4
Ten
sile
Str
ess
(MP
a)0.55% Vf (Bottom)
Sample 1Sample 2Sample 3Sample 4Sample 5Sample 6Average
0 0.01 0.02 0.03 0.04 0.05 0.06
Circumferential Strain (in./in.)
0
100
200
300
400
500
600
Te
nsile
Str
ess
(psi
)
0 0.01 0.02 0.03 0.04 0.05 0.06Circumferential Strain (mm/mm)
0
50
100
150
200
Ten
sile
Str
ess
(MP
a)0.55% Vf (Top)
Sample 1Sample 2Sample 3Sample 4Sample 5Sample 6Average
Figure A-8:Tensile Stress vs. Circumferential Strain – Set 3 (With 0.55% Bottom and Top Cylinders)
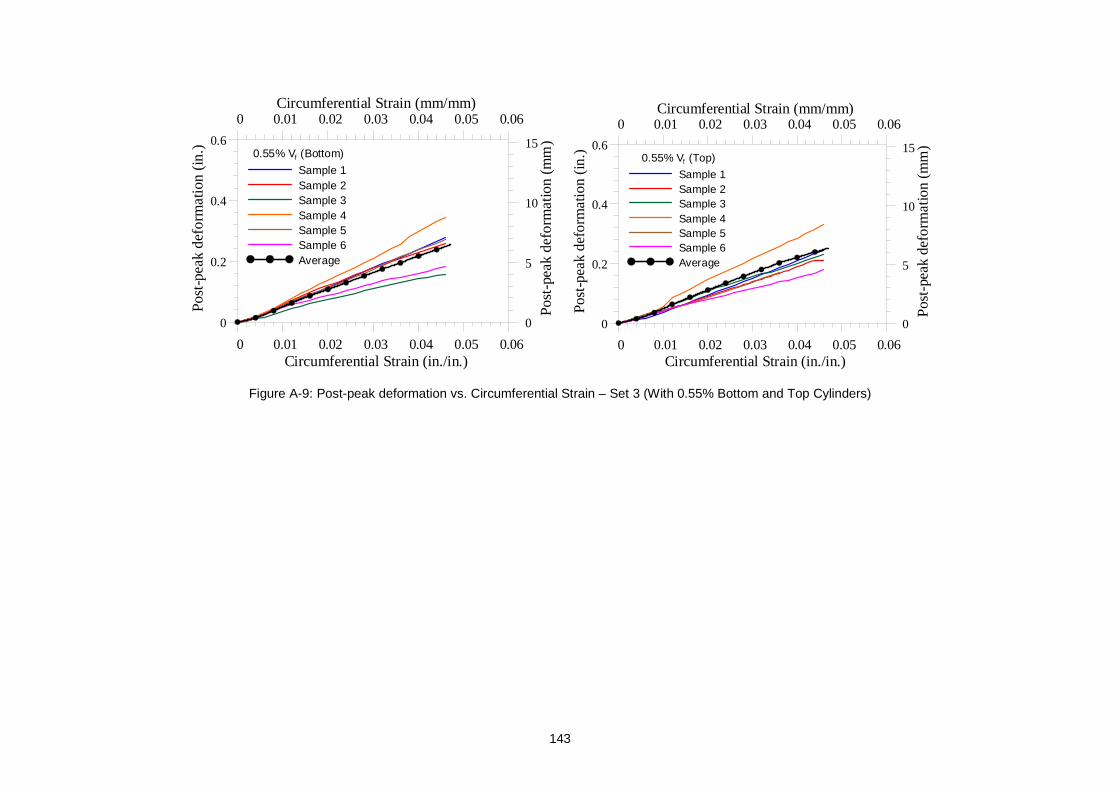
143
0 0.01 0.02 0.03 0.04 0.05 0.06Circumferential Strain (in./in.)
0
0.2
0.4
0.6
Pos
t-pe
ak
def
orm
atio
n (i
n.)
0 0.01 0.02 0.03 0.04 0.05 0.06Circumferential Strain (mm/mm)
0
5
10
15
Pos
t-pe
ak
def
orm
atio
n (m
m)
0.55% Vf (Bottom)
Sample 1Sample 2Sample 3Sample 4Sample 5Sample 6Average
0 0.01 0.02 0.03 0.04 0.05 0.06Circumferential Strain (in./in.)
0
0.2
0.4
0.6
Pos
t-pe
ak
def
orm
atio
n (i
n.)
0 0.01 0.02 0.03 0.04 0.05 0.06Circumferential Strain (mm/mm)
0
5
10
15
Pos
t-pe
ak
def
orm
atio
n (m
m)
0.55% Vf (Top)
Sample 1Sample 2Sample 3Sample 4Sample 5Sample 6Average
Figure A-9: Post-peak deformation vs. Circumferential Strain – Set 3 (With 0.55% Bottom and Top Cylinders)
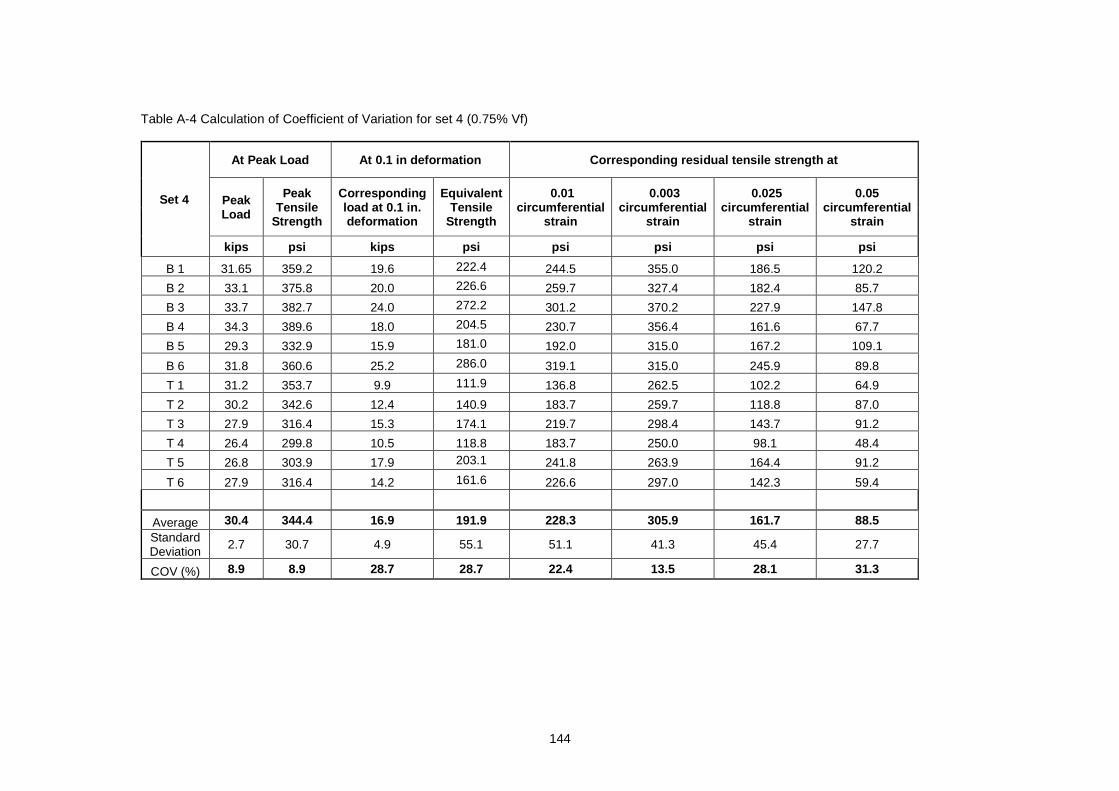
144
Table A-4 Calculation of Coefficient of Variation for set 4 (0.75% Vf)
Set 4
At Peak Load At 0.1 in deformation Corresponding re sidual tensile strength at
Peak Load
Peak Tensile
Strength
Corresponding load at 0.1 in. deformation
Equivalent Tensile
Strength
0.01 circumferential
strain
0.003 circumferential
strain
0.025 circumferential
strain
0.05 circumferential
strain
kips psi kips psi psi psi psi psi
B 1 31.65 359.2 19.6 222.4 244.5 355.0 186.5 120.2
B 2 33.1 375.8 20.0 226.6 259.7 327.4 182.4 85.7
B 3 33.7 382.7 24.0 272.2 301.2 370.2 227.9 147.8
B 4 34.3 389.6 18.0 204.5 230.7 356.4 161.6 67.7
B 5 29.3 332.9 15.9 181.0 192.0 315.0 167.2 109.1
B 6 31.8 360.6 25.2 286.0 319.1 315.0 245.9 89.8
T 1 31.2 353.7 9.9 111.9 136.8 262.5 102.2 64.9
T 2 30.2 342.6 12.4 140.9 183.7 259.7 118.8 87.0
T 3 27.9 316.4 15.3 174.1 219.7 298.4 143.7 91.2
T 4 26.4 299.8 10.5 118.8 183.7 250.0 98.1 48.4
T 5 26.8 303.9 17.9 203.1 241.8 263.9 164.4 91.2
T 6 27.9 316.4 14.2 161.6 226.6 297.0 142.3 59.4
Average 30.4 344.4 16.9 191.9 228.3 305.9 161.7 88.5 Standard Deviation
2.7 30.7 4.9 55.1 51.1 41.3 45.4 27.7
COV (%) 8.9 8.9 28.7 28.7 22.4 13.5 28.1 31.3
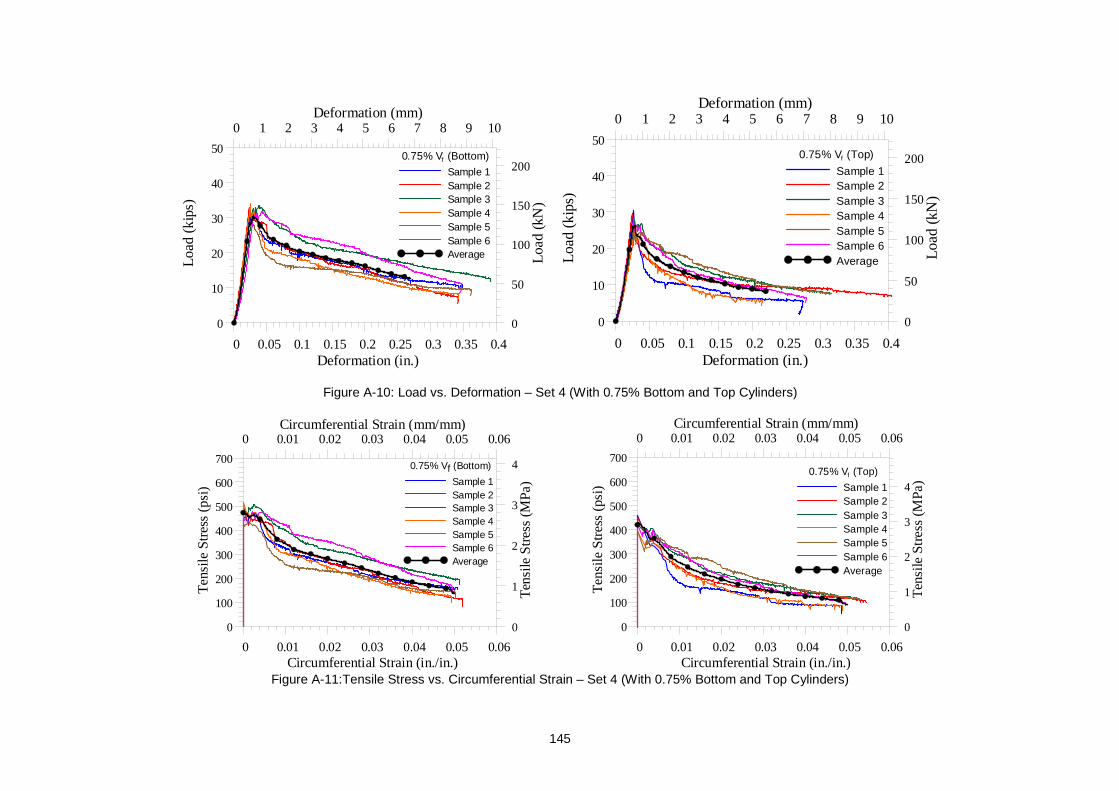
145
0 0.05 0.1 0.15 0.2 0.25 0.3 0.35 0.4Deformation (in.)
0
10
20
30
40
50
Loa
d(k
ips)
0 1 2 3 4 5 6 7 8 9 10Deformation (mm)
0
50
100
150
200
Loa
d (k
N)
0.75% Vf (Bottom)
Sample 1Sample 2Sample 3Sample 4Sample 5Sample 6Average
0 0.05 0.1 0.15 0.2 0.25 0.3 0.35 0.4Deformation (in.)
0
10
20
30
40
50
Loa
d(k
ips)
0 1 2 3 4 5 6 7 8 9 10Deformation (mm)
0
50
100
150
200
Loa
d (k
N)
0.75% Vf (Top)
Sample 1Sample 2Sample 3Sample 4Sample 5Sample 6Average
Figure A-10: Load vs. Deformation – Set 4 (With 0.75% Bottom and Top Cylinders)
0 0.01 0.02 0.03 0.04 0.05 0.06Circumferential Strain (in./in.)
0
100
200
300
400
500
600
700
Te
nsile
Str
ess
(psi
)
0 0.01 0.02 0.03 0.04 0.05 0.06Circumferential Strain (mm/mm)
0
1
2
3
4
Ten
sile
Str
ess
(MP
a)0.75% Vf (Bottom)
Sample 1Sample 2Sample 3Sample 4Sample 5Sample 6Average
0 0.01 0.02 0.03 0.04 0.05 0.06
Circumferential Strain (in./in.)
0
100
200
300
400
500
600
700
Te
nsile
Str
ess
(psi
)
0 0.01 0.02 0.03 0.04 0.05 0.06Circumferential Strain (mm/mm)
0
1
2
3
4
Ten
sile
Str
ess
(MP
a)0.75% Vf (Top)
Sample 1Sample 2Sample 3Sample 4Sample 5Sample 6Average
Figure A-11:Tensile Stress vs. Circumferential Strain – Set 4 (With 0.75% Bottom and Top Cylinders)
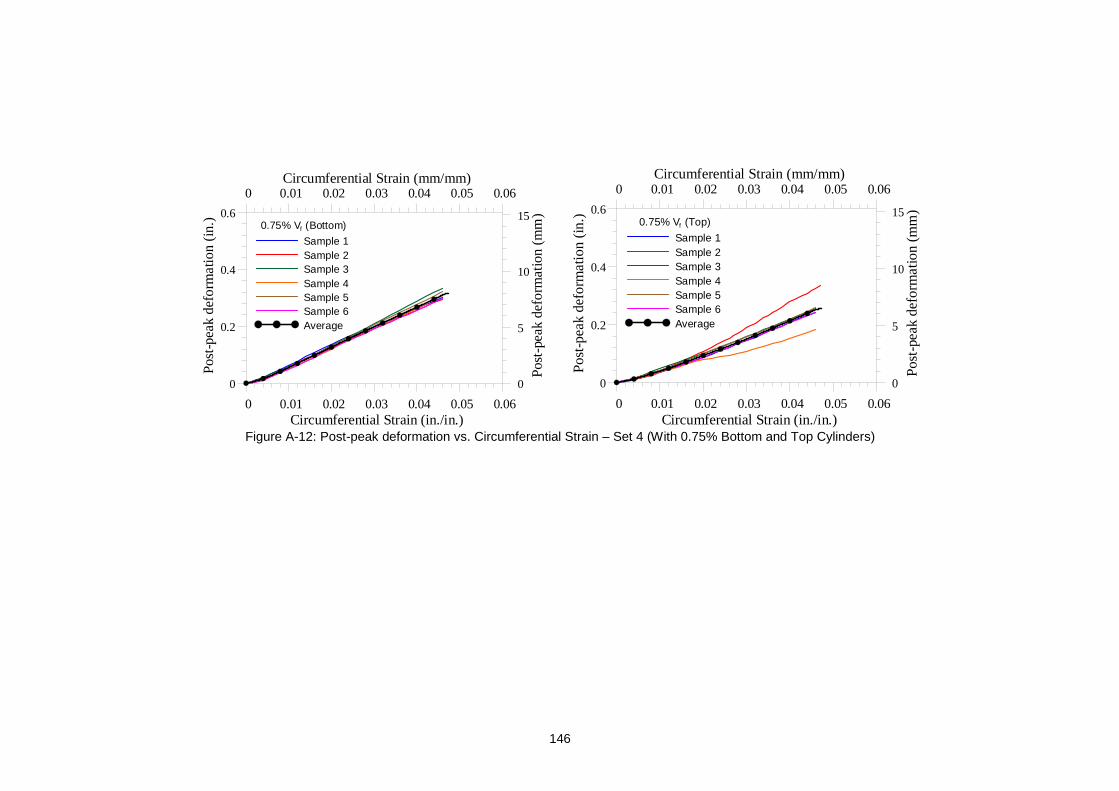
146
0 0.01 0.02 0.03 0.04 0.05 0.06Circumferential Strain (in./in.)
0
0.2
0.4
0.6P
ost-
pea
k d
efo
rma
tion
(in.
)0 0.01 0.02 0.03 0.04 0.05 0.06
Circumferential Strain (mm/mm)
0
5
10
15
Pos
t-pe
ak d
efo
rma
tion
(mm
)
0.75% Vf (Bottom)
Sample 1Sample 2Sample 3Sample 4Sample 5Sample 6Average
0 0.01 0.02 0.03 0.04 0.05 0.06
Circumferential Strain (in./in.)
0
0.2
0.4
0.6
Pos
t-pe
ak
def
orm
atio
n (i
n.)
0 0.01 0.02 0.03 0.04 0.05 0.06Circumferential Strain (mm/mm)
0
5
10
15
Pos
t-pe
ak
def
orm
atio
n (m
m)
0.75% Vf (Top)
Sample 1Sample 2Sample 3Sample 4Sample 5Sample 6Average
Figure A-12: Post-peak deformation vs. Circumferential Strain – Set 4 (With 0.75% Bottom and Top Cylinders)

147
Table A-5 Calculation of Coefficient of Variation for set 6 (0.35% Vf and 0.04 in./min displacement rate)
Set 5
At Peak Load At 0.1 in deformation Corresponding re sidual tensile strength at
Peak Load
Peak Tensile
Strength
Corresponding load at 0.1 in. deformation
Equivalent Tensile
Strength
0.01 circumferential
strain
0.003 circumferential
strain
0.025 circumferential
strain
0.05 circumferential
strain
kips psi kips psi psi psi psi psi
B 1 34.57 400.7 11.8 136.8 519.4 186.0 171.3 106.8
B 2 31.90 369.6 5.97 69.1 335.7 193.4 69.1 42.8
B 3 37.13 430.3 13.15 152.4 406.2 161.6 105.0 70.5
B 4 29.70 344.2 8.64 100.2 254.2 124.3 76.0 53.9
B 5 36.16 419.0 12.54 145.3 397.9 160.3 92.6 47.0
B 6 32.63 378.1 10.71 124.2 360.6 143.7 106.4 69.1
T 1 33.72 390.8 12.66 146.7 291.5 176.8 117.4 56.6
T 2 29.58 342.8 7.55 87.5 326.0 95.3 78.7 58.0
T 3 36.52 423.2 15.22 176.4 348.1 196.2 158.9 93.9
T 4 32.36 375.0 9.98 115.7 327.5 150.6 96.7 59.4
T 5 28.97 335.8 17.90 207.4 273.5 215.5 175.4 98.1
T 6 27.76 321.7 14.61 169.3 257.0 197.6 123.0 66.3
Average 32.6 377.6 11.7 135.9 341.5 166.8 114.2 68.5 Standard Deviation
3.1 36.4 3.4 39.3 74.9 34.6 36.6 20.6
COV (%) 9.6 9.6 28.9 28.9 21.9 20.7 32.1 30.1
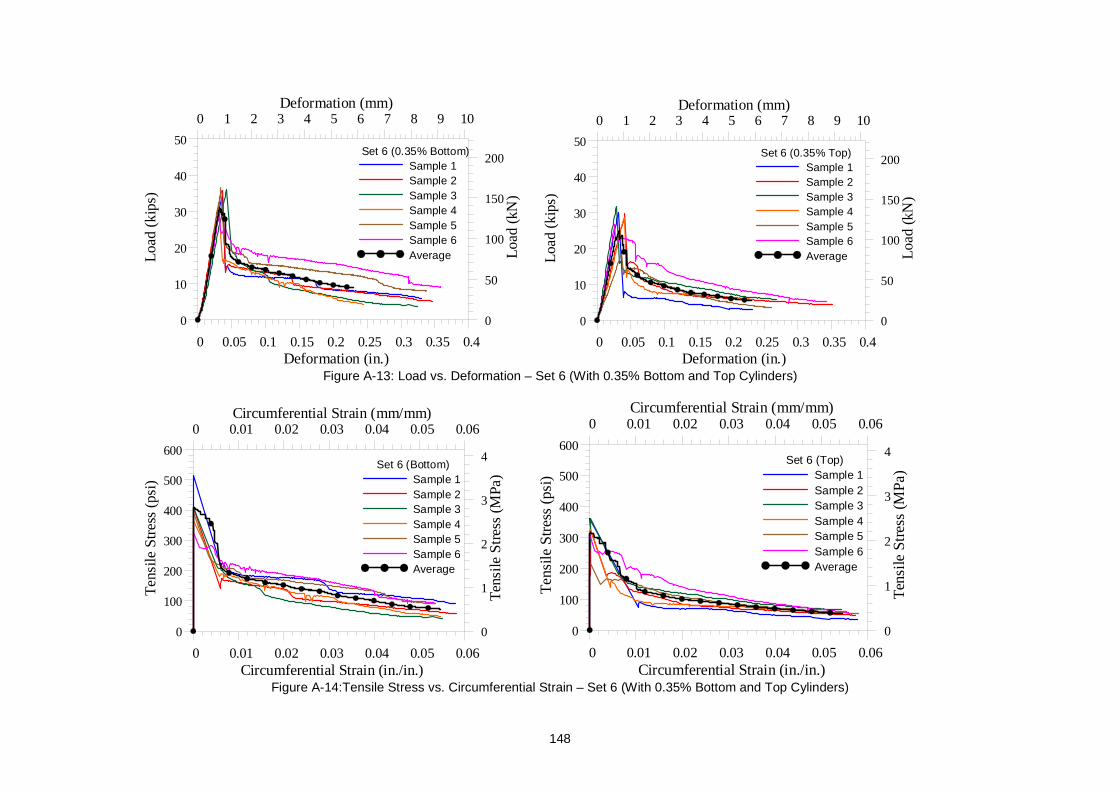
148
0 0.05 0.1 0.15 0.2 0.25 0.3 0.35 0.4Deformation (in.)
0
10
20
30
40
50Lo
ad
(kip
s)
0 1 2 3 4 5 6 7 8 9 10Deformation (mm)
0
50
100
150
200
Load
(kN
)
Set 6 (0.35% Bottom)Sample 1Sample 2Sample 3Sample 4Sample 5Sample 6Average
0 0.05 0.1 0.15 0.2 0.25 0.3 0.35 0.4
Deformation (in.)
0
10
20
30
40
50
Loa
d(k
ips)
0 1 2 3 4 5 6 7 8 9 10Deformation (mm)
0
50
100
150
200
Loa
d (k
N)
Set 6 (0.35% Top)Sample 1Sample 2Sample 3Sample 4Sample 5Sample 6Average
Figure A-13: Load vs. Deformation – Set 6 (With 0.35% Bottom and Top Cylinders)
0 0.01 0.02 0.03 0.04 0.05 0.06Circumferential Strain (in./in.)
0
100
200
300
400
500
600
Te
nsile
Str
ess
(psi
)
0 0.01 0.02 0.03 0.04 0.05 0.06Circumferential Strain (mm/mm)
0
1
2
3
4
Ten
sile
Str
ess
(MP
a)Set 6 (Bottom)
Sample 1Sample 2Sample 3Sample 4Sample 5Sample 6Average
0 0.01 0.02 0.03 0.04 0.05 0.06Circumferential Strain (in./in.)
0
100
200
300
400
500
600
Te
nsile
Str
ess
(psi
)
0 0.01 0.02 0.03 0.04 0.05 0.06Circumferential Strain (mm/mm)
0
1
2
3
4
Ten
sile
Str
ess
(MP
a)Set 6 (Top)
Sample 1Sample 2Sample 3Sample 4Sample 5Sample 6Average
Figure A-14:Tensile Stress vs. Circumferential Strain – Set 6 (With 0.35% Bottom and Top Cylinders)
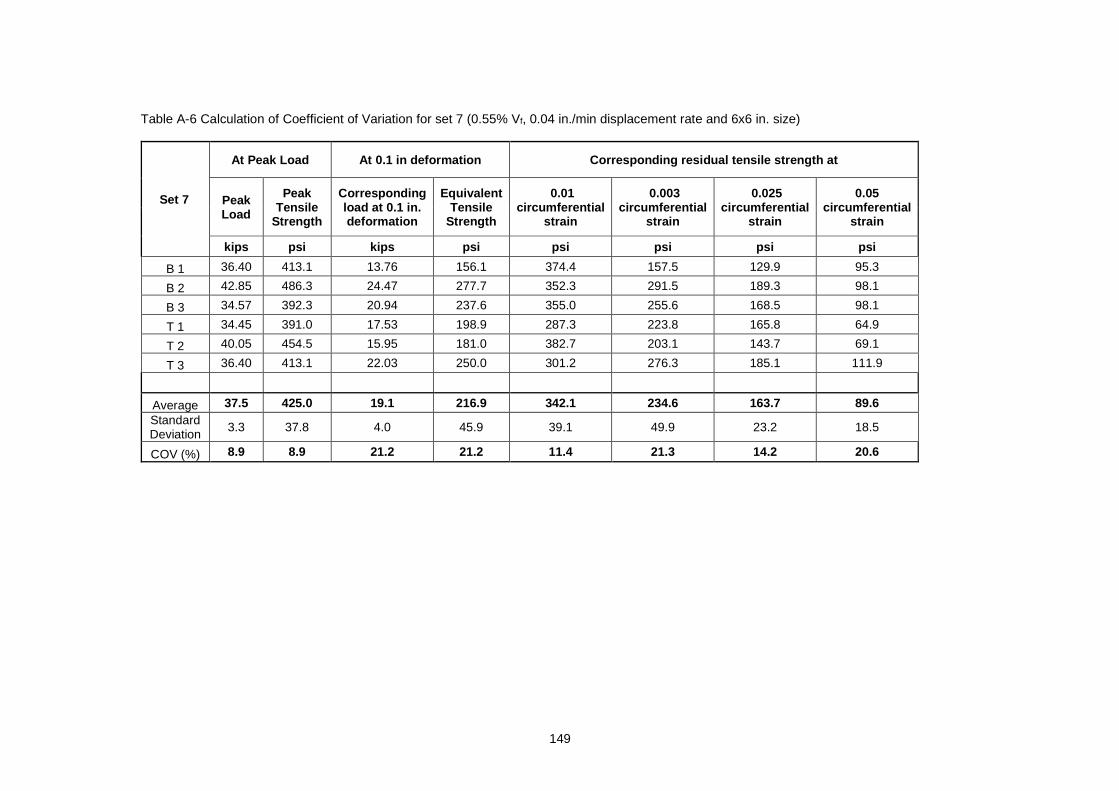
149
Table A-6 Calculation of Coefficient of Variation for set 7 (0.55% Vf, 0.04 in./min displacement rate and 6x6 in. size)
Set 7
At Peak Load At 0.1 in deformation Corresponding re sidual tensile strength at
Peak Load
Peak Tensile
Strength
Corresponding load at 0.1 in. deformation
Equivalent Tensile
Strength
0.01 circumferential
strain
0.003 circumferential
strain
0.025 circumferential
strain
0.05 circumferential
strain
kips psi kips psi psi psi psi psi
B 1 36.40 413.1 13.76 156.1 374.4 157.5 129.9 95.3
B 2 42.85 486.3 24.47 277.7 352.3 291.5 189.3 98.1
B 3 34.57 392.3 20.94 237.6 355.0 255.6 168.5 98.1
T 1 34.45 391.0 17.53 198.9 287.3 223.8 165.8 64.9
T 2 40.05 454.5 15.95 181.0 382.7 203.1 143.7 69.1
T 3 36.40 413.1 22.03 250.0 301.2 276.3 185.1 111.9
Average 37.5 425.0 19.1 216.9 342.1 234.6 163.7 89.6 Standard Deviation
3.3 37.8 4.0 45.9 39.1 49.9 23.2 18.5
COV (%) 8.9 8.9 21.2 21.2 11.4 21.3 14.2 20.6
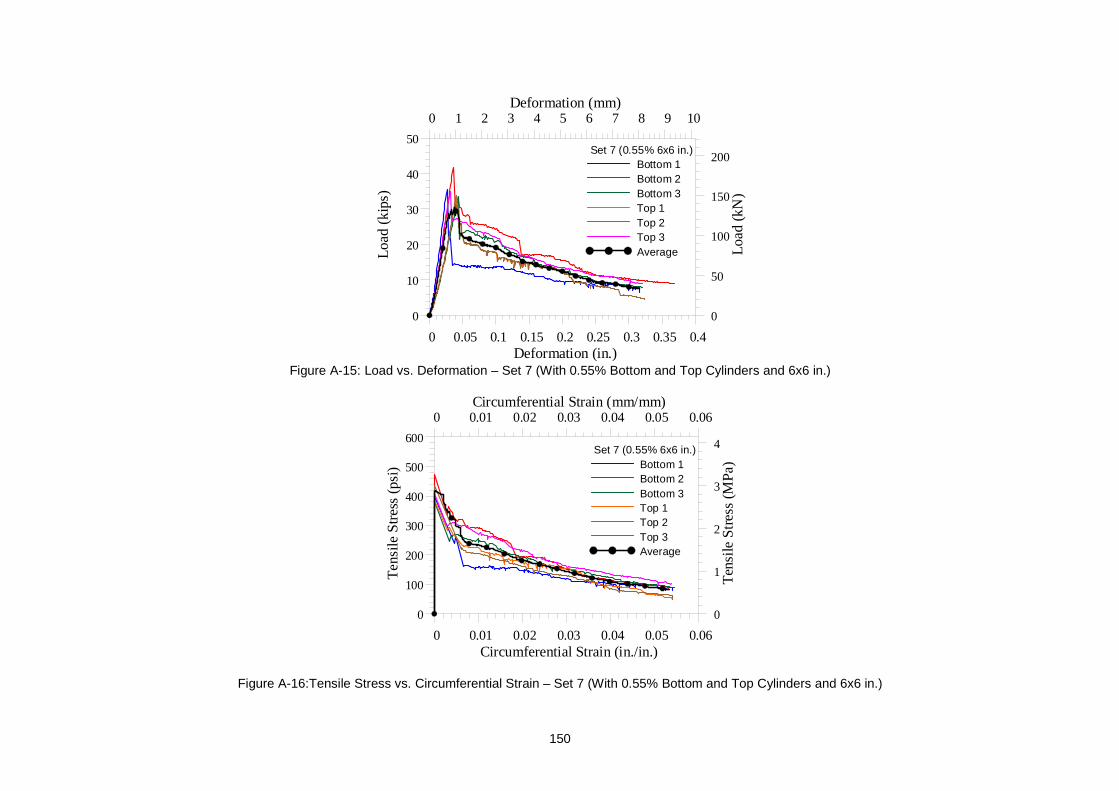
150
0 0.05 0.1 0.15 0.2 0.25 0.3 0.35 0.4Deformation (in.)
0
10
20
30
40
50
Loa
d(k
ips)
0 1 2 3 4 5 6 7 8 9 10Deformation (mm)
0
50
100
150
200
Loa
d (k
N)
Set 7 (0.55% 6x6 in.)Bottom 1Bottom 2Bottom 3Top 1Top 2Top 3Average
Figure A-15: Load vs. Deformation – Set 7 (With 0.55% Bottom and Top Cylinders and 6x6 in.)
0 0.01 0.02 0.03 0.04 0.05 0.06Circumferential Strain (in./in.)
0
100
200
300
400
500
600
Te
nsile
Str
ess
(psi
)
0 0.01 0.02 0.03 0.04 0.05 0.06Circumferential Strain (mm/mm)
0
1
2
3
4
Ten
sile
Str
ess
(MP
a)Set 7 (0.55% 6x6 in.)
Bottom 1Bottom 2Bottom 3Top 1Top 2Top 3Average
Figure A-16:Tensile Stress vs. Circumferential Strain – Set 7 (With 0.55% Bottom and Top Cylinders and 6x6 in.)
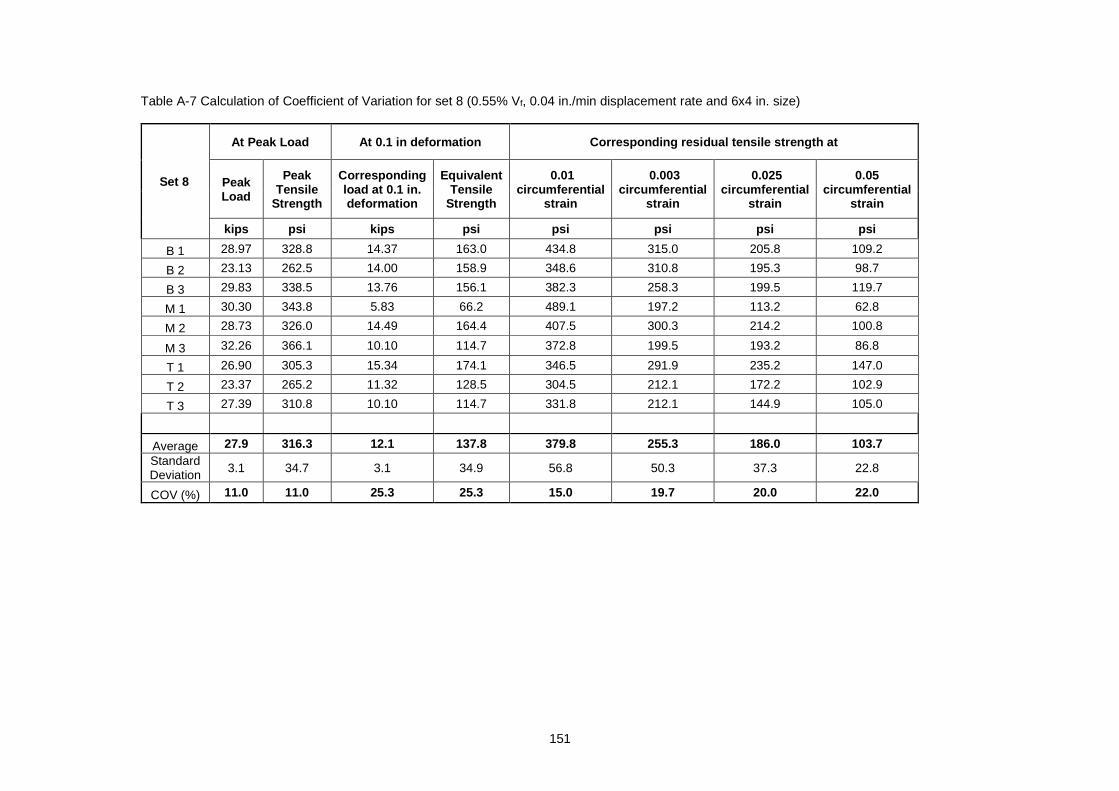
151
Table A-7 Calculation of Coefficient of Variation for set 8 (0.55% Vf, 0.04 in./min displacement rate and 6x4 in. size)
Set 8
At Peak Load At 0.1 in deformation Corresponding re sidual tensile strength at
Peak Load
Peak Tensile
Strength
Corresponding load at 0.1 in. deformation
Equivalent Tensile
Strength
0.01 circumferential
strain
0.003 circumferential
strain
0.025 circumferential
strain
0.05 circumferential
strain
kips psi kips psi psi psi psi psi
B 1 28.97 328.8 14.37 163.0 434.8 315.0 205.8 109.2
B 2 23.13 262.5 14.00 158.9 348.6 310.8 195.3 98.7
B 3 29.83 338.5 13.76 156.1 382.3 258.3 199.5 119.7
M 1 30.30 343.8 5.83 66.2 489.1 197.2 113.2 62.8
M 2 28.73 326.0 14.49 164.4 407.5 300.3 214.2 100.8
M 3 32.26 366.1 10.10 114.7 372.8 199.5 193.2 86.8
T 1 26.90 305.3 15.34 174.1 346.5 291.9 235.2 147.0
T 2 23.37 265.2 11.32 128.5 304.5 212.1 172.2 102.9
T 3 27.39 310.8 10.10 114.7 331.8 212.1 144.9 105.0
Average 27.9 316.3 12.1 137.8 379.8 255.3 186.0 103.7 Standard Deviation 3.1 34.7 3.1 34.9 56.8 50.3 37.3 22.8
COV (%) 11.0 11.0 25.3 25.3 15.0 19.7 20.0 22.0
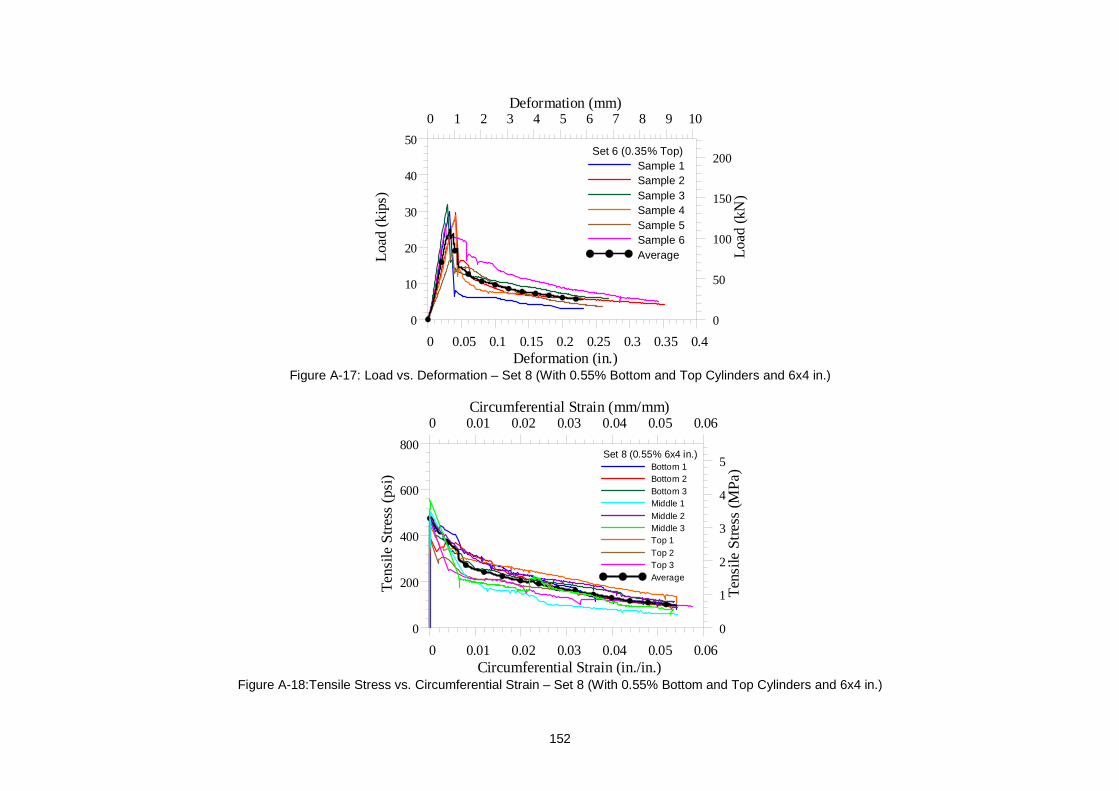
152
0 0.05 0.1 0.15 0.2 0.25 0.3 0.35 0.4Deformation (in.)
0
10
20
30
40
50
Loa
d(k
ips)
0 1 2 3 4 5 6 7 8 9 10Deformation (mm)
0
50
100
150
200
Loa
d (k
N)
Set 6 (0.35% Top)Sample 1Sample 2Sample 3Sample 4Sample 5Sample 6Average
Figure A-17: Load vs. Deformation – Set 8 (With 0.55% Bottom and Top Cylinders and 6x4 in.)
0 0.01 0.02 0.03 0.04 0.05 0.06Circumferential Strain (in./in.)
0
200
400
600
800
Te
nsi
le S
tres
s(p
si)
0 0.01 0.02 0.03 0.04 0.05 0.06Circumferential Strain (mm/mm)
0
1
2
3
4
5
Ten
sile
Str
ess
(MP
a)Set 8 (0.55% 6x4 in.)
Bottom 1Bottom 2Bottom 3Middle 1Middle 2Middle 3Top 1Top 2Top 3Average
Figure A-18:Tensile Stress vs. Circumferential Strain – Set 8 (With 0.55% Bottom and Top Cylinders and 6x4 in.)
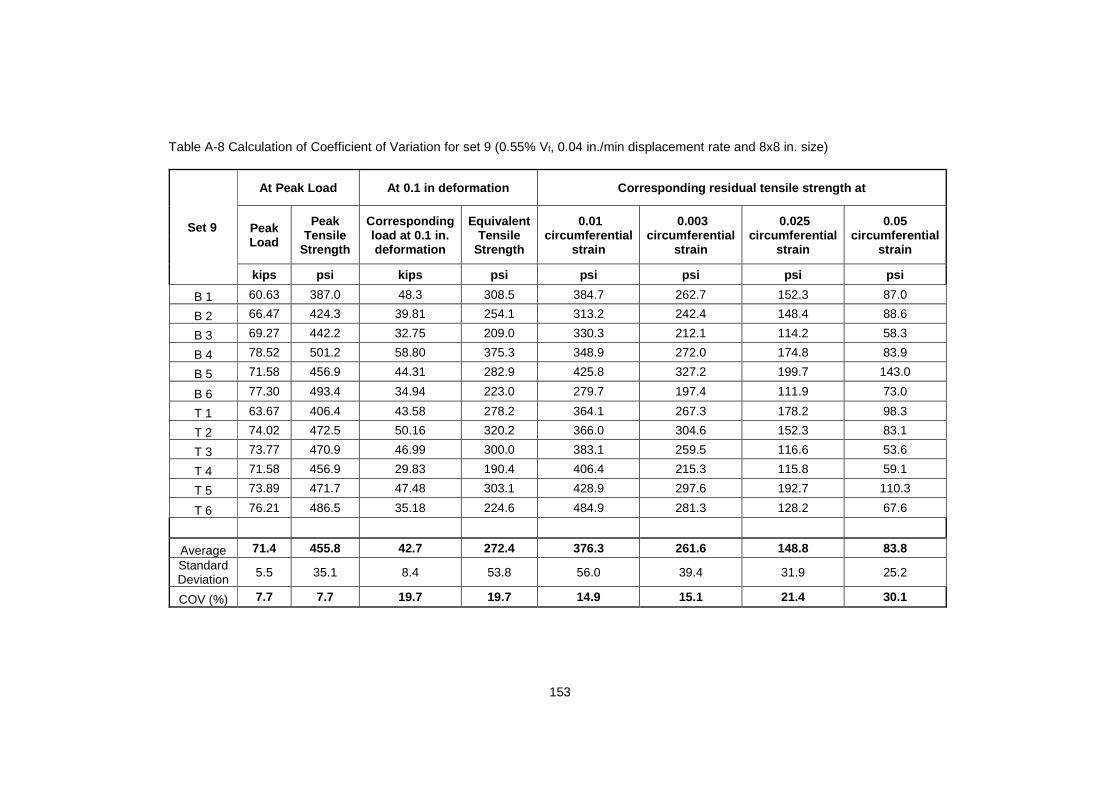
153
Table A-8 Calculation of Coefficient of Variation for set 9 (0.55% Vf, 0.04 in./min displacement rate and 8x8 in. size)
Set 9
At Peak Load At 0.1 in deformation Corresponding re sidual tensile strength at
Peak Load
Peak Tensile
Strength
Corresponding load at 0.1 in. deformation
Equivalent Tensile
Strength
0.01 circumferential
strain
0.003 circumferential
strain
0.025 circumferential
strain
0.05 circumferential
strain
kips psi kips psi psi psi psi psi
B 1 60.63 387.0 48.3 308.5 384.7 262.7 152.3 87.0
B 2 66.47 424.3 39.81 254.1 313.2 242.4 148.4 88.6
B 3 69.27 442.2 32.75 209.0 330.3 212.1 114.2 58.3
B 4 78.52 501.2 58.80 375.3 348.9 272.0 174.8 83.9
B 5 71.58 456.9 44.31 282.9 425.8 327.2 199.7 143.0
B 6 77.30 493.4 34.94 223.0 279.7 197.4 111.9 73.0
T 1 63.67 406.4 43.58 278.2 364.1 267.3 178.2 98.3
T 2 74.02 472.5 50.16 320.2 366.0 304.6 152.3 83.1
T 3 73.77 470.9 46.99 300.0 383.1 259.5 116.6 53.6
T 4 71.58 456.9 29.83 190.4 406.4 215.3 115.8 59.1
T 5 73.89 471.7 47.48 303.1 428.9 297.6 192.7 110.3
T 6 76.21 486.5 35.18 224.6 484.9 281.3 128.2 67.6
Average 71.4 455.8 42.7 272.4 376.3 261.6 148.8 83.8 Standard Deviation
5.5 35.1 8.4 53.8 56.0 39.4 31.9 25.2
COV (%) 7.7 7.7 19.7 19.7 14.9 15.1 21.4 30.1
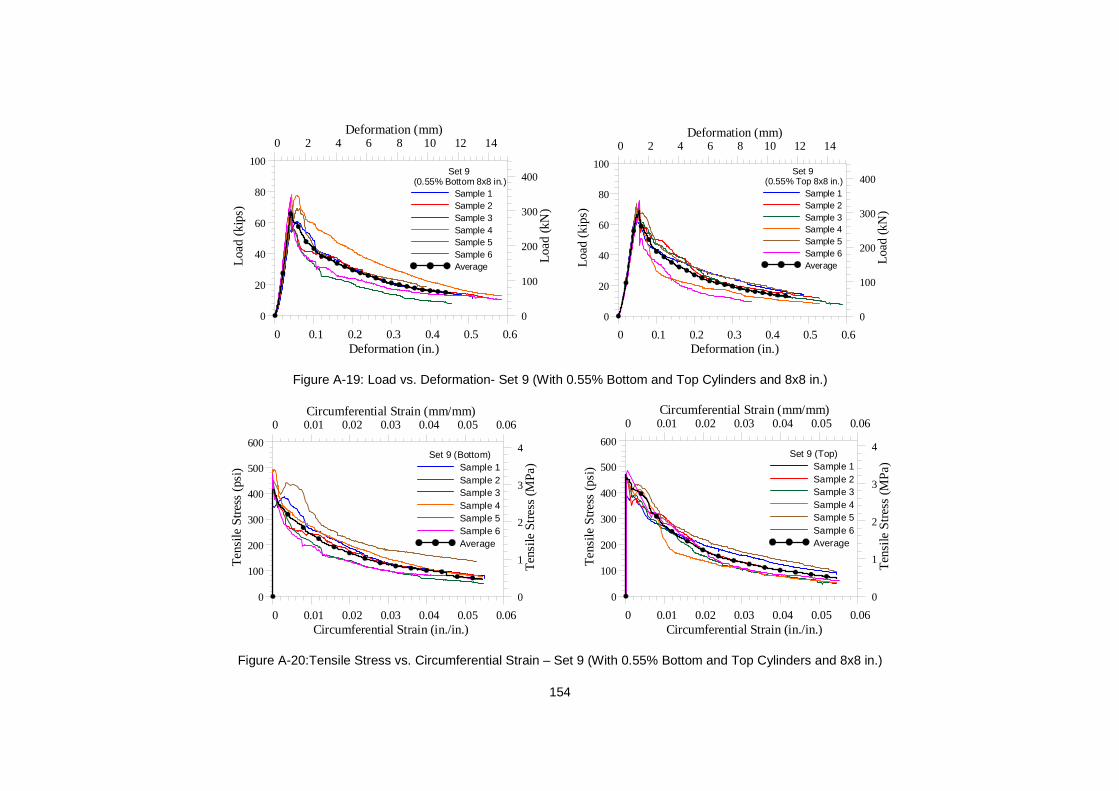
154
0 0.1 0.2 0.3 0.4 0.5 0.6Deformation (in.)
0
20
40
60
80
100
Loa
d(k
ips)
0 2 4 6 8 10 12 14Deformation (mm)
0
100
200
300
400
Loa
d (k
N)
Set 9 (0.55% Bottom 8x8 in.)
Sample 1Sample 2Sample 3Sample 4Sample 5Sample 6Average
0 0.1 0.2 0.3 0.4 0.5 0.6
Deformation (in.)
0
20
40
60
80
100
Loa
d(k
ips)
0 2 4 6 8 10 12 14Deformation (mm)
0
100
200
300
400
Loa
d (k
N)
Set 9 (0.55% Top 8x8 in.)
Sample 1Sample 2Sample 3Sample 4Sample 5Sample 6Average
Figure A-19: Load vs. Deformation- Set 9 (With 0.55% Bottom and Top Cylinders and 8x8 in.)
0 0.01 0.02 0.03 0.04 0.05 0.06Circumferential Strain (in./in.)
0
100
200
300
400
500
600
Ten
sile
Str
ess
(psi
)
0 0.01 0.02 0.03 0.04 0.05 0.06Circumferential Strain (mm/mm)
0
1
2
3
4
Ten
sile
Str
ess
(MP
a)Set 9 (Bottom)
Sample 1Sample 2Sample 3Sample 4Sample 5Sample 6Average
0 0.01 0.02 0.03 0.04 0.05 0.06Circumferential Strain (in./in.)
0
100
200
300
400
500
600
Te
nsile
Str
ess
(psi
)
0 0.01 0.02 0.03 0.04 0.05 0.06Circumferential Strain (mm/mm)
0
1
2
3
4
Ten
sile
Str
ess
(MP
a)Set 9 (Top)
Sample 1Sample 2Sample 3Sample 4Sample 5Sample 6Average
Figure A-20:Tensile Stress vs. Circumferential Strain – Set 9 (With 0.55% Bottom and Top Cylinders and 8x8 in.)

155
Appendix B
Detail calculation and graphs for Phase 2
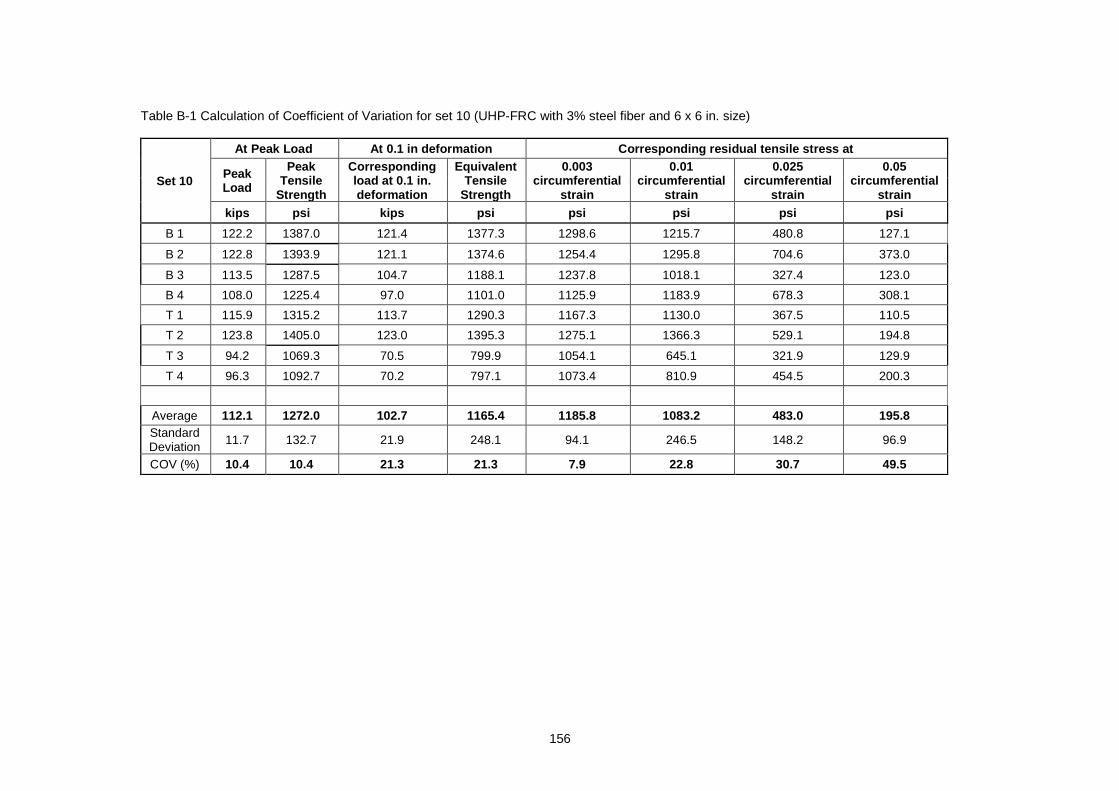
156
Table B-1 Calculation of Coefficient of Variation for set 10 (UHP-FRC with 3% steel fiber and 6 x 6 in. size)
Set 10
At Peak Load At 0.1 in deformation Corresponding re sidual tensile stress at
Peak Load
Peak Tensile
Strength
Corresponding load at 0.1 in. deformation
Equivalent Tensile
Strength
0.003 circumferential
strain
0.01 circumferential
strain
0.025 circumferential
strain
0.05 circumferential
strain kips psi kips psi psi psi psi psi
B 1 122.2 1387.0 121.4 1377.3 1298.6 1215.7 480.8 127.1
B 2 122.8 1393.9 121.1 1374.6 1254.4 1295.8 704.6 373.0
B 3 113.5 1287.5 104.7 1188.1 1237.8 1018.1 327.4 123.0
B 4 108.0 1225.4 97.0 1101.0 1125.9 1183.9 678.3 308.1
T 1 115.9 1315.2 113.7 1290.3 1167.3 1130.0 367.5 110.5
T 2 123.8 1405.0 123.0 1395.3 1275.1 1366.3 529.1 194.8
T 3 94.2 1069.3 70.5 799.9 1054.1 645.1 321.9 129.9
T 4 96.3 1092.7 70.2 797.1 1073.4 810.9 454.5 200.3
Average 112.1 1272.0 102.7 1165.4 1185.8 1083.2 483.0 195.8 Standard Deviation 11.7 132.7 21.9 248.1 94.1 246.5 148.2 96.9
COV (%) 10.4 10.4 21.3 21.3 7.9 22.8 30.7 49.5

157
0 0.1 0.2 0.3 0.4 0.5Deformation (in.)
0
50
100
150
Loa
d(k
ips)
0 2 4 6 8 10 12Deformation (mm)
0
200
400
600
Loa
d (k
N)
3% Steel (Bottom) Set 10
Sample 1Sample 2Sample 3Sample 4Average
0 0.1 0.2 0.3 0.4 0.5
Deformation (in.)
0
50
100
150
Loa
d(k
ips)
0 2 4 6 8 10 12Deformation (mm)
0
200
400
600
Loa
d (k
N)
3% Steel (Top)Set 10
Sample 1Sample 2Sample 3Sample 4Average
Figure B-1: Load vs. Deformation – Set 10 (With 3% Steel fibers Bottom and Top Cylinders)
0 0.01 0.02 0.03 0.04 0.05 0.06Circumferential Strain (in./in.)
0
300
600
900
1200
1500
1800
Te
nsile
Str
ess
(psi
)
0 0.01 0.02 0.03 0.04 0.05 0.06Circumferential Strain (mm/mm)
0
2
4
6
8
10
12
Ten
sile
Str
ess
(MP
a)3% Steel - Set 10
(Bottom- 6x6 inch)Sample 1Sample 2Sample 3Sample 4Average
0 0.01 0.02 0.03 0.04 0.05 0.06Circumferential Strain (in./in.)
0
300
600
900
1200
1500
1800
Te
nsile
Str
ess
(psi
)
0 0.01 0.02 0.03 0.04 0.05 0.06Circumferential Strain (mm/mm)
0
2
4
6
8
10
12
Ten
sile
Str
ess
(MP
a)3% Steel - Set 10
(Top- 6x6 inch)Sample 1Sample 2Sample 3Sample 4Average
Figure B-2:Tensile Stress vs. Circumferential Strain – Set 10 (With 3% steel fibers Bottom and Top Cylinders)
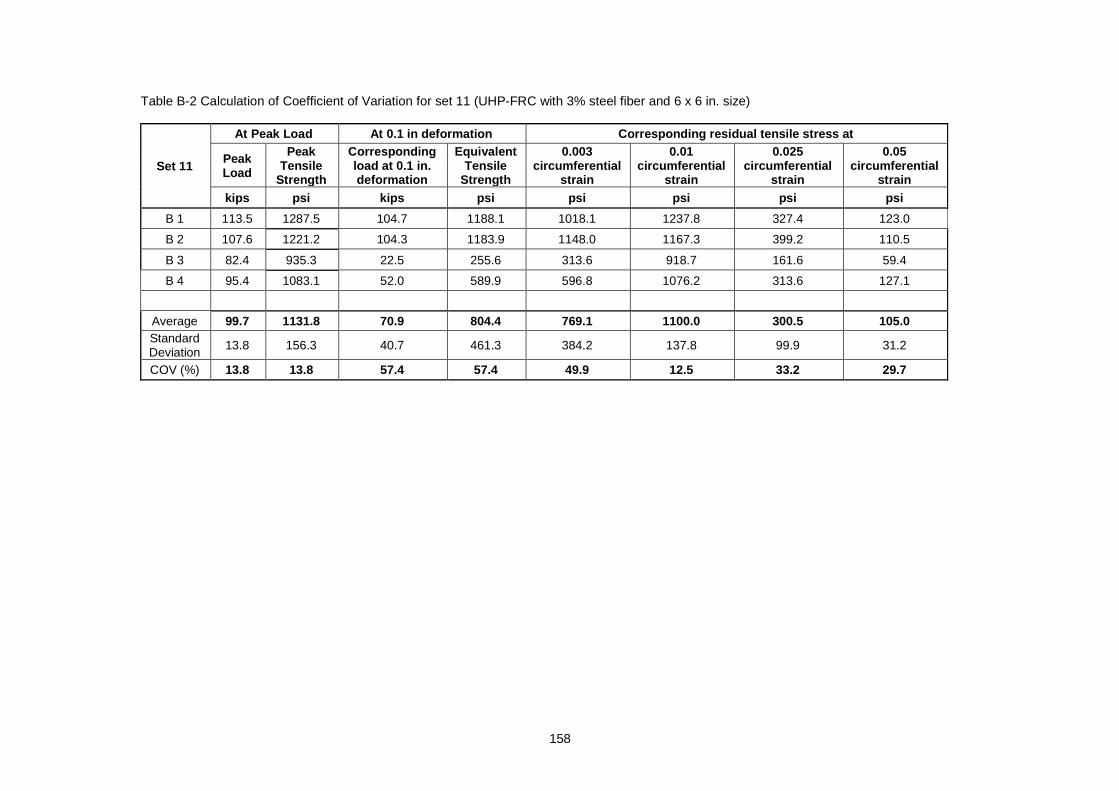
158
Table B-2 Calculation of Coefficient of Variation for set 11 (UHP-FRC with 3% steel fiber and 6 x 6 in. size)
Set 11
At Peak Load At 0.1 in deformation Corresponding re sidual tensile stress at
Peak Load
Peak Tensile
Strength
Corresponding load at 0.1 in. deformation
Equivalent Tensile
Strength
0.003 circumferential
strain
0.01 circumferential
strain
0.025 circumferential
strai n
0.05 circumferential
strain kips psi kips psi psi psi psi psi
B 1 113.5 1287.5 104.7 1188.1 1018.1 1237.8 327.4 123.0
B 2 107.6 1221.2 104.3 1183.9 1148.0 1167.3 399.2 110.5
B 3 82.4 935.3 22.5 255.6 313.6 918.7 161.6 59.4
B 4 95.4 1083.1 52.0 589.9 596.8 1076.2 313.6 127.1
Average 99.7 1131.8 70.9 804.4 769.1 1100.0 300.5 105.0 Standard Deviation
13.8 156.3 40.7 461.3 384.2 137.8 99.9 31.2
COV (%) 13.8 13.8 57.4 57.4 49.9 12.5 33.2 29.7
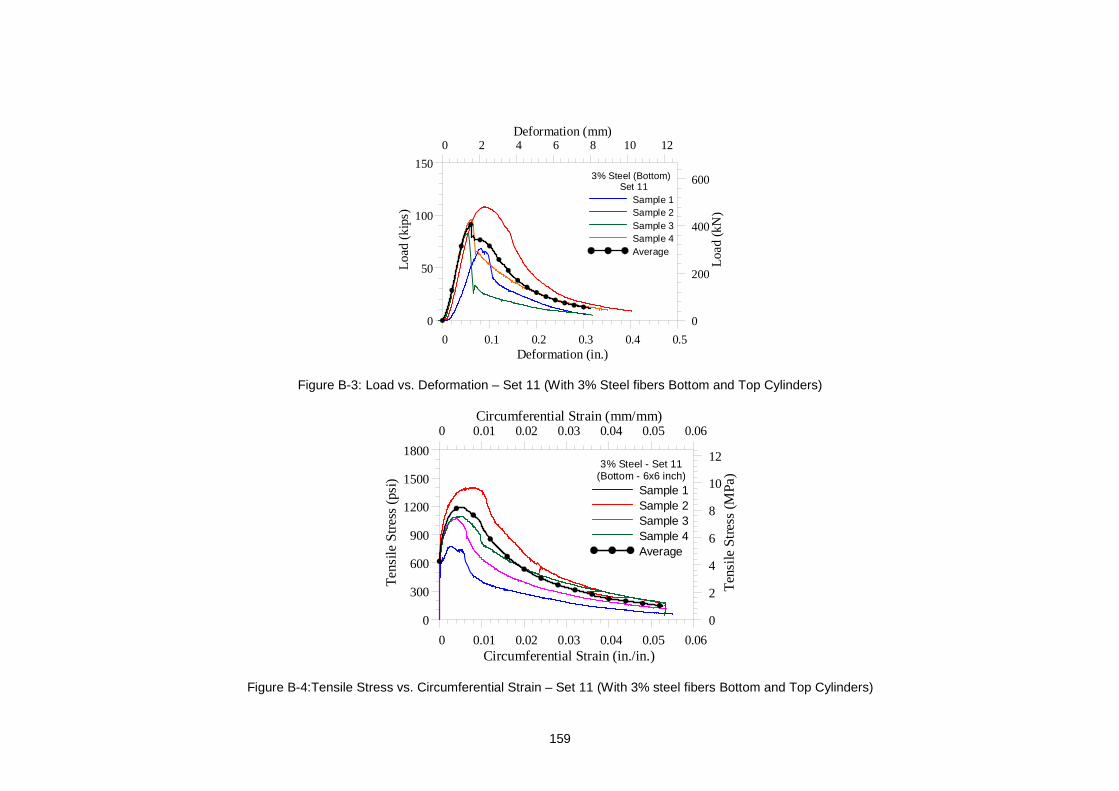
159
0 0.1 0.2 0.3 0.4 0.5Deformation (in.)
0
50
100
150
Loa
d(k
ips)
0 2 4 6 8 10 12Deformation (mm)
0
200
400
600
Loa
d (k
N)
3% Steel (Bottom) Set 11
Sample 1Sample 2Sample 3Sample 4Average
Figure B-3: Load vs. Deformation – Set 11 (With 3% Steel fibers Bottom and Top Cylinders)
0 0.01 0.02 0.03 0.04 0.05 0.06Circumferential Strain (in./in.)
0
300
600
900
1200
1500
1800
Te
nsile
Str
ess
(psi
)
0 0.01 0.02 0.03 0.04 0.05 0.06Circumferential Strain (mm/mm)
0
2
4
6
8
10
12
Ten
sile
Str
ess
(MP
a)3% Steel - Set 11
(Bottom - 6x6 inch)Sample 1Sample 2Sample 3Sample 4Average
Figure B-4:Tensile Stress vs. Circumferential Strain – Set 11 (With 3% steel fibers Bottom and Top Cylinders)
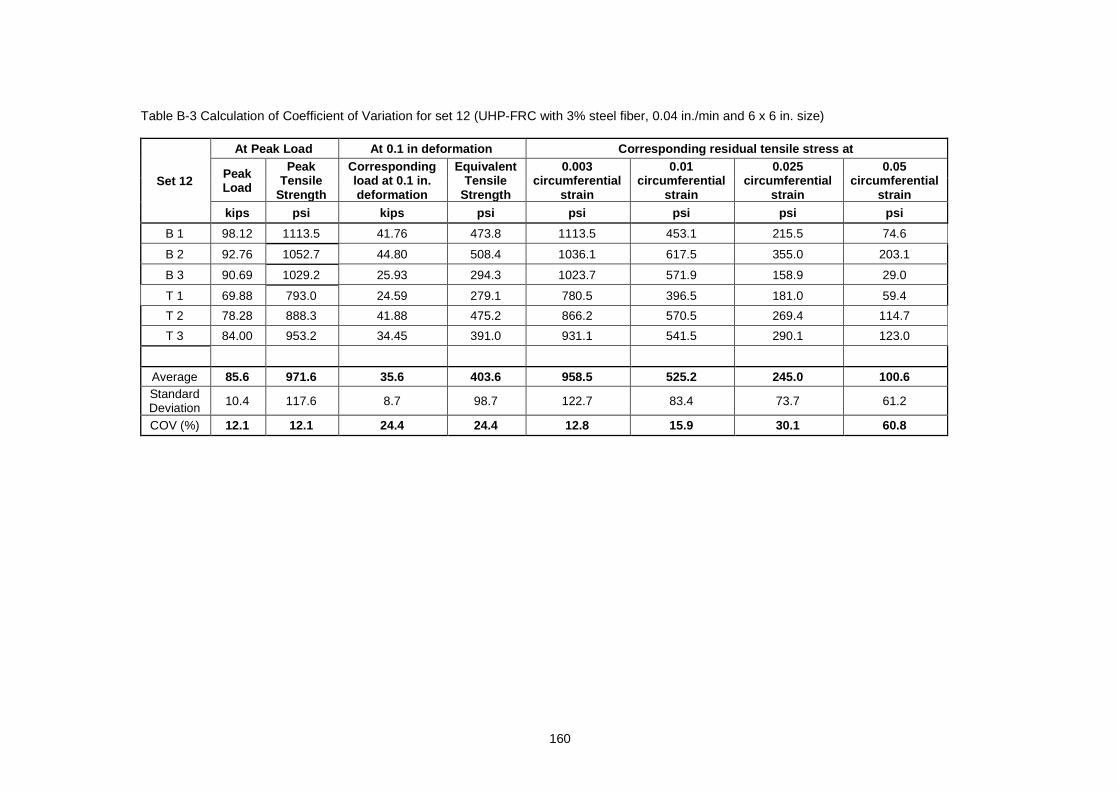
160
Table B-3 Calculation of Coefficient of Variation for set 12 (UHP-FRC with 3% steel fiber, 0.04 in./min and 6 x 6 in. size)
Set 12
At Peak Load At 0.1 in deformation Corresponding re sidual tensile stress at
Peak Load
Peak Tensile
Strength
Corresponding load at 0.1 in. deformation
Equivalent Tensile
Strength
0.003 circumferential
strain
0.01 circumferential
strain
0.025 circumferential
strain
0.05 circumferential
strain kips psi kips psi psi psi psi psi
B 1 98.12 1113.5 41.76 473.8 1113.5 453.1 215.5 74.6
B 2 92.76 1052.7 44.80 508.4 1036.1 617.5 355.0 203.1
B 3 90.69 1029.2 25.93 294.3 1023.7 571.9 158.9 29.0
T 1 69.88 793.0 24.59 279.1 780.5 396.5 181.0 59.4
T 2 78.28 888.3 41.88 475.2 866.2 570.5 269.4 114.7
T 3 84.00 953.2 34.45 391.0 931.1 541.5 290.1 123.0
Average 85.6 971.6 35.6 403.6 958.5 525.2 245.0 100.6 Standard Deviation 10.4 117.6 8.7 98.7 122.7 83.4 73.7 61.2
COV (%) 12.1 12.1 24.4 24.4 12.8 15.9 30.1 60.8
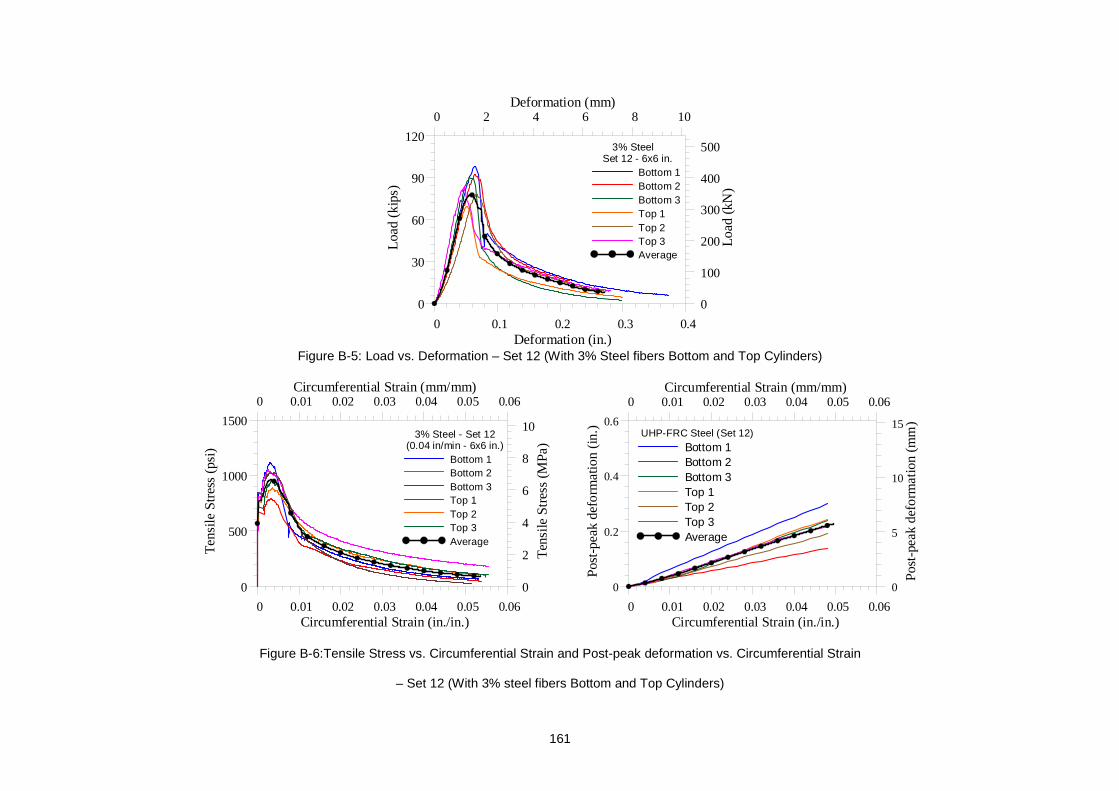
161
0 0.1 0.2 0.3 0.4Deformation (in.)
0
30
60
90
120
Loa
d(k
ips)
0 2 4 6 8 10Deformation (mm)
0
100
200
300
400
500
Load
(kN
)
3% Steel Set 12 - 6x6 in.
Bottom 1Bottom 2Bottom 3Top 1Top 2Top 3Average
Figure B-5: Load vs. Deformation – Set 12 (With 3% Steel fibers Bottom and Top Cylinders)
0 0.01 0.02 0.03 0.04 0.05 0.06Circumferential Strain (in./in.)
0
500
1000
1500
Te
nsile
Str
ess
(psi
)
0 0.01 0.02 0.03 0.04 0.05 0.06Circumferential Strain (mm/mm)
0
2
4
6
8
10
Ten
sile
Str
ess
(MP
a)3% Steel - Set 12
(0.04 in/min - 6x6 in.)Bottom 1Bottom 2Bottom 3Top 1Top 2Top 3Average
0 0.01 0.02 0.03 0.04 0.05 0.06Circumferential Strain (in./in.)
0
0.2
0.4
0.6
Pos
t-pe
ak
def
orm
atio
n (i
n.)
0 0.01 0.02 0.03 0.04 0.05 0.06Circumferential Strain (mm/mm)
0
5
10
15
Pos
t-pe
ak
def
orm
atio
n (m
m)
UHP-FRC Steel (Set 12)Bottom 1Bottom 2Bottom 3Top 1Top 2Top 3Average
Figure B-6:Tensile Stress vs. Circumferential Strain and Post-peak deformation vs. Circumferential Strain
– Set 12 (With 3% steel fibers Bottom and Top Cylinders)
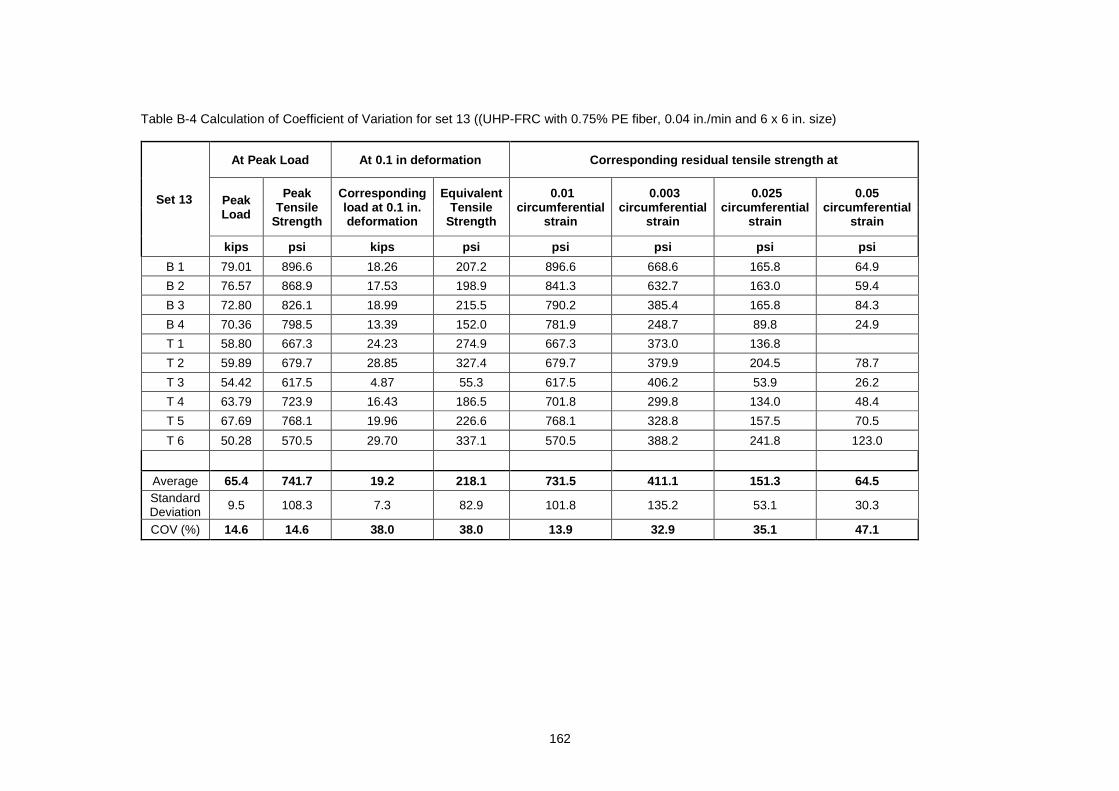
162
Table B-4 Calculation of Coefficient of Variation for set 13 ((UHP-FRC with 0.75% PE fiber, 0.04 in./min and 6 x 6 in. size)
Set 13
At Peak Load At 0.1 in deformation Corresponding re sidual tensile strength at
Peak Load
Peak Tensile
Strength
Corresponding load at 0.1 in. deformation
Equivalent Tensile
Strength
0.01 circumferential
strain
0.003 circumferential
strain
0.025 circumferential
strain
0.05 circumferential
strain
kips psi kips psi psi psi psi psi
B 1 79.01 896.6 18.26 207.2 896.6 668.6 165.8 64.9
B 2 76.57 868.9 17.53 198.9 841.3 632.7 163.0 59.4
B 3 72.80 826.1 18.99 215.5 790.2 385.4 165.8 84.3
B 4 70.36 798.5 13.39 152.0 781.9 248.7 89.8 24.9
T 1 58.80 667.3 24.23 274.9 667.3 373.0 136.8
T 2 59.89 679.7 28.85 327.4 679.7 379.9 204.5 78.7
T 3 54.42 617.5 4.87 55.3 617.5 406.2 53.9 26.2
T 4 63.79 723.9 16.43 186.5 701.8 299.8 134.0 48.4
T 5 67.69 768.1 19.96 226.6 768.1 328.8 157.5 70.5
T 6 50.28 570.5 29.70 337.1 570.5 388.2 241.8 123.0
Average 65.4 741.7 19.2 218.1 731.5 411.1 151.3 64.5 Standard Deviation 9.5 108.3 7.3 82.9 101.8 135.2 53.1 30.3
COV (%) 14.6 14.6 38.0 38.0 13.9 32.9 35.1 47.1
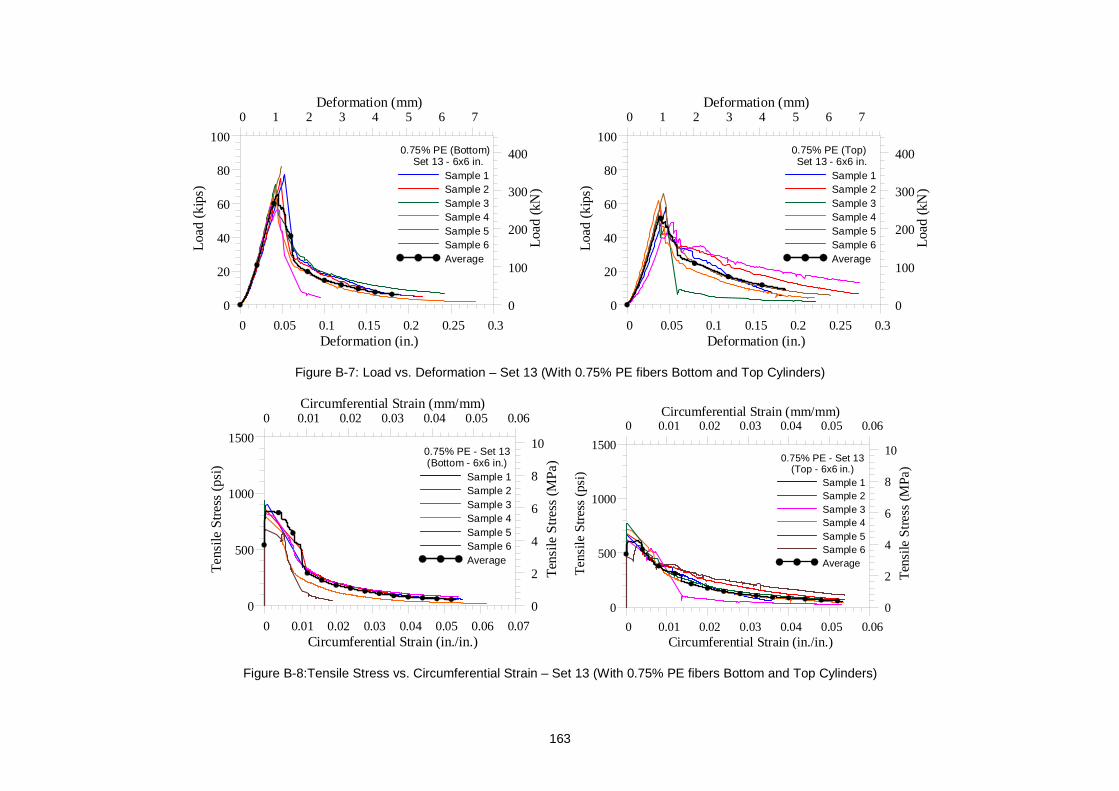
163
0 0.05 0.1 0.15 0.2 0.25 0.3Deformation (in.)
0
20
40
60
80
100
Loa
d(k
ips)
0 1 2 3 4 5 6 7Deformation (mm)
0
100
200
300
400
Loa
d (k
N)
0.75% PE (Bottom) Set 13 - 6x6 in.
Sample 1Sample 2Sample 3Sample 4Sample 5Sample 6Average
0 0.05 0.1 0.15 0.2 0.25 0.3Deformation (in.)
0
20
40
60
80
100
Loa
d(k
ips)
0 1 2 3 4 5 6 7Deformation (mm)
0
100
200
300
400
Loa
d (k
N)
0.75% PE (Top) Set 13 - 6x6 in.
Sample 1Sample 2Sample 3Sample 4Sample 5Sample 6Average
Figure B-7: Load vs. Deformation – Set 13 (With 0.75% PE fibers Bottom and Top Cylinders)
0 0.01 0.02 0.03 0.04 0.05 0.06 0.07Circumferential Strain (in./in.)
0
500
1000
1500
Te
nsile
Str
ess
(psi
)
0 0.01 0.02 0.03 0.04 0.05 0.06Circumferential Strain (mm/mm)
0
2
4
6
8
10
Ten
sile
Str
ess
(MP
a)0.75% PE - Set 13
(Bottom - 6x6 in.)Sample 1Sample 2Sample 3Sample 4Sample 5Sample 6Average
0 0.01 0.02 0.03 0.04 0.05 0.06Circumferential Strain (in./in.)
0
500
1000
1500
Te
nsile
Str
ess
(psi
)
0 0.01 0.02 0.03 0.04 0.05 0.06Circumferential Strain (mm/mm)
0
2
4
6
8
10
Ten
sile
Str
ess
(MP
a)0.75% PE - Set 13
(Top - 6x6 in.)Sample 1Sample 2Sample 3Sample 4Sample 5Sample 6Average
Figure B-8:Tensile Stress vs. Circumferential Strain – Set 13 (With 0.75% PE fibers Bottom and Top Cylinders)
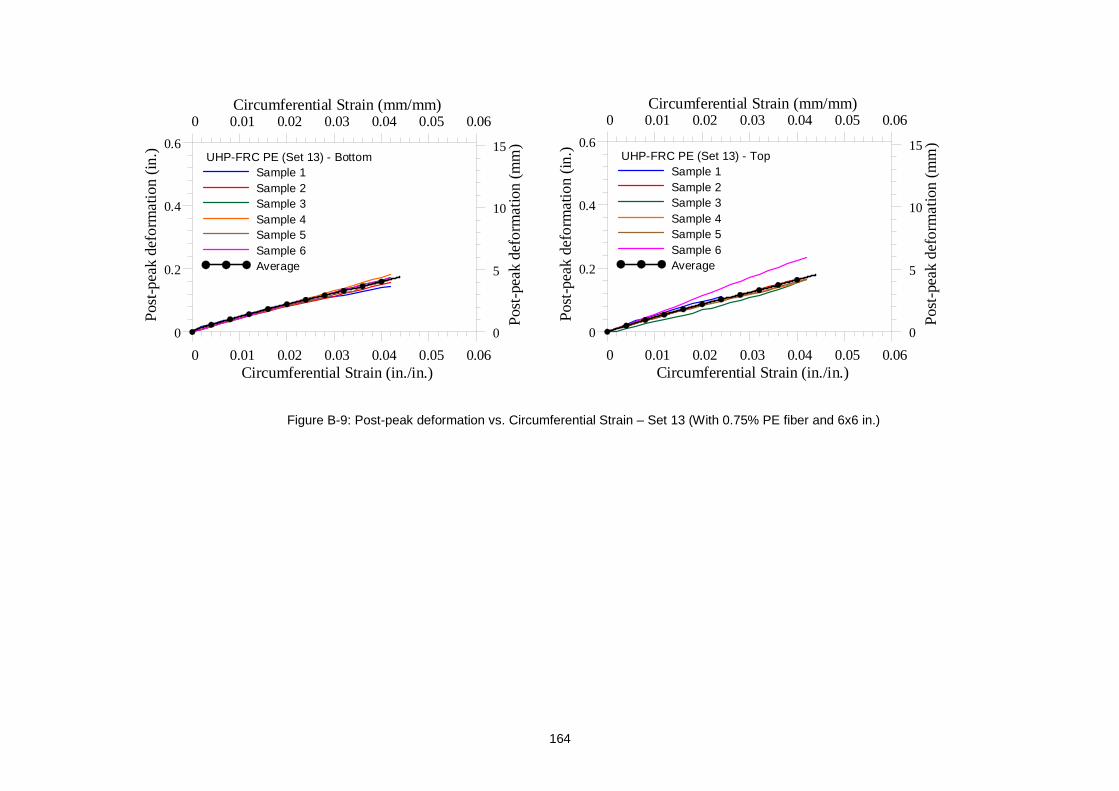
164
0 0.01 0.02 0.03 0.04 0.05 0.06Circumferential Strain (in./in.)
0
0.2
0.4
0.6P
ost-
pea
k d
efo
rma
tion
(in
.)
0 0.01 0.02 0.03 0.04 0.05 0.06Circumferential Strain (mm/mm)
0
5
10
15
Pos
t-pe
ak
def
orm
atio
n (m
m)
UHP-FRC PE (Set 13) - BottomSample 1Sample 2Sample 3Sample 4Sample 5Sample 6Average
0 0.01 0.02 0.03 0.04 0.05 0.06Circumferential Strain (in./in.)
0
0.2
0.4
0.6
Pos
t-pe
ak
def
orm
atio
n (i
n.)
0 0.01 0.02 0.03 0.04 0.05 0.06Circumferential Strain (mm/mm)
0
5
10
15
Pos
t-pe
ak
def
orm
atio
n (m
m)
UHP-FRC PE (Set 13) - TopSample 1Sample 2Sample 3Sample 4Sample 5Sample 6Average
Figure B-9: Post-peak deformation vs. Circumferential Strain – Set 13 (With 0.75% PE fiber and 6x6 in.)
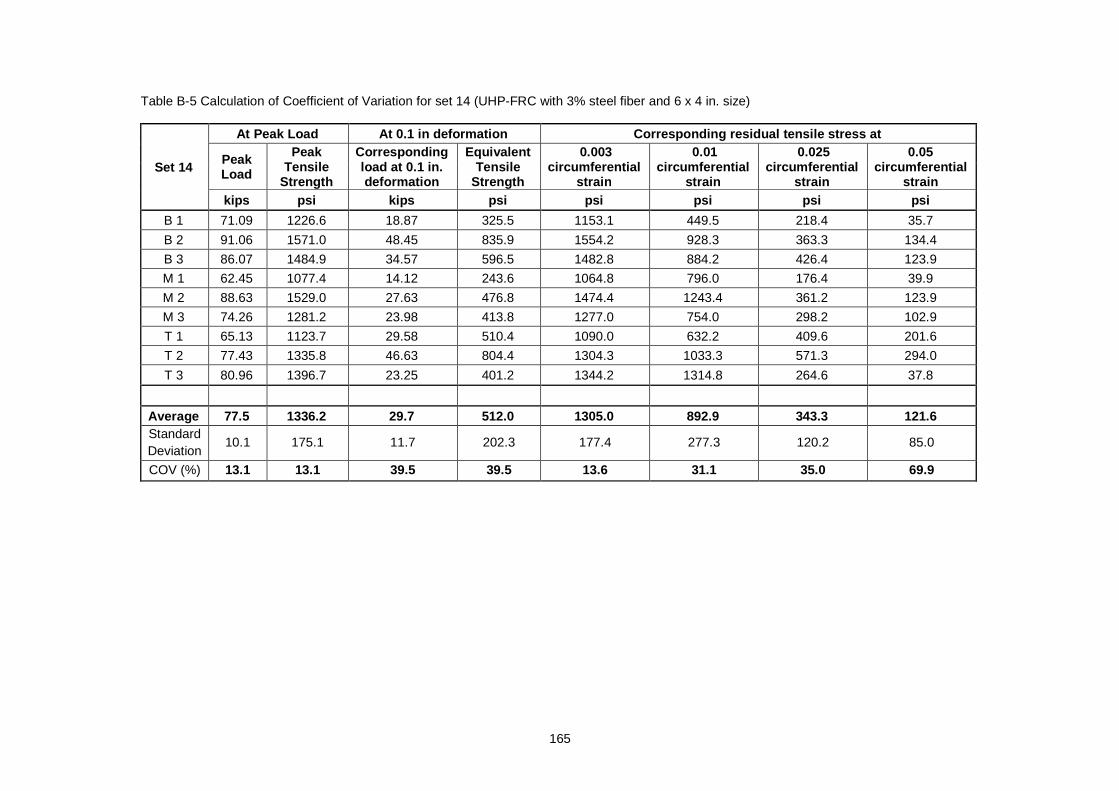
165
Table B-5 Calculation of Coefficient of Variation for set 14 (UHP-FRC with 3% steel fiber and 6 x 4 in. size)
Set 14
At Peak Load At 0.1 in deformation Corresponding re sidual tensile stress at
Peak Load
Peak Tensile
Strength
Corresponding load at 0.1 in. deformation
Equivalent Tensile
Strength
0.003 circumferential
strain
0.01 circumferential
strain
0.025 circumferential
strain
0.05 circumferential
strain kips psi kips psi psi psi psi psi
B 1 71.09 1226.6 18.87 325.5 1153.1 449.5 218.4 35.7
B 2 91.06 1571.0 48.45 835.9 1554.2 928.3 363.3 134.4
B 3 86.07 1484.9 34.57 596.5 1482.8 884.2 426.4 123.9
M 1 62.45 1077.4 14.12 243.6 1064.8 796.0 176.4 39.9
M 2 88.63 1529.0 27.63 476.8 1474.4 1243.4 361.2 123.9
M 3 74.26 1281.2 23.98 413.8 1277.0 754.0 298.2 102.9
T 1 65.13 1123.7 29.58 510.4 1090.0 632.2 409.6 201.6
T 2 77.43 1335.8 46.63 804.4 1304.3 1033.3 571.3 294.0
T 3 80.96 1396.7 23.25 401.2 1344.2 1314.8 264.6 37.8
Average 77.5 1336.2 29.7 512.0 1305.0 892.9 343.3 1 21.6 Standard Deviation
10.1 175.1 11.7 202.3 177.4 277.3 120.2 85.0
COV (%) 13.1 13.1 39.5 39.5 13.6 31.1 35.0 69.9
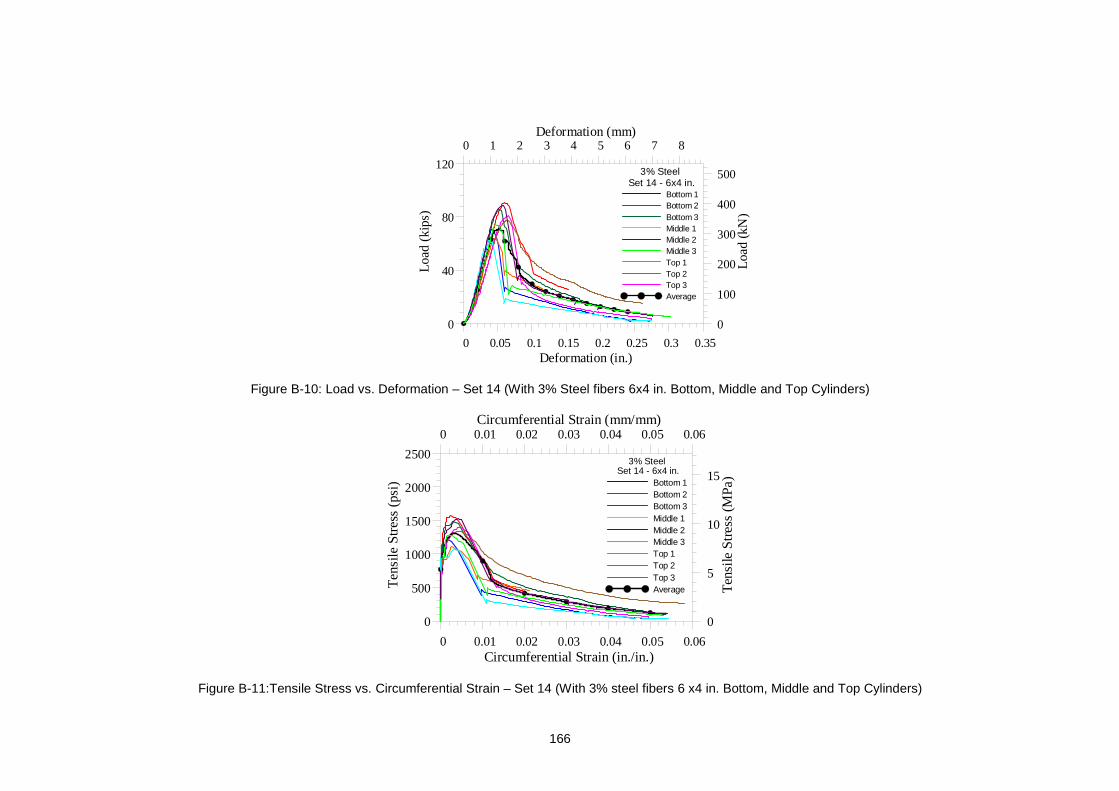
166
0 0.05 0.1 0.15 0.2 0.25 0.3 0.35Deformation (in.)
0
40
80
120
Load
(kip
s)
0 1 2 3 4 5 6 7 8Deformation (mm)
0
100
200
300
400
500
Loa
d (k
N)
3% SteelSet 14 - 6x4 in.
Bottom 1Bottom 2Bottom 3Middle 1Middle 2Middle 3Top 1Top 2Top 3Average
Figure B-10: Load vs. Deformation – Set 14 (With 3% Steel fibers 6x4 in. Bottom, Middle and Top Cylinders)
0 0.01 0.02 0.03 0.04 0.05 0.06Circumferential Strain (in./in.)
0
500
1000
1500
2000
2500
Ten
sile
Str
ess
(psi
)
0 0.01 0.02 0.03 0.04 0.05 0.06Circumferential Strain (mm/mm)
0
5
10
15
Ten
sile
Str
ess
(MP
a)3% Steel
Set 14 - 6x4 in.Bottom 1Bottom 2Bottom 3Middle 1Middle 2Middle 3Top 1Top 2Top 3Average
Figure B-11:Tensile Stress vs. Circumferential Strain – Set 14 (With 3% steel fibers 6 x4 in. Bottom, Middle and Top Cylinders)

167
Table B-6: Calculation of Coefficient of Variation for set 15 (UHP-FRC with 0.75% PE fiber and 6 x 4 in. size)
Set 15
At Peak Load At 0.1 in deformation Corresponding re sidual tensile stress at
Peak Load
Peak Tensile
Strength
Corresponding load at 0.1 in. deformation
Equivalent Tensile
Strength
0.003 circumferential
strain
0.01 circumferential
strain
0.025 circumferential
strain
0.05 circumferential
strain kips psi kips psi psi psi psi psi
B 2 48.09 829.6 11.08 191.1 810.7 319.2 134.4 60.9
B 3 50.03 863.2 14.49 249.9 817.0 399.1 193.2 42.0
B 4 51.62 890.5 5.36 92.4 884.2 747.7 96.6 56.7
M 2 55.15 951.4 10.96 189.0 951.4 315.0 142.8 46.2
M 3 53.32 919.9 4.87 84.0 911.5 640.6 84.0 31.5
M 4 55.51 957.7 8.28 142.8 688.9 277.2 123.9 52.5
T 2 50.40 869.5 8.40 144.9 835.9 273.0 138.6 31.5
T 3 46.87 808.6 11.20 193.2 749.8 344.4 151.2 42.0
T 4 31.29 539.8 15.70 270.9 520.9 344.4 193.2 81.9
Average 49.1 847.8 10.0 173.2 796.7 406.8 139.8 49. 5 Standard Deviation 7.3 126.1 3.7 63.9 130.8 169.4 37.3 15.9
COV (%) 14.9 14.9 36.9 36.9 16.4 41.6 26.7 32.1
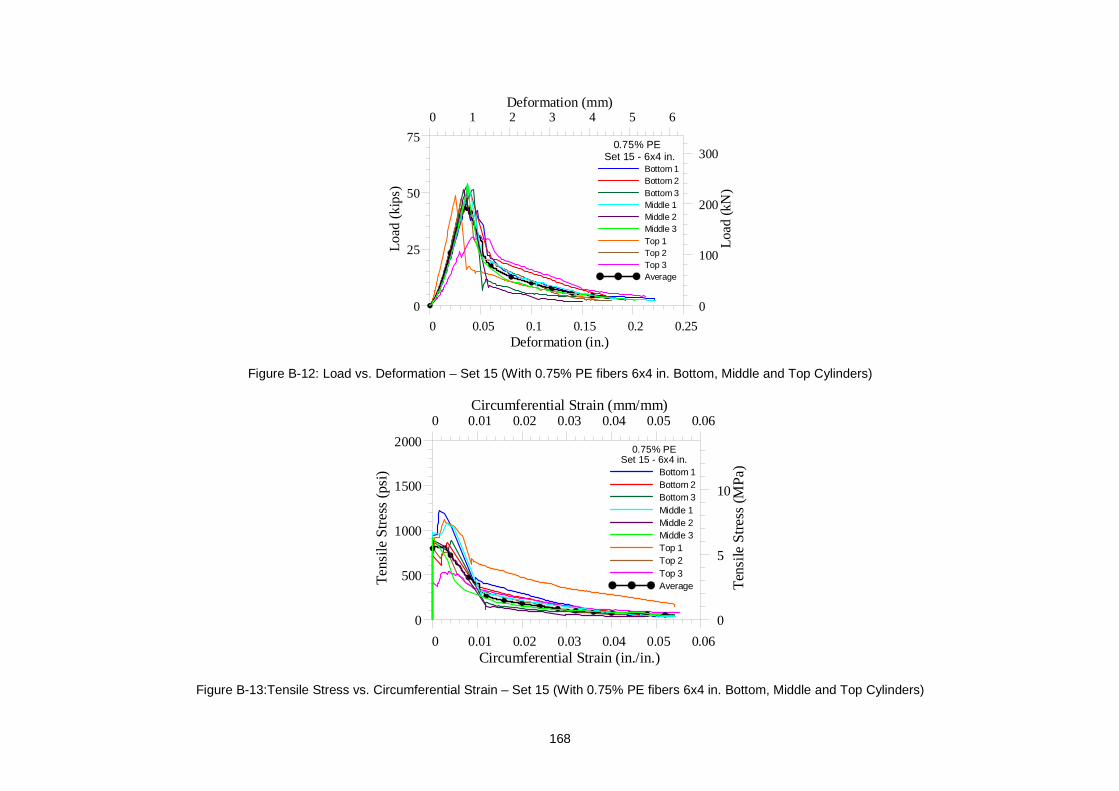
168
0 0.05 0.1 0.15 0.2 0.25Deformation (in.)
0
25
50
75
Loa
d(k
ips)
0 1 2 3 4 5 6Deformation (mm)
0
100
200
300
Loa
d (k
N)
0.75% PE Set 15 - 6x4 in.
Bottom 1Bottom 2Bottom 3Middle 1Middle 2Middle 3Top 1Top 2Top 3Average
Figure B-12: Load vs. Deformation – Set 15 (With 0.75% PE fibers 6x4 in. Bottom, Middle and Top Cylinders)
0 0.01 0.02 0.03 0.04 0.05 0.06Circumferential Strain (in./in.)
0
500
1000
1500
2000
Te
nsile
Str
ess
(psi
)
0 0.01 0.02 0.03 0.04 0.05 0.06Circumferential Strain (mm/mm)
0
5
10
Ten
sile
Str
ess
(MP
a)0.75% PE
Set 15 - 6x4 in.Bottom 1Bottom 2Bottom 3Middle 1Middle 2Middle 3Top 1Top 2Top 3Average
Figure B-13:Tensile Stress vs. Circumferential Strain – Set 15 (With 0.75% PE fibers 6x4 in. Bottom, Middle and Top Cylinders)
169
Appendix C
ASTM Draft Ballot for Standardization of Double Punch Test
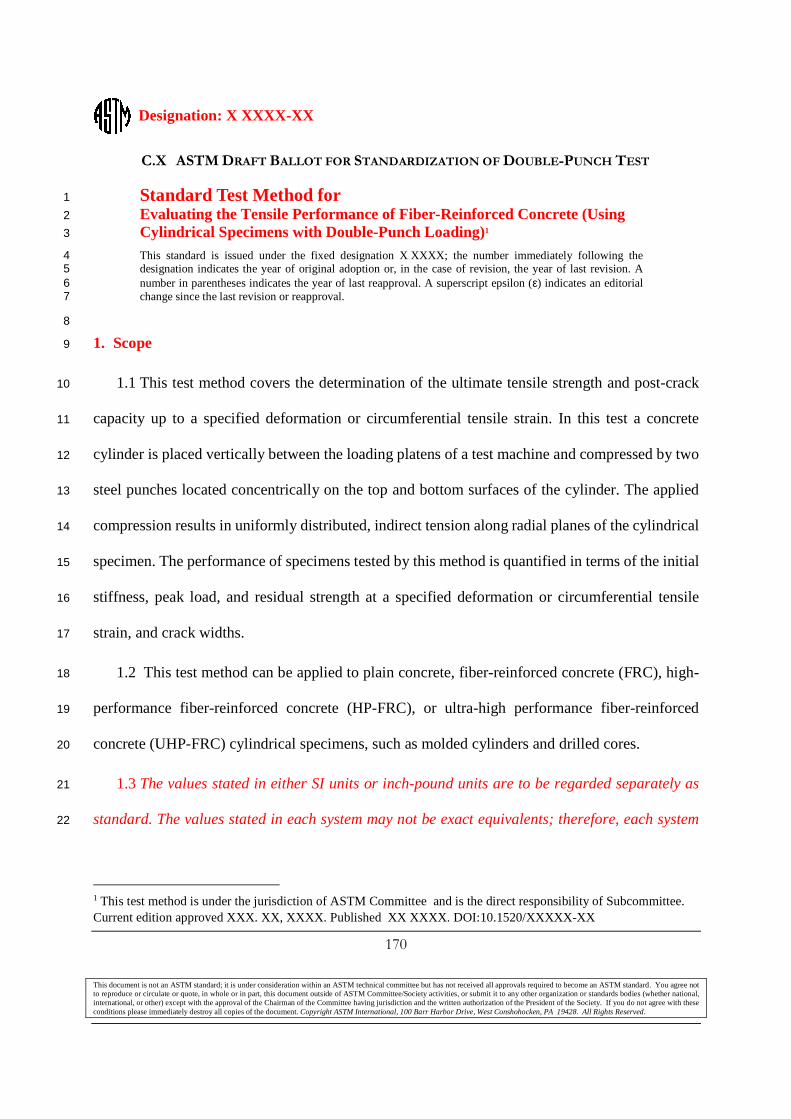
Designation: X XXXX-XX
170
This document is not an ASTM standard; it is under consideration within an ASTM technical committee but has not received all approvals required to become an ASTM standard. You agree not to reproduce or circulate or quote, in whole or in part, this document outside of ASTM Committee/Society activities, or submit it to any other organization or standards bodies (whether national, international, or other) except with the approval of the Chairman of the Committee having jurisdiction and the written authorization of the President of the Society. If you do not agree with these conditions please immediately destroy all copies of the document. Copyright ASTM International, 100 Barr Harbor Drive, West Conshohocken, PA 19428. All Rights Reserved.
Standard Test Method for 1
Evaluating the Tensile Performance of Fiber-Reinforced Concrete (Using 2
Cylindrical Specimens with Double-Punch Loading)1 3
This standard is issued under the fixed designation X XXXX; the number immediately following the 4 designation indicates the year of original adoption or, in the case of revision, the year of last revision. A 5 number in parentheses indicates the year of last reapproval. A superscript epsilon (ε) indicates an editorial 6 change since the last revision or reapproval. 7
8
1. Scope 9
1.1 This test method covers the determination of the ultimate tensile strength and post-crack 10
capacity up to a specified deformation or circumferential tensile strain. In this test a concrete 11
cylinder is placed vertically between the loading platens of a test machine and compressed by two 12
steel punches located concentrically on the top and bottom surfaces of the cylinder. The applied 13
compression results in uniformly distributed, indirect tension along radial planes of the cylindrical 14
specimen. The performance of specimens tested by this method is quantified in terms of the initial 15
stiffness, peak load, and residual strength at a specified deformation or circumferential tensile 16
strain, and crack widths. 17
1.2 This test method can be applied to plain concrete, fiber-reinforced concrete (FRC), high-18
performance fiber-reinforced concrete (HP-FRC), or ultra-high performance fiber-reinforced 19
concrete (UHP-FRC) cylindrical specimens, such as molded cylinders and drilled cores. 20
1.3 The values stated in either SI units or inch-pound units are to be regarded separately as 21
standard. The values stated in each system may not be exact equivalents; therefore, each system 22
1 This test method is under the jurisdiction of ASTM Committee and is the direct responsibility of Subcommittee. Current edition approved XXX. XX, XXXX. Published XX XXXX. DOI:10.1520/XXXXX-XX
C.X ASTM DRAFT BALLOT FOR STANDARDIZATION OF DOUBLE-PUNCH TEST

X XXXX
171
shall be used independently of the other. Combining values from the two systems may result in 23
non-conformance with the standard. 24
1.4 This standard does not purport to address all of the safety concerns, if any, associated 25
with its use. It is the responsibility of the user of this standard to establish appropriate safety and 26
health practices and determine the applicability of regulatory limitations prior to use. 27
2. Referenced Documents 28
2.1 ASTM Standards: 29
C31/C31M Practice for Making and Curing Concrete Test Specimens in the Field 30
C39/C39M Test Method for Compressive Strength of Cylindrical Concrete Specimens 31
C42/C42M Test Method for Obtaining and Testing Drilled Cores and Sawed Beams of Concrete 32
C172 Practice for Sampling Freshly Mixed Concrete 33
C192/C192M Practice for Making and Curing Concrete Test Specimens in the Laboratory 34
C496/C496M Test Method for Splitting Tensile Strength of Cylindrical Concrete Specimens 35
C823 Practice for Examination and Sampling of Hardened Concrete in Constructions 36
C1609/C1609M Test Method for Flexural Performance of Fiber-Reinforced Concrete (Using 37 Beam with Third-Point Loading) 38
C1399/C1399M Test Method for Obtaining Average Residual-Strength of Fiber-Reinforced 39 Concrete 40
3. Terminology 41
3.1 Definitions: 42
3.1.1 circumferential strain after peak εP, the circumferential strain obtained at specified 43
deformation after peak. 44
3.1.2 deformation at peak load, δ0, the net deformation value on the load-deformation curve 45
at peak load. 46
3.1.3 peak load, Pp, the maximum load on the load-deformation curve. 47
3.1.4 total vertical deformation, δ, the corrected vertical deformations in reloading phase and 48
post peak phase. 49
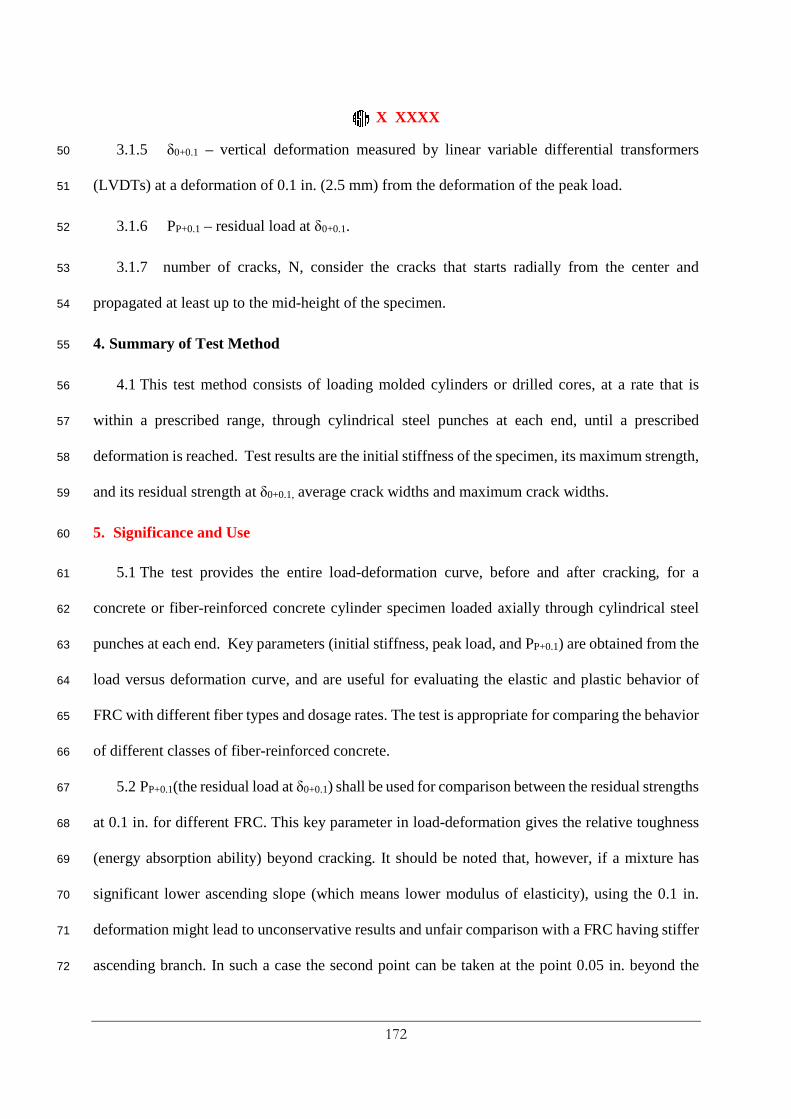
X XXXX
172
3.1.5 δ0+0.1 – vertical deformation measured by linear variable differential transformers 50
(LVDTs) at a deformation of 0.1 in. (2.5 mm) from the deformation of the peak load. 51
3.1.6 PP+0.1 – residual load at δ0+0.1. 52
3.1.7 number of cracks, N, consider the cracks that starts radially from the center and 53
propagated at least up to the mid-height of the specimen. 54
4. Summary of Test Method 55
4.1 This test method consists of loading molded cylinders or drilled cores, at a rate that is 56
within a prescribed range, through cylindrical steel punches at each end, until a prescribed 57
deformation is reached. Test results are the initial stiffness of the specimen, its maximum strength, 58
and its residual strength at δ0+0.1, average crack widths and maximum crack widths. 59
5. Significance and Use 60
5.1 The test provides the entire load-deformation curve, before and after cracking, for a 61
concrete or fiber-reinforced concrete cylinder specimen loaded axially through cylindrical steel 62
punches at each end. Key parameters (initial stiffness, peak load, and PP+0.1) are obtained from the 63
load versus deformation curve, and are useful for evaluating the elastic and plastic behavior of 64
FRC with different fiber types and dosage rates. The test is appropriate for comparing the behavior 65
of different classes of fiber-reinforced concrete. 66
5.2 PP+0.1(the residual load at δ0+0.1) shall be used for comparison between the residual strengths 67
at 0.1 in. for different FRC. This key parameter in load-deformation gives the relative toughness 68
(energy absorption ability) beyond cracking. It should be noted that, however, if a mixture has 69
significant lower ascending slope (which means lower modulus of elasticity), using the 0.1 in. 70
deformation might lead to unconservative results and unfair comparison with a FRC having stiffer 71
ascending branch. In such a case the second point can be taken at the point 0.05 in. beyond the 72
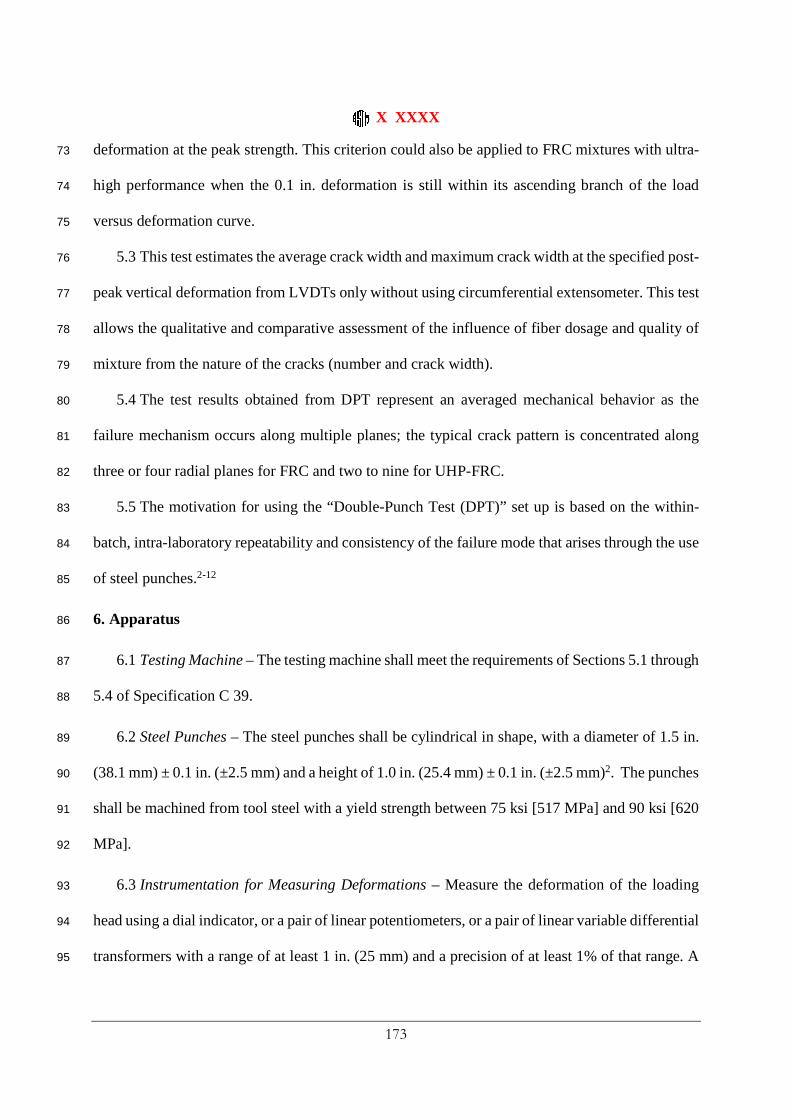
X XXXX
173
deformation at the peak strength. This criterion could also be applied to FRC mixtures with ultra-73
high performance when the 0.1 in. deformation is still within its ascending branch of the load 74
versus deformation curve. 75
5.3 This test estimates the average crack width and maximum crack width at the specified post-76
peak vertical deformation from LVDTs only without using circumferential extensometer. This test 77
allows the qualitative and comparative assessment of the influence of fiber dosage and quality of 78
mixture from the nature of the cracks (number and crack width). 79
5.4 The test results obtained from DPT represent an averaged mechanical behavior as the 80
failure mechanism occurs along multiple planes; the typical crack pattern is concentrated along 81
three or four radial planes for FRC and two to nine for UHP-FRC. 82
5.5 The motivation for using the “Double-Punch Test (DPT)” set up is based on the within-83
batch, intra-laboratory repeatability and consistency of the failure mode that arises through the use 84
of steel punches.2-12 85
6. Apparatus 86
6.1 Testing Machine – The testing machine shall meet the requirements of Sections 5.1 through 87
5.4 of Specification C 39. 88
6.2 Steel Punches – The steel punches shall be cylindrical in shape, with a diameter of 1.5 in. 89
(38.1 mm) ± 0.1 in. (±2.5 mm) and a height of 1.0 in. (25.4 mm) ± 0.1 in. (±2.5 mm)2. The punches 90
shall be machined from tool steel with a yield strength between 75 ksi [517 MPa] and 90 ksi [620 91
MPa]. 92
6.3 Instrumentation for Measuring Deformations – Measure the deformation of the loading 93
head using a dial indicator, or a pair of linear potentiometers, or a pair of linear variable differential 94
transformers with a range of at least 1 in. (25 mm) and a precision of at least 1% of that range. A 95
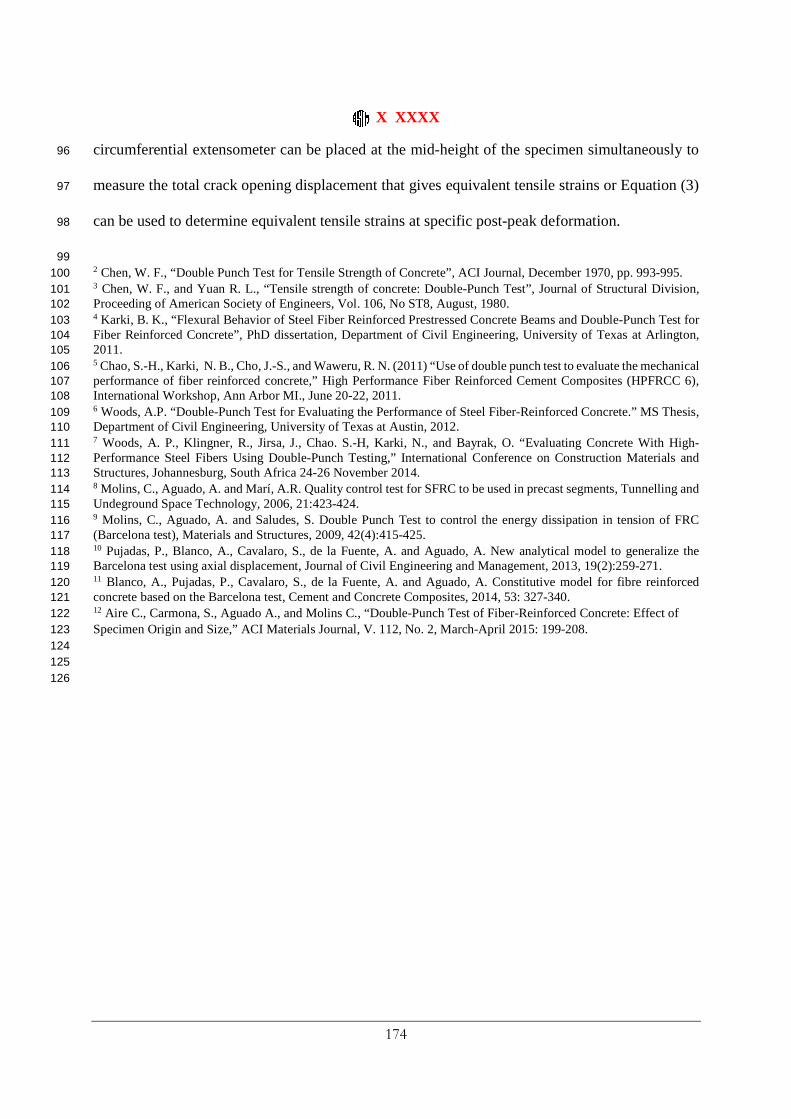
X XXXX
174
circumferential extensometer can be placed at the mid-height of the specimen simultaneously to 96
measure the total crack opening displacement that gives equivalent tensile strains or Equation (3) 97
can be used to determine equivalent tensile strains at specific post-peak deformation. 98
99 2 Chen, W. F., “Double Punch Test for Tensile Strength of Concrete”, ACI Journal, December 1970, pp. 993-995. 100 3 Chen, W. F., and Yuan R. L., “Tensile strength of concrete: Double-Punch Test”, Journal of Structural Division, 101 Proceeding of American Society of Engineers, Vol. 106, No ST8, August, 1980. 102 4 Karki, B. K., “Flexural Behavior of Steel Fiber Reinforced Prestressed Concrete Beams and Double-Punch Test for 103 Fiber Reinforced Concrete”, PhD dissertation, Department of Civil Engineering, University of Texas at Arlington, 104 2011. 105 5 Chao, S.-H., Karki, N. B., Cho, J.-S., and Waweru, R. N. (2011) “Use of double punch test to evaluate the mechanical 106 performance of fiber reinforced concrete,” High Performance Fiber Reinforced Cement Composites (HPFRCC 6), 107 International Workshop, Ann Arbor MI., June 20-22, 2011. 108 6 Woods, A.P. “Double-Punch Test for Evaluating the Performance of Steel Fiber-Reinforced Concrete.” MS Thesis, 109 Department of Civil Engineering, University of Texas at Austin, 2012. 110 7 Woods, A. P., Klingner, R., Jirsa, J., Chao. S.-H, Karki, N., and Bayrak, O. “Evaluating Concrete With High-111 Performance Steel Fibers Using Double-Punch Testing,” International Conference on Construction Materials and 112 Structures, Johannesburg, South Africa 24-26 November 2014. 113 8 Molins, C., Aguado, A. and Marí, A.R. Quality control test for SFRC to be used in precast segments, Tunnelling and 114 Undeground Space Technology, 2006, 21:423-424. 115 9 Molins, C., Aguado, A. and Saludes, S. Double Punch Test to control the energy dissipation in tension of FRC 116 (Barcelona test), Materials and Structures, 2009, 42(4):415-425. 117 10 Pujadas, P., Blanco, A., Cavalaro, S., de la Fuente, A. and Aguado, A. New analytical model to generalize the 118 Barcelona test using axial displacement, Journal of Civil Engineering and Management, 2013, 19(2):259-271. 119 11 Blanco, A., Pujadas, P., Cavalaro, S., de la Fuente, A. and Aguado, A. Constitutive model for fibre reinforced 120 concrete based on the Barcelona test, Cement and Concrete Composites, 2014, 53: 327-340. 121 12 Aire C., Carmona, S., Aguado A., and Molins C., “Double-Punch Test of Fiber-Reinforced Concrete: Effect of 122 Specimen Origin and Size,” ACI Materials Journal, V. 112, No. 2, March-April 2015: 199-208. 123 124 125 126
X XXXX
175
127
128
Figure 6-1: Typical Double-Punch Test Arrangement 129
130
6" [152.40 mm]
1.5" [38.10 mm]
2.907"[73.84 mm]
2.25"2.25" 1.50"
3"
2.25
"0.
75"
Ø 1.5" [38.10 mm]
height = 1" [25.4 mm]
[76.
20
mm
]
[57.15 mm] [57.15 mm]
[38.10 mm]
[57.
15
mm
] [19.
05
mm
]
131
Figure 6-2: Dimensions of Centering Disk and Steel Punch 132
Steel punch [1.5 in (38 mm) ϕ×1.0 in. (25 mm)]
LVDT
LVDT
Circumferential Extensometer
Steel punch centering
X XXXX
176
7. Specimens 133
7.1 Specimens shall be prepared by saw cutting molded concrete cylinders having a nominal 134
diameter of 6 in. (152.4 mm) and a nominal height of 12 in. (305 mm), into two cylinders, each 135
having a nominal diameter of 6 in. (152.4 mm) and a nominal height of 6 in. (152.4 mm). The 136
losses from saw kerf shall not be more than 0.15 in. [4 mm]. 137
7.2 The top or bottom 6 × 6 in. (152.4 × 152.4 mm) portion can be used for testing. However, 138
generally, specimens obtained from the bottom portion have a greater fiber density and distribution 139
than those from the top portion, due to segregation during casting. Therefore, the top portion shows 140
higher variations in the response parameters. Thus, top and bottom specimens should not be 141
compared directly. It has been shown that adding viscosity modifying agent to the FRC mixtures 142
is able to minimize that difference between the top and bottom portions. It is recommended that 143
the COV in the peak load in the bottom and the top portion should be less than 20% in order to 144
consider both top and bottom samples for average computation. It is also suggested six 6 × 6 in. 145
(152.4 × 152.4 mm) specimens be used for the evaluation. 146
7.3 Specimen surfaces shall be smoothed so that the steel punches make uniform (flat) contact 147
with the top and bottom faces of the specimen. Smooth contact surfaces can be obtained by 148
grinding the ends of the cylinder using a milling machine such that the ends do not depart from 149
perpendicularity to the axis by more than 0.5° (approximately equivalent to 1 mm in 100 mm [0.05 150
in. in 5 in.]). The ends of the cylinders shall be ground plane to within 0.050 mm [0.002 in.]. 151
8. Procedure 152
8.1 Using a punch centering disk (or masking tape), place steel punches concentrically at the 153
top and bottom of the specimen. To avoid eccentricity of load, the centroid of each steel punch 154

X XXXX
177
should align with the centroid of the cylinder surface within ± 0.1 in. [± 2.5 mm]. A plywood 155
dimensional guide may be used to help ensure this. 156
8.2 Place the specimen concentrically in the testing machine. 157
8.3 Loading can be applied by either load control or displacement control. However a 158
displacement-controlled testing generally provide stable response especially at the post-cracking 159
and the descending curve. Displacement-controlled testing is generally preferred. 160
8.4 Load the specimen using the following sequence if load-controlled testing machine is used: 161
8.4.1 Shakedown (Initial Loading and Unloading to Seat Punches and possible unevenness of the 162
surfaces of the specimen) – Load the specimen at a rate of 100 lb/sec (445 N/sec) ± 25 lb/sec (± 163
111 N/sec) up to a load of approximately 2 kips (8.9 kN). Unload the specimen at a rate between 164
100 and 300 lb/sec (445 and 1334 N/sec) to a load between 100 lb (445 N) and 200 lb (890 N). 165
The deflection at that final load is termed the “initial deformation offset.” 166
8.4.2 Reloading – Load the specimen at a rate of 100 lb/sec (445 N/sec) ± 25 lb/sec (± 111 167
N/sec). Load at this rate until the first radial crack appears in the top or bottom face of the 168
specimen. The load can be increased to 300 lb/sec (1335 N/sec) ± 25 lb/sec (± 111 N/sec) in the 169
post-cracking stage. 170
8.5 Load the specimen using the following sequence if displacement-controlled testing 171
machine is used: 172
8.5.1 Shakedown (Initial Loading and Unloading to Seat Punches and possible unevenness of the 173
surfaces of the specimen) – Load the specimen at a rate of 0.04 in./min (1.02 mm/min) ± 0.005 174
in./min (± 0.13 mm/sec) up to a load of approximately 2 kips (8.9 kN). Unload the specimen at a 175
X XXXX
178
rate 0.04 in./min (1.02 mm/min) to a load of 0.5 kips (2.2 kN). The deflection at that final load is 176
termed the “initial deformation offset.” 177
8.5.2 Reloading – Load the specimen at a rate of 0.04 in./min (1.02 mm/min) ± 0.005 in./min 178
(± 0.13 mm/sec). The testing can be typically completed within 12-15 minutes if an ultimate 179
deformation of 0.3 in. (7.6 mm) is reached. 180
8.6 Data Recording – Record the applied load and the deformation of the loading head at 1-181
second time intervals. The typical maximum load for FRC is about 35-40 kips [156-178 kN] and 182
UHP-FRC about is about 120 kips [534 kN]. 183
9. Evaluation and Reporting of Results 184
9.1 Subtract the initial deformation offset from each deformation reading during the reloading 185
phase. The resulting deformations are termed “corrected deformations.” 186
9.2 Using the recorded loads and the corrected deformations, calculate and report the initial 187
slope, maximum load, and residual load, as follows: 188
9.2.1 Evaluate the initial slope as the slope between applied loads of approximately 5 kips (22 kN) and 189
15 kips (67 kN). 190
9.2.2 Evaluate the maximum load directly. Evaluate the residual load, PP+0.1, at a corrected 191
deformation at δ0+0.1, which is the average number from the two LVDTs. 192
193

X XXXX
179
0 0.05 0.1 0.15 0.2 0.25Deformation (in.)
0
10
20
30
40
Loa
d (k
ips)
0 1 2 3 4 5 6Deformation (mm)
0
50
100
150
Loa
d(k
N)
Pult
PEAK LOAD
INITIAL SLOPE
P0.1-in. Pp+0.1 in. RESIDUAL LOAD AT δ0+0.1
δ0+0.1. :deformation at 0.1 in. beyond δ0
δ0 :deformation at peak load
0.1 in.
3
2
1
TYPICAL DPT PERFORMANCE CURVEKEY TEST PARAMETERS
194 Figure 9-1: Typical Double-Punch Test (DPT) Load versus Deformation Plot 195
(Performance Curve) showing Key Test Parameters 196
197
9.2.3 Evaluate the equivalent tensile stress versus strain response. Theoretically, by applying 198
a compressive load through the punches, uniform tensile stresses are generated over diametric 199
planes, and tensile cracks occur along these diametric planes. The equivalent tensile stress, derived 200
from the assumptions of plastic material and multiple tension cracking failure mechanisms, is 201
calculated as:3 202
2
0.75
(1.2 )t
Pf
bh aπ×=−
(1) 203
where ft is equivalent tensile stress, P is applied load, b is radius of cylinder, h is height of cylinder, 204
and a is radius of punches. 205
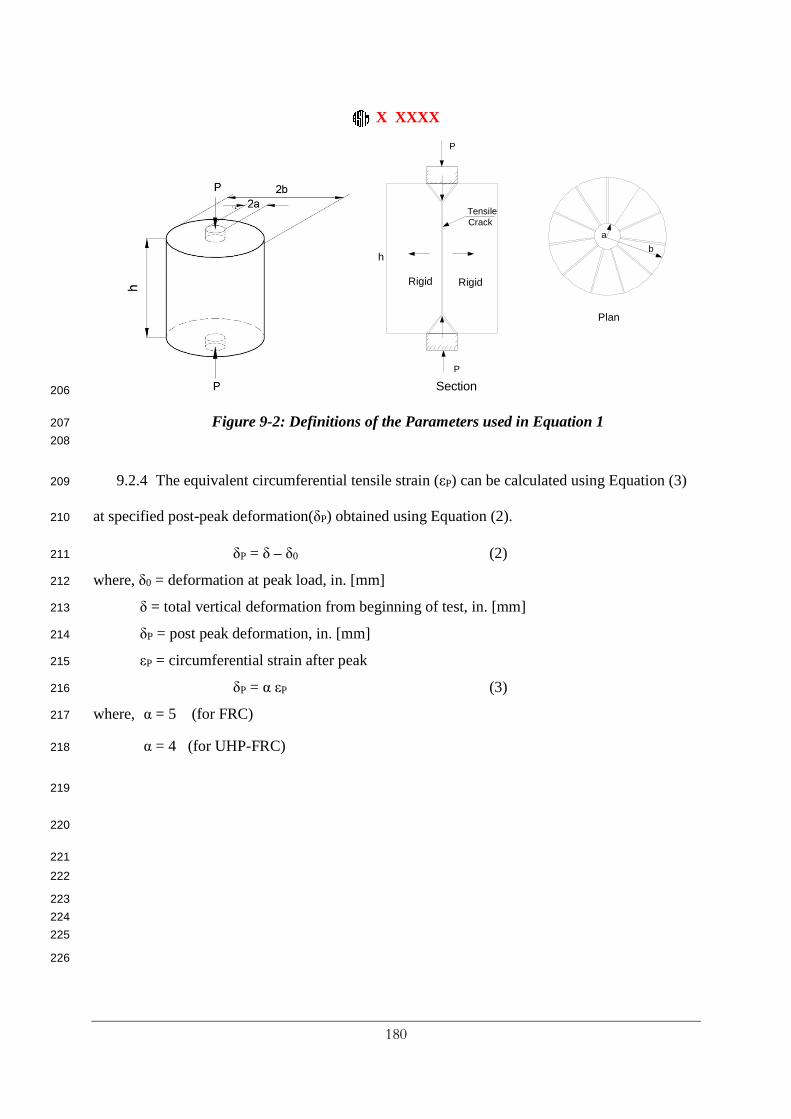
X XXXX
180
Section
Rigid
Plan
Tensile Crack
a
bh
P
P
Rigid
206
Figure 9-2: Definitions of the Parameters used in Equation 1 207
208
9.2.4 The equivalent circumferential tensile strain (εP) can be calculated using Equation (3) 209
at specified post-peak deformation(δP) obtained using Equation (2). 210
δP = δ – δ0 (2) 211
where, δ0 = deformation at peak load, in. [mm] 212
δ = total vertical deformation from beginning of test, in. [mm] 213
δP = post peak deformation, in. [mm] 214
εP = circumferential strain after peak 215
δP = α εP (3) 216
where, α = 5 (for FRC) 217
α = 4 (for UHP-FRC) 218
219
220
221
222
223
224
225
226
X XXXX
181
227
9.2.5 Count the number of cracks (N). The cracks that started radially from the center and 228
propagated at least up to the mid-height of the specimen shall be considered. Calculate average 229
crack width at specified post using the following formulas: 230
0 PDCW
N
π δα
×= 231
For typical DPT, with D0 = 6 in. [152.4 mm] and substituting α as given in section 9.2.4. 232
3.78 PCWN
δ= (for FRC) 233
4.72 PCWN
δ= (for UHP-FRC) 234
where, δP = post-peak deformation, in. 235
9.2.6 Calculate maximum crack width at specified post-peak deformation using the following 236
formulas: 237
1.5max 1.78 PC δ= (median value for FRC) 238
1.2max 1.78 PC δ= (upper bound value for FRC) 239
1.41max 1.14 PC δ= (for UHP-FRC with steel fibers) 240
2.2max 5.61 PC δ= (for UHP-FRC with PE fibers) 241
where, δP = post-peak deformation, in. 242
243
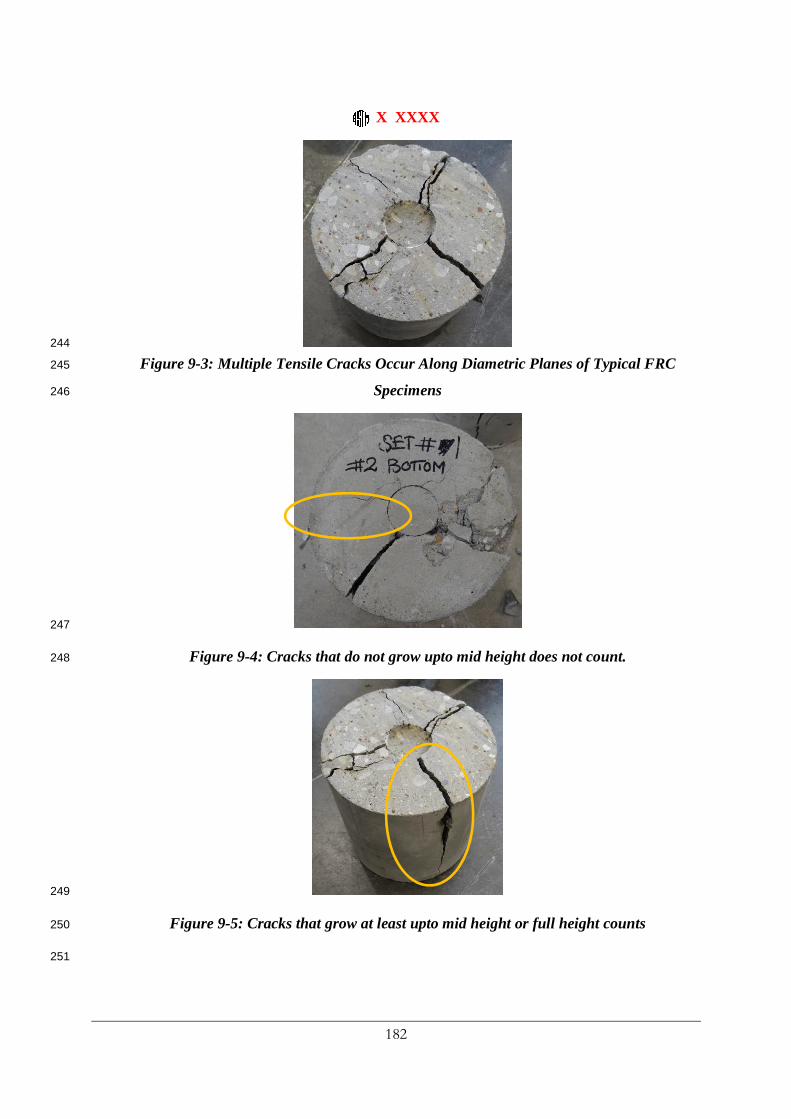
X XXXX
182
244
Figure 9-3: Multiple Tensile Cracks Occur Along Diametric Planes of Typical FRC 245
Specimens 246
247
Figure 9-4: Cracks that do not grow upto mid height does not count. 248
249
Figure 9-5: Cracks that grow at least upto mid height or full height counts 250
251
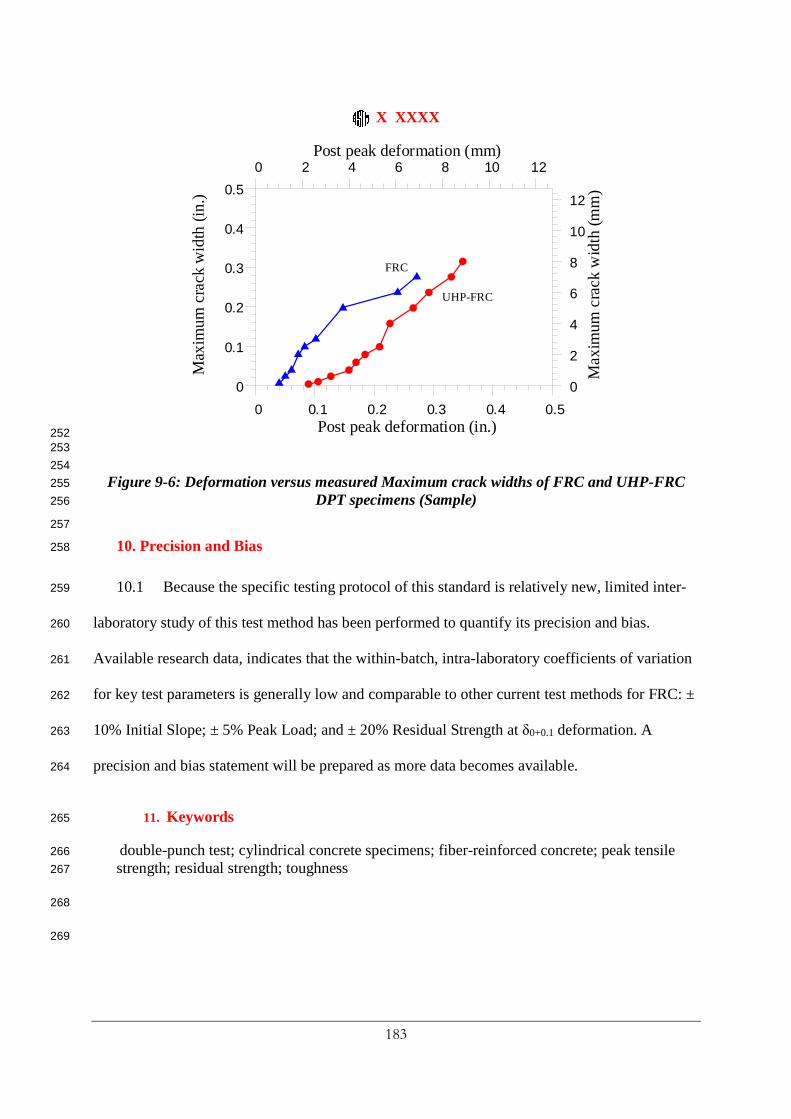
X XXXX
183
0 0.1 0.2 0.3 0.4 0.5Post peak deformation (in.)
0
0.1
0.2
0.3
0.4
0.5M
axim
um c
rack
wid
th (i
n.)
0 2 4 6 8 10 12Post peak deformation (mm)
0
2
4
6
8
10
12
Ma
xim
um c
rack
wid
th (m
m)
FRC
UHP-FRC
252 253
254
Figure 9-6: Deformation versus measured Maximum crack widths of FRC and UHP-FRC 255
DPT specimens (Sample) 256
257
10. Precision and Bias 258
10.1 Because the specific testing protocol of this standard is relatively new, limited inter-259
laboratory study of this test method has been performed to quantify its precision and bias. 260
Available research data, indicates that the within-batch, intra-laboratory coefficients of variation 261
for key test parameters is generally low and comparable to other current test methods for FRC: ± 262
10% Initial Slope; ± 5% Peak Load; and ± 20% Residual Strength at δ0+0.1 deformation. A 263
precision and bias statement will be prepared as more data becomes available. 264
11. Keywords 265
double-punch test; cylindrical concrete specimens; fiber-reinforced concrete; peak tensile 266
strength; residual strength; toughness 267
268
269
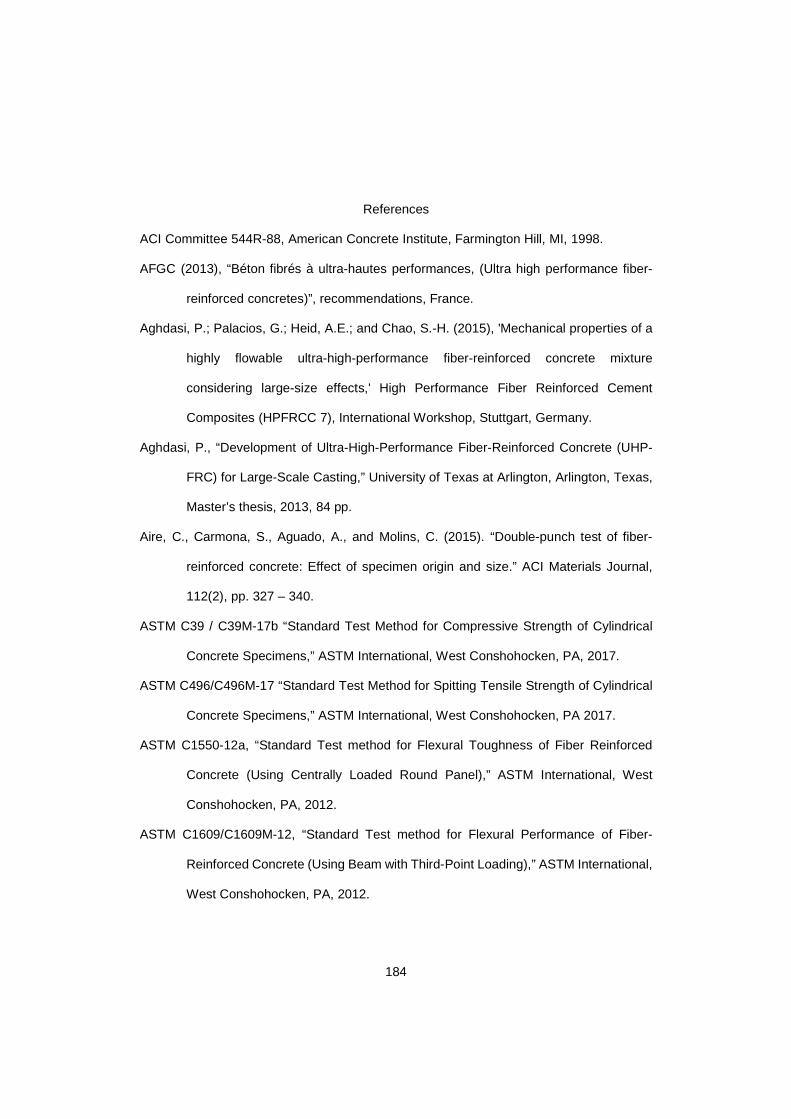
184
References
ACI Committee 544R-88, American Concrete Institute, Farmington Hill, MI, 1998.
AFGC (2013), “Béton fibrés à ultra-hautes performances, (Ultra high performance fiber-
reinforced concretes)”, recommendations, France.
Aghdasi, P.; Palacios, G.; Heid, A.E.; and Chao, S.-H. (2015), 'Mechanical properties of a
highly flowable ultra-high-performance fiber-reinforced concrete mixture
considering large-size effects,' High Performance Fiber Reinforced Cement
Composites (HPFRCC 7), International Workshop, Stuttgart, Germany.
Aghdasi, P., “Development of Ultra-High-Performance Fiber-Reinforced Concrete (UHP-
FRC) for Large-Scale Casting,” University of Texas at Arlington, Arlington, Texas,
Master’s thesis, 2013, 84 pp.
Aire, C., Carmona, S., Aguado, A., and Molins, C. (2015). “Double-punch test of fiber-
reinforced concrete: Effect of specimen origin and size.” ACI Materials Journal,
112(2), pp. 327 – 340.
ASTM C39 / C39M-17b “Standard Test Method for Compressive Strength of Cylindrical
Concrete Specimens,” ASTM International, West Conshohocken, PA, 2017.
ASTM C496/C496M-17 “Standard Test Method for Spitting Tensile Strength of Cylindrical
Concrete Specimens,” ASTM International, West Conshohocken, PA 2017.
ASTM C1550-12a, “Standard Test method for Flexural Toughness of Fiber Reinforced
Concrete (Using Centrally Loaded Round Panel),” ASTM International, West
Conshohocken, PA, 2012.
ASTM C1609/C1609M-12, “Standard Test method for Flexural Performance of Fiber-
Reinforced Concrete (Using Beam with Third-Point Loading),” ASTM International,
West Conshohocken, PA, 2012.
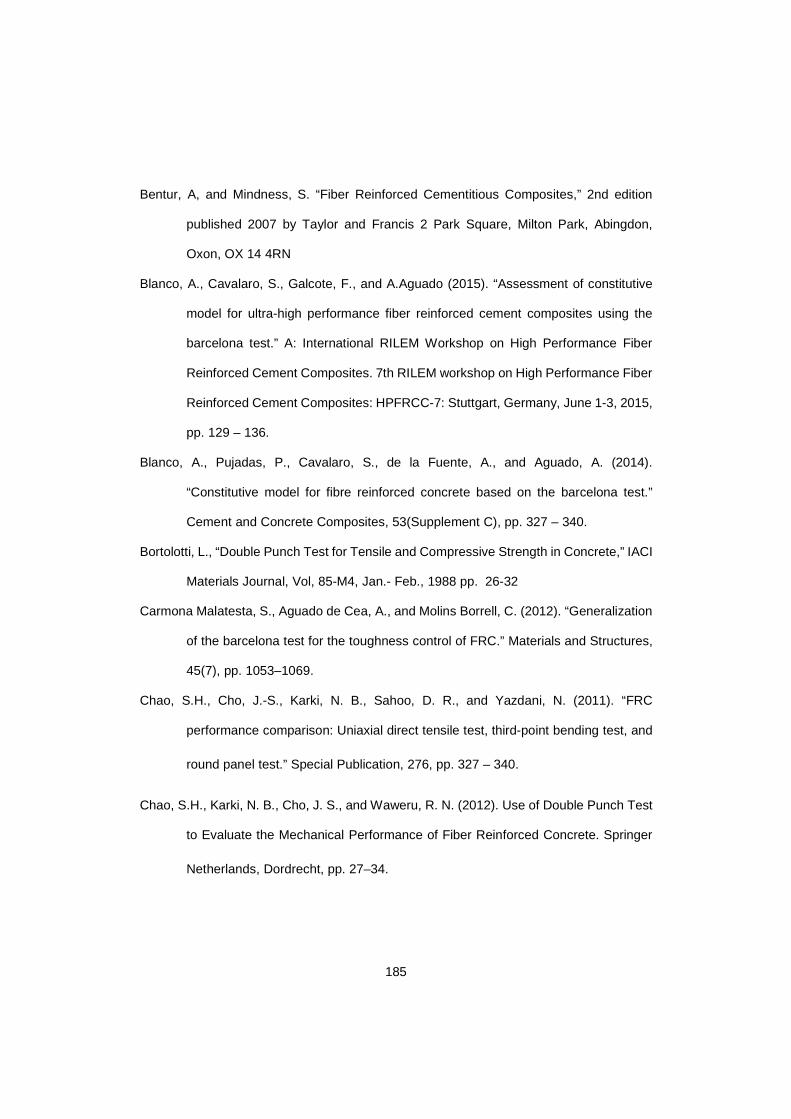
185
Bentur, A, and Mindness, S. “Fiber Reinforced Cementitious Composites,” 2nd edition
published 2007 by Taylor and Francis 2 Park Square, Milton Park, Abingdon,
Oxon, OX 14 4RN
Blanco, A., Cavalaro, S., Galcote, F., and A.Aguado (2015). “Assessment of constitutive
model for ultra-high performance fiber reinforced cement composites using the
barcelona test.” A: International RILEM Workshop on High Performance Fiber
Reinforced Cement Composites. 7th RILEM workshop on High Performance Fiber
Reinforced Cement Composites: HPFRCC-7: Stuttgart, Germany, June 1-3, 2015,
pp. 129 – 136.
Blanco, A., Pujadas, P., Cavalaro, S., de la Fuente, A., and Aguado, A. (2014).
“Constitutive model for fibre reinforced concrete based on the barcelona test.”
Cement and Concrete Composites, 53(Supplement C), pp. 327 – 340.
Bortolotti, L., “Double Punch Test for Tensile and Compressive Strength in Concrete,” IACI
Materials Journal, Vol, 85-M4, Jan.- Feb., 1988 pp. 26-32
Carmona Malatesta, S., Aguado de Cea, A., and Molins Borrell, C. (2012). “Generalization
of the barcelona test for the toughness control of FRC.” Materials and Structures,
45(7), pp. 1053–1069.
Chao, S.H., Cho, J.-S., Karki, N. B., Sahoo, D. R., and Yazdani, N. (2011). “FRC
performance comparison: Uniaxial direct tensile test, third-point bending test, and
round panel test.” Special Publication, 276, pp. 327 – 340.
Chao, S.H., Karki, N. B., Cho, J. S., and Waweru, R. N. (2012). Use of Double Punch Test
to Evaluate the Mechanical Performance of Fiber Reinforced Concrete. Springer
Netherlands, Dordrecht, pp. 27–34.
186
Chen, W. F., “Double Punch Test for Tensile Strength of Concrete,” ACI Materials Journal,
1970, pp. 993–995
Chen, W. F., “Limit Analysis and Soil Plasticity,” Elsevier Scientific Publishing Company,
Amsterdam, Oxford, New York, 1975, Chapter 11, pp. 501-541.
Chen, W. F., M. ASCE and Yuan R. L., “Tensile strength of concrete: Double-Punch Test,”
Journal of Structural Division, Proceeding of American Society of Engineers, Vol.
106, No ST8, August, 1980 pp.1673-169.
Federal Highway Administration (FHWA), “Ultra-High Performance Concrete: A State-of-
the-Art Report for the Bridge Community,” Publication Number: FHWA-HRT-13-
060, June 2013.
Fehling, E.; Bunje, K.; and Leutbecher, T. (2004), “Design relevant properties of hardened
Ultra High Performance Concrete,” Proceedings of the International Symposium
on Ultra High Performance Concrete, University of Kassel, pp. 327-338, Kassel,
Germany.
Galeote, E., Blanco, A., Cavalaro, S. H., and de la Fuente, A. (2017). “Correlation between
the barcelona test and the bending test in fibre reinforced concrete.” Construction
and Building Materials, 152(Supplement C), pp. 529 – 538.
Graybeal, B. A., and Davis, M. (2008), “Cylinder or Cube: Strength Testing of 80 to 200
MPa (11.6 to 29 ksi) Ultra-High Performance Fiber-Reinforced Concrete,” ACI
Materials Journal, V. 105, No. 6, pp. 603-609.
Graybeal, B. A. (2014). “Tensile mechanical response of ultra-high-performance concrete.”
Advances in Civil Engineering Materials, Vol. 4 No.2, pp. 62 – 74.

187
Kim, J., Lee, G.-P., and Moon, D. Y. (2015). “Evaluation of mechanical properties of steel-
fibre-reinforced concrete exposed to high temperatures by double-punch test.”
Construction and Building Materials, 79(Supplement C), pp. 182 – 191.
Marti, P., “Size Effect in Double-Punch Test on Concrete Cylinders,” ACI Materials Journal,
Vol. 86 No. 6, Nov.-Dec. 1989, pp. 597-601.
Mindess, S., Young, J. F., and Darwin, D., Concrete, 2nd Edition, Prentice Hall, Upper
Saddle River, NJ, 2003, 644 pp
Pros, A., Diez P. and Molins, C., “Model Validations of Numerical Simulation of Double
Punch Test,” ECCM 2010, IV European Conference on Computational Mechanics,
Paris, France May 16-21, 2010.
Molins, C., Aguado, A., and Saludes, S. (2009). “Double punch test to control the energy
dissipation in tension of FRC (Barcelona Test).” Materials and Structures, Vol.
42(4), pp. 415–425.
Pujadas, P., Blanco, A., Cavalaro, S., de la Fuente, A., and Aguado, A. (2013). “New
analytical model to generalize the barcelona test using axial displacement.”
Journal of Civil Engineering and Management, Vol. 19(2), pp. 259–271.
Pujadas, P., Blanco, A., Cavalaro, S., de la Fuente, A., and Aguado, A. (2014).
“Multidirectional double punch test to assess the post-cracking behaviour and fibre
orientation of frc.” Construction and Building Materials, Vol. 58(Supplement C), pp.
214 – 224.
Ranade, R.; Li, V.C.; Stults, M.D.; Heard, W.F.; and Rushing, T.S. (2013), “Composite
Properties of High-Strength, High-Ductility Concrete,” ACI Materials Journal, V.
110, No. 4, pp. 413-422.
Richard, P.; and Cheyrezy, M. (1995), “Composition of Reactive Powder Concretes,”
Cement and Concrete Research, V. 25, No. 7, Oct., pp. 1501-1511.

188
Tue, N. V.; Simsch, G.; Schneider, H.; Schmidt, D. (2004), “Bearing Capacity of Stub
Columns made of NSC, HSC and UHPC confined by a Steel Tube,” Proceedings
of the International Symposium on Ultra High Performance Concrete, University of
Kassel, pp. 339-350, Kassel, Germany, September.
Wille, K.; Naaman, A.E., and El-Tawil, S. (2011), “Optimizing Ultra-High-Performance
Fiber-Reinforced Concrete: Mixtures with Twisted Fibers Exhibit Record
Performance under Tensile Loading,” Concrete International, V. 33, No. 9, pp.35-
41.
Wille, K.; Naaman, A.E.; El-Tawil, S.; and Parra-Montesinos, G.J., (2012), “Ultra-High
Performance Concrete and Fiber Reinforced Concrete: Achieving Strength and
Ductility without Heat Treatment,” Materials and Structures, V. 45, No. 3, pp. 309-
324.
Woods, A. P., Klingner, R., Jirsa, J., Chao, S.-H., Karki, N., and Bayrak, O. Evaluating
concrete with high-performance steel fibers using double-punch testing.
189
Biographical Information
Shuveksha Tuladhar graduated from Tribhuvan University, Kathmandu, Nepal in
2012 with Bachelor’s degree in Civil Engineering. After completing her undergraduate
study, she worked as Civil Structural Engineer at R&R Engineering Consultancy Pvt. Ltd.
and CEAD (Consulting, Engineers, Architect, and Designers) in Nepal. She was
responsible for performing structural analysis and design of seismic resistant high-rise
buildings, the design of bridges and seismic retrofitting of various buildings in the
Kathmandu valley. She started her Masters of Science program in Civil Engineering
(Concentration: Structural Engineering) at The University of Texas at Arlington (UTA) in
August 2015. During her graduate program, she worked as a Graduate Research Assistant
under the supervision of Dr. Shih-Ho Chao. She was awarded ACI Katherine and Bryant
Mather Scholarship (2016-2017) by American Concrete Institute (ACI) Foundation; Civil
Engineering Outstanding Graduate Student Award (2016-2017); and Civil Engineering
Graduate Scholarship (2015-2016) from UTA. Her research interest includes fiber
reinforced concrete (FRC), ultra-high performance fiber reinforced concrete (UHP-FRC),
earthquake engineering and seismic behavior of structural systems.