Embed Size (px)
Citation preview
research papers
Acta Cryst. (2017). D73, 997–1006 https://doi.org/10.1107/S2059798317016357 997
Received 16 June 2017
Accepted 14 November 2017
Edited by J. Newman, Bio21 Collaborative
Crystallisation Centre, Australia
Keywords: high-pressure cooling; protein
crystals; polyimide capillary; buffer
composition.
PDB references: concanavalin A, 5o6n;
lysozyme, 5o6q
Supporting information: this article has
supporting information at journals.iucr.org/d
A standardized technique for high-pressure coolingof protein crystals
David Quirnheim Pais,a Barbara Rathmann,a Juergen Koepke,a Cveta Tomova,b
Paul Wurzingerb and Yvonne Thielmanna*
aMolecular Membrane Biology, Max Planck Institute of Biophysics, Max-von-Laue-Strasse 3, 60438 Frankfurt am Main,
Germany, and bLeica Microsystems Vienna, Hernalser Hauptstrasse 219, 1170 Vienna, Austria. *Correspondence e-mail:
Cryogenic temperatures slow down secondary radiation damage during data
collection from macromolecular crystals. In 1973, cooling at high pressure was
identified as a method for cryopreserving crystals in their mother liquor
[Thomanek et al. (1973). Acta Cryst. A29, 263–265]. Results from different
groups studying different crystal systems indicated that the approach had merit,
although difficulties in making the process work have limited its widespread use.
Therefore, a simplified and reliable technique has been developed termed high-
pressure cooling (HPC). An essential requirement for HPC is to protect crystals
in capillaries. These capillaries form part of new sample holders with SPINE
standard dimensions. Crystals are harvested with the capillary, cooled at high
pressure (220 MPa) and stored in a cryovial. This system also allows the usage of
the standard automation at the synchrotron. Crystals of hen egg-white lysozyme
and concanavalin A have been successfully cryopreserved and yielded data sets
to resolutions of 1.45 and 1.35 A, respectively. Extensive work has been
performed to define the useful working range of HPC in capillaries with 250 mm
inner diameter. Three different 96-well crystallization screens that are most
frequently used in our crystallization facility were chosen to study the formation
of amorphous ice in this cooling setup. More than 89% of the screening solutions
were directly suitable for HPC. This achievement represents a drastic
improvement for crystals that suffered from cryoprotection or were not
previously eligible for cryoprotection.
1. Introduction
Cooling of macromolecular crystals is a standard procedure in
X-ray crystallography. The low temperature of 100 K slows
down the process of radiation damage, which is especially
useful for synchrotron radiation (Ravelli & Garman, 2006).
All of the crystallization screening conditions already contain
chemicals that act as cryoprotectants; often the addition of
another cryoprotecting agent is necessary to form amorphous
ice at cryogenic temperatures. Today, various methods for the
cryoprotection of macromolecular crystals exist. The most
common procedure is the use of small additives such as
glycerol, ethylene glycol or 2-methyl-2,4-pentanediol
(Garman & Mitchell, 1996; Vera et al., 2011; Farley et al., 2014;
Pflugrath, 2015). Sensitive crystals often do not tolerate the
high concentrations of small additives which are necessary for
cryoprotection. Therefore, different approaches have used
sugars (Haas & Rossmann, 1970), salts (Holyoak et al., 2003;
Rubinson et al., 2000), low-molecular-weight PEGs (Discipio
et al., 1998), oils (Kwong & Liu, 1999) and mixtures (Vera &
Stura, 2014). The procedure of finding a cryoprotectant solu-
tion can be very laborious and time-consuming. The changed
ISSN 2059-7983

chemical environment may influence the quality of the crystal
and thus its diffraction.
A different alternative for the cryoprotection of macro-
molecular crystals is cooling at high pressure. The main
advantage of cooling at pressures of 220 MPa is the formation
of high-density amorphous (HDA) ice. Cooling causes the unit
cell of the protein to shrink by 2–7%, probably owing to
rearrangement in the lattice. The protein molecule itself
contracts as well by 1–2%, but contracts less compared with
the unit cell (Juers & Matthews, 2001). This observation means
that the volume reductions for water to
amorphous ice and for the unit cell of
the protein are similar. In contrast,
cooling of the crystal (at ambient pres-
sure) creates low-density amorphous
(LDA) ice. The phase transition from
water to LDA ice increases the volume
by 6.7% (Kim et al., 2005). If this
tendency to volume increase cannot be
alleviated by the addition of a cryopro-
tective agent, the crystal is disrupted or
has increased mosaicity. However, the
cryoprotective agent may itself dissolve
or compromise the order of the crystal
during the cryosoak.
The method of cooling at high pres-
sure for protein crystallography was first
introduced by Thomanek and cowor-
kers (Thomanek et al., 1973). They were
able to high-pressure cool myoglobin
crystals at 250 MPa and 77 K in
isopentane and liquid nitrogen. Since a
great effort was needed for each crystal,
the method was not widely pursued in
crystallography. In 1984 Mishima and
coworkers found that high-density
amorphous ice can be created by pres-
sures of 1000 MPa at 77 K (� =
1.17 g cm�3; Mishima et al., 1984). The
method of cooling at high pressure for
protein crystals was rediscovered in
2005 by Kim and coworkers using
helium gas for pressurization and
cooling again with liquid nitrogen (Kim
et al., 2005). The method required
35 min for pressurization, cooling and
pressure release. Later, it was further
extended to include derivatization with
noble gases for phasing (Kim et al.,
2006). The time per cooling cycle was
optimized by van der Linden et al.
(2014); here, a pressurization time of
5 min with helium gas was needed.
In the field of electron microscopy
(EM), cooling at high pressure has been
pursued since the 1970s after the
developments of Riehle & Hoechli
(1973). Continuous improvements in method development
have led to technically mature high-pressure cooling devices,
and these have been used over the years (Baumeister, 1982;
Hohenberg et al., 1994; Studer et al., 1995). These develop-
ments have also been employed in the field of crystallography.
Various crystal structures of crystals cooled at high pressure
have been determined, ranging from small soluble proteins to
large membrane proteins and a virus crystal (Gallus gallus
lysozyme, Canavalia ensiformis concanavalin A, Trichoderma
longibrachiatum xylanase, Sus scrofa insulin, Escherichia coli
research papers
998 Quirnheim Pais et al. � High-pressure cooling of protein crystals Acta Cryst. (2017). D73, 997–1006
Figure 1Comparison of the conventional cooling and HPC workflows. For conventional cooling the crystalsare harvested in a loop. The crystal is submerged into a chemical cryocondition and harvested again.Within a few seconds the crystal is placed into a cryovial filled with liquid N2 or placed into acryostream. For HPC the crystal is harvested once with the capillary of the sample unit. It is nowprotected by its own mother liquor. Cooling is started and the sample can be taken from the sampledewar to the semi-dry liquid N2 bath. The complete sample holder is formed, which is stored in acryovial.
AcrB, Thermosynechococcus elongatus photosystem II and
Bos taurus enterovirus 2; Burkhardt et al., 2012, 2013; Kurz et
al., 2012). Once the crystal had been inserted into various
kinds of capillaries, cooling at high pressure was feasible but
tricky. A great effort was required to keep the crystals cool
and to transfer them safely onto the goniometer at the
synchrotron. Each quartz capillary with a high-pressure cooled
crystal needed to be glued individually to a nylon loop at
135 K (Burkhardt et al., 2012). This method was applied to
different targets as a proof of concept, but could not be used to
easily cryoprotect a large number of different crystals.
The cryoprotection of macromolecular crystals is not an
easy task. The requirements for cooling and cryoprotection of
different crystals are as variable as the crystallization process
itself. Therefore, an additional reliable and rapid method is
required to cryoprotect macromolecular crystals where the
cooling with supplemented cryoprotectants is difficult and
time-consuming or is not possible at all. To overcome these
drawbacks, a standardized technique for HPC of crystals has
been developed. The workflow of the method in comparison
to cooling with the addition of cryoprotectants is illustrated in
Fig. 1. Crystals are harvested in a capillary, inserted into the
high-pressure machine and cooled. The samples drop into a
dewar containing liquid N2. Finally, the pin and capillary are
placed in a cryovial for storage and transport. At the
synchrotron the high-pressure-cooled crystals can be mounted
automatically just as in the regular SPINE (https://
www.embl.fr/spinesampleholder/) sample holders.
2. Materials and methods
2.1. Proteins and crystallization
Hen egg-white lysozyme was purchased from Hampton
Research (Aliso Viejo, California, USA). Concanavalin A
(type IV) was purchased from Sigma–Aldrich (Steinheim,
Germany). Lysozyme was dissolved in 0.02 M sodium acetate
pH 4.6 to yield a concentration of 20 mg ml�1, and concana-
valin A was dissolved in 0.025 M HEPES pH 7.0 at a
concentration of 10 mg ml�1. They were crystallized by the
sitting-drop method at 291 K in 200 nl drops at a 1:1 mixing
ratio in the MPI Tray (Rathmann et al., 2017). For lysozyme
the reservoir solution consisted of 0.8 M sodium chloride,
0.1 M sodium acetate pH 4.6. Concanavalin A was crystallized
using 6%(w/v) PEG 8000, 0.1 M Tris pH 8.5 as the reservoir
solution.
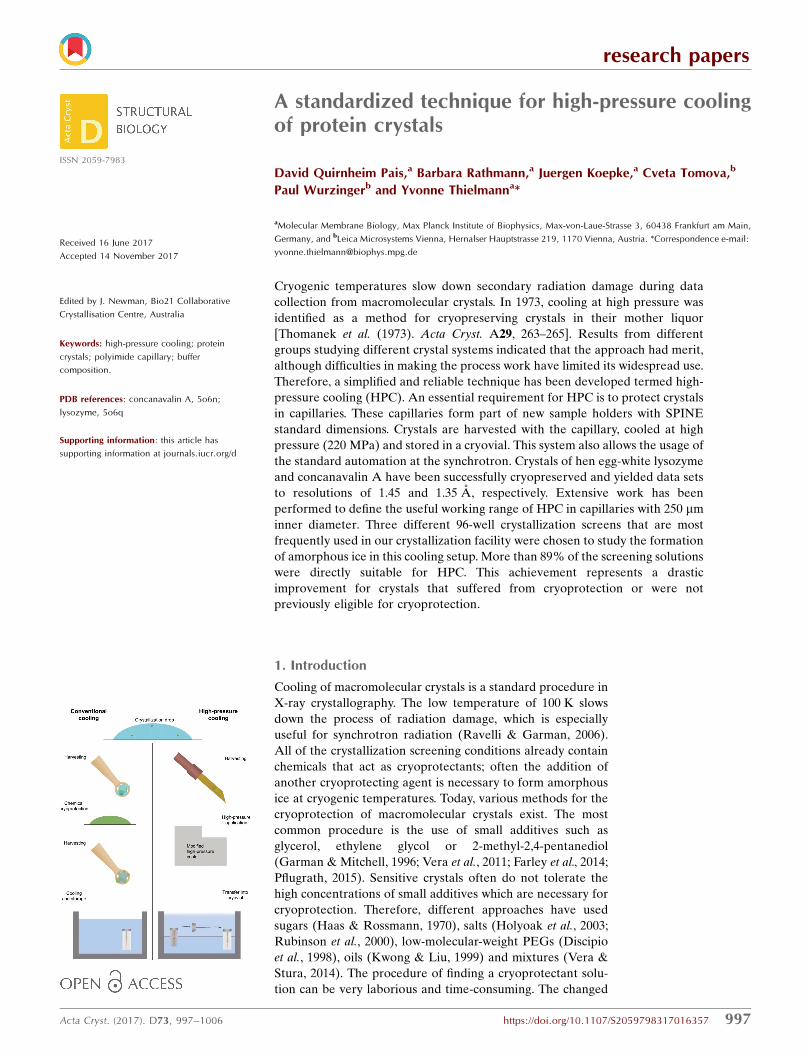
2.2. Crystal harvesting
To fit the needs of the high-pressure cooler, crystals were
harvested with specially fabricated sample units (Fig. 2a).
Instead of handling crystals with loops or meshes, they were
absorbed using capillary forces. A polyimide capillary with
250 mm inner diameter was purchased from Goodfellow
GmbH (Bad Nauheim, Germany). The capillary was cut to
form an angled tip and to a length of 5 mm. A nylon thread
(Berkley, Columbia, USA) with a diameter of 220 mm was
inserted into the polyimide capillary. The capillary was
attached to a copper pin. The nylon thread protrudes about
1 mm from the copper pin and within
the polyimide capillary. This is the limit
to which the crystals can be absorbed. A
cavity was pierced with a Minutien pin
(http://www.fiebig-
lehrmittel.de; 0.1 mm diameter) into the
polyimide capillary at the end of the
nylon thread (Fig. 2b). The copper pin
itself was mounted on a pin holder. This
overall assembly is termed the sample
unit. It can be extended after the
cooling process to fit the SPINE stan-
dard for automated sample mounting
(the sample unit together with the
extension is called the sample holder).
The copper pin, the pin holder and the
extension were provided by Leica
Microsystems Vienna (Vienna, Austria).
A schematic showing the dimensions of
the sample unit can be found in
Supplementary Fig. S1. The sample
units were pre-treated with 80%(v/v)
ethanol in an ultrasonic bath and dried
on a heat plate. This changed the wett-
ability of the polyimide capillary
remarkably. To harvest a crystal, the
capillary was inserted into the mother
liquor, pointing towards a crystal. As
soon as the opening of the capillary had
research papers
Acta Cryst. (2017). D73, 997–1006 Quirnheim Pais et al. � High-pressure cooling of protein crystals 999
Figure 2Overview of the parts and actions required before high-pressure cooling. (a) The sample unitconsists of a polyimide capillary, a copper pin and a pin holder. (b) The crystal is harvested from themother liquor with the capillary. (c) The capillary is filled with solution and crystal and sealed withsaturated PEG 100 000 solution. (d) The sample unit with solution and crystal is inserted into thecartridge. This takes place in the loading station of the high-pressure cooler and is guided by aloading groove and a cylindrical tool.
been submerged into the drop completely, the crystal was
absorbed together with its mother liquor as shown in Fig. 21.
To protect the solution and crystal in the capillary, both ends
of the capillary were closed immediately before cooling. A
drop of a saturated solution of PEG 100 000 (the solution was
extremely viscous and amenable for cleaning) was deposited
onto the angled tip and cavity using an insect needle (http://
www.fiebig-lehrmittel.de; 0.25 mm diameter). This could be
applied very precisely and worked in more than 95% of the
samples. Used sample units were cleaned with 2%(v/v) Decon
90 (Decon Laboratories Ltd, England) in an ultrasonic bath,
rinsed with deionized water, treated again with ethanol and
dried.
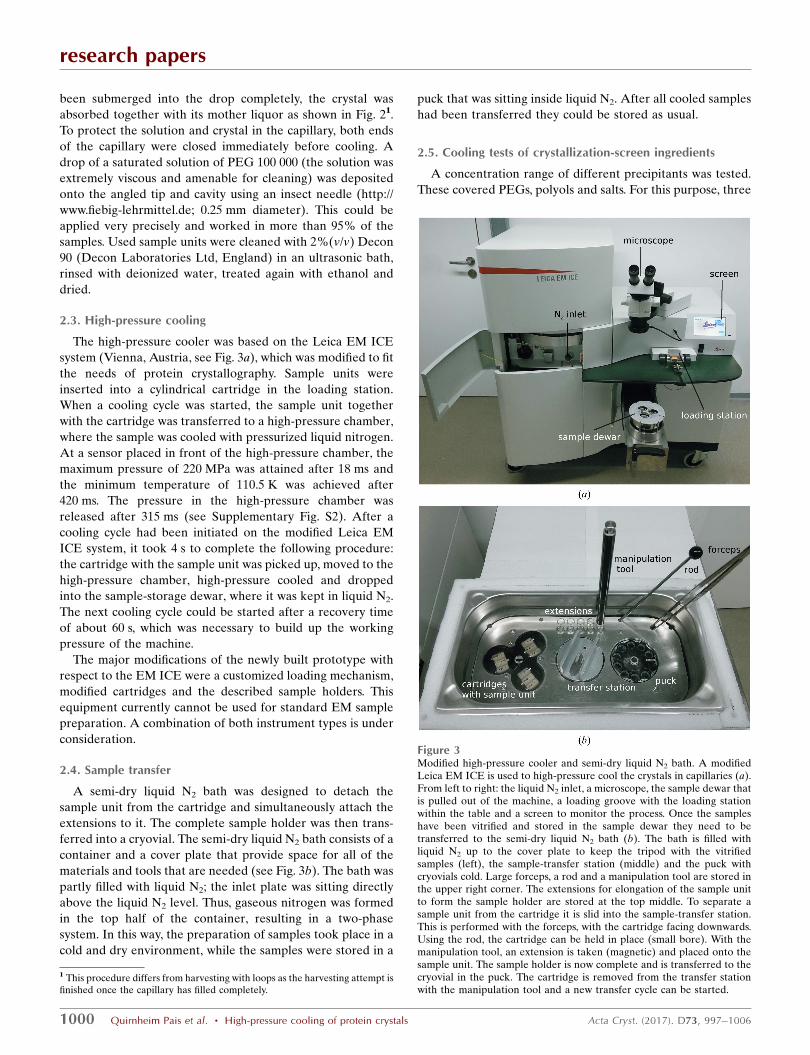
2.3. High-pressure cooling
The high-pressure cooler was based on the Leica EM ICE
system (Vienna, Austria, see Fig. 3a), which was modified to fit
the needs of protein crystallography. Sample units were
inserted into a cylindrical cartridge in the loading station.
When a cooling cycle was started, the sample unit together
with the cartridge was transferred to a high-pressure chamber,
where the sample was cooled with pressurized liquid nitrogen.
At a sensor placed in front of the high-pressure chamber, the
maximum pressure of 220 MPa was attained after 18 ms and
the minimum temperature of 110.5 K was achieved after
420 ms. The pressure in the high-pressure chamber was
released after 315 ms (see Supplementary Fig. S2). After a
cooling cycle had been initiated on the modified Leica EM
ICE system, it took 4 s to complete the following procedure:
the cartridge with the sample unit was picked up, moved to the
high-pressure chamber, high-pressure cooled and dropped
into the sample-storage dewar, where it was kept in liquid N2.
The next cooling cycle could be started after a recovery time
of about 60 s, which was necessary to build up the working
pressure of the machine.
The major modifications of the newly built prototype with
respect to the EM ICE were a customized loading mechanism,
modified cartridges and the described sample holders. This
equipment currently cannot be used for standard EM sample
preparation. A combination of both instrument types is under
consideration.
2.4. Sample transfer
A semi-dry liquid N2 bath was designed to detach the
sample unit from the cartridge and simultaneously attach the
extensions to it. The complete sample holder was then trans-
ferred into a cryovial. The semi-dry liquid N2 bath consists of a
container and a cover plate that provide space for all of the
materials and tools that are needed (see Fig. 3b). The bath was
partly filled with liquid N2; the inlet plate was sitting directly
above the liquid N2 level. Thus, gaseous nitrogen was formed
in the top half of the container, resulting in a two-phase
system. In this way, the preparation of samples took place in a
cold and dry environment, while the samples were stored in a
puck that was sitting inside liquid N2. After all cooled samples
had been transferred they could be stored as usual.
2.5. Cooling tests of crystallization-screen ingredients
A concentration range of different precipitants was tested.
These covered PEGs, polyols and salts. For this purpose, three
research papers
1000 Quirnheim Pais et al. � High-pressure cooling of protein crystals Acta Cryst. (2017). D73, 997–1006
Figure 3Modified high-pressure cooler and semi-dry liquid N2 bath. A modifiedLeica EM ICE is used to high-pressure cool the crystals in capillaries (a).From left to right: the liquid N2 inlet, a microscope, the sample dewar thatis pulled out of the machine, a loading groove with the loading stationwithin the table and a screen to monitor the process. Once the sampleshave been vitrified and stored in the sample dewar they need to betransferred to the semi-dry liquid N2 bath (b). The bath is filled withliquid N2 up to the cover plate to keep the tripod with the vitrifiedsamples (left), the sample-transfer station (middle) and the puck withcryovials cold. Large forceps, a rod and a manipulation tool are stored inthe upper right corner. The extensions for elongation of the sample unitto form the sample holder are stored at the top middle. To separate asample unit from the cartridge it is slid into the sample-transfer station.This is performed with the forceps, with the cartridge facing downwards.Using the rod, the cartridge can be held in place (small bore). With themanipulation tool, an extension is taken (magnetic) and placed onto thesample unit. The sample holder is now complete and is transferred to thecryovial in the puck. The cartridge is removed from the transfer stationwith the manipulation tool and a new transfer cycle can be started.
1 This procedure differs from harvesting with loops as the harvesting attempt isfinished once the capillary has filled completely.

commercially available screens were chosen that were used
most frequently at the crystallization facility of the Max
Planck Institute of Biophysics (Thielmann et al., 2012). The
complex chemical mixtures originated from the screens The
JCSG Core Suite I (Qiagen, Hilden, Germany), MemGold
ECO (Molecular Dimensions, Suffolk, England) and
JBScreen Classic HTS I (Jena Bioscience, Jena, Germany).
The crystallization-screen ingredients per well can be down-
loaded from the websites of the manufacturers (https://
www.qiagen.com, https://www.jenabioscience.com and https://
www.moleculardimensions.com), our website (https://
registration.cc.biophys.mpg.de/pickscreens/; Hedderich et al.,
2011) or others (http://c6.csiro.au; Newman et al., 2010). All
288 conditions were downloaded from PICKScreens and
sorted based on their precipitant. The main component of the
solution was chosen to be the precipitant. In cases where the
solutions contained 2-propanol and PEG 4000, the mixtures
were evaluated. If three or fewer concentrations per precipi-
tant were present in the screens, all of them were chosen to
describe the minimum concentration needed for amorphous
ice formation in cooling and HPC. If more solutions with
varying precipitant concentrations existed in the screens, low
concentrations were chosen to describe the minimum
concentration per precipitant necessary to yield amorphous
ice formation during cooling. All solutions were directly taken
from the deep-well blocks of the corresponding screens. Each
solution was cooled individually
three times. For HPC samples the
screen solution was absorbed into
the sample unit (about 100 nl),
closed with a saturated PEG
100 000 solution, cooled as
depicted in x2.3 and tested as
described in x2.6. A total of 255
samples were cooled by HPC. An
overview of the results can be
found in Figs. 4(a), 4(b) and 4(c).
Amorphous ice was usually
formed by HPC, as shown in
Supplementary Fig. S3(c): the
maximum of the diffuse scat-
tering shifted to a lower d-spacing
compared with the inner cubic ice
ring. This indicated the formation
of HDA ice, as shown by Kim et
al. (2008).
If no samples or one sample
out of three could be cooled to
form amorphous ice, the solutions
were counted as not cooled
successfully (orange in Fig. 4; if a
solution in a well position was
chosen for measurement, the
counts for successful cooling are
depicted in each well position for
the three different screens). A
transition zone for cooling was
observed if only two out of three
samples formed amorphous ice
(light green in Fig. 4). If a solution
could be cooled in three out of
three samples the solution was
counted as cooled successfully
(green in Fig. 4). All solutions
with the same or an increased
precipitant concentration as a
successfully cooled solution were
extrapolated as suitable for HPC
(the well position for the solution
was marked in green without
research papers
Acta Cryst. (2017). D73, 997–1006 Quirnheim Pais et al. � High-pressure cooling of protein crystals 1001
Figure 4Survey of the cooling tests. Illustrated are the three crystallization screens tested: JBScreen Classic HTS I(Jena Bioscience; top), The JCSG Core Suite I (Qiagen; middle) and MemGold ECO (MolecularDimensions; bottom). On the left are the HPC results: (a), (b) and (c). On the right are the results for gas-stream cooling: (d), (e) and ( f ). Boxes corresponding to the respective solutions were filled with the countof samples that formed amorphous ice during the cooling tests. Boxes without numbers were extrapolatedfrom the screening results. The boxes were marked in orange if one or more trials out of three replicateswere not cooled successfully. Where two out of three samples showed amorphous ice, boxes were colouredlight green (HPC) and light blue (gas stream). For all solutions which showed amorphous ice in all samplesthe boxes were coloured green (HPC) and blue (gas stream).
numbering). Solutions which had precipitant concentrations in
between two not successfully cooled solutions or had the same
or a lower precipitant concentration as not successfully cooled
solutions were extrapolated as not cooled successfully. Solu-
tions in between two probed solutions or solutions with the
same precipitant concentrations where two out of three
samples formed amorphous ice were extrapolated as well
positions in the transition zone.
Samples for conventional cooling were directly cooled in
150 mm MicroMounts (MiTeGen, Ithaca, New York, USA) in
the 100 K Cobra cryostream (Oxford Cryosystems, Oxford,
England). The gas stream was blocked until the sample was
mounted and suddenly released. The time required to trans-
port a drop of solution in a MicroMount from a well to the
goniometer and to release the gas stream was less than 3 s. The
liquid volume within a 150 mm sample aperture of a Micro-
Mount is small (about 130 pl) compared with a standard loop
as excess liquid is drained into a cavity. For the cooling tests
with the gas stream the following references were used to
guide the cooling test: Garman & Mitchell (1996), McFerrin &
Snell (2002) and Rubinson et al. (2000). In general, the tests
were started with the higher precipitant concentrations in the
solutions for gas-stream cooling. A total of 249 samples were
examined. Evaluation and extrapolation of the results was
performed as described for HPC. The results are visualized in
Figs. 4(d), 4(e) and 4( f) (orange for not cooled successfully,
light blue for the transition zone and blue for successfully
cooled solutions; the count in the well positions depicts the
sample number for amorphous ice formation).
2.6. Data collection and evaluation of cooling tests
Diffraction images of high-pressure cooled lysozyme and
concanavalin A crystals were collected on the PXII beamline
of the Swiss Light Source at the Paul Scherrer Institut,
Villigen, Switzerland.
Diffraction tests of the crystallization-screen ingredients
were carried out with an in-house Rigaku FR-E+ SuperBright
generator combined with a Saturn 944+ CCD detector
(Rigaku Europe, Sevenoaks, England). All diffraction tests
were analyzed with respect to the formation of an amorphous
state. Examples for diffraction tests with amorphous ice and
with crystalline ice rings can be found in Supplementary Fig.
S2.
2.7. Data processing and analysis
The diffraction patterns were indexed, integrated and
scaled using XDS (Kabsch, 2010). Molecular replacement was
performed using Phaser-MR within the PHENIX package.
Manual rebuilding in Coot and refinement in PHENIX were
used alternatingly (Adams et al., 2010; Emsley & Cowtan,
2004).
3. Results
3.1. Technical realization
The most important requirement for crystal handling is a
safe and reliable system. Initially, we tried to cool crystals on
loops, but the unpredictable position of the crystal in the
cylindrical cartridge or on the steel pin of the cryoloop forced
us to change the surrounding of the crystal to a capillary. This
change increased the reliability of the method drastically.
From these findings, a sample unit was developed that holds
the capillary during cooling (see Fig. 2a and Supplementary
Fig. S1 for dimensions). In order to create an easy and
straightforward loading mechanism for HPC, it was absolutely
necessary to change the setup from half-cylinders (Leica EM
ICE) to cylinders (see Fig. 2d). This alteration enabled loading
that could be effectively guided by tools with no need for
supervision by eye. The most important invention was a setup
for the cylindrical cartridge that allowed proper cooling of the
crystals within the mother liquor in the capillary, and kept the
vitrified material cool during the drop from the cooling
chamber into the sample dewar. It was an iterative process to
optimize the geometry of the cylindrical cartridge by influx
and efflux bore diameter, the positioning of the sample, the
material thickness and the cylinder material itself. In addition,
the cartridge needed to be adapted as the sample unit
progressed to the final state. It can then be elongated by an
extension to fit the SPINE standard for automation at
European synchrotrons. The assembly of the sample unit and
the cylindrical cartridge is held together by two magnets to
keep the sample in the capillary in a safe position during the
whole cooling and manipulation process.
3.1.1. Workflow of HPC. A method to cryoprotect crystals
with high pressure should be as simple as cooling with regard
to manual manipulation. Therefore, special care was taken to
develop a simple process that can be divided into three steps.
(i) Harvesting of crystals. Crystals are harvested in a poly-
imide capillary of the sample unit by using capillary forces
(Fig. 2). The polyimide capillary is sealed with PEG 100 000
solution2.
(ii) High-pressure cooling. Insertion of the sample unit into
the cartridge. The cartridge is already preloaded in the loading
station of the modified Leica EM ICE (Fig. 3a). Finally, the
user initiates the loading of the cartridge into the high-
pressure chamber.
(iii) Preparations for sample storage. The cartridge and
sample unit are taken from the sample dewar of the modified
Leica EM ICE to the semi-dry liquid N2 bath (Fig. 3b). Here,
the cartridge is separated from the sample unit. In the same
step the sample unit is also elongated by an extension to form
the sample holder. The sample holder is kept in a cryovial in
liquid N2 for storage.
3.1.2. Useful cooling range. To evaluate how useful HPC is
compared with the conventional cooling approach, a rather
extensive screening of crystallization solutions was performed.
The three most frequently used screens at our large crystal-
lization facility for membrane proteins were tested with 83
(gas-stream cooling) and 85 (HPC) out of 288 crystallization
solutions. The screens were The JCSG Core Suite I (Qiagen),
MemGold ECO (Molecular Dimensions) and JBScreen
research papers
1002 Quirnheim Pais et al. � High-pressure cooling of protein crystals Acta Cryst. (2017). D73, 997–1006
2 The PEG seal is used to optimize the visibility in the capillary, as whirls andbubbles can mask crystals.

Classic HTS I (Jena Bioscience). The evaluation criteria were
as follows. If all three individually cooled samples showed no
ice rings, the condition was deemed to be suitable for HPC or
gas-stream cooling (see Fig. 4). A transition zone for cooling
was attained when only two out of three samples were cooled
properly. From the 85 (HPC) investigated solutions the results
for the remaining 203 (HPC) solutions were extrapolated as
described in x2.5. In Fig. 4 all well positions which were
investigated show the count of successfully cooled samples.
Extrapolated well positions are marked by the corresponding
colour only. When cooling is applied in the gas stream in
150 mm MicroMounts, 47.3% of the crystallization solutions
should form amorphous ice in all three samples. Additionally,
19.8% of the solutions should show amorphous ice in two out
of three samples. In comparison, HPC should be able to cool
the crystallization solutions in more than 81.2% of the tests
successfully. Moreover, another 8.0% of the solutions should
be cooled in two out of three samples; this would result in a
total of 89.2% of the solutions. If both methods, HPC and gas-
stream cooling, were merged for all conditions giving at least
two out of three successfully cooled samples, a total of 90.2%
of the tested conditions could be used.
The precipitant solutions that could be vitrified only by gas-
stream cooling were all from MemGold ECO (bottom in
Fig. 4; A1, A11 and H12). All of these precipitant solutions
contained ammonium sulfate or sodium chloride. All other
solutions that could not be vitrified by either method are listed
in Fig. 5. By inspection of the successful and unsuccessful
cooling trials for HPC it was possible to deduce predictions of
the cooling results. If small-sized PEGs were used with an
average molecular weight of 200–600 Da, all solutions formed
amorphous ice. The lowest concentration tested was
15%(w/v). For medium-sized PEGs of between 1000 and
6000 Da, a concentration of 11–12%(w/v) was needed to form
amorphous ice in the samples. For PEG
8000 a concentration of only >5%(w/v)
was needed for amorphous ice forma-
tion in the samples. Larger PEGs
(10 000 and 20 000) formed amorphous
ice at the lowest concentrations of 8–
10%(w/v) in the solutions. The cooling
was mostly dependent on the chain
length of the PEG; it did not vary when
monomethyl ethers were used. Jeffa-
mines, pentaerythritol propoxylate,
triethylene glycol and 2-methyl-2,4-
pentanediol were present in these
screens only at high concentrations that
exceeded the limit necessary for
forming amorphous ice. It seems
reasonable that a similar dependence of
required concentrations on chain
lengths might apply. For salts we were
not able to deduce a general criterion
for successful cooling. Lithium sulfate
(1.0 M) and sodium citrate (1.1–1.6 M)
were cooled successfully by HPC. A
mixture of potassium and sodium
phosphate at 0.8 M was still cooled in
two out of three samples. Samples
containing ammonium sulfate (0.8–
2.5 M) and sodium chloride (2.5–3.0 M)
were cooled at most in only one out of
three cases with HPC. Interestingly,
these were partly cooled by gas-stream
cooling.
The screen solutions that were not
eligible for cooling (shown in Fig. 5) can
be classified into two groups. One group
can be easily rescued by applying the
above criteria for PEGs. This observa-
tion means that for all conditions
coloured yellow a concentration
increase of 1–2%(w/v) is sufficient to
research papers
Acta Cryst. (2017). D73, 997–1006 Quirnheim Pais et al. � High-pressure cooling of protein crystals 1003
Figure 5Overview of the solutions that were not well suited for HPC or cooling from Fig. 4. Screeningsolutions from the respective screens that failed to be cooled to amorphous ice are listed. Wellsmarked in yellow can be used for HPC if the PEG concentration is raised by 1–2%(w/v). Conditionsmarked in orange can be cooled by HPC if the PEG concentration is further increased by up to8%(w/v). The remaining five of the 288 conditions need conventional treatment with additionalcryoprotectants.
properly cool these solutions. Solutions coloured orange can
be cooled if the concentration of the PEG is further increased
by up to 8%(w/v). The remaining noncoloured conditions
form the second group, which is not appropriate for both HPC
and gas-stream cooling. These comprise only five out of 288
conditions, and contain ethanol, sodium chloride and ammo-
nium sulfate. The rather high concentrations of pure alcohols
from 20 to 40%(v/v) cannot be cooled by HPC and should be
conventionally treated by the addition of cryoprotectants.
Mixtures of alcohols with PEGs of appropriate concentration
are suitable for HPC [JBScreen HTS I, well D4: 10%(w/v)
PEG 4000, 20%(v/v) 2-propanol]. A solution containing
glycerol was present in the screens at a minimal concentration
of 22%(v/v) as precipitant and could be cooled without diffi-
culty.
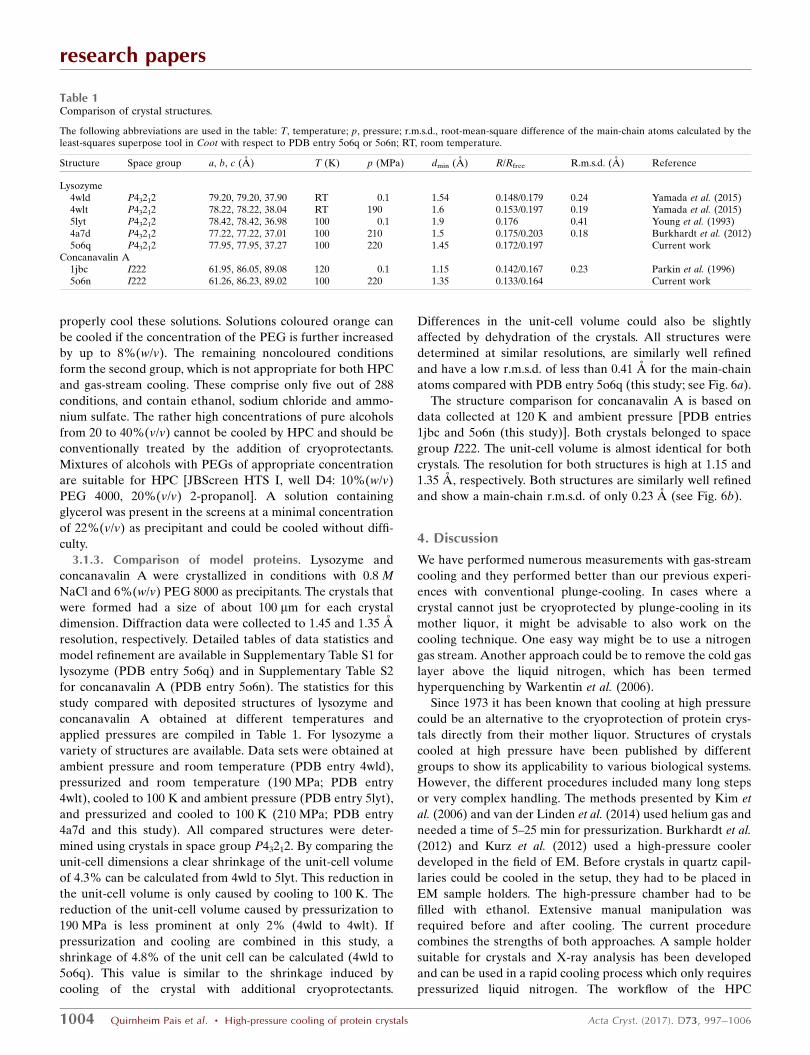
3.1.3. Comparison of model proteins. Lysozyme and
concanavalin A were crystallized in conditions with 0.8 M
NaCl and 6%(w/v) PEG 8000 as precipitants. The crystals that
were formed had a size of about 100 mm for each crystal
dimension. Diffraction data were collected to 1.45 and 1.35 A
resolution, respectively. Detailed tables of data statistics and
model refinement are available in Supplementary Table S1 for
lysozyme (PDB entry 5o6q) and in Supplementary Table S2
for concanavalin A (PDB entry 5o6n). The statistics for this
study compared with deposited structures of lysozyme and
concanavalin A obtained at different temperatures and
applied pressures are compiled in Table 1. For lysozyme a
variety of structures are available. Data sets were obtained at
ambient pressure and room temperature (PDB entry 4wld),
pressurized and room temperature (190 MPa; PDB entry
4wlt), cooled to 100 K and ambient pressure (PDB entry 5lyt),
and pressurized and cooled to 100 K (210 MPa; PDB entry
4a7d and this study). All compared structures were deter-
mined using crystals in space group P43212. By comparing the
unit-cell dimensions a clear shrinkage of the unit-cell volume
of 4.3% can be calculated from 4wld to 5lyt. This reduction in
the unit-cell volume is only caused by cooling to 100 K. The
reduction of the unit-cell volume caused by pressurization to
190 MPa is less prominent at only 2% (4wld to 4wlt). If
pressurization and cooling are combined in this study, a
shrinkage of 4.8% of the unit cell can be calculated (4wld to
5o6q). This value is similar to the shrinkage induced by
cooling of the crystal with additional cryoprotectants.
Differences in the unit-cell volume could also be slightly
affected by dehydration of the crystals. All structures were
determined at similar resolutions, are similarly well refined
and have a low r.m.s.d. of less than 0.41 A for the main-chain
atoms compared with PDB entry 5o6q (this study; see Fig. 6a).
The structure comparison for concanavalin A is based on
data collected at 120 K and ambient pressure [PDB entries
1jbc and 5o6n (this study)]. Both crystals belonged to space
group I222. The unit-cell volume is almost identical for both
crystals. The resolution for both structures is high at 1.15 and
1.35 A, respectively. Both structures are similarly well refined
and show a main-chain r.m.s.d. of only 0.23 A (see Fig. 6b).
4. Discussion
We have performed numerous measurements with gas-stream
cooling and they performed better than our previous experi-
ences with conventional plunge-cooling. In cases where a
crystal cannot just be cryoprotected by plunge-cooling in its
mother liquor, it might be advisable to also work on the
cooling technique. One easy way might be to use a nitrogen
gas stream. Another approach could be to remove the cold gas
layer above the liquid nitrogen, which has been termed
hyperquenching by Warkentin et al. (2006).
Since 1973 it has been known that cooling at high pressure
could be an alternative to the cryoprotection of protein crys-
tals directly from their mother liquor. Structures of crystals
cooled at high pressure have been published by different
groups to show its applicability to various biological systems.
However, the different procedures included many long steps
or very complex handling. The methods presented by Kim et
al. (2006) and van der Linden et al. (2014) used helium gas and
needed a time of 5–25 min for pressurization. Burkhardt et al.
(2012) and Kurz et al. (2012) used a high-pressure cooler
developed in the field of EM. Before crystals in quartz capil-
laries could be cooled in the setup, they had to be placed in
EM sample holders. The high-pressure chamber had to be
filled with ethanol. Extensive manual manipulation was
required before and after cooling. The current procedure
combines the strengths of both approaches. A sample holder
suitable for crystals and X-ray analysis has been developed
and can be used in a rapid cooling process which only requires
pressurized liquid nitrogen. The workflow of the HPC
research papers
1004 Quirnheim Pais et al. � High-pressure cooling of protein crystals Acta Cryst. (2017). D73, 997–1006
Table 1Comparison of crystal structures.
The following abbreviations are used in the table: T, temperature; p, pressure; r.m.s.d., root-mean-square difference of the main-chain atoms calculated by theleast-squares superpose tool in Coot with respect to PDB entry 5o6q or 5o6n; RT, room temperature.
Structure Space group a, b, c (A) T (K) p (MPa) dmin (A) R/Rfree R.m.s.d. (A) Reference
Lysozyme4wld P43212 79.20, 79.20, 37.90 RT 0.1 1.54 0.148/0.179 0.24 Yamada et al. (2015)4wlt P43212 78.22, 78.22, 38.04 RT 190 1.6 0.153/0.197 0.19 Yamada et al. (2015)5lyt P43212 78.42, 78.42, 36.98 100 0.1 1.9 0.176 0.41 Young et al. (1993)4a7d P43212 77.22, 77.22, 37.01 100 210 1.5 0.175/0.203 0.18 Burkhardt et al. (2012)5o6q P43212 77.95, 77.95, 37.27 100 220 1.45 0.172/0.197 Current work
Concanavalin A1jbc I222 61.95, 86.05, 89.08 120 0.1 1.15 0.142/0.167 0.23 Parkin et al. (1996)5o6n I222 61.26, 86.23, 89.02 100 220 1.35 0.133/0.164 Current work

procedure is rapid and kept rather simple, avoiding complex
manipulation steps.
The HPC technique offers a direct approach to the uniform
cooling of solutions in 250 mm polyimide capillaries. In
contrast, in a study by Warkentin et al. (2008) capillaries of a
similar diameter were plunge-cooled according to the hyper-
quenching method and needed a concentration of 30–
35%(w/v) glycerol to appear transparent when cooled. Using
HPC, greater than 89% of the examined crystallization solu-
tions form amorphous ice and appear visually clear (this also
includes the narrow transition zone of 8.0%). The percentage
of solutions cooled to an amorphous state can be further
increased if the PEG concentrations are minimally raised by
up to 8%(w/v) in the crystallization solution and cooled by
HPC. More than 97% of the conditions could then be cooled.
The initial target for HPC was the model protein lysozyme.
Interestingly, we never had any problems in cooling lysozyme
crystals in their mother liquor 0.8 M sodium chloride, 0.1 M
sodium acetate pH 4.6. From the results presented above this
condition should be rather difficult for HPC. However, the
mother liquor also contained the remaining lysozyme and this
might be the important difference. The protein left in the
crystallization solution may facilitate the cooling process and
HPC could be applicable even to a lower range of precipitant
concentrations than described here. The HPC technique
introduced represents enormous savings in time, cost and
resources when the cryoprotectants are not known or when
the crystals are difficult to handle in the presence of additional
cryoprotectants.
The treatment of the crystals in HPC was rather mild. The
crystals were harvested in a single procedure and were safe in
the capillary. The position of the crystal could be inspected
using a microscope. There was sufficient time to seal the tip
and the cavity at the side of the capillary with a solution of
high-molecular-weight PEG. This procedure prevented optical
disturbances from whirls and bubbles in the capillary that were
created if the capillary was not sealed with PEG. The mother
liquor of the crystal was kept inside the capillary. The crystal
was not stressed by chemical perturbations.
The handling and harvesting in capillaries was different
from previous methods and needed to be practiced. This
statement was especially true if the crystals were harvested
from 96-well plates. We are currently working on a procedure
to facilitate the harvesting process. The loading of the high-
pressure cooler and the handling in the semi-dry liquid N2
bath were guided by tools and were very accurate. The cooling
procedure worked rapidly and reliably. We were able to high-
pressure cool nine crystal samples in 10 min. An additional
time of about 30 s per sample unit was
needed to remove the cartridge and add
the extension. About 90% of the high-
pressure cooled crystals could be
directly visualized on the microscope of
the PXII beamline at the Swiss Light
Source. More crystals were found by
performing a grid screen with the X-ray
beam. A very important improvement
was a piece of nylon in front of the
copper and inside the polyimide capil-
lary. This addition limited the end of the
capillary to which the crystals could be
absorbed and prevented the possibility
of scattering from the copper.
For the two model proteins lysozyme
and concanavalin A the complete HPC
procedure showed very similar results
compared with known crystal structures.
For lysozyme all crystal structures from
the different physical settings had a
corresponding main-chain r.m.s.d. of
less than 0.41 A.
An interesting finding was that the
majority of crystallization conditions
that were not cooled to amorphous ice
showed cubic ice rings and were opti-
cally clear. The X-ray diffraction
analysis was absolutely necessary to
probe this. Moreover, we were not able
to cool pure alcohol–water mixtures to
amorphous ice. From the analysis of a
powder diffraction pattern of 20%(v/v)
research papers
Acta Cryst. (2017). D73, 997–1006 Quirnheim Pais et al. � High-pressure cooling of protein crystals 1005
Figure 6From the crystals to the structures. The crystal structures compared in Table 1 are superimposed forlysozyme (a) and concanavalin A (b). The colour code in (a) is as follows: PDB entry 4wld, lightgreen; 4wlt, dark green; 4a7d, light blue; 5lyt, dark grey; 5o6q (this study), blue. In (b) PDB entry1jbc is coloured dark grey and 5o6n (this study) blue. For both proteins the crystal structuressuperimpose very well for the main-chain atoms. (c) The diffraction pattern of concanavalin A. (d)The polyimide capillary with HPC-treated crystal is shown as it was visible at the PXII beamlinemicroscope. The nylon thread can be seen on the right. It restricts the volume of the capillary. Ontop of the polyimide capillary is the PEG 100 000 seal covering the cavity.
ethanol cooled by HPC, we suspect the formation of ice II and
ice III in the capillary. Apparently, the crystallization kinetics
play a role depending on the additives used in the screen
solutions. As stated above, we are working on a variation of
the sample unit to simplify the harvesting process. We would
also like to dispense the liquid from the capillary once the
crystal has been taken up. This should improve the signal-to-
noise ratio for all X-ray measurements. Another important
fact is that 96-well plates often contain drops with 100–200 nl
volume. If one crystal-harvesting attempt has already used all
of the mother liquor (100 nl for one capillary), then the
remaining crystals cannot be withdrawn. This is highly
problematic if membrane proteins are handled, where the
exact concentration of the detergent in the mother liquor is
not known and cannot be replaced. The first trials with
capillaries and crystals without mother liquor have been
successful. A tool to easily operate the new mechanism is
currently being built.
5. Conclusion
HPC has been developed as a very rapid and reliable tech-
nique to directly cryopreserve crystals in their mother liquor.
A wide chemical space of crystallization conditions can be
homogeneously cooled. Structure determinations of high-
pressure cooled crystals of model proteins lead to very similar
structures compared with crystals analyzed using commonly
employed methods. Extensive trials are ongoing to investigate
whether the procedure can also be advantageous for chal-
lenging and sensitive crystals, for example for membrane
proteins.
Acknowledgements
We thank U. Rehse from the MPI Biophysics workshop and R.
Wogritsch from Leica Microsystems Vienna for their technical
expertise. Many thanks to O. H. Weiergraber (Forschungs-
zentrum Julich) for fruitful discussions and reading of the
manuscript. Special thanks to H. Michel for support and
criticism. We thank L. Tapmeyer and M. U. Schmidt (both at
Goethe-Universitat) for help in analysis of the powder
diffraction data. We would also like to thank the PXII
beamline scientists at the Swiss Light Source.
Funding information
This work was financially supported by the Cluster of Excel-
lence Frankfurt (Macromolecular Complexes) and the Max-
Planck-Gesellschaft.
References
Adams, P. D. et al. (2010). Acta Cryst. D66, 213–221.Baumeister, W. (1982). Ultramicroscopy, 9, 151–158.Burkhardt, A., Wagner, A., Warmer, M., Reimer, R., Hohenberg, H.,
Ren, J., Fry, E. E., Stuart, D. I. & Meents, A. (2013). Acta Cryst.D69, 308–312.
Burkhardt, A., Warmer, M., Panneerselvam, S., Wagner, A., Zouni,A., Glockner, C., Reimer, R., Hohenberg, H. & Meents, A. (2012).Acta Cryst. F68, 495–500.
Discipio, R. G., Jenner, L., Thirup, S., Sottrup-Jensen, L., Nyborg, J. &Stura, E. (1998). Acta Cryst. D54, 643–646.
Emsley, P. & Cowtan, K. (2004). Acta Cryst. D60, 2126–2132.Farley, C., Burks, G., Siegert, T. & Juers, D. H. (2014). Acta Cryst. D70,
2111–2124.Garman, E. F. & Mitchell, E. P. (1996). J. Appl. Cryst. 29, 584–587.Haas, D. J. & Rossmann, M. G. (1970). Acta Cryst. B26, 998–
1004.Hedderich, T., Marcia, M., Kopke, J. & Michel, H. (2011). Cryst.
Growth Des. 11, 488–491.Hohenberg, H., Mannweiler, K. & Muller, M. (1994). J. Microsc. 175,
34–43.Holyoak, T., Fenn, T. D., Wilson, M. A., Moulin, A. G., Ringe, D. &
Petsko, G. A. (2003). Acta Cryst. D59, 2356–2358.Juers, D. H. & Matthews, B. W. (2001). J. Mol. Biol. 311, 851–862.Kabsch, W. (2010). Acta Cryst. D66, 125–132.Kim, C. U., Chen, Y.-F., Tate, M. W. & Gruner, S. M. (2008). J. Appl.
Cryst. 41, 1–7.Kim, C. U., Hao, Q. & Gruner, S. M. (2006). Acta Cryst. D62, 687–
694.Kim, C. U., Kapfer, R. & Gruner, S. M. (2005). Acta Cryst. D61, 881–
890.Kurz, M., Blattmann, B., Kaech, A., Briand, C., Reardon, P., Ziegler,
U. & Gruetter, M. G. (2012). J. Appl. Cryst. 45, 999–1008.Kwong, P. D. & Liu, Y. (1999). J. Appl. Cryst. 32, 102–105.Linden, P. van der, Dobias, F., Vitoux, H., Kapp, U., Jacobs, J., Mc
Sweeney, S., Mueller-Dieckmann, C. & Carpentier, P. (2014). J.Appl. Cryst. 47, 584–592.
McFerrin, M. B. & Snell, E. H. (2002). J. Appl. Cryst. 35, 538–545.Mishima, O., Calvert, L. D. & Whalley, E. (1984). Nature (London),
310, 393–395.Newman, J., Fazio, V. J., Lawson, B. & Peat, T. S. (2010). Cryst.
Growth Des. 10, 2785–2792.Parkin, S., Rupp, B. & Hope, H. (1996). Acta Cryst. D52, 1161–1168.Pflugrath, J. W. (2015). Acta Cryst. F71, 622–642.Rathmann, B., Quirnheim Pais, D. & Thielmann, Y. (2017). J. Appl.
Cryst. 50, 327–330.Ravelli, R. & Garman, E. F. (2006). Curr. Opin. Struct. Biol. 16, 624–
629.Riehle, U. & Hoechli, M. (1973). Freeze-etching: Technique and
Applications, edited by E. L. Benedetti & P. Favard, pp. 31–61.Paris: Societe Francaise de Microscopie Electronique.
Rubinson, K. A., Ladner, J. E., Tordova, M. & Gilliland, G. L. (2000).Acta Cryst. D56, 996–1001.
Studer, D., Michel, M., Wohlwend, D., Hunziker, E. B. & Buschmann,M. D. (1995). J. Microsc. 179, 321–332.
Thielmann, Y., Koepke, J. & Michel, H. (2012). J. Struct. Funct.Genomics, 13, 63–69.
Thomanek, U. F., Parak, F., Mossbauer, R. L., Formanek, H.,Schwager, P. & Hoppe, W. (1973). Acta Cryst. A29, 263–265.
Vera, L., Czarny, B., Georgiadis, D., Dive, V. & Stura, E. (2011). Cryst.Growth Des. 11, 2755–2762.
Vera, L. & Stura, E. (2014). Cryst. Growth Des. 14, 427–435.Warkentin, M., Berejnov, V., Husseini, N. S. & Thorne, R. E. (2006). J.
Appl. Cryst. 39, 805–811.Warkentin, M., Stanislavskaia, V., Hammes, K. & Thorne, R. E.
(2008). J. Appl. Cryst. 41, 791–797.Yamada, H., Nagae, T. & Watanabe, N. (2015). Acta Cryst. D71, 742–
753.Young, A. C. M., Dewan, J. C., Nave, C. & Tilton, R. F. (1993). J. Appl.
Cryst. 26, 309–319.
research papers
1006 Quirnheim Pais et al. � High-pressure cooling of protein crystals Acta Cryst. (2017). D73, 997–1006


![Laser cooling techniques: standard and alternated optical ... · The technique of laser cooling, whose basic idea was proposed in 1975 [1], provided the development of many important](https://img.pdfslide.net/doc/110x75/5e7916bfba1e494a7c72adef/laser-cooling-techniques-standard-and-alternated-optical-the-technique-of-laser.jpg)


![Technique of uncertainty and sensitivity analysis for ... · cooling [MWh] and system load [kW]. The power of heating and cooling coil in air- handling unit (AHU) and in terminal](https://img.pdfslide.net/doc/110x75/5e96e1116e83b727576393b5/technique-of-uncertainty-and-sensitivity-analysis-for-cooling-mwh-and-system.jpg)


![Gas Turbine Blade Cooling Technique[1]](https://img.pdfslide.net/doc/110x75/5695cf741a28ab9b028e2a1f/gas-turbine-blade-cooling-technique1.jpg)