Embed Size (px)
Citation preview
MAY 2019
A Statewide Assessment of Sexual Harassment and Assault

MEASURING #METOO IN CALIFORNIA , 2019 | A Statewide Assessment of Sexual Harassment and Assault 2
CONTENTSABOUT THE ORGANIZATIONS ...................................................................................................................................... 3
ADVISORY COMMITTEE ...................................................................................................................................................4
ACKNOWLEDGMENTS ...................................................................................................................................................... 5
DEFINITIONS FOR THE REPORT .................................................................................................................................. 6
EXECUTIVE SUMMARY .....................................................................................................................................................8
Methodology .................................................................................................................................................................8
Key Findings ...................................................................................................................................................................8
INTRODUCTION .............................................................................................................................................................. 10
Methodology .................................................................................................................................................................12
SURVEY FINDINGS ...........................................................................................................................................................15
Prevalence of Sexual Harassment and Assault ..........................................................................................................15
Locations Where Sexual Harassment and Assault Occur ........................................................................................19
How Recently People Experienced Sexual Harassment or Assault ........................................................................21
The Impact of Sexual Harassment and Assault ........................................................................................................21
People Who Commit Sexual Harassment and Assault ...........................................................................................22
Accusations of Sexual Harassment and Assault ......................................................................................................25
CONCLUSION ...................................................................................................................................................................26
APPENDIX A – Other Studies ........................................................................................................................................... 27

MEASURING #METOO IN CALIFORNIA , 2019 | A Statewide Assessment of Sexual Harassment and Assault 3
ABOUT THE ORGANIZATIONS
UC SAN DIEGO CENTER ON GENDER EQUITY AND HEALTH The Center on Gender Equity and Health aims to improve population health and development by improving the status, opportunities and safety of women and girls, globally. To achieve sustainable and large-scale change, GEH seeks and maintains partnerships with governmental and non-gov-ernmental agencies around the globe. A social justice framework is utilized by GEH, and innovative technologies are employed to facilitate change at individual, community and national levels. GEH.UCSD.edu
CALIFORNIA COALITION AGAINST SEXUAL ASSAULTCALCASA provides leadership, vision and resources to rape crisis centers, individuals and other entities committed to ending sexual violence. CALCASA is committed to ending sexual violence through a multifaceted approach of prevention, intervention, education, research, advocacy and public policy. CALCASA relays the challenges and successes of local work to the statewide and national levels and best practices, evidence-based and practice-based programs at the state and national levels to local constituents. CALCASA.org
STOP STREET HARASSMENTStop Street Harassment (SSH) is a volunteer-run nonprofit organization dedicated to documenting and ending gender-based street harassment worldwide through public education and community mobilization. Our work includes the annual International Anti-Street Harassment Week, the Na-tional Street Harassment Hotline, research reports, and website resources. StopStreetHarassment.org
PROMUNDOPromundo works to promote gender equality and create a world free from violence by engaging men and boys in partnership with women and girls. Since its founding in Brazil in 1997, Promundo has worked with partners to advance this mission by conducting cutting-edge research that builds the knowledge base on masculinities and gender equality; developing, evaluat-ing, and scaling up high-impact gender-transformative interventions and programs; and carrying out campaigns and advocacy initiatives to prevent violence and promote gender justice. PromundoGlobal.org.
RALIANCERALIANCE is a national partnership dedicated to ending sexual violence in one generation. Every day, RALIANCE makes prevention possible by advancing research, influencing policy, supporting innovative programs and helping leaders establish safe workplaces and strong communities. Founded in 2015 through a multimillion dollar seed investment by the National Football League, RALIANCE is based in Washington, DC. RALIANCE.org
This study was jointly funded by four organizations: Center on Gender Equity and Health (GEH) at UC San Diego, Stop Street Harassment, California Coalition Against Sexual Assault, and Promundo.

MEASURING #METOO IN CALIFORNIA , 2019 | A Statewide Assessment of Sexual Harassment and Assault 4
ADVISORY COMMITTEEThis survey builds on the 2018 survey — see that report for the full list of the advisory committee. The following people also gave input on this updated survey in 2019.
ANNIE E. CLARKCo-author of We Believe You: Survivors of Campus Sexual Assault Speak Out
BRIAN P. HEILMANSenior Research Officer, Promundo
NICOLE E. JOHNS, MPHResearch Data Analyst, Center on Gender Equity and Health, University of California, San Diego
HOLLY KEARLFounder, Stop Street Harassment and author of the 2018 report
DAVID S. LEE, MPH Director of Prevention, California Coalition Against Sexual Assault, PreventConnect, RALIANCE
PATRICK RYNE MCNEIL, MAStop Street Harassment Board Member and civil rights advocate
LAURA PALUMBO, MADirector of Communications, National Sexual Violence Resource Center, RALIANCE
BRITNAE PURDY, MAStop Street Harassment Board Member and Project Coordinator to Reduce Sexual Assault, Domestic Violence and Stalking at the University of Mary Washington
ANITA RAJ, PHDTata Chancellor Professor of Medicine, School of Medicine; Professor of Education Studies, Division of Social Sciences; and the Director of the Center on Gender Equity and Health, University of California, San Diego
CHAI SHENOY, ESQCo-Founder of Collective Action for Safe Spaces
JASMINE TUCKER, MADirector of Research, National Women’s Law Center
NANCY XIONG, MAStop Street Harassment Board Member and Associate Director, Women & Gender Studies, George Mason University

MEASURING #METOO IN CALIFORNIA , 2019 | A Statewide Assessment of Sexual Harassment and Assault 5
ACKNOWLEDGMENTSThis report was authored by Nicole E. Johns, Dr. Anita Raj, David S. Lee and Holly Kearl. All analyses used in this report were conducted by Nicole E. Johns.
This study draws California specific data and analysis used in the report Measuring #MeToo: A National Study on Sexual Harassment and Assault (http://www.stopstreetharassment.org/our-work/nationalstudy/2019study/)
This study was jointly funded by four organizations: Center on Gender Equity and Health (GEH) at UC San Diego, Stop Street Harassment, California Coalition Against Sexual Assault, and Promundo. We thank our donors and funders for making this report possible. Each organization provided key input throughout the process as well as pro bono advice and work. Notably, GEH generously provided pro bono data analysis.
Special thanks to:
MEGAN THOMASCommunications specialist with RALIANCE, who gave copy editing of the report.
LORENA CAMPOS Communications coordinator with CALCASA, who gave copy editing input of the report.
CELESTE ESPINOZA Graphic designer with CALCASA, who designed and laid out the report.
BRUCE BARR At NORC, who was instrumental in the execution of this national survey and worked with SSH on two prior surveys (2014, 2018) when he was employed by GfK.

MEASURING #METOO IN CALIFORNIA , 2019 | A Statewide Assessment of Sexual Harassment and Assault 6
DEFINITIONS FOR THE REPORT The Centers for Disease Control and Prevention defines sexual violence as “a sexual act that is committed or attempted by another person without freely given consent of the victim or against someone who is unable to consent or refuse.”1
This is inclusive of forced sex acts, as well as unwanted non-penetrative sexual contact, or non-contact unwanted sexual experiences.
For this report, we used the terms as follows, delineating forced sex acts from other sexual abuses and using the terms sexual assault and sexual harassment, to be more consistent with the terms of the #MeToo movement.
SEXUAL ASSAULTThis term involves a sexual act that someone was forced to do against their will and without their consent. See Table 1 on the next page for the precise wording of the question from the survey. When assessing reported perpetration of sexual assault, the exact same phrasing of the survey item was used, but we switched it to reflect the respondent doing that act rather than experiencing it.
SEXUAL HARASSMENTThis term includes fourteen different specific actions, categorized into verbal sexual harassment, cyber sexual harassment, and physically aggressive sexual harassment. The specific actions included in the survey are presented in these three categories in Table 1 on the next page. For the sake of concision, the report will frequently refer to these categories by name; this is meant to refer to reported experiences or perpetration of any one or more of the actions within that category. Forced sex acts are excluded from the term “sexual harassment” for this study. When assessing reported perpetration of sexual harassment, the exact same phrasing of these survey items was used, but we switched it to reflect the respondent doing the act rather than experiencing it.
1 Basile KC, et al. 2014. “Sexual Violence Surveillance: Uniform Definitions and Recommended Data Elements, Version 2.0.” National Center for Injury Prevention and Control, Centers for Disease Control and Prevention. https://www.cdc.gov/violenceprevention/pdf/sv_surveillance_definitionsl-2009-a.pdf.

MEASURING #METOO IN CALIFORNIA , 2019 | A Statewide Assessment of Sexual Harassment and Assault 7
DEFINITIONS FOR THE REPORT
Table 1. Detailed Survey Items and Categorization
VERBAL SEXUAL HARASSMENT
• Someone whistling, honking, making kissy noises, “Pssst” sounds, or leering/staring aggressively at you.
• Someone saying things like, “Hey Baby,” “Mmmm Sexy,” “Yo Shorty,” “Mami/Mamacita,” “Give me a smile,” or similar comments in a way that is disrespectful and/or unwanted and/or made you feel unsafe.
• Someone calling you a sexist slur, like “Bitch,” “Slut,” “Cunt,” “Ho” or “Thot.”
• Someone misgendering you or calling you a homophobic or transphobic slur, like “Fag,” “Dyke,” or “Tranny.”
• Someone talking about your body parts inappropriately or offensively (such as your legs, crotch, butt, or breasts), saying sexually explicit comments (“I want to do BLANK to you”) or asking inappropriate sexual questions.
• Someone making threats to harm you, to harm someone you know, or to share personal information you don’t want shared (examples could include your sexual orientation or drug use history or immigration status)
• Someone saying you must date them or do a sexual act for them in exchange for something (such as a good grade, a promotion, a job, drugs, food, or something similar) or instead of something (like paying rent or a citation, etc).
• Someone repeatedly asking you for a date or your phone number when you’ve said no or ignored them.
CYBER SEXUAL HARASSMENT
• Someone repeatedly texting or calling you in a harassing way.
• Someone electronically sending you or showing you sexual content without your permission, such as over e-mail, snapchat or Facebook or on their phone or computer.
• Someone taking and/or sharing sexual pictures or videos of you without your permission.
PHYSICALLY AGGRESSIVE SEXUAL HARASSMENT
• Someone flashing or exposing their genitals to you without your permission.
• Someone physically following you without your permission.
• Someone purposely touching you or brushing up against you in an unwelcome, sexual way.
SEXUAL ASSAULT • Someone forcing you to do a sexual act without your permission or one that you don’t want to do (including while you are under the influence of alcohol or drugs).

MEASURING #METOO IN CALIFORNIA , 2019 | A Statewide Assessment of Sexual Harassment and Assault 8
EXECUTIVE SUMMARYThis 2019 California survey reconfirms the findings of the 2019 national survey Measuring #MeToo: A National Study on Sexual Harassment and Assault: sexual harassment and assault are widespread problems in California, causing pain, limiting people’s lives, and negatively affecting communities and society. Study results show that most women and men have experienced one or more form of harassment and assault, while a comparably smaller proportion tell us that they’ve ever committed these acts. This may indicate that many abusers are repeat offenders who abuse multiple people. The findings add to the large evidence base demonstrating that nearly all instances where someone is accused of sexual harassment are based in fact, and most respondents believe those who make high profile accusations. This study highlights that we must do more to stop and prevent sexual assault and harassment earlier.
Methodology This report presents the findings of a state representative survey of 278 women and 222 men, ages 18 and up, conducted online in February - March 2019. The UC San Diego Center on Gender Equity and Health (GEH) conducted all data analyses.
Key Findings1. Sexual harassment and assault pose a significant problem, especially for women.
• Statewide, 86% of women and 53% of men reported experiencing some form of sexual harassment and/or assault in their lifetime.
• More than 4 in 5 women (81%) and almost half of men (48%) experienced verbal sexual harassment;
• Nearly 1 in 2 women (44%) and 1 in 3 men (31%) were sexually touched in an unwelcome way;
• 4 in 10 women (39%) and 1 in 3 men (31%) experienced cyber sexual harassment;
• More than 1 in 4 women (26%) and 1 in 7 men (15%) were physically followed;
• 1 in 3 women (32%) and around 1 in 7 men (15%) faced unwanted genital flashing;
• 1 in 4 women (26%) and 1 in 10 men (10%) survived sexual assault.
2. Sexual minority men and women are at disproportionate risk for sexual harassment.
• Lesbian and bisexual women respondents were significantly more likely than straight women to report harassment (98% versus 86%); as well as sexual assault (81% versus 25%). Harassment was also more com-monly reported by gay and bisexual men (92%) than straight men (52%); in particular, physically aggressive sexual harassment was more common, reported by 77% of gay and bisexual men, versus 35% of straight men.
3. Women are most likely to experience sexual harassment in public spaces and from strangers, where men are most likely to experience sexual harassment in institutional settings such as schools and the workplace and from peers.
• Among all women, most (77%) reported experiencing sexual harassment it in a public space, like on the street or in a store, and half (50%) reported experiencing sexual harassment in their institutions, such workplace or school. Men most frequently report sexual harassment occurring in institutions (37%) followed by public spaces (35%).

MEASURING #METOO IN CALIFORNIA , 2019 | A Statewide Assessment of Sexual Harassment and Assault 9
EXECUTIVE SUMMARY | Key Findings
• Women who reported experiencing harassment and/or assault most frequently reported that a stranger had been involved in at least one incident (50% of women reporting harassment only; 65% of women reporting harassment and assault). Men experiencing harassment or assault most frequently reported that a coworker (40% of those experiencing harassment only) or a classmate (50% of those experiencing harassment and assault) was involved in at least one incident.
4. Men born outside the US are more likely than men born in the US to report that they have experienced sexual harassment.
• Men born outside the US were significantly more likely than men born in the US to report that they had experienced sexual harassment (75% vs 49%). In particular, they were more likely to experience verbal harassment (73% vs 44%) and more likely to experience cyber harassment (65% vs 25%).
5. Effects of sexual harassment and assault include anxiety and depression, as well as altering life and activities. Reporting to authorities is rare.
• Among those affected by sexual harassment and/or assault, 38% of women and 14% of men report anxiety or depression as a consequence of the abuse. Additional common responses included ending a relationship (25% of women, 13% of men) and even changing a job (15% women, 13% men). Less than 10% of women and men filed an official complaint or report to an authority figure.
6. Most people who said they committed sexual harassment also said they had experienced sexual harassment.
• Among those who reported committing sexual harassment, 95% of women and 80% of men reported experiencing it too. In contrast, among those who reported never having committed sexual harassment, 80% of women and 36% of men reported experiencing it.
7. While experiences of sexual harassment and assault are highly prevalent, accusations of sexual harassment and assault are very rare.
• While over one-third of people reported perpetration of sexual harassment or assault, less than 5% of individuals have ever been accused of these abuses, formally or informally.
8. Beliefs related to high profile allegations of sexual harassment and assault are comparable for women and men.
• More people believed harassment or assault happened in most or all cases (56% of women, 51% of men) than believed that harassment or assault did not happen in most cases (8% of women, 8% of men). Most people said that the veracity of high profile sexual harassment and assault allegations varied from cases to case, and that some were true, and some were untrue (36% of women and 41% men). More than one in 20 women and men view all recent high profile allegations as lies.
MEASURING #METOO IN CALIFORNIA , 2019 | A Statewide Assessment of Sexual Harassment and Assault 10
INTRODUCTION Building on their 2018 national study2 that provided the data behind people’s #MeToo stories, in 2019, Stop Street Harassment and The UC San Diego Center on Gender Equity and Health released an updated national report on sexual harassment and assault, and, for the first time, a state-representative report for California, in partnership with the California Coalition Against Sexual Assault.
California is an important place to examine the current state of sexual harassment and assault in the US; it is where the #MeToo movement has received much attention since 2017 in response to demands for accountability for those in the entertainment industry, such as Harvey Weinsten, who sexually harassed and assaulted actors and others for decades with impunity. The past two years have resulted in more allegations, against leaders in the state’s illustrious academic institu-tions, technology industry, and in national politics. Yet, despite the growing activism of the movement, there is some evidence of ongoing concerns, including indications of higher rates of sexual harassment and assault seen in the west than in other regions in the United States.
California is also where innovative prevention efforts have emerged. California is the only state that has grants from all four CDC violence prevention grant programs (DELTA Impact, Rape Prevention and Education, Essentials for Childhood and Preventing Teen Dating and Youth Violence by Addressing Shared Risk and Protective Factors) and home of Coaching Boys into Men, an evidence-based sexual violence and teen dating violence prevention program. Public health programs, legislators and prevention education experts are examining investments in prevention. In California, colleges and universities have affirmative consent standards to use in campus sexual assault cases after groundbreaking legislation was passed in 2014. 3
This 2019 California survey includes data on the scope and scale of sexual harassment and assault in our state. It also includes questions and findings around experiences and beliefs related to accusations of sexual harassment and assault, added in light of a few events that occurred since early 2018 that sparked national debate. These two main events were Dr. Christine Blasey Ford’s testimony of sexual assault by Brett Kavanaugh during his U.S. Supreme Court nomination hearing, and Department of Education Secretary Betsy DeVos proposed changes the rules guiding schools on how they handle sexual assault allegations.
More people are publicly voicing their fears about false accusations following these two news stories and because of the number of high-profile men who faced retribution within the #MeToo movement since the Fall of 2017.
Our survey, however, shows that the proportion of people who have ever been accused of sexual harassment or assault is much smaller than those who admit to perpetrating it (which we expect is under-reported in our survey). Further, our survey shows that most people believe, to some extent, those who say they have experienced sexual harassment or assault, and at a higher prevalence than that seen nationally.
2 “The Facts Behind the #MeToo Movement: A National Study on Sexual Harassment and Assault,” Stop Street Harassment, February 21, 2018, http://www.stopstreetharassment.org/resources/2018-national-sexual-abuse-report/. 3 Bill Chappell, California Enacts ‘Yes Means Yes’ Law, Defining Sexual Consent, National Public Radio, Septemeber 29, 2014, https://www.npr.org/sections/thetwo-way/2014/09/29/352482932/california-enacts-yes-means-yes-law-defining-sexual-consent
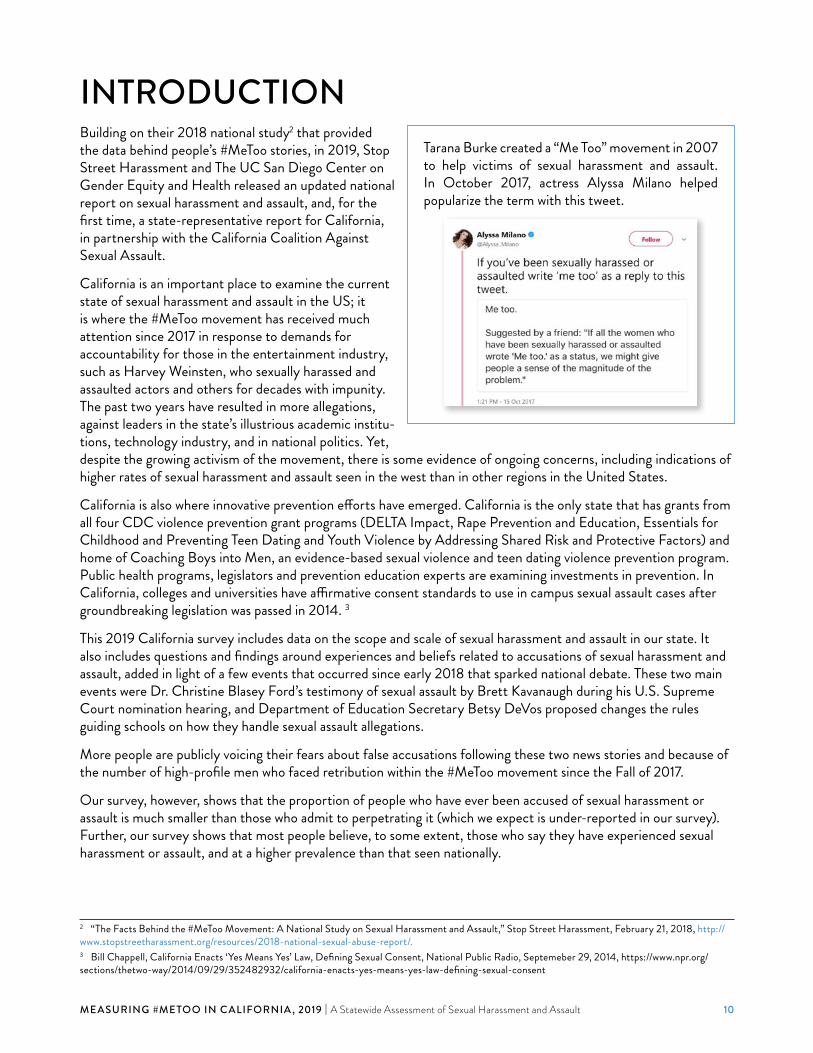
Tarana Burke created a “Me Too” movement in 2007 to help victims of sexual harassment and assault. In October 2017, actress Alyssa Milano helped popularize the term with this tweet.
MEASURING #METOO IN CALIFORNIA , 2019 | A Statewide Assessment of Sexual Harassment and Assault 11
INTRODUCTION
We hope that people who set policies and shape public opinion around accusations will use these findings to inform their efforts. We hope they will recognize that even in a self-reported survey, very few people have ever been accused of sexual harassment or assault compared with those who have said they perpetrated it and especially compared with the many people who said they have experienced it. By and large, when people say they experienced sexual harassment or assault, they are telling the truth.
The report covers information on these main topics:
1. The prevalence of sexual harassment and assault overall.
2. The locations where sexual harassment and assault take place.
3. When sexual harassment and assault most recently occurred.
4. How sexual harassment and assault makes people feel and what they do because of it.
5. The people who commit sexual harassment and assault, including from the view point of those who have experienced it and from those who say they have done it.
6. Accusations of sexual harassment and assault, including the percent of people who say they’ve been accused and what public opinion is for high profile accusation cases.
MEASURING #METOO IN CALIFORNIA , 2019 | A Statewide Assessment of Sexual Harassment and Assault 12
METHODOLOGYUC San Diego GEH and SSH commissioned a nationally representative survey of women and men on sexual harassment and assault with NORC at the University of Chicago, using the AmeriSpeak Panel, the most repre-sentative online probability panel available in the U.S. In addition to this national survey and with support from CALCASA, NORC created a California-specific over-sample from within the AmeriSpeak Panel to examine state-specific results. NORC recruited and surveyed a total sample of N=500 adults living in California aged 18 and older, all of whom were required to complete a forced choice item on sex, in which they identified themselves as female (n=278) or male (n=222). The sample was surveyed in three waves of the AmeriSpeak Omnibus as part of the national survey, with additional California-specific over sample recruitment for one week after; all surveys were collected between February 14 and March 28 2019.
Funded and operated by NORC at the University of Chicago, AmeriSpeak is a probability-based panel designed to be representative of the US household population. Randomly selected US households are sampled using area probability and address-based sampling, with a known, non-zero probability of selection from the NORC National Sample Frame.
These sampled households are then contacted by US mail, telephone, and field interviewers (face to face). The panel provides sample coverage of approximately 97% of the U.S. household population. Those excluded from the sample include people with P.O. Box only addresses, some addresses not listed in the USPS Delivery Sequence File, and some newly constructed dwellings. While most AmeriSpeak households participate in surveys by web, non-internet households can participate in AmeriSpeak surveys by telephone.
Households without conventional internet access but having web access via smartphones are allowed to participate in AmeriSpeak surveys by web. AmeriSpeak panelists participate in NORC studies or studies conducted by NORC on behalf of governmental agencies, academic researchers, and media and commercial organizations.
The survey included this introductory text, to clarify how pervasive the assessed behaviors are and the confidentiali-ty of the survey, a typical practice for surveys on sensitive topics:
“This survey is focused on sexual harassment and abuse, which includes all forms of unwanted sexual, homophobic, transphobic and/or sexist experiences across all areas of people’s lives. Your answers to the questions will be strictly confidential. We are not collecting your name nor any identifying information.
We appreciate and honor you for sharing your experiences in the survey. We know it can be upsetting and challenging. The information from the survey will help advocates, policymakers and educators better under-stand how to address these issues and make communities safer for everyone. Your participation matters, and it will make a difference.”
The full survey is available at www.StopStreetHarassment.org.
Individuals who declined to answer questions were retained in analyses for consistency with national report method-ology. Exclusion of these individuals changed point estimates by no more than 1%.
MEASURING #METOO IN CALIFORNIA , 2019 | A Statewide Assessment of Sexual Harassment and Assault 13
METHODOLOGY
Who Took the Survey?All data were analyzed by the UC San Diego’s Center on Gender Equity and Health. To determine the representa-tiveness of the sample in California, they made comparisons to California census data and projections.
GENDER222 males and 278 females (based on the forced choice response on gender) took the survey and this was weighted to become a sample size of 245 males and 255 females.
REGIONIncluding survey weighting, most respondents were from Southern California (58%, 298 people), 15% from the Central Valley region (76 people), 14% from the Bay region (63 people), and 13% from the Northern/Mountain Valley region (63 people). [Note: We did not consider rural/urban differences, as the vast majority of the sample (99%) resided in a metropolitan area or metropolitan statistical area (MSA). An MSA is “a geographical region with a relatively high population density at its core and close economic ties throughout the area.” Census data also indicate that 95% of state residents are in an urban area.]4
AGEAmong respondents, 31% were aged 18 to 34 (12% age 18-24 and 20% age 25-34), 26% aged 35 to 49, 24% aged 50 to 64, and 19% aged 65 and older. Because people under 18 years old were not included in the survey, the percentages for the age groups that were included are larger than the general population. But for a comparison, 10% of people in California in 2017 Census estimates were age 18 to 24 years, 15% were 25-34, 20% age 35-49, 18% aged 50-64, and 14% were 65 years or older.5
RACE/ETHNICITYParticipants were mostly non-Hispanic White (41%) or Hispanic (35%); an additional 6% were non-Hispanic Black, and 18% were mixed-race/other race. This was comparable to the California population as a whole, which is 37% non-Hispanic White, 39% Hispanic, and 7% non-Hispanic Black.6
SEXUAL ORIENTATION AND GENDER IDENTITYFor the total sample, 3% reported being gay/lesbian or bisexual, which is comparable to state data indicating that 5% of people in the California identify as gay/lesbian, bisexual or transgender.7
DISABILITYSix percent of respondents reported having some type of disability, which is lower than American Community Survey data indicating that 12% of those in California live with a disability.8
FOREIGN BORNFourteen percent of respondents were born outside the US; this is lower than the state average of 27%.9
4 US Census “Urban and Rural.” 2010. https://data.census.gov/cedsci/table?q=California%20urban&table=P2&tid=DECENNIALSF12010.P2&g=0400000US06&vintage=2010&layer=state&cid=P0020015 American Community Survey. “Age and Sex.” 2017. https://data.census.gov/cedsci/table?q=California&table=S0101&tid=ACSST1Y2017.S0101&g=0400000US06&vintage=2017&layer=state&cid=S0101_C01_001E. 6 US Census. “Quick Facts: California.” 2018. https://www.census.gov/quickfacts/ca. 7 Gallup News. “Vermont Leads States in LGBT Identification.” Social & Policy Issues. Feb 6, 2017. https://news.gallup.com/poll/203513/ver-mont-leads-states-lgbt-identification.aspx. 8 American Community Survey. “Disability Characteristics.” 2017. https://data.census.gov/cedsci/table?q=California%20disabili-ty&table=S1810&tid=ACSST1Y2017.S1810&t=Disability&g=0400000US06&vintage=2017&layer=state&cid=S1810_C01_001E. 9 US Census. “Quick Facts: California.” 2018. https://www.census.gov/quickfacts/ca.

MEASURING #METOO IN CALIFORNIA , 2019 | A Statewide Assessment of Sexual Harassment and Assault 14
METHODOLOGY
Notably, there were no significant differences by sex in region, age, race/ethnicity, income, sexual orientation, disability, or being foreign-born. Overall rates of harassment and assault are assessed below by all listed demographic characteristics; due to small cell sizes, demographic comparisons were limited for other survey questions.
Study Limitations1. Sample
Because of the relatively small sample size, some groups like transgender or non-binary folks, Native Americans and Asian Americans, were too small in number to allow for findings specific to these populations. Fortunately, other research has been conducted on various smaller demographics. Appendix B highlights examples of studies on specific demographic groups whose experiences are unable to be reflected in the current study. Also, this survey excluded people without phones, such as people in prison or jail. Finally, we may have under-represen-tation of foreign born residents due to the availability of the survey only in English, and because those without documentation and those who are migratory are less likely to be available to panel studies such as this one.
2. Age Due to the added expense and challenge of gaining parental consent for this topic, the sample is limited to those aged 18 and older.
3. Survey Length Due to a limited budget, the survey was short, but we hope it will inspire future surveys and research.
4. Reliance on Self-Report Measures Sexual harassment and assault measures rely on self-report and are thus vulnerable to recall biases and response biases. The consistency of the responses to the repeated questions in the 2018 and 2019 survey suggest the validity of study findings, however.
5. Challenges in Measuring Use of Harassment and Assault This year’s survey, for the first time, includes a section on self-reported use of sexual harassment and assault behaviors. Measuring self-reported use of harassment and assault carries inherent risks and limitations, includ-ing a well-documented likelihood of producing results that reflect under-reporting of perpetration behavior. In addition, the field of research practice in measuring these behaviors is relatively new and evolving, with no firmly established standard, validated scales or sets of questions yet emerging. As such, in the interest of continuing to advance this research practice, the questions comprising this section in our study had never been fielded before. As discussed in the relevant section below, lower rates of reported use of sexual harassment and assault in the 2019 survey as compared to rates of experiencing victimization of sexual harassment and assault are to be expected, and also support the conclusion that people who commit sexual harassment and assault may have multiple victims. Furthermore, the survey asked identical questions related to use of harassment and assault behaviors to respondents of all gender identities. Findings therefore require careful consideration related to ways in which the qualitative nature or cultural context of certain acts/questions may shift based on the gender of the person using the behavior and their relative position in a patriarchal society.
MEASURING #METOO IN CALIFORNIA , 2019 | A Statewide Assessment of Sexual Harassment and Assault 15
SURVEY FINDINGSAll survey respondents answered the first of the seven questions to indicate whether they had experienced sexual harassment and/or assault. They were shown the descriptors for 14 types of sexual harassment one at a time and also, a descriptor for sexual assault. They were asked whether they had ever experienced that type of sexual harassment and assault, and if they answered yes, they were asked where it occurred (with 15 location options). If they answered, “No,” to ever experiencing all forms of harassment and assault, the survey went on to question five through seven. Respondents who selected at least one sexual harassment or assault experience answered all six remaining questions.
Analyses were weighted to provide nationally representative prevalence estimates. Bivariate analyses were conduct-ed to assess significant associations (at p<0.05) between sexual harassment and assault on key demographics, when the sample size allowed.
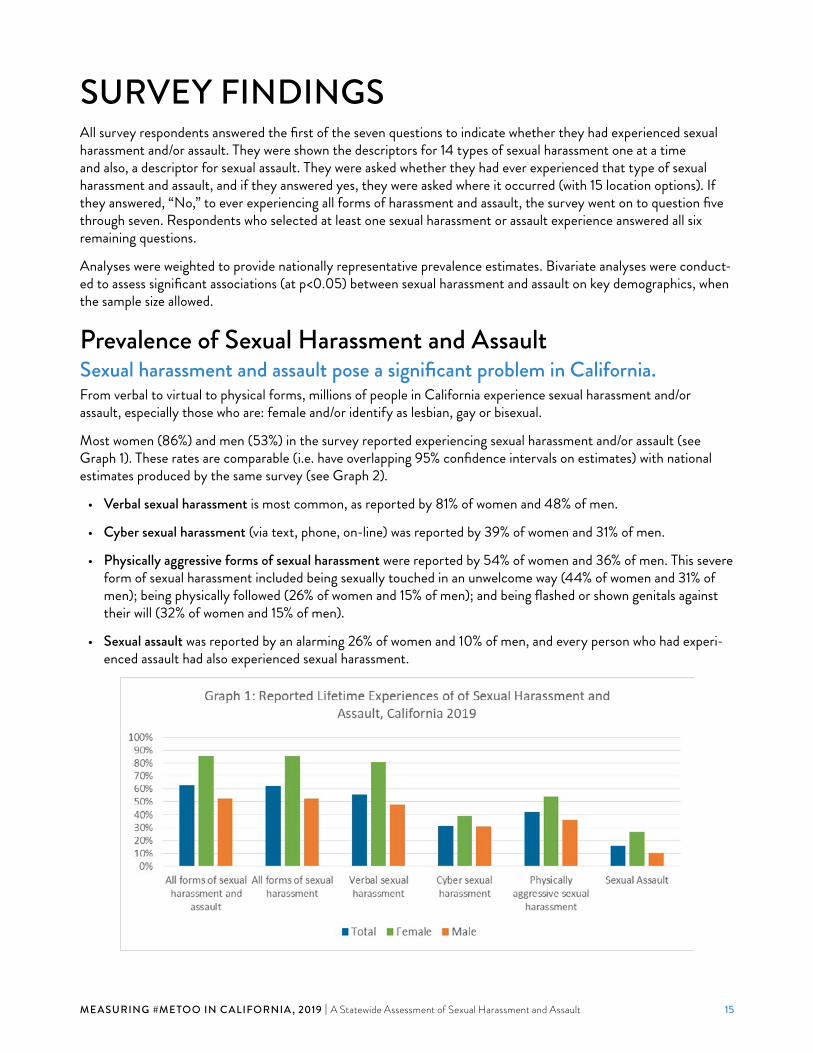
Prevalence of Sexual Harassment and AssaultSexual harassment and assault pose a significant problem in California. From verbal to virtual to physical forms, millions of people in California experience sexual harassment and/or assault, especially those who are: female and/or identify as lesbian, gay or bisexual.
Most women (86%) and men (53%) in the survey reported experiencing sexual harassment and/or assault (see Graph 1). These rates are comparable (i.e. have overlapping 95% confidence intervals on estimates) with national estimates produced by the same survey (see Graph 2).
• Verbal sexual harassment is most common, as reported by 81% of women and 48% of men.
• Cyber sexual harassment (via text, phone, on-line) was reported by 39% of women and 31% of men.
• Physically aggressive forms of sexual harassment were reported by 54% of women and 36% of men. This severe form of sexual harassment included being sexually touched in an unwelcome way (44% of women and 31% of men); being physically followed (26% of women and 15% of men); and being flashed or shown genitals against their will (32% of women and 15% of men).
• Sexual assault was reported by an alarming 26% of women and 10% of men, and every person who had experi-enced assault had also experienced sexual harassment.

MEASURING #METOO IN CALIFORNIA , 2019 | A Statewide Assessment of Sexual Harassment and Assault 16
SURVEY FINDINGS | Prevalence of Sexual Harassment and Assault
The top five most frequently selected forms of sexual harassment and assault by gender in 2019 are:
WOMEN• Someone whistling, honking, making kissy noises, “Pssst” sounds, or leering/staring aggressively at you. (70%)
• Someone saying things like, “Hey Baby,” “Mmmm Sexy,” “Yo Shorty,” “Mami/Mamacita,” “Give me a smile,” or similar comments in a way that is disrespectful and/or unwanted and/or made you feel unsafe. (64%)
• Someone calling you a sexist slur, like “Bitch,” “Slut,” “Cunt,” “Ho” or “Thot.” (51%)
• Someone purposely touching you or brushing up against you in an unwelcome, sexual way. (44%)
• Someone talking about your body parts inappropriately or offensively (such as your legs, crotch, butt, or breasts), saying sexually explicit comments (“I want to do BLANK to you”) or asking inappropriate sexual questions. (44%)
MEN • Someone purposely touching you or brushing up against you in an unwelcome, sexual way. (31%)
• Someone talking about your body parts inappropriately or offensively. (25%)
• Someone whistling, honking, making kissy noises, “Pssst” sounds, or leering/staring aggressively at you. (24%)
• Someone electronically sending you or showing you sexual content without your permission. (23%)
• Someone repeatedly asking you for a date or your phone number when you’ve said no or ignored them. (22%)
See Graph 3 for more information.

MEASURING #METOO IN CALIFORNIA , 2019 | A Statewide Assessment of Sexual Harassment and Assault 17
SURVEY FINDINGS | Prevalence of Sexual Harassment and Assault
It is also worth highlighting the following two findings:
• Being called a homophobic or transphobic slur was one of the most frequently selected forms of sexual harass-ment for men (20%), while it was the least selected form of harassment for women (11%). It is one of only two forms of harassment that was more commonly reported by men than by women, though not significantly more so (p=0.06).
• Quid-pro-quo sexual harassment (in this context meaning “something for something” between someone with power over someone else) was not as frequently selected as other forms, but it was still notable. Around 10% of women and 8% of men said someone told them they must date them or do a sexual act for them in exchange for something (such as a good grade, a promotion, a job, drugs, food, or something similar) or instead of some-thing (like paying rent or receiving a citation).

MEASURING #METOO IN CALIFORNIA , 2019 | A Statewide Assessment of Sexual Harassment and Assault 18
SURVEY FINDINGS | Prevalence of Sexual Harassment and Assault
Prevalence of Sexual Harassment and Assault by Various DemographicsOverall, sexual harassment is so common for women of all backgrounds that most differences by demographic groups as far as if they have experienced sexual harassment ever or not are not statistically significant. One excep-tion is sexual orientation; Women who identify as lesbian or bisexual were more likely to report experiencing both sexual harassment and assault than straight women.
Among men, gay and bisexual men and younger men were more likely to report harassment than straight men and older men, respectively. There were no significant differences by demographics in terms of reported assault among men.
RACE/ETHNICITYAny slight differences in experiences of harassment and assault across racial/ethnic groups for women and men were not statistically significant.
SEXUAL ORIENTATION
Table 1: Prevalence by Sexual Orientation and Gender, California 2019
Sexual Harassment Overall
Physically Aggressive Sexual Harassment Sexual Assault
Lesbian/Bisexual Women 98% 90% 81%
Straight Women 86% 54% 25%
Gay/Bisexual Men 92% 77% 26%
Straight Men 52% 35% 10%
HOUSEHOLD INCOMEOverall, there was no meaningful difference by annual household income for sexual harassment or assault for both women and men.
DISABILITYThere were no significant differences in reports of sexual harassment or assault between women with and without disabilities. Men with disabilities were more likely to experience physically aggressive sexual harassment than men without disabilities (64% vs 34%, p=0.05). Other forms of harassment and assault did not differ significantly for men based on disability.
AGEPeople were asked about their experiences of sexual harassment and assault ever, so one would expect older respondents to be more likely to report experiences than younger respondents. This was the case for most forms of harassment for women, though differences by age were not statistically significant. For men, however, older men (65+) were the least likely to report harassment.10 In particular, verbal sexual harassment was most common for younger men (78% of men 18-24) and least common among older men (12% of men 65+, p=0.004). Other forms of harassment and assault did not differ significantly by age.
10 The reason for this lower reporting among the oldest individuals is unclear: 1) If most incidents of sexual abuse take place in people’s younger years, do older people not remember many of those incidents but they did have them? 2) Are older people less likely to identify the examples provided of sexual abuse as sexual abuse compared with younger people? 3) Did sexual harassment and assault occur less in decades past, perhaps due to fewer women being in public spaces, workplaces and institutions of higher education? 4) Were forms of sexual violence so normalized that older people do not identify them as abuse? 5) Some other reason?

MEASURING #METOO IN CALIFORNIA , 2019 | A Statewide Assessment of Sexual Harassment and Assault 19
SURVEY FINDINGS | Prevalence of Sexual Harassment and Assault
REGIONThere were no significant differences in rates of reported harassment for men or women by region of California. Men in the Bay region were more likely to report assault than men in other regions (29% vs 4-9%, p=0.04); there was no other significant difference in rates of reported assault by region of the state for women.
FOREIGN-BORN STATUSMen born outside the US were significantly more likely than men born in the US to report that they had experienced sexual harassment (75% vs 49%, p=0.04). In particular, they were more likely to experience verbal harassment (73% vs 44%, p=0.02) and more likely to experience cyber harassment (65% vs 25%, p=0.002); there was not a significant difference in experience of physically aggressive harassment or assault for men born within or outside the US. No statistically significant differences in reported harassment or assault were observed for women by foreign vs US-born status.
Locations Where Sexual Harassment and Assault OccurA public space was the most frequently reported location for sexual harassment, and a private residence was the most frequently reported location for sexual assault. For every instance of sexual harassment or assault that respondents had experienced, they were asked to specify the location where this act took place. Possible locations included known residences, public places, online spaces, and/or institutions known to participants. See Table 2 for a complete list.
Among all women surveyed, most (77%) reported experiencing sexual harassment in public spaces; 74% in a public space like on the street or in a store, 40% at a nightlife venue, and 29% on mass transit. Half of women (50%) experienced harassment at an institution, with around one-third of all women reporting sexual harassment in their workplace (36%) or at school (39%). One third (33%) also reported experiencing harassment at their own home or place of residence.
Men also reported sexual harassment occurring in institutions (37%) and in public (35%). Around one-quarter of men reported experiencing sexual harassment in their workplace (28%) or at a school (23%). One-third reported experiencing harassment in a public space like on the street or in a store (32%), and one-fifth reported experiencing harassment on mass transportation (19%). One quarter (23%) also reported experiencing harassment at their own home or place of residence.
In terms of sexual assault, women most commonly report it occurring in someone else’s home (14%), where men most commonly reported it occurring at school (4%).

MEASURING #METOO IN CALIFORNIA , 2019 | A Statewide Assessment of Sexual Harassment and Assault 20
SURVEY FINDINGS | Locations Where Sexual Harassment and Assault Occur
Table 2: Prevalence of Sexual Harassment by Location Among All Respondents, California 2019
Female Male Total
Known Residence/Car 46% 27% 37%
Your home or place of residence 33% 23% 28%
Someone else’s home or place of residence 28% 18% 23%
Your car or the car of a person you knew 17% 14% 15%
Public Spaces 77% 35% 56%
A public space (like a street, park, beach, store, restaurant, mall, library, movie theater, museum, swimming pool, gym) 74% 32% 53%
Mass transportation (bus, subway, metro, train or airplane) 29% 19% 24%
Taxi or ride-sharing service driven by someone you didn’t know 4% 9% 6%
Nightlife venue (like a concert, bar or club) 40% 18% 29%
Online 37% 21% 29%
Online (such as over e-mail or social media platforms) 28% 17% 23%
By phone (texting or calls) 30% 12% 21%
Participants’ Institutions 50% 37% 44%
Participants’ schools (elementary through university) 39% 23% 31%
Your elementary school 6% 8% 7%
Your middle school 17% 16% 16%
Your high school 31% 19% 25%
Your university or college or technical training school 20% 9% 15%
Your workplace, including temporary jobs and internships 36% 28% 32%
Other Location Not Listed 11% 6% 9%

MEASURING #METOO IN CALIFORNIA , 2019 | A Statewide Assessment of Sexual Harassment and Assault 21
SURVEY FINDINGS
How Recently People Experienced Sexual Harassment or AssaultAround one in three women and men who experienced sexual harassment or assault said it had most recently occurred within the past year. Participants who reported ever experiencing sexual harassment or assault were asked when the most recent incident occurred. One-third of women (35%) and men (34%) in this subsample said the most recent experience occurred in the past year, and 55% of all respondents said the most recent experience took place in the past five years.
Lesbian and bisexual women were more likely than straight women (78% vs 34%, p=0.01) to report that harassment had occurred within the past year; no such difference was observed for men.
Notably, 89% of men who reported experiencing harassment in the past year reported harassment in a public place, compared with 54% of men who reported last experiencing harassment more than a year ago (p=0.002). Similarly, 98% of women reporting harassment within the past year reported harassment in a public place, compared with 86% of women who reported last experiencing harassment more than a year prior (p<0.001).
The Impact of Sexual Harassment and Assault The most frequent response to experiencing sexual harassment and assault was feeling anxiety or depression. The survey also asked respondents to share whether they had experienced any one or more of ten possible respons-es or effects of victimization of harassment or assault. Among these, the most frequently selected outcomes of respondents’ experiences of sexual harassment and assault were similar by sex, though women were significantly more likely than men to report these effects. The top outcome was feeling anxiety or depression (38% women, 14% men). The next most frequently selected response was to end a relationship due to the abuse (25% of women, 13% of men). The third most frequently selected response for women was to change one’s route or regular routine (24% women, 10% men); the third most frequently select response for men was to seek a new job assignment, change jobs, or quit a job (15% women, 13% men). Notably, only 1 in 12 women and men (8%) filed an official complaint or report to an authority figure, including filing a police report. A full list is found in Graph 4. Lesbian and bisexual women were more likely than straight women to report feeling depressed or anxious and make changes to their lives (p=0.01). No other differences by demographics were observed.

MEASURING #METOO IN CALIFORNIA , 2019 | A Statewide Assessment of Sexual Harassment and Assault 22
SURVEY FINDINGS
People Who Commit Sexual Harassment and AssaultWomen face greater risk for sexual harassment and even assault from strangers, where men face greater risk from peers, such as classmates and co-workers. Among women who had experienced sexual harassment and/or assault, strangers (50% of women reporting ha-rassment alone; 65% of women reporting harassment and assault) were the most commonly reported perpetrators. Among men who had experienced harassment only, a co-worker was the most common perpetrator, reported by 40%, but among those who had experienced harassment and assault, a classmate was the most frequent perpetra-tor, reported by 50%. See Graphs 5 and 6 for more information.

MEASURING #METOO IN CALIFORNIA , 2019 | A Statewide Assessment of Sexual Harassment and Assault 23
SURVEY FINDINGS | People Who Commit Sexual Harassment and Assault
Respondents could indicate if they had ever committed acts of sexual harass-ment or assault, and over one-third reported perpetration of sexual harassment, mostly as verbal abuse. In 2019, for the first time, we included a series of questions to ascertain whether the respondent had ever com-mitted sexual harassment or assault themselves. Mirroring the questions on experiences of sexual harassment or assault, respondents were asked whether they themselves had ever done any of the same 15 acts, “when others did not willingly agree to [the act] or did not want to have [the act], or you were unsure if they wanted to have [the act] but you did it anyway.” See Table 1 in the Definitions section. Findings indicate that over one-third of participants (37% of men and 39% of women) reported ever committing harassment, and 6% of men and <1% of women report-ed ever committing sexual assault. See Graph 7 for further detail.
Notably higher reporting of experiencing rather than committing these abuses may be due to under-reporting of perpetration, given the sensitivity (and, for some items, illegality) of the related acts. There is some evidence that this under-reporting among men may be even greater than that seen for women.11 Differences in how women and men tend to understand sexual harassment and assault may impact their awareness level when self-reporting their own actions. It may also be the case that those committing these offenses do so against multiple individuals, a finding demonstrated in prior research on sexual violence.12
11 Reed, E., Gupta, J., & Silverman, J. G. (2014). “Understanding sexual violence perpetration.” JAMA pediatrics, 168(6), 581. doi:10.1001/jamapediat-rics.2013.5408.12 Reed, E., Gupta, J., & Silverman, J. G. (2014). “Understanding sexual violence perpetration.” JAMA pediatrics, 168(6), 581. doi:10.1001/jamapediat-rics.2013.5408.

MEASURING #METOO IN CALIFORNIA , 2019 | A Statewide Assessment of Sexual Harassment and Assault 24
SURVEY FINDINGS | People Who Commit Sexual Harassment and Assault
The findings on self-reported use of harassment and assault behaviors tell a complex story. First, it is a testament to the widespread prevalence of harassment and assault in the California that fully one-third of respondents report using one or more of these behaviors in their lifetime. But it is also essential to consider that the ways in which women and men approach, interpret, and experience these behaviors (and the survey questions about them) may likely vary based on the gendered nature of certain of these actions.
For example, the one and only action women reported more frequently than men (though the difference in report-ing rates was not significant) was “calling someone a sexist slur like ‘bitch,’ ‘slut,’ ‘cunt,’ ‘ho,’ or ‘thot.’” In interpreting this finding, it is essential to recognize that these slurs are gendered in their nature: they imply a female subject and are most often directed at women. Therefore, for this item, we must recognize that there is an important qualitative difference when a member of the group demeaned by a particular slur (women in this case) uses this word, by comparison to when this word is used by a member of another, more privileged, group (men in this case). It is simply not accurate to directly equate women’s use of these terms with men’s use of these terms, as if the act is identical in its cultural connotation and implication regardless of the gender of the person using the terms. Certainly, these terms can be wielded in harassing and abusive ways by members of all genders, but the gendered nature of the terms is undeniable and must affect our interpretation. For comparison, readers may consider slurs of a racist and homophobic nature, and the qualitatively different social meaning and impact when these words are wielded against marginalized groups from the outside as compared to when they are used within the marginalized group.
While our initial analysis of overall rates of self-reported harassment and assault behaviors showed that perpetration did not differ in statistically significant ways by the gender of the respondent, this equivalence altered upon removal of the “sexist slurs” item from our definition of harassment. Upon removal of this variable, we see a statistically significant difference suggesting that men are more likely to engage in behaviors of sexual harassment and assault as compared to women (34% of men vs 20% of women, p=0.04).
Most people who said they committed sexual harassment also said they had experienced sexual harassment. Experiencing and committing sexual harassment and assault appear to be connected. Among those who reported committing sexual harassment, 95% of women and 80% of men reported experiencing it, too (p=0.03). In contrast, among those who reported never having committed sexual harassment, 80% of women and 36% of men reported experiencing it (p<0.001).
These findings are consistent with prior research on adolescent cyber-sexual harassment13 and military contexts,14 and suggest that contexts or cultures that are more tolerant of these behaviors may connect perpetration and victimization.
13 Ybarra ML, Espelage DL, Mitchell KJ. “The co-occurrence of internet harassment and unwanted sexual solicitation victimization and perpetration associations with psychosocial indicators.” J Adolesc Health. 2007 Dec;41(6 Suppl 1):S31-41. 14 Morral, A. R., Gore, K., & Schell, T. L. (2015). Sexual Assault and Sexual Harassment in the U.S. Military: Volume 2. Estimates for Department of Defense Service Members from the 2014 RAND Military Workplace Study. Retrieved from Santa Monica, CA: https://www.rand.org/pubs/research_re-ports/RR870z2-1.html.
MEASURING #METOO IN CALIFORNIA , 2019 | A Statewide Assessment of Sexual Harassment and Assault 25
SURVEY FINDINGS
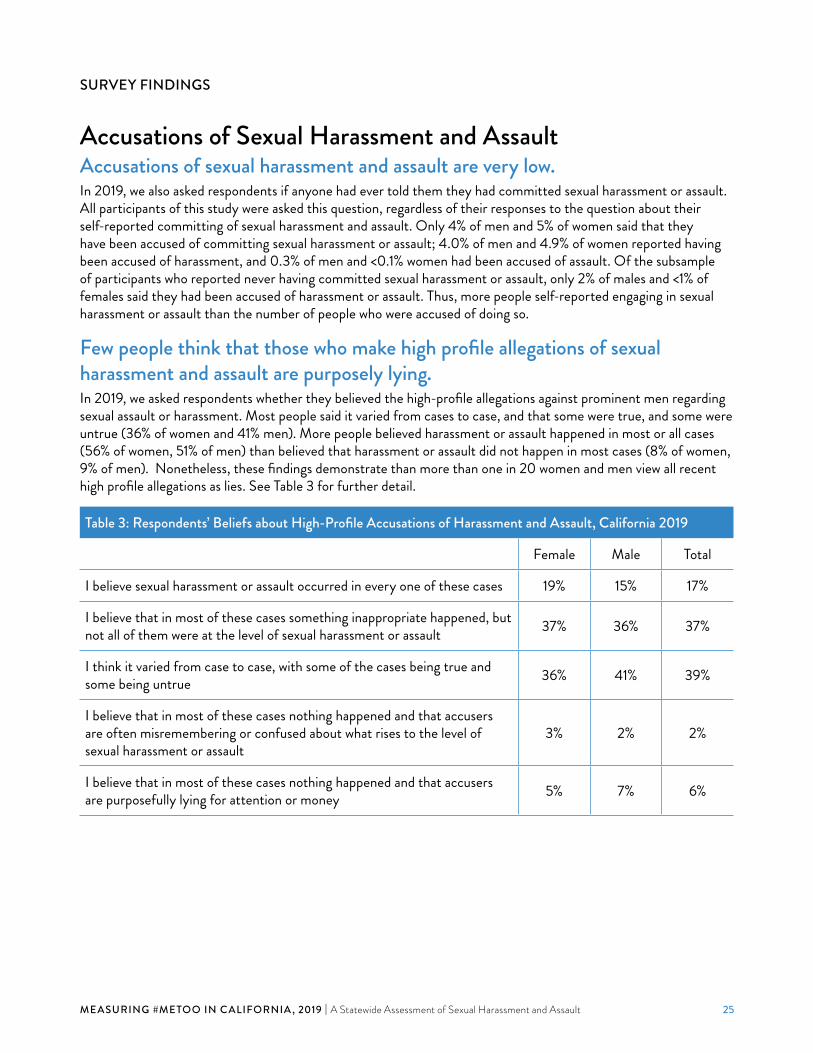
Accusations of Sexual Harassment and Assault Accusations of sexual harassment and assault are very low.In 2019, we also asked respondents if anyone had ever told them they had committed sexual harassment or assault. All participants of this study were asked this question, regardless of their responses to the question about their self-reported committing of sexual harassment and assault. Only 4% of men and 5% of women said that they have been accused of committing sexual harassment or assault; 4.0% of men and 4.9% of women reported having been accused of harassment, and 0.3% of men and <0.1% women had been accused of assault. Of the subsample of participants who reported never having committed sexual harassment or assault, only 2% of males and <1% of females said they had been accused of harassment or assault. Thus, more people self-reported engaging in sexual harassment or assault than the number of people who were accused of doing so.
Few people think that those who make high profile allegations of sexual harassment and assault are purposely lying. In 2019, we asked respondents whether they believed the high-profile allegations against prominent men regarding sexual assault or harassment. Most people said it varied from cases to case, and that some were true, and some were untrue (36% of women and 41% men). More people believed harassment or assault happened in most or all cases (56% of women, 51% of men) than believed that harassment or assault did not happen in most cases (8% of women, 9% of men). Nonetheless, these findings demonstrate than more than one in 20 women and men view all recent high profile allegations as lies. See Table 3 for further detail.
Table 3: Respondents’ Beliefs about High-Profile Accusations of Harassment and Assault, California 2019
Female Male Total
I believe sexual harassment or assault occurred in every one of these cases 19% 15% 17%
I believe that in most of these cases something inappropriate happened, but not all of them were at the level of sexual harassment or assault 37% 36% 37%
I think it varied from case to case, with some of the cases being true and some being untrue 36% 41% 39%
I believe that in most of these cases nothing happened and that accusers are often misremembering or confused about what rises to the level of sexual harassment or assault
3% 2% 2%
I believe that in most of these cases nothing happened and that accusers are purposefully lying for attention or money 5% 7% 6%
MEASURING #METOO IN CALIFORNIA , 2019 | A Statewide Assessment of Sexual Harassment and Assault 26
CONCLUSIONIn the eighteen months after the #MeToo Movement gained national traction, some state legislatures and various industries have taken actions toward addressing sexual harassment and assault. In 2018, for example, the California legislature provided $5 million in one-time funding for rape crisis center programs.
Yet our study demonstrates that the problem of sexual harassment and assault goes beyond the workplace and the need to provide services to those who have been abused. Public spaces, private residences, and even schools are prime locations for experiences of sexual harassment and assault. A recent report showed the costs of sexual violence in California for one year totaled $140 billion.15 When an alarming 86% of women and 53% of men in California face sexual violations that cause them pain and prompt many to alter their lives in significant ways, we must do more to stop and prevent sexual assault and harassment earlier.
Prevention efforts, including education in schools as early as possible, around issues of consent and harassment are crucial. It is also necessary to shift to a culture where individuals look out for one another, getting involved when they witness inappropriate behavior, and where those who commit sexual harassment and assault are held accountable. This includes holding public figures to high standards to send a clear message that sexual harassment and assault are not tolerated. We must stop the cycle of harassment and abuse and create a better world for the next generation.
While the problem of sexual harassment and assault is high, we can take actions to prevent it. We have learned that prevention works. In order to be effective, prevention programs must be comprehensive and ongoing to reduce sexual harassment and assault. In California there are examples of comprehensive and ongoing programs, such as the California Department of Public Health’s Rape Prevention and Education program and Coaching Boys into Men (developed by California-based Futures Without Violence), that are making differences every day in efforts to prevent violence. However, a greater investment in prevention is necessary to expand these efforts to more communities. With over 10,000 schools in California, a substantial effort is needed to expand the reach of preven-tion programs throughout the state. In a survey of the leading 73 organizations throughout California doing sexual and domestic violence prevention work, comprehensive ongoing prevention work takes place only in 28 preschools, 69 elementary schools, 79 middle schools, and 273 high schools.16 Only through great investments in prevention will be able to shift to reduce the incidence of sexual harassment and assault.
Believing survivors of sexual harassment and assault is also critical. Our study shows that false allegations are rare, particularly in contrast to the high number of people who say they have experienced harassment. Further, our study shows that most people do believe each other, to varying degrees. Our policies should reflect these realities, and it is always necessary to hold those who cause harm accountable.
Finally, our study affirms that in order to prevent harassment and assault, it is necessary to know more about people who commit these acts. Given the limitations of self-reporting perpetration behaviors, the study provides only some insight on individuals who commit sexual harassment and assault, but it is a start. And, it is notable that as many people were willing to self-report as did. We believe more research on these populations is necessary to understand the behaviors we want to end and inform effective prevention efforts.
While we still have more to learn about sexual harassment and assault, this study shows alarming prevalence that should inspire action and more investments in prevention. No one should have to experience trauma caused by harassment and assault.
15 “The Cost and Consequences of Sexual Violence in California” California Coalition Against Sexual Assault. 2018. http://www.calcasa.org/wp-content/uploads/2018/02/CALCASA_CCofSV_FINALSpreads_2018.pdf16 California Partnership to End Domestic Violence and California Coalition Against Sexual Assault (2019) Prevention Assessment

MEASURING #METOO IN CALIFORNIA , 2019 | A Statewide Assessment of Sexual Harassment and Assault 27
APPENDIX A – OTHER STUDIESThese are examples of resources and studies on sexual harassment and assault that can supplement the findings of this report regarding specific demographics or locations.
Overall Resources: 1 in 6 Statistics: https://1in6.org/get-information/the-1-in-6-statistic/.
Centers for Disease Control and Prevention: Sexual Violence: https://www.cdc.gov/violenceprevention/sexualvio-lence/.
“Cost and Consequences of Sexual Violence in California.” California Coalition Against Sexual Assault, 2018.http://www.calcasa.org/wp-content/uploads/2018/02/CALCASA_CCofSV_FINAL_2018.pdf
Love is Respect: Dating Abuse Statistics: http://www.loveisrespect.org/resources/dating-violence-statistics/.
National Intimate Partner and Sexual Violence Survey (NISVS): Summaries and Special reports from the National Center for Injury Prevention and Control, Centers for Disease Control and Prevention https://www.cdc.gov/violenceprevention/datasources/nisvs/index.html.
National Sexual Violence Resource Center Resource Library: http://www.nsvrclibrary.org/.
“Reporting on Rape and Sexual Violence: A Media Toolkit for Local and National Journalists to Better Media Coverage.” Chicago Taskforce on Violence Against Girls & Young Women Media http://www.chitaskforce.org/wp/wp-content/uploads/2012/10/Chicago-Taskforce-Media-Toolkit.pdf.
“Reporting on Sexual Violence: Tips for Journalists.” National Sexual Violence Resource Center. 2017. https://www.nsvrc.org/publications/nsvrc-publications/reporting-sexual-violence-tips-journalists.
“STOP SV: A Technical Package to Prevent Sexual Violence.” Centers for Disease Control and Prevention. 2016. https://www.cdc.gov/violenceprevention/pub/technical-packages.html.
Talking Points: American Journal of Preventive Medicine Releases Lifetime Economic Burden of Rape Among U.S. Adults. National Sexual Violence Resource Center. 2017. https://www.nsvrc.org/publications/nsvrc-publications/talking-points-american-journal-preventive-medicine-releases
LGBTQQIA “2015 Transgender Survey Report.” National Center for Transgender Equality. 2015. http://www.ustranssurvey.org/reports (It includes breakout reports for various racial/ethnic groups and each U.S. state as well as the military.)
Burns, Crosby and Philip Ross. “Gay and Transgender Discrimination Outside the Workplace.” Center for Ameri-can Progress. 2011. https://cdn.americanprogress.org/wp-content/uploads/issues/2011/07/pdf/lgbt_discrimination.pdf.
Grant, Jaime M. et al. “Injustice at Every Turn: A Report of the National Transgender Discrimination Survey.” The National Gay and Lesbian Task Force and the National Center for Transgender Equality. 2011. http://www.thetaskforce.org/static_html/downloads/reports/reports/ntds_full.pdf.
“Key Findings from ‘Sexual Identity, Sex of Sexual Contacts, and Health-Related Behaviors among Students in Grades 9–12 - United States and selected sites, 2015’”. National Sexual Violence Resource Center. 2017. https://www.nsvrc.org/publications/nsvrc-publications-research-briefs/key-findings-sexual-identity-sex-sexual-con-tacts-and.

MEASURING #METOO IN CALIFORNIA , 2019 | A Statewide Assessment of Sexual Harassment and Assault 28
APPENDIX A | Other Studies
DisabilitiesDisability Justice, “Sexual Abuse.” http://disabilityjustice.org/sexual-abuse/.
Not on the Radar: Sexual Assault of College Students with Disabilities. National Council on Disability. 2018. https://www.ncd.gov/publications/2018/not-radar-sexual-assault-college-students-disabilities.
Shapiro, Joseph. “The Sexual Assault Epidemic No One Talks About.” NPR. 8 January 2018. https://www.npr.org/2018/01/08/570224090/the-sexual-assault-epidemic-no-one-talks-about.
Shapiro, Joseph. “From the Frontlines of A Sexual Assault Epidemic: 2 Therapists Share Stories.” NPR. 18 January 2018. https://www.npr.org/2018/01/18/577065301/from-the-frontlines-of-a-sexual-assault-epidemic-two-thera-pists-share-stories.
Shapiro, Joseph. “In Their Words, Adults with Intellectual Disabilities Tell Their Sexual Assault Stories.” NPR. 18 January 2018. https://www.npr.org/2018/01/18/578956859/in-their-words-adults-with-intellectual-disabili-ties-tell-their-sexual-assault-s.
Race/EthnicityAsian Pacific Institute on Gender-Based Violence: https://www.api-gbv.org/.
Indian Law Resource Center: “Ending Violence Against Native Women.” http://indianlaw.org/issue/ending-vio-lence-against-native-women.
“Key Findings from Sexual Violence Victimization and Associations with Health in a Community Sample of African American Women”. National Sexual Violence Resource Center. 2016. https://www.nsvrc.org/publications/key-find-ings-sexual-violence-victimization-and-health-community-sample-african-american-women.
Women of Color Network, “Domestic Violence.” http://www.doj.state.or.us/wp-content/uploads/2017/08/wom-en_of_color_network_facts_domestic_violence_2006.pdf.
People Who Commit Sexual Abuse“Eight Things Everyone Should Know About Sexual Abuse & Sexual Offending.” ATSA. 2014. http://www.atsa.com/pdfs/Policy/8ThingsEveryoneShouldKnow.pdf.
“Unmasking Sexual Harassment: How Toxic Masculinities Drive Men’s Abuse in the US, UK, and Mexico, and What We Can Do To End It.” Promundo. 2018. https://promundoglobal.org/resources/unmasking-sexual-harass-ment/?lang=english
Sedensky, Matt and Normaan Merchant. “Betrayed by the Badge.” Associated Press. 1 November 2015. http://interactives.ap.org/2015/betrayed-by-the-badge.
Public SpacesKearl, Holly. “Unsafe and Harassed in Public Spaces: A National Street Harassment Report.” Stop Street Harass-ment. 2014. http://www.stopstreetharassment.org/our-work/nationalstudy/

MEASURING #METOO IN CALIFORNIA , 2019 | A Statewide Assessment of Sexual Harassment and Assault 29
APPENDIX A | Other Studies
Domestic Relationships/Intimate Partner RelationshipsBrown, Taylor NT and Jody L. Herman. “Intimate Partner Violence and Sexual Abuse Among LGBT People: A Review of Existing Research.” The Williams Institute. 2015. https://williamsinstitute.law.ucla.edu/wp-content/uploads/Intimate-Partner-Violence-and-Sexual-Abuse-among-LGBT-People.pdf
Catalano, S.M. (2013). Intimate partner violence: Attributes of victimization, 1993–2011. Washington, DC: U.S. Department of Justice, Bureau of Justice Statistics. Retrieved January 21, 2016, from http://www.bjs.gov/content/pub/pdf/ipvav9311.pdf - PDF.
K-12 Schools“Addressing Sexual Harassment in New York City Public Schools.” Robert Wood Johnson Foundation. 2014. https://www.rwjf.org/en/library/research/2014/10/addressing-sexual-harassment-in-new-york-city-public-schools.html.
Hill, Catherine and Holly Kearl. “Crossing the Line: Sexual Harassment in Schools.” AAUW. 2011. https://www.aauw.org/research/crossing-the-line/.
“’Like Walking Through a Hailstorm’: Discrimination Against LGBT Youth in US Schools.” Human Rights Watch. 2016. https://www.hrw.org/report/2016/12/07/walking-through-hailstorm/discrimination-against-lgbt-youth-us-schools
McDowell, Rose et al. “Hidden horror of school sex assaults revealed by AP.” Associated Press. 2017. https://www.ap.org/explore/schoolhouse-sex-assault/hidden-horror-of-school-sex-assaults-revealed-by-ap.html
Onyeka-Crawford, Adaku et al. “Let Her Learn: Stopping School Pushout for Girls of Color.” National Women’s Law Center. 2017. https://nwlc.org/wp-content/uploads/2017/04/final_nwlc_Gates_GirlsofColor.pdf
“Sexual Harassment & Bullying of Youth: Sexual Violence & Individuals Who Identify as LGBTQ.” National Sexual Violence Resource Center and Pennsylvania Coalition Against Rape. 2012. http://www.nsvrc.org/sites/default/files/Publications_NSVRC_Guides_Sexual-Harassment-Bullying-Youth.pdf
Smith, Joanne et al. Hey Shorty! A Guide to Combating Sexual Harassment and Violence in Schools and on the Streets. (Feminist Press, 2011).
Colleges/UniversitiesCantor, David et al. (2015). “Report on the AAUW Campus Climate Survey on Sexual Assault and Sexual Mis-conduct.” Westat. https://www.aau.edu/sites/default/files/%40%20Files/Climate%20Survey/AAU_Campus_Cli-mate_Survey_12_14_15.pdf.
Fisher, B.S., Cullen, F.T., & Turner, M.G. (2000). “The Sexual Victimization of College Women.” National Institute of Justice, Bureau of Justice Statistics. https://www.ncjrs.gov/pdffiles1/nij/182369.pdf.
Krebs, C.P., Lindquist, C.H., Warner, T.D., Fisher, B.S., & Martin, S.L. (2007). The Campus Sexual Assault (CSA) Study. National Institute of Justice. https://www.ncjrs.gov/pdffiles1/nij/grants/221153.pdf.
Krebs, Christopher et al. (2016). “Campus Climate Survey Validation Study Final Technical Report.” Bureau of Justice Statistics Research and Development Series. https://www.bjs.gov/content/pub/pdf/ccsvsftr.pdf.
de Heer, Brooke et al. (2017). “Measuring Sexual Violence on Campus: Climate Surveys and Vul-nerable Groups.” Journal of School Violence, Vol 16: Issue 2. http://www.tandfonline.com/doi/abs/10.1080/15388220.2017.1284444?journalCode=wjsv20.

MEASURING #METOO IN CALIFORNIA , 2019 | A Statewide Assessment of Sexual Harassment and Assault 30
APPENDIX A | Other Studies
Wood, Leila, et al. (2017). “Climate Surveys: An Inventory of Understanding Sexual Assault and Other Crimes of Interpersonal Violence at Institutions of Higher Education.” Violence Against Women, Vol 23: 1249-1267. http://journals.sagepub.com/doi/abs/10.1177/1077801216657897.
WorkplacesFeldblum, Chai R. and Victoria A. Lipnic. “Select Task Force on the Study of Harassment in the Workplace.” U.S. Equal Employment Opportunity Commission. 2016. https://www.eeoc.gov/eeoc/task_force/harassment/upload/report.pdf
“Hands Off, Pants On: Sexual Harassment in Chicago’s Hospitality Industry.” UNITE HERE Local 1. 2016. https://www.handsoffpantson.org/
“Key Findings of the Select Task Force on the Study of Harassment in the Workplace.“ National Sexual Violence Resource Center. 2017. https://www.nsvrc.org/publications/nsvrc-publications-research-briefs/key-findings-select-task-force-study-harassment
Quick, James Campbell et al. “Sexual harassment: Have we made any progress?” Journal of Occupational Health Psychology, 2017; 22 (3): 286 DOI: 10.1037/ocp0000054
“Working for Inclusion: Time for Congress to Enact Federal Legislation to Address Workplace Discrimination Against Lesbian, Gay, Bisexual and Transgender Americans.” U.S. Commission on Civil Rights. 2017. http://www.usccr.gov/pubs/LGBT_Employment_Discrimination2017.pdf