Embed Size (px)
Citation preview
Airbus
A Statistical Analysisof CommercialAviation Accidents1958-2019

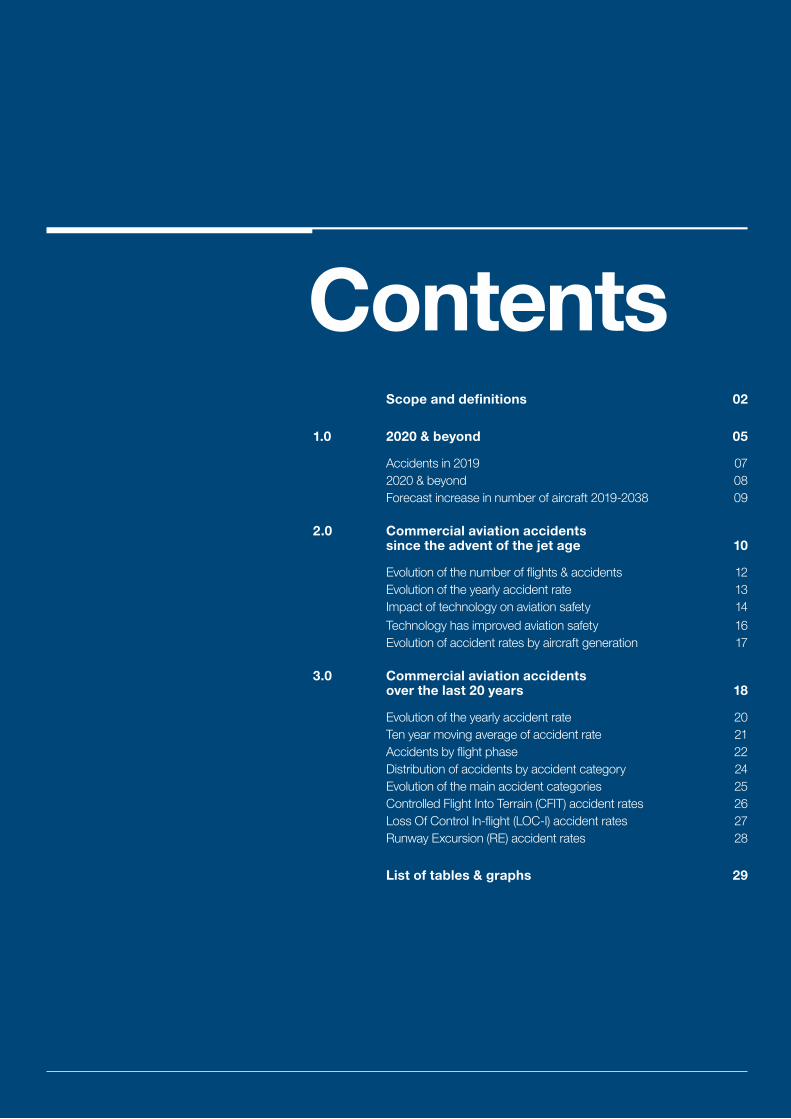
Contents Scope and definitions 02
1.0 2020 & beyond 05
Accidents in 2019 07
2020 & beyond 08
Forecast increase in number of aircraft 2019-2038 09
2.0 Commercial aviation accidents since the advent of the jet age 10
Evolution of the number of flights & accidents 12
Evolution of the yearly accident rate 13
Impact of technology on aviation safety 14
Technology has improved aviation safety 16
Evolution of accident rates by aircraft generation 17
3.0 Commercial aviation accidents over the last 20 years 18
Evolution of the yearly accident rate 20
Ten year moving average of accident rate 21
Accidents by flight phase 22
Distribution of accidents by accident category 24
Evolution of the main accident categories 25
Controlled Flight Into Terrain (CFIT) accident rates 26
Loss Of Control In-flight (LOC-I) accident rates 27
Runway Excursion (RE) accident rates 28
List of tables & graphs 29
02A Statistical Analysis of Commercial Aviation Accidents 1958 / 2019
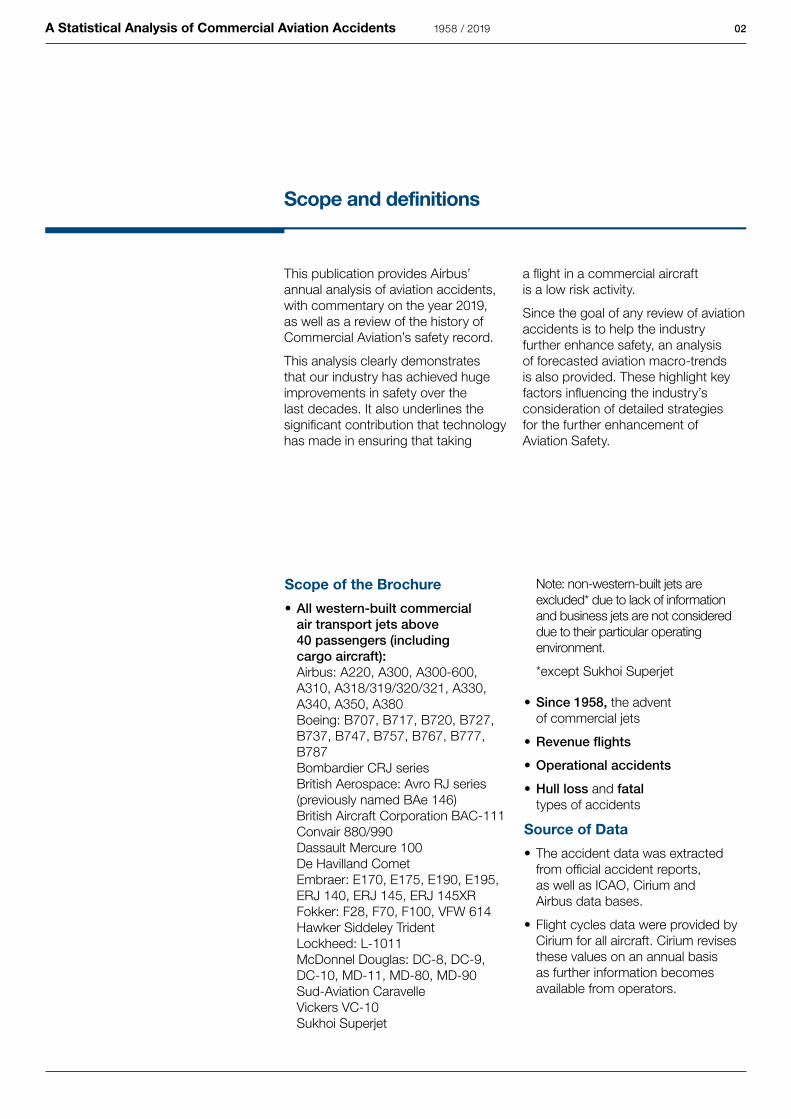
Scope and definitions
This publication provides Airbus’ annual analysis of aviation accidents, with commentary on the year 2019, as well as a review of the history of Commercial Aviation’s safety record.
This analysis clearly demonstrates that our industry has achieved huge improvements in safety over the last decades. It also underlines the significant contribution that technology has made in ensuring that taking
a flight in a commercial aircraft is a low risk activity.
Since the goal of any review of aviation accidents is to help the industry further enhance safety, an analysis of forecasted aviation macro-trends is also provided. These highlight key factors influencing the industry’s consideration of detailed strategies for the further enhancement of Aviation Safety.
Scope of the Brochure • All western-built commercial
air transport jets above 40 passengers (including cargo aircraft):
Airbus: A220, A300, A300-600, A310, A318/319/320/321, A330, A340, A350, A380
Boeing: B707, B717, B720, B727, B737, B747, B757, B767, B777, B787
Bombardier CRJ series British Aerospace: Avro RJ series
(previously named BAe 146) British Aircraft Corporation BAC-111 Convair 880/990 Dassault Mercure 100 De Havilland Comet Embraer: E170, E175, E190, E195,
ERJ 140, ERJ 145, ERJ 145XR Fokker: F28, F70, F100, VFW 614
Hawker Siddeley Trident Lockheed: L-1011 McDonnel Douglas: DC-8, DC-9,
DC-10, MD-11, MD-80, MD-90 Sud-Aviation Caravelle Vickers VC-10 Sukhoi Superjet
Note: non-western-built jets are excluded* due to lack of information and business jets are not considered due to their particular operating environment.
*except Sukhoi Superjet
• Since 1958, the advent of commercial jets
• Revenue flights
• Operational accidents
• Hull loss and fatal types of accidents
Source of Data
• The accident data was extracted from official accident reports, as well as ICAO, Cirium and Airbus data bases.
• Flight cycles data were provided by Cirium for all aircraft. Cirium revises these values on an annual basis as further information becomes available from operators.
03A Statistical Analysis of Commercial Aviation Accidents 1958 / 2019
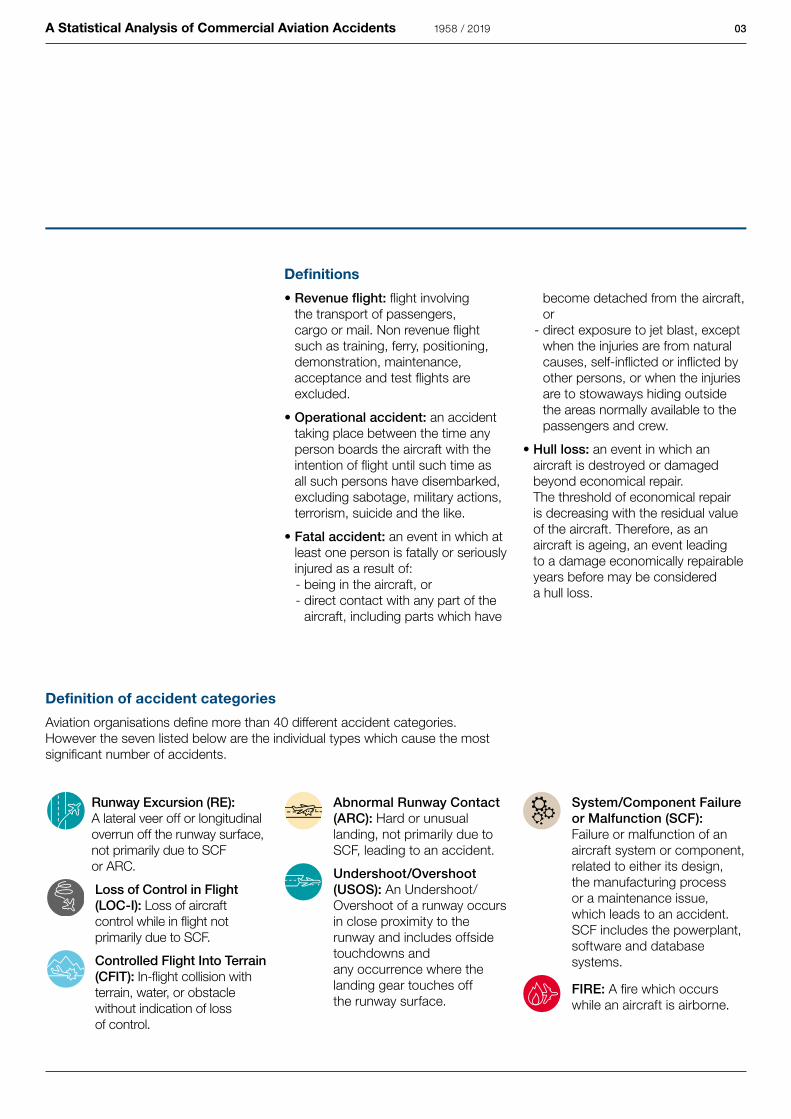
Definitions
• Revenue flight: flight involving the transport of passengers, cargo or mail. Non revenue flight such as training, ferry, positioning, demonstration, maintenance, acceptance and test flights are excluded.
• Operational accident: an accident taking place between the time any person boards the aircraft with the intention of flight until such time as all such persons have disembarked, excluding sabotage, military actions, terrorism, suicide and the like.
• Fatal accident: an event in which at least one person is fatally or seriously injured as a result of:- being in the aircraft, or- direct contact with any part of the
aircraft, including parts which have
become detached from the aircraft, or
- direct exposure to jet blast, except when the injuries are from natural causes, self-inflicted or inflicted by other persons, or when the injuries are to stowaways hiding outside the areas normally available to the passengers and crew.
• Hull loss: an event in which an aircraft is destroyed or damaged beyond economical repair. The threshold of economical repair is decreasing with the residual value of the aircraft. Therefore, as an aircraft is ageing, an event leading to a damage economically repairable years before may be considered a hull loss.
Definition of accident categories
Aviation organisations define more than 40 different accident categories. However the seven listed below are the individual types which cause the most significant number of accidents.
Abnormal Runway Contact (ARC): Hard or unusual landing, not primarily due to SCF, leading to an accident.
Undershoot/Overshoot (USOS): An Undershoot/Overshoot of a runway occurs in close proximity to the runway and includes offside touchdowns and any occurrence where the landing gear touches off the runway surface.
System/Component Failure or Malfunction (SCF): Failure or malfunction of an aircraft system or component, related to either its design, the manufacturing process or a maintenance issue, which leads to an accident. SCF includes the powerplant, software and database systems.
FIRE: A fire which occurs while an aircraft is airborne.
Runway Excursion (RE): A lateral veer off or longitudinal overrun off the runway surface, not primarily due to SCF or ARC.
Loss of Control in Flight (LOC-I): Loss of aircraft control while in flight not primarily due to SCF.
Controlled Flight Into Terrain (CFIT): In-flight collision with terrain, water, or obstacle without indication of loss of control.


2020 & beyond
1.0
1.1 Accidents in 2019 07
1.2 2020 and beyond 08
1.3 Forecast increase in number of aircraft 2019-2038 09
05A Statistical Analysis of Commercial Aviation Accidents 1958 / 2019
07A Statistical Analysis of Commercial Aviation Accidents
Flightdepartures
In-servicefleet
0.28
2019
0.47
2018
35 MILLION
25,760AIRCRAFT
2018
36 MILLION
26,680AIRCRAFT
2019
2018
0.14
2019
0.11
Fatal accidents rate per million flights
Hull loss accidents rate per million flights
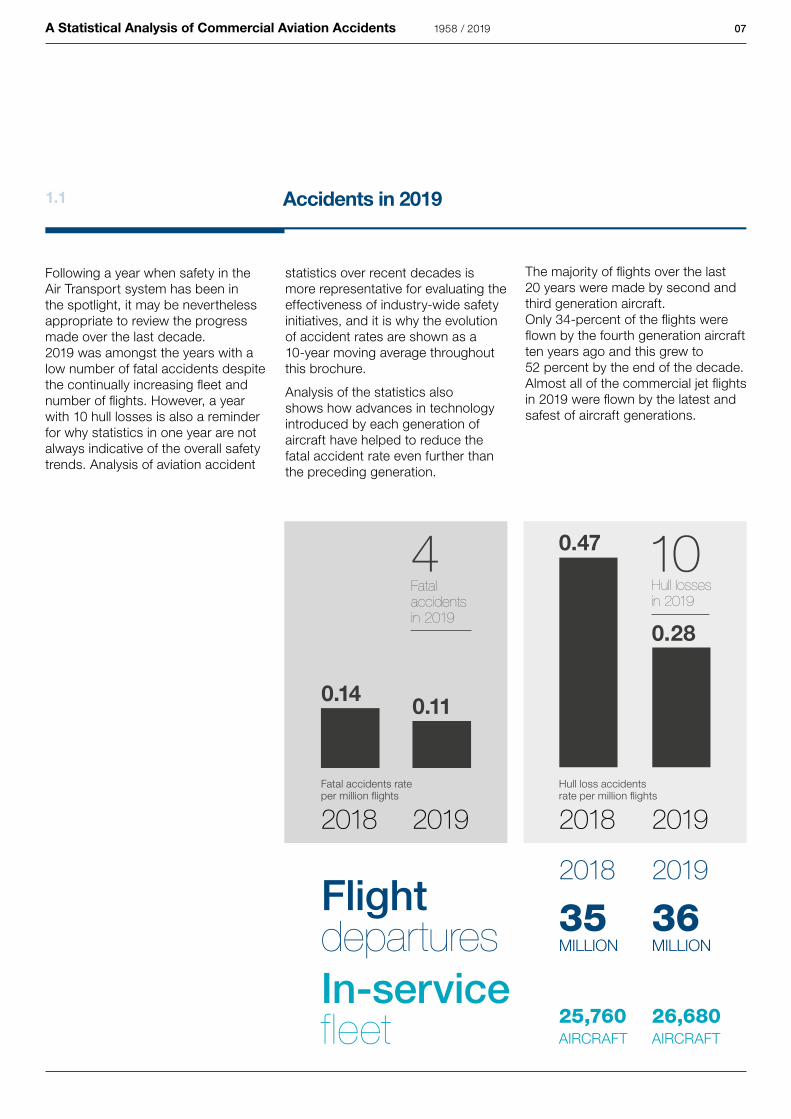
1.1 Accidents in 2019
10Hull losses in 2019
1958 / 2019
Fatal accidents in 2019
4
Following a year when safety in the Air Transport system has been in the spotlight, it may be nevertheless appropriate to review the progress made over the last decade. 2019 was amongst the years with a low number of fatal accidents despite the continually increasing fleet and number of flights. However, a year with 10 hull losses is also a reminder for why statistics in one year are not always indicative of the overall safety trends. Analysis of aviation accident
statistics over recent decades is more representative for evaluating the effectiveness of industry-wide safety initiatives, and it is why the evolution of accident rates are shown as a 10-year moving average throughout this brochure.
Analysis of the statistics also shows how advances in technology introduced by each generation of aircraft have helped to reduce the fatal accident rate even further than the preceding generation.
The majority of flights over the last 20 years were made by second and third generation aircraft. Only 34-percent of the flights were flown by the fourth generation aircraft ten years ago and this grew to 52 percent by the end of the decade. Almost all of the commercial jet flights in 2019 were flown by the latest and safest of aircraft generations.
1.2 2020 and beyond
08A Statistical Analysis of Commercial Aviation Accidents
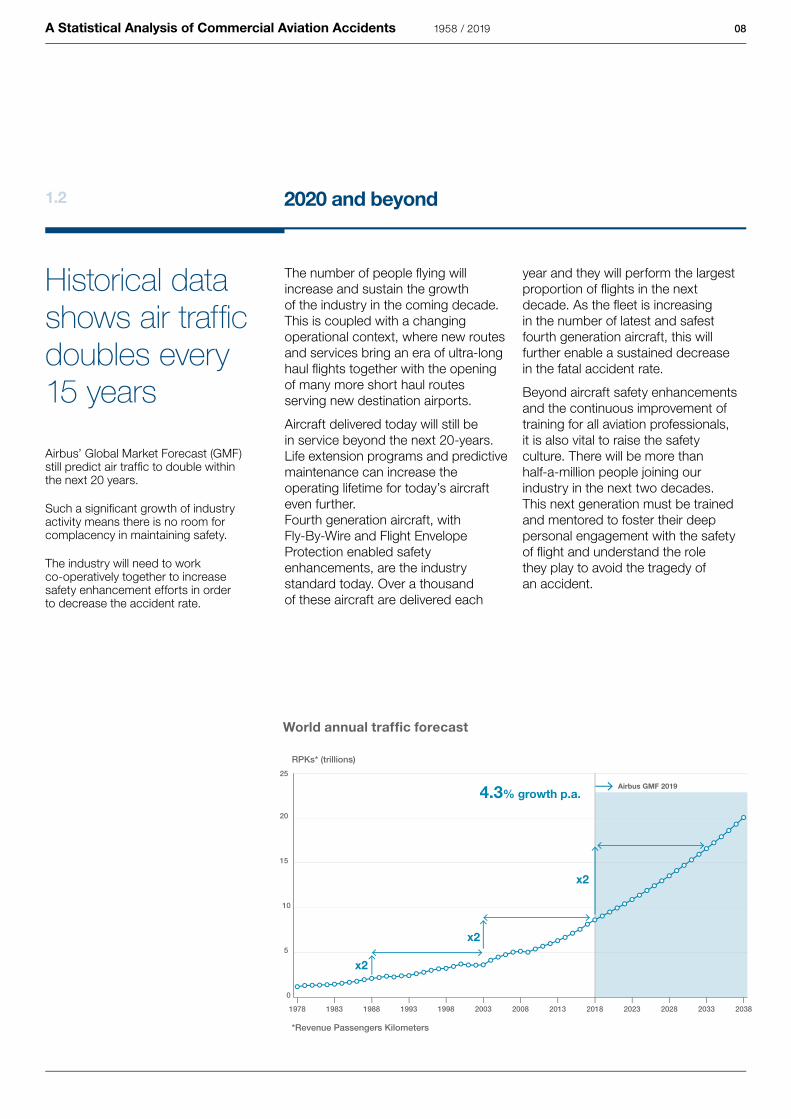
Historical data shows air traffi c doubles every15 years
Airbus’ Global Market Forecast (GMF)still predict air traffi c to double withinthe next 20 years.
Such a signifi cant growth of industry activity means there is no room for complacency in maintaining safety.
The industry will need to work co-operatively together to increasesafety enhancement efforts in order to decrease the accident rate.
World annual traffi c forecast
x2
x2
x2
4.3% growth p.a.
The number of people fl ying will increase and sustain the growthof the industry in the coming decade.This is coupled with a changing operational context, where new routes and services bring an era of ultra-long haul fl ights together with the opening of many more short haul routes serving new destination airports.
Aircraft delivered today will still bein service beyond the next 20-years.Life extension programs and predictive maintenance can increase the operating lifetime for today’s aircraft even further.Fourth generation aircraft, withFly-By-Wire and Flight Envelope Protection enabled safety enhancements, are the industry standard today. Over a thousand of these aircraft are delivered each
year and they will perform the largest proportion of fl ights in the next decade. As the fl eet is increasingin the number of latest and safest fourth generation aircraft, this will further enable a sustained decreasein the fatal accident rate.
Beyond aircraft safety enhancements and the continuous improvement of training for all aviation professionals,it is also vital to raise the safety culture. There will be more thanhalf-a-million people joining our industry in the next two decades.This next generation must be trained and mentored to foster their deep personal engagement with the safety of fl ight and understand the rolethey play to avoid the tragedy ofan accident.
1958 / 2019
1.3
09A Statistical Analysis of Commercial Aviation Accidents
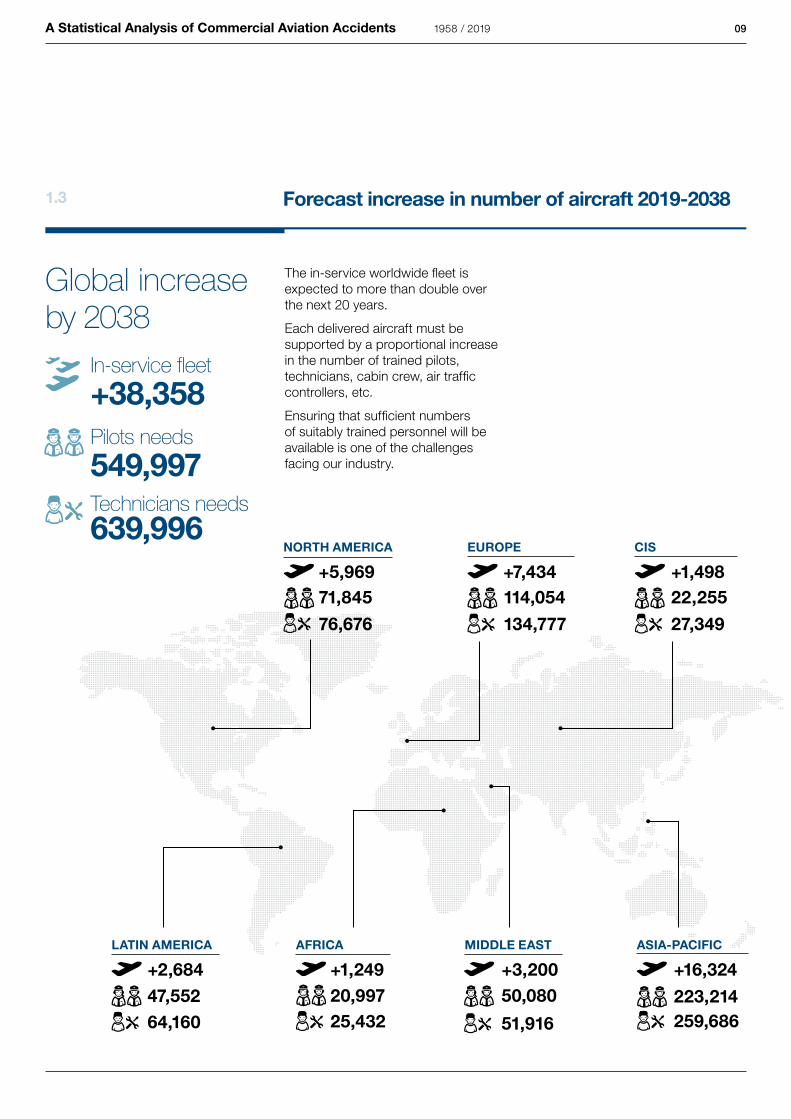
The in-service worldwide fleet is expected to more than double over the next 20 years.
Each delivered aircraft must be supported by a proportional increase in the number of trained pilots, technicians, cabin crew, air traffic controllers, etc.
Ensuring that sufficient numbers of suitably trained personnel will be available is one of the challenges facing our industry.
Global increase by 2038
Pilots needs
In-service fleet
Technicians needs
Forecast increase in number of aircraft 2019-2038
LATIN AMERICA AFRICA MIDDLE EAST ASIA-PACIFIC
NORTH AMERICA
71,845
+5,969 +7,434 +1,498
114,054 22,255
47,552 20,997 50,080 223,214
76,676 134,777 27,349
64,160 25,432 51,916 259,686
EUROPE CIS
549,997
+38,358
639,996
1958 / 2019
+2,684 +1,249 +3,200 +16,324
Commercial aviation accidents since the advent of the jet age
2.0
2.1 Evolution of the number of flights & accidents 12
2.2 Evolution of the yearly accident rate 13
2.3 Impact of technology on aviation safety 14
2.4 Technology has improved aviation safety 16
2.5 Evolution of accident rates by aircraft generation 17
10A Statistical Analysis of Commercial Aviation Accidents 1958 / 2019
2.1 Evolution of the number of flights & accidents
12A Statistical Analysis of Commercial Aviation Accidents
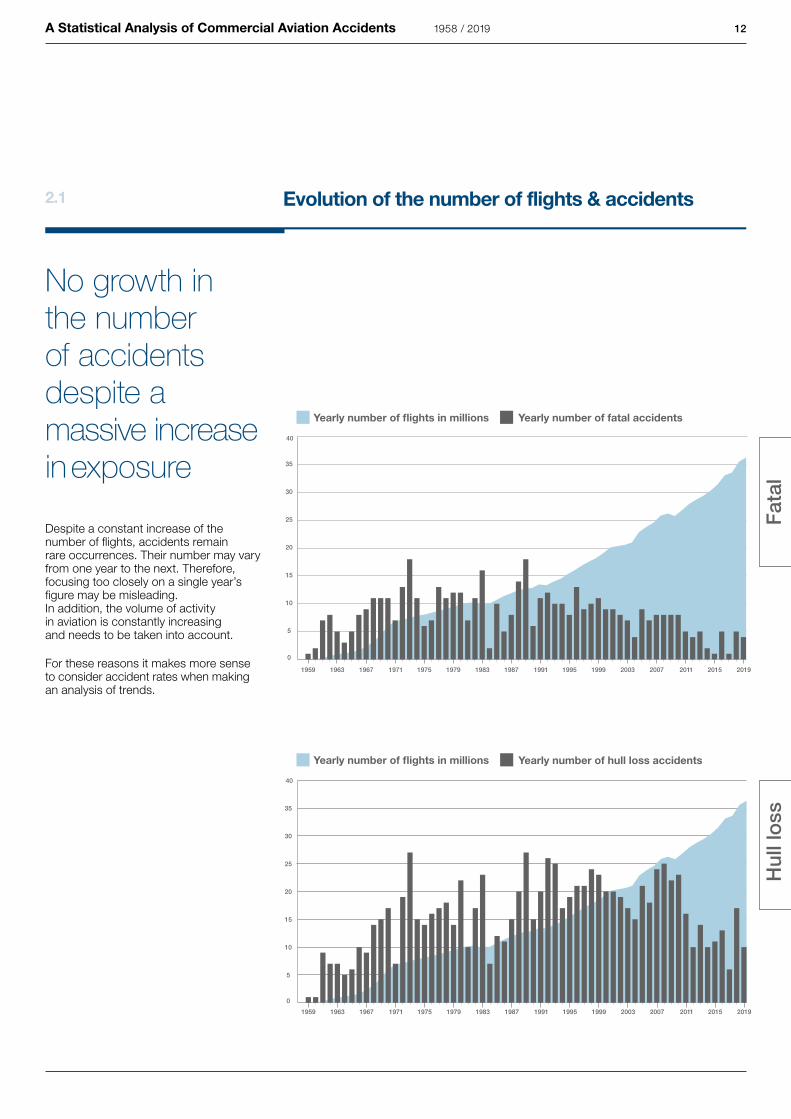
No growth in the number of accidents despite a massive increase inexposure
Despite a constant increase of the number of flights, accidents remain rare occurrences. Their number may vary from one year to the next. Therefore, focusing too closely on a single year’s figure may be misleading.In addition, the volume of activity in aviation is constantly increasing and needs to be taken into account.
For these reasons it makes more sense to consider accident rates when making an analysis of trends.
Fa
tal
Hu
ll lo
ss
1958 / 2019
2.2 Evolution of the yearly accident rate
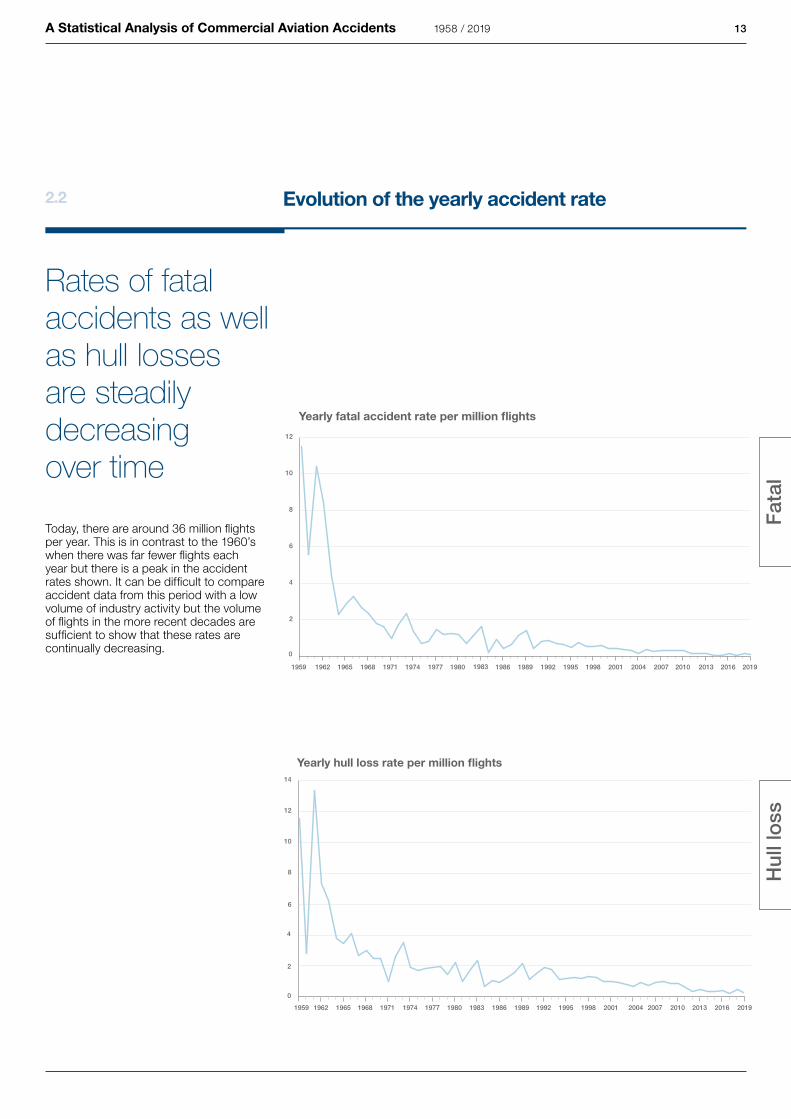
Rates of fatal accidents as well as hull losses are steadily decreasing over time
Today, there are around 36 million flights per year. This is in contrast to the 1960’s when there was far fewer flights each year but there is a peak in the accident rates shown. It can be difficult to compare accident data from this period with a low volume of industry activity but the volume of flights in the more recent decades are sufficient to show that these rates are continually decreasing.
Fa
tal
Hu
ll lo
ss
13A Statistical Analysis of Commercial Aviation Accidents 1958 / 2019
2.3 Impact of technology on aviation safety
14A Statistical Analysis of Commercial Aviation Accidents
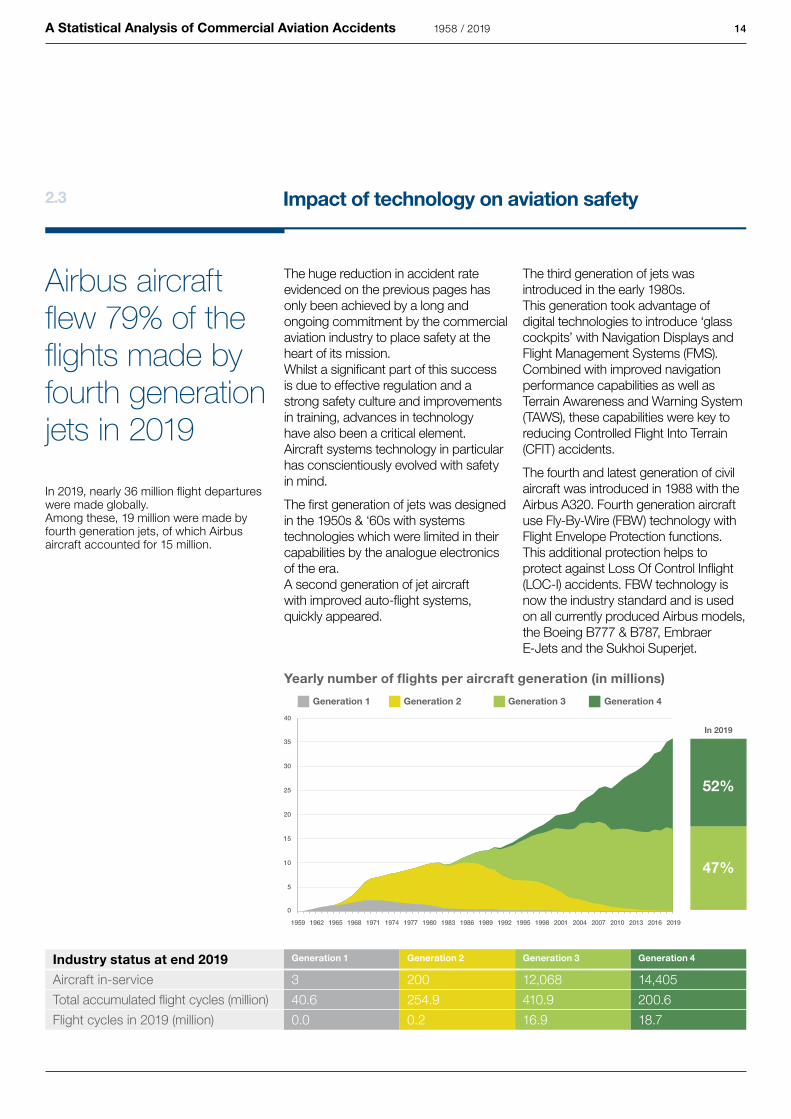
Airbus aircraft flew 79% of the flights made by fourth generation jets in 2019
In 2019, nearly 36 million flight departures were made globally.Among these, 19 million were made by fourth generation jets, of which Airbus aircraft accounted for 15 million.
Yearly number of flights per aircraft generation (in millions)
The huge reduction in accident rate evidenced on the previous pages has only been achieved by a long and ongoing commitment by the commercial aviation industry to place safety at the heart of its mission. Whilst a significant part of this success is due to effective regulation and a strong safety culture and improvements in training, advances in technology have also been a critical element. Aircraft systems technology in particular has conscientiously evolved with safety in mind.
The first generation of jets was designed in the 1950s & ‘60s with systems technologies which were limited in their capabilities by the analogue electronics of the era. A second generation of jet aircraft with improved auto-flight systems, quickly appeared.
The third generation of jets was introduced in the early 1980s. This generation took advantage of digital technologies to introduce ‘glass cockpits’ with Navigation Displays and Flight Management Systems (FMS). Combined with improved navigation performance capabilities as well as Terrain Awareness and Warning System (TAWS), these capabilities were key to reducing Controlled Flight Into Terrain (CFIT) accidents.
The fourth and latest generation of civil aircraft was introduced in 1988 with the Airbus A320. Fourth generation aircraft use Fly-By-Wire (FBW) technology with Flight Envelope Protection functions. This additional protection helps to protect against Loss Of Control Inflight (LOC-I) accidents. FBW technology is now the industry standard and is used on all currently produced Airbus models, the Boeing B777 & B787, Embraer E-Jets and the Sukhoi Superjet.
Industry status at end 2019 Generation 1 Generation 2 Generation 3 Generation 4
Aircraft in-service 3 200 12,068 14,405
Total accumulated flight cycles (million) 40.6 254.9 410.9 200.6
Flight cycles in 2019 (million) 0.0 0.2 16.9 18.7
1958 / 2019
15A Statistical Analysis of Commercial Aviation Accidents
1
3
2
4
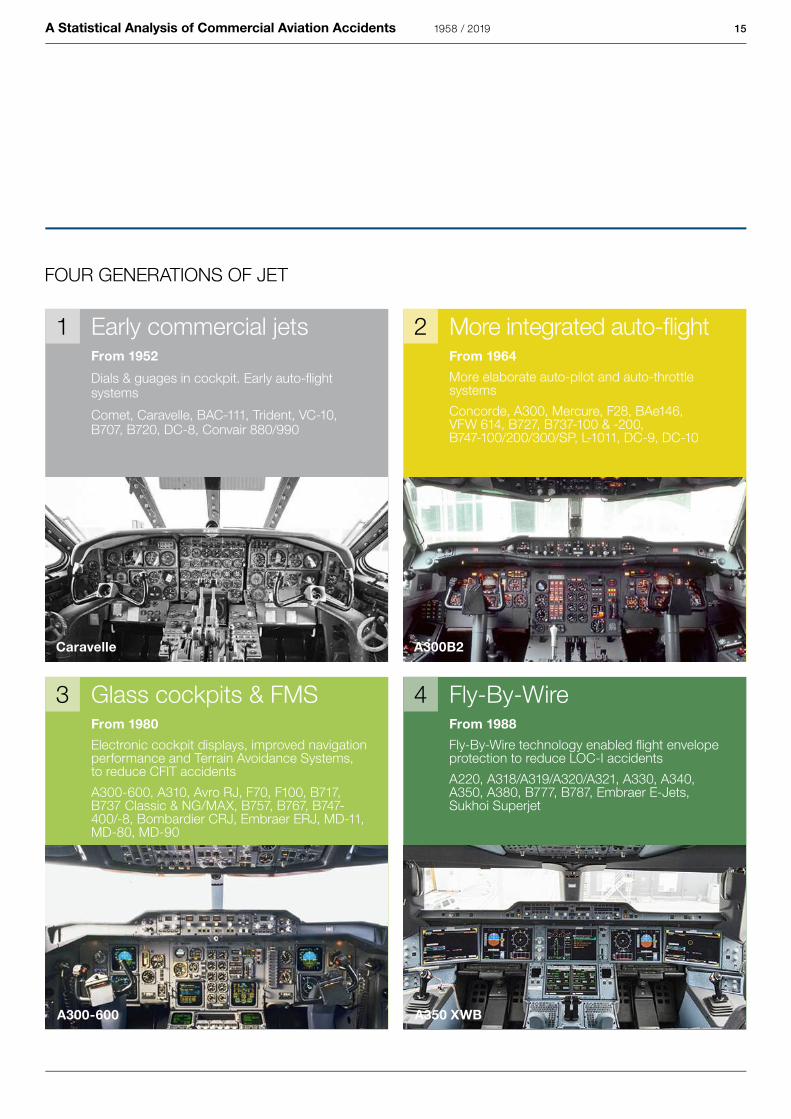
Early commercial jetsFrom 1952
Dials & guages in cockpit. Early auto-fl ight systems
Comet, Caravelle, BAC-111, Trident, VC-10, B707, B720, DC-8, Convair 880/990
Caravelle
From 1964
More elaborate auto-pilot and auto-throttle systems
Concorde, A300, Mercure, F28, BAe146,VFW 614, B727, B737-100 & -200,B747-100/200/300/SP, L-1011, DC-9, DC-10
More integrated auto-fl ight
A300B2
From 1980
Electronic cockpit displays, improved navigation performance and Terrain Avoidance Systems,to reduce CFIT accidents
A300-600, A310, Avro RJ, F70, F100, B717,B737 Classic & NG/MAX, B757, B767, B747-400/-8, Bombardier CRJ, Embraer ERJ, MD-11, MD-80, MD-90
Glass cockpits & FMS
A300-600
From 1988
Fly-By-Wire technology enabled fl ight envelope protection to reduce LOC-I accidents
A220, A318/A319/A320/A321, A330, A340, A350, A380, B777, B787, Embraer E-Jets, Sukhoi Superjet
Fly-By-Wire
A350 XWB
FOUR GENERATIONS OF JET
1958 / 2019
Generation 4Generation 3
2.4 Technology has improved aviation safety
16A Statistical Analysis of Commercial Aviation Accidents
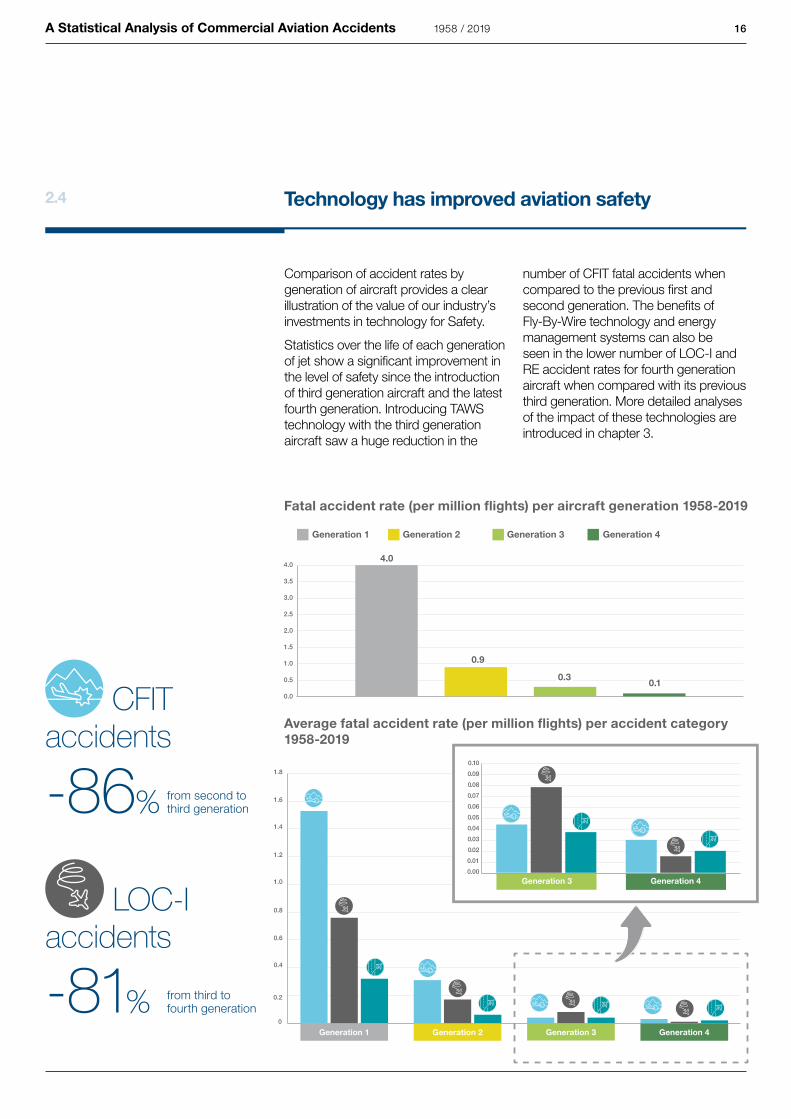
Comparison of accident rates by generation of aircraft provides a clear illustration of the value of our industry’s investments in technology for Safety.
Statistics over the life of each generation of jet show a significant improvement in the level of safety since the introduction of third generation aircraft and the latest fourth generation. Introducing TAWS technology with the third generation aircraft saw a huge reduction in the
number of CFIT fatal accidents when compared to the previous first and second generation. The benefits of Fly-By-Wire technology and energy management systems can also be seen in the lower number of LOC-I and RE accident rates for fourth generation aircraft when compared with its previous third generation. More detailed analyses of the impact of these technologies are introduced in chapter 3.
-86%
-81%
CFIT
accidents
LOC-I
accidents
from second tothird generation
from third tofourth generation
Average fatal accident rate (per million flights) per accident category 1958-2019
Fatal accident rate (per million flights) per aircraft generation 1958-2019
1958 / 2019
4.0
0.9
0.10.3
0.16
0.52
17A Statistical Analysis of Commercial Aviation Accidents
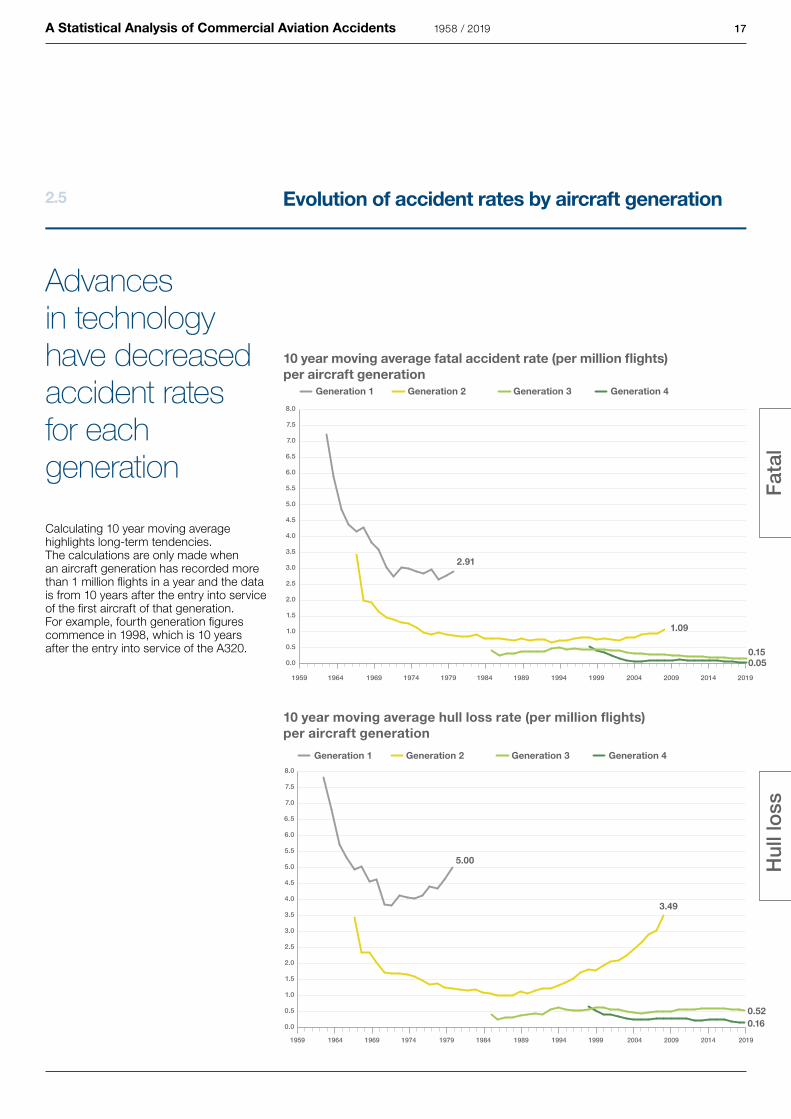
10 year moving average fatal accident rate (per million flights) per aircraft generation
10 year moving average hull loss rate (per million flights) per aircraft generation
Advances in technology have decreased accident rates for each generation
Calculating 10 year moving average highlights long-term tendencies.The calculations are only made when an aircraft generation has recorded more than 1 million flights in a year and the data is from 10 years after the entry into service of the first aircraft of that generation.For example, fourth generation figures commence in 1998, which is 10 years after the entry into service of the A320.
Fa
tal
Hu
ll lo
ss
2.5 Evolution of accident rates by aircraft generation
1958 / 2019
1.09
0.150.05
2.91
5.00
3.49
Commercial aviation accidents over the last 20 years
3.0
3.1 Evolution of the yearly accident rate 20
3.2 Ten year moving average of accident rate 21
3.3 Accidents by flight phase 22
3.4 Distribution of accidents by accident category 24
3.5 Evolution of the main accident categories 25
3.6 Controlled Flight Into Terrain (CFIT) accident rates 26
3.7 Loss Of Control In-flight (LOC-I) accident rates 27
3.8 Runway Excursion (RE) accident rates 28
18A Statistical Analysis of Commercial Aviation Accidents 1958 / 2019
3.1 Evolution of the yearly accident rate
20A Statistical Analysis of Commercial Aviation Accidents
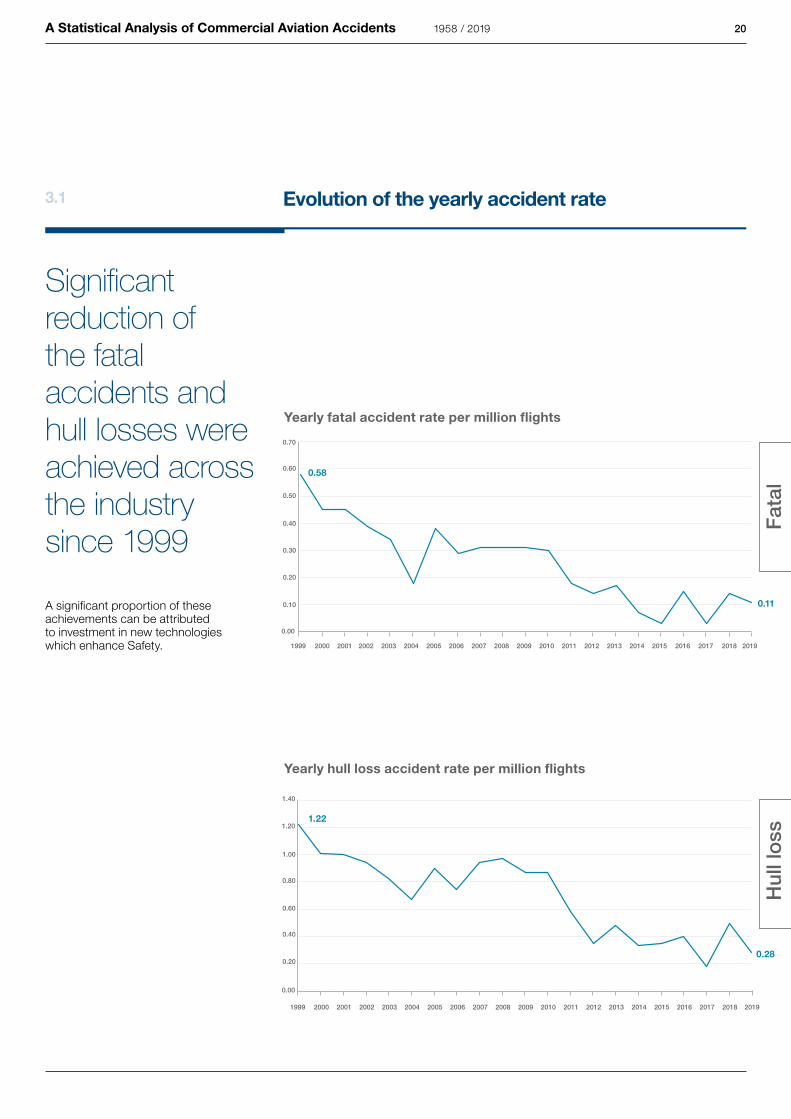
Significant reduction of the fatal accidents and hull losses were achieved across the industry since 1999
A significant proportion of these achievements can be attributed to investment in new technologies which enhance Safety.
Yearly fatal accident rate per million flights
Yearly hull loss accident rate per million flightsF
ata
lH
ull lo
ss
0.11
0.58
1.22
0.28
1958 / 2019
0.05
3.2 Ten year moving average of accident rate
Fa
tal
Hu
ll lo
ss
10 year moving average fatal accident rate (per million flights) per aircraft generation
21
10 year moving average hull loss accident rate (per million flights) per aircraft generation
A Statistical Analysis of Commercial Aviation Accidents
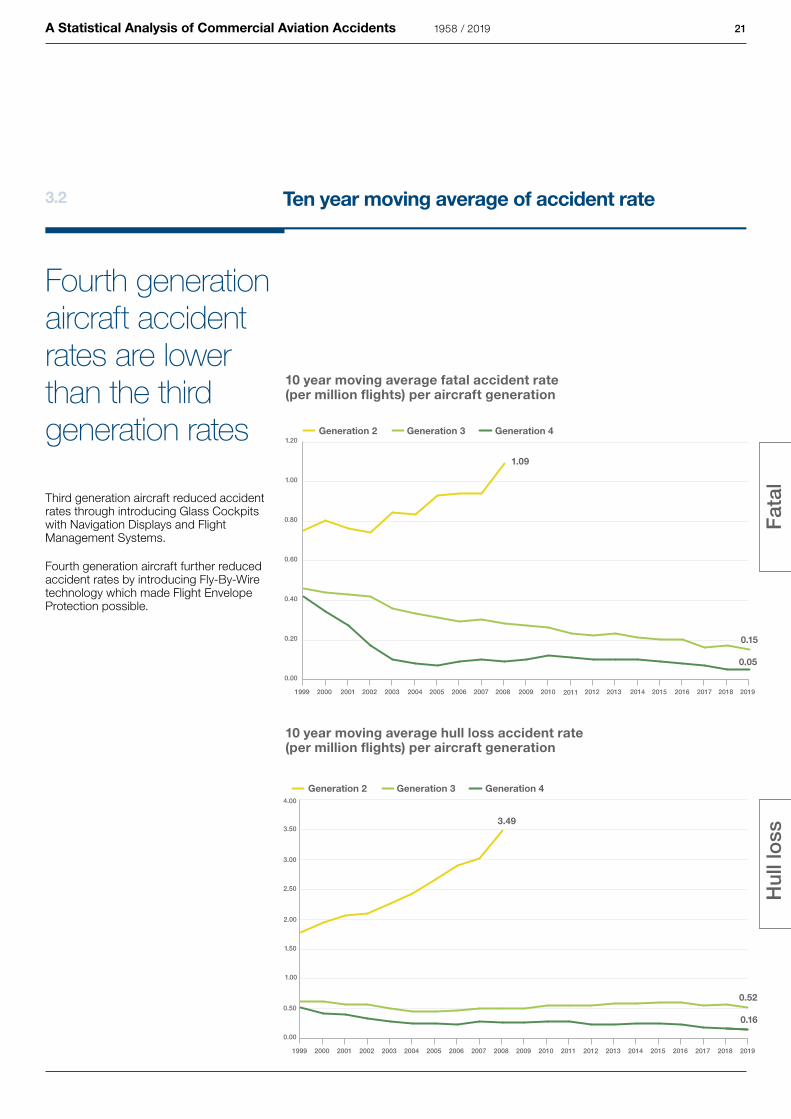
Fourth generation aircraft accident rates are lower than the third generation rates
Third generation aircraft reduced accident rates through introducing Glass Cockpits with Navigation Displays and Flight Management Systems.
Fourth generation aircraft further reduced accident rates by introducing Fly-By-Wire technology which made Flight Envelope Protection possible.
1958 / 2019
1.09
3.49
0.52
0.16
0.15
3.3 Accidents by flight phase
22A Statistical Analysis of Commercial Aviation Accidents
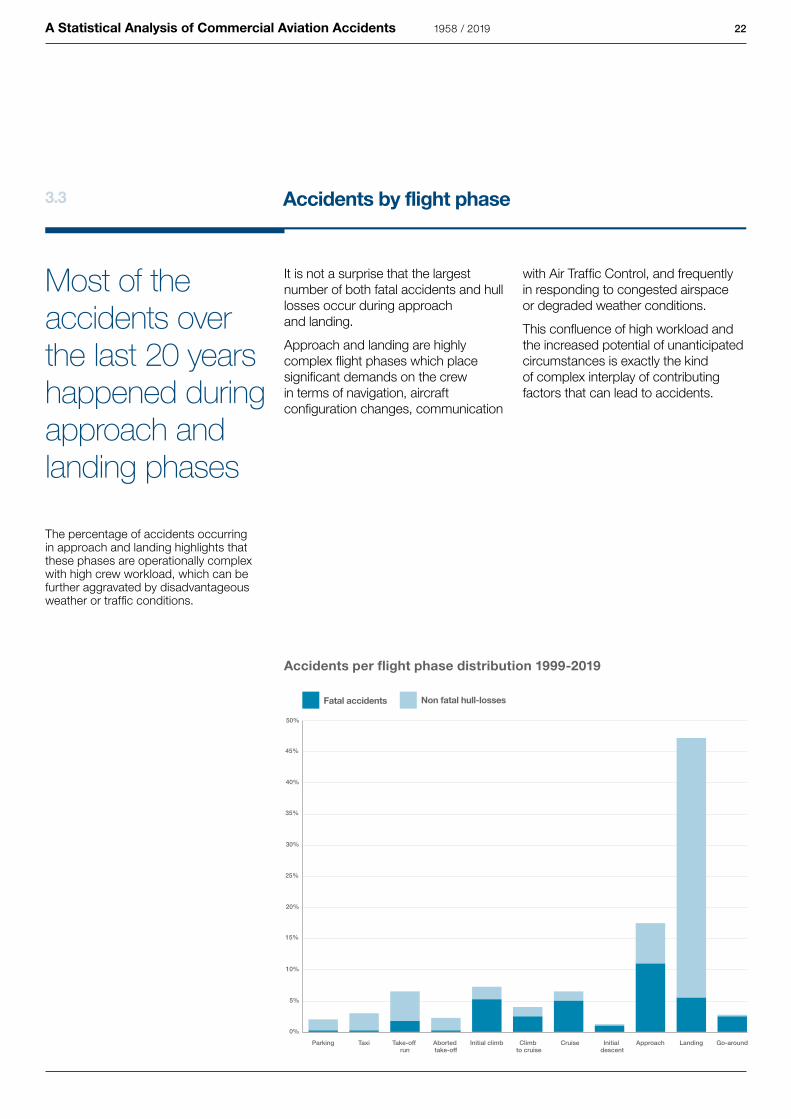
Accidents per flight phase distribution 1999-2019
Most of the accidents over the last 20 years happened during approach and landing phases
The percentage of accidents occurringin approach and landing highlights that these phases are operationally complex with high crew workload, which can be further aggravated by disadvantageous weather or traffic conditions.
It is not a surprise that the largest number of both fatal accidents and hull losses occur during approach and landing.
Approach and landing are highly complex flight phases which place significant demands on the crew in terms of navigation, aircraft configuration changes, communication
with Air Traffic Control, and frequently in responding to congested airspace or degraded weather conditions.
This confluence of high workload and the increased potential of unanticipated circumstances is exactly the kind of complex interplay of contributing factors that can lead to accidents.
1958 / 2019
23A Statistical Analysis of Commercial Aviation Accidents
Definitions of flight phases
• Parking: this phase ends and starts when the aircraft respectively begins or stops moving forward under its own power.
• Taxi: this phase includes both taxi-out and taxi-in. Taxi-out starts when the aircraft begins moving forward under its own power and ends when it reaches the takeoff position. Taxi-in normally starts after the landing roll-out, when the aircraft taxis to the parking area. It may, in some cases, follow a taxi-out.
• Takeoff run: this phase begins when the crew increases thrust for the purpose of lift-off. It ends when an initial climb is established or the crew aborts its takeoff.
• Aborted takeoff: this phase starts when the crew reduces thrust during the takeoff run to stop the aircraft. It ends when the aircraft is stopped or when it is taxied off the runway.
• Initial climb: this phase begins at 35 feet above the runway elevation. It normally ends with the climb to cruise. It may, in some instances, be followed by an approach.
• Climb to cruise: this phase begins when the crew establishes the aircraft at a defined speed and configuration enabling the aircraft to increase altitude for the cruise. It normally ends when the aircraft reaches cruise altitude. It may, in some cases end with the initiation of a descent.
• Cruise: this phase begins when the aircraft reaches the initial cruise altitude. It ends when the crew initiates a descent for the purpose of landing.
• Initial descent: this phase starts when the crew leaves the cruise altitude in order to land. It normally ends when the crew initiates changes in the aircraft’s configuration and/or speed in view of the landing. It may, in some cases end with a cruise or climb to cruise phase.
• Approach: this phase starts when the crew initiates changes in the aircraft’s configuration and/or speed in view of the landing. It normally ends when the aircraft is in the landing configuration and the crew is dedicated to land on a particular runway. It may, in some cases, end with the initiation of an initial climb or go-around phase.
• Go-around: this phase begins when the crew aborts the descent to the planned landing runway during the approach phase. It ends with the initiation of an initial climb or when speed and configuration are established at a defined altitude.
• Landing: this phase begins when the aircraft is in the landing configuration and the crew is dedicated to land on a particular runway. It ends when the aircraft’s speed is decreased to taxi speed.
1958 / 2019
7%
3.4 Distribution of accidents by accident category
24A Statistical Analysis of Commercial Aviation Accidents
Fa
tal
Hu
ll lo
ss
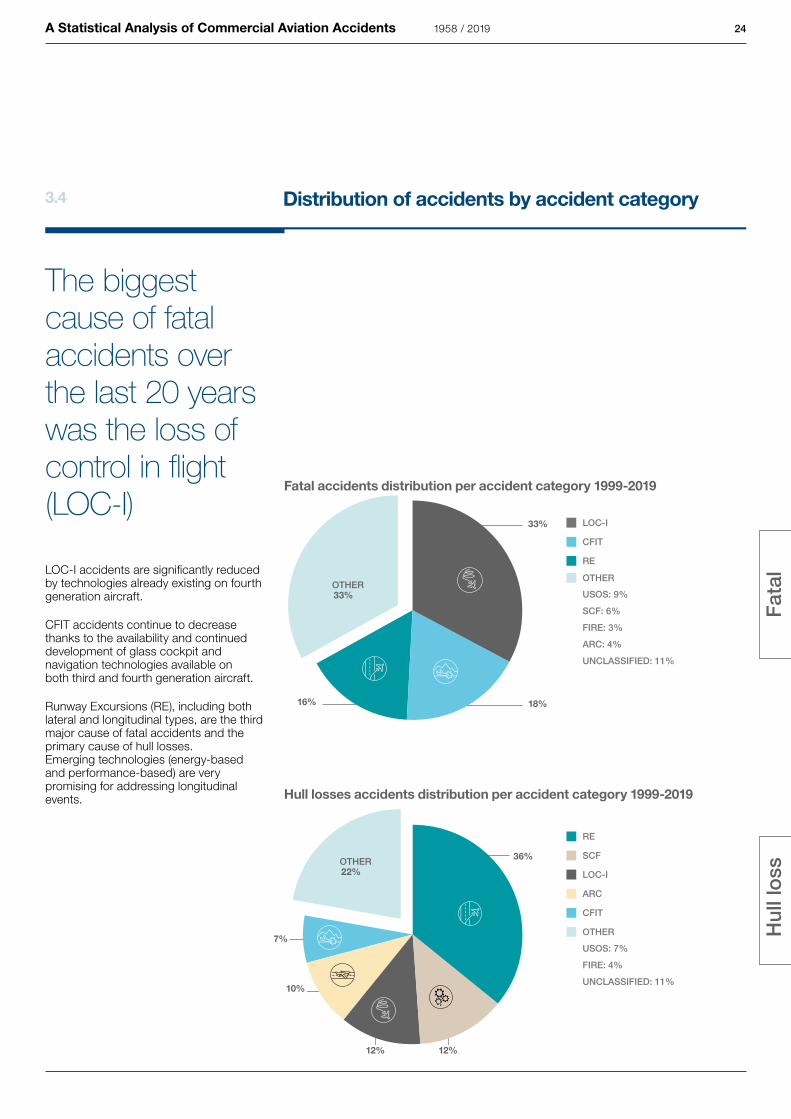
Fatal accidents distribution per accident category 1999-2019
Hull losses accidents distribution per accident category 1999-2019
The biggest cause of fatal accidents over the last 20 years was the loss of control in flight (LOC-I)
LOC-I accidents are significantly reduced by technologies already existing on fourth generation aircraft.
CFIT accidents continue to decrease thanks to the availability and continued development of glass cockpit and navigation technologies available on both third and fourth generation aircraft.
Runway Excursions (RE), including both lateral and longitudinal types, are the third major cause of fatal accidents and the primary cause of hull losses. Emerging technologies (energy-based and performance-based) are very promising for addressing longitudinal events.
1958 / 2019
LOC-I
RE
CFIT
SCF
RE
OTHER
USOS: 9%
SCF: 6%
FIRE: 3%
ARC: 4%
UNCLASSIFIED: 11%
LOC-I
ARC
CFIT
OTHER
33%
18%
36%
12%12%
10%
16%
33%OTHER
22%OTHER
USOS: 7%
FIRE: 4%
UNCLASSIFIED: 11%
0.05
3.5 Evolution of the main accident categories
10 year moving average fatal accident rate (per million flights) per accident category
25
10 year moving average hull loss rate (per million flights) per accident category
A Statistical Analysis of Commercial Aviation Accidents
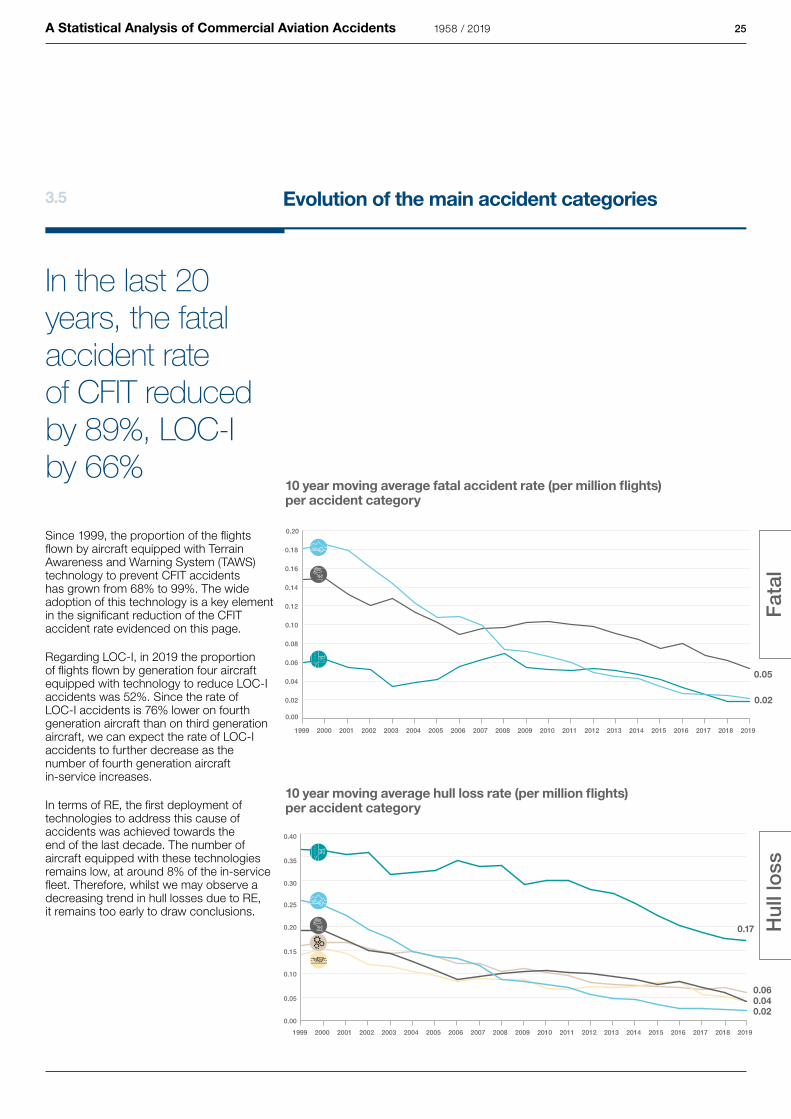
In the last 20 years, the fatal accident rate of CFIT reduced by 89%, LOC-I by 66%
Since 1999, the proportion of the flights flown by aircraft equipped with Terrain Awareness and Warning System (TAWS) technology to prevent CFIT accidents has grown from 68% to 99%. The wide adoption of this technology is a key element in the significant reduction of the CFIT accident rate evidenced on this page.
Regarding LOC-I, in 2019 the proportion of flights flown by generation four aircraft equipped with technology to reduce LOC-I accidents was 52%. Since the rate of LOC-I accidents is 76% lower on fourth generation aircraft than on third generation aircraft, we can expect the rate of LOC-I accidents to further decrease as the number of fourth generation aircraft in-service increases.
In terms of RE, the first deployment of technologies to address this cause of accidents was achieved towards the end of the last decade. The number of aircraft equipped with these technologies remains low, at around 8% of the in-service fleet. Therefore, whilst we may observe a decreasing trend in hull losses due to RE, it remains too early to draw conclusions.
Fa
tal
Hu
ll lo
ss
1958 / 2019
0.02
0.17
0.060.040.02
3.6 Controlled Flight Into Terrain (CFIT) accident rates
26A Statistical Analysis of Commercial Aviation Accidents
10 year moving average CFIT fatal accident rate (per million flights) per aircraft generation
Fa
tal
Hu
ll lo
ss
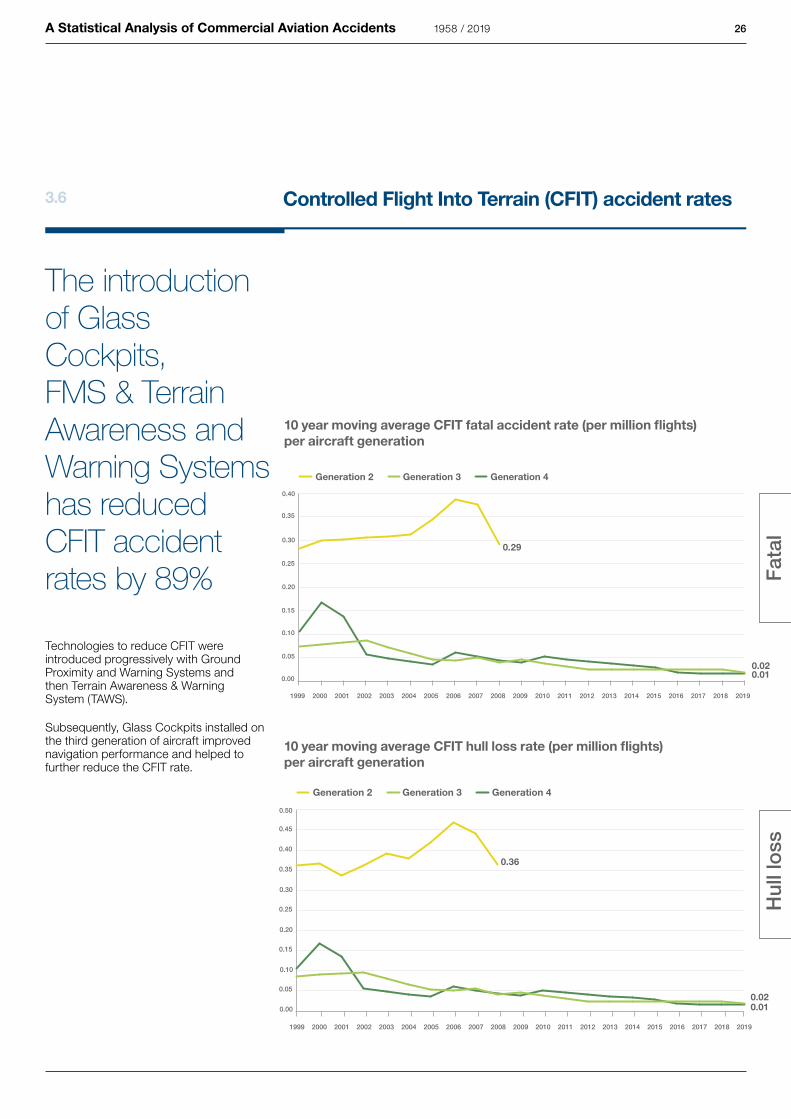
The introduction of Glass Cockpits, FMS & Terrain Awareness and Warning Systems has reduced CFIT accident rates by 89%
Technologies to reduce CFIT were introduced progressively with Ground Proximity and Warning Systems and then Terrain Awareness & Warning System (TAWS).
Subsequently, Glass Cockpits installed on the third generation of aircraft improved navigation performance and helped to further reduce the CFIT rate.
0.29
0.020.01
0.36
0.020.01
1958 / 2019
10 year moving average CFIT hull loss rate (per million flights) per aircraft generation
3.7 Loss Of Control In-flight (LOC-I) accident rates
10 year moving average LOC-I fatal accident rate (per million flights) per aircraft generation
10 year moving average LOC-I hull loss accident rate (per million flights) per aircraft generation
Fa
tal
Hu
ll lo
ss
27A Statistical Analysis of Commercial Aviation Accidents
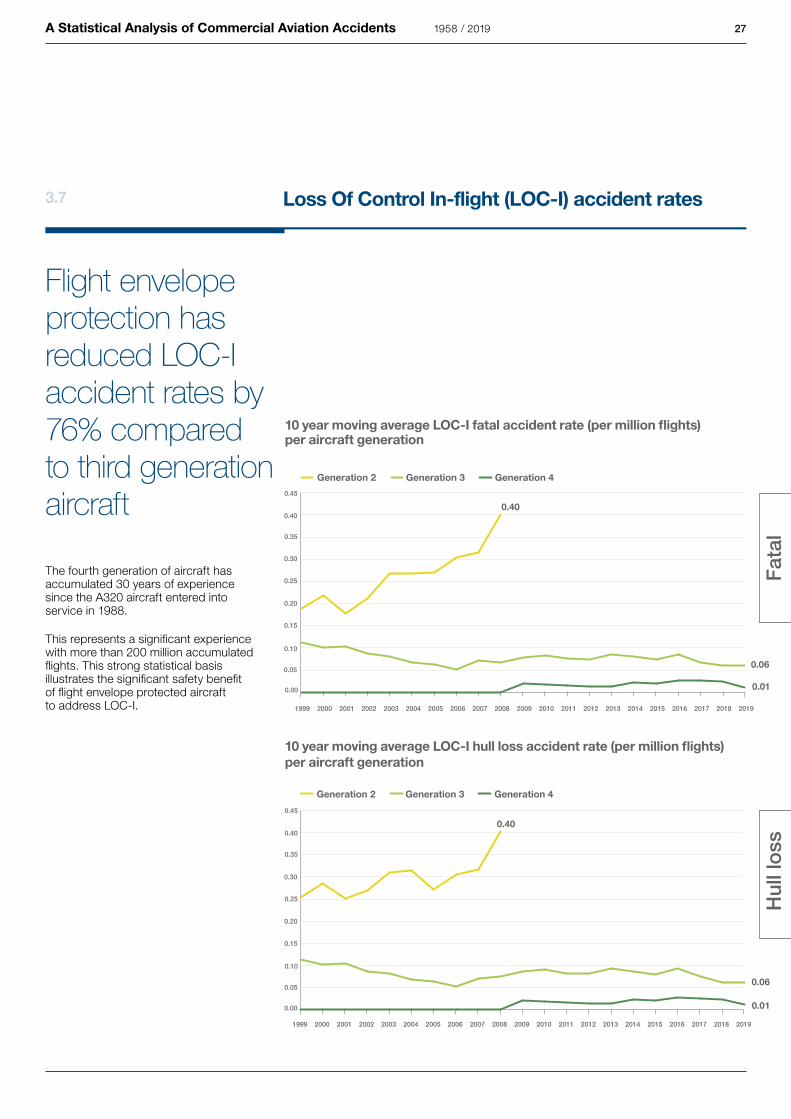
Flight envelope protection has reduced LOC-I accident rates by 76% compared to third generation aircraft
The fourth generation of aircraft has accumulated 30 years of experience since the A320 aircraft entered into service in 1988.
This represents a significant experience with more than 200 million accumulated flights. This strong statistical basis illustrates the significant safety benefit of flight envelope protected aircraft to address LOC-I.
0.40
0.40
0.06
0.06
0.01
0.01
1958 / 2019
3.8 Runway Excursion (RE) accident rates
28A Statistical Analysis of Commercial Aviation Accidents
10 year moving average RE fatal accident rate (per million flights) per aircraft generation
10 year moving average RE hull loss accident rate (per million flights) per aircraft generation
Fa
tal
Hu
ll lo
ss
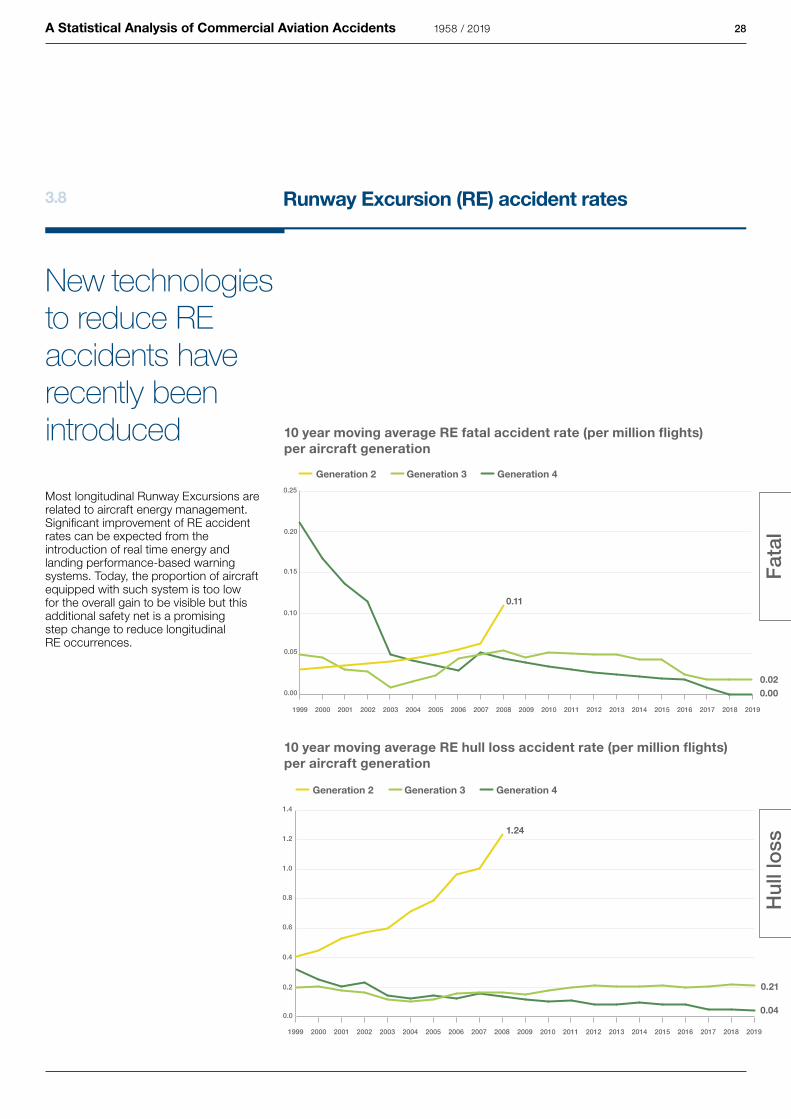
New technologies to reduce RE accidents have recently been introduced
Most longitudinal Runway Excursions are related to aircraft energy management. Significant improvement of RE accident rates can be expected from the introduction of real time energy and landing performance-based warning systems. Today, the proportion of aircraft equipped with such system is too low for the overall gain to be visible but this additional safety net is a promising step change to reduce longitudinal RE occurrences.
1.24
0.11
0.02
0.00
0.04
0.21
1958 / 2019
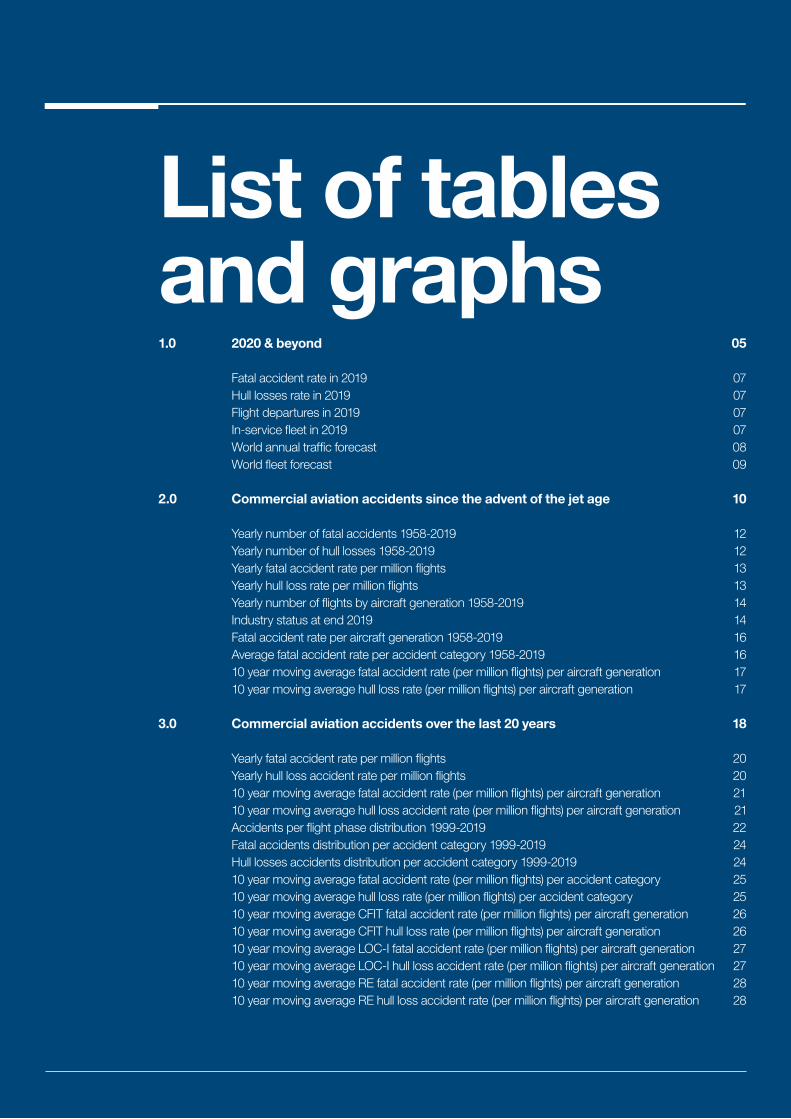
List of tables and graphs1.0 2020 & beyond 05
Fatal accident rate in 2019 07
Hull losses rate in 2019 07
Flight departures in 2019 07
In-service fleet in 2019 07
World annual traffic forecast 08
World fleet forecast 09
2.0 Commercial aviation accidents since the advent of the jet age 10
Yearly number of fatal accidents 1958-2019 12
Yearly number of hull losses 1958-2019 12
Yearly fatal accident rate per million flights 13
Yearly hull loss rate per million flights 13
Yearly number of flights by aircraft generation 1958-2019 14
Industry status at end 2019 14
Fatal accident rate per aircraft generation 1958-2019 16
Average fatal accident rate per accident category 1958-2019 16
10 year moving average fatal accident rate (per million flights) per aircraft generation 17
10 year moving average hull loss rate (per million flights) per aircraft generation 17
3.0 Commercial aviation accidents over the last 20 years 18
Yearly fatal accident rate per million flights 20
Yearly hull loss accident rate per million flights 20
10 year moving average fatal accident rate (per million flights) per aircraft generation 21
10 year moving average hull loss accident rate (per million flights) per aircraft generation 21
Accidents per flight phase distribution 1999-2019 22
Fatal accidents distribution per accident category 1999-2019 24
Hull losses accidents distribution per accident category 1999-2019 24
10 year moving average fatal accident rate (per million flights) per accident category 25
10 year moving average hull loss rate (per million flights) per accident category 25
10 year moving average CFIT fatal accident rate (per million flights) per aircraft generation 26
10 year moving average CFIT hull loss rate (per million flights) per aircraft generation 26
10 year moving average LOC-I fatal accident rate (per million flights) per aircraft generation 27
10 year moving average LOC-I hull loss accident rate (per million flights) per aircraft generation 27
10 year moving average RE fatal accident rate (per million flights) per aircraft generation 28
10 year moving average RE hull loss accident rate (per million flights) per aircraft generation 28
AIRBUS S.A.S. 31707 Blagnac Cedex, France© AIRBUS S.A.S. 2020 - All rights reserved, Airbus, its logo and the product names are registered trademarks.
Concept design by Airbus MultiMedia Studio 20192737. Photos by Airbus, A. Doumenjou, A. Pecchi, H. Goussé, aurelienantoine. Computer rendering by Fixion.
Reference: X00D17008863 Issue 4. February 2020. Printed in France by Art & Caractère.
Confi dential and proprietary document. This document and all information contained herein is the sole property of AIRBUS S.A.S. No intellectual property rights are granted by the delivery of this document or the disclosure of its content. This document shall not be reproduced or disclosed to a third party without the express written consent of AIRBUS S.A.S. This document and its content shall not be used for any purpose other than that for which it is supplied. The statements made herein do not constitute an offer.They are based on the mentioned assumptions and are expressed in good faith. Where the supporting grounds for these statements are not shown, AIRBUS S.A.S. will be pleased to explain the basis thereof.
This brochure is printed on Symbol Tatami White.This paper is produced in factories that are accredited EMAS and certifi ed ISO 9001-14001, PEFC and FSC CoC. It is produced using pulp that has been whitened without either chlorine or acid. The paper is entirely recyclable and is produced from trees grown in sustainable forest resources.
The printing inks use organic pigments or minerals. There is no use of basic dyes or dangerous metals from the cadmium, lead, mercury or hexavalent chromium group.
The printer, Art & Caractère (France 81500), is engaged in a waste management and recycling programme for all resulting by-products.