Embed Size (px)
Citation preview
A STATISTICAL APPROACH TO SOME MINE VALUATION AND
ALLIED PROBLEMS ON THE WITWATERSRAND.
A STATISTICAL APPROACH TO SOME
MINE VALUATION AND ALLIED PROBLEMS
ON THE WITWATERSRAND
D. G. Krige, B .S c .(E n g .) (Rand)
Thesis presented for the
Deg-se o f M.Sc. in Engineering,
U n ivers ity oi the WitwaLersrand
JOHANNESBURG, 15th March, 1951

INTRODUCTION
The d e te rm in a t io n of th e p robab le tonnage and
grade of payable ore rem aining from time to timo in a mine
and the c o r r e c t p o l ic y of s e l e c t i v e mining based on such
d e te r m in a t io n s , i s o f v i t a l im portance to the mining engineer
and the i n v e s to r of c a p i t a l . I t i s s u r p r i s i n g , th e r e fo r e ,
t h a t more a t t e n t i o n has no t been devoted on the W ltw iter. vnd
to th e s c i e n t i f i c improvement of mine va lu a tio n methods,
which a t p r e s e n t c o n s i s t a lm ost e n t i r e l y of the a p p lic a t io n
o f sim ple a r i th m e t i c and e m p ir ic a l f o T u la e based on p r a c t ic a l
e x p e r ie n c e .
E xperience t ~ed on i n t e l l i g e n t observation and
p i a c t i c a l e x p e r im e n ta t io n h a s , no d o u b t , th roughout the
h i s t o r y o f mankind provided the L&sls fo r the advancement o f
a l l th e r ien eo s as w e ll as +he n e c e s sa ry confidence in
approaching th e m u lt i tu d e of problems s c i e n t i f i c and otherwise
which have had to be faced from time to t im e . I t i s a l s o
e v id e n t t h a t w ith o u t th e found a t io n s to n e o f elementary
a r i th m e t i c th e so c a l le d e x a c t s c ie n c e s could not have
a t t a in e d t h e i r p re s e n t d e g iee o f developm ent. P r a c tic a l
ex p er ien ce and e lem en tary a r i th m e t i c - h a v e , t h e r e f o r e ,
n a t u r a l l y a l s o been in d is p e n s a b le in p ro v id in g the background
fo r p r e s e n t mine v a lu a t io n methods on th e Rand.
These m ethods, however, ig n o re th e a d d i t i o n a l
In fo rm a tio n and e x p e r ien ce which can be gained from a c a r e fu l
s t a t i s t i c a l a n a ly s i s o f the behav iour of gold values both
i n d iv id u a l ly and c o l l e c t i v e l y . In the w r i t e r ' s opinion what
i s c a l l e d f o r i n improving th e p r e s e n t methods i s , t h e r e f o r e ,
not th e d i s c a rd in g o f th e v a lu a b le e x p e r ien ce a l re a d y ga ined ,
but th e w idening o f such e x p e r ien ce by approach ing th e subject
on a s t a t i s t i c a l b a s i s , an approach which w i l l i n t u r n
i n e v i t a b l y / , . .
i n e v i t a b l y lead to the ad o p tio n o f improved methods of
v a lu a t io n .
The s c ie n c e of s t a t i s t i c s has expanded r a p id ly
d u r in g th e l a s t two decades and i t s va lue as an ind ispensable
to o l i$; now reco g n ised n o t only by r e s e a r c h workers and
s c i e n t i s t s but a l s o , ever in c r e a s in g ly , by th e commercial and
i n d u s t r i a l w orld . This be ing the case i t ;Ls noteworthy that
i n a mining f i e ld such as th e Rand w ith i t s h ig h ly developed
and advanced mining methods, s in g u la r ly l i t t l e a t te n t io n has
been paid t p th e a n a ly s i s o f mine v a lu a t io n problems on a
modern s t a t i s t i c a l b a s i s . This om ission i s even more
s t r i k i n g when cogn isance i s taken of the w ea lth of sampling
d a ta concern ing th e gold o re which i s a v a i l a b l e and o f the
f a r - r e a c h in g d e c i s io n s and d e d u c tio n s c o n s ta n t ly being based
on such d a t e . V arious c o n t r ib u t io n s have been made from time
t o time tow ards th e a p p l i c a t i o n of s t a t i s t i c s to mine
v a lu a t io n on the Rand* b u t a sy s te m a tic p r a c t i c a l approach on
c l e a r l y d e f in e d fundam ental concep ts s t i l l appears to be
la c k in g .
The o b je c t of t h i s paper i s , th e r e fo r e , to attempt
t o i n d i c a t e how th e mine v a lu a to r can g a in p r a c t ic a l experience
i n the s t a t i s t i c a l s tudy of gold v a lu e s , and how such
ex p e r ien ce a d s p e c i a l i s e d s t a t i s t i c a l methods can be applied
p r o f i t a b l y i n so lv in g many of th e exi s t i n g problems and in
improving th e g e n e ra l s ta n d a rd of mine v a lu a t io n on th e Rand.
For t h i s p u rp o se , d ig r e s s io n i n to th e somewhat s p e c ia l i s e d
f i e l d of m athem atica l s t a t i s t i c s w i l l be n e c e s s a ry , b u t i t i s
hoped t h a t th e mine v a lu a to r who la c k s th e m athem atica l
background t o g ra sp th e d e t a i l e d s t a t i s t i c a l re a so n in g f u l l y ,
w i l l be a b le to a p p r e c ia t e th e fundam ental concepts and I f
convinced , w i l l be a b le to app ly th e suggested methods
i n t e l l i g e n t l y / . . .
*Ref i, 13, l 4 , 1 5 , 3 , 5 ft 2 - see B ib l io g ra p h y .
I -r r
iv
i n t e l l i g e n t l y . I t i s for th is reason hat the w riter has
attempted to expla in certa a basic s t a t i s t i c a l concepts in
more d e r a i l than may appear necessary.
The w riter makes no claim that any o f h is suggested
methods are n e c e s sa r i ly unique nor the t -n a l word in s t a t i s
t i c a l a p p l ic a t io n , but i t i s h is earnest hope that the
thoughts pres ,.«ted may arouse the in t e r e s t o f those who have
th e w elfare o f mining a t h eart , and in so doing, a s s i s t in che
already overdue c lo s in g o f the present gap in the mine valua
t io n branch o f the sc ie n c e o f mining.
LA
r
TABLE OF CONTENTS
Pace
I , .
D e f in it io n of F\mdam.ental Concecta .........................................1. P o p u la t io n ....................................... ........................ ......................2. Sampling from a population ..................................................3 . Random s a m p l in g .............................................................................4 . Homogeneous and non-homogeneous populations ............
Frequency histograms and curves .........................................
The Gen era l Charact e r i s t i c s apd g.L„^SLognormal Frequency Curve ........................................................... ^1 . The shape o f the lognormal curve ................................ 1U2. The a p p lica t io n o f the lognormal curve in various
f i e l d s .............................................................................• • ! • • • 113„ Suggested reason for the lognorma] d is tr ib u t io n o f
gold values ...........................................................1$, General basic conclusions to be drawn from the lo g -
ormal d is t r ib u t io n of gold v a l u e s ................................
K r . i : : : : : : : : : : : : : : : : : : : : : : : : : : : \ \2 . Arithmetic m e a n .............................................................................3 . Transposed f o r m ............................................................................ ^L. Median and m o d e .........................................5. Moments and standard d ev ia t io n .........................................6 . Skewness and k u r to s ls ................................... •••7. The curve o f log xs r e la t io n between arithm etic and
geometric means ....................................................................8 . The d is t r ib u t io n o f a product o f x 2t9. The area under the curve and the average o f a l l x
values above any x value .................................................... ^10. Sampling from a lognormal population . . . . . . . . . 2 /
(a) D is tr ib u t io n o f arithm etic means o f s e t s o fsample v a l u e s ................................................. • • •
(b) D is tr ib u t io n o f geometric means of s e t s o fsample values and o f an "Improved" estim ate of the ar ith m etic mean .......................... 29
(c ) D is tr ib u t io n o f the variances o f s e t s o fsample v a l u e s .................................................................. ..
11. Combination o f lognormal subpopulations withid e n t ic a l parameters "a," and lognorma H v d i s t r i buted means ................................................ .. ••• • • • • • •
12. R ela tionsh ip between a parent lognormal populationand th e means o f s e t s of sample v a lu e s drawn fromth e lognormal subpopu la tions s t i p u l a t e d In 11 above 3“
13. F it t in g " th e lognormal cu rve: improvements in theestim ate o f the population mean ...................................(a) F i t t in g by moments o f observed values . . . . . . ,39(b) F i t t in g by moments o f logs o f values ...........(c) F it sing by the theory o f maximum l ik e l ih o o d w
14. Lognormal c o r r e la t io n . . . ................................................ ^
Vi
Page
c m m m i v .
A p r a c t i c a l Q raphjoal Method o f Curve F i t t i n g fo rl£&no ig a l p i s t r l i J t i o n s . . . T . ’ . . . . . . 501 . T ra n s p o s i t io n o f th e lognormal curve i n to a
s t r a i g h t l i n e ............................................................................. 502 . Logarithm ic p r o b a b i l i t y paper . . . 523. G raph ica l d e te rm in a t io n o f th e param eter "a" . . . 53*+. G raph ica l d e te rm in a t io n o f th e a r i th m e t i c mean . . . 555. G raph ica l o b s e rv a t io n o f non-homogeneity of a
d i s t r i b u t i o n ........................................................................ 566 . G raph ica l o b s e rv a t io n o f th e absence o f an e n t i r e
ca te g o ry o f the low est v a lu es ........................................ 577. Confidence zones .................................................................... 578 . The m athem atical e q u iv a le n t o f th e g ra p h ic a l f i t on
lo g a r i th m ic p r o b a b i l i t y paper . . . 60
CHAPTER V.
A. ■ P rac tica l I n v e s t i g a t i o n In to c e r t a i n B asic P ro p e r t ie s the D ls tr lb u t lO 'i o. Gold Values on W itw aie^srand
Mines ......................................................................................................... 621. D i s t r ib u t io n s o b ta in e d from l i n e a r and g r id samp
l in g and th e frequency w e ig h tin g o f v a lu es ................. 62(a) I n v e s t i g a t i o n based on development sampling
va lu es ................................................. 64(b) I n v e s t i g a t i o n based on s to p e sampling v a lu es . 64(c) C onclusions r e frequency w eigh ting o f v a lu es . 65
2 . E f f e c t o f th e s iz e o f a r e e f a re a on th e r e l a t i v eshape, i . e . the param eter " a , " o f th e d i s t r i b u t i o no f sample v a lu es .................................................................... 65(a General .............................................................................. 65(b) Development v a lu e s in r e s p e c t o f r e l a t i v e l y
la r g e a re a s . . . ............. 67(c) Development v a lu es in sm all a re a s . . . . . . . . . 69(d) Stope sampling v a lu es ....................... 71(e) A n a ly s is o f th e observed v a r i a t i o n s in th e
“a ' s " fo r d i f f e r e n t and equal s i z e a re a s . . . 72( f ) C onclusions ..................................................................... 73
3 . E f f e c t o f th e s iz e o f th e samples on th e r e l a t i v eshape o f th e frequency curve f o r a s p e c i f i c a r e a -d i s t r i b u t i o n s f o r o re r e s e r v e blocks ....................... 74(a) S ize o f samples . . . 74(b) Ore r e s e rv e d i s t r i b u t i o n f o r Mine A ................. 76(c) O ther o re r e s e r v e d i s t r i b u t i o n s . . . 79
4 . The d i f f e r e n c e s i n th e r e l a t i v e shapes o f thefrequency curves o b ta in ed from d ip , s t r i k e andg r id sampling . . . . . . . . . . . . . . . . . . . . . . . . . . . 82
CHAPTER VI.
Sgffle P r f c U s a l A R Bli.sstlons o f a ja t jU jt lg g M WA llie d . P f , ................................................... 84
I . The r e l i a b i l i t y o f in d iv id u a l fa c e and block v a lu a t io n s . . . . . . . . . . . . . . . . . . . . . . . . . . . . . . . . . 84(a) One sample per b lock o r fa c e .......... ............................. 85(b) A number o f samples per b lock or fa c e ................. 86(c) C onclusions re s to p in g p o l ic y ..................................... 89(d) The a d v i s a b i l i t y o r o th e rw ise o f co n tin u in g
, w ith s to p e sampling .................. 90
v i i
Page
2 . Forecasts o f mine gradu from borehole r e s u lt s . . . %(a) Confidence to be placed in borehole r e s u lt s . . 92(b) Additional confidence gained from d e f le c t io n s 93(c) The e f f e c t o f the d istan ce o f a d e f le c t io n
from the o r ig in a l in te r s e c t io n ....................... 96(d) General conclusions regarding the under- or
over-est im ation o f a mine's value from borehole r e s u l t s .................................................................... 97
3. Bias errors introduced in mine va lu ation due t o th el im ited number of a v a i la b le sample sec t io n s . . . 98(a) Bias errors in d i f f e r e n t ore reserve value
c a teg o r ie s , , , 98(b) Block plan fa c to r s in value c a teg o r ie s -
a c tu a l and th e o r e t ic a l , . ............................... 101(u) A\ v- rage block plan fa c to r above pay l im it . . . 104(d) A p a r t ia l explanation o f the mine c a l l fa c to r 105(s) The mine c a l l fa c to r and ac tu a l over-sampling 107( f ) The nercentage of unpay ore included and of
pay ore excluded in blocking out ore r e s e rv e s 109H. Other errors in mine va lu a tion .................................. I l l
(a) Sampling e r r o is ........................................................... m(b) Assaying e r r o r s ; s i lv e r content o f b u llio n . . 11?
5. Estimating face and block values more e f f i c i e n t l yfrort a v a i la b le sampling r e s u lt s ................................. V 3(a) where the parameter "a" can be predicted with
confidence b e fo r e h a n d .................................... 113(b) Where the parameter ''a” cannot be p re d ic te d
a ccu ra te ly ................................................................... 117
SMAgosted improved Mine Valuation Methods based mainly3 ta t i s 11c a 1 ,pp r 0 : 121
1. P r a c t ic a l suggestions concerning sampling ............... 1222 . P r a c t ic a l suggestions concerning the development
and stoping p o l i c i e s ............................................................ 122(a) Prevention o f b ias in lo c a t in g r a i s e s .............. 122(b) Regular s iz e b locks ................................................... 122(c) Confinement o f stop ing operations to properly
blocked out a r e a s ............................................................ 1233. The d isc o n t in u a tio n o f a l l "cutting" o f in d iv id u a l
or block v lu es ........................................................................ * 1234 . The in tro d u ctio n o f s t a t i s t i c a l methods for improv
ing block and face va lu ation s ......................................... 1235. Ore reserve computations based on defined l im i t s o f
error ................................................................................................ 1246 . The in tro d u ctio n , where necessary , o f s t a t i s t i c a l l y
determined block value co rrect io n fa c to r s .............. 12 $7 . Conclusion . . . 126
ADDENDUM.
Lfre.Frtgn?ncy_pi s t r lb u t lo n of Uranium Values and the C orrela tion between Ira.nlum ani. Gold Values .............. 1271 . D is tr ib u t io n o f uranium values ......................................... 1282 . C orrela tion between gold and uranium v a l u e s 1293 . In te r p o la t io n o f uranium ore reserv es from gold ore
reserves .................................... 1324 . The operation o f tt jo in t pay l im i t for gold and
uranium ............. 133
BlbAloKraphy .......... 137
Lr \
C H A P T E R
*
EEfXNITIQK OF FUNDAi SriA.L. CONCEPTS
The J r t e l l i g e n t observer has no doubt o ften been
amazed a t th e r e g u l a r i t y and o rder behind what at f i r s t g lance ,
appears t o be a c h a o t ic v a r i a t i o n in th e a t tr ib u te s of an
o b je c t , even t or c o n d i t io n . The in d iv id u a l h eigh ts o f th e |j
people forming th e p o p u la t io n o f a town, fo r example, appear
from a c a s u a l i n v e s t i g a t i o n to vary h ap h aza rd ly , and y e t wnen
such h e ig h t measurements a r e groured acco rd ing to the f requency
of o ccu rren ce o f in d iv id u a l s iz e s over th e f u l l range o f s iz e s
a s u r p r i s i n g l y uniform and r e g u la r t re n d in such f re q u e n c ie s
w i l l be fo u n d . Thus i n t e l l i g e n t e n e r v a t i o n and a n a ly s is
w i l l g e n e r a l ly d i s c lo s e the r e g u la r p a t t e r n and d e f in i t e law
behind th e ap p a re n t chaos , i . e . the method behind the a p p a ren t
madness. S t a t i s t i c s i s the branch of a p p lied mathematics
which s u i t a b l y p ro v id es th e s c i e n t i f i c a id required for such
o b s e rv a t io n and a n a l y s i s .
Even an ex p er ien ced mine v a lu a to r on tho Rand may
b e l ie v e t h a t th e v a r i a t i o n between gold v a lu es along a s t r e t c h
of d r iv e , r a i s e or s to p s fa c e i s h aphazard . This i s n o t the
c a s e , however, and i t fo llo w s n a t u r a l l y t h a t th e establishm ent
o f th e r e g u la r p a t t e r n and laws fo llow ed by such v a lu e s , and
the c o r r e c t i n t e r p r e t a t i o n th e r e o f , must open up now avenues
of approach t o the b e n e f i t r f mire v a lu a t io n i n g e n e r a l .
I t i s as w e l l to s t r e s s a t t h i s s ta g e t h a t tho b a s ic
problem o f mine v a lu a b le i i s t h a t the a c tu a l gold c o n te n t of a |
block of o re to be s to p cJ i s unknown and th a t i t can never be
de term ined e x a c t ly u n t i l th e ore has been mined and th e gold
e x t r a c t e d . Even i n th e l a t t e r ev, n t th e c o n te n t can only he
in f e r r e d s in c e i t i s im p o ss ib le to measure the gold l o s t in
m in in g / . . .
mining e x a c t l y , and f rc . j a p r a c t i c a l p o in t of view the o re
from a s in g le block cannot generally be kept separate u n d e r -N
ground and in tne reduction works. The actual gold v a lu e of
an in ta c t block of e r | ^an, th e r e fo r e , only be es tim a ted from
vne lim ited number of va lues a v a i la b le round i t s p e r ip h e ry ,
the orthodox estim ate being based on the arithm etic mean of
such a s e t o f a v a ila b le v a lu e s , i . e . the mean of such v a lu es
i s accepted as being the in d ica ted mean value of the b lo ck of%ore. h- ob ject of a s t a t i s t i c a l approach to mine v a lu a t io n
i s to determine the r e l i a b i l i t y of such e x i s t in g methods of
estim ation and to develop , where p o s s ib le , methods which w i l l
on average y ie ld c lo se r and more r e l i a b le e s t im a te s of the
actual mean value o f the ore from the l im ited a v a i l a b le samp
lin g inform ation.
Before th is can be done, however, the fo llo w in g
fundamental s t a t i s t i c a l terms and th e ir a p p l i c a t io n to mine
va lu ation on the South African gold f i e l d s have to be d e f i n e d !_ v
1. P o p u la t ion.
The common concept o f a ’•p o p u la t io n ” i s t h a t o f a
large group o f persons, each V'.mber" of the p o p u la t io n being
I d e n t i f ie d by h is or her own p articu lar a t t r i b u t e s such as
h e ig h t , w eigh t, age, w ea lth , e t c . In the s t a t i s t i c a l s e n se ,
however, the measurements o f any one a t tr ib u te of the
Individ a l persons in such a group c o n s t i tu te a p o p u la t io n
(o f urements) and each such measurement I s reg a rd ed as a
member o f the population.
In the case o f a gold mine, the ore body can be
regarded as a s in g le ore parcel which can bo subdiv ided i n t o a
large number of small p arce ls o f ore, each of th e se sm a lle r
parcels having i t s own a t t r ib u t e s , the v i t a l one n a t u r a l l y
being i t s gold content. The aim in framing the id e a l p o l ic y
of s e l e c t i v e mining i s t o s e l e c t for stoping purposes only
t h o s e / . . .
those p a r c e l s of ore which c o n ta in s u f f i c i e n t gold to pay fo r
a l l ex p en d itu re in cu rred up to and in c lu d in g the e x t r a c t io n of
t h i s g o ld , and to leave i n t a c t a l l p a r c e l s w ith an i n s u f f i c i e n t
gold c o n te n t to cover such c o s t s . In p r a c t i c e , excep t i n the
case of u n u su a l ly wide a u r i f e r o u s r e e f b o d ie s , t h i s r ro c a s s of
s e l e c t i o n ' j e f f e c te d in r e s p e c t of r e e f " p a rc e ls " which i n
each case occupy th e e n t i r e w idth of th e r e e f body for e c o n o m ic
band of r e e f ) and the "payable" and "unpayable" p a rc e ls can
co n seq u en tly be d e p ic te d on the p lane of th e r e u f by th e a re a s
covered by th e se p a r c e l s . For p r a c t i c a l pu rposes , t h e r e f o r e ,
a r e e f body :ln a p a r t i c u l a r mine can be regarded as a l a r g e
" a re a " of r e e f c o n s is t in g o f sm alle r in d iv id u a l r e e f " a r e a s H,
each "a rea" being i d e n t i f i e d in p a r t i c u l a r by the gold c o n te n t
c f th e ore p a rc e l (or "volume" or tonnage o f o re ) i t rep resen ts .
The gold c o n te n ts of such in d iv id u a l sm all r e e f " a re a s" w i th in
a la rg e r e e f " a rea" can from a s t a t i s t i c a l a n g le , co n seq u en tly
be reg ard ed as the members of a 'p o p u la t io n , ’
The s m a l le s t " a rea" o f r e e f th e gold c o n te n t of
which i s measured in p r a c t i c e , i s t h a t r e p re s e n te d by th e
c ro ss s e c t io n a l a re a o f th e s tandard s i z e channel cu t in th e
p ro cess o f sampling a c ro s s the w id th of th e r e e f body a t a
sampling s e c t io n , and on average m easures app rox im a te ly s i x |
square in c h e s . For mine v a lu a t io n p u rp o se s , t h e r e f o r e ,
* the measuremen ts c f the goj.d. con te n t s of a l l the s ta n d ard s iz e
(6 S3, in.) r e e f "a r e a s" which constitute a l a r g e r r e ^ f "a rea"
w i l l be r e g a r ded as a popul i t l o n and eve ry such l i id l v ldua]
measurement w i l l be a member f the p o p u la t io n . The b a s ic i
p o p u la t io n i s comprised o f the oc t u a l go ld c o n te n ts o f th e s e
"a reas" b u t th e se can in p r a c t i c e only be measured by u n d e r
ground sam pling , and hence the observed p o p u la t io n c o n s i s t s of
a number o f measurem ents o f th e a c t u a l gold co n te n ts concerned .
, the p r a c t i c a l caso of a hlock of ore nieasurinp^
say 200 f t . x 200 f t . , which has been sampled a t 5 fo o t
i n t e r v a l s round i t s p e r ip h e ry , the measured gold con ten ts of
the 160 odd s tandard s iz e r e e f "areas'* a t the correspond ing
number o f sample s e c t io n s w i l l c o n s t i t u t e the only known
members of the p o p u la t io n o f measurements of the gold
con . o* the odd m i l l io n 6 sq . i n , r e e f "a re a s" co n s ti tu tir^ ;
th e e n t i r e b lock .
1h* g o l i c o n ten t of any one such s tandard s iz e r e e f
"a re#" (t> sq . i n s . ) w i l l be measured by the assayed gold
cor; -?n 01 the sam ple(s) ob ta ined from th e channel out a t th e
co rresp o n d in g sampling s e c t io n , i . e . by the (weighted average)
d w t/ to n o f th e sam ple(s) x tonnage o f s a m p le (s ) . Now, s in ce
the tonnage of the sam ple(s) i s d i r e c t l y p ro p o r t io n a l to the
volume of th e s a m p le (s ) , and the volume i s in tu rn d i r e c t l y
p r o p o r t io n a l to th e o v e r a l l sampled . I d th (when the c ro s s
s e c t io n a l are* o f the channel cu t fo r every sample i s
i d e n t i c a l ) , i t fo llo w s t h a t th e measurement of th e gold conten t
of a s ta n d a rd s i r s r e e f " a rea" i s d i r e c t l y p r o p o r t io n a l to
the average d w t/ to n over the sampled width x th e sampled
w id th
" t o t a l inch dwts fo r th e sample s e c t io n
th«i a rea co n cern ed ,
The inch dwts of a sample s e c t io n can , t h e r e f o r e ,
a££jLiLtei. as a measurement ( r e q u i r in g only m u l t i p l i c a t i o n by
some c o n s ta n t f a c to r to y ie ld the a c t u a l number of dw ts) of th # -4
gold conten- of a s t a ndard s i z e of r e e f " a ro .y ((, s i , i n s . )
£ 0r-PspQnM n£. to t h i s sam pling s e c t i o n .
Where the r e e f w id th i s r e l a t i v e l y narrow the s to p in g w luth i s de term ined e n t i r e l y by p r a c t i c a l m in in g c o n s id e ra t io n s and i ? f a i r l y c o n s ta n t . In such a r t c the inch <*vt v a lu e * ' a sampling s e c t io n d iv id ed by the more - t l e s s c o n s ta n t f a c to r of th e s to p in g w idth 30 as to ; .d the d w t/ to n v .ue ovc* the s to p in g w id th w i l l a l s o , t h e r e f o r e .p r o v i d e a measurement of the gold c o n te n t of the r e l e v a n t s tan d a rd s iz e r o o f a r e a .
S i n i l n r l y / . . .
Mco rrespond ing to
S im ila r ly , in the case of a wide variab le re e f w idth having a d e f in i t e in flu en ce on the stoping w id th , but where n either of these widths appears on average to be re la ted to the corresponding inch-dwt values* the dwt/ton value over the stoping width at a sampling se c t io n w i l l on average a lso provide a measure of th e gold content of the corresponding standard s iz e r e e f a rea .
In the unusual case where there appears to be ad e f in i t a r e la t io n sh ip between the stoping w idths and corresponding inch-dwt va lues a t the v a r io u s sample s e c t io n s , the problem i s more complicated and w i l l no t be considered in th is paper.
Frc a p r a c t ic a l point of view, t h e r e f o r e , the use
of e ith e r the inch-dwt value or the dwt/ton value over the
stoping width a t a sampling sec t io n can be j u s t i f i e d and
should j l c l d the same eventual answer, s in ce the average
dwt/ton value for the tonnage of ore in a block i s the quotient
of the average inc^-dwt value and the average s to p in g width.
For the purpose of th is th e s is the inch-dwt measure
w i l l be used almost in v a r ia b ly and a population w i l l t h e r e fo r e
be considered as being comprised of a number of inch-dw t
values o f sample se c t io n s corresponding t o 'S tandard" s iz e r e e f
areas , In the case of a block o f ore , for example, the
population w i l l consist o f a l l tho t h e o r e t i c a l ly p o s s ib le
inch-dwt va lues which could bo obtained i f th e clock wore to
be entree cod by a process of continuous sam pling.
S im ila r ly the sam.clo va lues obtained from a s ^ - e t c 1'
of d r iv e , r a is e or $>topc face can ba considered to be oouiva-
le n t to that obtained from a r u la t iv e ly narrow and e lo n g a ted
"area" o f r e e f contain ing a population of sample s e c t io n
v a lu e s .
A case where the area concept i s departed from i s in
the a n a ly s is o f the d is t r ib u t io n of ca lcu la te d ore r e s e r v e
va lu es . In t h i s case the population in e f f e c t com prises the
in d icated moan values o f a number of blocks of o re . In o rd e r ,
h o w ever /. . .
* i . e . where tho f u l l range o f stoping width v a r ia t io n s i sl i k e l y to be a sso c ia ted with every category o f inch-dw t
however , to allow for the fa c t that these block areas a re
u su a lly not only very d ivergent In s i z e , but a lso i n s u f f i c i e n t
In number to r e f l e c t the proper d is t r ib u t io n of the ore]
reserve v a lu e s , :he tonnages of the varlou value c a te g o r ie s
provide a. b e tter frequency measure. The population w i l l
th erefore in th is case c o n s is t of a l l the in d iv id u a l to n s of
ore in the ore reserves each at the in d icated average value of
the ore block of which i t fc "s part.
2 . Sampling from a Population .
In the s t a t i s t i c a l sense "sampling11 im p lies the
s e le c t io n , a t random, of a lim ited number o f members o f a
population , the group of s e le c te d member c o n s t i t u t i n g the so
c a l le d "sample". To the mine valuator "sam pling" im p l ie s th e
p h ysica l a c t of c h i s e 1lin g out a few pounds of r e e f (and waste)
m ateria l for assay purposes, and "samples" imply the separate
packages of r e e f (and w aste) m aterial ob ta in ed in "sampling".
I t i s , th e r e fo r e , obvious that in th e a p p l i c a t io n of s t a t i s t i c s
to mine v a lu a tio n a c lea r d i s t in c t io n i s re q u ire d between the
above dual meanings of both "sampling" and "sample". Since
th is t h e s i s i s primarily inteiided fo r the b e n e f i t of mine
v a lu a to r s , the va lu ation in te r p r e ta t io n of th e se two terms
w i l l be maintained and the corresponding s t a t i s t i c a l terms
w i l l be referred to in the fo llow in g manner
S t a t i s t i c a l Term.___
"Sample"
"Sampling"
Valuation E qu iva len t
A se t o f sample v a lu es drawnfrom a population of sample .values.
The act o f drawing a s e t of sample va lu es from a p o p u la t io n of such v a lu e s .
The term sample where used in t h i s t h e s i s , t h e r e f o r e ,
u n less a l i f i e d i s used in the mina v a lu a tio n sense and an
in d iv id u a l sampl value w i l l be the inch-dwt value a t a
s a m p lin g / . . .
sampling s e c t io n , i . e . a member of a population o;' Individual
sampl3 v a lu es .
i . Random Sampling.
A considerable part of s t a t i s t i c a l theory has been
L'lilt up round the basic concept of "random'' sampling
( s t a t i s t i c a l s e n se ) , i . ' 3. the concept c f the drawing 01 a set
of sample va lues (va luation sense) from a population of such
valuea in a purely random and unbiassed maimer. B r ie f ly th is
means that everv i n d i v i d u a l member of a population must have'
an eoual chance o f s e le c t io n .
Consider now an area c? a r e e f body from which a set
of "random" sample va lues i s required. I t i s commor sen to
any mine valuator f i a t i f , for in s ta n c e , 10 samples a r e taken
in , say, tho confined space of one corner of t h i s r e e f " a r e a ,"
the va lues of such samples w i l l , in a l l p r o b a b il ity , n o t be
r e p resen ta t iv e of the va lu es in the "a re a " as a whole, and
s in ce the th e o r e t ic a l sample va lues It the rem ainder o f the
"area" had no chance o f s e le c t io n at a l l , the 10 sample
values w i l l c e r ta in ly not be "random." To e n su re , t h e r e f o r e ,
that pi 1 sample values have an equal chance of s e l e c t i o n the
id e a l p r a c t ic a l mothod would apparently be to d iv id e th e "area
in to ten equa] portions and to s e le c t without b ia s one sample
per p o rt io n , Much a method being v i r t u a l l y equivalent to g r id
sampling on a square pattern
In p r a c t ic e , however, samples can only be ta k e n
round the periphery of en ore b lock . The th e o r e t ic a l sample
values in the in te r io r of the b lock , th e r e fo r e , have no chance
of s e l e c t i o n , and "random" sampling in the id e a l sense becomes
im p ossib le . Where, however, the s e le c t io n o f the lo c a t io n s
o f the d r iv es and r a is e s bounding a block of ore has not been
iifltranced in any way by sampling va lues previously known or
in ferred , and where sampling round the periphery i s carr ied out
w it h o u t / , . .
w ithout b i a s , i t i s contended that the r e s u l t s w i l l in g e n e ra l
conform to those which would be obtained from id ea l "random"
sampling of the block on a grid pattern . D e ta i ls of an
experimental attempt to confirm th is contention w i l l be found
in Chapter V, paragraph 1 ,
^ • Homogeneous and Non-homogeneous P opulations.
The sample va lues along a w e ll defined r e e f h o r iz o n
(or sedim entation u n it) where the o r ig in a l pattern of gold
.position has not subsequently bnen upset by f a c to r s such as
leach in g , can be regarded from a p r a c t ic a l point of view an
c o n s t i tu t in g a homogeneous population. Where however two
r e e fs merge or where the basic gold d i s t r i b u t i o n has been u p se t
by e . g . , the hydrothermal ad d ition of gold or the le a c h in g cut
of a proportion o f the g o ld , the r e su lta n t p o p u la t io n w i l l no
longer be homogeneous and may d i s c lo s e c h a r a c t e r i s t i c s f o r e ig n
to those o f the co n s t itu e n t or of the o r i g i n a l p o p u l a t i o n s )
r e s p e c t iv e ly . In cases whore non-homogeneity i s suspected ,
th e r e fo r e , the problems should be approached e i t h e r from the
angle of the c o n s t itu e n t homogeneous p o p u la t io n s (where a
mixture o f populations i s susp ected ), or of tno r e c o n s t r u c t io n
of the o r ig in a l homogeneous population . Such problems however
are s p e c ia l i s e 1 and f a l l ou tside the b asic concepts which
require con sid era tion a t th is s ta g e .
5. Ff Hi s and. Si e v e s .
The s t a t i s t i c a l a n a ly s is o f a population o f v i ' <es
c o n s is t s prim arily of the segregation o f such va lues i n t o a
range of s e le c te d value c a te g o r ie s . The population I s th en
represented g rap h ica lly by p lo t t in g the l im i t s o f the range of
values w ith in each value category as a b sc is sa e and on each such
range of va lues as base , a rectan g le w ith area in d ir e c t p ro
portion t o the frequency o f occurrence o f the values in the
v a l u e / . . .
va lue c a te g o ry concerned. The r e s u l t a n t s te p diagram i s
c a l l e d a frequency h is to g ra m .and where the va lue ranges are
made s u f f i c i e n t l y sm a ll , t h i s s te p diagram w i l l the
l im i t in g c a s e , merge i n to a smooth curve c a l le d a f requency
cu rv e .
CHAPTER I I / . . .
/ ' VNormal curve
b
X.
Lo gn orm ul Curve
^ W s P -C\
I
THE GENERAL CHARACTERISTICS AND APPLICATIONS PE—IHE- .LOGNORMAL FREQUENCY CURVE I
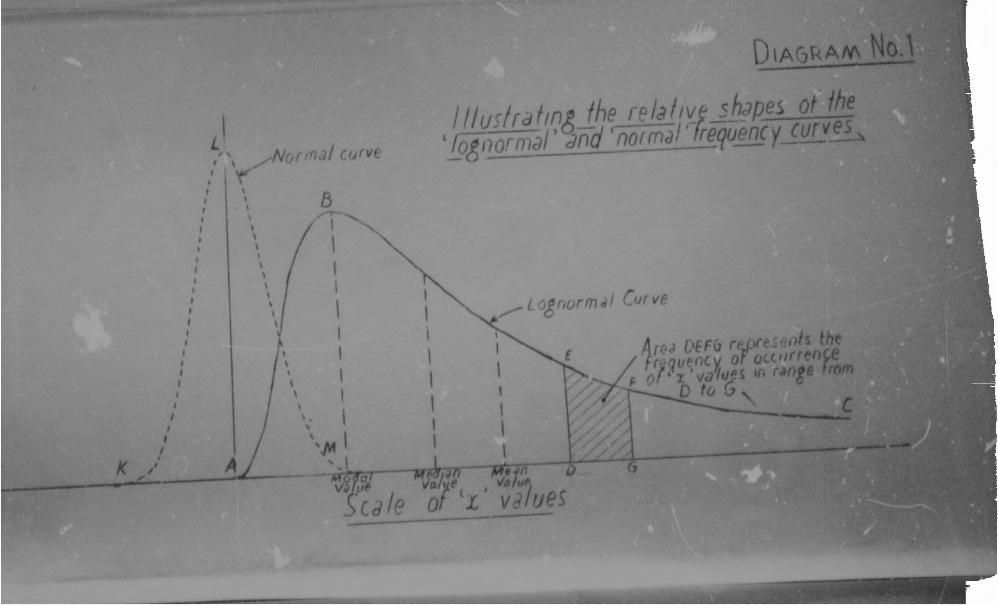
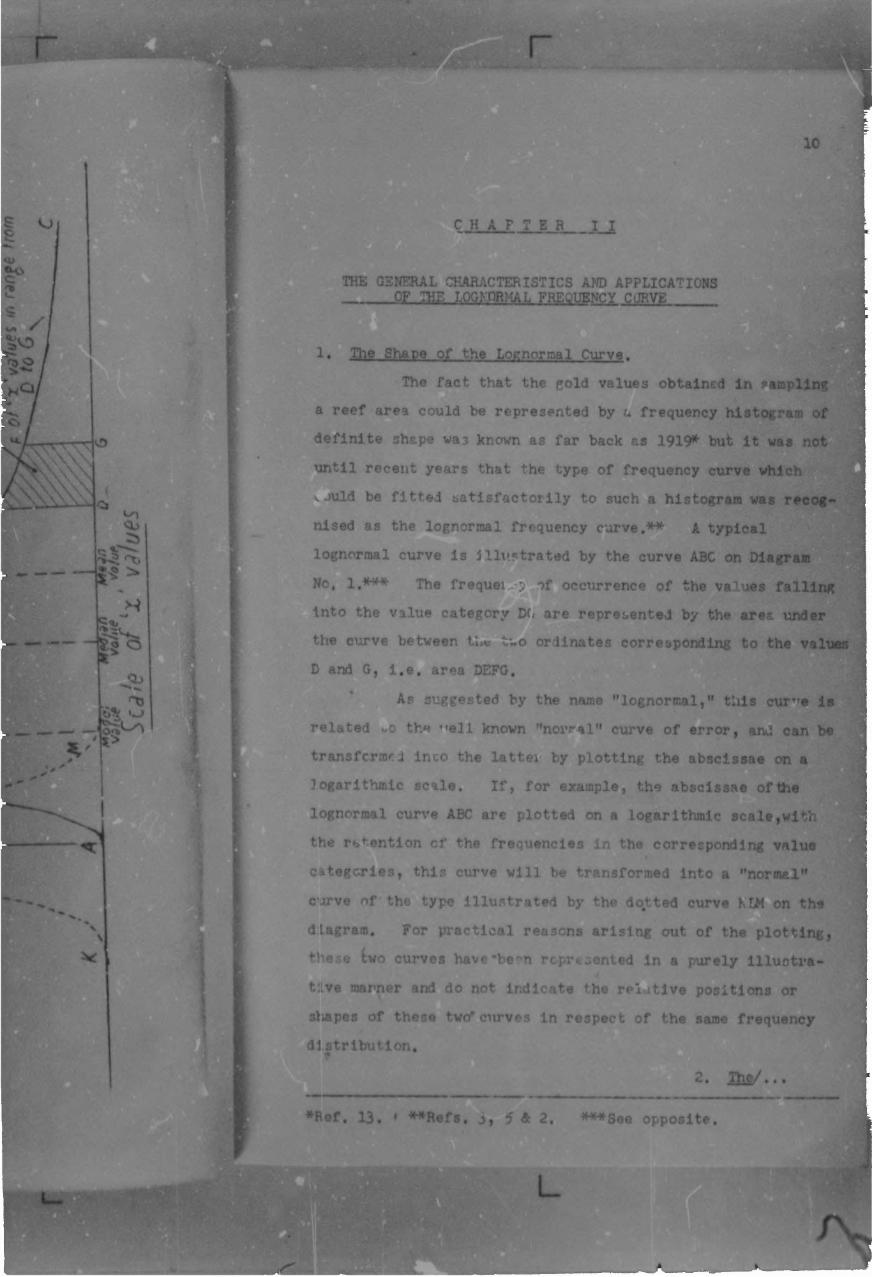
Shape o f th e Lognorm al C u rv e .
The fa c t that the gold v alu es ob ta ined In sampling
a r e e f area could be represented by a f requency h is to g ram of
d e f i n i t e shape was known as far back as 1919* but i t was not
u n t i l recen t years that the type o f frequency curve which
JUld be f i t t e d s a t i s f a c t o r i l y to such a h is tog ram was re c o g
nised as the lognormal frequency curve.-** A ty p ic a l
lognormal curve i s j llv .F trated by the curve ABC on Diagram
No. 1.*** The f r e q u e i o f occurrence of the v a lu es f a l l i n g
in to the value category DC are r e p re s e n te d by the a re a under
the curve between the two ordinates correspond ing to the values
D and G, i . e . area DEFG.
As suggested by the name " lo g n o rm al," t h i s curve i s
r e la ted uo the ” e l l known "novral" curve o f e r r o r , and can be
transformed inco the l a t t e r by p lo tt in g the a b s c is s a e on a
logarithm ic s c a le . I f , for example, the a b s c is s a e of the
lognormal curve ABC are p lo tted on a lo g a r i th m ic s c a l e ,w i th
the r e te n t io n o f the frequencies in the co rrespond ing v a lu e
c a te g o r ie s , t h is curve w i l l be transformed in to a "normal"
curve o f the type i l lu s t r a t e d by the dotted curve KIH on th e
diagram. For p r a c t ic a l reasons a r is in g out o f th e p l o t t i n g ,
th e se two curves h ave’been represented in a p u re ly i l l u s t r a
t iv e manner and do not in d ic a te the r e l a t i v e p o s i t io n s or
shapes of these two' curves in resp ect o f the same frequency
d is t r ib u t io n .
1M / . ..2 .
*Ref. 13, ' * * R e fs , 3 , ? & 2. ***See o p p o s ite ,
2 . The Appl i c a t io n of the Lognormal Curve in Various FI
The lognormal frequency curve i s not pecu liar to the
d is t r ib u t io n of gold va lues and has been found to be ap p licab le
in a large number of w idely d i f f e r e n t fielu& as the fo llo w in g
b r ie f l i s t w i l l in d ic a te : -
The incomes of in d iv id u a ls in a nation ,*
The s iz e s of grains in samples from sedim entary d e p o s its .* *
The s iz e s of sandgralns in samples from windblown sand.***
The s iz e s of p a r t ic le s of s i l v e r in a pho tograph icemulsion,****
S e n s i t i v i t i e s of animals of same sp ec ie s tod ru gs.* ’'**
Numbers of plankton caught in d i f f e r e n t h a u ls w ith a net.****
Amounts of e l e c t r i c i t y used in medium c l a s s homes in the U.S.A.****
Reaction times of human beings in a word te s t ,* * * *
Number of words in sentences from works of G. B. Shew.****
Diameters o f p a r t ic le s of airborne d u s t in co a l mines,****
As far as the Witwatersrand gold f i e ld and i t s
ex ten sion s arc concerned, evidence from a number of th e ch a in
of mines s tre tch in g for more than a hundred miles from
Heidelberg in the ca s t to the West-Wlts l in o in the west as
w ell as from mines in the Klcrksdorp S e c to r , in d ic a te s t h a t i t
i s h igh ly probable that the lognormal curve can be a p p l ie d
throughout to a l l the economic r e e f horizons e ith e r d i r e c t l y
or in d ir e c t ly (where the population of gold values i s no t
homogeneous) , An a n a ly s is of the borehole values for the
Basal, Reef in the Orange Free S tate f i e l d confirm the n a t u r a l
exp ecta tion that these va lues arc a lso lognormally d is tr ib u te d
3. Suggested/ . . .
♦ R e f .5. * *R efs„ 11 & 18. ***Rcf. 19. ****Rcf. 20.
3 . Suggested Reason for tho Lcgnormal D is tr i bution of Gold V alues .
The abov' Ind ication s of the general a p p l i c a b i l i t y
of the lognormal frequency curve suggest that lognormal d i s
tr ib u t io n s r e s u l t froin d e f in i t e natural laws which cover a t
l e a s t a l l tho f i e l d s referred to in paragraph 2 abo” o.
A r e e f body can be regarded as a m ixture o f gold and
waste p a r t i c l e s , the r e la t iv e concentration of the former per
u n it r e e f area being measured as prev iously exp la ined by the
inch-dwt value of a sample s e c t i o r . D is reg ard in g the v a r ia
t io n in p a r t ic le s i z e s , the mixture of gold and waste p a r t ic le s
can be considered analogous to a mixture o f , say , £>lack and
white b a l l s r e s p e c t iv e ly , and the roof in a block o f ore
analogous to a layer of such a mixture of b a l l s covering a
corresponding area. I f , now an even layer of b a l l s was
formed by the spreading of the mixture of b a l l s i n an e n t i r e l y
random manner over the area of the block concerned , i t can be
shown by tho app lic i t io n of the b asic t h e o r ie s of p r o b a b i l i t y
that tho concentrations o f black b a l l s per u n it sm all a r e a ,
(sa y , 6 sq. i n s . ) w.JM vary according to the "normal"
frequency d is t r ib u t io n law, i . e . tho f requency d i s t r i b u t i o n of
such concentrations w i l l conform to the "normal" f requency
curve .
I f th gold p a r t ic le s were d e p o s ite d in a random
manner, one would, th e r e fo r e , n a tu ra lly expect th e gold
concentrations per standard s iz e area as measured by the sample
se c t io n inch-dwts a lso to be d is tr ib u te d "n o rm a lly ," w h ereas ;
in f a c t , the logarithms of such inch-dwt v a lu e s a rc "norm ally"
d is t r ib u te d .
Tho follow ing re feren ces to Nature's use of the
l in ea r and logarithm ic s c a le s a rc , however, of p art icu lar
in t e r e s t in t h is connectlor and may provide a p a r t ia l
e x p l a n a t io n i -
"The l in e a r s c a le , s in ce i t was f i r s t cut on the w a ll of
an Egyptian temple, has come to be accepted by man
almost as i f i t were the one unique sca le w ith which
Nature works and b u i ld s , whereas i t i s noth ing of th e
s o r t , I t s so le value l i e s in g iv in g due prominence to
the d if fe r e n c e s and sums of q u a n tit ie s when th e se a re
what we want to d isp la y . But Nature, i f she has any
p referen ce , probably takes more i n t e r e s t in th e r a t i o s
between q u a n t i t i e s ; she i s rare ly concerned w ith s iz e
for the sake of s iz e ," *
"Linear s c a le s are seldom acceptable to Nature. A
m illim etre d if fe r e n c e between the diameters of two
boulders i s in s ig n i f ic a n t but a m illim etre d i f f e r e n c e
between one sand grain and another i s a large and
important in e q u a l i ty . The natural s c a le fo r s iz e
c l a s s i f i c a t i o n , th e r e fo r e , i s logarithm ic,"**
I t I s , th e r e fo r e , no4- s u rp r i s in g t h a t the d i s t r i b u
t io n s of e . g . , grain s iz e s in a sample from a sedim entary
horizon and the s iz e s o f sand grains in n a t u r a l l y d e p o s i te d
windblown sand d e p o s i t s , tend to be "normal" when the s iz e s
are measured on a logarithm ic s c a le . W ithout e n la rg in g i n any
way on the above quotations or endeavouring to r e c o n c i l e t h e y
observed fa c ts with the laws c o n tr o l l in g the s e t t l i n g o f (»o ld )
p a r t ic le s in l iq u id s , i t appears that the f a c t t h a t gold v a lu es
are d is tr ib u te d "normally" only when measured on a lo g a r i th m ic
sc a le could be explained from tho natural laws a l r e a d y known,
and that research in t h i s d ir e c t io n w i l l prove p r o f i t a b l e ,
bearing in mind p a r t ic u la r ly the remaining doubts a s to the
o r ig in of the gold in the W ltw etorsrand r e e f s ,
*+. Gen e r a l / . . .
♦Ref. 19, p. 2. **Ref. 18, p. 15.
14
S in c i the gold values In a homogeneous r e e f body can
be expected to be d is tr ib u ted lognormally, l.ie que-tlon
n atura lly a r ires whether th is w i l l be the case ir r e s p e c t iv e of
the s iz e of t:-* area concerned. The s e le c t io n of the bound
a r ie s of a m'.nc in resp ect of which the lognormal d is tr ib u t io n
gold values has been observed, i s gen era lly arb itrary and
i t i s , th e r e fo r e , natural to expect the d is tr ib u t io n s of gold
vdl iec w ith in cortion s o* such a mine a l s o to be lognormal
i r r e s p e c t iv e of the s iz e of such p o rt io n s . This ha* been
confirmed by p r a c t ic a l experiment for various s iz e s o f r e e f
areas down to a s iz e smaller than that of the average ore
reserve block on a mine.*
Further, s ince the d e c is io n Sc s e le c t samples
corresponding to r e e f areas of 6 sq. in s , each i s a lso
a r b itr a r y , the s iz e of the sample should a lso not a f f e c t the
t y p ic a l ly lognormal d is tr ib u t io n of gold v a lu es . This i s
confirmed by the observed face that in an ideal ca e** the
average va lues of ore reserve blocks w ith in s. ruine are a l s o
d is tr ib u te d lognormally.
I t i s immediately evident fror I l lu s t r a t io n o f a
ty p ic a l lognormal .urve (Diagram No. 3 ,> f t the iroh-dwt
values comprising a lognormal frequency jv r /e c c v ^ Lhn e n t ir e
th e o r e t ic a l range from z e r o -to i n f i n i t y . C o r in g In mind
that the area under the cur-'' corresponding to uny p a rt icu la r
value category i s a d ir e c t i .asure o f the frequency c f occur
rence o f values in th is value category , i t i s evident that
s in ce the curve approaches tha x -a x is a sym p to tica lly in the
range of the higher value c a te g o r ie s , the frequency o f
o c c u r r e n c e / . . .
*See Chapter V,**'Where the mine i s 100? payable and the ore r e sa r v e s . th ere
fo r e , include a l l ore b locks; and where the natural d i s t r i bution has not been upset by previous mining o p era t io n s ,
Am
occurrence of extremely high values i s r e la t iv e ly small but
that i t can only become zero for i n f i n i t e l y large v a lu es .
In drawing a s e t of values at random from a
population o f v a lu es , the p ro b a b il i ty o f drawing a value in
any p a rticu la r value category i s measured by the r e la t iv e
frequency o f occurrence of values In t h i s category, e . t . i f.
10# of the t o t a l values occur in a p a rt icu la r value category ,
the p r o b a b il i ty of drawing a value from t h i s category w i l l
n a tu r a lly be 1 in 10, I t i s , th ere fo re , evident th a t in the
case of a lognormal d is t r ib u t io n of v a lu e s , the pro b a b i l i ty of
iS r ik lr a an extremely high value i s s l i g h t but m u n— :
besoae nor-o ja s te n t except X*' I n f in i t e ly large v a lu e s .*
It i s a lso evident from Diagram No, 1 that e v e ry
lognormal d i s t r i b u t i o n , no matter what i t s mean value may be,
must comprise a mixture of values ranging tV soretlc& lly from
zero to i n f i n i t y . a d is t r ib u t io n with a low average value
w i l l , th e r e fo r e , always conta in a proportion (even i f
i n f i n i t e l y sm a ll) o f r e l a t i v e l y high v a lu e s , and v ic j , v e r s a a
d is t r ib u t io n with a high average value w i l l contain a propor
t io n of r e l a t i v e l y low v a lu e s . In mine vp,:*’a t ii .n , th ere fo re ,
t&S- o g c ^ r g n c e _ o f ^ l i ^ v -e l^ h lg b _ y ^ iufis (even j,f only occa-
.ilPlW lyi) lh a low-grade block of ore i s q u ite natui nd
s im ila r ly a l s o the occurrence of low value* i n a big .grade
block of ore.
Considering now the p r a c t ic a l aspect o f , say , a
block of ore or a stope face in resp ect o f which only a lim ited
number o f a l l the p o ss ib le va lues i s a v a i la b le , i t i s evident
that the p oss ib le combinations o f , say , 10 sample va lues each,
which can be drawn from this complete d i s t r ib u t io n formed by a l l
t h e / . . .
♦In p ra ct ice the maximum ’ old va.lv v i s i b l e w i l l be that corresponding to puro g o ld , i . e . none 5 8 3 ,0 0 0 d v t s / to n , or say,29 m il l io n inch -d vts for & 50-lncn stoping width.
the sample v a lu e s , w i l l be I n f i n i t e and , t h e r e f o r e , t h a t the
p r o b a b i l i t y of s t r i k i n g two id e n t i c a l s e ts _ o f 10. v a l u e s .each
i s s l i g h t . F u r th e r in view of the wide range of va lues
covered by the p a ren t p o p u la t io n , the s t r i k i n g of a s e t In
whlSh a l l . 10 va lues a r e , i den t i ca l . I s v i r t u a l l y lmpo;g%bl9 .
I f , t h e r e f o r e , i n sam pling , say , 10 s e c t ! is a )ng a stop*
f a c e , th e inch-dw t v a lu es a re found to be i d e n t i c a l ov to l i e
w i th in a very c lo se range of v a lu e s , th e r e s u l t i s e ith e r that
of a h ig h ly improbable even t or must be suspected of not being
genuine .
A f u r t h e r b a s ic co n c lu s io n to be drawn from the
knowledge of the lognor a l frequency d is t r ib u t io n o f gold
v a lu es 1 - th a t the in d iv id u a l sample values a v a ila b le in
r e s p e c t o f a b lock of o re or a otope fa c e represent only a few
known v a lu e s ou t of a v i r t u a l l y i n f i n i t e number of values
which can be o b ta ined by re p e a te d sam pling . Where the few
known sample v a lu e s a re d ' s t r i b u t e d over the range of values
i n app ro x im a te ly the same p ro p o r t io n s as th e t o t a l nuaber of
p o s s ib le sample v a lu e s , th e mean va lue of these few samples
w i l l n a t u r a l l y correspond c lo s e ly to th e true mean value o f a l l
the p o s s ib le sam ples. In p r a c t i c e , however, some of the r * la -
t i v e l y few ex trem ely h ig h v a lu e s in th e parent population of
v a lu e s , must a t one time or ano ther be struck in taking a s e t
of sam ples , and w i l l i n such an even t appear to be out of accord
w ith th e r e s t of th e sample v a lu es in th e s e t , and w i l l r a is e
the average va lue of th e s e t to an abnorm ally high f ig u r e .
Such v a lu e s a re g e n e ra l ly regarded as 'anom alous," "freak,"or
th e r e s u l t of bad sam pling , and a re in p r a c t i c e u s u a l ly "cut"
or " a d ju s te d " by a r b i t r a r y methods i n o rd e r to y ie ld w h a t ,at
any r a t e , app ears to be a more r e l i a b l e average r e s u l t . Such
a p p a re n t ly anomalous v a lu e s a r e , however, genuine members of
the p o p u la t io n o f v a lu es along tha s to p s face or i n the block
I—
17
of ore, and are , th ere fo re , In no sense tru ly anomalous or
freak. The correct approach to the problem of estim atin g the
true mean value of the unknown population of v a l u e s , ( I . e . of
the stope face or ore block) from the few known members of th is
population , ( i . e . from the few a v a ila b le sample values,) i s ,
tn e r e fo r e , to f i l l in the gaps between tuese known values in
such a way as t j r e s u lt in the best estim ate of the parent
d is t r ib u t io n of v a lu e s , i . e . the population , without d iscard ing
or " c u tt in g " any one value which may appear to be anomalous.
This i s b a s ic a l ly the aim in approaching the problems o f mine
va lu ation from a s t a t i s t i c a l angle.
I t i s a lso evident that s ince even adjoining sample.
values cannot be exported to bo id e n t i c a l , a fa c t which has in
a p r a c t ic a l way o ften beer, observed from the r e s u l t s o f check
sampling in the same groove, any sample value cannot be regarded
as having a so c a l le d "aroa or d is ta n ce of i n f l uence," except
in so far as i t i s r e la te d to the actu a l r e e f area p rev iou sly
occupied by the sampled m ater ia l , i . e . approximately 6 sq. in s .
Where sampling i s done a t , say, r fo o t I n te r v a ls , the "influence"|
o f a sample value cannot, th ere fo re , on any lo g ic a l grounds be
extended for a d is ta n ce o f 2^ f t . on e ith e r side o f the r e l e
vant sample s e c t io n . I t appears, th e r e fo r e , that sampling
need not be carried out a t r ig id ly determined, regular in te r v a ls ,
ard that where such in te r v a ls are in practica , irregu lar (but
not such as t o Introduce any obvious b ia s ) ,w e ig h t in g of
in d iv id u a l values by tho ir so c a l le d "distances o f in fluence"
cannot be upheld on s c i e n t i f i c grounds. I t a l s o fo llow s that
the concoction that an occas ion a l high value encountered Ir,
sampling su c cess iv e stopc faces in a low-grade block o f ore i s
In d ic a t iv e of a patch of high-grade pro (extending halfway from
thi velevant sample s e c t io n to surrounding sampling s e c t io n s ) ,
Is e n t ir e ly erroneous.
I L
CHAPTER I I I / . . .
A MATHEMATICAL ANALYSIS OF CERTAIN PROPERTIES OF THE LOGNORMAL DISTRIBUTION AND LOGNORMAL ________________CORRELATION SURFACE________________
Notai In t h i s and subsequent c h a p te r s the fo llow in g r e f e r e n c e s w i l l app ly
Normal curve
Mean
Sample
L o g a rith m s
- th e normal curve of c n or on which th e major p a r t of th-i theory of s t a t i s t i c s i s based ,*
- a r i th m e t ic mean,
- sample i n th e mining v a lu a tio n sense as d i s t i n c t from "sample" in th e s t a t i s t i c a l s e n s e < the la t t e r being r e f e r r e d to i n th is th e s is as a " se t o f sample v a lu e s ."
- Naperian lo g s u n le s s otherw ise s t a t e d , i . e . lo g s to the bare "e,"
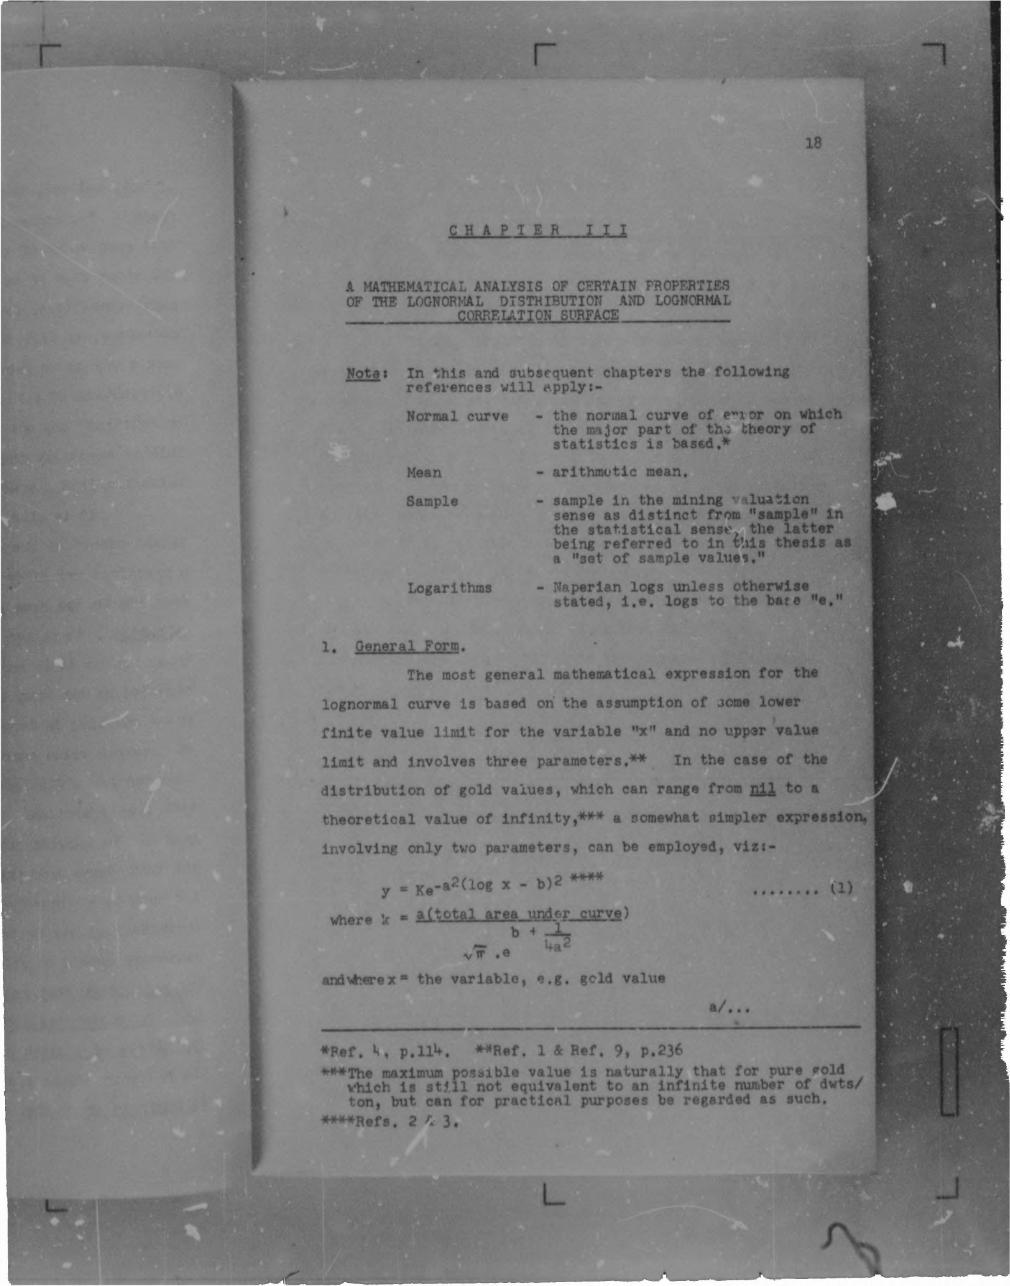
1 . G eneral Form.
The most g e n e ra l m athem atical e x p re ss io n for the
lognormal curve i s based on th e assum ption o f some lower
f i n i t e v a lu e l i m i t fo r th e v a r i a b le "x" and no upper value
l i m i t and in v o lv e s th re e p a ram ete rs .* * In the case o f the
d i s t r i b u t i o n of gold v a lu e s , which can range from to a
t h e o r e t i c a l v a lu e o f i n f i n i t y , * * * a somewhat s im pler exp ression ,
in v o lv in g on ly two p a ra m e te rs , can be employed, v i z : -
y . Ke- a 2 ( log x - b )2
Where k - fLr _ ^ r v e )b 4 - L -
4a2
( 1 )
V TT • 6and where x * th e v a r i a b l e , e . g . geld v a lu e
a / . . .
♦R ef, k , p . l l 4 . **Ref. 1 4 R ef. 9 , P .236***The maximum p o s s ib le v a lu e i s n a t u r a l l y th a t fo r pure gold
which i s s t i l l n o t e q u iv a le n t to an i n f i n i t e number of dwtsz to n , bu t can fo r p r a c t i c a l purposes be regarded as such,
****Refs. 2 % 3#
19
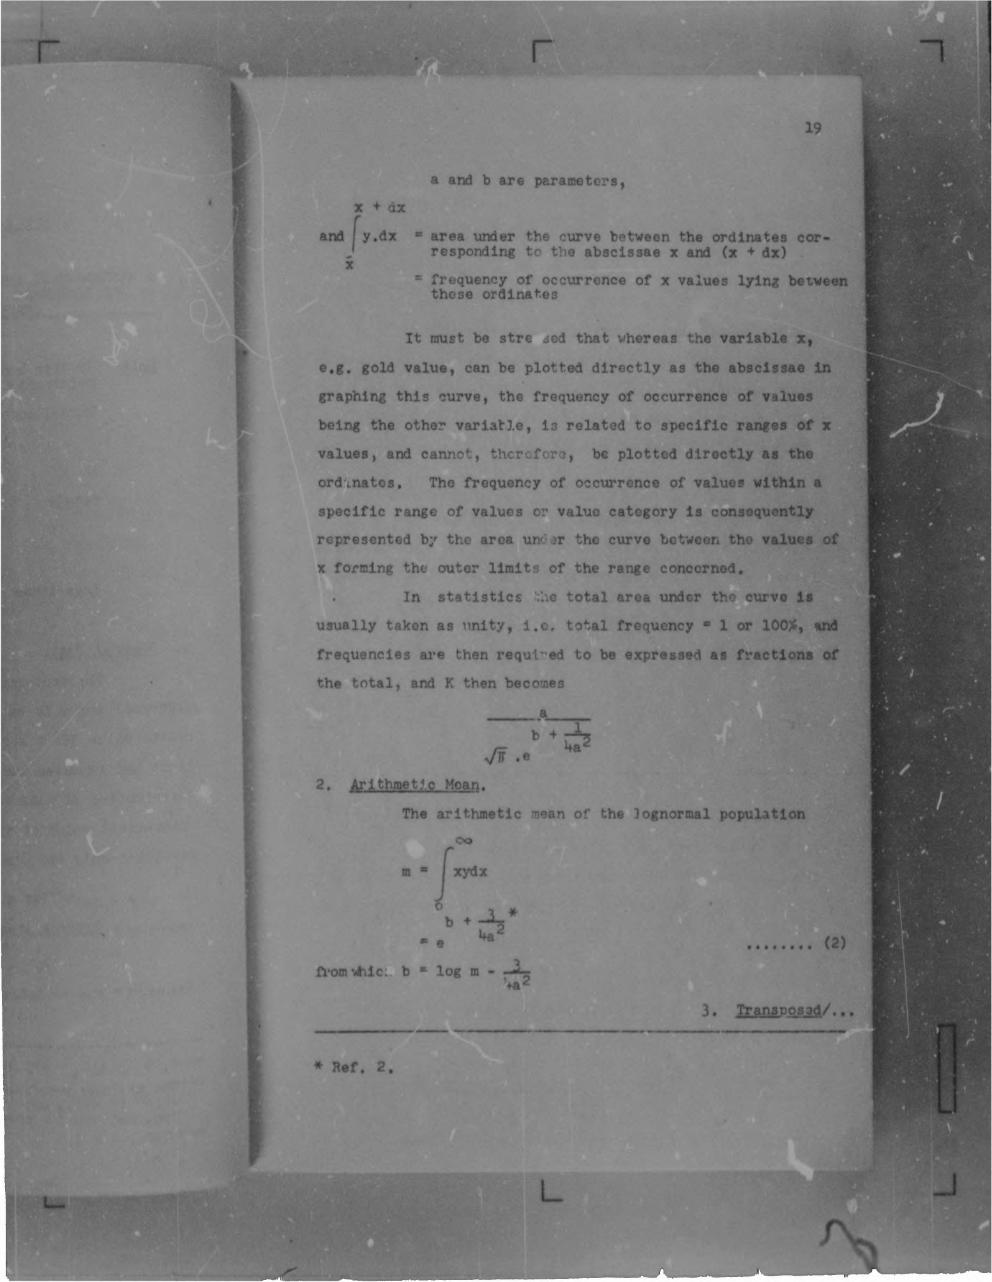
a and b a re param eters ,
x + dx
andf y -
dx * a re a under the curve between the o rd in a te s c o r responding to th e a b s c is s a e x and (x + dx)
= frequency of occurrence of x va lu es ly in g between th e se o rd in a te s
I t must be s t r e sod t h a t whereas the v a ria b le x ,
e . g . gold v a l u e , can be p lo t te d d i r e c t l y as the a b sc issa e in
graphing t h i s c u rv e , th e frequency of occurrence of va lu es
being the o th e r v a r i a b l e , i s r e l a t e d to s p e c i f i c ranges o f x
v a l u e s , and ca n n o t , t h e r e f o r e , be p lo t t e d d i r e c t l y as the
o r d in a te s . The frequency of occurrence of v a lu es w ith in a
s p e c i f i c range o f v a lu es or v a lu e ca te g o ry i s consequently
r e p re s e n te d by th e a rea under the curve between th e valu es of
x forming th e o u te r l i m i t s o f th e range concerned .
In s t a t i s t i c s She t o t a l a re a under th e curve i s
u s u a l ly tak en as u n i t y , i . e . t o t a l frequency * 1 or 100#, and
f re q u e n c ie s a re then re q u ire d t o be exp ressed as fr a c t io n s of
th e t o t a l , and K then becomes
a ___
b + AV i •« 4a‘
2 . A r i th m etic Moan.
The a r i th m e t ic mean o f the lognorm al population
oo
m xydx
° 3b + -* 3
4a2 (2)
fl’om >hic;. b * log m -Va2
3 . Transpo s e d / . . .
* R ef. 2 .
L
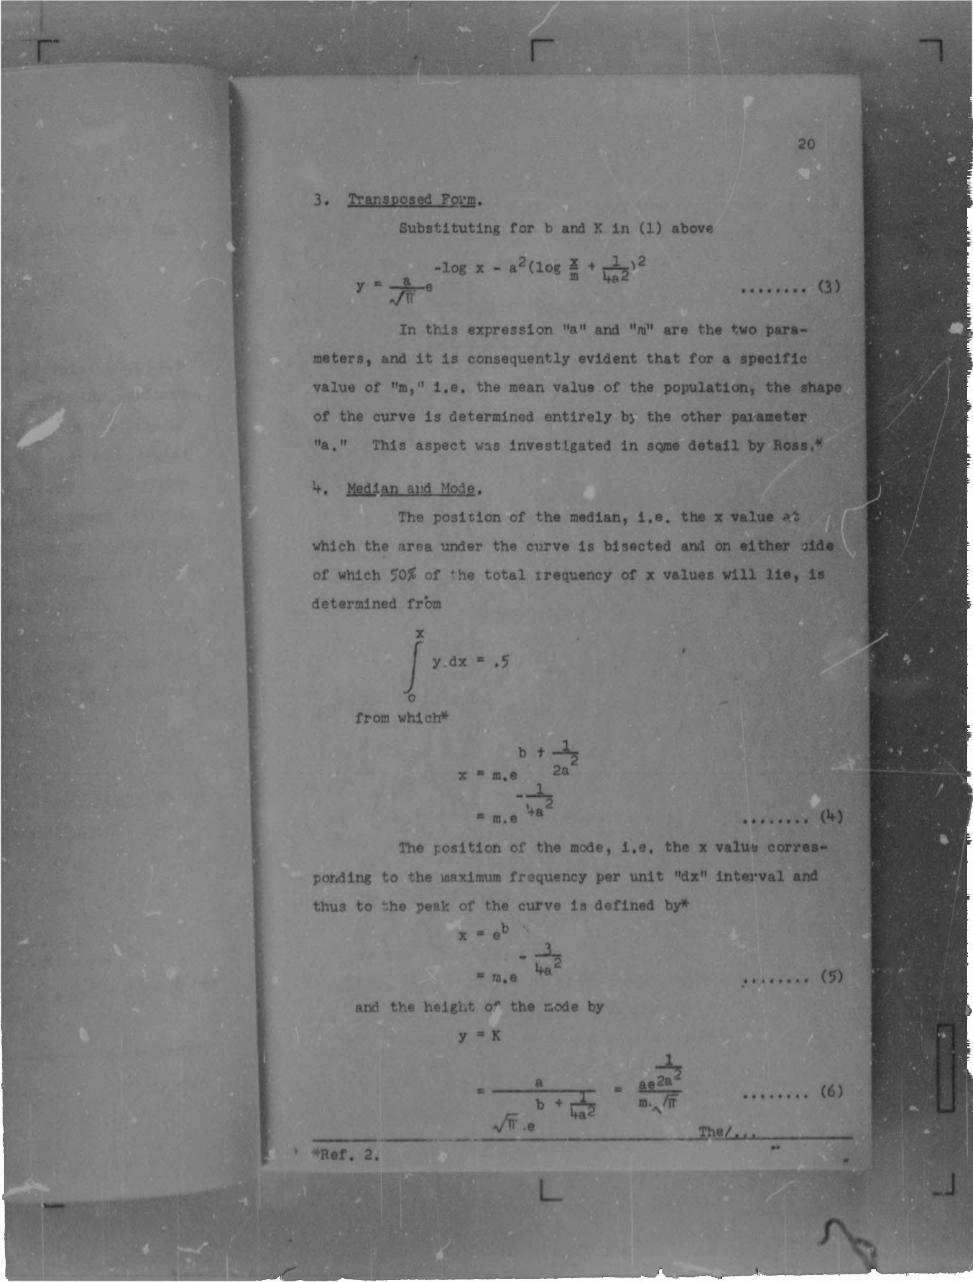
-3 . Transposed Form.
S u b s t i tu t in g fo r b and K i n (1) above
vlr- lo g x - » 2 ( lo g Z ♦ A ' 2
In t h i s e x p re ss io n "a" and "ra11 a re the two para
m e te rs , and i t i s co n seq u en tly e v id e n t t h a t fo r a s p e c if ic
v a lu e of "m," i . e . the mean va lue o f the population , the shape
o f the curve i s determ ined e n t i r e l y bj the other parameter
" a . " This a s p e c t was in v e s t ig a te d i n sqme d e t a i l by Ross,*
4 , Median and Mode.
The p o s i t io n of the median, i . e . the x value a t
which th e a r e a under the curve i s b isec ted and on e ith e r aide
of which 50/6 o f ihe t o t a l frequency of x va lu es w i l l l i e , i s
determ ined from
x
y .d x = .5
from which*
x B m.eb t —
2a
m.e
e e e e e e e (3 )
The p o s i t io n of th e mode, i . e . the x valu e co rr es
ponding to the maximum frequency per u n i t "dx" in te r v a l and
th u s to th e peak of the curve i s d e f in e d by*
x - eb '
m.e (5)
and th e h e ig h t or th e code by
y = k■ '
♦R ef. 2.
r
21
The r e l a t i v e g r a p h ic a l p o s i t io n s of the mode, median
and mean of th e lognormal d i s t r i b u t i o n a re in d ic a te d on
Diagram No. 1 , (see Chapter I I ) ,
5. Moments and Standard D e v ia t io n .
a 2nd moment vp of the d i s t r i b u t i o n about the
o r ig in i s d e f in ed as
v2 y ,x 2 .dx which from ( 1 ) above w ith the t o ta l a r e a under th e curve equal to u r / t y
x-o03r
x2e-b - - a 2 (log x - b ) 2
he ,dx
s u b s t i t u t i n g (w * a log * - ab - ^
(from which dx = 2dw ( a
and x w e H+ b +
t h i s red u ces to
jL( ,2 b + a<).
W=4 0 0
e -w2,dw (7 )
w=- 00—%
« e2b + a2 s in c e th e l a s t f a c t o r in (7) i s the in tegra l o f a form of the normal curve of error * u n i ty s in ce th e t o t a l a re a under the lo g
normal curve has a l s o been taken as u n ity
and from (2 ) above
Vp “ m2e2a~ ( 8 )
V a r ia n c e » The second moment about the a r i th m e t i c mean "my1
i . e . the v a r i a n c e , i s g iven by
yU 2 * second moment about the o r i g i n - (mean)^
- 1 ,* m2e 2*^ - m2
* m2 (e 2a£ - 1 )
* Ref. 4 , p . 65.
L
, « , » « . • • (9) T h e / . . .
. i
The s ta n d a rsL_4eyla.tiQB, I . e . V v a r ia n c e
e u 2 e m ^ t T l .............. ( 1 0 )
The c o e f f i c i e n t of v a r i a t i o n . I . e . th e s tan d a rJ d ev ia t io n divided
by th e a r i th m e t ic moan*
= V ®2a - 1 (10a)
The I rd moment, v^ , of th e d i s t r i b u t i o n about the o r ig in i s
d e f in e d asOOr
v ; * / y .x ^ .d x , which can in a manner sim ilar t o t h a t
J used fo r th e 2nd moment be reduced too
J Le m e2a . . . . . . . (11)
But the ?rd moment about the meanoo
y * 3 ' j y(x-m )^dx = - 3av2 * 2m^
(j
~ ^ 2 "S'* m^e2a - + 2nP
P, r : ,- m3(o2a - l ) 2 (e 2a + 2 ) .............. (12)
And th e 3rd moment about the mean in s tan d a rd u n U t«
i . e . i n u n i t s o f ( s ta n d a rd d e v i a t i o n ) 3 i n order to reduce the
r e s u l t to a pure number***
— i A«°C . (62a 2 . ■>} (13)
U .« ( e 2a + 2 ) ( v o c f f . of v a r i a t i o n ) (13a)
The/ . . .
♦ R e f . 4 , p . 9 0 . * * R e f . , p . 6 ? . * * * R e f . 4 , p . 72 .
The i+th moment.
By a s im i la r p rocedure i t can be shown t h a t
v4 -
- L 4 - i , ^yU 4 = mV(e2a - l ) 2 (ea + 2e 2a + 3e* - 3 )
andO C l » 3 (e 2^ - l ) ( e 2a2 + 3 o ^ + 6c 2*2 + 6 ) .......... (14)
2 3* oa2 + 2e2a + 3o*" - 3 (15)
6 . Skewnesg and K urtpals.
The skewness* o f th e curve i s measured b y O C y
(No. (13) a b o v e ) , and as —U" can never be n egative for r e a l2a*
v a lu es o f " a , " , w i l l always bo p o s it iv e .* * This means*
t h a t the mode or peak of th e curve w i l l always bo to the l e f t
of the mean va lue and th e curve w i l l always have i t s longer
t a i l on th e r ig h t-h a n d s id e of the mean v a lu e . I t i s a lso
e v id en t t h a t as "a" approaches i n f i n i t y , o< 3 approaches zero
and the curve th u s lo se s i t s skewness, th e mode then approach
ing co in c id en ce w ith th e moan
The k u r to s l s * ** of th e curve i s measured byoC 4 > and
i s r e l a t e d to whether th e curve if, f l a t - t o p p e d w ith f i l l e d out
sh o u ld e rs o r sh a rp ly peaked, the peak o f th e normal curve being
accep ted as th e c r i t e r i o n . T’-.e k u r t c s l s fo r th e normal curve
i s equal to 3 , fo r a f l a t - t o p p e d c u r / e i t i s l e s s than 3 , and
fo r a sh a rp ly peaked curve 1: exceeds 3 . From No. (15) above
i t i s e v id e n t thatO C 4 w i l l always exceed 3 and, t h e r e f o r e , the
lognorm al curve i s always more sh a rp ly peaked th a n the normal
curve and i s t h e r e fo r e s a id to be l e p t o k u r t l c . I t i s a l s oc l e a r / , . .
♦R ef. 4 , p p .73 & 111, * R e f. 8 , p .11.**In the lim it in g case when a * ° o ,°C 3 * 0 ,♦♦♦Ref. 4 , pp .73 & H I , * R ef. 8 , p .11.
c l e a r t h a t a s "a" approaches In f in i ty ,O C ^ approaches 3 , I . e .
th e k u r to s l s of th e normal cu rve .
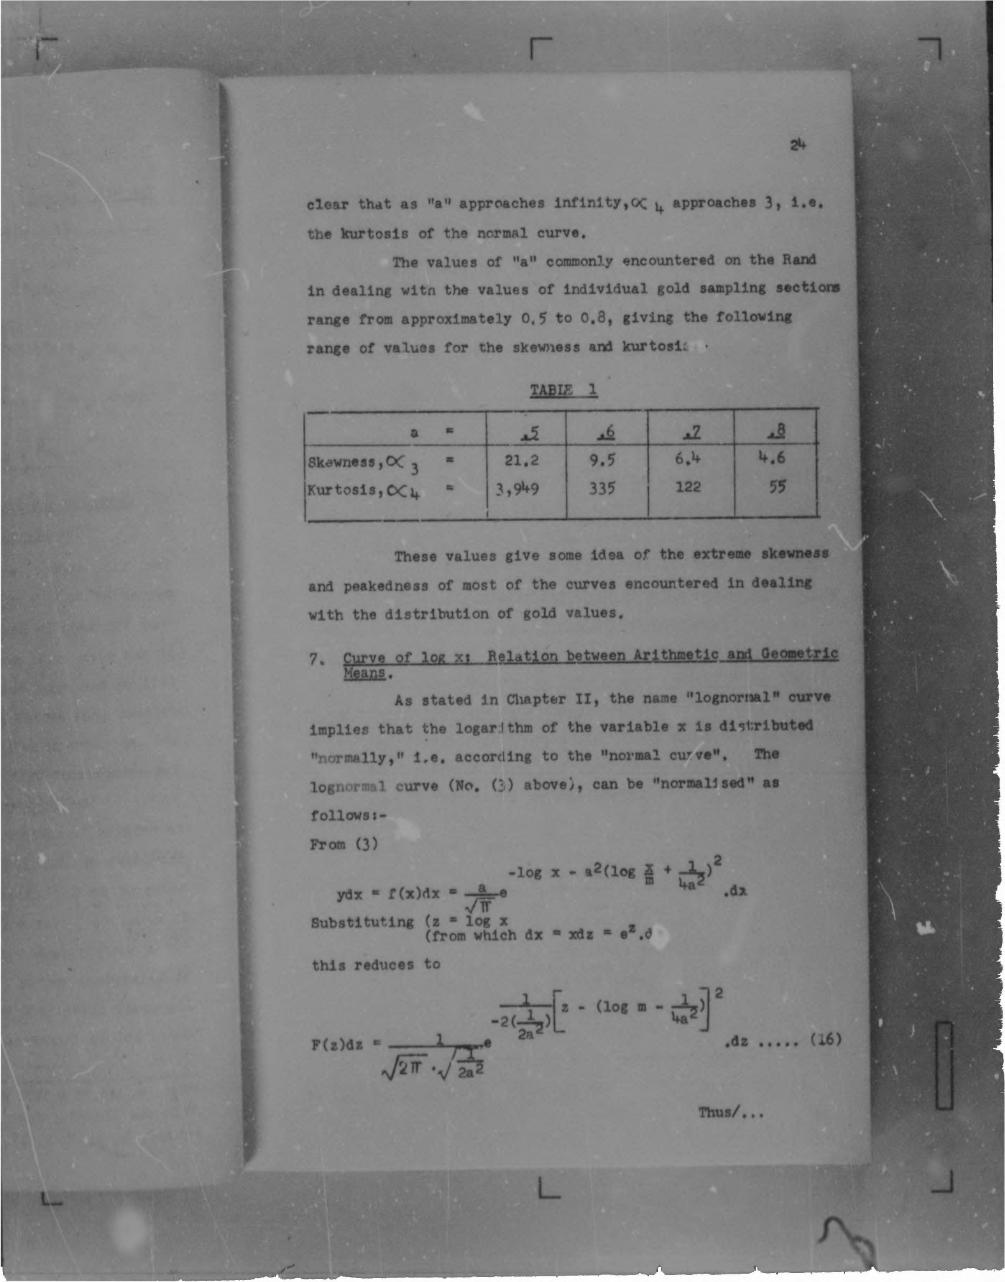
The va lu es of "a" commonly encountered on the Rand
i n d e a l in g v l t n the v a lu e s o f In d iv id u a l gold sampling section s
range from approx im ate ly 0 .5 to 0 . 8 , g iv in g the fo llow in g
range of v a lu e s fo r the skewness and k u rto sl:
TAB Iff 1
a e * 1 A A A
Skewness,C< ■ 2 1 .2 9 .5 6 .4 4 .6
K u r to s l s ,O C 4 *- 3 ,949 335 122 55
These v a lu es g ive some Idea o f th e extreme skewness
and peakedness of most of th e curves encountered In d ea lin g
w i th the d i s t r i b u t i o n of gold v a lu e s ,
7 . Curve o f log x i Re l a t i o n between A rjth m e t lc .and
As s ta t e d In Chapter I I , th e name "lognornal" curve
Im p lie s t h a t the lo g a r i th m of the v a r i a b l e x Is d is tr ib u te d
"n o rm a lly ," I . e . acco rd ing to the "normal c u rv e " . The
lognormal curve (No. (3) ab o v e) , can be "normalised" as
f o l lo w s t -
From (3)
- lo g x - a2 ( log 2 + - I * ) 'ydx e f (x )d x ‘vr* .dx
S u b stitu tin g (z ■ log x(from which dx ■ xdz * e .d
t h i s reduces to
F(z)dZ e . ----1 ***'*
z - ( lo g
e d Z e e e e e ( )
T h u s/,. e
Thus th*> v a r ia b le z , I . e . log x i s normally d istr ib u ted * with
mean *■ i m — (17)l o e i
standard d ev ia tio n
andl variance2a' (18)
But rrom No. (4) above the median of the lognormal curve
* me ‘A
and lienee the log of the median “ log m -
But, from Nc. (17) th is Is the mean o f the d is tr ib u
t io n o f the lo g s o f the v ariab le "x." Further, as the mean
of the lo g s o f a number o f va lu es equals the log of the
geom etric mean of such v a lu e s , i t i s ev id en t that the
Curve (No. (16)) Is symmetrical about % value equ^Vftl^ll t tB .AbS
log of the geom etric mean of the parent lofinpraftl
p o p u la tion. . . . . . . . (19)
and fu r th e r , th a t the medlar ^ Kqogqefolc met.n of the IfiXr
normal population are co ln c ld e jit . (20)
N ote; The normal d is tr ib u t io n (No. (1 6 )) above, can be reduced
to the common form, for which ta b le s are printed in
n early every book on s t a t i s t i c s ,
i . e .
by su b stitu tin g vt - ( log m - ^ 2 )
d ev ia tio n s o f "a" from i t s mean In standard u n i t s , i . e . u n its o f i t s standard d e v ia tio n .
R e la t io n / . .
R elation between a?lfrupetj,c t rj-.C-rroaa.
From Nos. (4) and (20) above
Geometric mean * me
■ (arithm etic (21)
or log of geom etric log of arithm etic _mean mean 4*2
( 21» )
8 . Th, g ls I r l^ y tio n .o X p lied by a co n sta n t.
Let q “ kx ( I . e . dx *
nf a Prodnot of "x". I . e . o f m l t l -
wherek e a constant
I . e . X - a
P u h stltu tlo n In No. (3 ) y ie ld s
- lo g (^ ) - a2 ( lof(q )dq
W ‘~
- lo g q - + A 1,dq #.**### ( 2 2 )
By comparison w ith No, ( 3 ) t the d i s t r lb v t ion of q
i s , th e r e fo r e , a lso lognormal w ith id e n t ic a l parameter "a" and
mean * mk. M u ltip lic a tio n of the v a r ia b le x by a constant
fACtor, th e r e fo r e , has no e f f e c t on the r e la t iv e shape of the
curve and m erely changes the mean o f the d is tr ib u t io n in the
same proportion as the change In the in d iv id u a l "x ^al'.e *
I t fo llo w s , th e r e fo r e , th a t the u n it in which the
lognormal v a r ia b le tr" i s expressed has no e f f e c t on the
parameter "a" of the d is tr ib u t io n .
, a L ^
The area under the curve, i . e . the frequency of "x"
values above an "x" value o f , say , w ilx he
x-r®* ^ - lo g :c - a 2 ( lo g J + - L - ) 2m 4*2
—r—r GV ?ydx .dx
X«Xi
S u b s t i tu t in g w * ^ y 2 (log# + ^ g )
and wi = a j l d o g ^ . +
“ v2
r '?** '""7e * ,dv (23)
of "x "
The average valuo of a l l 'be" va lu es above an "x" value
f *xydx
% 1 “ T8®
ydx
uhich w ith the same su b s titu tio n as above reduews to
**1
W 4 -
* m.
v i
(23a)
This can be solved by the use of standard ta b les o f _v2
the in te g r a l of (y ^ p e" ' ) which are av l ia b le in alm ost any
textbook on s t a t i s t i c s ,
10. sampling ( in ■the _ g ta tj ,a t^ ^ l ier>3^ frog a.Lgud&mlin s ..ua t lo n .
(a) pi^t.r^bptlon of arithm etic nogn? of gata_.2f_3&3Bl9
v a lu e s » Now consider the process o f drawing an in f: .n ite
number o f so ts o f N .-J^dom sample va lu es each from *. lognormal
population . The moans * such so ts of v a ltu s w i l l iny i e l d / . . .
y ie ld a new frequency d is tr ib u t io n w ith an o v era ll mean equal
to that o f the parent popu lation . In the case of an arbitrary
population th is d is tr ib u t io n of mean.i w i l l have the same
general form as th at o f the parent population^ but i t s variance
w i l l be l e s s , i t s skewness much le s s and i t s k u rto sis very
much le s s than that o f the parent p op u lation ,* Further, as
the number of samples per s e t , N, i s in crea sed , the skewness
and k u r to s is w i l l approacn the corresponding values for the
normal cu rve. The p o s it io n in the case o f the lognormal
parent population can now b ' examined from the knowledge of the
formulae** a p p licab le to arb itrary p o p u la tio n s:-
Variance -
which from No. (9)- I ,
( A )
where "m" and "a" are the parameters o f the parent popu
la t io n and N = number o f samples per s e t .
The Ird moment (ebout the mean in Standard u n its )
" -)rr! mpment of Parent P0PUla_U3B
I fwhich from No. (13)
A * r ?. * 2 )
/ N"The 4th r.'C (about the mean in Standard u n its )
« 3 4 ^ (4tb moment o f parent population - 3)
which from No. (14)
# # * * » (25)
* 3 4 - l ) ( e 2 a " + 3e*^ + 6e2a2 + 6)
JL JL i- « 3 4 ^ (ea " + 2e 2a 4 3ea< - 6 )
(26)
(27)
4ii a n a ly s is o f formulae Nos. (2 4 )to (27) In d ica tes
th at the d is tr ib u t io n of the means o f s e ts o f sample valuesfr o m /., .
* R ef, 8 , p. 108. ** R ef. 6 , pp. 102/S
from a lognormal parent population i? not i t s e l f tru ly lo g
normal, but more skew and peaked for the same varian ce , Tests
carried out w ith observed1 lognormal populations have, however,
in d icated th a t for p r a c t ic a l purposes, the d is tr ib u tio n of the
means o f s e t s o f sample va lu es se le c ted a t random can be
regarded as lognormal and th a t No. (24) above can be emplo. id
to arrive a t i t s th e o r e t ic a l varian ce,
w i l l sp e c ify the r e la t iv e shape of the lognormal frequency
ctarve which c lo s e ly approximates the d is tr ib u tio n of means of
s e ts of N random samples drawn from the parent lognormal
population w ith parameter " a .”
(b) D is tr ib u tio n of geom etric peaps of gqts pf MfflPJlg
values and o_f n J^lgrproved^estomata of tfre arlthm ft^c me^Qi
From No. (16) i t was seen th at the d is tr ib u t io n of the logarithm
o f the lognormal v a r ia b le "x" i s "normal" and defined by
where z * log xNow the frequency d is tr ib u t io n o f the means (z*) of
s e ts of N z va lu es each, drawn from t h is normal population of
the lo g s o f x w i l l a lso be normal,* w ith variance * ^ 5 , and
the same o v e r a ll mean z v a lu e , and w i l l thus be d efined by
i . e . m(e
The parameter "ax i " can, th e r e fo r e , be ca lcu la ted and
F (I 1 )dz1 -
( lo g m - — g)
w h e re /,. .
,d z i . . ( 2 9 )
where z* * mean of the lo g s o f N x va lu es In the l tt s e t o f
sample values
* logarithm of the gevm etric mean of x,nese N "x”
values
= log , where g.r e geom etric mean of 1*“ s e t of
sample values
arri No. (29) then, by su b s t itu t io n , reduces to
-Na2 |lo g - ( lo g m - , L .da,d&
(30)
R eference to Nos. (3 ) and (9) w i l l in d ic a te , th ere
fo r e , th at the geom etric moans o f s e ts o l N (lognorm ally
d is tr ib u te d ) sample va lu es each, are a lso logn-'.m ally d i s t r i
buted w ith variance -= - 1 )
and mean log m =—4a
But in Nos. (21) and (21a) i t was shown th a t the
geom etric and arithm etic means of a lognormal population are
d ir e c t ly re la ted through the parameter "a" of the p op u lation .
Thus i f the "a" o f the parent population i s known, i t i s
p o ss ib le to a rr iv e a t an estim ate of the truo population mean
"m" from the ca lcu la ted geom etric mean "gi" of a so t o f sample
va lu es from the formula _1. “ 4^5
geom etric moan ■ (ar ith m etic mcan).e
Therefore taking
“A (3D
where h * in estim ate of the true arithm etic moan
of the population derived from the 1 ^
so t o f sample v a lu e s ,
Then/.
Then from (30)
2r ftijM h i Kj Y ~ e
m e mean o f th is d is tr ib u tio n c f h<
r
31
-Na^(log h i - log m) - log \.dh^ . . . 0 2 )
f ( h i ) .h i .d h i
m l-Na2 (log h i - log m) 2
S u b stitu tin g w * a y N (lo g h i - log • ) -
the mean of the d is tr ib u tio n
oo
. me4Na (33)
The mean of the d is tr ib u t io n o f w i l l , th e re fo r e ,
always exceed the true mean "m" o f the parent population ard
eonssquently "hi," as an estim ate of "m" w i l l be b ia sse d , the 1
bias fa c to r e4Na‘ only d isappearing when N approaches in f in i t y .
The b ias i s vory evident In the case o f H 1 when the obserw l
geom etric mean must be the same as the observed arith m etic
mean, i . e . "gt " must equal "hi," whereat "hi" then becomes
equal to
. > 5
This suggests th a t "hjL" must be corrected by a
factor dependent on N and eq u iva len t to e Ua ' when N - 1 and
to /e e e
to 1 when N e0<3. S im ilar co rrectio n s are required in most
s t a t i s t i c a l estim ates based on a lim ited number of sample
v a lu es , e ,g . B e s je l 's co rrec tio n .*
D iv is io n by the b ias fa cto r in No. (3 3 )t i . e . e
provides t h is correctin g term and the corrected estim atu of
the population mean now becomes
■B i.e
from which i t i s ev ident that when
N - 1 , m* * g i
( * )
and when N— , ® i-► g i .e
As a check on the unbiassed nature of the s t a t i s t i c
"mi" as an estim ate of "m," su b s titu tio n In No. (30) y ie ld s
F(ffi1 )dmi- lo g mi - Na^dog ffli - log m + —
From No. (3) I t w i l l be seen th a t the d is tr ib u t io n
of "m " i s lognormal w ith mean - "m,M i . e . the true mean of ttie
parent p op u lation , and the other parameter ■ (corresponding
to "a" of the parent p op u la tion ). The s t a t i s t i c l a ,
th e r e fo r e , an unbiassed estim ate o f the population mean and
from No. (9 ) the variance o f the d is tr ib u t io n of w i l l be1
- m 2 ( e ^ - 1 ) (36)
E ff ic ie n c y of "flL*"
When the variance of a normal population i s known,
the maximum lik e lih o o d estim ate of the population mean i s the
mean o f the s e t of sample values drawn from the population**
a n d /. . .
*R ef, 6 , p. 125. **R ef. 8 , p .273.
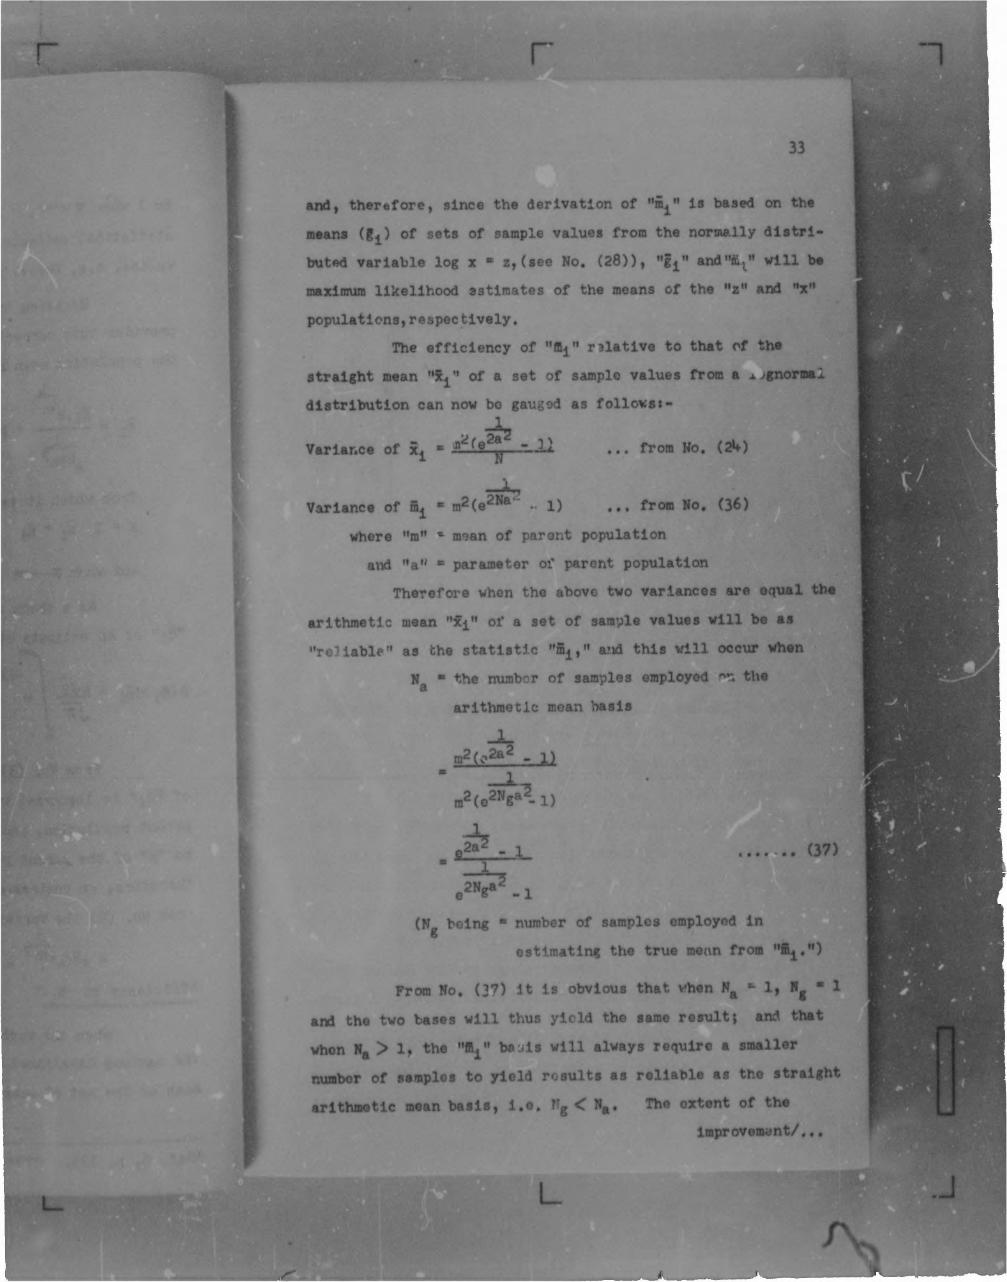
and, th e r e fo r e , s in ce the d er iv a tio n o f i s based on the
means (g^) o f se ts of sample values from the normally d i s t r i
buted v a r ia b le log x * z , ( s e e No. (2 8 ) ) , "g^" a n d w i l l be
maximum lik e lih o o d estim ates o f the means of the "z" and "x"
p o p u la tio n s ,r e sp e c tiv e ly .
The e f f ic ie n c y of r a la t iv e to th at of the
s tr a ig h t mean "x^" of a se t o f sample va lu es from a x ^gnormal
d is tr ib u t io n can now bo gauged as fo l lo w s i-
Variance of e — =-2^. . . . from No, (24)
Variance of m * m2 (e 2Na' - 1) . . . from No. (36)
where "mM *■ mean o f parent population
and "a" = parameter of parent population
Therefore when the above two variances are equal the
arithm etic mean "*i" of a se t o f sample va lu es w i l l be as
'•r e lia b le " as the s t a t i s t i c •’i i ," and t h is w i l l occur when
Na ■ the number o f samples employed nn the
a rith m etic mean b asis
- Xm2 (o2a - 13
m2 (e2Nga - 1 )
- Xe2a - 1 (37)
«2 N S" - 1
(Ng being = number of samples employed in
estim atin g the true mean from "m^.")
From No. (37) i t i s obvious th at when N0 *- 1 , Ng * 1
and the two bases w i l l thus y ie ld the same r e s u lt ; and that
when Na > 1 , the b a s is w i l l always require a sm aller
number of samples to y ie ld r e s u lt s as r e l ia b le as the s tr a ig h t
arithm etic mean b a s i s , i . e . Ng ^ Na , The ex ten t o f the4 mrtv* n t* /
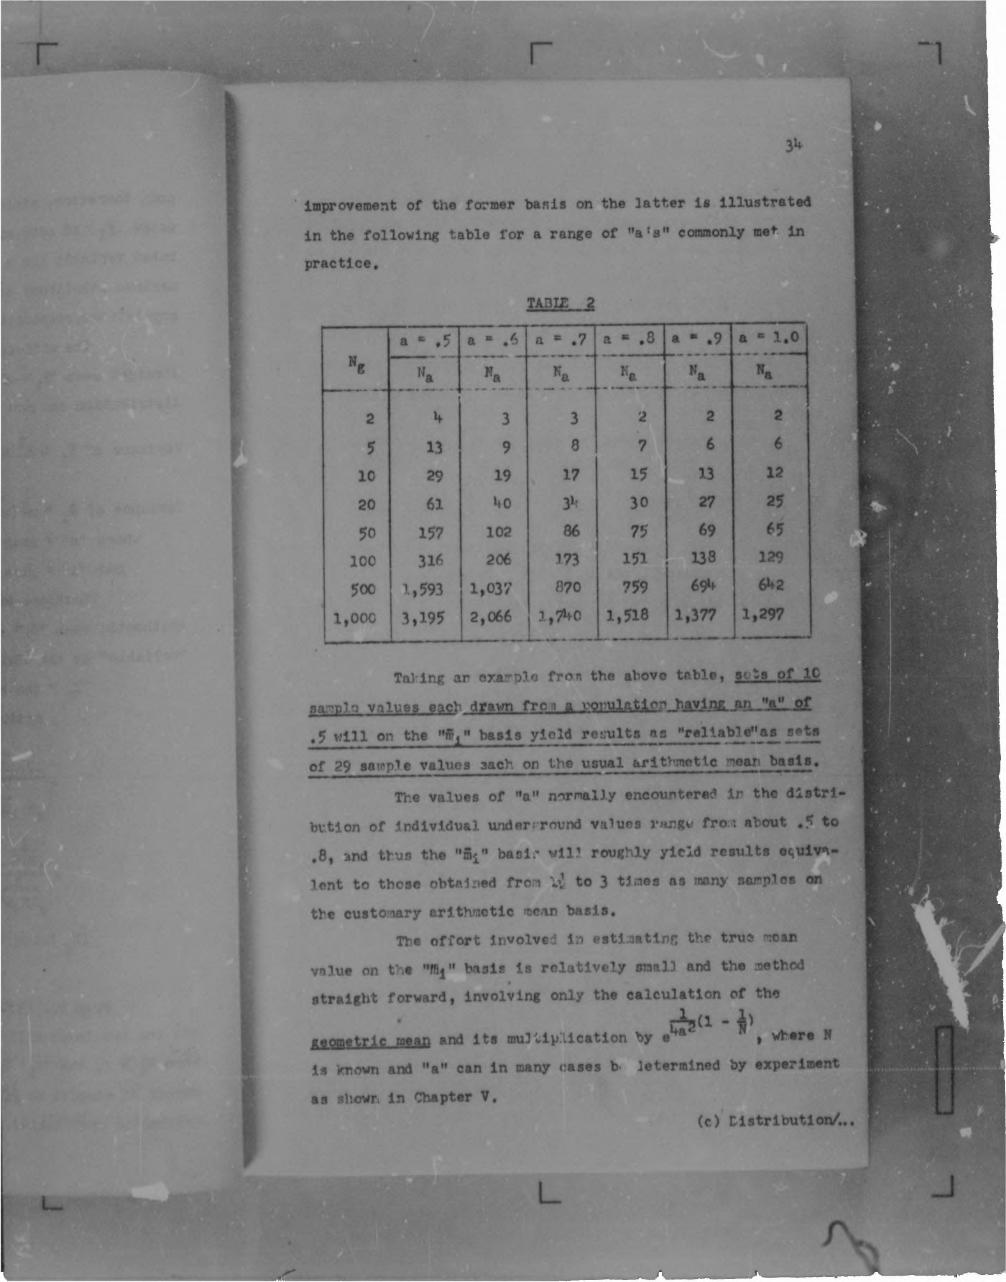
improvement of the former b a sis on the la t t e r i s i l lu s tr a te d
in the fo llow in g tab le for a range o f "a‘a" commonly met in
p r a c tic e .
TABIE 2
1,2972,0663,1951 ,000
Tal ing ar exarplo fron the above ta b le , si ta o f 10
sarnla v a lu es each dyavm frcii a v o ru la tlo r hAylQg.,an_, _ g £
,5 v l l l on the "m," b a s is y i e l d resu l t s as " re lla ble"as s« ts
of 29 sample va lu es aach on the usual arith m etic mean b a s is .
The values o f "a11 normally encountered ir the d i s t r i
bution o f in d iv id u a l under; round va lu es range fro t about .5 to
. 8 , and thus the "m1N b e e lf w il l roughly y ie ld r e s u lt s equiva
le n t to th ose obtained from \ i to 3 tim es as many samples on
the custo.iary arith m etic mean b a s is .
The e f fo r t involved in estim atin g the true mean
value on the " b asis i s r e la t iv e ly small and the method
s tr a ig h t forward, in vo lv in g only the c a lc u la t io n of the
* l V 1 " ^Kfpme tr lc mean and i t s m u lt ip lic a tio n by e , where N
i s known and "a" can in many cases b leterm ined by experiment
as shown in Chapter V.(r'i hi stributionZ
r
, -
'
r35
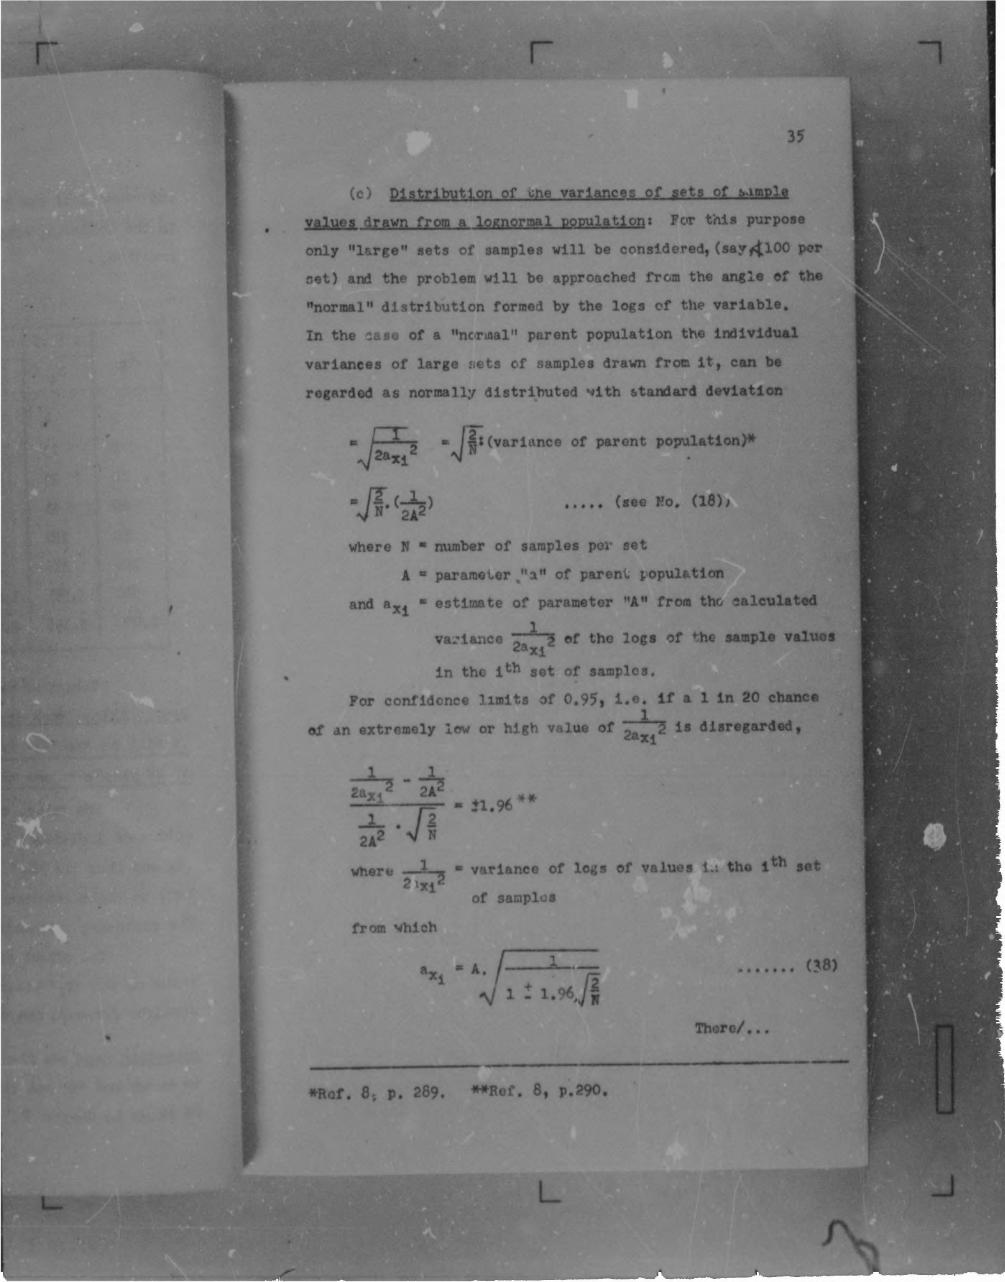
(c ) D i s t r i b u t i o n of one v a r ia n c e ; of, ^.et? of
valu es drawn from a lognormal p o p u la t io n : For t h i s purpose
only " l a rg e " s e t s of samples w i l l be cons ide red , (sa y ^ 1 0 0 per
s e t ) and th e problem w i l l be approached from the ang le of the
"normal" d i s t r i b u t i o n formed by the logs o f the v a r ia b le .
In th e ease of a "normal" p a ren t p o p u la t io n th e in d iv id u a l
v a r ia n c e s o f la rg e n e ts o f samples drawn from i t , can be
regarded as norm ally d i s t r i b u t e d w ith s tan d a rd d ev ia tio n
■ J S ? - j f (v a r ia n c e of p a re n t population)*
(see Ho. (18)
where N * number o f samples per s e t
A “ param eter ," a " of p a re n t p o p u la t io n
and a , 4 * e s t im a te o f param eter "A" from tho ca lcu la ted
v a r ia n c e “ “^"‘5 of tho lo g s o f the sample valuesax i
i n th e 1 th s e t of samples.
For con fidence l i m i t s of 0 .9 5 , i . e . i f a 1 in 20 chance
o f an ex trem ely low or h ig h value o f *'a" t i s d isregarded ,
2a+1.96 * *
JL .
where L _ ■ v a r ia n c e of logs of v a lu e s in tho 1 th se t2 i x i 2
of samples
from which
a X i * A
V 1 -
*Rof. 8, p . 289. **Rof. 8 , p . 290.
L
(38)
T h e r e / . . .
1
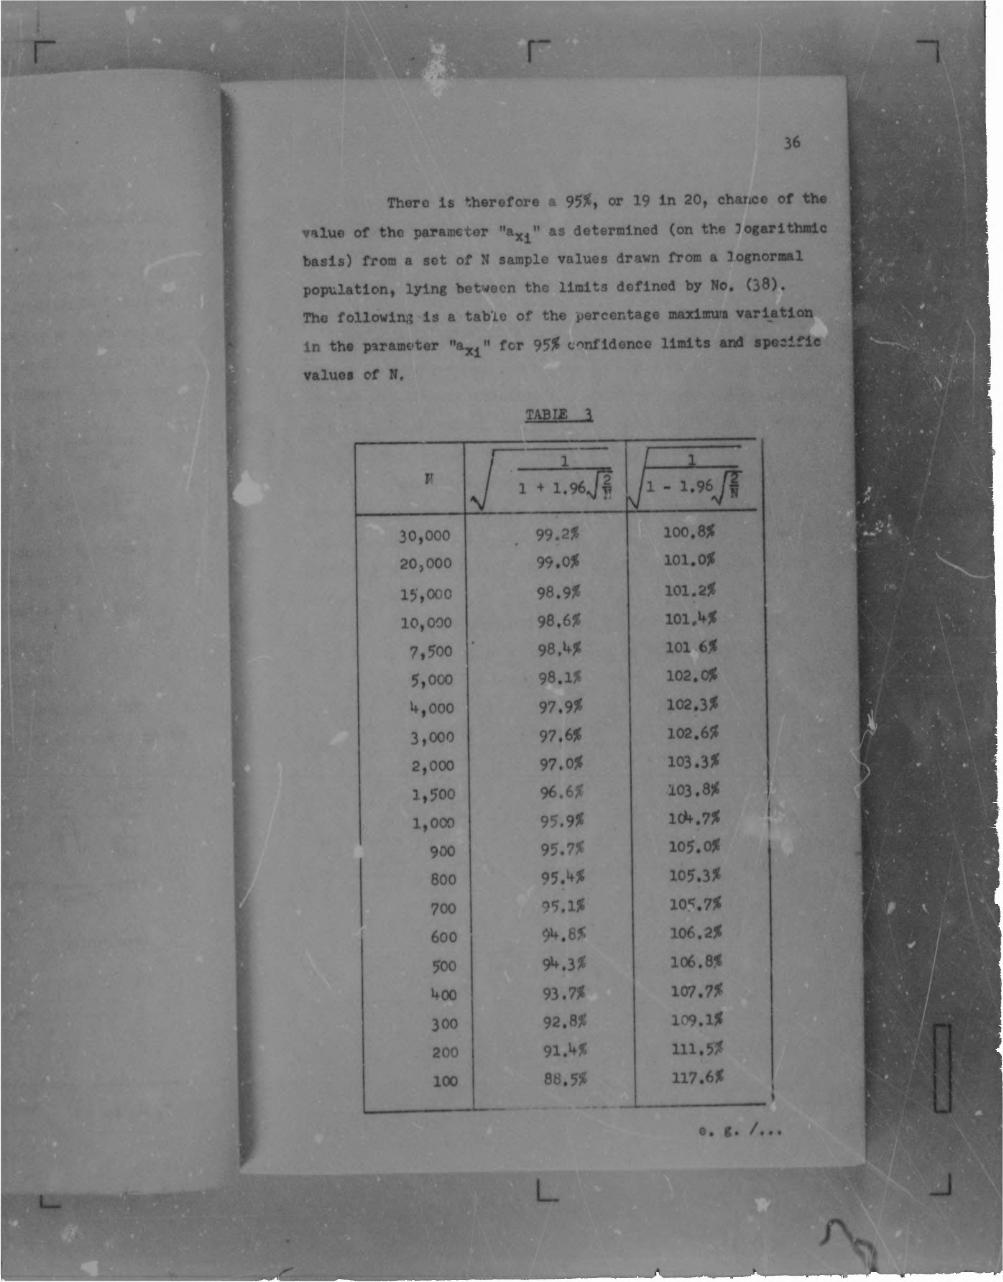
r bk
r
36
There i s th e r e fo re a 95%y or 19 in 20, chance of the
v a lu e of th e param eter "ax i " as determ ined (on th e lo g a r ith m ic
b a s is ) from a s e t of N sample va lues drawn from a lognormal
p o p u la t io n , ly in g between the l im i t s d e f in ed by No, (38)•
The fo llow ing i s a t a b l e o f the percen tage maximum v a r i a t i o n
in the param eter "ax ^ 11 f o r 95% confidence l im i t s and s p e c i f i c
va lu es of N,
TAB I f 2
L
p1 1 / 1 .
J 1 * 1 .96J l ,J l - 1 . 9 6 J J
3 0 ,0 0 0 99.2* 100 . 8*
2 0 ,0 0 0 99.0* 101 . 0*
15 ,000 98.9* 101 . 2*
10 ,000 9 8 . 6* 101,4*
7,500 98 .4* 101 6 *
5 ,000 98.1* 102 . 0*
4 ,0 0 0 97 .9* 102.3*
3 ,0 0 0 97.6* 102 . 6*
2 ,0 0 0 97.0* 103.3*
1 ,5 0 0 9 6 . 6 * 103.8*
1 ,000 95.9* 164.7*
900 95.7* 105 . 0*
600 9 5 > * 105.3*
700 95 .1* 105.7*
600 94 .6* 106 . 2*
500 94.3* 1 06 . 8*
400 93.7* 107.7*
300 9 2 . 8* 109.1*
200 91.4* 111.5*
100 88.5* 117.6*
G # 6• / • • •
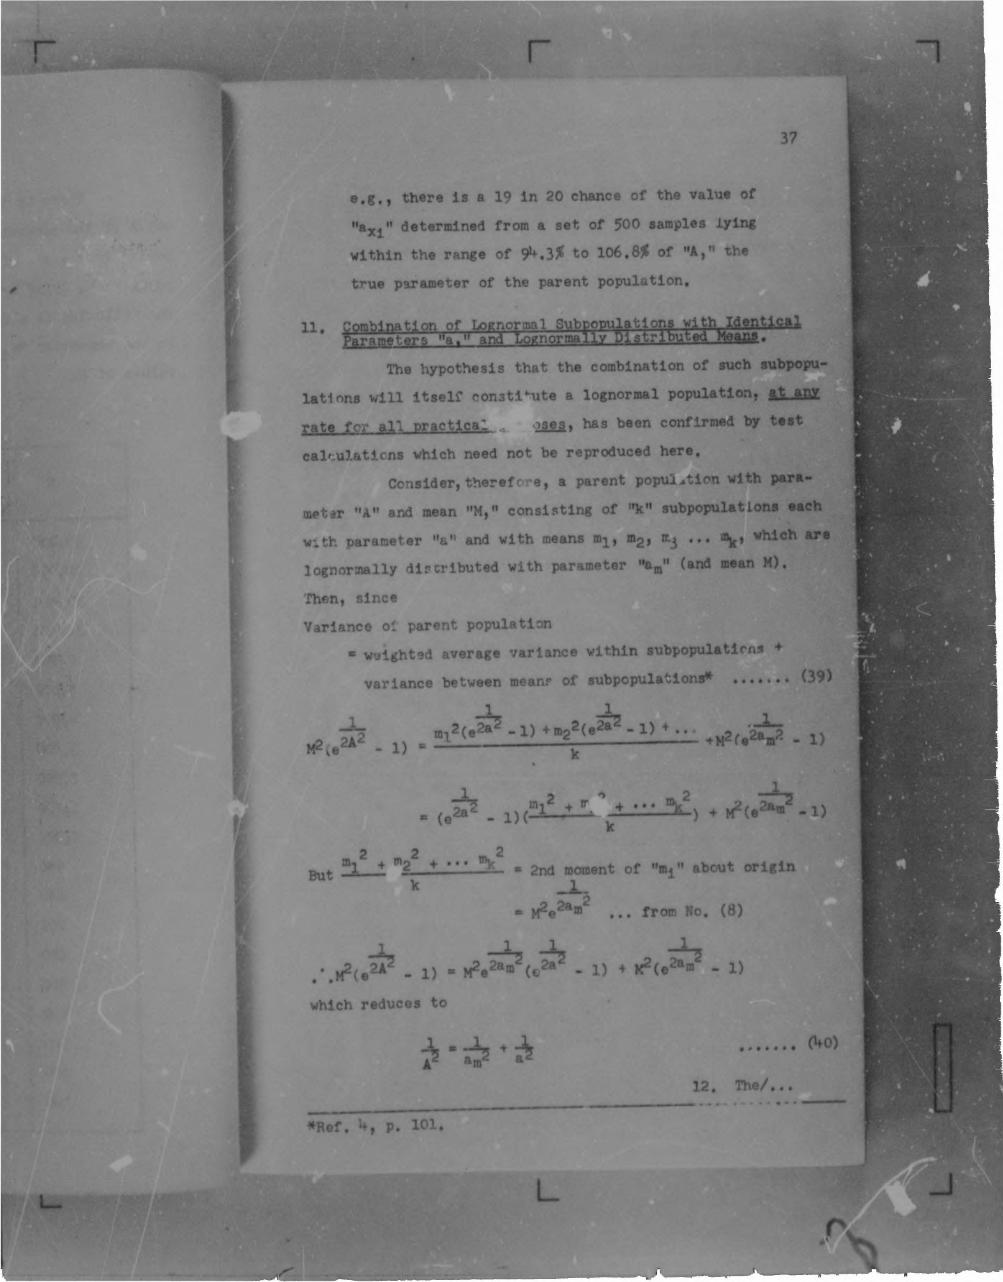
e . g . , th e re i s a 19 in 20 chance of the value of
••aXj " determ ined from a s e t of 500 samples ly ing
w i th in th e range of 9*+.3^ to 106 .&% of "A, the
t r u e param eter of th e p a re n t p o p u la t io n .
The h y p o th es is t h a t the com bination of such subpopu-
l a t l o n s w i l l i t s e l f c o n s t i t u t e a lognormal population , %t any
r a t e fo r a l l p r a c t i c a l 2SSS, has been confirmed by t e s t
c a l c u l a t i o n s which need no t be reproduced here.
C o n s id e r , t h e r e f o r e , a p a ren t p o p u la t io n with para
meter "A" and mean "M," c o n s is t in g of "k" subpopulations each
w ith param eter "a" and w ith means m^, mg, ny . . . wh ich are
lognorm ally d i s t r i b u t e d w ith param eter "am" (and mean M).
Then, s in ce
V ariance of p a re n t p o p u la t io n
= w eighted average v a r ia n c e w i th in su b p o p u la ticn s +
v a r ia n c e between means of subpopulations* .............. (39)
- 1-- 1 ) *
♦ H2 (e2am;5 - 1 )k
^ - ) + ^ ( e - 1 )
But2 2 2
^1 ~l‘ ’*'***---------* 2nd moment o f "mi" about o r ig in
* M2*24® . . . from No. (8)
1 1 _1 —i - ,/ M2 ( e 2 A " „ d . M 2e 2 a m ( , 2 . „ %) + ^ ( e ^ m - 1 )
_ L .
which red u ces to
(40)
12 9 TlnoZ 0 9 9
*Ref. p. 101#
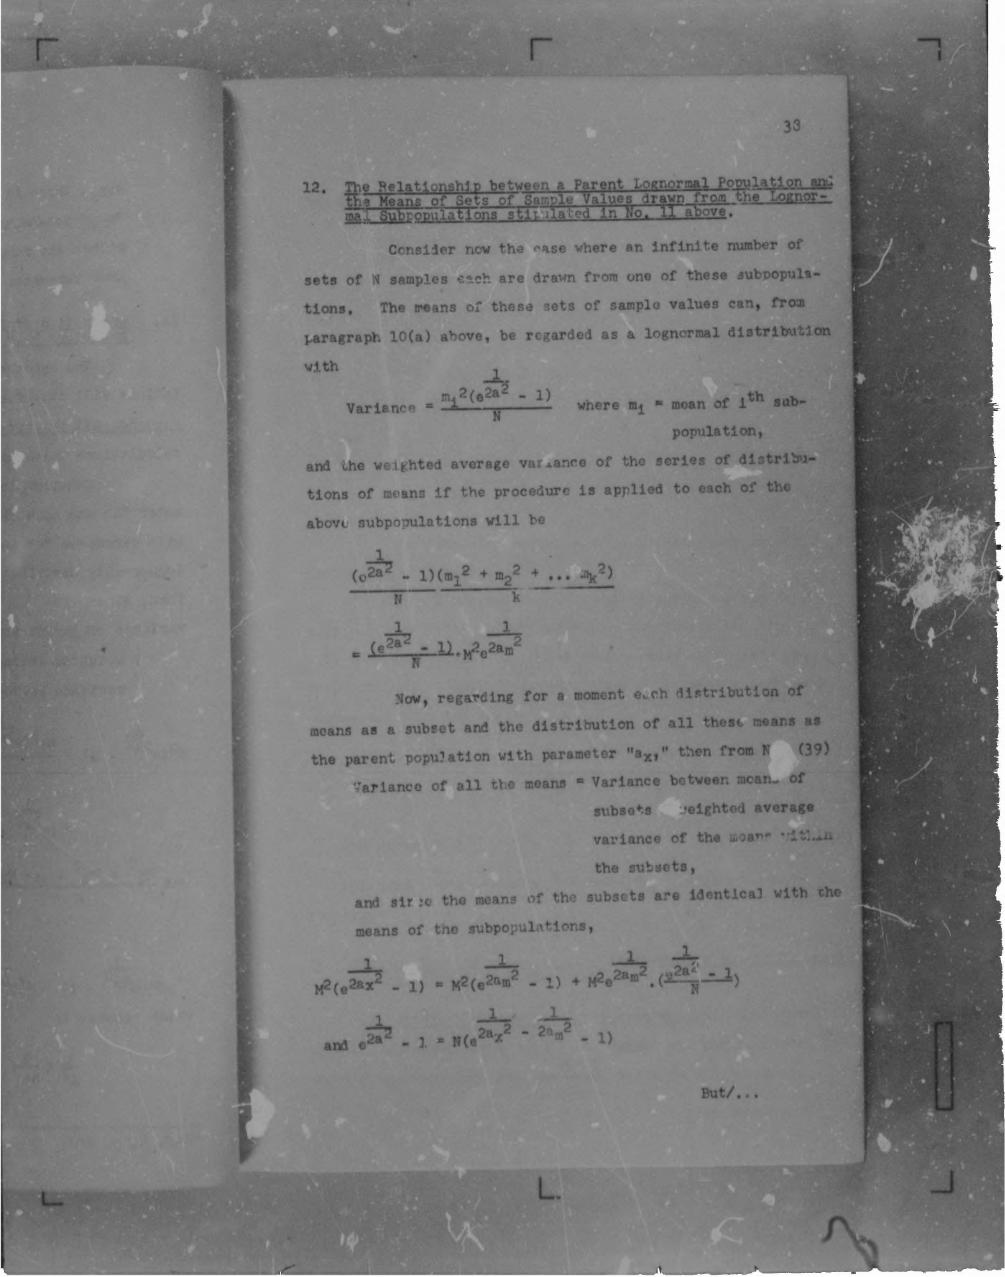
r
12. Tl-.e_Pelatj,9nsh3.f t - - . - . '
33
Popula t io n ank avn from The Lognor-
ConsldPr now the fa se where an in f in i t e number of
s e ts o f N samples each are drawn from one o f these subpopula
t io n s . The means of th ese se ts o f sample values can, from
paragraph 1 0 (a) above, be regarded as a lognormal d is tr ib u tio n
with .
h M m t-5
TTpopulation ,
and the weighted average variance o f the s e r ie s of d i s t r i b u
t io n s of means i f the procedure i s applied to each o f the
above subpopulations w i l l be
Variance - ni a (9 ^ ' 11 where mj - moan of 1th aub-
&(e ia^ _ l)(m 12 + m22 + . . . 4 ( ' )N
Now, regarding for a moment e^ch d is tr ib u t io n of
means as a subset and the d is tr ib u tio n o f a l l these means as
the parent population w ith parameter "a%," then from K (39)
V ariance of a l l the means * Variance between mean., of
subsets weighted average
variance of the luoa *" '
the s u b s e ts ,
and s ir so the means o f the sub sets are id en tic a l w ith the
means of the subpopulations,
1 _ i _ l - J LM2 (e 2ax2 „ i ) - 1 ) ♦
and e*- - 1N(e2az 2 - 2ar -; _ n
B u t/. . .
L.
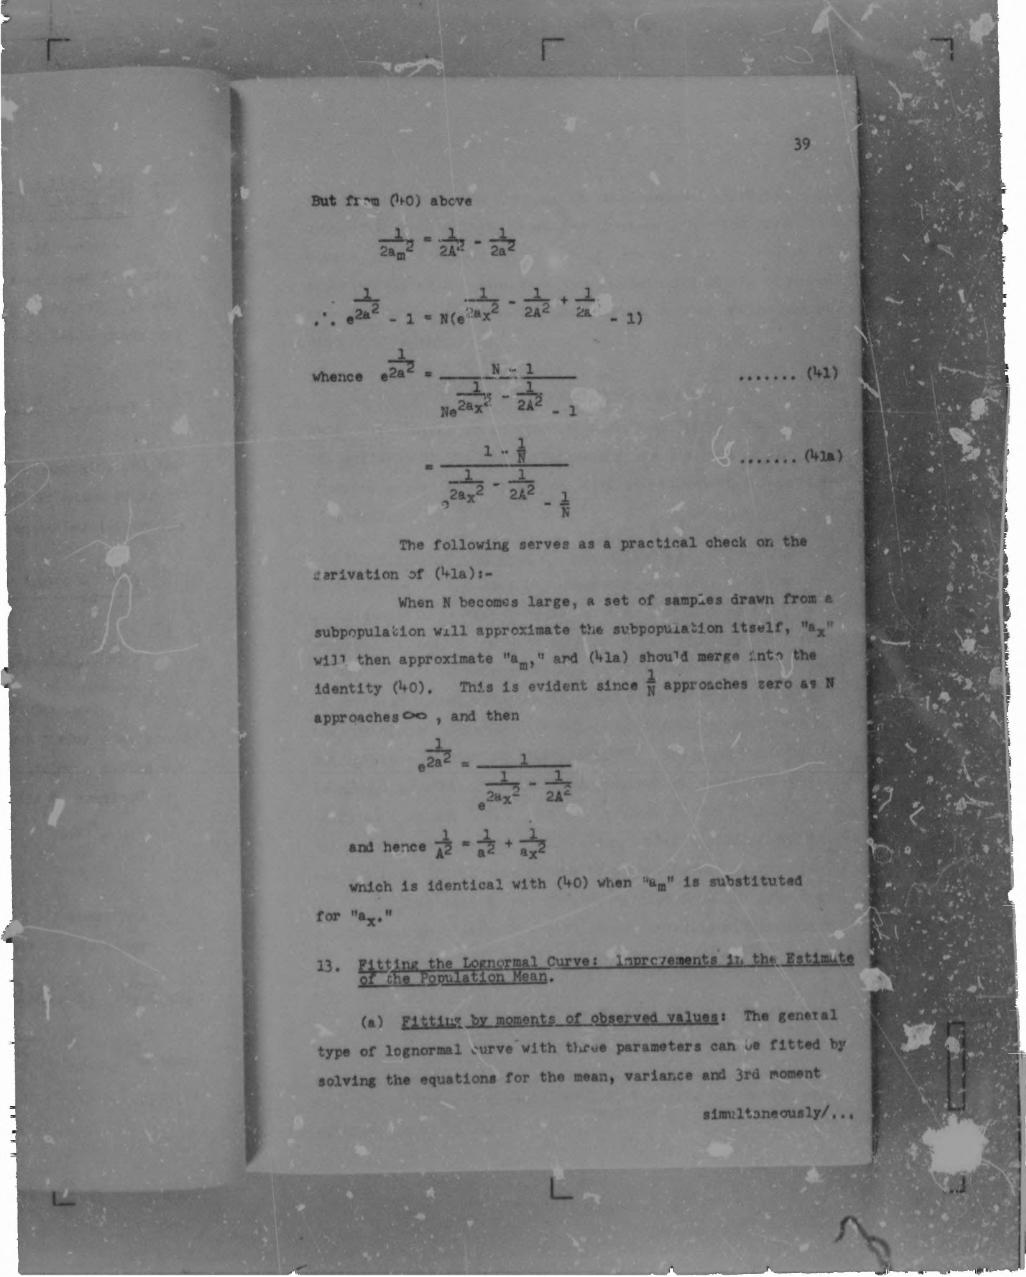
But fr'm Of-0) abcve
— i-w ; * - ^ 7 - ■■Ob 2 O A«- Ob
e2a - 1 - N(e''*x
whence e2a^ * — -~
Ne2ax" " 2X2 _ i
r
39
. - - I - . _ 1_ + _J-2e*2 2A2 2a - 1)
(41)
i (4 ia )<[•15 • # e • e * e V ’ /
The fo llow in g serves as a p r a c t ic a l check on the
sa r iv a tio n of (4 la )» -
When N becomes la r g e , a s e t o f samples drawn from a
subpopulation w i l l approximate the svbpopuiation i t s e l f , "&%"
v i ] i then approximate "a ," and (4la ) shou1d merge in to the1
id e n t ity (4 0 ) . This i s ev id en t s in ce ^ approaches zero as N
approaches0 0 , and then
and hence ^ ^ * 7^3
wnich i s id e n t ic a l w ith (40) when u*m” i s su b stitu ted
g ni>£maI_Cuy,ve: Inprc/e.agr^ts j n ^ - .
(a) P i t u i * bv moments o f observed v a lu e s * The general
type o f lognormal curve w ith tlu-ue parameters can ve f i t t e d by
so lv in g the equations for the mean, variance and 3rd moment
s im u lta n e o u s ly /,. ,
L
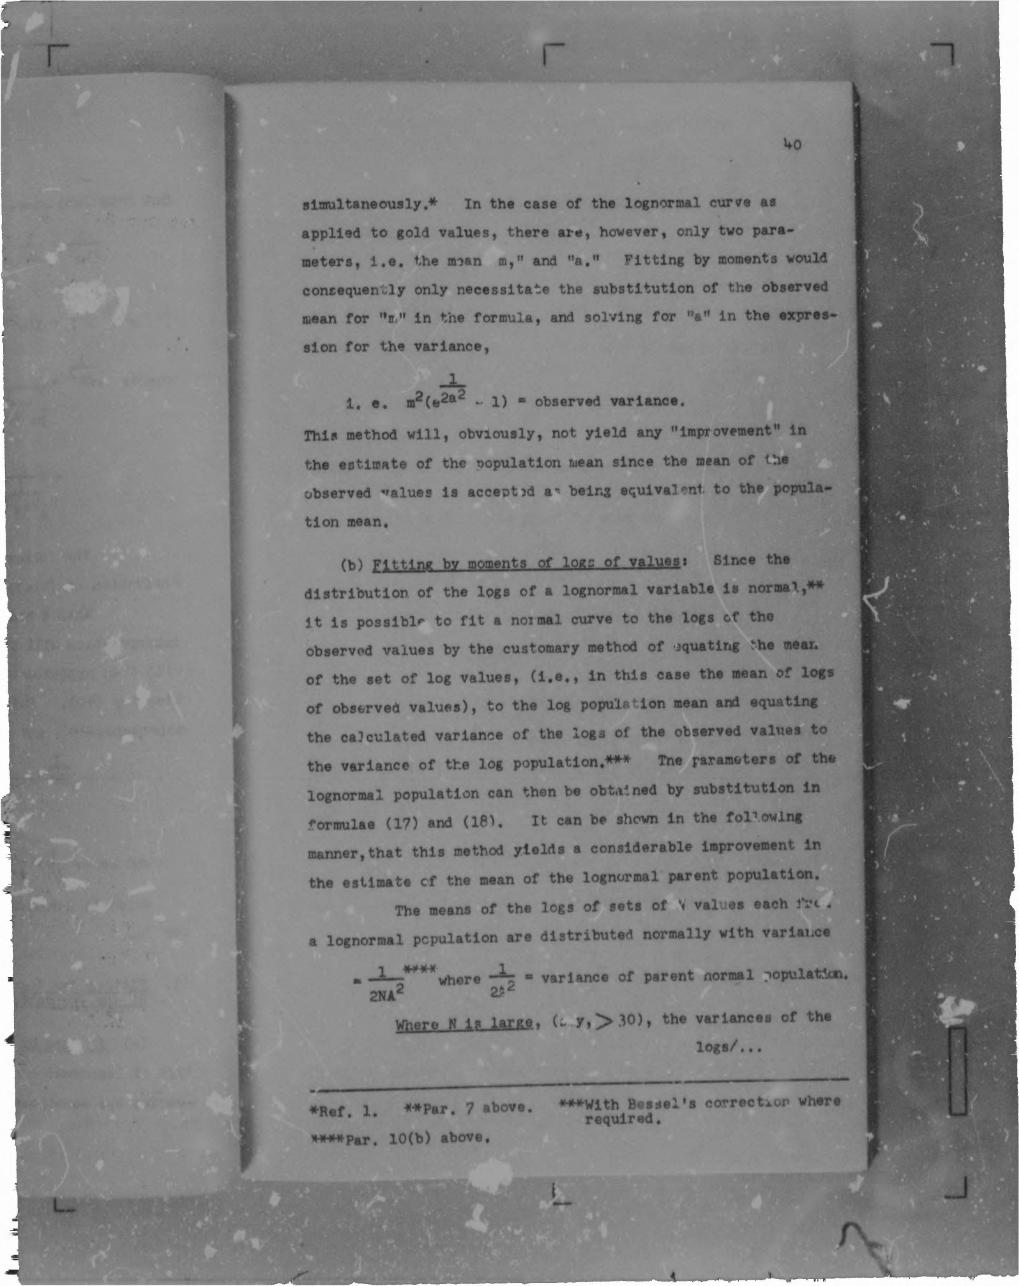
sim u ltan eou sly .* In the case of the lognormal curve as
applied to gold v a lu e s , there a re , however, only two para
m eters, I . e . the moan m,” and "a." F it t in g by moments would
consequently only n e c e s s ita te the su b s titu tio n of the observed
mean for **," in the form ula, and so lv in g for "a" in the expres
s io n for the varian ce ,
_ L1 . e . m2 (e 2a - 1 ) * observed variance.
This method w i l l , o b v io u sly , not y ie ld any "improvement" in
the estim ate of the population mean sin ce the mean o f the
observed va lu es i s accept 3d a ' being eq u iva len t to the popula
t io n mean.
(b) Fi t t in g by moments of log? of Y a W a ' Since the
d is tr ib u t io n of the lo g s o f a lognormal v a r ia b le i s normal,**
I t i s p o ss ib le to f i t a normal curve to the logs o f the
observed va lu es by the customary method o f equating the mean
o f the s e t o f log v a lu e s , ( i . e . , in th is case the mean of logs
o f observed v a lu e s ) , to the log population mean and equating
the ca lcu la ted variance o f the lo g s of the observed va lu es to
the variance o f the log population .*** Tne parameters of the
lognormal population can then be obtained by su b s titu tio n in
formulae (17) and (1 6 ) . I t can be shown in the fo llo w in g
m anner,that th is method y ie ld s a con sid erab le improvement in
the estim ate c f the mean o f the lognormal parent p opu lation .
The means of the logs o f s e ts of S values each i'vi <
a lognormal population are d istr ib u ted normally w ith variance
m —1— ****where — “ variance of parent normal population.2NA2 2 ^
Where N Is la r g e , U 7 , > 3 0 ) , the variances o f the
l o g s / . . .
1 **par. 7 above. ***With B e s s e l's correction where1 ‘ req u ired .
****Par. 10(b) above.
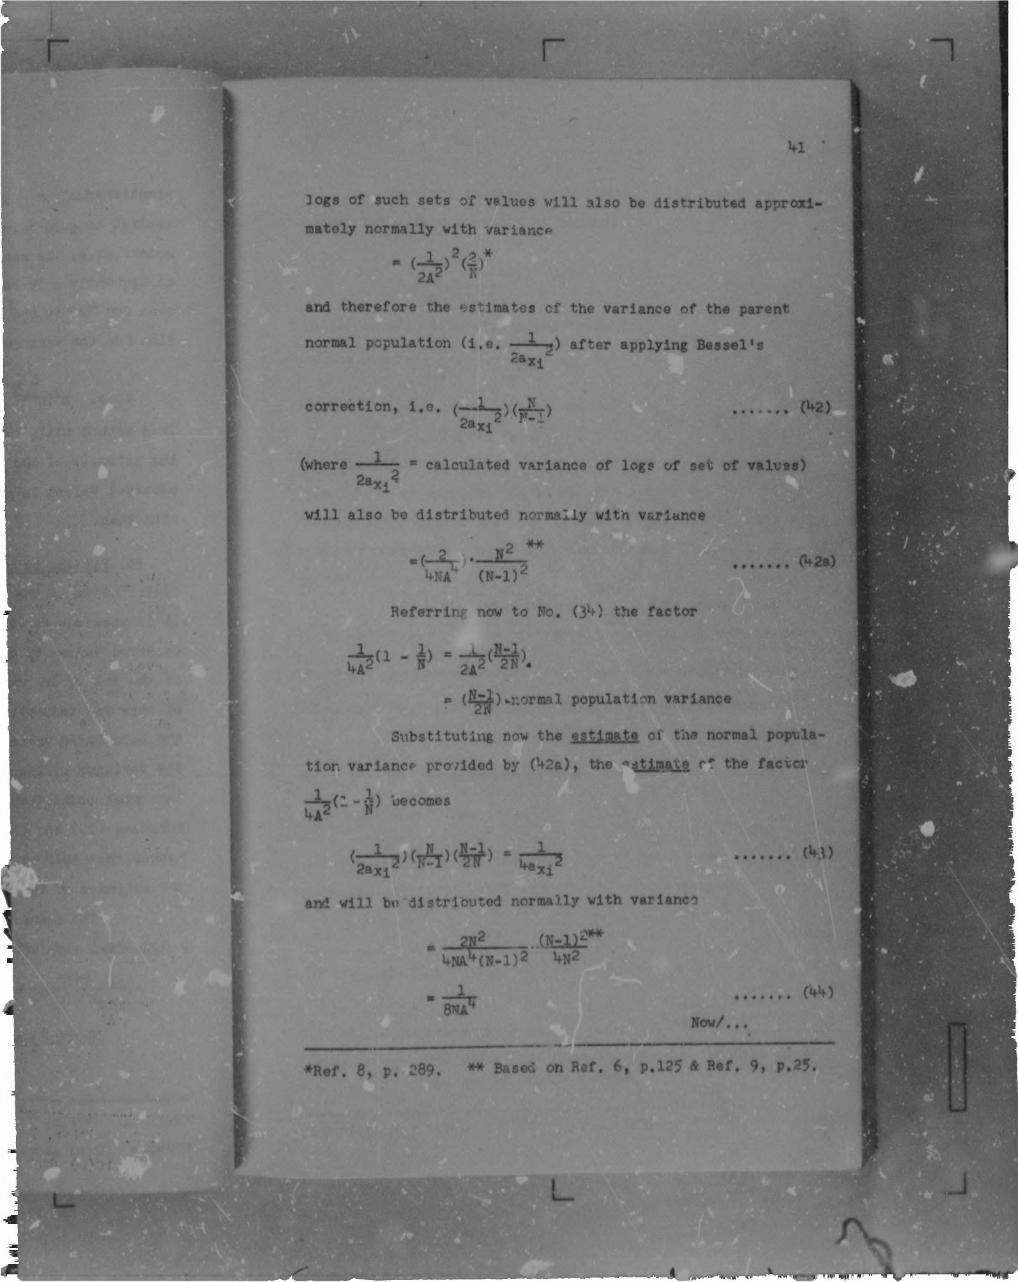
3ogs of such s e ts o f values w i l l a lso be d istr ib u ted approxi
mately norm ally with variance
and th erefo re the e s t im a te s of the variance o f the parent
normal population ( i . e . -g) a fter applying B e s s e l's
ca lcu la ted variance of lo g s o f s e t of v a lu es)
w i l l a lso be d is tr ib u ted normally w ith variance
Una1* (N -l) 2
Referring now to No. (34) the factor
c o r r e c tio n , i . e . (
(where
(Ih l)2 1 2N «
—•=(! - v ) becomes UA2
2_______(N-JLlt4NA4 (N -1 ) 2 4n2
and w i l l be d istr ib u ted normally w ith variance
♦R ef. 8 , p. 289. ** Based on R ef, 6 , p .125 & R ef. 9* P .25.
................. (42a)
(43 )
= (2L 1 ).norm al population variance
S u b s t i t u t i n g now the estim ate o f the normal popula
t io n variance provided by (4 2 a ), the " a tlmate r f the fa cto r
Now/.. .
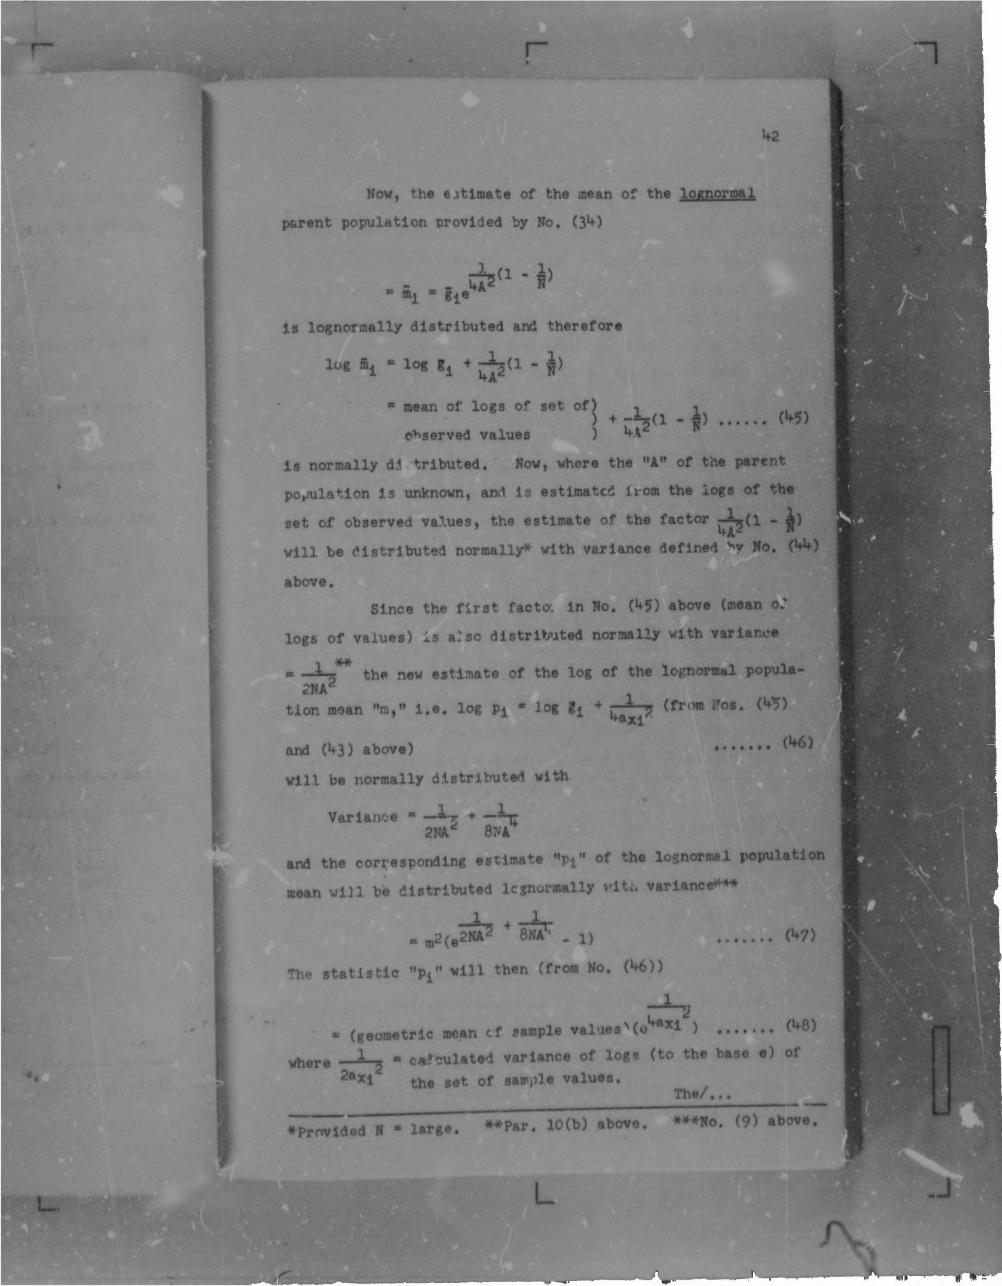
Nov, the ejtim ate of the mean o f the lognormal
parent population provided by No. (34)
(45)
- 4A - m1 - g i e K
Is lognorm ally d istr ib u ted and th erefore
log = log + ^ - g ( l - ^)
= mean of lo g s o f s e t of
observed va lu es
Is norm ally dl tr lb u ted . Now, where the "A1* of the parent
population Is unknown, and Is estim ated Irom the logs o f the
se t o f observed v a lu es , the estim ate of the factor j - ^ ( l - ^)
w il l be d is tr ib u te d normally* with variance defined ''y No. (44)
above.S ince the f i r s t facto: In No. (45) above (mean o:
logs o f v a lu es) Is a :sc d is tr ib u ted normally w ith variance
*#= —L - the new estim ate of the log of the lognormal popula-
2NAtlo n moan "m,” I . e . log p * log . p (from Noe. (4"5)
x l ’
and (43) above)
w i l l be norm ally d is tr ib u ted with
Variance + —n r2NA 8NA
(47)
and the corresponding estim ate "Pi" o f the lognormal population
mean w i l l be d is tr ib u te d Icgnormally w ith variance***
+ - I f «m 2 (e2N ^ SNA* . ! )
The s t a t i s t i c "pV *111 then (from No. (46 ))
--L -g(geom etric moan c f sample v a l ips ( o 1 ) (48)
where __» ca lcu la ted variance of lo g s (to the base e) of2**1 the se t o f sample v a lu e s .
T h e /. . . _______
**Par. 10(b) above. ***No. (9 ) above.* Provided N • la rg e .
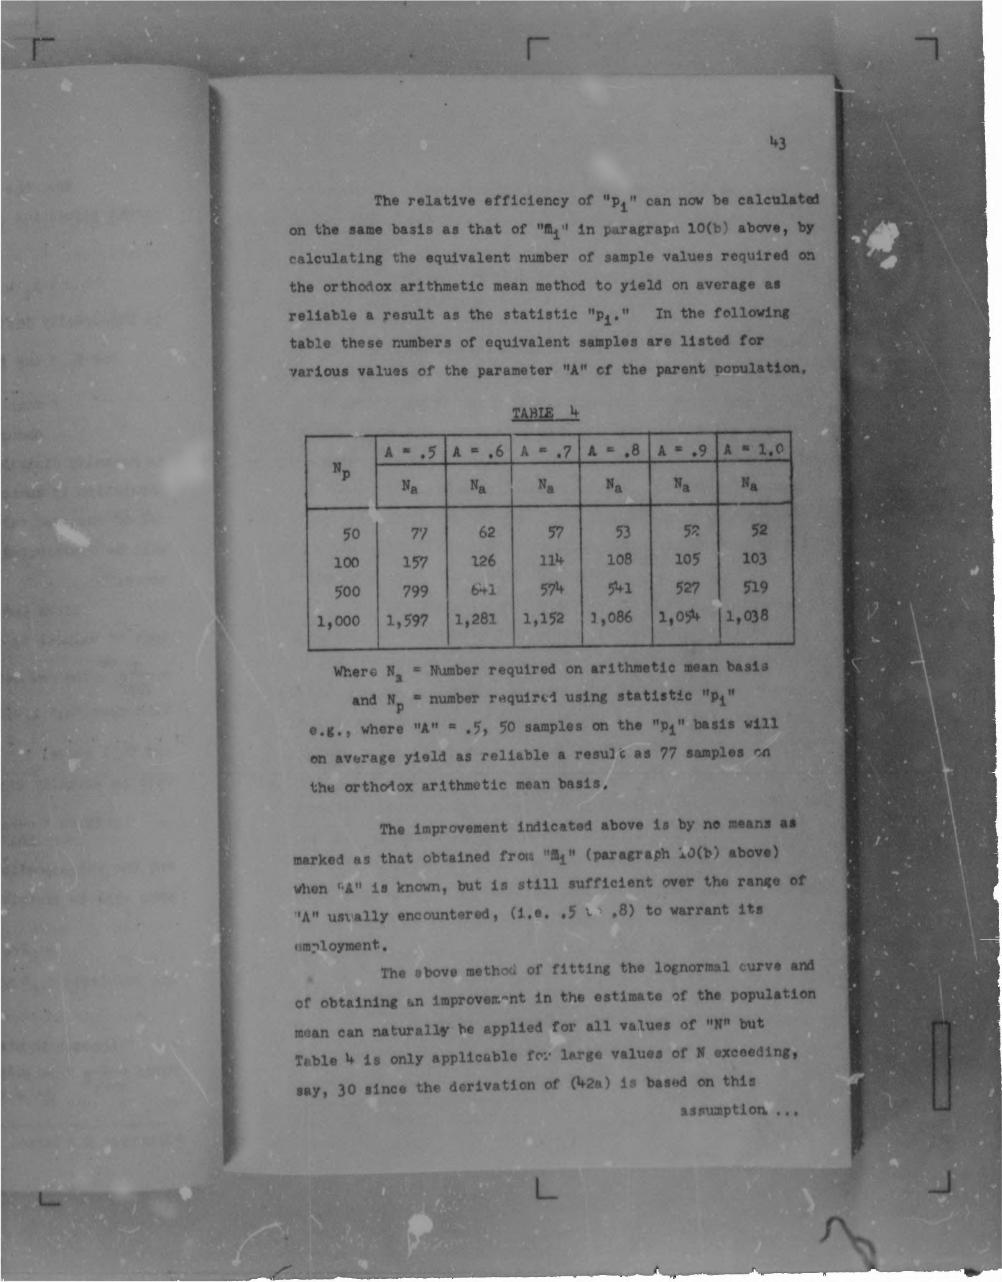
The r e la t iv e e f f ic ie n c y of "Pj" can now be calcu lated
on the same b a sis as th a t of in paragrapn 1 0 (b) above, by
c a lc u la tin g the eq u iva len t number of sample values required on
the orthodox arithm etic mean method to y ie ld on average as
r e l ia b le a r e s u lt as the s t a t i s t i c "p^. *' In the fo llow in g
ta b le th ese numbers of eq u iva len t samples are l i s t e d for
various va lu es o f the parameter "A" c f the parent p ecu la tio n ,
TABLE V
NPa - .5 A - .6 A = .7
COu<
A - .9 A - 1 .0
H, Na Na Na Na
50 77 62 57 53 52 52
100 157 126 114 108 105 103
500 799 641 574 541 527 519
1,000 1,597 1,281 1,152 1,086 1,054 11,038
*
Where Na * Number required on arith m etic mean b a sis
and Np * number required using s t a t i s t i c "Pj"
e . g . , where "A" B , 5 , 50 samples on the "Pji" b a sis w i l l
on average y ie ld as r e l ia b le a r e su ic as 77 samples on
the orthodox arith m etic mean b a s is .
The improvement ind icated above i s by no means as
marked as th at obtained from " IV (paragraph 10(b) above)
when ‘'•A" i s known, but i s s t i l l s u f f ic ie n t over the range of
u su a lly encountered, ( i . e . ,5 V . 8 ) to warrant i t s
employment.The above method of f i t t in g the lognormal curve and
of ob ta in in g an improvem-nt in the estim ate of the population
mean can n a tu ra lly be applied for a l l va lu es o f "N" but
Table 4 i s only a p p lica b le for large va lu es o f N exceed ing,
say, 3 0 s in ce the d er iv a tio n of (42a) i s based on th isassumption. . . .
L
assum ption. Tie determ ination of the improvement provided
by "Pi" for sm aller va lu es o f "N," f a l l s beyond the scope of
th is t h e s is .
P ractica l examples of the a p p lica tio n of t h i s method
are provided in Chapter VI.
(c) F l t t l w . by the Theory of Maximum L ik elih ood: This
method has been developed for the lognormal curve by S lch el*
and Finney*-* and i s uased, as in the case of the method under
(b) above, on the c a lc u la te * mean and v a r ia n c e of the logs of
the s e t o f sample values concerned. The s o lu t io n provided by
the Theory of Maximum L ikelihood , however, maximises the com
bined p ro b a b ility of obtain ing the observed mean and variance
in a s e t o f lo g s of sample v a lu es , and thus p rov ides a "better”
estim a than th at under (b) above.
This method req u ires the so lu tio n of an i n f i n i t e
s e r ie s wh ch in v o lv es a f a ir amount of c a lc u la t io n to a r r iv e
a t a s u f f ic ie n t ly c lo se r e s u lt , or a l t e r n a t i v e l y , the use of
ta b le s o f B e s s e l's fu n c tio n s , and the o v e r a l l t h e o r e t i c a l
improvement obtained i s for a l l p r a c t ic a l p urposes , the same
as th a t under (b) above. Three examples quoted by S ic h e l fo r
s e ts of 10 samples each have been solved using the method
under (b) above, «nd the r e s u lt s obtained d i f f e r e d from h i s to
the maximum exten t o f only a few p ercent.
The use o f th is more com plicated method a p p e a rs ,
th er e fo re , not to be j u s t i f ie d from a p r a c t i c a l point of view,
except p o ss ib ly in part. ,u lar c a s e s , e .g . borehole v a l u e s ,
where the time fa cto r in c a lc u l i on i s o f l i t t l e concequencr
14. Lognorma l Corxel.»U.Qil•As shown in paragraph 7 above, the d is tr ib u t io n of
the logarithm s of a lognormal v a r ia b le i s normal and i t i s ,
t h e r e f o r e / . . .
*R of. 5. 7 .
t h e r e f o r e , e v id en t t h a t a normal c o r r e l a t i o n su rface of the
logs of two J o in t lognoim al v a r i a b le s can be transposed Into a
lognorm al c o r r e l a t i o n su rfa c e of th ese two v a r i a b l e s . The
problem of the lognormal c o r r e l a t i o n su rfa c e w i l l consequently
be approached from the angle of the r e l a t i v e l y simple normal
c o r r e l a t i o n su rfa c e formed by the logs o f the v a r i a b l e s , and
only th e i d e a l case of the normal c o r r e l a t i o n su rface w ith
hom oscedastlc r e g re s s io n system* and l i n e a r regression w i l l be
c o n s id e re d .
Now l e t : -
x and y e two J o in t lognorm al v a r ia b le s
i and t ° the co rrc i^u n d ln g J o in t normal v a r i a b l e s , i . e . log x
and log y , r e s p e c t iv e ly
* and 7 *= means o f the two lognormal p o p u la t io n s
z and € * means of the two m rm a l p o p u la t io n s of and " t"
* lo g s o f th e geom etric means o f the two lognormal
p o p u la t io n s of "x" and "y" (see paragraph 7)
a y ■ param eter o f the lognormal p o p u la t io n of "yM and of
th e normal p o p u la t io n of "t"
tLy. * param eter of th e lognormal p o p u la t io n of "x" and of
t i e normal p o p u la t io n cf " z 1
& « param eter of the lognormal d i s t r i b u t i o n formed by
each of th e v a r io u s a r ra y s of " y 's " in th e x e e t e -
&ories- param eter of the normal d i s t r i b u t i o n formed by each
a r r a y of " t ' s "
xyy * param eter of th e lognormal d i s t r i b u t i o n formed by
each a r ra y of " x 's "
- param eter o f t in norm*! d i s t r i b u t i o n formed by each
a r ra y o f " z 's ' 'F ro m /. . .
♦ftof. k , p. 209.
From paragraph 7 above i t i s , th e r e f o r e , ev id en t
t h a t
The mean of a l l the " z ' s " = z = log o f mean o f th e %'s - r
= lOg X - _Ju_ .........4a
a%
(49)
The mean o f a l l the " t ' s " * € * log p - (49a)4ft
The mean of each a r ra y of " z 's " = ?og of mean of corresponding
a r ra y of %'s - 1 - 3 . . . ( 5 0 ) 4ai ^‘xy
The mean o f each a r r a y o f " t ' s " = log o f mean of corresponding
a r ra y of y ' s - -— . . . ( 5 ^ ' ^ y x
F u r th e r , as th e lin e cf regression 9.1 "t"
i s formed by th e s e r i e s o f moms of a r r a y s of "t's" i t w i l l
correspond to th e s e r i e s o f (logs of the means of arrays of
y t 3 . — . I t i s , t h e r e f o r e , e v id e n t that the lin e (or4a yx
curve) of r e g r e s s i on 01 "y" o p _ ^ l w il l on the logarithm ic
graph of " t " on «% " p lo t as a s t r a i g h t l in e p a ra lle l to the
l i n e of r e g r e s s io n of " t " on "z" a t a " v e r t i c a l " d istan ce ,
( i ,e . p a r a l l e l to the y a x i s ) o f + from the
l a t t e r . (51)
S im i l a r ly , th e l in e or curv e p f . JOZT^sglffl @1
"x" on "y" w i l l on th e lo g a r i th m ic graph o f "z" on " t " p lo t
as a s tr a ig h t l i n e p a r a l l e l to th e l i n e o f r e g re s s io n o f "z"
on " t " a t a d i s ta n c e p a r a l l e l to the x a x is of + " 3 f r o a
the l a t t e r . *...............(51ft)
I t should be noted a t t h i s s ta g e th a t only a 45°
l i n e on double lo g a r i th m ic graph paper w i l l co n v er t i n to a
s t r a i g h t l i n e on o rd in a ry g r tp h p ap er , and th a t the l a t t e r
H n « w i l l always pass through the OYtg5n, e .g .»
log y * log x + log S i s a 45° lin o on doable
logarithm ic paper converting in to
y e Sx on ordinary graph paper
where S ■ a constant
Any other s tr a ig h t l in e on double logarithm ic paper
w i l l convert in to a curve on ordinary graph paper, e . g . ,
log y B P log x + log S (where p B s lo p e ^ *5°)
converts toy = eP log % + log S
= Glog Sep log x
= KeP ** ( i . e . a type of exponential curve)
4?
Line of reg ress io n
Now consider a l in e of reg ressio n of "y" on "x" o f
y = Sx
converting to
log y ■ log x + log S
t B z + log S
, from the con clu sion s reached above (No, (51)) the llr^q .q£
r eg re ss io n of "t" on w i l l be
t = a + log S - — (%)yx
w ith slop e * 1
But the s lop e o f the l in e o f reg ressio n o f " t 1 on "z" in
general
e Standard d e v ia t io n C o e ff ic ie n t)*Standard d ev ia tio n Of Z
•S., . . . (from Nos. (17) and (1 8 ))
2a x ‘a.
v’h e n /. . .
♦R ef. 4 , p. 177.
when the slop e * 1 , th ere fo re , the c o e f f ic ie n t of c o rre la tio n
Line of reg ressio n z on t;
P u r.h er , the general formula for the slope
l in e o f reg r ess io n o f z on t Is
.rd d ev ia tio n of z r *tandare d ev ia tio n of t '
ay* .r and from No. (5V) th is
x
This l in e of reg ressio n w i l l , th e re fo re , je
ay 2z “ -£wt + K ..............
ax
and i t o.ust pass through the point z ,^ which, from
Nos. (49) and (49a> can be stated as
log x - —i-r , log y - —l- z 4ax 2 4ayZ
Solving for K in No. (56) y ie ld s
K * log * - ^ 3 »log y
and No. (56) becomes
z = -^ * t + log x - ^ n - lo g y ............ax a*
Now, the variance o f each array of z ’s
« L — » Variance o f z ' s ( l - r<) which from No.2® xy2
« - ^ - n ( l - ^ 5 ) ............2ax *- axz
C onsequently, from No. (51a) above, the -4ne.,gr r e g r e s s io n o f x on y can be obtained from
I . e . log x '
*R ef. 4 , p . 177, **H ef. 4 , p. 180.
2 2 2 i , o , l*g x = — l o g y + log jt - -J^xlog y + - — *(1 - — *) , , , « (59® )
ax ax 4ax 2 ax
and where in a sp e c ia l case x “ y2 2
log x * -^ * log y + (log X + — - * ) ( 1 ---- £*) (59b)®x ax c
I t i s ev id en t, th erefo re , th a t in the case of a lo g
normal c o r r e la t io n su r fa ce , a s tra ig h t l in e of reg ressio n of
y on x of the type y * Sx w i l l have a corresponding curve of
r eg r e ss io n of x on y as defined by No. (5 9 )s. This property
fin d s p a rtic u la r a p p lica tio n in the subsequent examination of
b ias errors in mine v a lu a tio n , (Chapter V I, paragiaph 3 ) .
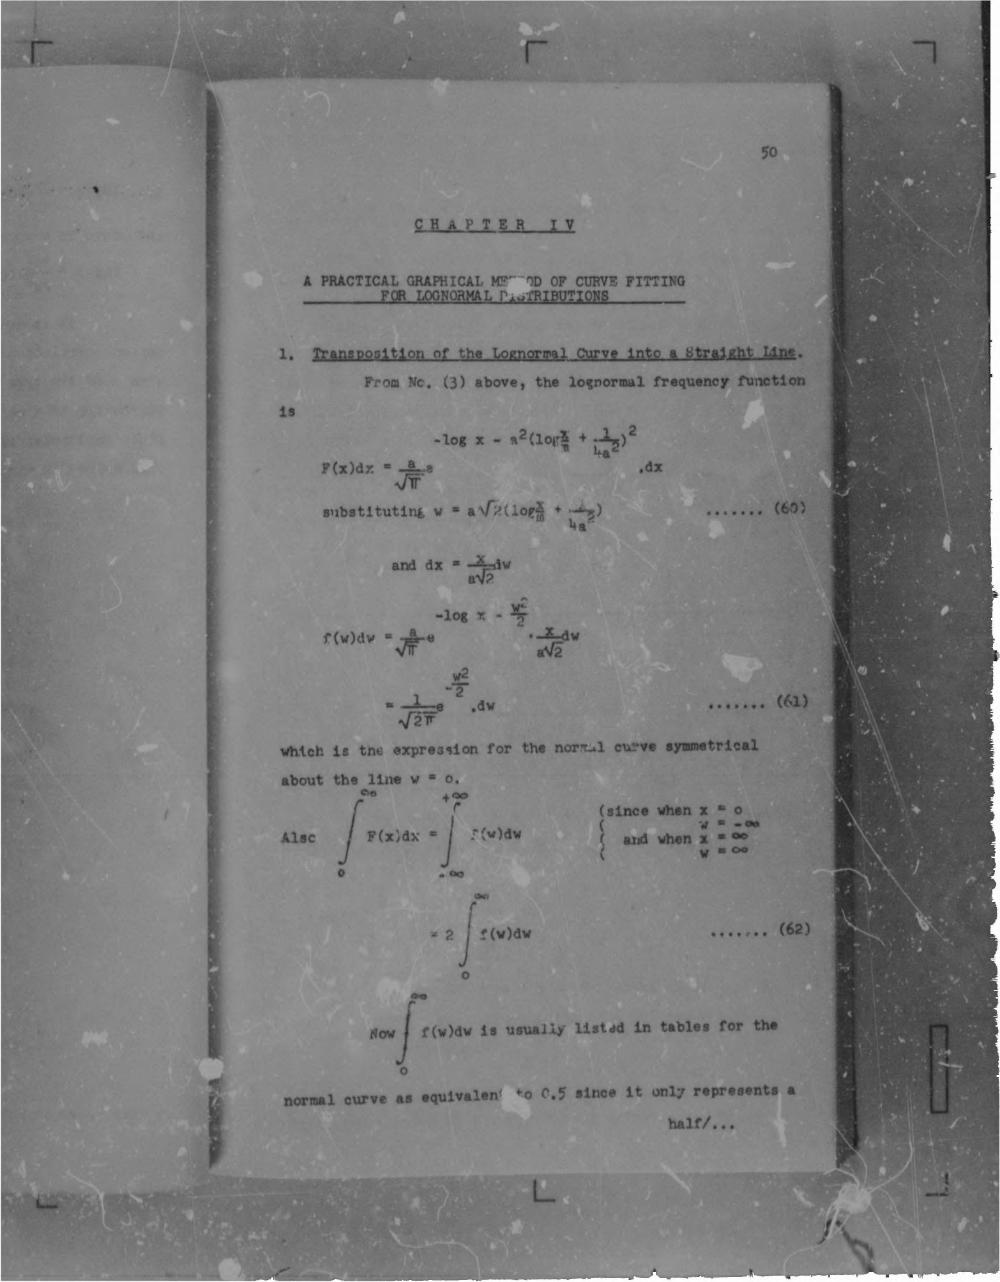
C H A P T E R I V
A PRACTICAL GRAPHICAL ME~"OD OF CURVE FITTING __________FOR, LOGNORMAL P^TRIBUTIONS__________
1. T ransposition of the Lognormal Curve in to tr a il
From Nc. (3) above, the lognormal fr e q u e n c y fu nction
- lo g x - a2 (lo iri +**a£'
F(x)dx * ,dxV f
su b s titu tin g w * a ( iogjjj ♦ • • « • • • • C60/
#«##*## (^1)
-log X - -7Tf(w)dv
about the l in e w * o.> oo
-'(w)dwAlso
* P. 1 f(w)dw
iNow I f(w )dv i s u su a lly l l s t a d in ta b les for the
normal curve as equivalent *o 0 .5 s in ce I t only rep resen ts a
h a l f / . . .
which i s tne exp ression for the norsul curve symmetrical
(s in c e when x “ o( w ■ -<*»( and when x * 00( w ■ -
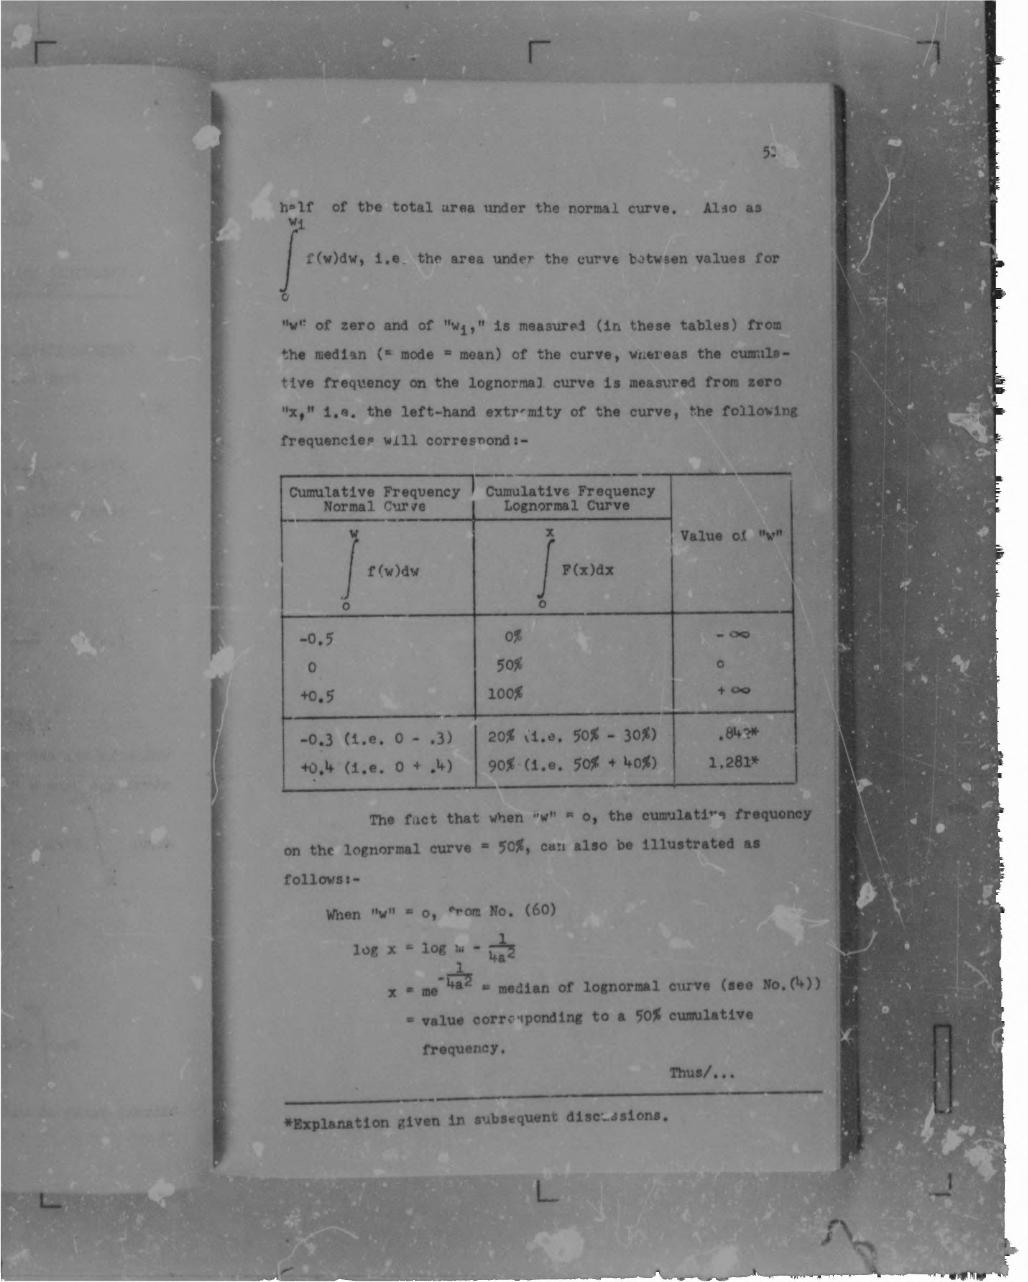
r r
5:
h » lf of the to ta l area under the normal curve. Also as *1
f(w)dw, l . e the area under the curve botwsen values for
"v': o f zero and of "w^," Is measured (In these ta b le s ) from
the median (* mode = mean) of the curve, vneieas the cumula
t iv e frequency on the lognormal curve I s measured from zero
" x ,” I . e . the left-h an d extrem ity of the curve, the fo llow in g
freq u en cies w i l l corresnond:-
Cumulative Frequency 1 Normal Curve
Cumulative Frequency Lognormal Curve
} ?Value o.t "v"
| f(w)dw 1 F(x)dxJ. 1
0 0
-0 .5 0 % - 0 0
0 50$ 0
+0 .5 100$ + 0 0
-0 .3 ( I . e . 0 - .3 ) 20$ v i .e . 50$ - 30$) .84"*
+0.4 ( i . e . 0 + .4 ) 90$ ( i . e . 50$ + 40$) 1.281*
The fa c t that when "w" * o , the cumulati'-s frequency
on the lognormal curve e 50^, can a lso be I llu s tr a te d as
fo llo w s «-
When "w" * o , ^orc No. (60)
log x log w -_ 1_ &
x * me ^ * median of lognormal curve (see N o.(M )
e value corresponding to a 90$ cum ulative
frequency.T h u s/.. .
♦E xplanation given In subsequent d is c u s s io n s .
L
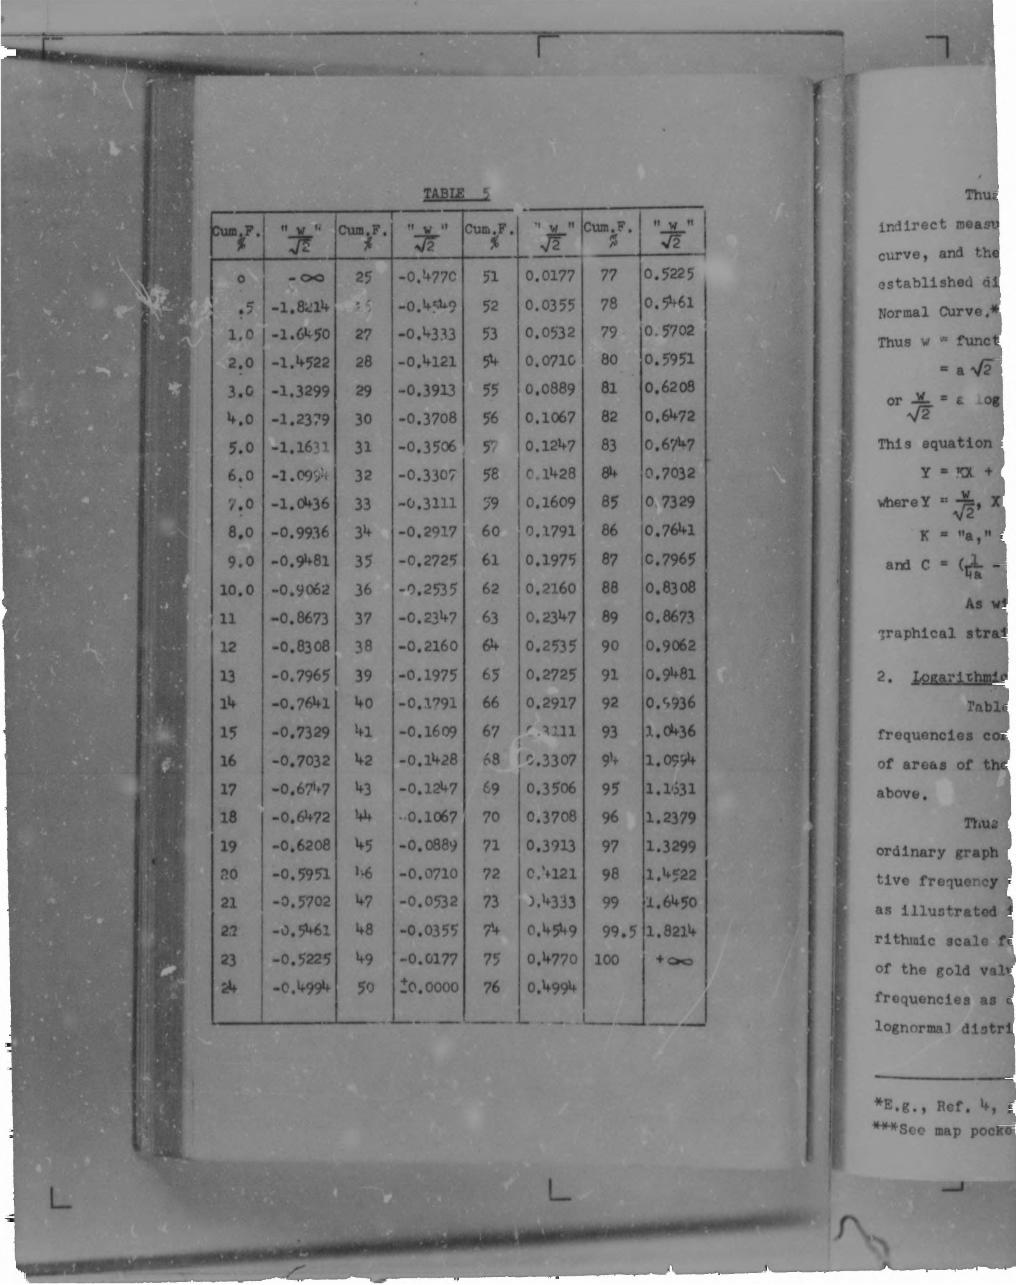
1
TABLE ‘
M « H #
C u m , M v *'i t
Cum.F. * V **J r
Cum.F. II w MVT
0 - OO 25 -0.4770 51 0.0177 77 0.5225
.5 -1.8214 f 5 .0 .4549 52 0.0355 78 0.5461
1 .0 -1.6450 27 -0.4333 53 0.0532 79 0,5702
2.0 -1.4522 28 -0.4121 54 0.071G 80 0 . 5951
3 .0 -1.3299 29 -0.3913 55 0,0889 81 0.6208
4 .0 -1.2379 30 -0.3708 56 0.1067 82 0.6472
5.0 -1.1631 31 -0.3506 57 0.1247 83 0.6747
6.0 -1.0954 32 -0.3307 56 0.1428 84 0.7032
7 .0 -1.0436 33 -0.3111 59 0.1609 85 0 7329
8.0 -0.9936 34 -0.2917 60 0.1791 86 0.7641
9 .0 -0.9481 35 -0.2725 61 0.1975 87 0.7965
10.0 -0.9062 36 -0.2535 62 0.2160 88 0.8308
11 -0.8673 37 -0.2347 63 0.2347 89 0.8673
12 -0.8308 38 -0.2160 64 0.2535 90 0.9062
13 -0.7965 39 -0.1975 65 0.2725 91 0.9481
14 -0.7641 40 -0.1991 66 0.2917 92 0.9936
15 -0.7329 4 l -0.1609 67 r . * u i 93 1.0436
16 -0.7032 42 -0.1428 68 0.3307 94 1.0994
17 -0.6747 43 -0.1247 69 0.3506 95 1.1631
18 -0.6472 44 • 0.1067 70 0.3708 96 1.2379
19 -0.6208 45 -0.0889 71 0.3913 97 1.3299no -0.5951 46 -0.0710 72 0.4121 98 1.4522
21 -0.5702 47 -0.0532 73 3.4333 99 1.6450
22 -0.5461 48 -0.0355 74 0.4549 99.5 1.8214
23 -0.5225 49 -0.0177 75 0,4770 100 + O o
24 -0.4994 50 Zo.oooo 76
- - - - -
0.4994
"1 I
Th
in d ir e c t mea
cu rve, and t
e s ta b lish e d d
Normal Curve.
Thus w “ func
a V2
or * a i.ogV 2
This equation
Y = KX +
where Y "
and C =
As wi
grap h ica l s t r a i
2 . Loearithm ii
Tabl<
freq u en cies coj
of areas o f th<
above.
Thu:
ordinary graph
t iv e frequency
as i l lu s t r a t e d
r ith io ic s c a le :
of the gold va:
freq u en c ies as
lognormal d is t i
* E .g . , Ref ^ ^ S e o map po
A
Author Krige, D. G. Name of thesis A statistical approach to some mine valuation and allied problems on the Witwatersrand. 1951
PUBLISHER: University of the Witwatersrand, Johannesburg
©2013
LEGAL NOTICES:
Copyright Notice: All materials on the Un i ve r s i t y o f the Wi twa te r s rand , Johannesbu rg L ib ra ry website are protected by South African copyright law and may not be distributed, transmitted, displayed, or otherwise published in any format, without the prior written permission of the copyright owner.
Disclaimer and Terms of Use: Provided that you maintain all copyright and other notices contained therein, you may download material (one machine readable copy and one print copy per page) for your personal and/or educational non-commercial use only.
The University of the Witwatersrand, Johannesburg, is not responsible for any errors or omissions and excludes any and all liability for any errors in or omissions from the information on the Library website.