Embed Size (px)
Citation preview

A and
Stocking Its Use in
Guide fo r A
by Benjamin A. Roach
iegheny Hard Intermediate
USBA FOREST SERVICE RESEARCH PAPER ME-373 3977
FOREST SERVfGE, U.S. DEPARTMENT OF AGRICULTURE NORTHEASTERN FOREST WPERINIENT STAT30fd 6816 MARKET STREET, UPPER DARBY, PA. 19082
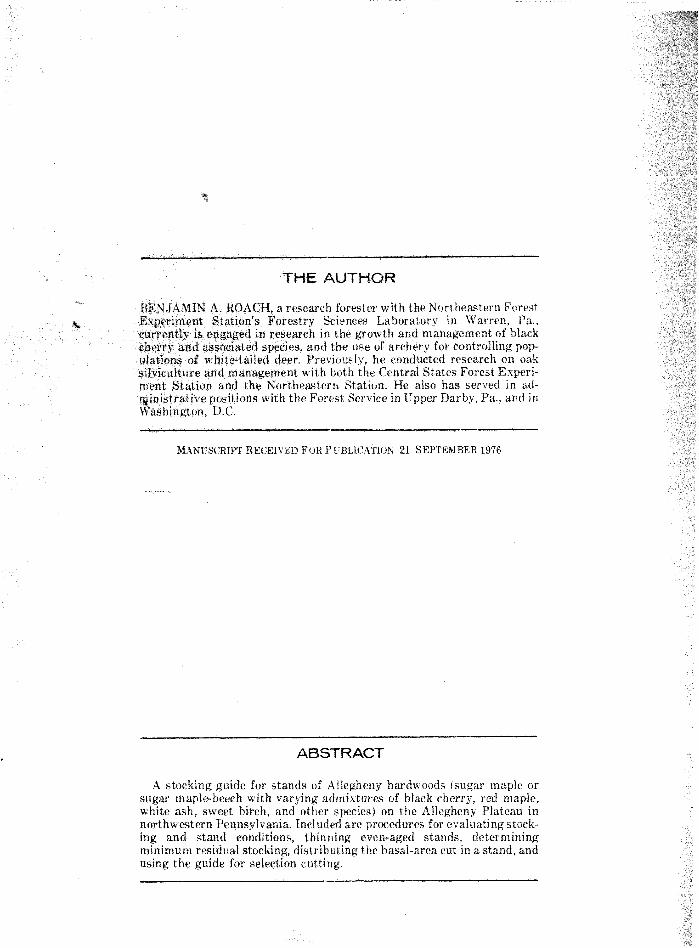
BEMJAIt4CfN A, ROACH, a research forester with "the Northeastern Forest Experiment St ation's Forestry Sciences Laboratory in FVarren, Pa., currenCIy is e ~ g a g e d in research in the g a w t h and management of black cherry and associated speeies, and the use of archery for cantrolling pop- ulatitms of whit e-tailed deer. Previousi y, he conducted researeit? on oak silviczlfture and management with both the Central States Forest Experi- ment Station and the Kortheastern Station. He also has served in ad- qinistraLive positions with the Forest Service in rjpper Darby, Pa., and in Washington, D.C. - --
;WiBNGSGRIPT RECEIVED FOR P CBLICATION 21 SEPTEMBER 1975
-- -
ABSTRACT
A stocking guide for stands of Allegheny hardwoods (sugar maple or sugar maplebeeeh with varying admixtures of black cherry, red maple, white ash, ~ \ ~ t ? e t birch, and other species) on the AlIeghen3- Plateau in northwetern Pennsylvania. Included are procedures for evaluating stock- ing and stand conditions, thinning even-aged stands, determining minimum residual stocking, distributing the basal-area cut in a stand, and using the guide for selection cutting.
. A Stocking Guide for Allegheny Hardwoods and Its Use i n Controlling Intermediate Cuttings
CONTENTS
INTRODUCTION . . . . . . . . . . . . . . . . . . . . . . . . . . . . . . . . . . . . . . . . . . . . . . . . 1 . . . . . . . . . . . BACKGROUND . . . . . . . . . . . . . . . . . . . . . . . . . . . . . . . . . . .. 1
TREE-AREA RATIO FOR ALLEGHENY HARDWOODS . . . . . . . . . . 2 SO WHAT? . . . . . . . . . . . . . . . . . . . . . . . . . . . . . . . . . . . . . . . . . . . . . . . . . . . . . 2 STOCKING GUIDE FOR ALLEGHENY HARDWOODS . . . . . . . . . . . 4 THE STAND INtENTORY . . . . . . . . . . . . . . . . . . . . . . . . . . . . . . . . . . . . . . 5
Planning the Sample Cruise . . . . . . . . . . . . . . . . . . . . . . . . . . . . . . . . . . . . 5 The Basal-Area Tally . . . . . . . . . . . . . . . . . . . . . . . . . . . . . . . . . . . . . . . . . . 8 The Tree Count . . . . . . . . . . . . . . . . . . . . . . . . . . . . . . . . . . . . . . . . . . . . . . . 8 Determining Average Stand Diameter . . . . . . . . . . . . . . . . . . . . . . . . 11
EVALUATING STOCKING AND STAND CONDITION . . . . . . . . . . . . 11 GENERAL PRINCIPLES FOR THINNING EVEN-AGED STANDS . 14
Variations Needed for Allegheny Hardwoods . . . . . . . . . . . . . . . . . . . . 1 5 DETERMINING MINIMUM RESIDUAL STOCKING . . . . . . . . . . . . . . 16 DISTRIBUTING THE CUT . . . . . . . . . . . . . . . . . . . . . . . . . . . . . . . . . . . . . . 18
Is the Cut Practical? . . . . . . . . . . . . . . . . . . . . . . . . . . . . . . . . . . . . . . . . . . 19 USE OF THE GUIDE I S SELECTION CUTTING . . . . . . . . . . . . . . . . . 25 PRECAUTIONS . . . . . . . . . . . . . . . . . . . . . . . . . . . . . . . . . . . . . . . . . . . . . . . . . 25
Region of Applicability . . . . . . . . . . . . . . . . . . . . . . . . . . . . . . . . . . . . . . . . 25 Species Composition . . . . . . . . . . . . . . . . . . . . . . . . . . . . . . . . . . . . . . . . . . . 27 Field Checks on Marking . . . . . . . . . . . . . . . . . . . . . . . . . . . . . . . . . . . . . . 29 Be Sure to Include the Small Trees . . . . . . . . . . . . . . . . . . . . . . . . . . . . . 29
LITERATURE CITED . . . . . . . . . . . . . . . . . . . . . . . . . . . . . . . . . . . . . . . . . . . 30

Headquarters of the Northeastern Forest Experiment Station are in Upper Darby, Pa. Field laboratories and research units are maintained at:
Amherst, Massachusetts, in cooperation with the University of Massachusetts.
O Beltsville, Maryland. Q Berea, Kentucky, in cooperation with Berea College.
0 Burlington, Vermont, in cooperation with the University of
* Delaware, Ohio.
Durham, New Hampshire, in cooperation with the University of New Hampshire.
Hamden, Connecticut, in cooperation with Yale University. Kingston, Pennsylvania.
* Morgantown, West Virginia, in cooperation with West Vir- ginia University, Morgantown.
6 Orono, Maine, in cooperation with the University of Maine,
6 Parsons, West Virginia. Q Pennington, New Jersey.
Princeton, West Virginia. * Syracuse, New York, in cooperation with the State University
of New York College of Environmental Sciences and Forest- ry at Syracuse University. Syracuse.
* Warren, Pennsylvania.

INTRODUCTION
CONTROL OF STAND DENSITY is the prin- cipal means tha t foresters have for regulat-
ing sta,nd growth. Ideally, to grow a full crop of wood products a s quickly as possible, we should always have in our stand the minimum number of trees tha t will just use all of the light, mois- ture, and nutrients that a re available on the site each growing seaspn. The problems have always been how to define this ideal, and then how to achieve it.
Through the years many stocking guides have been developed to aid the forester in judging how well his stand is stocked compared to some prescribed standard, and, consequently, how the stocking would have to be changed to approach the ideal. In my opinion the best of the modern guides is the one developed by Gingrich (196'7) for the oaks. I t describes the maximum stocking to be expected and the minimum stocking that is needed for full yield, in basal area per acre, for a stand of a given average diameter. The guide has a rational biological basis; it is generally in- dependent of the influence of site, age, or stand structure; and the measurements that are need- ed for its application can be easily and quickly obtained in the field. Similar guides have since been developed for use in t h e Northeast: northern hardwoods (Lectk, Sotc>~~zon, and Filip 196,9); paper birch (l'Mnrqz~is, Solom on, arrd B j o r k b o ~ n 1,969); spruce-f i r (Fr-rrztk njtd Bjmkborn 19%); and white pine (Ph ilbrook, Barrett, u ttd Let& 1972).
Following Gingrich's lead I have developed s tock ing gu ides fo r s t a n d s of Allegheny hardwoods (sugar maple or sugar maple-beech with varying admixtures of black cherry, red maple, white ash, sweet birch, and other spec i e s ) on t h e A l l egheny P l a t e a u in northwestern Pennsylvania. This guide differs from the others listed in that I found i t
necessary to incorporate a measure of stand composition-specifically, the basal area in black cherry, white ash, and yellow-poplar ex- pressed as a percentage of the total basal area of the stand.
The growth rate of a healthy tree is determined largely by the amounts of light, moisture, and nutrients tha t a re available to i t year after year. If these elements a r e con- tinuously available in amounts equal to the tree's ability to use them, the growth ra te of the t ree should be a t a maximum. If their availabili- t y becomes less than optimum, the growth rate of the tree is reduced; if their availability is reduced too greatly the tree will die.
The larger the tree, the greater a re the amounts of light, moisture, and nutrients re- quired for its survival and growth. But (if we ig- nore variables such as fertilization, irrigation, and climatic variation) the total amounts of these elements that are available on a site can be considered constant year after year. So a s the trees increase in number or in size, undisturbed stands tend to reach and maintain a maximum degree of crowding. As some trees grow, others must die. The surviving trees receive less than opt imum amounts of light, moisture, o r nutrients, and their growth is relatively slow.
The a rea of a given site is, of course, constant. And if the amounts of light, moisture, and nutrients that reach the site can also be con- sidered constant, they may be thought of collec- tively a s the growing space available. This grow- ing space can be expressed in area, and the area can be allocated mathematically among the trees present according to size. The tree-area ratio (Chisrnctn uvd Schlrnrclche?* 1940) is useful for this purpose.

TREE-AREA RAT10 FOR ALLEGHENY HARDWOODS
I collected data on 106 natural hardwood stands throughout Warren, McKean, Forest, and Elk Counties in Pennsylvania. Some data came from measuremenb of temporary plots; other data were gleaned from research records dating as far back as 1928.'
The criteria for selecting the stands were somewhat subjective. Primarily there had to be. no reason to believe that the stand was not a t the maximum degree of crowding permitted by the site; that is, the stands had to show no eviknce (on direct examination or in the records) of past cutting or other disturbance. The only exceptions were six research plots on which there had been a very light cutting more than 30 years earlier. However, no stands were excluded just bqause they seemed to have fewer trees or less basal area than others, if there was no evidence of disturbance. Because the tree- area ratio seems to be generally independent of site quality, I made no attempt to determine site quality.
The stand data consisted of tables of numbers
N is the number of trees. ZD is the sum of diameters. ZlD2 is the sum of squares of the diameters.
If all figures are calculated on a per-acre basis, then tree area should be 1 acre or 1,000 milacres.
The best regression (highest R2 and lowest standard error of the estimate) was based on six species groups: sugar maple/beech/black c h e r r y - w h i t e a s h - y e l l o w - p o p l a r / r e d maple/yellow birch-sweet birch/miscellaneous. The miscellaneous group consisted of pin cherry, hemlock, basswood, aspen, cucumber- tree, striped maple, American hornbearn, hophornbeam, and serviceberry. Except for pin cherry in young stands, trees of the mis- cellaneous group occurred as scattered in- dividuals.
The equation is: Tree area (milacres) = -18.4188 -.I754 Nsm + ,1953 CDsm + .0353 CD2sm +
.2537 Nbe -.I256 ZDbe + .0628 ZD2be +
.4172 Nbc-wa- yp + .I690 ZDbc-wa-yp + ,0075 ZD2bc-wa-yp - .4342 Nrm + -2726 ZDrm + .0162 CD2rrn + .8288 Nbir - .2012 ZDbir + -0630 CD2bir - .2878 Nmisc.
+.2263 ZDmisc. + ,0017 Z1D2misc. of trees per acre that were 1.0 inch in diameter at breast height (dbh) or larger, by species and This regression is highly significant with a l-inch diameter class; the data were compiled coefficient of multiple determination (R2) of 99.6 from diameter tape measurements of every tree percent. The standard error of estimate is 43.8 on the plot. The plots ranged in size from 1/4 milacres or about 5 percent of the mean tree acre to 20 acres, and totaled 175 acres with area of the plots. about 125,000 trees. Stand age ranged from 18 to more than 100 years; basal area ranged from 60 to 175 square feet per acr?, and number of trees SO WHAT? from 200 to 5,000 per acre. From these tables I calculated the number of trees per acre, the From the high R2 and small standard error, sums of the diameters per acre, and the sums of we can be reasonably confident tha t un- the squared diameters per acre, by species for disturbed stands of Allegheny hardwoods do in- each plot. deed achieve an average maximum degree of -
These data were used to solve the tree-area stocking, and that we can describe this average eauation: maximum mathematically. By plugging into the
I -
Tree area = (alNl+bl ZD1 + ci 2D21)+ e q u a t i o n t h e a p p r o p r i a t e p e r - a c r e
(azN2 + b2 ZD2 + c2 ZD22) . . . measwrements for any stand, we can determine the number of milacres that the stand occupies
where a, b, and c are regression coefficients. when each tree is allocated the average The subscript numbers indicate different minimum growing Space that it needs to S U r -
species or species groups. vive. If we divide that figure by 10, we will ob- tain the stocking percentage in the stand com- - -
thank personnel of the Pennsylvania Bureau of pared to the average maximum stocking (100 Forestry and of the Seh001 of Forest Resources of The Penn- percent) for an natural stand of the syivania State University for the use of stand da ta that they generously made available for this study. same composition and average diameter.

Unfortunately, this stocking equation is not very useful for determining relative stocking in the woods. The number of trees can be obtained easily by counting them on sample plots. The sum of the squared diameters can be obtained easily by conversion from basal-area estimates; the latter can be made quickly with a wedge prism.2 But the sum of diameters term requires a measure, or a t least an estimate, of the diameter of many individual trees, and this takes much time and computation. Therefore, it would be convenient if a reasonably accurate es- timate of stocking could be obtained without us- ing the sum of diameters term.
The sum of diameters is useful primarily for indicating the differences in stocking between stand2 that have the same basal area and number of trees, but different structures. Gingrich (196r) found that differences in struc- ture among oak stands resulted primarily from differences in species composition. But, with the exception of yello~-poplar, the species usually encountered in oak stands all had about the same requirements for growing space. That is, a 1Zinch white oak required about the same amount of growing space as a 1Zinch black oak or a 12-inch hickory.. Therefore, if the amount of yellow-poplar in an oak stand were relatively low, both structure and composition could be ig- nored. Stocking estimates could be based on only the number of trees and basal area per acre.
This is because the number of trees per acre and the basal area per acre, taken together, mathematically define the diameter of the tree of average basal area (hereafter referred to as the average stand diameter). As nearly every normal yield table will show, there is a close relat ionship between t h e average s t and diameter and the maximum basal area per acre. Therefore there must be an equally close relationship between the maximum basal area per acre and the number of trees per acre. So, for any forest type with a particular typical
* structure (so that the sum of diameters term becomes insignificant), a regression of max- imum basal area per acre on number of trees per acre provides a means for dispIaying graphically the tree-area equation for aver age maximum
2Because basal area and the sum of squared diameters a re essentially the same, it makes sense to use basal areadireet- ly rather than perform a needless conversion to sum of squared diameters.
stocking in that type, If we superimpose on that graph the lines that indicate the average stand diameter, we can see the relationship between average stand diameter and maximum basal area.
Then it becomes a simple matter to determine the relative stocking of any stand, if its average diameter is known, by comparing the basal area of the stand with the basal area shown on the chart for a stand of the same average diameter. Also it is easy to determine the residual basal area that is needed for any degree of stocking, as long as cutting does not cause a significant change in stand structure. Finally, the degree of stocking and the average stand diameter should provide an excellent basis for predicting future growth and development-both for individual trees and for stands-once the necessary data are accumulated.
Al though t h e s t r u c t u r e of Al legheny hardwood stands varies much more than that of oak stands, I had hoped that a stocking guide based only on number of trees and basal area might be accurate enough for field use, but this hope proved illusory. The regression of basal area on number of trees per acr,e, though highly significant, had an R2 of only 34 percent, and a standard error of the estimate of 16 percent. It seemed logical that the low R2 and the high stan- dard error were due to large variations in struc- ture among the sample stands. Obviously, some measure of structure had to be included.
I couldn't think of any indicator of structure that promised reasonable accuracy and that would be any easier to obtain than the sum of diameters. But it seemed likely tha t the varia- tion in structure was caused primarily by two factors: differences in stand age, and the wide range in species composition.
There was a modest improvement in results after I incorporated stand age in the regression of basal area on number of trees per acre, but it was considerably less than I had expected. So I investigated a number of possible indicators of composition.
The best indicator that I found was the percentage of basal area in the stand that was contributed by each species. In fact, when this variable was included the effect of stand age dis- appeared. This indicator was convenient because it promised to eliminate the practical difficulties of determining stand age in the field, or trying to assign a specific age to stands con-

taining more than one age class. And by tallying number of trees and basal area by six species groups, I found tha t relative stocking could be estimated with the same accuracy a s i t could with the complete tree-area equation.
But trouble developed when I tried to use this method in the woods, I found tha t I would have to carry a large n u m b e ~ of charts to cover the many possible species combinations, or carry one of the more sophisticated pocket calculators to solve the complex equation for each combina- tion. Also, this method required a detailed marking inventory and complicated calculations to determine residual stocking. In short, the method was accurate, but too unwieldy; I found th? two species groups were the most I could handle without difficulty.
So I tried many combinations to find the two species groups tha t gave results tha t were the most consistent with the full tree-area equation; these two groyps proved to be one containing black cherry, white ash, and yellow-poplar, and another containing all other species.
STOCKING GUIDE FOR ALLEGHENY HARDWOODS The overall stocfiing regression for Allegheny
hardwoods produced the following equation (for 106 plots):
Basal area per acre for 100 percent stock- ing = 272.5248 - 59.7549 (Loglo of number of trees per acre) + 0.7032 (percentage of total basal area in the stand contributed by black cherry, white ash , and yellow- pop1 ar) . This regression has a coefficient of determina-
tion (R2) of 67.4 percent, and a standard error of estimate of 13.77 square feet of basal area, or about 11 percent of the mean basal area of the plots. This standard error is a little more than twice that for the tree-area equation. I believe tha t most of the additional error resulted
"n exploring the shape of the re area per acre on number of trees per transformations gave better correlations than the straight line: Log X , Log Y, and the quadratic. The quadratic g a w the best correlation (by a very small amount) within the range of the data; however, when the curves were ex- trapolated beyond the limits of the data, the quadratic and Log Y forms roduced entirely unrealistic estimates (as, of course, does t i e straight line). The Log X estimates looked very reasonable so I used Log X (Log,, of number of trees per acre).
because the differences in s tand s t ructure and corn position cannot be accounted for adequate1 when only two species groups a r e used.
Although the degree of accuracy of this regression may be adequate for field use, or a t least better than guessing, i t seemed desirable to improve it if possible. Also stocking percent- ages tha t were calculated for individual s tands with this equation differed considerably from the stocking percentages calculated from the tree-area equation a t the extremes of diameter and composition.
So I stratified the data by using the percent- age composition and calculated new regressions for each 10-percent change in composition from 0 to 40 percent; I used a n additional regression for curves from 50 to 80 percent. These new regressions made an excellent progression, and none crossed any other within the range of t he data. The R2 (coefficient of multiple determina- tion) of these regressions is 70 percent; the stan- dard error of the estimate is 10.5 percent. I accepted the 0- and 80-percent curves as the ex- tremes, and the original regression (average composition of 40 percent) as the mean, and dis- tributed the curves of 10, 20, 30, 50, 60, and 70 percent progressively throughout the range. Figures 1A and 1 B are versions of this char t tha t have been condensed for easier use in t h e field.
As the chart shows, when a fully stocked s tand grows older, overcrowding causes mortali- t y (mostly among the smaller trees) and reduces the number of trees per acre. This, combined with continued growth of the remaining trees, increases the average stand diameter. Because larger trees use growing space more efficiently than smaller trees, the total basal area of t h e s tand continues to increase toward the max- imum tha t the site can carry. This maximum depends on the sizes of the trees in the stand, which a r e reflected by t h e average s t a n d diameter.
The A-level curves on figure 1 show t h e average maximum basal areas per acre tha t will be attained by undisturbed Allegheny hardwood stands with given average diameters when various percentages of the basal areas a re con- tained in black cherry, white ash, and yellow- poplar. If the percentage composition does not change, successive plots of the basal area- number of trees relationship for a heavily stocked stand should fall progressively to the left

along the appropriate A-level curve on the chart. Usually, though, the cherry-ash-poplar group grows faster than the birch-beech-sugar maple component, so the percentage composition tends t o increase; a n d t h e s t a n d t e n d s t o be represented by a higher curve.
These curves should be t h o u g h t of a s averages. Many times thg plot of a s tand will fall somewhat above or below the appropriate curve, and the stand might still be considered perfectly "normal". One reason for this, of course, is the normal biological variation, and the statistical error that is inherent in the curves-the standard errors of the estimate are around 10 percent. Another reason is the varia- tion i n growing conditions from year t o year. For kxample, if soil moisture in the summer is a limiting factor for growth, a period of wetter- than-average growing seasons will permit stock- ing to increase above the A level. Conversely, a period of drought years will increase mortality and cause the stand to drop below the A level. This became very apparent when I was examin- ing stand records spanning the drought of the early 1930's. But whether i t is currently above or below A level, the long term trend of the stand should be toward tha t level.
The B-level curves on figure 1 are not based on field data; they are my preliminary estimate (guess, really) of the minimum stocking that is needed for full utilization of the site.
Gingrich (1 967) calculated a minimum stock- ing level for the oaks from crown measurements of open-grown trees. His B level is the stocking a t which the sum of the cross-sectional areas of the oak crowns would just equal the ground sur- face area of the stand if each tree had its max- imum crown size. His B-level basal areas range from 55 to 58 percent of the A levels. The B level that is recommended for northern hardwoods in New England ranges from about 54 to 69 per- cent of the A level (Leak et aE. 1969). In the United States generally, the recommended basal area to be left after thinning ranges from about 50 to '70 percent of the maximum tha t is en- countered. For maximum wood production, European foresters recommend slight1 y higher "B levels", ranging from about 60 to 80 percent of maximum. The upper part of this range is recommended primarily for the more intolerant species (especially Scotch pine) or for stands in the latter par t of relatively long (by U.S. stan- dards) rotations (Assmtxr?rh 1970; Braathe 195T).
I have not made a study of crown diamters of Allegheny hardwood species, and growth studies are too recent to indicate the stocking level that produces the maximum net basal-area growth. From general observation I recommend 60 percent of A-level stocking as a n estimated average B level tha t should be adequate until data are available from which to derive a better one. Thus the B levels (dashed curves) on the stocking chart (fig. 1) are calculated a t 60 per- cent of the A levels for s tands of the same average diameter.
THE STAND INVENTORY Use of the stocking chart requires the
following stand data: (1) the total basal area per acre; (2) the percentage of that basal area that is contributed by black cherry, white ash, and yellow-poplar (hereafter referred to as percent CAPS); and (3) the average s t a ~ d diauletet. (diameter of the tree of mean basal area). These can be determined from da ta t ha t a re required during a sample cruise of the stand.
The following procedure is not the only one that can be used, but of those that I in- vestigated, this procedure was the simplest and most convenient one tha t still provided accept- able accuracy.
Planning the Sample Cruise
The first step is t o determine the s tand boundaries; they should be set primarily to keep the stand as uniform a s possible in composition, age, site quality, and structure. But some con- sideration also should be given to ease of future management. If the boundaries coincide with easily recognized features of the terrain, field work will be more efficient, records will be more reliable, and there will be less danger tha t the stand boundaries will be "lost" in the ad- ministrative records of stand treatments. I t i s often impossible to satisfy both objectives, but a small compromise will of ten simplify ad- ministration without causing a great increase in variability.
The optimum size of the s tand will vary with many factors, especially the size of the property, the objectives of the owner, the ease of access, the nature of markets, and the need to protect o r improve other resources-for example, wildlife habitat. I t will often prove convenient if the

STOCKING GUIDE FOR ALLEGHENY HARDWOODS
FOR TREES 6 TO 15 INCHES IN DIAMETER
DlAMETER OF TREE OF A VERAGE BASAL AREA - INCHES
TREES PER ACRE
Figws 1A.-Stocking E(&& for Allegheny hardwood& fur tree8 6 to 15 inches in diametet.

STOCKfNG GUIDE FOR ALLEGHENY HARDWOODS
FOR TREES 3 TO 18 INCHES IN DIAMETER
DlAMETER OF TREE OF AVERAGE BASAL AREA - /NCWES
TREES PER ACRE - NUBDRED
Figure 1B.-Stocking guide for Allegheny hardwoods, fer trees 3 to 10 Inches in diameter.

stand is large enough to provide a reasonably ef- ficient field operation by itself, but not so large that variability is increased greatly. Generally I would not consider a stand tha t is smaller than 3 to 5 acres a s a separate entity; and stands this small may be difficult to regenerate if there a re many deer around. A t the other extreme, I would rare1 y accept a stafid as large as 50 acres.
The shape of the stand can also be an impor- t an t factor when it is time to regenerate it. Deer seem to hit a long narrow stand harder than they hit a shorter, wider stand of equal area (unless the area is so small tha t the deer eliminate reproduction regardless of the stand's shape).
A4ter the stand boundaries have been deter- mined, the next s tep is to lay out a travel route for the sampling. Usually, several trips should be planned through the stand, and on parallel lines that a re spaced several chains apart . Sam- ple points should be spaced along the lines mechanically. Of course, the lines should be laid out t o provide reasonable coverage of the whole stand, not just its most accessible areas.
The number of lines, the spacing between them, and the spacing between sample points must be set so t ha t there are enough samples to provide accurate averages for the stand. Ex- perience in previously unthinned 50-year-old stands indicates that 10 to 12 sample points a re required to reduce the standard error of the mean basal area to 10 percent or less. Older stands, especially those that have been previous- ly thinned, require more sample points.
I use 10 sample points a s the absolute minimum for a stand, and then only if the stand is small (less than 15 acres) and if the basal area and structure are nearly uniform from point to point. In stands tha t are larger than 15 acres, I usually shoot for one sample point per 1 1/2 to 2 1/2 acres, and plan on a maximum of 20 points.
The Basal-Area Tally
At each sample point a wedge prism is used to obtain a dot tally of basal area per acre (trees 1.0 inch in dbh or larger), by two species groups t CAPS and other) and by four major size cIasses (saplings, poles, small and large sawtimber ). When the sample cruise is completed the dot count is totaled and converted to a per-acre basis (fig. 2A).
I t is necessary to tally the basal area by the
two species groups to determine the percentage composition: basal area in CLiZPs divided by total basal area equals the yer=ceuif CAPS (fig. 2A).
I t is not necessary to break down the tally by size class to determine present stocking, but this breakdotvn provides a good, quick picture of stand structure. I t also is useful later in guiding the s tand prescription and in distributing the cut among the size classes. Because the size classes are broad, and because our objective is primarily to provide a picture of average s tand structure, i t is not necessary t o measure the diameters of the sample trees for this tally; visual estimates are satisfactory.
Diameter ranges for the size classes (fig. 2A) may be changed as desired, though they should be consistent throughout a property. Also i t may be helpful to identify certain tree classes on the tally-for example, using x's instead of dots to designate culls, or wolf trees, o r misshapen members of sprout clumps.
In tallying the basal area, one precaution is especially important: Don't overlook the small trees. The stocking guide is based on all trees tha t are 1.0 inch in dbh or larger; if the small trees are overlooked or deliberately ignored, the guide will give you a wrong answer.
The Tree Count
We cannot determine the average stand diameter directly from the basal-area da ta tha t was obtained on the cruise, and it rrr2u.t ?tot bc~ estinzzated visually. However, there is a direct mathematical relationship between the average diameter and the number of trees per acre for a given basal area. During a cruise, we can obtain a good estimate of basal area per acre by using a wedge prism. Therefore, if we count the trees on enough sample plots to obtain a good estimate of the number of trees per acre, we can calculate the average stand diameter; or we can deter- mine i t accurately enough directly from the stocking chart.
The easiest method that I have found for determining the number of trees per acre is counting the trees on 1/20-acre circular plots (radii of 26 113 feet) that a r e centered on the sample points used for the basal-area tally. I place a marker a t the center of a plot, go out 26 113 feet from tha t point, and walk around the circumference, counting the trees (live trees on- ly) as the line between me and the center of the

D I S T R I B U T I O N OF T H E C U T L A R G E S A W T S M A L L S A W T P O L E S S A P L I N G S C A P S O t h e r C A P S I O t h e r C A P S I O t h e r C A P S 1 O t h e r
S T A N D C A L C U L A T I O N S
Figure 2A.-A sample of summary stand tally sheet after cruise.

Figure 2B.-Diameter distribution in sample stand used in figuse 2A.
a BLACK CHERRY - YELLOW - POPLAR
a R E D MAPLE - BIRCH
a SUGAR MAPLE - BEECH
DIAMETER CLASS - INCHES
plot passes them. After a little experience (especially learning to mark your starting point) this procedure can be completed for each plot in about 1 1/2 to 2 minutes.
The wedge prism also makes a handy rangefinder for keeping yourself on the plot cir- cumference (Nylttnd ar6d Renaele 1975). At 26 1/3 feet, a 10-factor prism will exactly subtend a target of 9.57 inches. The target can be a 9.57'- inch length of stove pipe fastened to a pole, or painted rings of different colors spaced 9.57 in- ches apar t on the pole. The former is a little easier to see; the latter is handier to carry in the woods. After a little experience the prism is needed only two or three times per plot for check ing b o r d e r l i n e t r e e s . T h e r e i s o n e precaution: calibrate your prism; not all prisms have the exact factor they're supposed to have.
As with the basal-area tally, it is important to count all trees tha t are 1.0 inch in dbh or larger because these are the tree sizes that the stocking guide is based on. Failure to count the small trees will guarantee a n error. "Trees" means all
forest trees including hophornbeam, striped maple, and American hornbeam, but not shrubs such a s witchhazel.
Although it is not necessary for determining total stocking, keeping the tree count separately for each of the two species groups will be very helpful later.
Some foresters like to convert the basal-area tally t o a tree count. If we know the diameter of each sample tree tha t is picked up through the wedge prism, we can make a direct estimate of the number of trees per acre through conversion factors that are unique to the diameters. But I have found that this method is unsatisfactory for several reasons:
First , the number-of-trees factor varies wide- ly among the diameters, so visual estimates of diameters are not accurate enough; measuring the diameters will provide a better estimate but this takes more time than counting the trees on a 1120-acre plot.
Second, even if the diameters of the trees a r e measured, this method produces a much smaller

sample of the trees under 9.6 inches than is ob- tained by counting the trees on the lf2O-acre plot. For example, to pick up a 1.0-inch tree as a sample tree through the 10-factor wedge prism means that that tree must be within 2.75 feet of the sample point. In effect, 1-inch trees are be- ing sampled on a circular plot that has an area of only about 1/1800 acye. An average of 1 sam- ple point per 2 acres of stand means a sampling intensity of about 31100 of 1 percent for 1-inch trees, and about 1/10 of 1 percent for 2-inch trees. If the same number of plots a re 1120-acre in size, we can obtain a sample of 2 1/2 percent for all diameter classes.
A third factor of a practical nature further reduces the prospects of correctly sampling s&ll trees with a wedge prism. Forest technicians (and even most foresters) are smart enough not to walk through brush if they can avoid it. Therefore it is a rare sample point that ends up in a clump of saplings, and, consequent- ly, very few lsinch trees are ever found within 2.75 feet of a plot center (or 2-inch trees within 5.5 feet).
In a typical 50-year-old unmanaged Allegheny hardwood stand, there will be between 700 and 900 trees per acre that are smaller than 9.6 in- ches, and only abGut 50 to 80 trees per acre that are larger. With an equal number of samples, the small trees are sampled much more inten- sively on the fixed 11'20-acre plots than they are by the wedge prism; and with the relatively small number of samples commonly used for stand inventory, fixed plots provide a much better estimate of the total number of trees per acre.
When the cruise is completed, the number of trees is totaled for all sample plots and con- verted to a per-acre basis (fig. 2A).
Determining Average Stand Diameter
If your pocket calculator has a square-root key, it is now easy to compute the average stand diameter: Basal area per acre divided by number of trees per acre equals the average basal area per tree. Multiply this number by 183.35 (a constant that converts square feet of basal area to the square of a diameter in inches) and take the square root. The result is the average stand diameter (diameter of the tree of average basal area).
The average stand diameter also can be deter-
mined directly from the stocking chart (fig. 3). F o l l o ~ upward along the line tha t denotes t he number of trees per acre until this line in- tersects the horizontal line that signifies t he particular basal area per acre. Note where this point falls with reference to the adjacent slant- ing lines that designate average stand diameter. The average stand diameter can usually be es- timated this way within 1/10 inch, which is ac- curate enough.
EVALUATING STOCKING AND STAND CONDITION
The sample cruise has yielded the data-basal area, p e r c e ~ t CAPS, and average stand diameter-needed to determine relative stocking in the stand. The first step in this process is to determine the basal area tha t would be expected in the stand if it were 100 per- cent stocked. On the stocking chart (fig. 4) follow down along a line (real or imaginary) that represents the average stand diameter until the line intersects an A-level curve (real or im- aginary) that corresponds to the perceri t CA Ps in the sample stand. Read the basal area for this point. This is the basal area that a stand of tha t average diameter and with that percey~t CAPS would usually have if it were a t the average maximum stocking found in nature (100 percent). If we divide this basal area into the basal area that was determined for the sample stand, and multiply by 100, we will obtain the percent stocking of the sample stand.
By using the summary sheet that results from the stand inventory, we can now make a n objective evaluation of stand condition. If we use the stand described on the summary sheet (fig. 2A) a s an example, a glance a t the sheet will show us that the stand is obviously immature: the average diameter is only 5.0 inches, and there are only 2 square feet of basal area per acre in large sawtimber. It is apparent that the bulk of the basal area is split between the small sawtimber and poletimber sizes, so these are the size classes that we should look to to provide the final crop. We can also see that the stand is very well stocked; in fact it is near the maximum stocking to be expected, so natural mortality must be heavy and net growth relatively low. We can see that half the basal area is in the cherr y-ah-yellow-poplar group, and that this group, which is mostly small sawtimber, is run-


Figure 4.-A-level stocking percent for stand determined from stocking guide.
TREES PER ACRE - HUlrfDREDS

ning away from the other species. which a r e mostly poles. If we failed to observe it during the inventory, we can tell from the large number of trees per acre, and the sizeable basal area in the sapling class, tha t there must be a large number of small trees in the s tand (probably 400 to 600 per acre in the 1- to 3-inch range).
All of these factors together provide a typical picture of a middle-aged, even-aged, heavily- stocked stand of excellent composition tha t is just in the process of growing from poletimber into sawtimber. In such a stand, a thinning is desirable to speed this process.
While many of these factors would be noted by a n experienced forester in a casual observa- tion, i t would be rare if he noted all of them; and casual observations a re notoriously imprecise in determining quantities. The information provid- ed by the summary sheet eliminates much of the subjective jud5ment and guesswork. The sum- mary also provides a record that will help sub- stantiate current decisions and permit future evaluation of stand development.
GENERAL PRINCIPLES FOR-THINNIN6
EVEN-AGED STANDS
The main goal of thinning is to develop the full yield of major products as soon a s possible. This is the big payoff for the entire rotation. Therefore each thinning should favor trees from the larger size classes that are of sufficient number and quality to provide a full yield. The bulk of the cutting must be carried out among trees from the smaller size classes, thus satisfy- ing a second goal of thinning: to use the trees tha t would die during subsequent stand develop- ment. Trees from the favored classes should be cut in only those amounts tha t are necessary to provide the desired spacing and to improve quality and composition as much as possible. So unless there is an overburden of defective large trees, the general rule is that every thinning should cause an increase in the average stand diameter, a decrease in the diameter range, and greater uniformity in the residua1 stand.
The stocking of previously unthinned natural stands will usually be near 100 percent or A level. At this level of stocking, the net growth of the stand is low. Trees in the upper crown classes may grow fairly well (though rarely a t
their maximum rate), but much of this growth is counterbalanced by mortality in the lower crown classes and in the species tha t are least able to survive this intense comwtition.
Total wood production of a s t and is about the same a t any degree of stocking between the A level and the B level. However a t A-level stock- ing, this growth is distributed among many trees. Individual growth rates a r e slow, and some of this growth is wasted on trees that will soon die. A t B-level stocking, t he growth is dis- tributed among relatively fewer trees. In- dividual growth rates a r e faster, and none of the trees will be in danger of dying from overcrowd- ing for some time. Therefore net growth (and the ra te of product development) is much better near B-level stocking. So intermediate cuttings should reduce stocking to t he B level.
No thinning should be made tha t reduces residual stocking below the B level because this would reduce the total yield and encourage the development of a heavy understory, or the inva- sion of the area by herbaceous plants.
The length of the interval between thinnings should depend on how fast stocking and mortali- ty build up. Mortality is usually insignificant until the stand reaches stocking of about 75 per- cent; then it begins to increase. Mortality rarely becomes serious until stocking reaches about 80 to 85 percent. Thus, a range of stocking of 75 t o 80 percent provides a good breaking point in deciding whether to thin. If the stand is stocked a t less than 75 percent, growth should be good and mortality should be light, and the margin above the B level may be'too small to provide a commercial cut. If stocking in the stand is more than 80 percent, growth rates will be slow, mor- tality will increase, and there should be enough basal area in the stand above the B level to make the cutting operation worthwhile. When stock- ing is between 75 and 80 percent, thinning is a matter of judgment. If the stand is readily accessible and markets are good, thin it. If con- ditions are the opposite, you can wait a few years.
Unfortunately, young s tands tend to increase in stocking more rapidly than older stands, which impIies different thinning intervals for stands of different ages. This would greatly complicate planning and administration, which are commonly based on 10- or 20-year cutting in- tervals. This problem can be partially overcome by making lighter thinnings in older stands, and

by bringing younger stands to a heavier stock- ing between thinnings.
Variations Needed for Allegheny Hardwoods
T h e foregoing pr inc ip les a r e broadly applicable to any forest type, but the Allegheny hardwoods are unique in several respects. The combination of rapid-growing, relatively short- lived intolerant species in the same stand with slower-@owing long-lived tolerants poses the problem of bringing the latter to merchantable size before all of the former have been cut or lost. The regeneration of the intolerant and in- termediate species (except a t times for birch and perhhps yellow-poplar) depends on advance reproduction (Marquis et al. 1975). But the ad- vance reproduction is short-lived; i t comes and goes. This requires that a seed source be present right up to the final harvest cut to maintain a good stocking o f ~ d v a n c e reproduction of the in- tolerant and intermediate species. If no advance reproduction of the other species is present a t the final cut, the next stand will be composed only of sugar maple or sugar maple and beech, and there will be a consequent loss of value and
- - - variety.
A second complicating factor is that stand structure and stand growth vary not only with stand age and stand density but also with the percentages of the various species in the stand. Interestingly, the combination of slow-growing tolerants in the small diameter classes and rapid-growing intolerants in the larger diameter classes creates a reverse J-shaped distribution curve that usually is considered typical of an uneven-aged stand, even though the trees in the stand may differ in age by only 2 or 3 years (fig. 2B). These factors make thinnings much more complex in these stands than they are in stands that have the bell-shaped distribution con- sidered characteristic of even-aged stands.
Growth studies are too recent to provide reliable information on growth r a t e s of Allegheny hardwood species after thinning. Early (3-year) results from thinned 50-year-old stands indicate that there is an increase of only 1 114 to 1 1/2 percent per year in stoclcing per- cent. This rate, if it continues, indicates a minimum cutting interval of about 15 years.
Finally, a number of sites seem relatively "fragile". Stands on the more poorly drained
soils seem to represent a tension zone between forest and herbaceous vegetation. Cutting that is too severe, with the high population of deer present-and especially if the cutting is fol- lowed by fire-can quickly convert a forest stand to an herbaceous field that may take a half cen- tury or more to return to trees.
The general rule that thinnings should reduce stocking to the B level is broadly applicable in Allegheny hardwoods, but there are two impor- tant exceptions. One exception is a stand that is threatened by invasion of grass, or especially ferns. A current study by Stephen Horsley s u p ports the growing evidence that these plants produce chemicals that are inimical to the es- tablishment and growth of tree seedlings. The development of a heavy herbaceous cover could seriously retard or even prevent the regenera- tion of the new stand when the present stand becomes mature. Although we do not yet know the relationship between canopy density and the rate of invasion by herbaceous plants un- derneath, it seems reasonable that the more open the overstory, the faster the invasion.
A previously unthinned stand is usually near maximum crowding, and average crown size will be small. If this stand is thinned to the B level in one operation, more growing space will be made available than the remaining trees can immediately use, and there will be an interval of several years before the crowns have expanded to fill all of the growing space. In the interim, the extra growing space will encourage the inva- sion of the herbaceous plants. Therefore, if clumps of these plants are already present (covering 10 percent or more of the ground), or if surrounding areas have a heavy cover of them, I would not reduce the timber stand below 70 per- cent stocking.
The second exception to the general rule is a stand in the last third of the rotation-say, one that is 60 or more years old. Such stands contain many large trees, and thinning to the B level will result in a wide spacing. It takes a long time for the crowns of a relatively few large trees to fill in the open spaces; in the meantime, much growth may be lost. Therefore, I usually would not reduce the stocking of a previously unthinned stand that is 60 or more years old below 70 percent-even if there is no danger of invasion by herbs-unless the thinning is essential for promoting the maximum growth of tolerant species,

Unless herbaceous plants seem to be a problem, I would not hesitate to thin a stand younger than 60 years of age to B-level (60 per- cent) stocking regardless of how densely it was stocked initially. Bole sprouting can be mini- mized in Allegheny hardwoods by selecting clean-stemmed trees to remain.
Also, a fairly heavy release is necessary to ob- tain a large growth increase in sugar maple and beech. These species grow well when they have sufficient space; but as soon as the stand becomes crowded-especially when there is a dominant canopy of intolerant species-the growth of sugar maple and beech nearly stops. By the time a heavily-stocked s tand is 35 years
black cherry typically ranges from 3 to 12 in diameter; but the largest of t he sugar
maple that started a t the same time will be only about 4 inches in diameter, and the largest beech only 3 inches (Table 1).
To bring any beech and sugar maple to merchantable s h e before the black cherry is in danger of overmaturity and decline, the tolerant species must have relatively heavy release. Otherwise an expensive Timber Stand Improve- ment (TSI) operation will be necessary after the main stand is harvested t o remove excess maple and beech saplings, and small poles. The alter- native is a n inevitable conversion of stand type to sugar maple or sugar maple-beech.
DETERMINING MINIMUM RESIDUAL STOCKING
With the principles for making intermediate cuttings in mind, the next s tep is t o determine what the residual stand should contain. There are three things tha t the prescriber must deter- mine: (1) the level of stocking desired in the residzcal stand; (2)the percer~t CAPS desired in the residual stand; and (3) the probable average diameter of the residual stand.
To illustrate, I will use the s tand that was previously outlined on the summary sheet (fig. 2). This stand is well-stocked, is less than 60 years old, and is not threatened by invasion of herbaceous plants. I t can be thinned back to B level stocking (60 percent); this figure is entered on the summary sheet (fig. 5).
There a re few data available to guide t he choice of the percent CAPS for residual stands. As a practical matter, I have found it difficult t o change t h e percerit CAPS by more t h a n 10-either way-by thinning. Tentatively, I recommend maintaining CAPs of about 50 per- cent, so I will plan to keep the perce~tt CAPS in the residual stand about the same a s it was-at 50 (fig. 5).
I t is more difficult to estimate the average diameter of the residual s tand than it is to es- t imate the percent CAPs. The change in average
Table 1.-Diameter of tree of average basal area, by species, in fully stocked, even-aged, and previously unmanaged stands of Allegheny hardwoods (in inches)
Stand Yellow- Black Pin White Red Yellow and Sugar Entire age poplar cherry cherry ash maple sweet birch maple Beech stand
(years)
Number of stands 16 97 28 23 84 79 I01 63 101 R2 (9%) 93 7 9 5 4 92 7 3 7 7 5 9 52 80
a ~ i m i t s of data indicated by lowest stand age and diameter figures in boldface.
16

B A S A L A R E A A N D T R E E T A L L Y
D I S T R I B U T I O N O F T H E C U T L A R G E SAWT. S M A L L S A W T . P O L E S S A P L I N G S r
C A P S O t h e r C A P 5 O t h e r C A P * O t h e r C A P S O t h e r C u t
B o s o l , A r e a I 1 1 1
S T A N D C A L C U L A T I O N S
Figure 5.-Sample stand tally sheet shows goails for residual stand.

diameter depends on the relative proportions of the large and small trees that are cut. In general, if I thin mostly from below in both species groups, the average stand diameter will increase. In thinning 5eyear-old stands general- ly from below, I find that I can increase the average stand diameter a t the rate of about 0.4 inch for each 10 pgrcent stocking that is re- moved. (In both older and younger stands, the amount is less-about 0.25 inch per 10 percent stocking removed).
In the sample stand, to leave 60 percent stock- ing means removing about 35 percent stocking:
35/10 X 0.4 inch = 1.4-inch increase. So I estimate the average diameter of the
residual stand to be 5.0 plus 1.4 or 6.4 inches yfig. 5).
Now I can go to the stocking chart and deter- mine the basal area per acre that I need in the residual stand.
Follow down along an imaginary line that represents ?a 6.4-inch average diameter until i t intersects a B-level curve (in this case an im- aginary dashed line) that represents 50 percent CAPs (fig. 6). Read the basal area for that point (85 square feet), and enter i t on the summary sheet (fig. 7). This is the minimum basal area per acre needed for B-level stocking in a stand that has an average diameter of 6.4 inches and that contains 50 percent CAPs.
From this point drop straight down on the stocking chart to determine the number of trees per acre that should remain-390 (fig. 6). This last step is not really necessary, but it will be useful later.
Now it is possible to determine the basal area per acre that is needed in each species group. With 50 percent CAPs half of the 85 square feet should be in CAPs, the rest in the "other" species (fig. 7). (I rounded them off for easier figuring).
The cut stand can be determined by subtract- ing the I-esidual stand from the original (fig. 8). The cut should amount to 38 square feet per acre: 19 square feet of CAPs, 19 square feet of "others".
If other than 60 percent stocking is desired in the residual stand, the above procedure must be modified. For example, if 70 percent stocking is desired in the residual stand, the cut will be lighter and the average stand diameter must be reestimated:
25/10 X 0.4 inch = 1 .O-inch increase.
This increase added to the original stand diameter equals an estimated average diameter of 6.0 inches for the residual stand.
On the stocking chart follow down along the 6.0-inch average diameter line but find the basal area by using the A-level curves-137.5 square feet (fig. 9). This is the basal area that a 6.0-inch stand with 50 percent CAPs would have if it were 100 percent stocked. For this stand, 70 per- cent stocking equals 70 percent of 137.5, or 96 square feet.
The number of trees that should remain per acre can be found by following on down the 6.0- inch average diameter line until i t intersects a line that represents 96 square feet, and then dropping down vertically as before (490 trees). The residual stand and the cut stand can now be determined as before. (Residual stand is 96 square feet: 48 square feet in CAPs, 48 square feet in others"; cut stand is 410 trees and 27 square feet: 13.5 square feet in CAPs, 13.5 square feet in "others".)
DISTRIBUTING THE CUT Now you come to the fun part-deciding how
the basal area to be cut in the stand will be dis- tributed among the size classes.
As figure 8 shows, we will be cutting a little less than one-third of the basal area, but nearly two-thirds of the trees. (This is the reason for finding the number of trees per acre, as well as the basal area, for the residual stand-it shows the relative number of cut and leave trees.) Ob- viously, we must cut a large number of small trees to increase the average stand diameter to 6.4 inches.
We know also that we must cut generally from below in both species groups. Each species group has an average diameter of its own, and we need to remove more basal area from below those average diameters than from above them. As a general rule, I try to take about two-thirds of the basal area from below, about one-third from above the average diameter, in each species group. Now, if we just knew the average diameters of each group. . .
If the tree counts were kept separate1 y for the two species groups, the average diameter of each group can be calculated or determined from the chart, as was shown earlier for the en- tire stand. (Don't try to average the average diameters of the two groups to get the stand average diameter, though; it doesn't work.)
If the tree counts were not kept separately, timber, but if I find three sawtimber that a re there are still several factors to guide us. Table 1 together in a sprout clump, I'll probably mark shows the average diameter, by species, for one of them. So I'll modify the marking guides even-aged stands of Allegheny hardwoods; from as I go along, but I will keep the relative propor- table 1 we can estimate that 54-year-old black tions in mind and use them to guide my marking cherry will average about 11 inches in diameter.
Another way to estimate this quadratic mean diameter is to go back 40 the summary sheet (fig. 9). The stand contains 62 square feet per acre in CAPs, distributed as 2 feet in saplings, 25 feet in poles, 33 feet in small sawtimber, and 2 feet in large sawtimber. The midpoint of this basal area-31 square feet-falls in the lower part of the small sawtimber class, about 12 in- ches. On the average, the midpoint of the basal aree will be about 1 inch larger than the average diameter. So again we can estimate a n average diameter for the CAPs a t about 11 inches.
So in distributing the CAP cut, I will plan to remove about two thirds of the cut basal area-say, 13 square feet-from the sapling and poletimber classes, and the remaining 6 square feet from the sawtimber.
CAP saplings in a 54-year-old stand have no future, so I will plan to remove all of them (2 square feet per acre). Eleven square feet will be removed in CAP-p-oles, and 6 square feet will come from small CAP sawtimber (fig. 10).
Now I can compare the CAP cut, by size class, with what is present in those size classes to determine the relative proportions. I must cut all of the CAP saplings, a little less than half of the CAP poles, and about one out of five small sawtim ber.
I'll follow the same principles in distributing the "other" cut. The "other" group has 61 square feet of basal area in 804 trees, which signifies an average diameter of 3.7 inches. So I'll plan to take two-thirds of the cut basal area-about 13 square feet-from the "other" saplings, saving 4- and 5-inch trees where there's a choice. I'll assign the remaining 6 square feet to the "other" poles, figuring on cutting about one out of six.
The above proportions make up only a general guide t h a t will be modified a s occasion demands. For example, I do not intend to mark any CAP large sawtimber, but if I run into a wolf tree, or a tree badly misshapen, or one bad- ly damaged by wind or Iightning, I'll not hesitate to mark it. Also, I intend to cut all the CAP saplings, but if I find one standing alone in what would otherwise be a hole in the stand, 1'11 leave it. I want to save all the "other" saw-
throughout the bulk of the stand where there are no overriding factors.
There is one other important factor t o remember during marking: The stand summary provides a good picture of the average stocking condition throughout the present stand. And through our stand analysis procedure, we should now have a good mental picture (after a little experience learning what different stock- ing percents look like in the woods) of what the residual stand should look like after cutting. However the present stand is not average everywhere; it will contain both dense and sparse patches. Since a major goal of thinning is to make the residual stand more uniform than the original, it is up to the marker to recognize these denser and lighter patches as he comes t o them, and make his marking heavier or lighter, accordingly. This may sound difficult, but it is not; all you have to do is keep looking at the stand as well a s a t the individual trees.
Is the Cut Practical ?
The prospective cut as determined above can be considered the ideal, In this stand it might amount to 400 to 600 board feet and per haps 5 or 6 cords of pulpwood per acre. Where markets and access are good, it would probably just make a commercial thinning; with poor markets and access it probably would not. Even with a commercial thinning, a TSI operation would have to follow to remove 15 to 16 square feet of saplings.
At this point a compromise may be possible, perhaps by thinning a little more heavily in t he sawtimber and a little less in the saplings and poles. If this is necessary in order to make the difference between a commercial thinning or no thinning, I would certainly not say that it is wrong.
But there a re two factors to remember. First, you will not get the increase in average stand diameter that was estimated; so it will be necessary to go back and calculate new residual and cut basal areas. Second, if this process is carried too far-so that the final crop is reduced in value o r i s delayed for one o r more

BA
SA
L A
RE
A P
ER
AC
RE
- S
QU
AR
E F
EW

S T A N D C A L C U L A T I O N S
D I S T R I B U T I O N OF T H E C U T
Figure ?.-Sample stand tally sheet shows basal area and number of trees per acre desired in residual stand.
C u t B o s o l A r e a
L A R G E S A W ? ' . S M A L L S A W T . P O L E S S A P L I N G S n
C A P S O t h e r C A P S ( O t h e r C A P S 1 O t h s r C A P S ( O t h e r

S T A N D C A L C U L A T I O N S
D I S T R I B U T I O N O F T H E C U T
Figure 8.-Sample stand tally sheet shows number of trees per acre in cut stand and basal-area cut per acre by species group.
C u t B o s o l
A reo
L A R G E S A W T .
C A P S ( O t h e r
S M A L L S A W ? ' . C A P S O t h e r
P O L E S C A P S
( S A P L I N G S o t h e r ( C A P S o t h e r
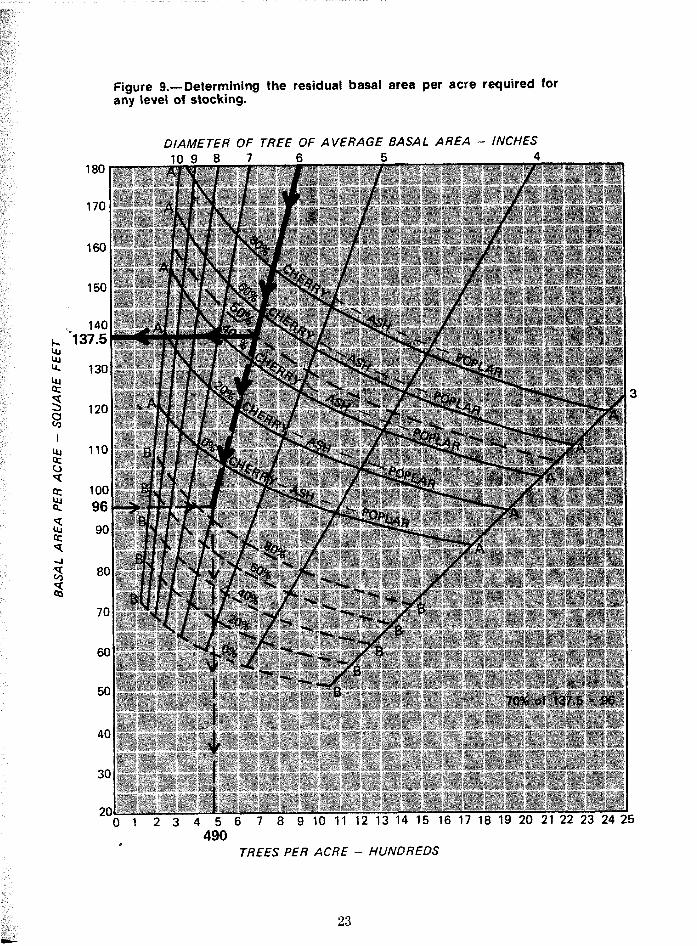
Figure 9.-Determining the residual basal area per acre required for any level of stocking.
DIAMETER OF TREE OF AVERAGE BASAL AREA - INCHES
490 * TREES PER ACRE - HUNDREDS

S T A N D C A L C U L A T I O N S
\ D I S T R I B U T I O ~ O F T H E C J ~ T
Figue 10.--Sample stand tally sheet shows distribution of cut, by size class and species group, required to leave desired residual stand.
C u t B o s a l , A r e o
Y
L A R G E S A W T .
~.. C A P S O t h e r
S ~ A L L S A W T .
O t h e r
'
-
\ P O L E S \ S A P L I N G S
C ~ P L C ~ P S O t h e r
&" O t h e r
13

decades-it becomes not a thinning but a highgrading. In that case you should be aware of this difference and a t least use correct ter- minology.
USE OF THE GUICIE IN SELECTION CUTTING
The stocking guide is based on the principle of allocating growing space to the trees in a stand according to size. If every tree in the stand is allotted sufficient space to live and grow, i t should make little difference to the tree whether it grows in an even-aged or an uneven-aged stand (except, of course, that the lack of shade tolerance prevents small CAPs from developing or sarviving in either one). Therefore the stock- ing guide should be as useful for controlling selection cutting as it is for controlling even-age thinnings.
The same tally form and procedure may be used; the only hifferences are in planning the residual stand and distributing the cut.
Selection cutting is designed to maintain a specified diameter distribution in the residual stand, and various distributions are possible. The classic and-more commonly used dis- tributions are based on the ratio between the numbers of trees in successive diameter classes. The ratio has been designated a s the Q factor and it usually ranges from 1.3 to 1.6.
When a Q and the largest diameter to be grown have been chosen, the number of trees and the basal area per acre can be determined for each diameter class. Then it's a simple matter to calculate by size class the average stand diameter and the basal area that a re need- ed for any stacking percent. Table 2 lists a number of possible basal area goals by size class for Q's of 1.3 to 1.6 for several percent CAPS, and a t two levels of stocking.* The maximum tree size in Table 2 is 24 inches.
To use the guide for selection cutting, you need only select an appropriate basal area goal from Table 2 and list it as the residual stand on
3Traditionally, Q factors have been used to show the ratio of trees by successive 2-inch diameter classes, and no trees smaller than 5 inches have been considered. This seems like a slop y way of doing business, so in preparing Table 2 I used t i e square root of Q to calculate numbers of trees by 1- inch diameter class, and included all trees down to 1 inch in diameter so that the basal area goals would conform to the stocking chart.
the stand inventory sheet. In using the same stand that was used in previous examples, I selected a basal-area goal for a residual stocking of 60 percent with 50 percent CAPs and a Q of 1.5 (fig. 11). (Note that the Q selected deter- mines the average diameter for the residual stand.)
The cut stand is determined by subtraction, a s before, and a decision is made a s to how the cut will be distributed. Because of the shortage of large sawtimber in the stand, it will be desirable to save a s much sawtimber a s possible, and some excess poles, to make up the deficit.
The distribution of the cut in figure 11 is a lit- tle unrealistic; some sawtimber will undoubted- ly have to be removed because of defect, risk, poor form, or spacing. But distributing the cut as shown is the closest we can come to attaining the selection distribution in this cutting cycle without reducing yield.
It would have helped if I had selected a higher Q: the higher the Q the more small trees are re- quired in the distribution; also the higher the Q, the smaller the average stand diameter-so the heavier the cut could be and the more of it that could be assigned to the poletimber and saw- timber classes.
Within a few cuts, of course, the percent CAPS will decline and the stand will be con- verted to sugar maple or sugar maple-beech. However the procedure provides a good picture of how the cut must be distributed to work toward a selection-cutting goal. And a t any time it should lead to the best growth that the stand is capable of under the selection-cutting system.
PRECAUTIONS Reg ion of Applicabi I ity
Although this guide was developed from sam- ple stands in a relatively small four-county area in northwestern Pennsylvania, I arn hopeful that it will be applicable outside this area. The guide seemed to perform well in three areas in New Yirk State; that is, estimates of original and residual stocking obtained from the guide conformed to visual estimates, and there were no obvious discrepancies. Also, the A level for 0 percent CAPs closely parallels the A level developed for northern hardwoods in New England (Leak, S o l o ~ ~ o n , and Filip 1969). The latter shows slightly lower basal areas, but this

Figure 11.-Sample stand tally sheet shows distribution of cut by size class fat setection cutting.
B A S A L A R E A A N D T R E E T A L L Y
NEEID .' 30 25- 10
D I S T R I B U T I O N OF T H E C U T f
C u t B a s a l
L A R G E S A W T 11 S M A L L S A W T .
J , A r e a
C A P S P O L E S I( S A P L I N G S
S T A N D C A L C U L A T I O N S
C A P . I O t h e r O t h e r 1 C A P S
_l L.L6 C A P 5 O t h e r '
2
O t h e r
1-2 d d.

Table 2.-Basal-area goals for selection cutting of Allegheny hardwoods
Diameter class (inches) Aver age
Qfactor stand CAPS Total diameter 1-5 6-10 11-16 l 7 +
Inches % ------------- ft2 / acre me--------
RESIDUAL STOCKING AT 60 PERCENT
RESIDUAL STOCKING AT 70 PERCENT
can be explained in part because it does not in- clude all of the saplings that are covered in the g u i d e f o r t h e A l l e g h e n y h a r d w o o d s . Nevertheless, if the Allegheny guide is used out- side the area of its origin, caution and watch- fulness are needed.
with "others". This doesn't necessarily mean that ash and poplar have the same requirements for growing space that black cherry has-only that their requirements seem closer to cherry than to the other speeies. Therefore this guide should be applied cautiously in stands where CAPs are mostly white ash or yellow-poplar.
The same caution applies t o stands with a high percentage of conifers. Hemlock, spruce, and other conifers grow in denser stands than cherry; this indicates that they require less growing space a t a given diameter. If the guide is used in stands that contain a high proportion of hemlock (10 percent or more), the relative stocking will be overestimated.
Stands that have a large amount of red maple also pose a problem. Using the coefficients ob- tained from the tree-area equation, I plotted the
Species Composition The sample stands that I used had a composi-
tion that was fairly typical. Sugar maple, black cherry, and beech were the most common species; red maple and birch ranked next. The stands contained relatively little white ash, yellow-poplar, hemlock, or other species. In fact, there were too few of these trees to treat the speeies individually in the tree-area equation. My best results were obtained after I lumped ash and poplar with black cherry, and hemlock

Figure 12.-Growing-space allocations for five species groups.
DIAMETER CLASS (INCHES)

growing-space requirements for the five main species groups. The curves for three of them- beech, sugar maple, and the birches-were very similar (fig. 12); the curve for CAPS was much lower. The curve for red maple fell almost ex- actly halfway between, so red maple apparent- ly requires more space than the CAPs, but less than beech, birch, and sggar maple.
Ideally, then, it would be desirable to use three species groups rather than two, but this makes the procedure much more complicated. And I don't think the extra precision is worth the effort.
I checked a number of stands with widely different percentages of red maple; I used both the stocking guide and the tree-area equation. Stocking percents were similar for stands that contained up to about 20 percent red maple. (The composition of red maple averaged 15 per- cent in the 106$sample stands.) In stands that had more than 20 percent red maple, the stock- ing guide tended to overestimate the stocking percent. But there seems to be a relatively sim- ple correction: If the stand contains more than 20 percent red maple, calculate the B level the regular way; thenincrease it by 1 square foot for every 10 percent of red maple. For example, if the B level is a t the 90-square-feet level, and the stand is 40 percent red maple, increase the B level to 94 square feet.
Field Checks on Marking
For either a selection cut or an even-age thin- ning I strongly recommend that, after marking and before cutting, you make a new stand inven- tory of the prospective residual stand-at least for the first few stands. If there a re serious dis- crepancies between the planned and the actual stand, you can see what went wrong and correct the marking.
I also recommend that after cutting you make additional checks of stocking. In a short time you will develop the ability t o judge relative stocking by eye, which is a great help in mark- ing. After some experience and follow-up checking, I found that I could mark a stand to leave a certain percent stocking and usually be within 5 percent. I always make a stand inven- tory first, and I continue to check myself every chance I get, but it is easier to estimate stocking percent than basal area.
Be Sure to Include the Small Trees
I t is essential that the understory trees (all saplings 1.0 inch in dbh and larger) be included when using the guide. Failing to do so will result in overestimating stand diameter and un- derestimating stocking. The B level will then be too high; the amount available for cutting will be reduced; and the real residual stocking will be higher than intended (table 3).
Table 3.-Effect of excluding smaller trees from basal-area tally on differences in CAPS, diameter, and stocking in residual stand, basal area of permitted cut, and in estimated and actual residual stands
Minimum dbh included (inches)
Item 1.0 1.6 2.6 4.6
Ay urent yaranzetws oz)nginol stand
Percent CAPs Average stand diameter (inches) 4.9 5.5 6.7 8.4 Stocking percent 101 96 85 68
Per?rti t ted eu t Basal area (ft2/acre)
Estim uted ~esidual stand Percent CAPS 50 50 50 50 Average stand diameter (inches) 6.5 7.0 7.7 8.7 Stocking percent 60 60 60 60
Actual residual stand Percent CAPS 50 49 4 7 41 Average stand diameter (inches) 6.5 5.5 4.8 4.7 Stocking percent 60 67 7 6 93

LITERATURE CITED
Assmann, Ernst . 1970. The principles of forest yield study. Engl. ed. Pergamon Press, New York. 506 p.
Braathe, Peder. 1957. Thinnings in even-aged stands: a summary of European literature. Fac. For. Cniv. New Brunsurick, Fredericton. 92 p.
Chisman, H. H., and F. X. Schumacher. 1940. On the tree-area ratio and certain of its applications. J . For. 38:311-317.
Frank, Robert M . , and John C. Bjorkbom. 1973. A silvicultural guide for spruce-fir in the Northeast. USDA For. Serv. Gen. Tech. Rep. NE-6. 29 p.
Gingrich, Samuel R. 1967. Measuring and evaluating stocking and stand density in upland hardwood forests in the Central SQtes. For. Sci. 13(1):38-53.
Leak, William B., Dale S. Solomon, and Stanley M . Filip. 1969. A silvicultural guide for northern hardwoods in the Northeast. USDA For. Serv. Res. Pap. NE-143. 34 p.
Marquis, David A., Ted J . Grisez, John C. Bjorkbom, and Benjamin A. Roach.
1975. Interim guide to regeneration of Allegheny hardwoods. USDA For. Serv. Gen. Tech. Rep. NE-19. 14 P.
Marquis, David A., Dale S. Solomon, and John C. Bjorkbom. 1969. A silvicultural guide for paper birch in the Northeast. USDA For. Serv. Res. Pap. NE-130. 47 p.
Nyland, Ralph D., and Kermit E. Remele. 1975. Prism measures distance for plot boundaries. Appi. For. Res. Inst. Res. Note 17. State Uniir. N. Y., Syracuse. 4 p.
Philbrook, James S., James P. Barrett, and William B. Leak. 1972. A stocking guide for eastern white pine. USDA For. Serv. Res. Note NE-168. 3 p.
* U.S. GOVERNMENT PRINTING OFFICE: 1977-703-078/39