Embed Size (px)
Citation preview
www.elsevier.com/locate/patrec
Pattern Recognition Letters 27 (2006) 1744–1754
A straight line detection using principal component analysis
Yun-Seok Lee, Han-Suh Koo, Chang-Sung Jeong *
Department of Electronics Engineering, Korea University, Anam-Dong, Seongbuk-Gu, Seoul, Republic of Korea
Received 16 August 2005; received in revised form 30 March 2006Available online 22 June 2006
Communicated by G. Sanniti di Baja
Abstract
A straight line detection algorithm is presented. The algorithm separates row and column edges from edge image using their primitiveshapes. The edges are labeled, and the principal component analysis (PCA) is performed for each labeled edges. With the principal com-ponents, the algorithm detects straight lines and their orientations, which is useful for various intensive applications. Our algorithm over-comes the disadvantages of Hough transform (HT) and other algorithms, i.e. unknown grouping of collinear lines, complexity and localambiguities. The experimental results show the efficiency of our algorithm.� 2006 Elsevier B.V. All rights reserved.
Keywords: Straight line detection; Principal component analysis (PCA); Line descriptor; Edge image
1. Introduction
Straight line detection is a fundamental field in com-puter vision, e.g. vanishing point detection, parallel linedetection and line matching across views (Lutton et al.,1994; Schmid and Zisserman, 1997). A few models havebeen proposed in literature; among them, Hough trans-form (HT) is the most well-known algorithm (Hough,1962; Duda and Hart, 1972). In HT, each edge pixel isvoted upon a quantized parameter space. Each cell in theaccumulator array for the quantized parameter space cor-responds to a straight line. Modified versions of HT havebeen proposed such as fast HT (Li et al., 1986), adaptiveHT (Illingworth and Kittler, 1987), combinatorial HT(Ben-Tzvi and Sandler, 1990) and hierarchical HT (Princenet al., 1990). However, regardless of its robustness, theactual distribution of edges is not known, because HT isa mandatory grouping method for collinear lines.
0167-8655/$ - see front matter � 2006 Elsevier B.V. All rights reserved.
doi:10.1016/j.patrec.2006.04.016
* Corresponding author. Tel.: +82 2 929 0985; fax: +82 2 926 7620.E-mail addresses: [email protected] (Y.-S. Lee), hskoo@kor-
ea.ac.kr (H.-S. Koo), [email protected] (C.-S. Jeong).
In the method presented by Nevatia and Babu (1980),edge pixels are extracted using six 5 · 5 gradient masksfor threshold detection and thinning. Edge pixels arelinked to other pixels which are identified as the same lin-ear segment. The contours are approximated by relativestraight line pieces using an iterative end-point fittingmethod.
In (Burns and Hanson, 1986), pixels are grouped intoline-support regions of similar gradient orientation. Theintensity surface associated with each line-support regionis approximated by a planar surface. Straight lines areextracted by intersecting this fitted plane with a horizontalplane representing the average intensity of the regionweighted by a local gradient magnitude. Although longlines can be extracted, the method is rather complex.
In (Venkateswar and Chellapa, 1992), a straight lineextractor for aerial images is proposed. The extractor firstscans the edge image to generate a label image using vari-ous templates for edge direction. Next, the extractorassigns the same label to the edge pixels in the same line.Then, the lines are merged, if they are identified as a collin-ear line. The disadvantage of this method, however, is thatit has to consider a large number of templates.
Algorithm 1: Row and column edge extraction (p[i][j]:pixel at (i, j))
for all i and j
if both p[i][j] and p[i][j + 1] are edge pixelsregister p[i][j] and p[i][j + 1] as row mark
end ifif both p[i][j] and p[i � 1][j] are edge pixels
add column mark to the register of p[i][j] andof p[i � 1][j]
else if p[i][j] is an edge but it has no mark in theregister
register p[i][j] as single markend if
end for
Y.-S. Lee et al. / Pattern Recognition Letters 27 (2006) 1744–1754 1745
Recently, Guru et al. (2004) proposed a line detectionalgorithm based on small eigenvalue. The small eigenvalueof the covariance matrix of the edge pixels covered by amask of a proper size is estimated. The mask is moved pixelby pixel, so that each edge pixel has a number of eigen-values because of the overlapping of masks. Consequently,each edge pixel is associated with the minimum eigenvalueof all the small eigenvalues that are assigned to it; and if theminimum eigenvalue is less than a pre-defined thresholdvalue, the pixel is said to be linear edge pixel. However,the performance can be damaged by either unsuitable sizeof mask or excessive noise pixels in the edge image. Morerecently, they presented papers for the algorithm usingprincipal component analysis (PCA) (Nagabhushan et al.,2005; Shekar et al., 2006). Especially, they proposed analgorithm for edge detection using eigenvalue (Nagabhu-shan et al., 2005), so they can have straightforward proce-dure for line detection using PCA because the line detectionneeds an edge image for the first time. Besides, in theirpaper for object recognition (Shekar et al., 2006), they usedtheir line detection method as preprocessing, and againthey used PCA to obtain principal component vectors ofobjects. In this way, they have proposed various applica-tions for PCA from edge detection to object recognition.
In this paper, we describe an efficient algorithm forstraight line detection. As discussed in the following sec-tion, the algorithm extracts straight lines from edge imageusing PCA. First, we divide edge segments into row- andcolumn-directional edge pieces to label them separatively.Second, we analyze each labeled line to obtain its principaldirection and straightness. Straight lines are then detected,if the small eigenvalue of line is less than a pre-definedvalue, which may be changed relative to the length of theline. Section 3 will discuss the threshold for determiningstraightness of lines. In Section 4, experimental results willbe shown. The discussion and conclusion will be addressedin Section 5.
1.1. Terminology
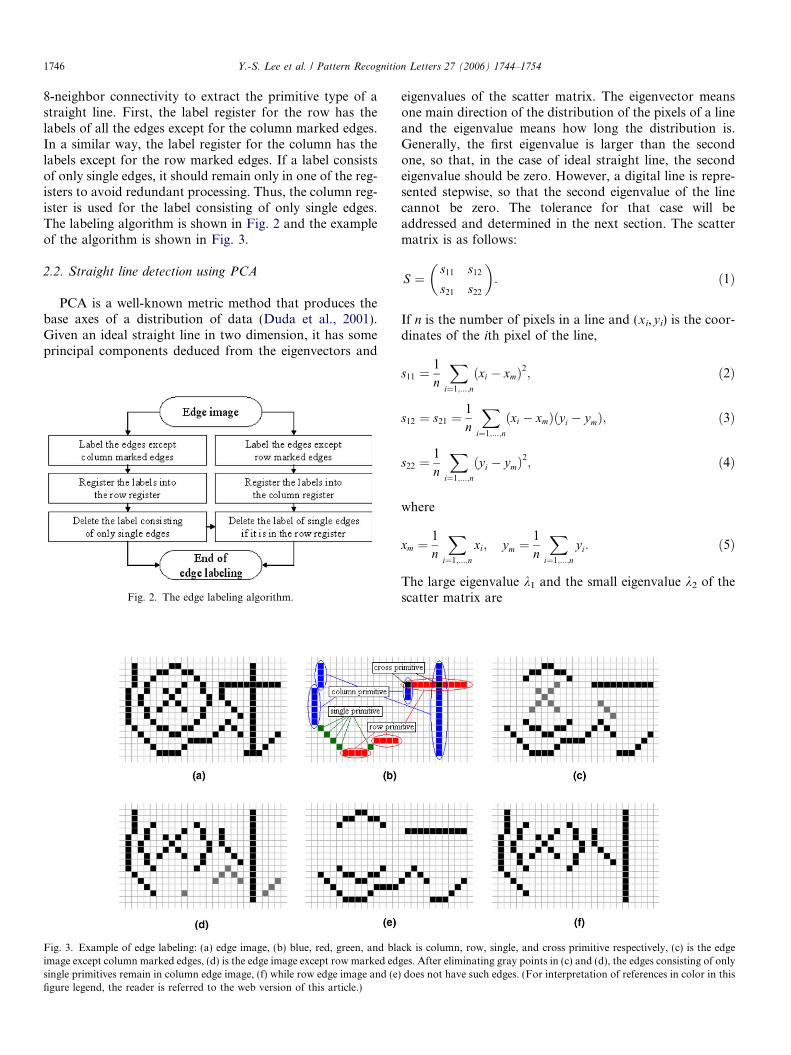
We discriminate ‘‘straight line’’ from line. We also use‘‘primitive’’ as a basic segment of a line which is like abar. Therefore, ‘‘row edge’’ consists of row primitivesand ‘‘column edge’’ consists of column primitives. The edgepixel that has no neighbor in four directions is called ‘‘sin-gle’’ primitive, and the pixel that can be an element of bothrow and column primitives is called ‘‘cross’’ primitive (seeFig. 3(b)).
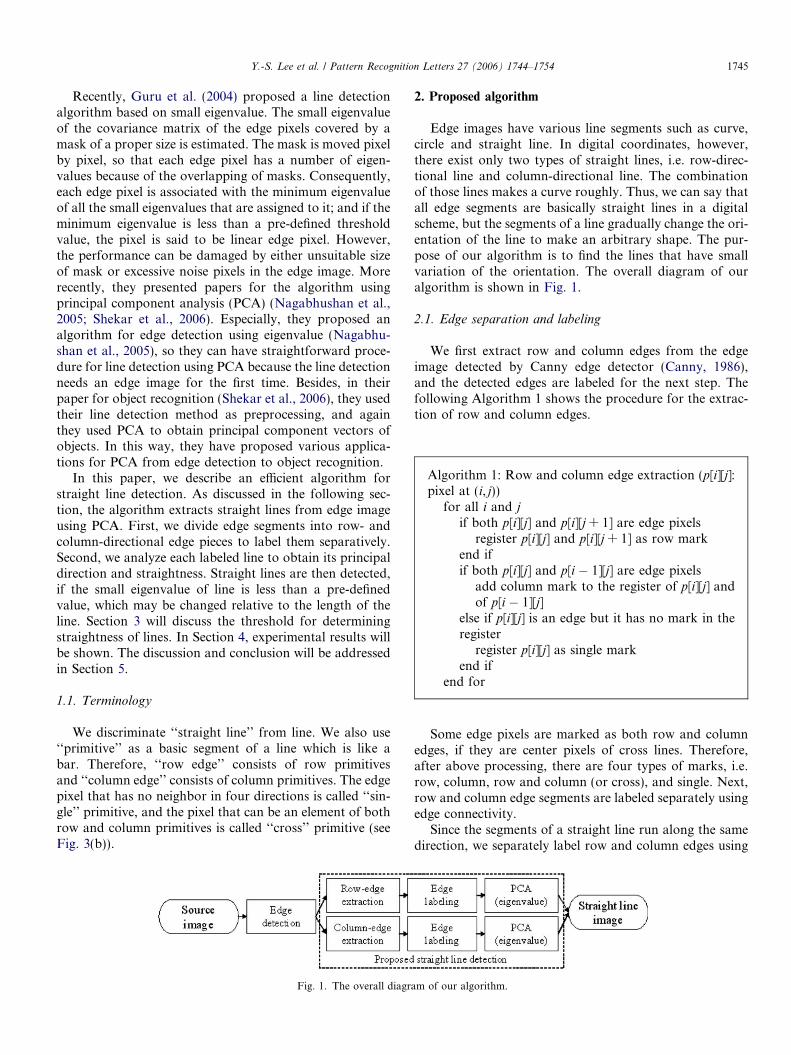
Fig. 1. The overall diagra
2. Proposed algorithm
Edge images have various line segments such as curve,circle and straight line. In digital coordinates, however,there exist only two types of straight lines, i.e. row-direc-tional line and column-directional line. The combinationof those lines makes a curve roughly. Thus, we can say thatall edge segments are basically straight lines in a digitalscheme, but the segments of a line gradually change the ori-entation of the line to make an arbitrary shape. The pur-pose of our algorithm is to find the lines that have smallvariation of the orientation. The overall diagram of ouralgorithm is shown in Fig. 1.
2.1. Edge separation and labeling
We first extract row and column edges from the edgeimage detected by Canny edge detector (Canny, 1986),and the detected edges are labeled for the next step. Thefollowing Algorithm 1 shows the procedure for the extrac-tion of row and column edges.
Some edge pixels are marked as both row and columnedges, if they are center pixels of cross lines. Therefore,after above processing, there are four types of marks, i.e.row, column, row and column (or cross), and single. Next,row and column edge segments are labeled separately usingedge connectivity.
Since the segments of a straight line run along the samedirection, we separately label row and column edges using
m of our algorithm.
1746 Y.-S. Lee et al. / Pattern Recognition Letters 27 (2006) 1744–1754
8-neighbor connectivity to extract the primitive type of astraight line. First, the label register for the row has thelabels of all the edges except for the column marked edges.In a similar way, the label register for the column has thelabels except for the row marked edges. If a label consistsof only single edges, it should remain only in one of the reg-isters to avoid redundant processing. Thus, the column reg-ister is used for the label consisting of only single edges.The labeling algorithm is shown in Fig. 2 and the exampleof the algorithm is shown in Fig. 3.
2.2. Straight line detection using PCA
PCA is a well-known metric method that produces thebase axes of a distribution of data (Duda et al., 2001).Given an ideal straight line in two dimension, it has someprincipal components deduced from the eigenvectors and
Fig. 2. The edge labeling algorithm.
Fig. 3. Example of edge labeling: (a) edge image, (b) blue, red, green, and blaimage except column marked edges, (d) is the edge image except row marked edsingle primitives remain in column edge image, (f) while row edge image and (e)figure legend, the reader is referred to the web version of this article.)
eigenvalues of the scatter matrix. The eigenvector meansone main direction of the distribution of the pixels of a lineand the eigenvalue means how long the distribution is.Generally, the first eigenvalue is larger than the secondone, so that, in the case of ideal straight line, the secondeigenvalue should be zero. However, a digital line is repre-sented stepwise, so that the second eigenvalue of the linecannot be zero. The tolerance for that case will beaddressed and determined in the next section. The scattermatrix is as follows:
S ¼s11 s12
s21 s22
� �: ð1Þ
If n is the number of pixels in a line and (xi,yi) is the coor-dinates of the ith pixel of the line,
s11 ¼1
n
Xi¼1;...;n
ðxi � xmÞ2; ð2Þ
s12 ¼ s21 ¼1
n
Xi¼1;...;n
ðxi � xmÞðyi � ymÞ; ð3Þ
s22 ¼1
n
Xi¼1;...;n
ðyi � ymÞ2; ð4Þ
where
xm ¼1
n
Xi¼1;...;n
xi; ym ¼1
n
Xi¼1;...;n
yi: ð5Þ
The large eigenvalue k1 and the small eigenvalue k2 of thescatter matrix are
ck is column, row, single, and cross primitive respectively, (c) is the edgeges. After eliminating gray points in (c) and (d), the edges consisting of only
does not have such edges. (For interpretation of references in color in this
Y.-S. Lee et al. / Pattern Recognition Letters 27 (2006) 1744–1754 1747
k1 ¼1
2s11 þ s22 þ
ffiffiffiffiffiffiffiffiffiffiffiffiffiffiffiffiffiffiffiffiffiffiffiffiffiffiffiffiffiffiffiffiffiffiffiffiðs11 � s22Þ2 þ 4s2
12
q� �; ð6Þ
k2 ¼1
2s11 þ s22 �
ffiffiffiffiffiffiffiffiffiffiffiffiffiffiffiffiffiffiffiffiffiffiffiffiffiffiffiffiffiffiffiffiffiffiffiffiðs11 � s22Þ2 þ 4s2
12
q� �: ð7Þ
We can only know the proportion of the elements of theeigenvector, and so the angle of the line, h is defined as
h ¼ tan�1 ðk1 � s11Þs12
or h ¼ tan�1 s21
ðk1 � s22Þ: ð8Þ
Above two equations are identical because det(k1I �S) = 0. In this way, the straightness of a line and its angleare obtained. Thus, the position and orientation of a line iseasily taken from the eigenvector of the scatter matrix as itis obtained from HT. However, HT gives the informationfor a group of the lines in the same orientation, whilePCA gives such information for a separate line.
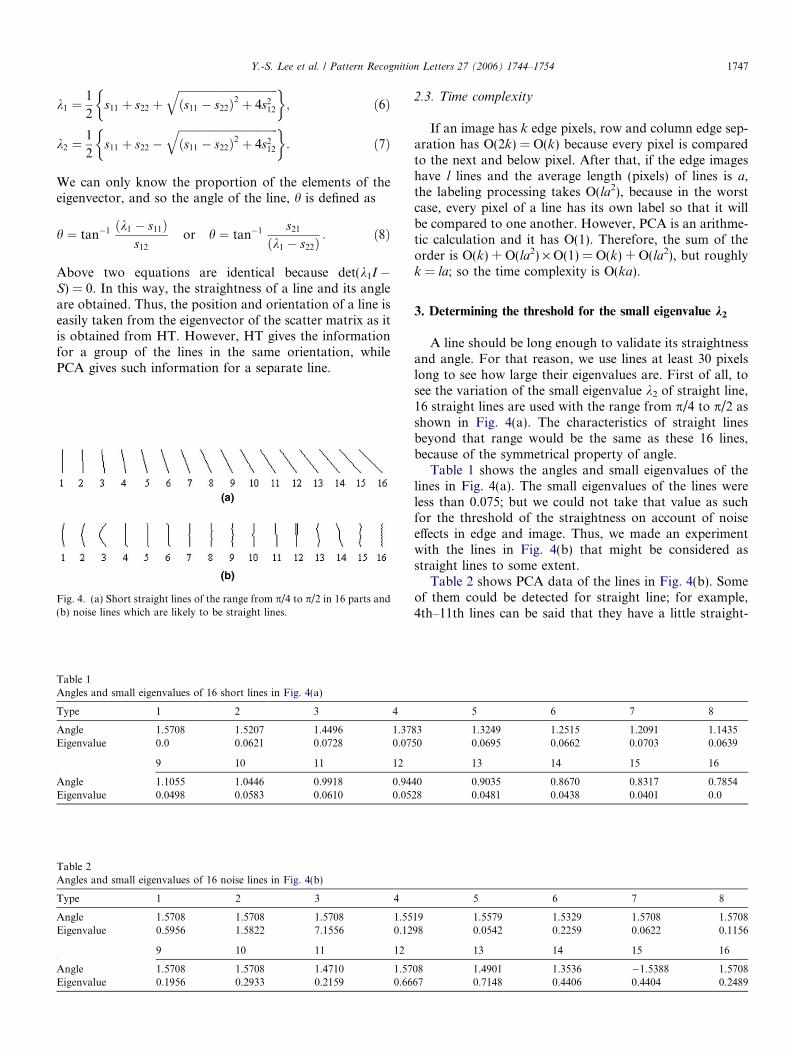
Fig. 4. (a) Short straight lines of the range from p/4 to p/2 in 16 parts and(b) noise lines which are likely to be straight lines.
Table 1Angles and small eigenvalues of 16 short lines in Fig. 4(a)
Type 1 2 3 4
Angle 1.5708 1.5207 1.4496 1.37Eigenvalue 0.0 0.0621 0.0728 0.07
9 10 11 12
Angle 1.1055 1.0446 0.9918 0.94Eigenvalue 0.0498 0.0583 0.0610 0.05
Table 2Angles and small eigenvalues of 16 noise lines in Fig. 4(b)
Type 1 2 3 4
Angle 1.5708 1.5708 1.5708 1.55Eigenvalue 0.5956 1.5822 7.1556 0.12
9 10 11 12
Angle 1.5708 1.5708 1.4710 1.57Eigenvalue 0.1956 0.2933 0.2159 0.66
2.3. Time complexity
If an image has k edge pixels, row and column edge sep-aration has O(2k) = O(k) because every pixel is comparedto the next and below pixel. After that, if the edge imageshave l lines and the average length (pixels) of lines is a,the labeling processing takes O(la2), because in the worstcase, every pixel of a line has its own label so that it willbe compared to one another. However, PCA is an arithme-tic calculation and it has O(1). Therefore, the sum of theorder is O(k) + O(la2) · O(1) = O(k) + O(la2), but roughlyk = la; so the time complexity is O(ka).
3. Determining the threshold for the small eigenvalue k2
A line should be long enough to validate its straightnessand angle. For that reason, we use lines at least 30 pixelslong to see how large their eigenvalues are. First of all, tosee the variation of the small eigenvalue k2 of straight line,16 straight lines are used with the range from p/4 to p/2 asshown in Fig. 4(a). The characteristics of straight linesbeyond that range would be the same as these 16 lines,because of the symmetrical property of angle.
Table 1 shows the angles and small eigenvalues of thelines in Fig. 4(a). The small eigenvalues of the lines wereless than 0.075; but we could not take that value as suchfor the threshold of the straightness on account of noiseeffects in edge and image. Thus, we made an experimentwith the lines in Fig. 4(b) that might be considered asstraight lines to some extent.
Table 2 shows PCA data of the lines in Fig. 4(b). Someof them could be detected for straight line; for example,4th–11th lines can be said that they have a little straight-
5 6 7 8
83 1.3249 1.2515 1.2091 1.143550 0.0695 0.0662 0.0703 0.0639
13 14 15 16
40 0.9035 0.8670 0.8317 0.785428 0.0481 0.0438 0.0401 0.0
5 6 7 8
19 1.5579 1.5329 1.5708 1.570898 0.0542 0.2259 0.0622 0.1156
13 14 15 16
08 1.4901 1.3536 �1.5388 1.570867 0.7148 0.4406 0.4404 0.2489
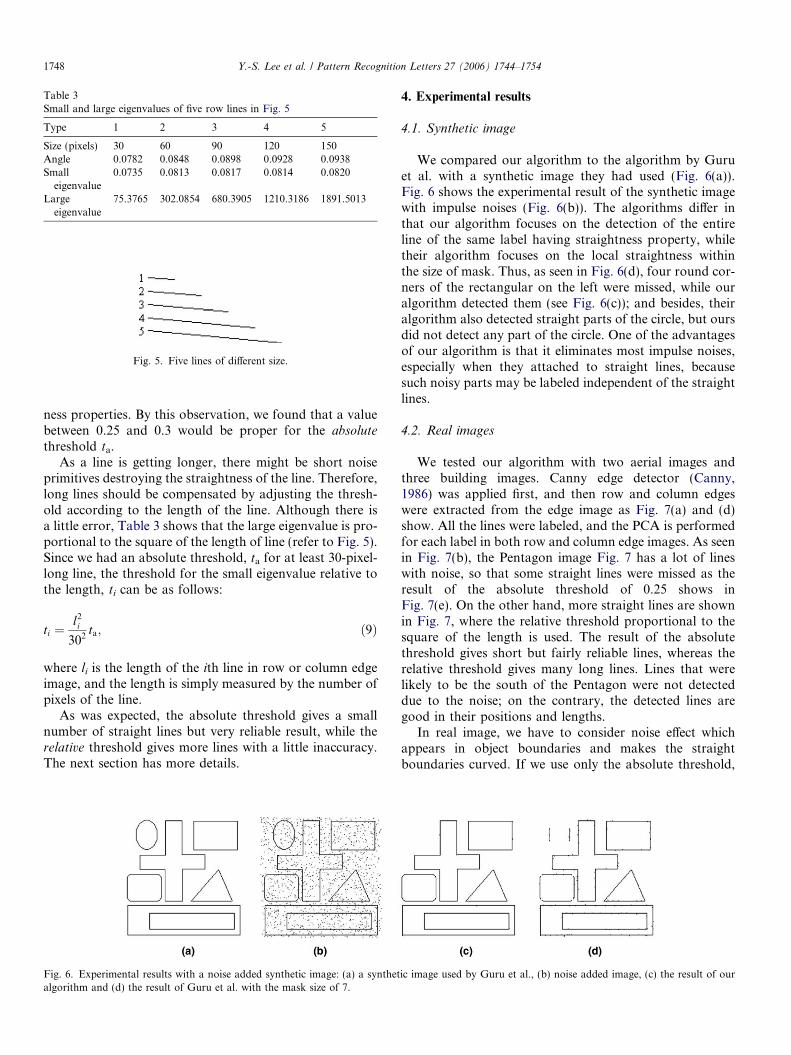
Table 3Small and large eigenvalues of five row lines in Fig. 5
Type 1 2 3 4 5
Size (pixels) 30 60 90 120 150Angle 0.0782 0.0848 0.0898 0.0928 0.0938Small
eigenvalue0.0735 0.0813 0.0817 0.0814 0.0820
Largeeigenvalue
75.3765 302.0854 680.3905 1210.3186 1891.5013
Fig. 5. Five lines of different size.
1748 Y.-S. Lee et al. / Pattern Recognition Letters 27 (2006) 1744–1754
ness properties. By this observation, we found that a valuebetween 0.25 and 0.3 would be proper for the absolute
threshold ta.As a line is getting longer, there might be short noise
primitives destroying the straightness of the line. Therefore,long lines should be compensated by adjusting the thresh-old according to the length of the line. Although there isa little error, Table 3 shows that the large eigenvalue is pro-portional to the square of the length of line (refer to Fig. 5).Since we had an absolute threshold, ta for at least 30-pixel-long line, the threshold for the small eigenvalue relative tothe length, ti can be as follows:
ti ¼l2
i
302ta; ð9Þ
where li is the length of the ith line in row or column edgeimage, and the length is simply measured by the number ofpixels of the line.
As was expected, the absolute threshold gives a smallnumber of straight lines but very reliable result, while therelative threshold gives more lines with a little inaccuracy.The next section has more details.
Fig. 6. Experimental results with a noise added synthetic image: (a) a synthetalgorithm and (d) the result of Guru et al. with the mask size of 7.
4. Experimental results
4.1. Synthetic image
We compared our algorithm to the algorithm by Guruet al. with a synthetic image they had used (Fig. 6(a)).Fig. 6 shows the experimental result of the synthetic imagewith impulse noises (Fig. 6(b)). The algorithms differ inthat our algorithm focuses on the detection of the entireline of the same label having straightness property, whiletheir algorithm focuses on the local straightness withinthe size of mask. Thus, as seen in Fig. 6(d), four round cor-ners of the rectangular on the left were missed, while ouralgorithm detected them (see Fig. 6(c)); and besides, theiralgorithm also detected straight parts of the circle, but oursdid not detect any part of the circle. One of the advantagesof our algorithm is that it eliminates most impulse noises,especially when they attached to straight lines, becausesuch noisy parts may be labeled independent of the straightlines.
4.2. Real images
We tested our algorithm with two aerial images andthree building images. Canny edge detector (Canny,1986) was applied first, and then row and column edgeswere extracted from the edge image as Fig. 7(a) and (d)show. All the lines were labeled, and the PCA is performedfor each label in both row and column edge images. As seenin Fig. 7(b), the Pentagon image Fig. 7 has a lot of lineswith noise, so that some straight lines were missed as theresult of the absolute threshold of 0.25 shows inFig. 7(e). On the other hand, more straight lines are shownin Fig. 7, where the relative threshold proportional to thesquare of the length is used. The result of the absolutethreshold gives short but fairly reliable lines, whereas therelative threshold gives many long lines. Lines that werelikely to be the south of the Pentagon were not detecteddue to the noise; on the contrary, the detected lines aregood in their positions and lengths.
In real image, we have to consider noise effect whichappears in object boundaries and makes the straightboundaries curved. If we use only the absolute threshold,
ic image used by Guru et al., (b) noise added image, (c) the result of our
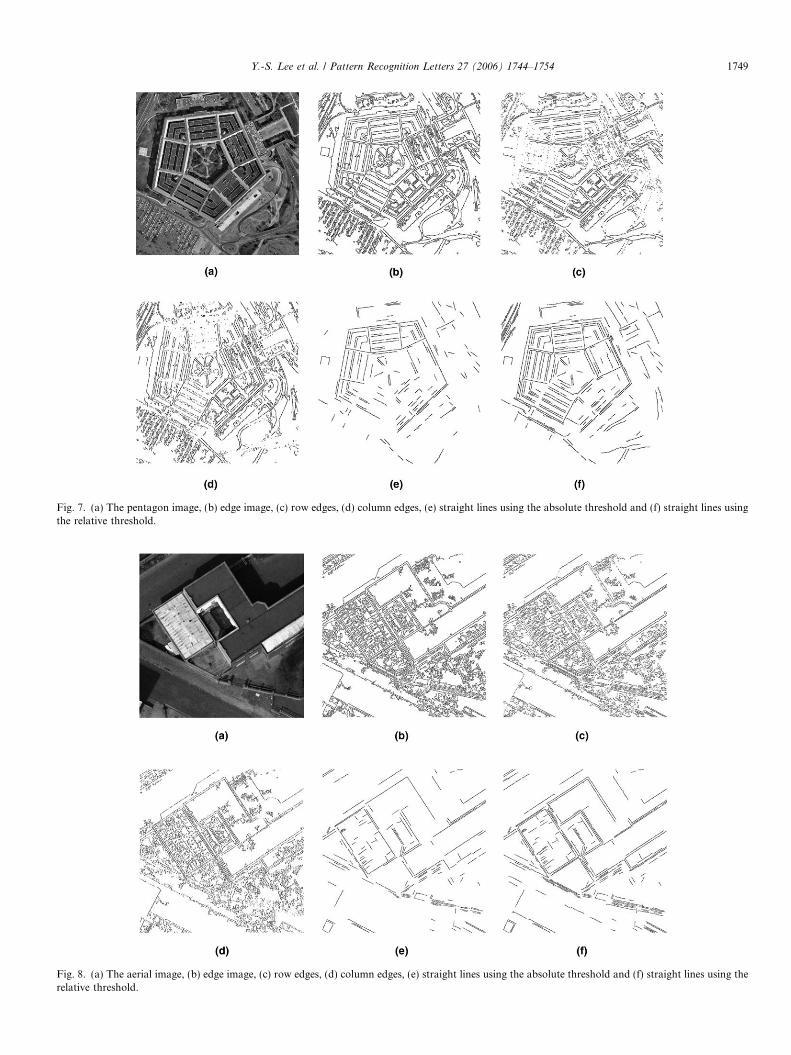
Fig. 7. (a) The pentagon image, (b) edge image, (c) row edges, (d) column edges, (e) straight lines using the absolute threshold and (f) straight lines usingthe relative threshold.
Fig. 8. (a) The aerial image, (b) edge image, (c) row edges, (d) column edges, (e) straight lines using the absolute threshold and (f) straight lines using therelative threshold.
Y.-S. Lee et al. / Pattern Recognition Letters 27 (2006) 1744–1754 1749
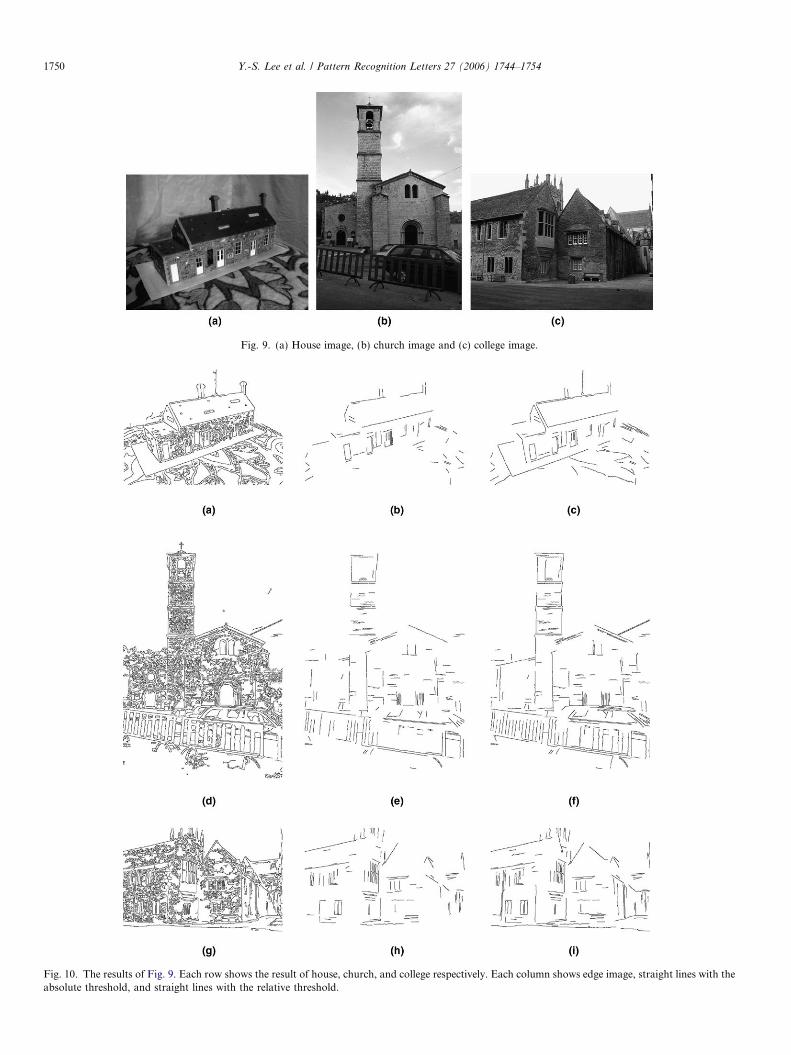
Fig. 9. (a) House image, (b) church image and (c) college image.
Fig. 10. The results of Fig. 9. Each row shows the result of house, church, and college respectively. Each column shows edge image, straight lines with theabsolute threshold, and straight lines with the relative threshold.
1750 Y.-S. Lee et al. / Pattern Recognition Letters 27 (2006) 1744–1754
Y.-S. Lee et al. / Pattern Recognition Letters 27 (2006) 1744–1754 1751
there will be small number of detected lines because ofnoise. Besides, we found that the line is easily affected bynoise as it is getting longer, so that we proposed anotherthreshold that changes according to the length of a lineto reduce noise effect and detect more lines. In summary,the application that needs exact straight line such as stereoline matching should use the absolute threshold only, but ifthe application that needs many straight lines such asobject recognition has to use proposed relative threshold.
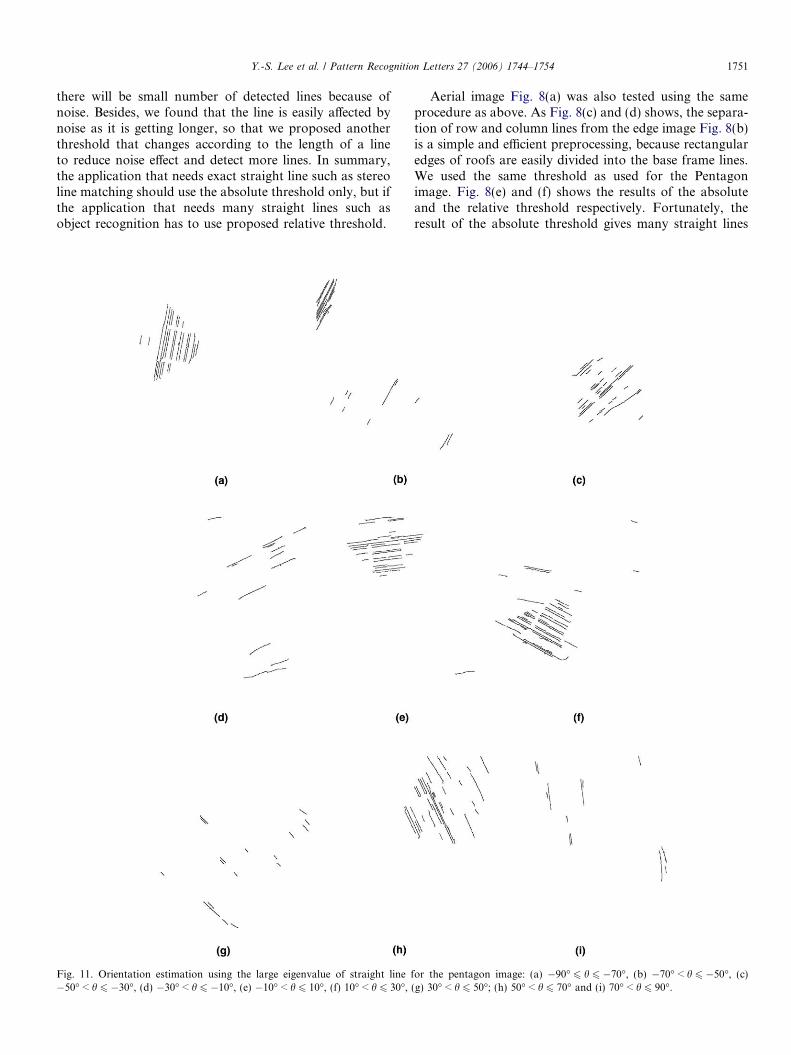
Fig. 11. Orientation estimation using the large eigenvalue of straight line f�50� < h 6 �30�, (d) �30� < h 6 �10�, (e) �10� < h 6 10�, (f) 10� < h 6 30�,
Aerial image Fig. 8(a) was also tested using the sameprocedure as above. As Fig. 8(c) and (d) shows, the separa-tion of row and column lines from the edge image Fig. 8(b)is a simple and efficient preprocessing, because rectangularedges of roofs are easily divided into the base frame lines.We used the same threshold as used for the Pentagonimage. Fig. 8(e) and (f) shows the results of the absoluteand the relative threshold respectively. Fortunately, theresult of the absolute threshold gives many straight lines
or the pentagon image: (a) �90� 6 h 6 �70�, (b) �70� < h 6 �50�, (c)(g) 30� < h 6 50�; (h) 50� < h 6 70� and (i) 70� < h 6 90�.
1752 Y.-S. Lee et al. / Pattern Recognition Letters 27 (2006) 1744–1754
regardless of noise effect, whereas the result of the relativethreshold has a few curve lines, but they are connected tolong straight lines.
Other three images (see Fig. 9) were also tested with thesame threshold, 0.25. Fig. 10(a)–(i) is the results of thoseimages. The advantage of the relative threshold is that itdefines the shapes of buildings more clearly as shown inthe results, whereas the absolute threshold missed some
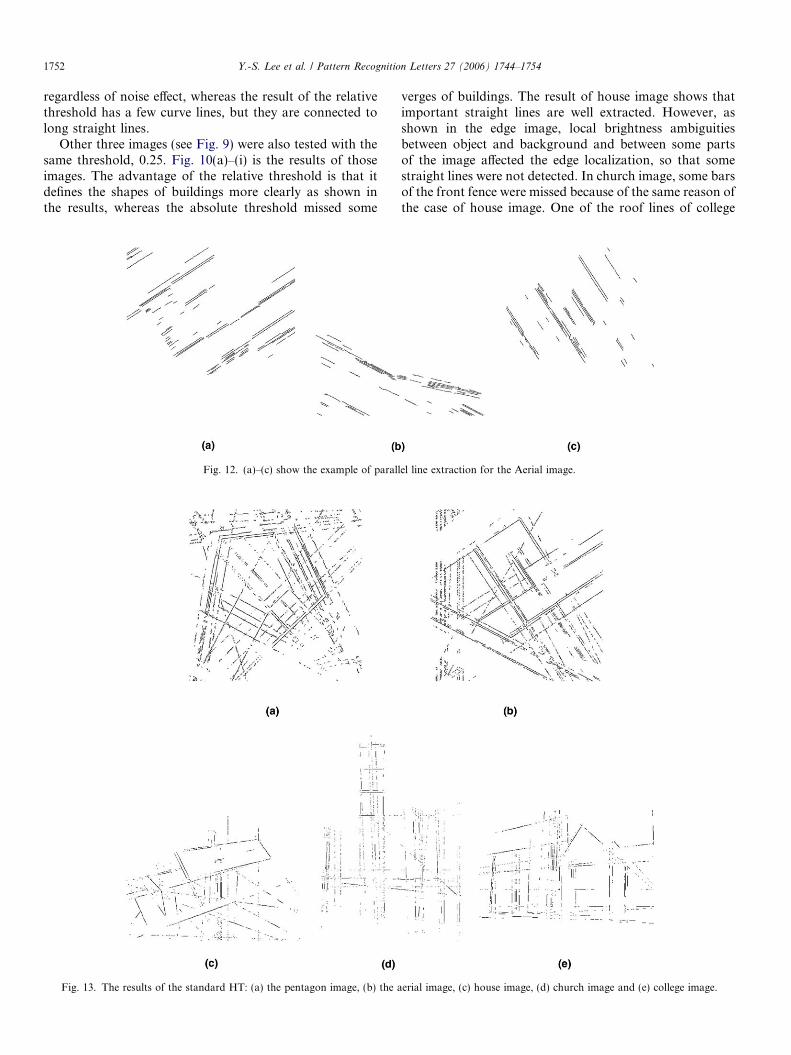
Fig. 12. (a)–(c) show the example of parall
Fig. 13. The results of the standard HT: (a) the pentagon image, (b) the a
verges of buildings. The result of house image shows thatimportant straight lines are well extracted. However, asshown in the edge image, local brightness ambiguitiesbetween object and background and between some partsof the image affected the edge localization, so that somestraight lines were not detected. In church image, some barsof the front fence were missed because of the same reason ofthe case of house image. One of the roof lines of college
el line extraction for the Aerial image.
erial image, (c) house image, (d) church image and (e) college image.
Table 4Consuming time of our method and standard HT (s)
Image Pentagon Aerial House Church College
Ours Labeling 1.566 3.765 0.375 2.331 0.781The rest 0.172 0.266 0.062 0.203 0.109Total 1.738 4.031 0.437 2.534 0.890
HT Total 8.584 12.716 6.472 10.741 6.555
Y.-S. Lee et al. / Pattern Recognition Letters 27 (2006) 1744–1754 1753
image was also missed, and the windows of the college areso small that they are very sensitive to the noise, whichmeans a line should be long enough to show its property.Nevertheless, all the results show a good efficiency of ouralgorithm, and show that the relative threshold is neededto get more information for further processing.
Figs. 11 and 12 are examples of the orientation estima-tion of straight lines. This work helps us do additional pro-cessing such as vanishing point detection, parallel linedetection and line matching across views (Lutton et al.,1994; Schmid and Zisserman, 1997). Fig. 13 shows theresults of HT with the same images we have used. However,too many edges deteriorate the performance, which is disad-vantage of HT. Of course, estimated angle of a line of ourresult can be compared with that of HT, but our methodestimates exact angle of a line, while HT obtains the approx-imate angle of a line from accumulator cells divided by pre-defined angle and distance. Moreover, the lines of HT arebroken frequently. There are some reasons of this problem:First, HT is very sensitive to edge image. If an image hasquite a lot of edges, the result of HT is very poor, and ourtest images have so many edges. Second, because HT givesline that is in the range of angle of an accumulator cell witha tolerance, the value from HT result is not exact. Third,HT chooses the peak value out of accumulator cells anddeletes it before the next peak detection, so that some partof a line that is near the previous peak line may not bedrawn. Fourth, since HT has a grouping characteristic, itoften mistakes a group of edges for a line, i.e. when manyedges spread over the same distance and angle, HT takesthem as one line according to the accumulated votes.
We also present consuming time of our method and HTfor each image in Table 4. The environment was Pentium 42 GHz and the platform was Visual C++ for MS-Win-dows. Obviously, large image takes more time like the Aer-ial image, and most of time of our method elapses in theedge labeling processing. We think that it is kind oftrade-off between time and accuracy; that is, because weuse labeling processing, we can get exact values of lines,but unfortunately it takes much of time. On the otherhand, HT consumes long time because the quantizationinterval and peak detection take plenty of time.
5. Discussions and conclusion
Our algorithm basically uses a simple segmentation thatseparates row and column edges using primitive shape. Insome cases, however, our algorithm fails. For instance, if
two straight lines meet with the difference between twoangles small, they might have the same label, which makesthe small eigenvalue for the label larger.
Chain code (Sonka et al., 1999) algorithm can be analternative to the solution of the problem. If we use thisalgorithm, corners and points that have a great curvatureshould be detected. Besides, every end point and junctionpoint should be extracted. There can be three types of com-position of line: end-end line, end-junction line and junc-tion-junction line. However, it may take so much timefor processing. Moreover, the ambiguity about line seg-ment and noise edge does hardly disappear.
The proposed algorithm is a simple and efficient. Espe-cially, it is good for an edge image that has a lot of edges.In addition, our algorithm avoids mask processing thatonly uses local information. Solving the problem of twoor more merged straight lines as mentioned above will bea future work for improving the performance of ouralgorithm.
Acknowledgements
This work was supported by the Brain Korea 21 andKIPA Information Technology Research Center. The Pen-tagon image was obtained from Carnegie Mellon ImageDatabase and all the rest of the source images in experi-ment section were obtained from Visual Geometry Groupat Oxford University.
References
Ben-Tzvi, D., Sandler, M.B., 1990. A combinatorial Hough transform.Pattern Recognition Lett. 11 (3), 167–174.
Burns, J.B., Hanson, A.R., 1986. Extraction straight lines. IEEE Trans.Pattern Anal. Mach. Intell. (4), 425–456.
Canny, J.F., 1986. A computational approach to edge detection. IEEETrans. Pattern Anal. Mach. Intell. 8 (6), 679–698.
Duda, R.O., Hart, P.E., 1972. Use of Hough transformation to detectlines and curves in pictures. Commun. ACM 15 (1), 11–15.
Duda, R.O., Hart, P.E., Stork, D.G., 2001. Pattern Classification, Seconded. Wiley Interscience (Chapter 3).
Guru, D.S., Shekar, B.H., Nagabhushan, P., 2004. A simple and robustline detection algorithm based on small eigenvalue analysis. PatternRecognition Lett. 25, 1–13.
Hough, P.V.C., 1962. Method and means for recognizing complexpatterns, US Patent No. 3069654.
Illingworth, J., Kittler, J., 1987. The adaptive Hough transform. IEEETrans. Pattern Anal. Mach. Intell. 9 (5), 690–698.
Li, H., Lavin, M.A., Le Master, R.J., 1986. Fast Hough transform: Ahierarchical approach. Comput. Vision Graphics Image Process. 36,139–161.
Lutton, E., Maitre, H., Lopez-Krahe, J., 1994. Contribution to thedetermination of vanishing points using Hough transform. IEEETrans. Pattern Anal. Mach. Intell. 16 (4), 430–438.
Nagabhushan, P., Guru, D.S., Shekar, B.H., 2005. Eigen transformationbased edge detector for gray images, PReMI 2005. LNCS 3776, 434–440.
Nevatia, R., Babu, K.R., 1980. Linear feature extraction and description.Comput. Graphics Image Process. 13, 257–269.
Princen, J., Illingworth, J., Kittler, J., 1990. A hierarchical approach toline extraction based on the Hough transform. Comput. VisionGraphics Image Process. 52 (1), 57–77.
1754 Y.-S. Lee et al. / Pattern Recognition Letters 27 (2006) 1744–1754
Schmid, C., Zisserman, A., 1997. Automatic line matching across views.Proc. IEEE Conf. Comput. Vision Pattern Recognition, 666–671.
Shekar, B.H., Guru, D.S., Nagabhushan, P., 2006. Object recognitionthrough the principal component analysis of spatial relationshipamongst lines ACCV 2006. LNCS 3851, 170–179.
Sonka, M., Hlavac, V., Boyle, R., 1999. Image Processing Analysis andMachine Vision, Second ed. International Thomson Computer Press(Chapter 6).
Venkateswar, V., Chellapa, R., 1992. Extraction of straight lines in aerialimages. IEEE Pattern Anal. Mach. Intell. 14, 1111–1114.