Embed Size (px)
Citation preview
A Strategic Approach to the Control of Cancer
Otis W. Brawley, M.D.Chief Medical and Scientific Officer American Cancer SocietyProfessor of Hematology, Medical Oncology, Medicine and Epidemiology Emory University

Disclosures
• Dr. Brawley has nothing to disclose.
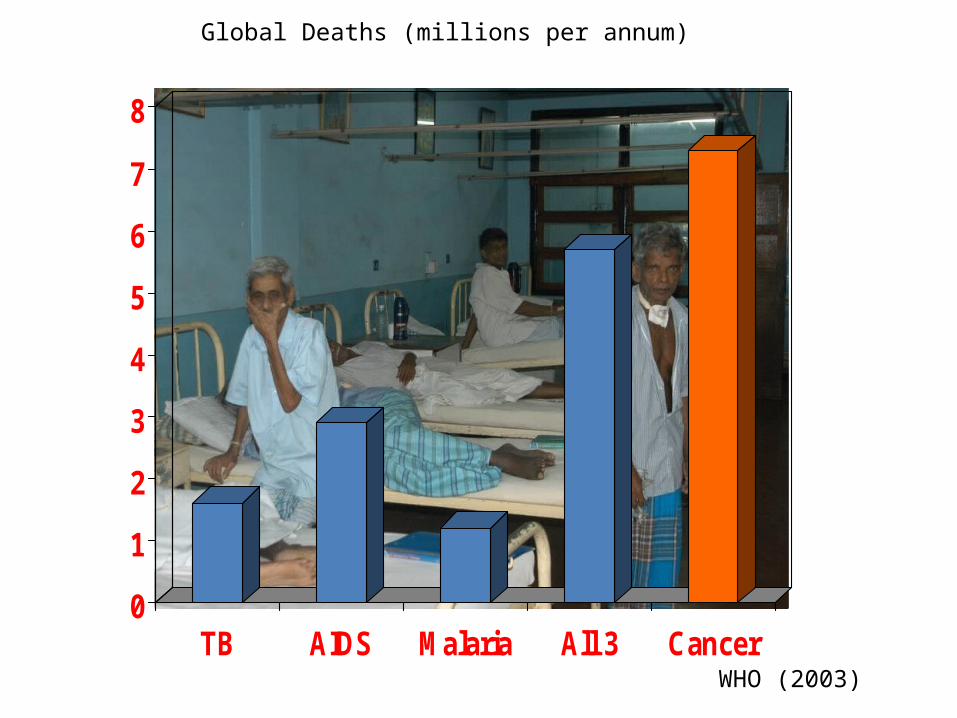
WHO (2003)
0
1
2
3
4
5
6
7
8
TB AIDS Malaria All 3 Cancer
Global Deaths (millions per annum)
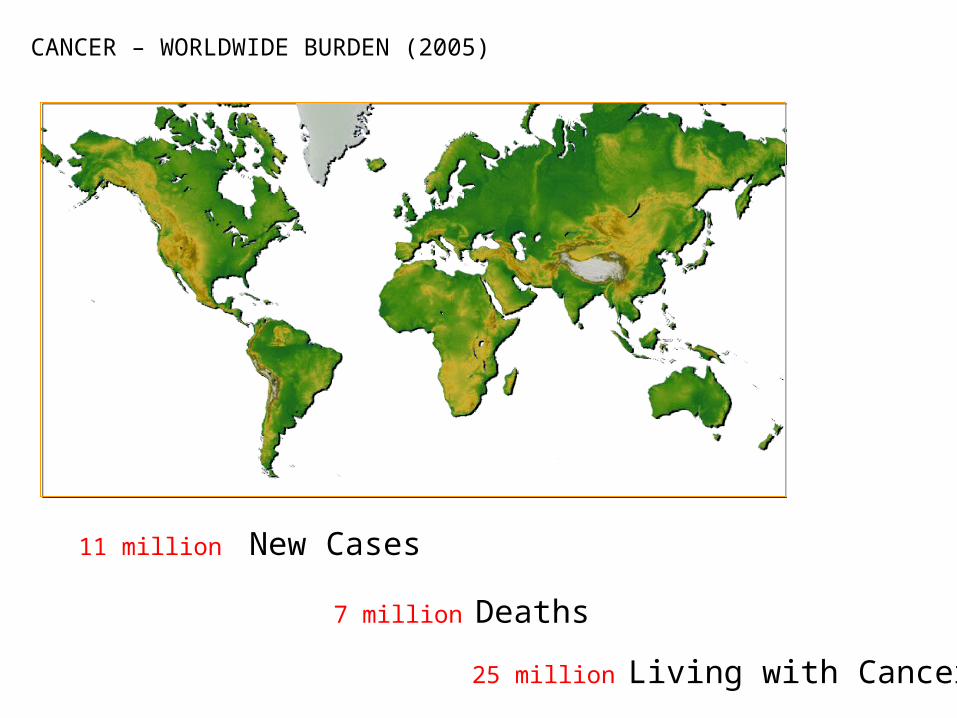
7 million Deaths
11 million New Cases
25 million Living with Cancer
CANCER – WORLDWIDE BURDEN (2005)
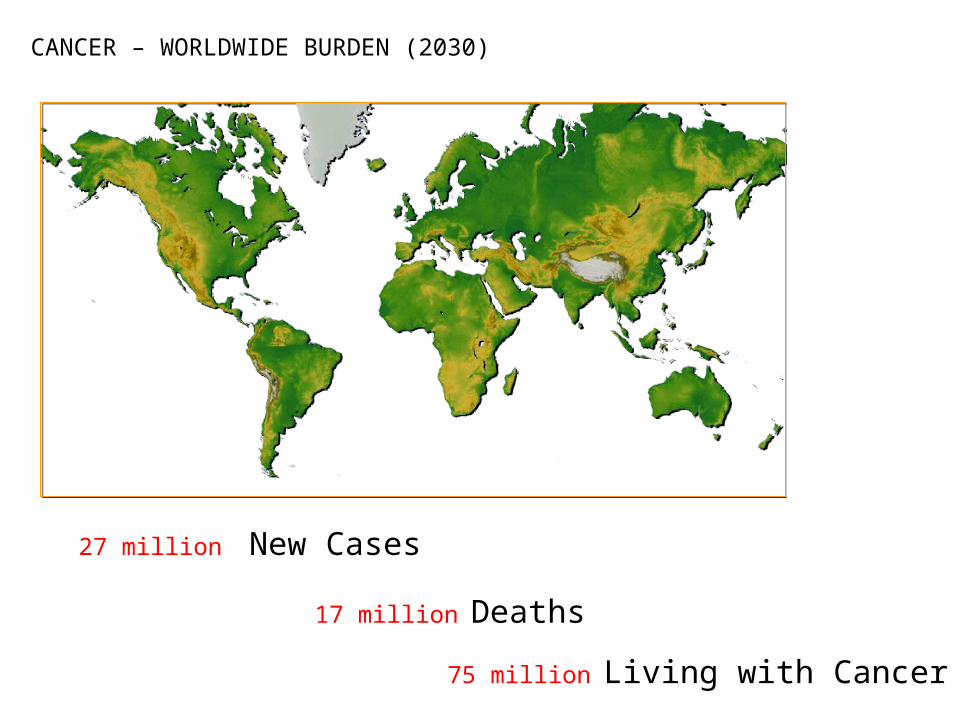
17 million Deaths
27 million New Cases
75 million Living with Cancer
CANCER – WORLDWIDE BURDEN (2030)
Outline
• Observations on the US Economy• The need to redefine cancer for the 21st century• Trends in cancer epidemiology• Interventions that can save lives
U.S. Health Care Spending
In 2009, the U.S. spent
$2.53 TRILLION on Health Care
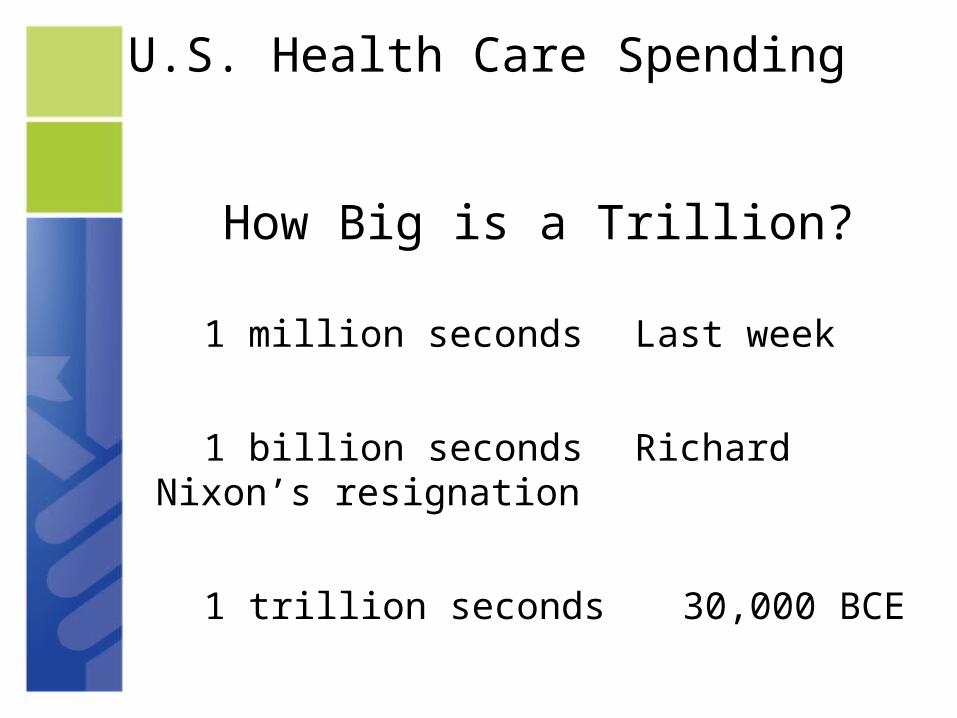
U.S. Health Care Spending
How Big is a Trillion?
1 million seconds Last week
1 billion seconds Richard Nixon’s resignation
1 trillion seconds 30,000 BCE
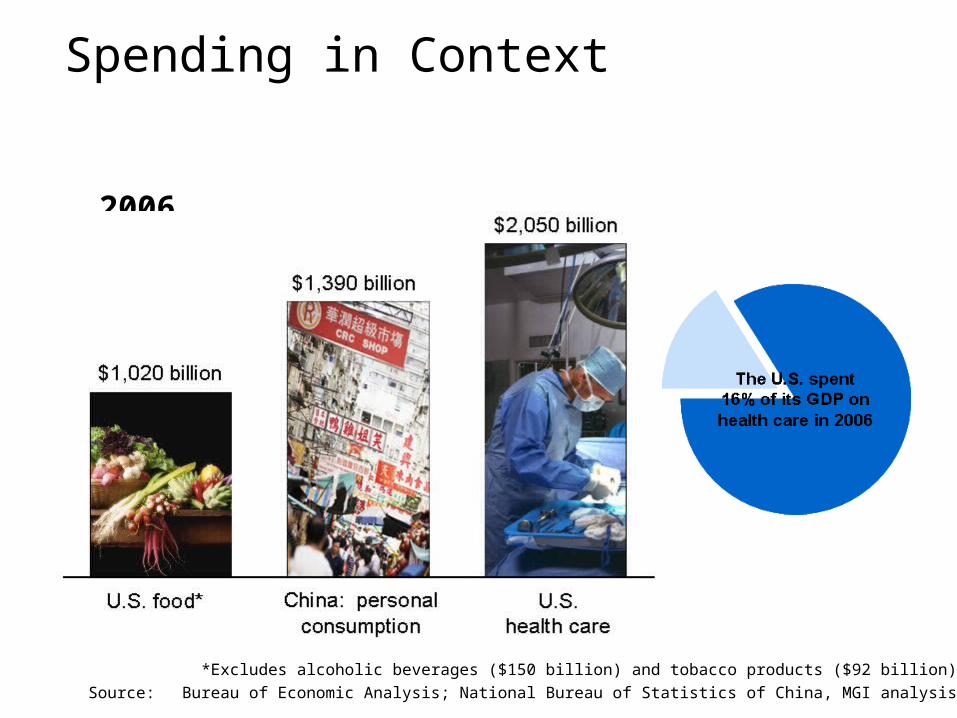
Spending in Context
2006
*Excludes alcoholic beverages ($150 billion) and tobacco products ($92 billion)Source: Bureau of Economic Analysis; National Bureau of Statistics of China, MGI analysis

Spending: US vs. Other CountriesPer capita health care
spending, 2006$ at PPP*
Per capita GDP ($)*Purchasing power parity.
** Estimated Spending According to Wealth. Source: Organization for Economic Co-operation and Development (OECD)
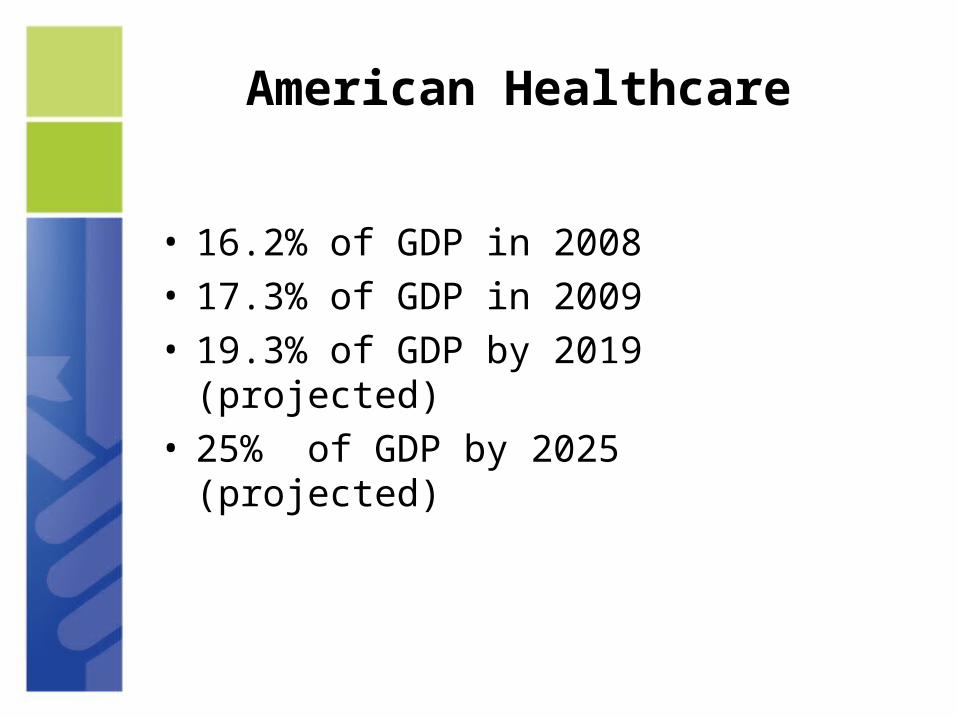
American Healthcare
• 16.2% of GDP in 2008• 17.3% of GDP in 2009• 19.3% of GDP by 2019 (projected)• 25% of GDP by 2025 (projected)
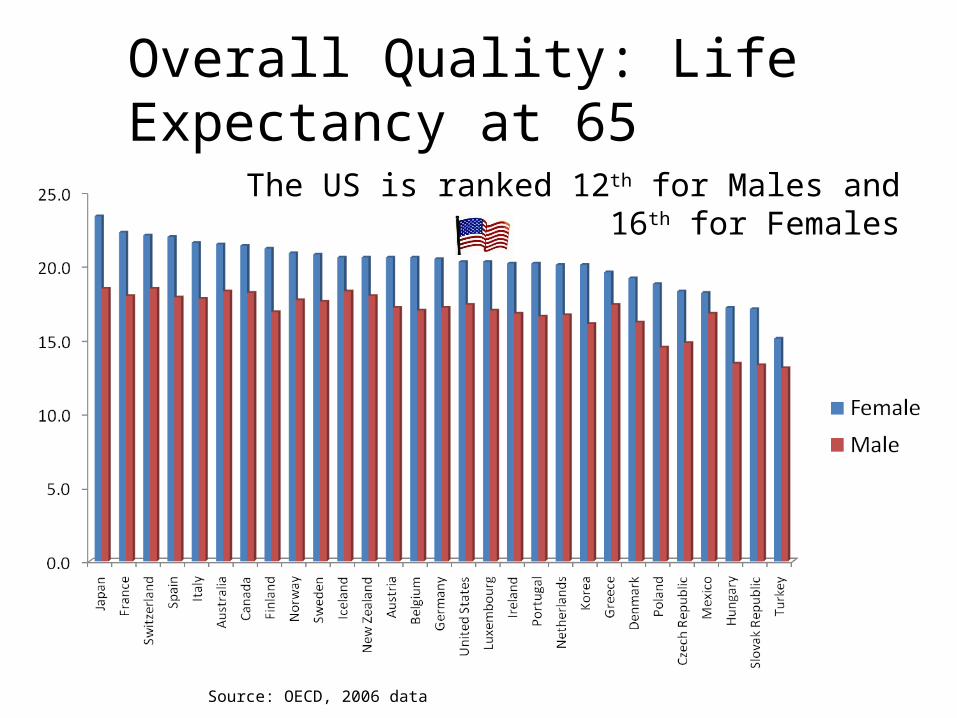
Overall Quality: Life Expectancy at 65
The US is ranked 12th for Males and 16th for Females
Source: OECD, 2006 data
Toward an Efficient Healthcare System
• Some consume too much (Unnecessary care given)
• Some consume too little(Necessary care not given)
• We could decrease the waste and improve overall health!
• Evidence Based Medicine

Rudolph Ludwig Karl Virchow
1821- 1902
Virchow’s Accomplishment
One of the first cellular pathologists
Virchow’s node
Defined conditions that cause thrombosis
One of the initial description of leukemia
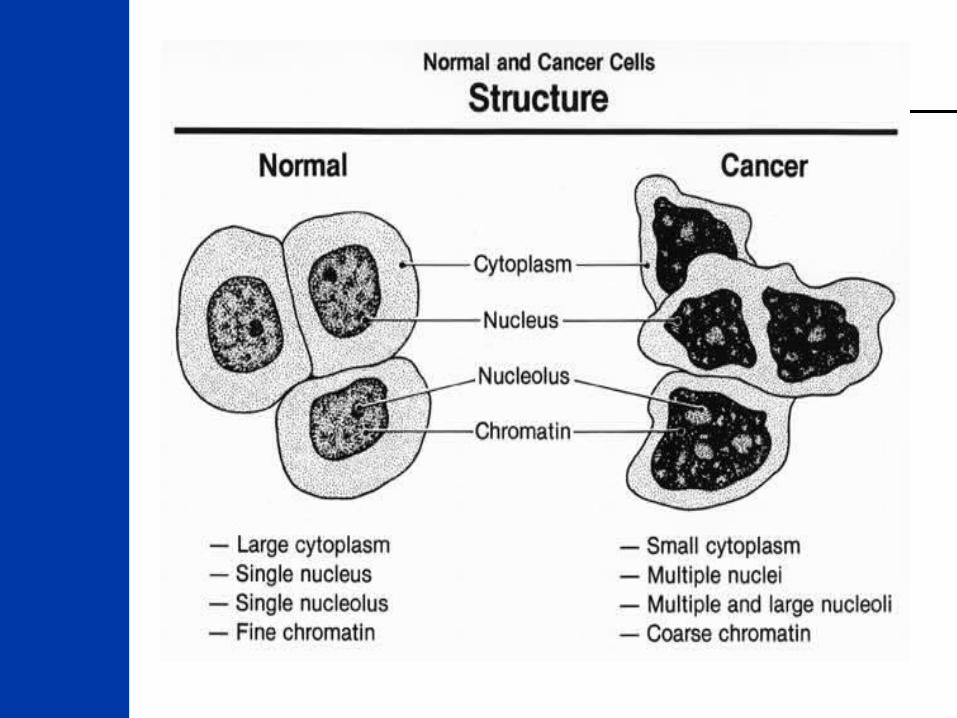
Defined cancer as a disease involving uncontrolled cell growth
Defined cancer using a light microscope on specimens obtained by autopsy
Virchow’s Accomplishments
The definition of cancer used in 2010 is largely that of Virchow with minor modifications
More than 160 years later, we still use his definitions using a light microscope.
There is clear evidence that some early detected cancers do not poise a threat and do not need to be treated.
OverdiagnosisCure is Possible but not Necessary
Prostate Cancer
Breast Cancer
Lung Cancer (NSCLC)
Cervical Disease
Renal Cancer
Melanoma
Colon Cancer
OverdiagnosisCure is Possible but not Necessary
In the US, it is estimated:
More than half of all screen diagnosed prostate cancers
At least fifteen percent of screen detected frank breast cancers. A larger proportion of Ductal carcinoma in situ (DCIS)
Perhaps ten percent or more of lung cancers diagnosed through CT screening
A large proportion of cervical dysplasia
A Genomic Definition of CancerGenetics vs Genomics
Genetics is the study of heredity or inherited traits (such as eye color) and alterations in specific genes that may impact the individual potential for a given health condition.
Genomics is the study of complex sets of genes, how they are expressed in cells (what their level of activity is), and the role they play in biology.
The Growth in Cancer Incidence and Mortality is due to:
The increasing size of and the aging of the population
Industrialization and adaptation of Western habits (smoking, diet, etc.) This is especially a problem in South America, Africa and Asia
Growing biotechnology and development of diagnostic tests and screening technologies.
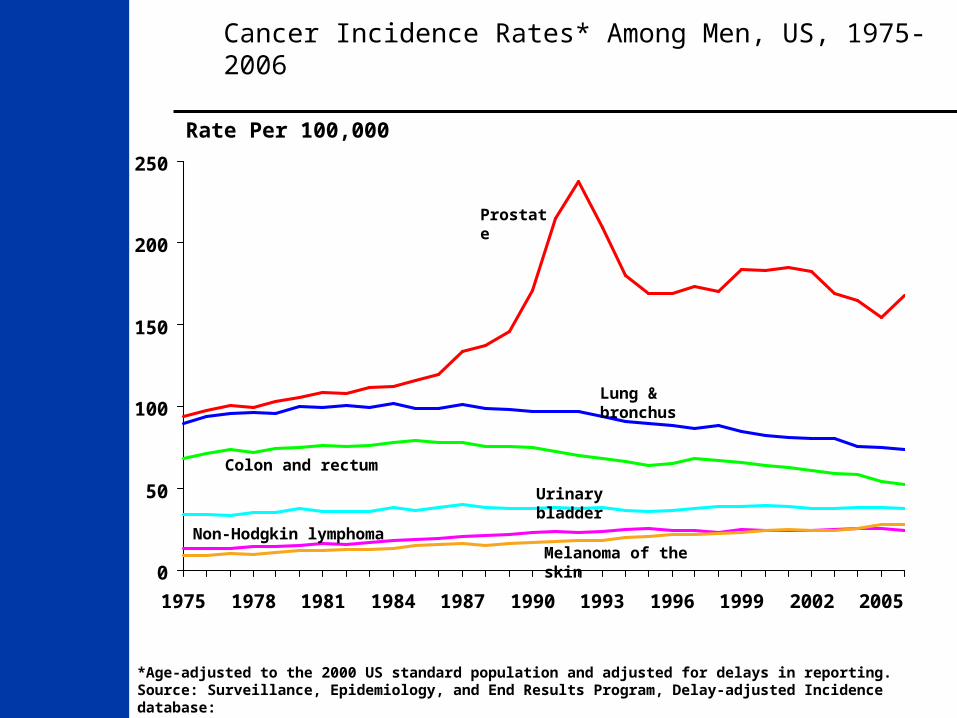
Cancer Incidence Rates* Among Men, US, 1975-2006
0
50
100
150
200
250
1975 1978 1981 1984 1987 1990 1993 1996 1999 2002 2005
Prostate
Lung & bronchus
Colon and rectum
Urinary bladder
Non-Hodgkin lymphoma
Rate Per 100,000
Melanoma of the skin
*Age-adjusted to the 2000 US standard population and adjusted for delays in reporting.Source: Surveillance, Epidemiology, and End Results Program, Delay-adjusted Incidence database: SEER Incidence Delay-adjusted Rates, 9 Registries, 1975-2006, National Cancer Institute, 2009.

Cancer Death Rates* Among Men, US,1930-2006
*Age-adjusted to the 2000 US standard population.Source: US Mortality Data 1960-2006, US Mortality Volumes 1930-1959,National Center for Health Statistics, Centers for Disease Control and Prevention, 2009.
0
20
40
60
80
10019
30
1935
1940
1945
1950
1955
1960
1965
1970
1975
1980
1985
1990
1995
2000
2005
Lung & bronchus
Colon & rectum
Stomach
Rate Per 100,000
Prostate
Pancreas
LiverLeukemia
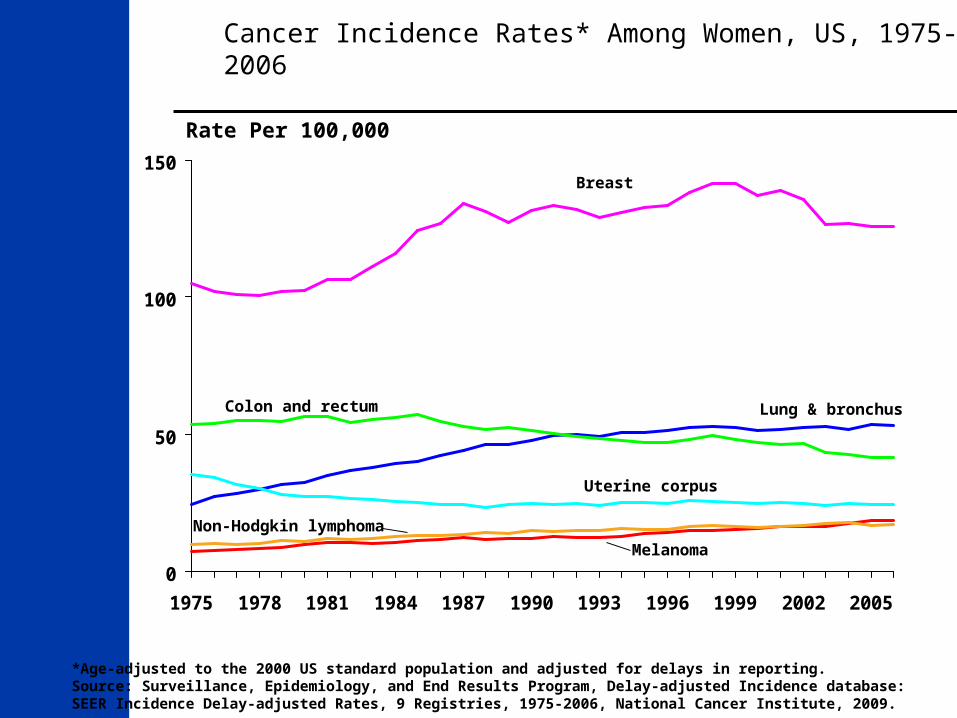
Cancer Incidence Rates* Among Women, US, 1975-2006
*Age-adjusted to the 2000 US standard population and adjusted for delays in reporting.Source: Surveillance, Epidemiology, and End Results Program, Delay-adjusted Incidence database: SEER Incidence Delay-adjusted Rates, 9 Registries, 1975-2006, National Cancer Institute, 2009.
0
50
100
150
1975 1978 1981 1984 1987 1990 1993 1996 1999 2002 2005
Colon and rectum
Rate Per 100,000
Breast
Lung & bronchus
Uterine corpus
Melanoma
Non-Hodgkin lymphoma
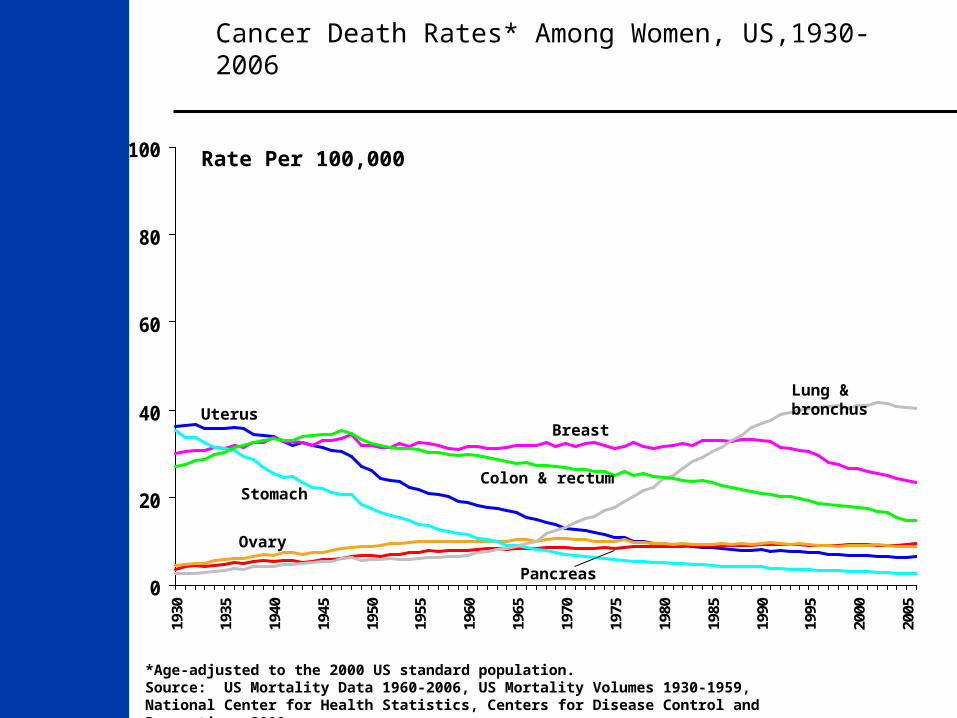
Cancer Death Rates* Among Women, US,1930-2006
*Age-adjusted to the 2000 US standard population.Source: US Mortality Data 1960-2006, US Mortality Volumes 1930-1959,National Center for Health Statistics, Centers for Disease Control and Prevention, 2009.
0
20
40
60
80
10019
30
1935
1940
1945
1950
1955
1960
1965
1970
1975
1980
1985
1990
1995
2000
2005
Lung & bronchus
Colon & rectum
Uterus
Stomach
Breast
Ovary
Pancreas
Rate Per 100,000
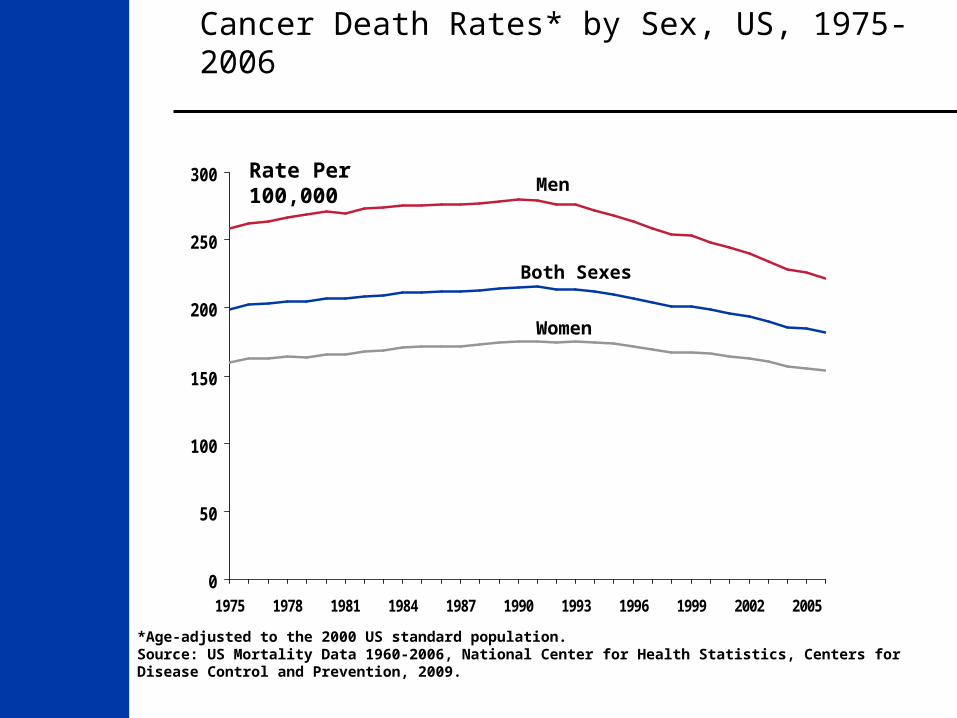
Cancer Death Rates* by Sex, US, 1975-2006
*Age-adjusted to the 2000 US standard population.Source: US Mortality Data 1960-2006, National Center for Health Statistics, Centers for Disease Control and Prevention, 2009.
0
50
100
150
200
250
300
1975 1978 1981 1984 1987 1990 1993 1996 1999 2002 2005
Men
Both Sexes
Rate Per 100,000
Women
0
50
100
150
200
250
300
350
400
450
500
1975 1978 1981 1984 1987 1990 1993 1996 1999 2002 2005
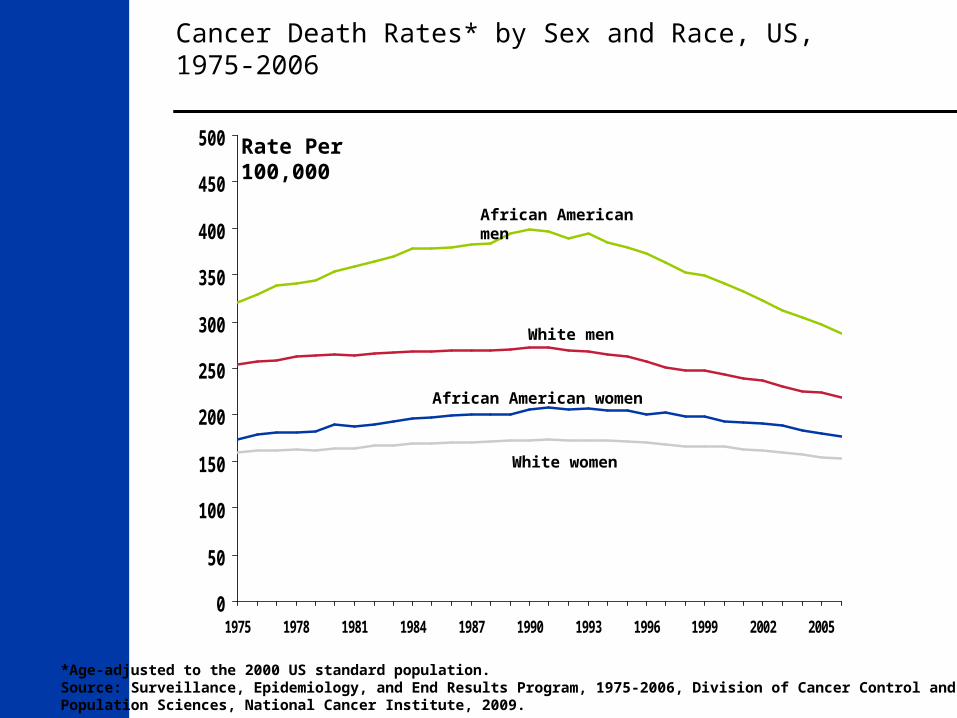
African American men
White men
African American women
White women
Rate Per 100,000
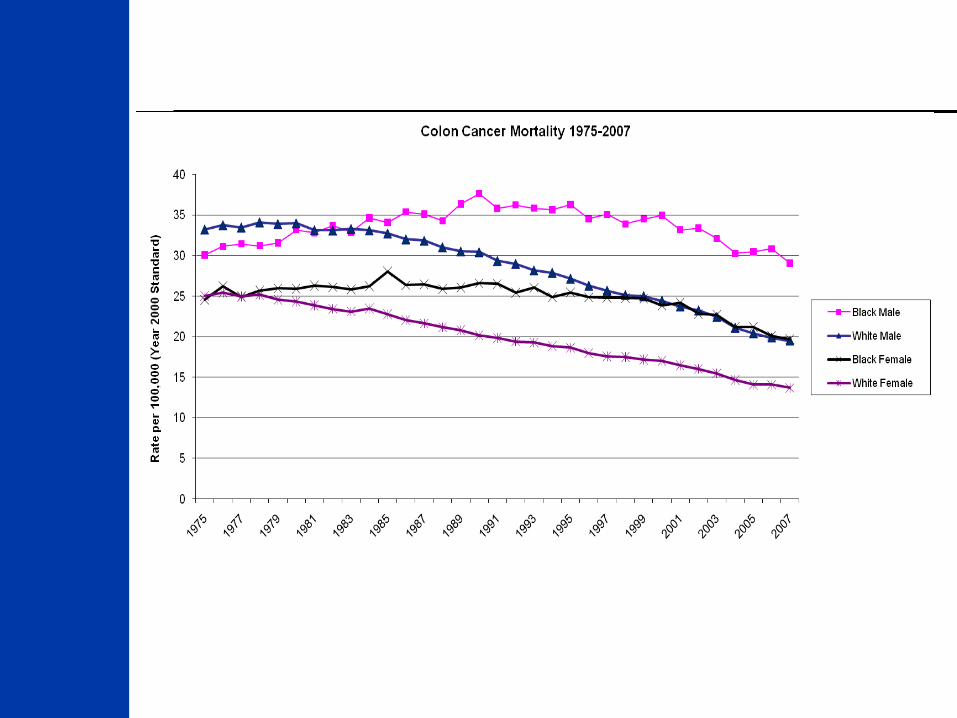
Cancer Death Rates* by Sex and Race, US, 1975-2006
*Age-adjusted to the 2000 US standard population.Source: Surveillance, Epidemiology, and End Results Program, 1975-2006, Division of Cancer Control andPopulation Sciences, National Cancer Institute, 2009.
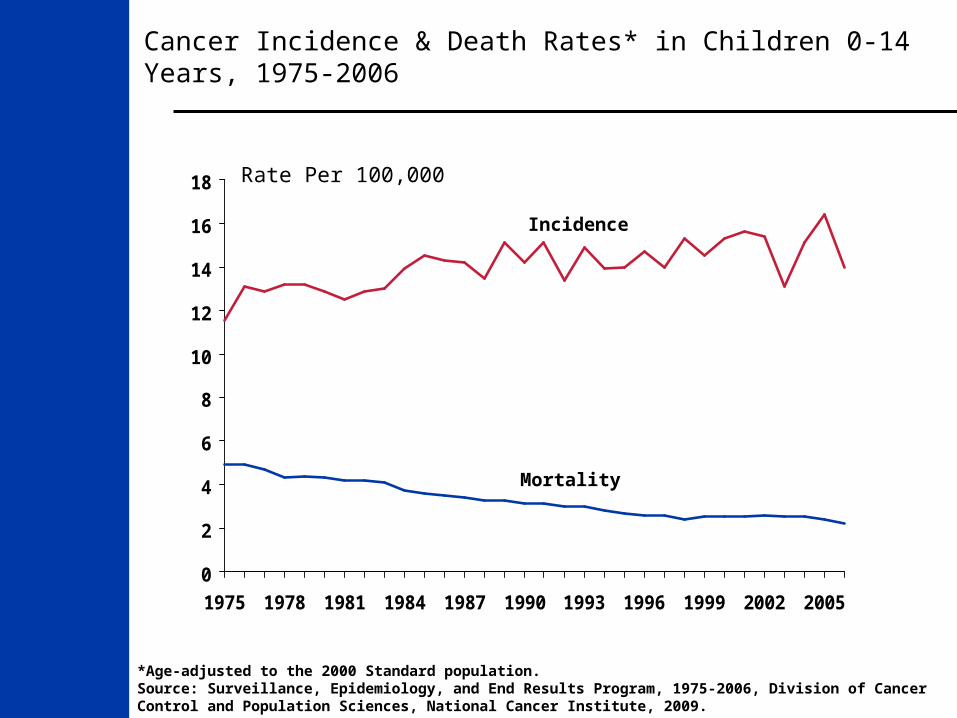
Cancer Incidence & Death Rates* in Children 0-14 Years, 1975-2006
0
2
4
6
8
10
12
14
16
18
1975 1978 1981 1984 1987 1990 1993 1996 1999 2002 2005
Incidence
Mortality
Rate Per 100,000
*Age-adjusted to the 2000 Standard population.Source: Surveillance, Epidemiology, and End Results Program, 1975-2006, Division of Cancer Control and Population Sciences, National Cancer Institute, 2009.
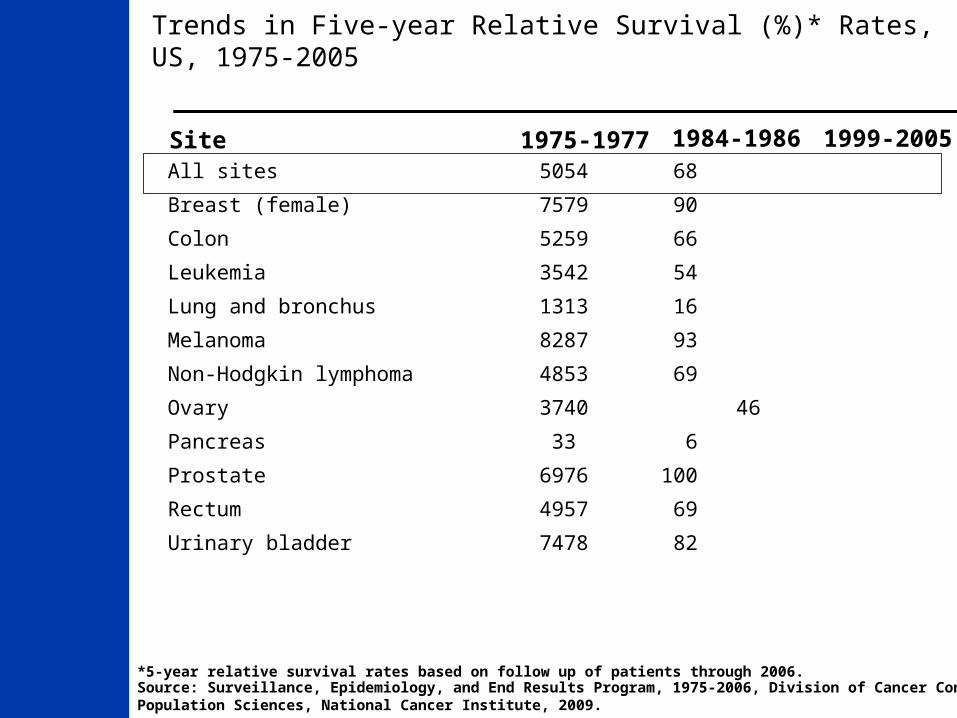
Trends in Five-year Relative Survival (%)* Rates, US, 1975-2005
*5-year relative survival rates based on follow up of patients through 2006. Source: Surveillance, Epidemiology, and End Results Program, 1975-2006, Division of Cancer Control andPopulation Sciences, National Cancer Institute, 2009.
Site 1975-1977 1984-1986 1999-2005All sites 50 54 68
Breast (female) 75 79 90
Colon 52 59 66
Leukemia 35 42 54
Lung and bronchus 13 13 16
Melanoma 82 87 93
Non-Hodgkin lymphoma 48 53 69
Ovary 37 40 46
Pancreas 3 3 6
Prostate 69 76 100
Rectum 49 57 69
Urinary bladder 74 78 82
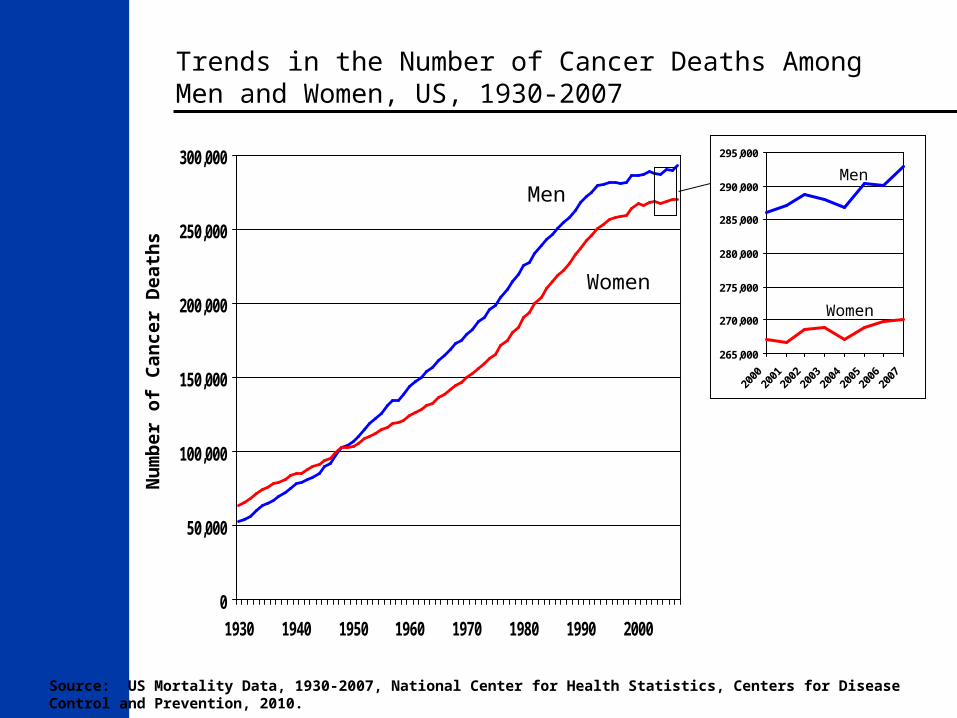
Trends in the Number of Cancer Deaths Among Men and Women, US, 1930-2007
0
50,000
100,000
150,000
200,000
250,000
300,000
1930 1940 1950 1960 1970 1980 1990 2000
Women
Men
Nu
mb
er o
f C
ance
r D
eath
s
265,000
270,000
275,000
280,000
285,000
290,000
295,000
Men
Women
Source: US Mortality Data, 1930-2007, National Center for Health Statistics, Centers for Disease Control and Prevention, 2010.
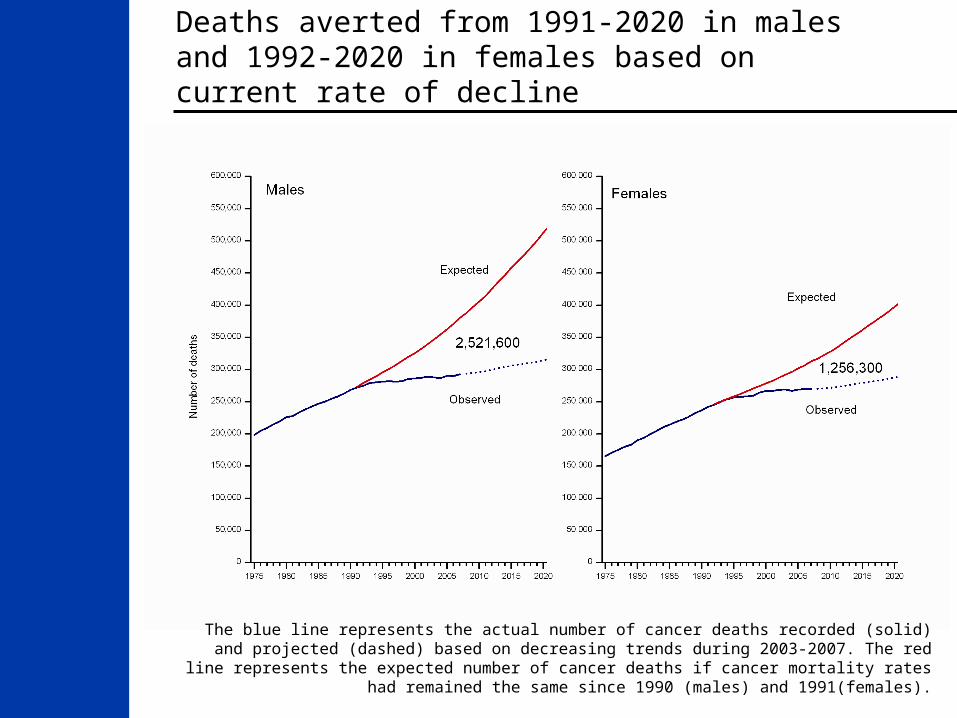
Deaths averted from 1991-2020 in males and 1992-2020 in females based on current rate of decline
The blue line represents the actual number of cancer deaths recorded (solid) and projected (dashed) based on decreasing trends during 2003-2007. The red line represents the expected number of cancer deaths if cancer mortality rates had remained the same since 1990 (males)
and 1991(females).

Trends in Cigarette Smoking Prevalence* (%), by Sex, Adults 18 and Older, US, 1965-2008
*Redesign of survey in 1997 may affect trends. Estimates are age adjusted to the 2000 US standard population using five age groups: 18-24, 25-34 years, 35-44 years, 45-64 years, and 65 years and over. Source: National Health Interview Survey, 1965-2008, National Center for Health Statistics, Centers for Disease Control and Prevention, 2009.
0
10
20
30
40
50
60
1965
1974
1979
1983
1985
1990
1992
1994
1995
1997
1998
1999
2000
2001
2002
2003
2004
2005
2006
2007
2008
Year
Pre
vale
nce
(%
)
Men
Women
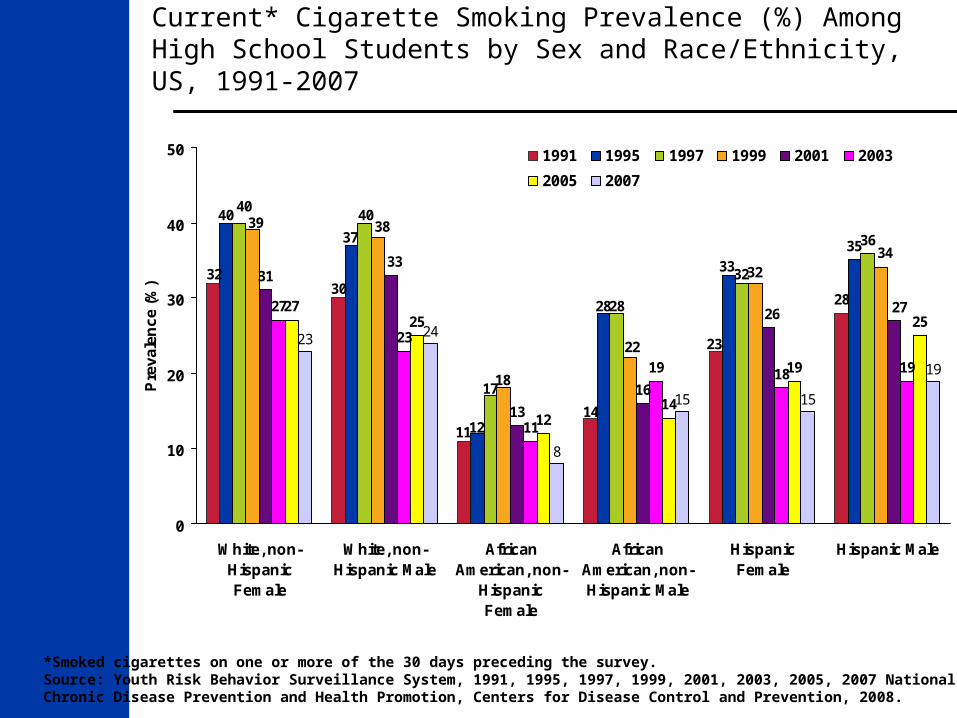
Current* Cigarette Smoking Prevalence (%) Among High School Students by Sex and Race/Ethnicity, US, 1991-2007
*Smoked cigarettes on one or more of the 30 days preceding the survey.Source: Youth Risk Behavior Surveillance System, 1991, 1995, 1997, 1999, 2001, 2003, 2005, 2007 National Center for Chronic Disease Prevention and Health Promotion, Centers for Disease Control and Prevention, 2008.
28
35
31
13
16
27
23
11
19 18 19
2725
1214
19
2523 24
8
15 15
19
3230
11
14
23
40
37
12
28
33
4040
17
32
36
28
34
39 38
22
32
18
33
2726
0
10
20
30
40
50
White, non-HispanicFemale
White, non-Hispanic Male
AfricanAmerican, non-
HispanicFemale
AfricanAmerican, non-Hispanic Male
HispanicFemale
Hispanic Male
Pre
vale
nce
(%
)1991 1995 1997 1999 2001 2003
2005 2007
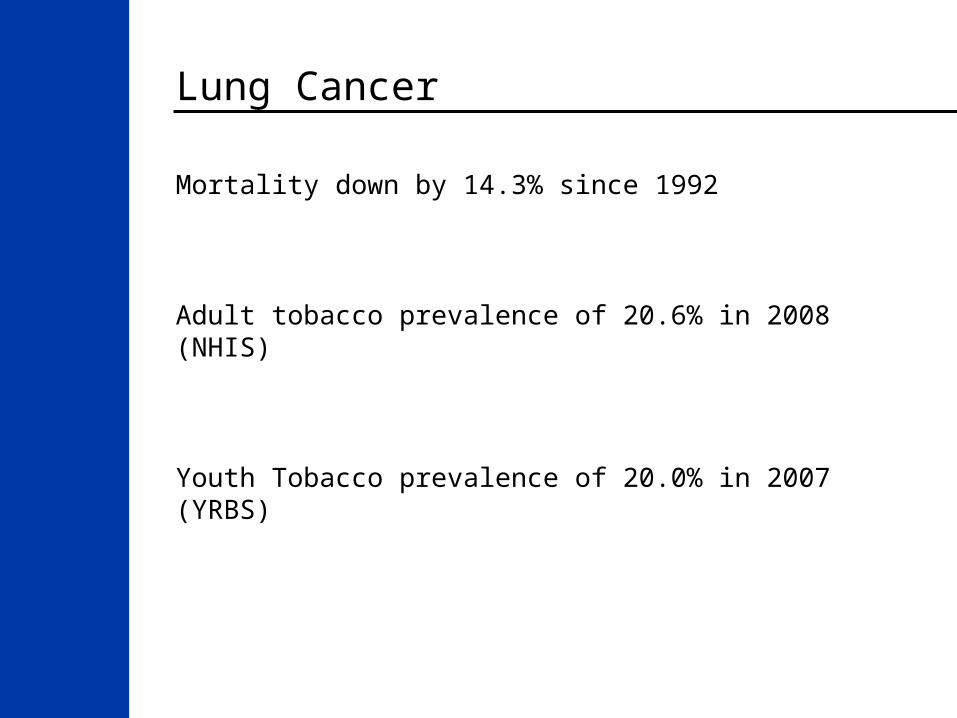
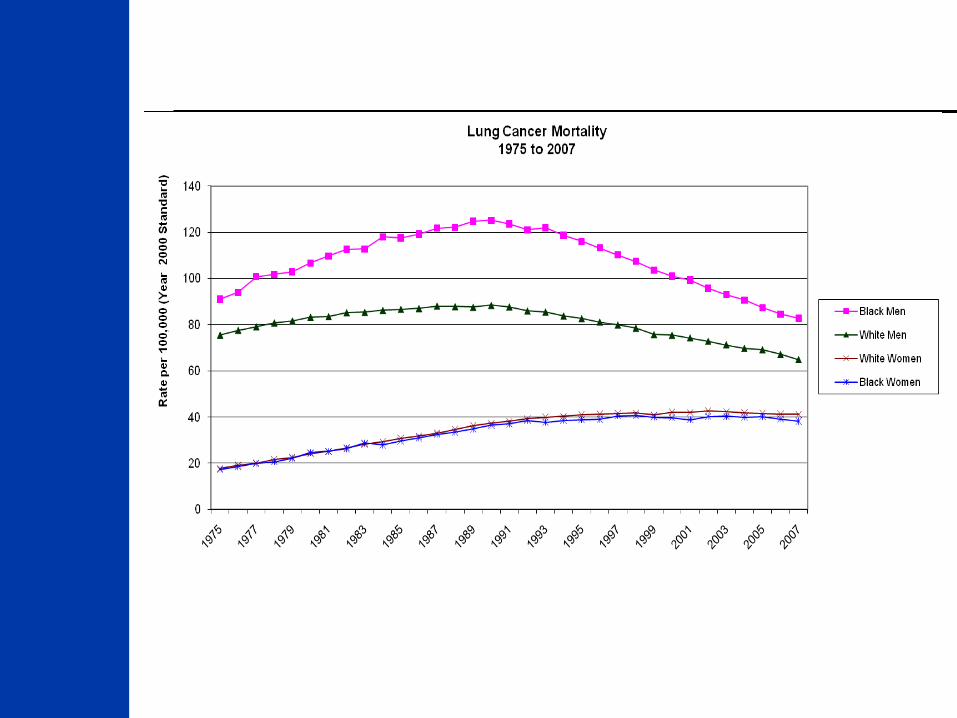
Lung Cancer
Mortality down by 14.3% since 1992
Adult tobacco prevalence of 20.6% in 2008 (NHIS)
Youth Tobacco prevalence of 20.0% in 2007 (YRBS)
Prostate Cancer Screening
An issue that must be approached ethically, logically and rationally
We must realize:
What we know.
What we do not know.
What we believe.
American Urological Association
Given the uncertainty that PSA testing results in more benefit than harm, a thoughtful and broad approach to PSA is critical.
Patients need to be informed of the risks and benefits of testing before it is undertaken. The risks of overdetection and overtreatment should be included in this discussion.
PSA Best Practice Statement 2009
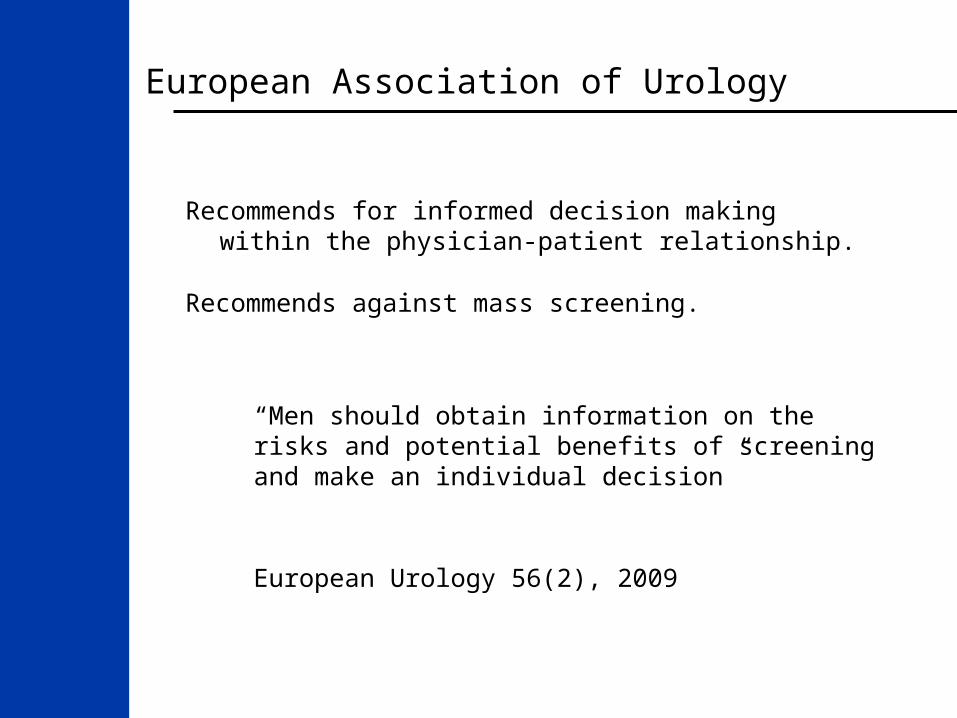
European Association of Urology
Recommends for informed decision making within the physician-patient relationship.
Recommends against mass screening.
“Men should obtain information on the risks and potential benefits of screening and make an individual decision”
European Urology 56(2), 2009
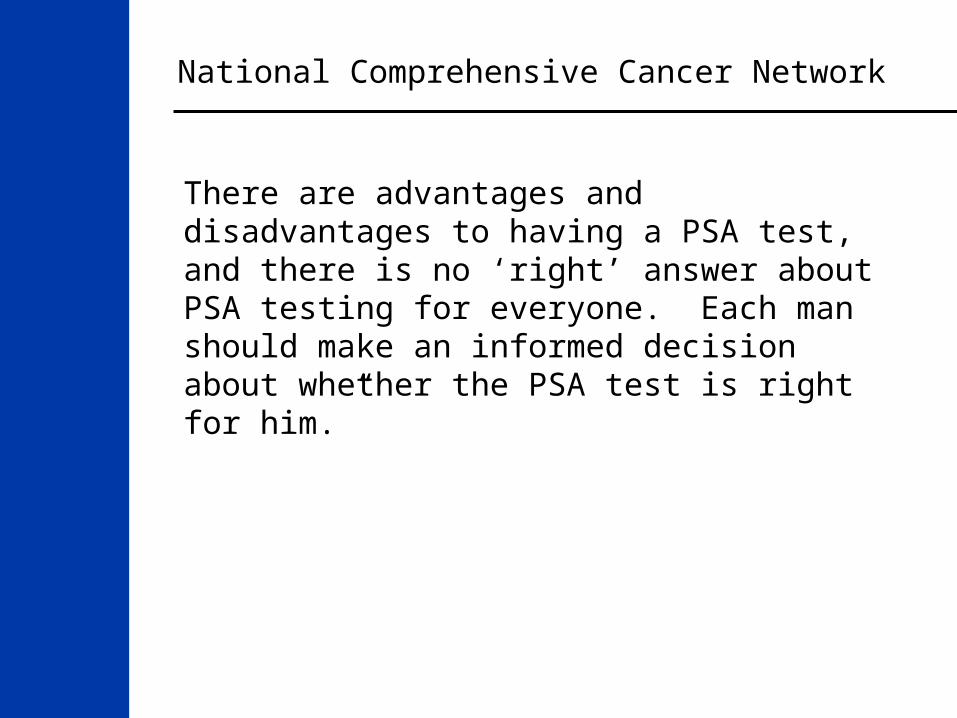
National Comprehensive Cancer Network
There are advantages and disadvantages to having a PSA test, and there is no ‘right’ answer about PSA testing for everyone. Each man should make an informed decision about whether the PSA test is right for him.”
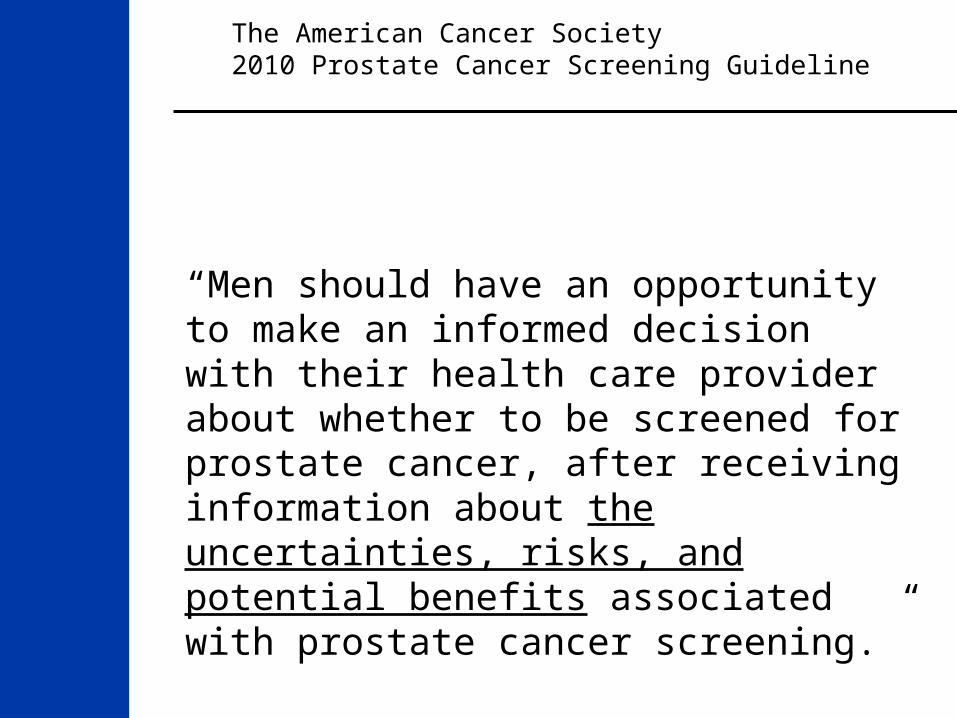
“Men should have an opportunity to make an informed decision with their health care provider about whether to be screened for prostate cancer, after receiving information about the uncertainties, risks, and potential benefits associated with prostate cancer screening.”
The American Cancer Society 2010 Prostate Cancer Screening Guideline
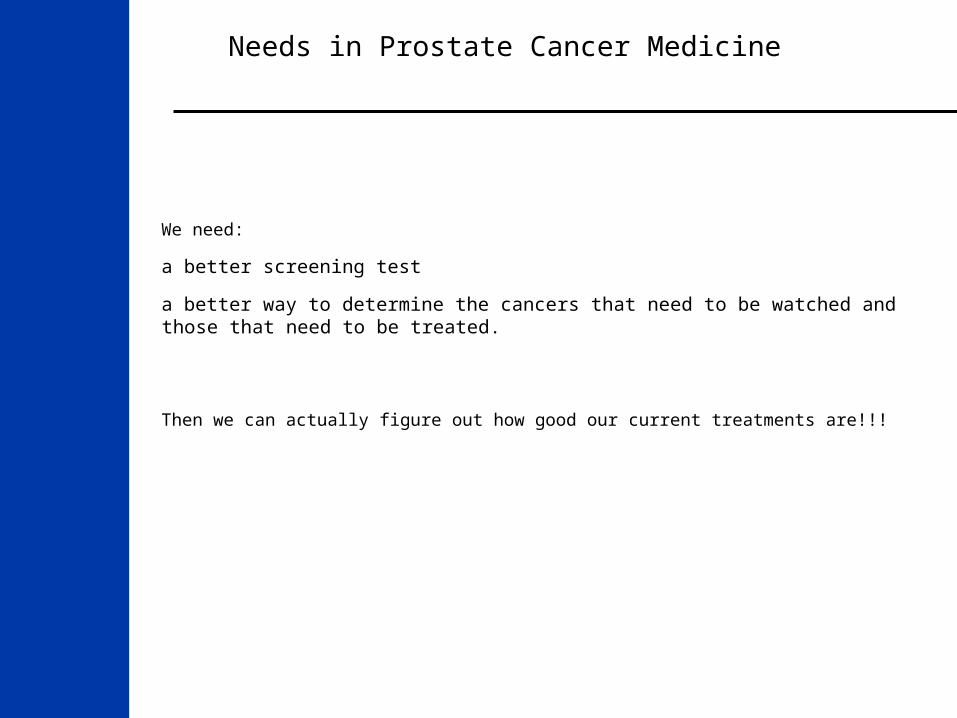
Needs in Prostate Cancer Medicine
We need:
a better screening test
a better way to determine the cancers that need to be watched and those that need to be treated.
Then we can actually figure out how good our current treatments are!!!
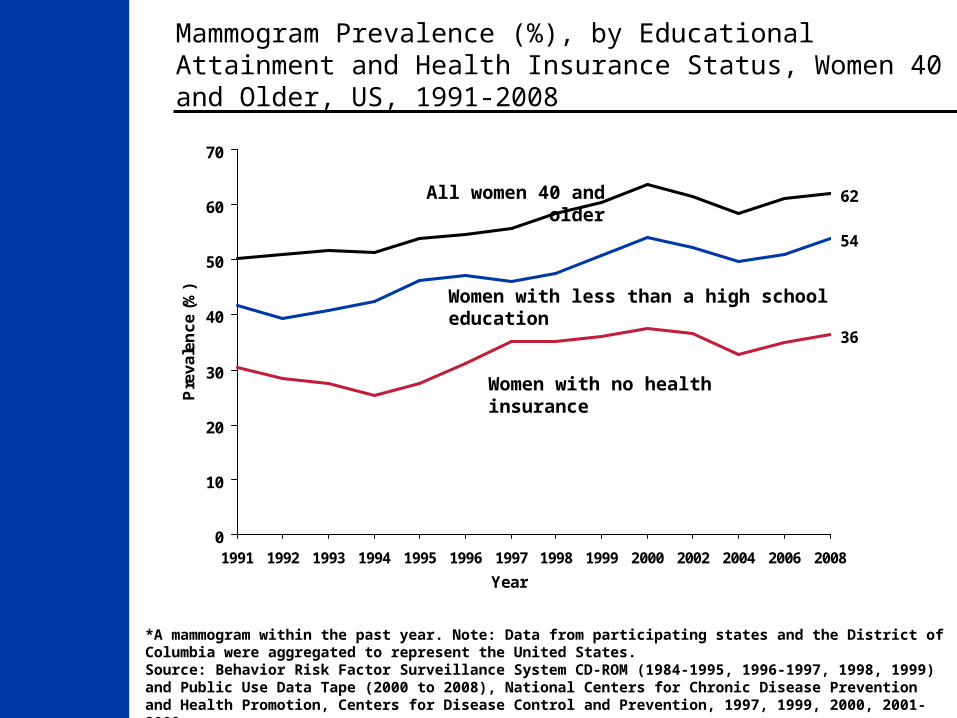
Mammogram Prevalence (%), by Educational Attainment and Health Insurance Status, Women 40 and Older, US, 1991-2008
*A mammogram within the past year. Note: Data from participating states and the District of Columbia were aggregated to represent the United States.Source: Behavior Risk Factor Surveillance System CD-ROM (1984-1995, 1996-1997, 1998, 1999) and Public Use Data Tape (2000 to 2008), National Centers for Chronic Disease Prevention and Health Promotion, Centers for Disease Control and Prevention, 1997, 1999, 2000, 2001-2009.
54
36
62
0
10
20
30
40
50
60
70
1991 1992 1993 1994 1995 1996 1997 1998 1999 2000 2002 2004 2006 2008
Year
Pre
va
len
ce
(%
)
Women with less than a high school education
Women with no health insurance
All women 40 and older

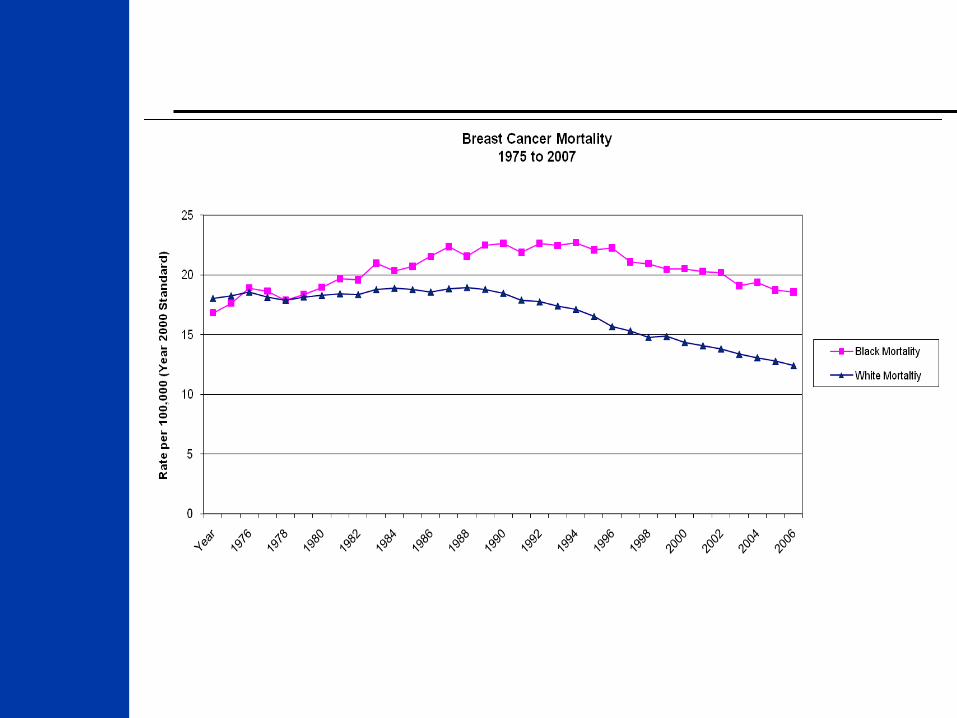
Breast Cancer as of 2008
Mortality down by 30.1% since 1992
Early Detection: Of women aged 40 and older who have breast screening :
53% (NHIS),
62.1% (BRFSS)
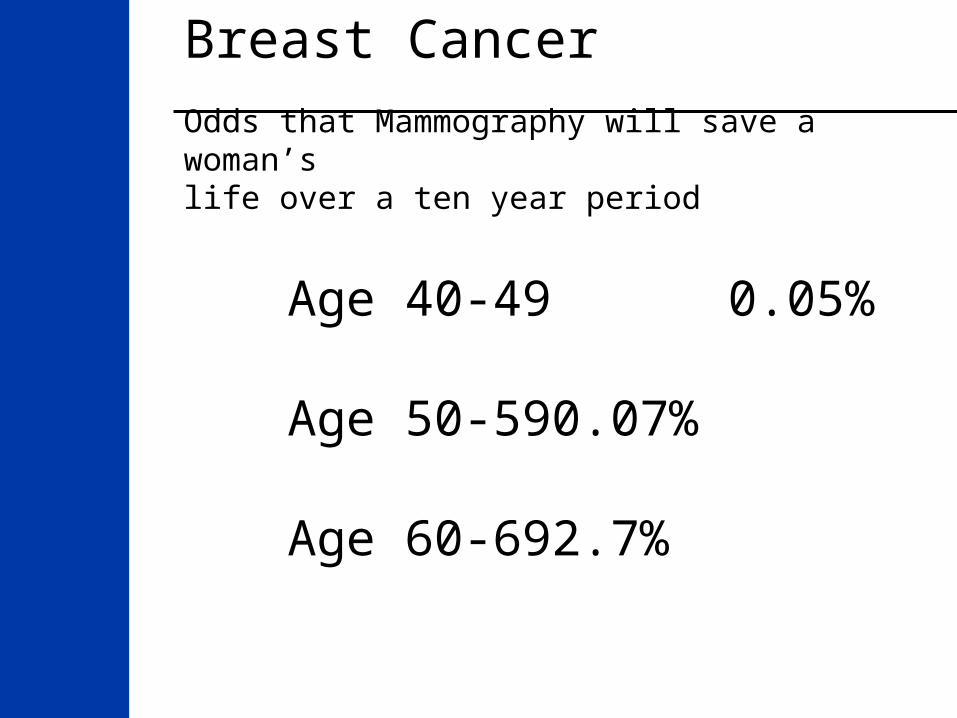
Breast CancerOdds that Mammography will save a woman’s life over a ten year period
Age 40-49 0.05%
Age 50-59 0.07%
Age 60-69 2.7%
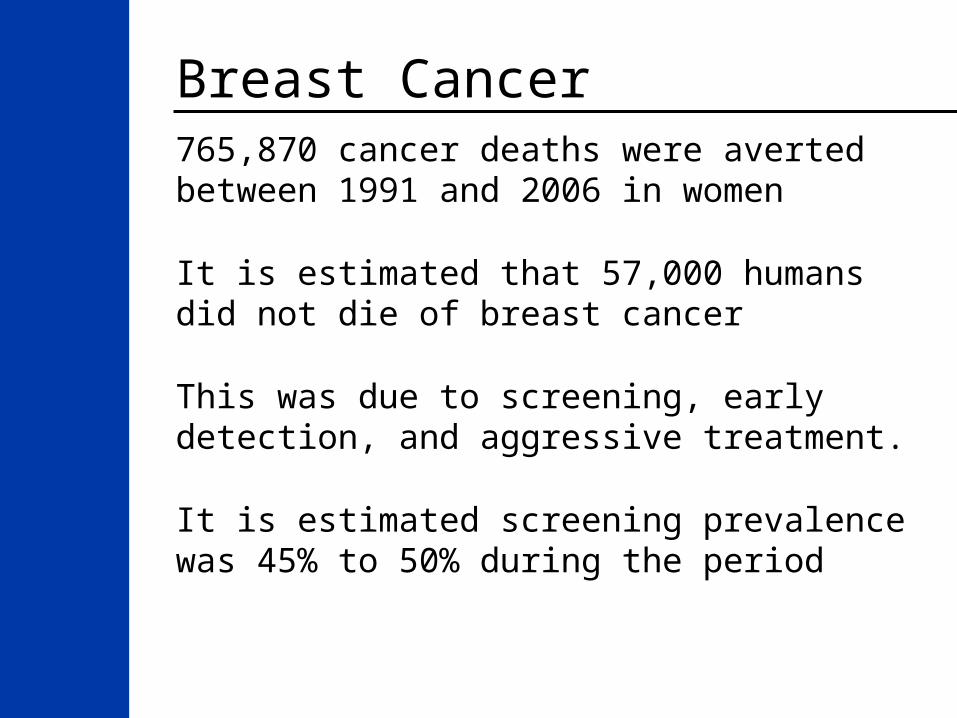
Breast Cancer765,870 cancer deaths were averted between 1991 and 2006 in women
It is estimated that 57,000 humans did not die of breast cancer
This was due to screening, early detection, and aggressive treatment.
It is estimated screening prevalence was 45% to 50% during the period
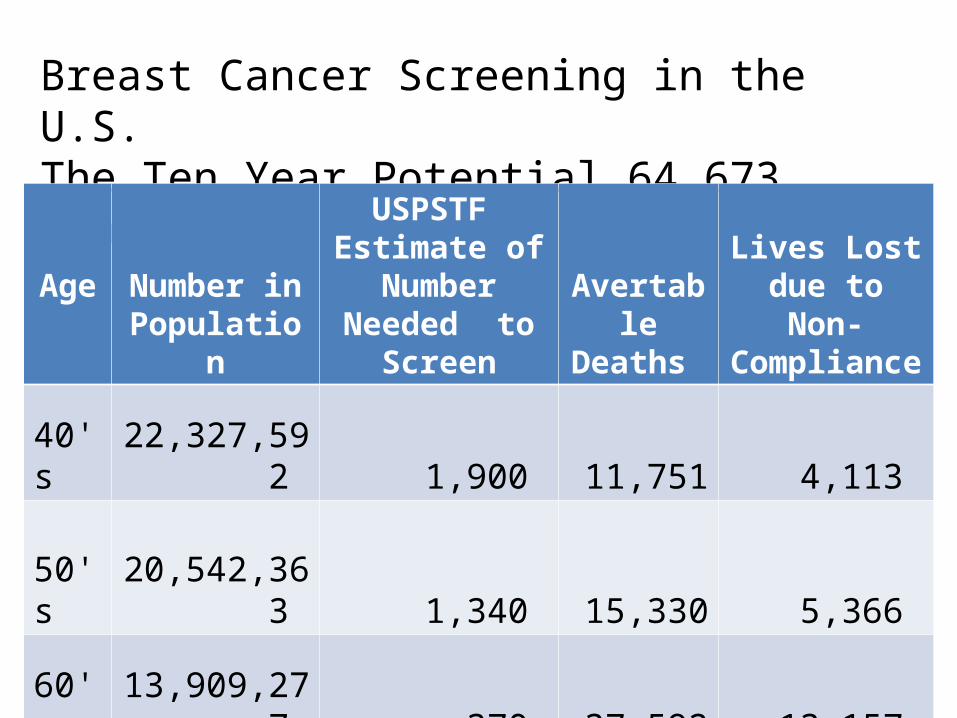
Breast Cancer Screening in the U.S.The Ten Year Potential 64,673 deaths averted
AgeNumber inPopulation
USPSTF Estimate of
Number Needed to Screen
Avertable Deaths
Lives Lost due to Non-
Compliance
40's 22,327,592 1,900 11,751 4,113
50's 20,542,363 1,340 15,330 5,366
60's 13,909,277 370 37,592 13,157
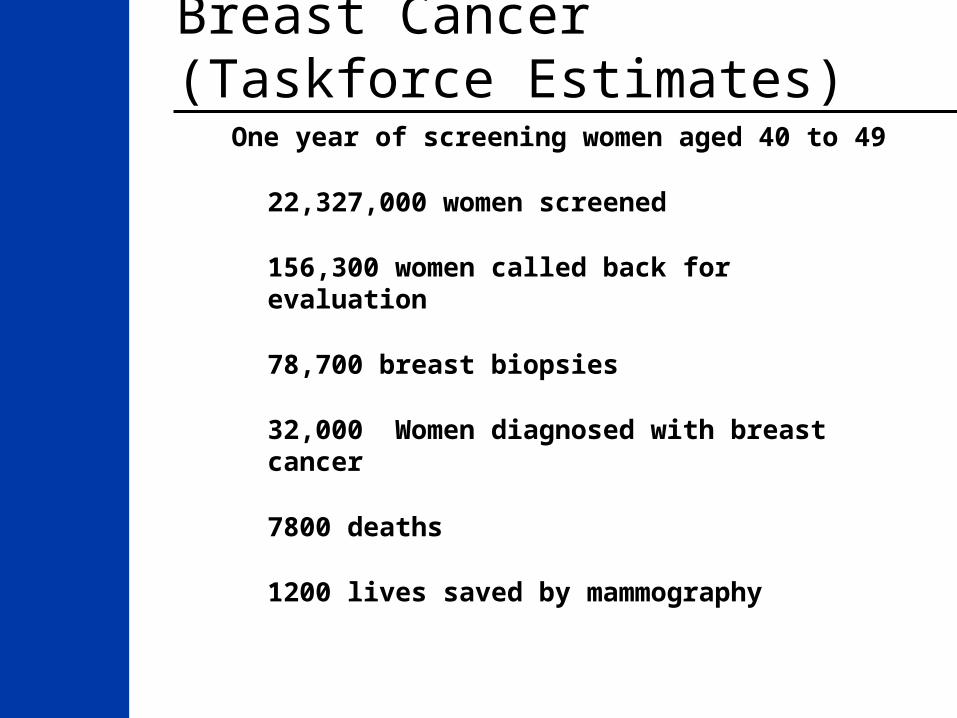
Breast Cancer (Taskforce Estimates)One year of screening women aged 40 to
49
22,327,000 women screened
156,300 women called back for evaluation
78,700 breast biopsies
32,000 Women diagnosed with breast cancer
7800 deaths
1200 lives saved by mammography

Breast Cancer (Taskforce Estimates)One year of screening women aged 40 to
49
22,327,000 women screened
32,000 diagnosed
24,200 survive
7800 deaths
1200 lives saved by mamography
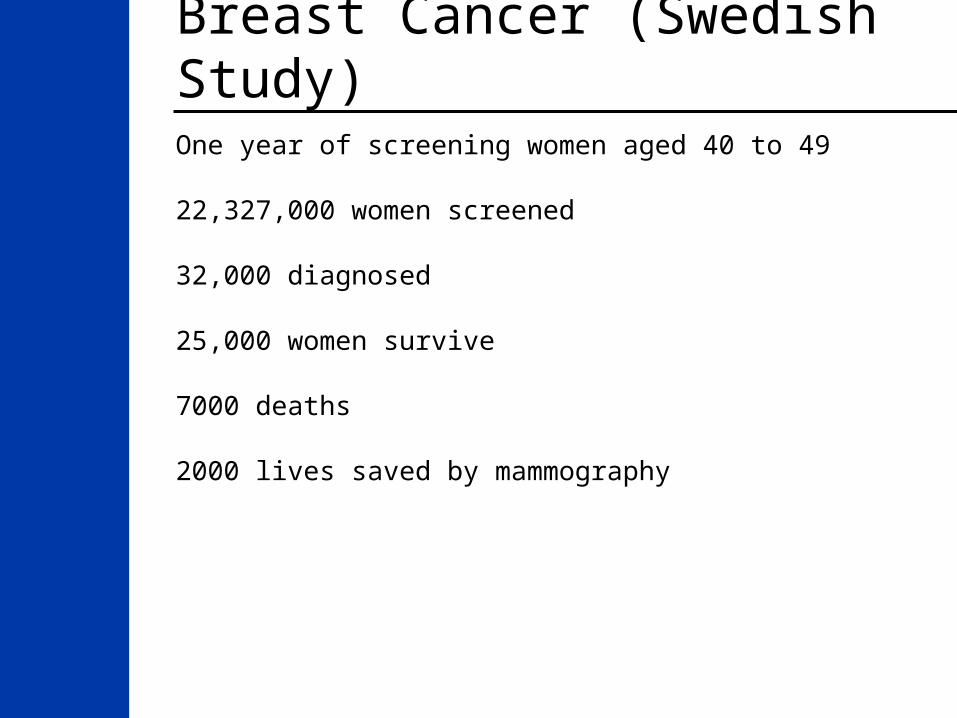
Breast Cancer (Swedish Study)One year of screening women aged 40 to 49
22,327,000 women screened
32,000 diagnosed
25,000 women survive
7000 deaths
2000 lives saved by mammography

Breast CancerTaskforce vs Swedish Study (estimates)
22,327,000 women screened per year
32,000 diagnosed
24,200 to 25,000 women survive
7000 to 7800 deaths
1200 lives saved vs 2000 lives saves
Difference of about 800 Lives per year
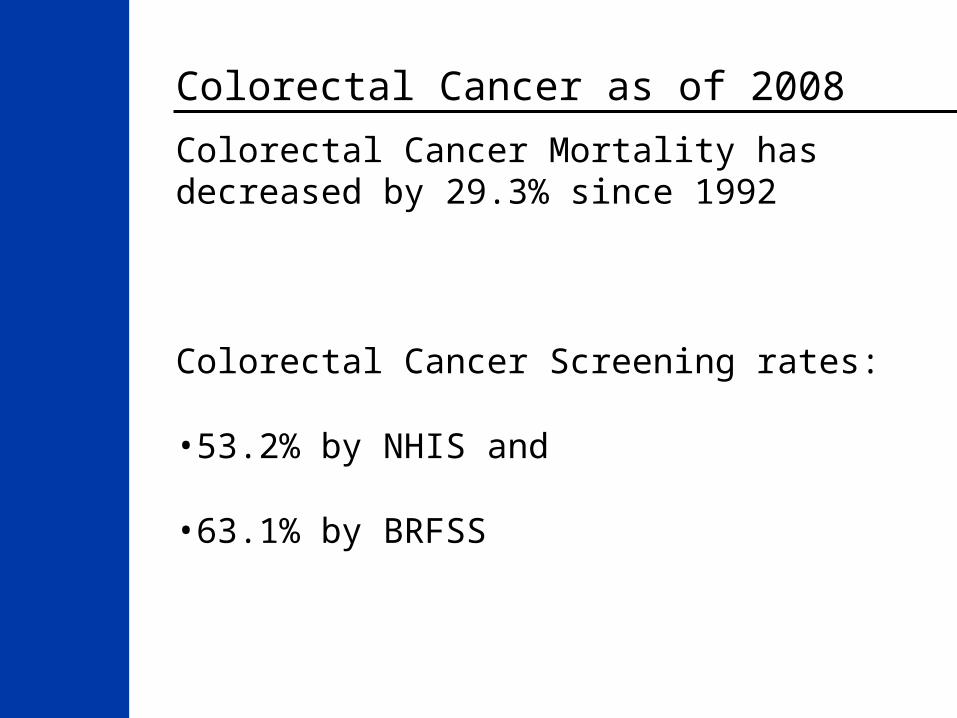
Colorectal Cancer as of 2008
Colorectal Cancer Mortality has decreased by 29.3% since 1992
Colorectal Cancer Screening rates:
•53.2% by NHIS and
•63.1% by BRFSS
20
16
8
21
16
9
18
12
22
16
9
19
14
9
16
12
8
1513
7
24
0
5
10
15
20
25
30
Total Less than a high schooleducation
No health insurance
Pre
va
len
ce
(%
)
1997 1999 2001 20022004 2006 2008
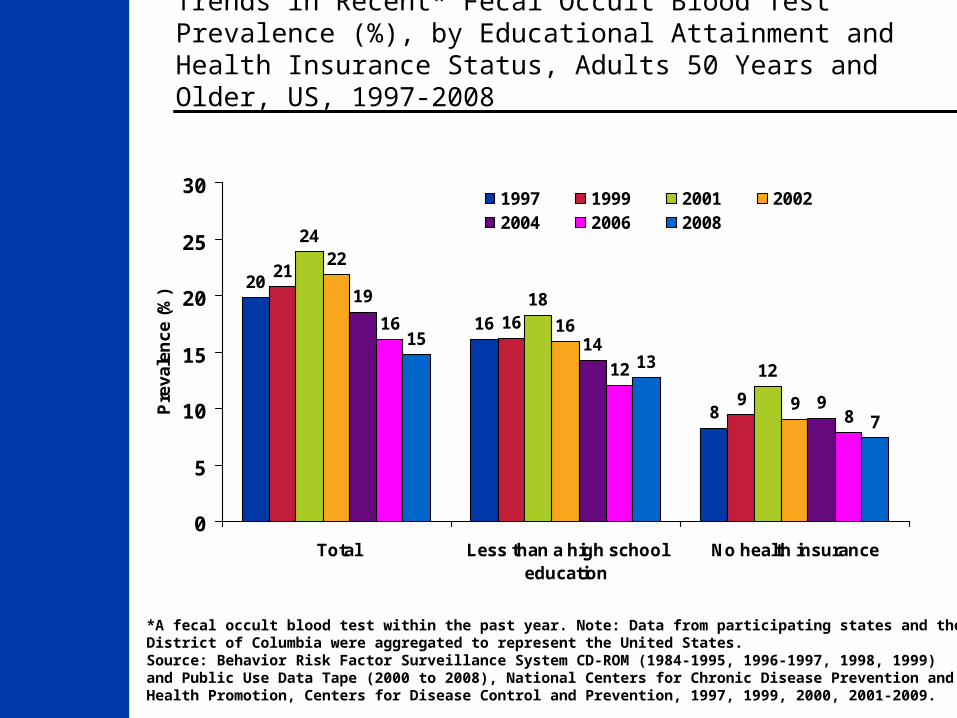
Trends in Recent* Fecal Occult Blood Test Prevalence (%), by Educational Attainment and Health Insurance Status, Adults 50 Years and Older, US, 1997-2008
*A fecal occult blood test within the past year. Note: Data from participating states and the District of Columbia were aggregated to represent the United States. Source: Behavior Risk Factor Surveillance System CD-ROM (1984-1995, 1996-1997, 1998, 1999) and Public Use Data Tape (2000 to 2008), National Centers for Chronic Disease Prevention and Health Promotion, Centers for Disease Control and Prevention, 1997, 1999, 2000, 2001-2009.
44
37
22
44
36
21
45
36
21
50
41
22
56
43
25
60
42
26
0
10
20
30
40
50
60
70
Total Less than a high schooleducation
No health insurance
Pre
vale
nce
(%
)1999 2001 2002 20042006 2008
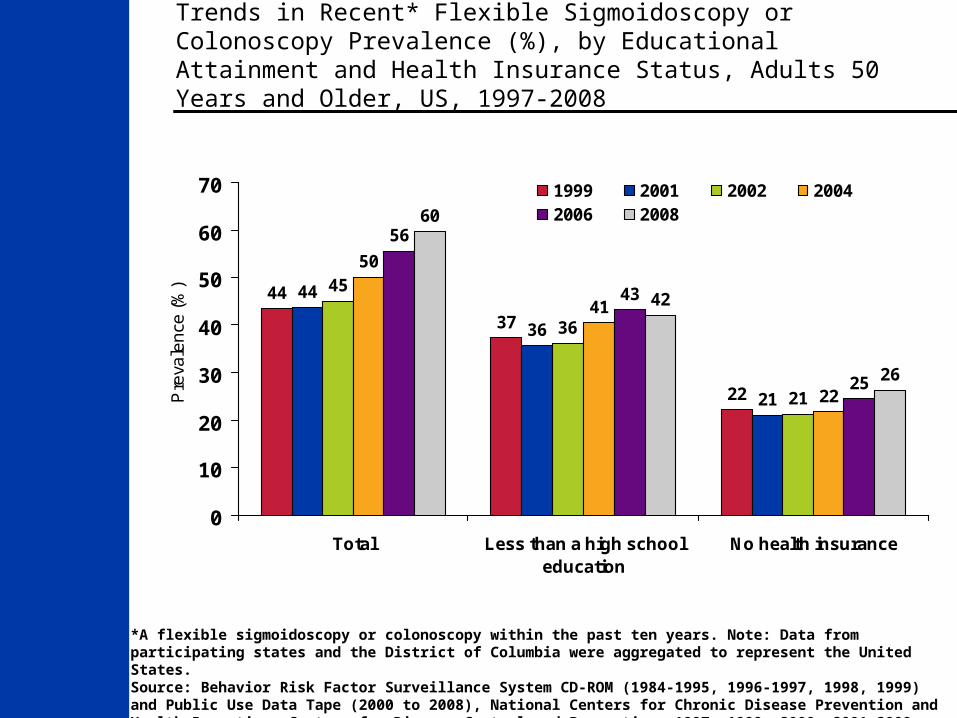
Trends in Recent* Flexible Sigmoidoscopy or Colonoscopy Prevalence (%), by Educational Attainment and Health Insurance Status, Adults 50 Years and Older, US, 1997-2008
*A flexible sigmoidoscopy or colonoscopy within the past ten years. Note: Data from participating states and the District of Columbia were aggregated to represent the United States. Source: Behavior Risk Factor Surveillance System CD-ROM (1984-1995, 1996-1997, 1998, 1999) and Public Use Data Tape (2000 to 2008), National Centers for Chronic Disease Prevention and Health Promotion, Centers for Disease Control and Prevention, 1997, 1999, 2000, 2001-2009.

Nutrition and Physical Activity
Obesity, high caloric intake, and lack of physical activity has the potential of being a greater cause of cancer in the U.S. than tobacco by 2030
We are currently not able to model this in an acceptable fashion
It is causing a rise in cancer incidence
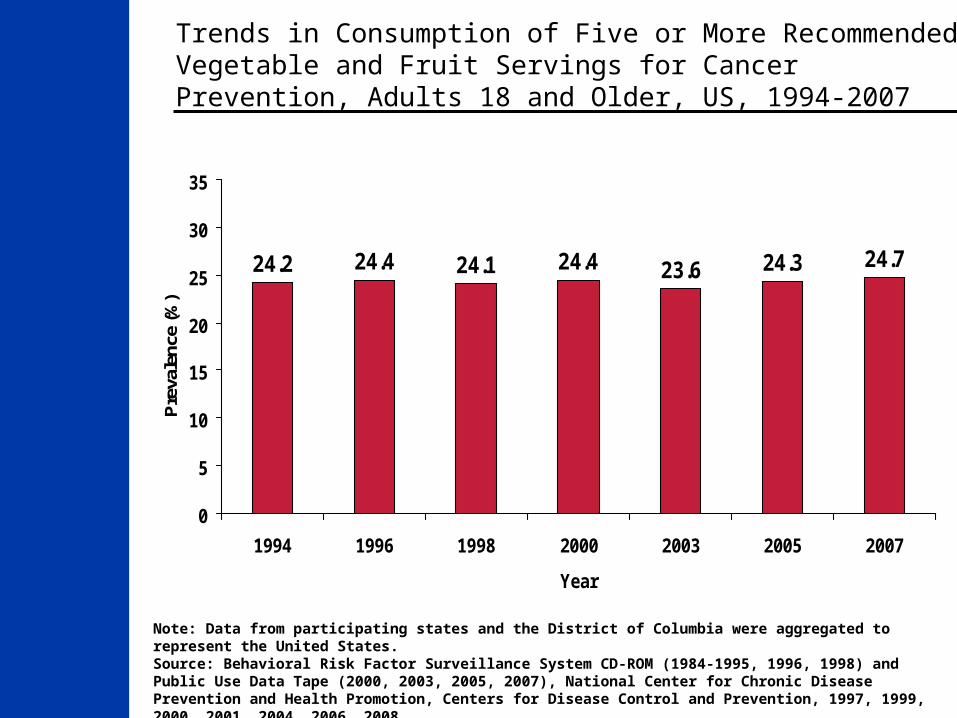
Note: Data from participating states and the District of Columbia were aggregated to represent the United States.Source: Behavioral Risk Factor Surveillance System CD-ROM (1984-1995, 1996, 1998) and Public Use Data Tape (2000, 2003, 2005, 2007), National Center for Chronic Disease Prevention and Health Promotion, Centers for Disease Control and Prevention, 1997, 1999, 2000, 2001, 2004, 2006, 2008.
24.2 24.4 24.1 24.4 23.6 24.3 24.7
0
5
10
15
20
25
30
35
1994 1996 1998 2000 2003 2005 2007
Year
Pre
vale
nce
(%)
Trends in Consumption of Five or More Recommended Vegetable and Fruit Servings for Cancer Prevention, Adults 18 and Older, US, 1994-2007
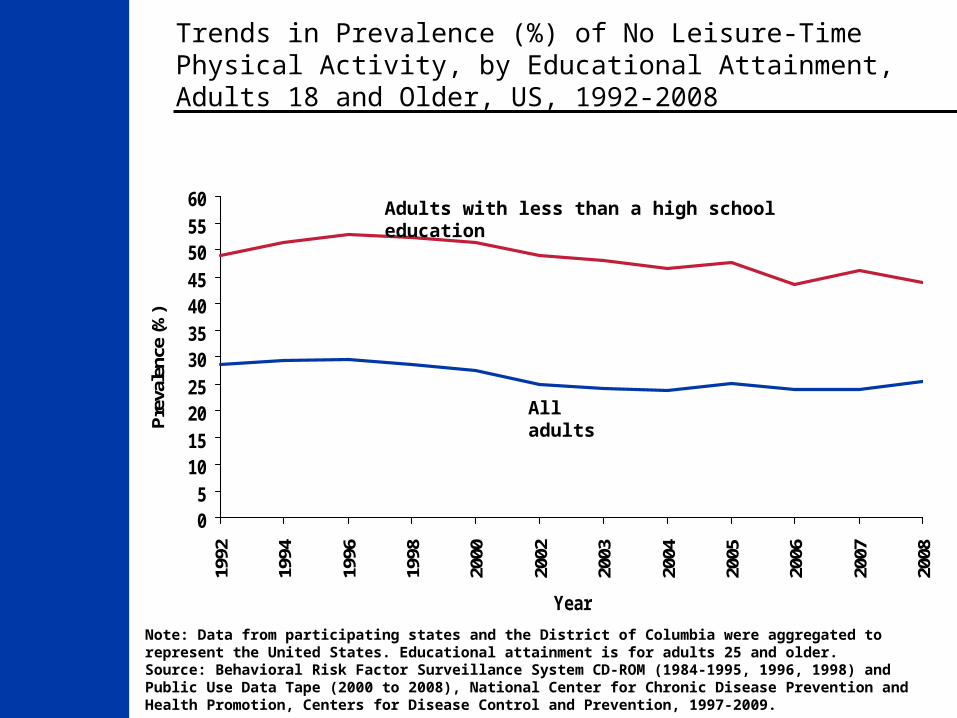
Trends in Prevalence (%) of No Leisure-Time Physical Activity, by Educational Attainment, Adults 18 and Older, US, 1992-2008
Note: Data from participating states and the District of Columbia were aggregated to represent the United States. Educational attainment is for adults 25 and older.Source: Behavioral Risk Factor Surveillance System CD-ROM (1984-1995, 1996, 1998) and Public Use Data Tape (2000 to 2008), National Center for Chronic Disease Prevention and Health Promotion, Centers for Disease Control and Prevention, 1997-2009.
05
1015202530354045505560
1992
1994
1996
1998
2000
2002
2003
2004
2005
2006
2007
2008
Year
Pre
vale
nce
(%)
Adults with less than a high school education
All adults

Trends in Obesity* Prevalence (%), By Gender, Adults Aged 20 to 74, US, 1960-2008†
*Obesity is defined as a body mass index of 30 kg/m2 or greater. † Age adjusted to the 2000 US standard population. Source: 1976-2006: National Health and Nutrition Examination Survey, Hispanic Health and Nutrition Examination Survey (1982–84). Centers for Disease Control and Prevention, National Center for Health Statistics, Health, United States, 2008, With Special Feature on the Health of Young Adults. Hyattsville, Maryland: 2009. 2007-2008: National Health and Nutrition Examination Survey Public Use Data File, 2007-2008 National Center for Health Statistics, Centers for Disease Control and Prevention, 2009.
1311
1615
12
1715
13
17
2321
26
3128
3433 333535
33
36
0
5
10
15
20
25
30
35
40
45
Both sexes Men Women
Pre
vale
nce
(%)
NHES I (1960-62) NHANES I (1971-74) NHANES II (1976-80) NHANES III (1988-94)
NHANES 1999-2002 NHANES 2003-06 NHANES 2007-08
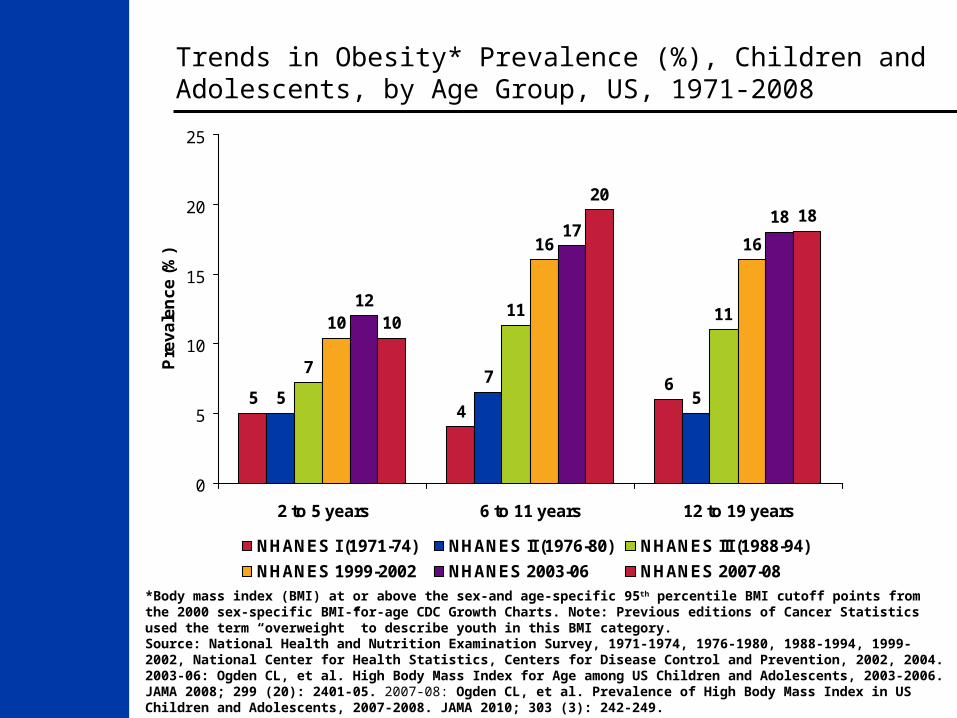
Trends in Obesity* Prevalence (%), Children and Adolescents, by Age Group, US, 1971-2008
*Body mass index (BMI) at or above the sex-and age-specific 95th percentile BMI cutoff points from the 2000 sex-specific BMI-for-age CDC Growth Charts. Note: Previous editions of Cancer Statistics used the term “overweight” to describe youth in this BMI category.Source: National Health and Nutrition Examination Survey, 1971-1974, 1976-1980, 1988-1994, 1999-2002, National Center for Health Statistics, Centers for Disease Control and Prevention, 2002, 2004. 2003-06: Ogden CL, et al. High Body Mass Index for Age among US Children and Adolescents, 2003-2006. JAMA 2008; 299 (20): 2401-05. 2007-08: Ogden CL, et al. Prevalence of High Body Mass Index in US Children and Adolescents, 2007-2008. JAMA 2010; 303 (3): 242-249.
54
65
75
7
11 1110
16 16
12
1718
10
2018
0
5
10
15
20
25
2 to 5 years 6 to 11 years 12 to 19 years
Pre
va
len
ce
(%
)
NHANES I (1971-74) NHANES II (1976-80) NHANES III (1988-94)
NHANES 1999-2002 NHANES 2003-06 NHANES 2007-08
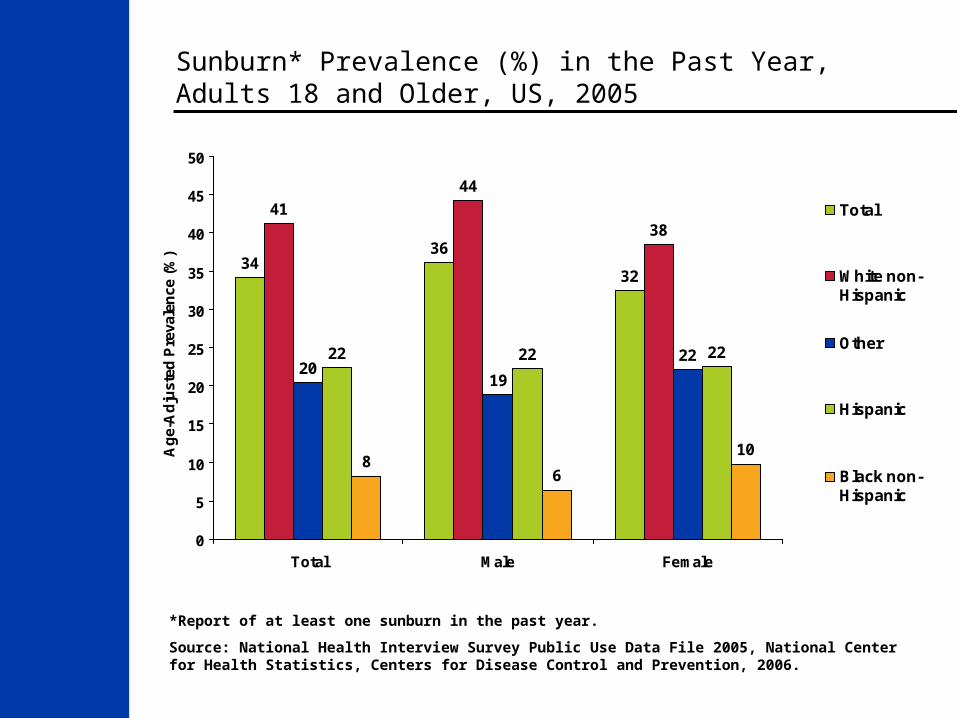
Sunburn* Prevalence (%) in the Past Year, Adults 18 and Older, US, 2005
3436
32
41
44
38
19
2222 22 22
86
10
20
0
5
10
15
20
25
30
35
40
45
50
Total Male Female
Ag
e-A
dju
sted
Pre
vale
nce
(%
)
Total
White non-Hispanic
Other
Hispanic
Black non-Hispanic
*Report of at least one sunburn in the past year.
Source: National Health Interview Survey Public Use Data File 2005, National Center for Health Statistics, Centers for Disease Control and Prevention, 2006.

A Strategic Approach to the Control of Cancer
Otis W. Brawley, M.D.Chief Medical and Scientific Officer American Cancer SocietyProfessor of Hematology, Medical Oncology, Medicine and Epidemiology Emory University