Embed Size (px)
Citation preview
Journal of Policy Analysis and Management, Vol. 27, No. 3, 457–478 (2008)© 2008 by the Association for Public Policy Analysis and Management Published by Wiley Periodicals, Inc. Published online in Wiley InterScience (www.interscience.wiley.com)DOI: 10.1002/pam.20353
Abstract
The California class size reduction program provided schools with cash rewardsfor K–3 classes of 20 or fewer students. I show how program rules made it possiblefor schools to save money by using mixed-grade classes to meet class size reduc-tion obligations while maintaining larger average class sizes. I also show that thissmoothing of students across grades is associated with a significant test score gapfor certain second and third grade students. My estimates suggest that class sizereduction may lead to lower test scores for students placed in combination classes.Alternative explanations of teacher experience and credentialing changes cannotexplain the test score pattern. This result spotlights both the underappreciatedrole of age heterogeneity in classroom learning and the difficulty of replicating thesuccess of policy experiments in statewide reform. © 2008 by the Association forPublic Policy Analysis and Management.
INTRODUCTION
The California Class Size Reduction Program, adopted in 1996, was one of thelargest state education reforms of its decade. Though a number of states adoptedmeasures to reduce the size of elementary school classes, the California programwas the most ambitious in scope, affecting millions of kindergarten through thirdgrade students to date at a cost of several billion dollars. Based on the experimentalevidence provided by Tennessee’s Project STAR, policy makers expected that reduc-ing class sizes would lead to increased student test scores.1
However, these expectations failed to account for the possible strategic actions ofthe schools implementing the program. This paper documents a perverse test scorepattern associated with the reduction in class sizes for second and third graders thatis not explained by differences in teacher experience or credentials. It also showshow this pattern can be explained by the increased use of mixed-grade classes,sometimes referred to as combination classes, and how the program providedincentives for schools to use them.
In California, the implementation of class size reduction focused solely on attain-ing a particular class size, rather than an intervening mechanism through whichclass size affects achievement. Though policy makers intended to provide schoolswith incentives to hire more teachers and create more classes, the nonlinear rewardstructure they created, an all-or-nothing payment based on a threshold class size,provided schools with incentives to smooth class size across grades by creating
David SimsA Strategic Response to Class Size Reduction: Combination Classes and Student Achievement in California
1 For STAR evidence see Krueger (1999) and Finn and Achilles (1990).
PAM273_02_20353.qxd 5/30/08 1:17 AM Page 457

458 / A Strategic Response to Class Size Reduction
combination classes, thereby reducing maximum class size while expending fewerresources. Thus, this study adds to a growing literature that examines how educa-tional agents can undermine large-scale reform through their response to unintendedprogram incentives, most notably Jacob and Levitt’s (2003) examination of teachercheating in response to high-stakes accountability testing.2
Despite important data limitations, this paper also informs the continuing debateabout the desirable level of student heterogeneity in the tracking and peer-effect lit-eratures. Based on my estimates of the negative effects of combination classes andusing generous assumptions about the effects of decreasing class size, I concludethat the students placed in combination classes by the program are worse offdespite moving to smaller classes. If class size effects are instead consistent with thenear zero estimates of Hoxby (2000), the program may have had a net negativeeffect on student achievement in its initial years.
Though some researchers (for example, Figlio & Page, 2002) have argued that thenegative effects attributed to tracking and ability grouping in the education litera-ture largely reflect sample selection issues, there is no consensus on how increasingthe age variance in classrooms might translate to student outcomes. Since theCalifornia policy effectively created an experiment in age-heterogeneity and sinceage is correlated with scholastic experience and aptitude, it provides evidence abouthow student test scores respond to increased variance along those dimensions inthe classroom. Finally, the expansion of multi-grade combination classes I observedmay provide more general information about the classroom achievement effects ofmixed-grade or combination classes themselves.
THE CALIFORNIA CLASS SIZE REDUCTION
The Class Size Reduction Program, which arose from an unexpected politicalalliance between Governor Pete Wilson and the state legislature in the summer of1996, provided incentives for schools to voluntarily reduce their class sizes in earlygrades. The state committed to pay each school a $650 bonus for every student ineach grade, K–3, where all classes had 20 students or fewer.3 This payment was size-able relative to California’s 1995–96 per-pupil expenditure of $6,068, and it wasincreased in subsequent years, reaching $906 in 2002–03. Anticipating a lack ofclassroom space, the state also arranged to subsidize the procurement of temporaryclassrooms with payments of $25,000. After the first year this subsidy rose to$40,000.
The large awards offered by the state led to high program participation rates.However, because schools were required to reduce class sizes in a particular gradeorder, there was unequal participation across grades. Only when first grade classsizes were below 20 could schools receive money for reducing the size of their sec-ond grade classes. A school that had reduced class sizes for first and second graderscould receive program money for reducing the size of either kindergarten or thirdgrade classes. In later years the program was changed to allow both kindergartenand third grade students from the same school to participate. Consequently, by thesecond year (1997–98), more than 95 percent of first and second graders were inclasses that qualified for a subsidy, while only two-thirds of kindergarteners andthird-graders participated. In year three, all grade levels exceeded 80 percent
Journal of Policy Analysis and Management DOI: 10.1002/pamPublished on behalf of the Association for Public Policy Analysis and Management
2 In fact, Acemoglu, Kremer, and Mian (in press) argue that the public provision of education existsexpressly to avoid high-powered incentive schemes in that area.3 Disbursements were made at the district level. Although the law contains an option which provides ahalf payment for students spending half a day in classes of 20 or fewer, this feature is mainly utilized bykindergarten classes. For example, in the first year of my study for the relevant grades, only 1.5 percentof the class size reduction classes were half-day. Thus, I do not make any distinction between half andfull day participants in the analysis.
PAM273_02_20353.qxd 5/30/08 1:17 AM Page 458
A Strategic Response to Class Size Reduction / 459
participation and by the fourth year all grade levels had a participation rate of over90 percent.
California’s Class Size Reduction Program was extraordinarily expensive. In itsfirst year, including payments for classroom space, the program committed thestate to over $1.3 billion in payments. This number increased as per-student awardand participation levels rose, so that by 2001 the subsidy payments constituted 6 percent of the state direct education budget.
Previous research on the California Class Size Reduction has been hampered bydata and program design limitations. Since the program was offered to all schooldistricts, an appropriate control group for adopting schools is not obvious.Furthermore, there is a lack of outcome level microdata that might help overcomethis problem. A state-commissioned evaluation of the program (Blanco, Bohrnstedt, &Stecher, 1999) focused on the difference in fifth versus third grade test scores inadopting and non-adopting schools. Although it found minor gains in studentachievement, the assumption that fifth grade students are unaffected by class sizereduction seems implausible. At a minimum, many fifth grade students experiencedclass size increases due to program adoption (Sims, 2007).
Rivkin and Jepsen (2002) used variation in the timing of program adoption toidentify the effects of smaller class size on test scores. They found large and signif-icant positive effects, especially for students in poorer districts. Their most impor-tant finding, however, was that class size reduction led adopting schools to hirelarge numbers of inexperienced teachers with incomplete credentials. This influx,in turn, reduced student test scores, especially in heavily African American schools,increasing educational inequality. However, they concluded that the influx of inex-perienced teachers likely represented a short run adjustment rather than a lastingproblem.
CONCEPTUAL FRAMEWORK
An institutional feature of the California program that has largely avoided attentioninvolves the incentives it provided schools to use combination classes. Studentsfrom eligible grades in combination classes qualified for program money as long asthe size of the combination class was below 20 students.4 This meant that adminis-trators could reduce class sizes to the 20-student threshold with less expense bysmoothing enrollment across grades.
To illustrate this process, consider a school that had 60 students, 30 in one firstgrade class and 30 in one second grade class, prior to the program. Without com-bination classes this school would have to implement the program for first and sec-ond graders by hiring two new teachers and providing four classes with 15 studentseach. However, the additional money that would be paid to the school for imple-menting the program might be as little as $39,000, too little to pay the additionalteachers.5 To adopt, this school must shift money from other areas to cover theextra cost. However, if the school is allowed to count combination classes towardits goal it can hire one new teacher and have three classes of 20 students. One ofthese classes is a combination class with equal numbers of students from eachgrade. This way, the school covers more of its costs from the program bonus.
Although this incentive to mix grades might have been anticipated, there wasclearly little concern that mixed-grade classes might reduce student achievement.
Journal of Policy Analysis and Management DOI: 10.1002/pamPublished on behalf of the Association for Public Policy Analysis and Management
4 This applied even when some of the students in the class were not from eligible grades. For example,a class of 18 third graders and 2 fourth graders received a payment for the 18 third graders. In practice,schools were far more likely to combine classes within eligible grades, as this reduced the inefficiency ofputting students that did not qualify for the subsidy in a smaller class. 5 This is figured at the initial payment rate of $650. Even at the 2002 rate of $906, it is hard to imaginepaying the salaries and benefits of two new California teachers for $54,360.
PAM273_02_20353.qxd 5/30/08 1:17 AM Page 459

460 / A Strategic Response to Class Size Reduction
Given this, it might be useful to informally consider a couple of potential rationali-zations for the relationship between age heterogeneity and test scores. For example,if classroom instruction is a congestible public good, as suggested by the model ofLazear (2001), any policy that increases the student propensity to demand individ-ual attention, whether through legitimate questions or misbehavior, will decreaseaverage learning. Thus, a trade-off between student age heterogeneity and class sizeexists if smaller classes create less congestion but the rate of student interruptionsincreases in a group with students from different grade levels.
Alternatively, consider the problem of a teacher maximizing some proxy for studentlearning by allocating instruction time among endogenously sized student groupswithin the classroom (including individual students), given some constraint on class-room time. While smaller classes might appear to relax the constraint, an increase inage group heterogeneity could decrease the size of viable instructional groups, forc-ing the teacher to allocate time over more entities even if there are fewer students.This situation seems germane to the California case, where each grade level isrequired to take separate skills tests. Such a testing regime diminishes the ability toteach a unified curriculum to an entire combination class. In either case, any bene-fits of smaller classes may well be offset for students forced into combination classes.
Empirically, previous investigations of combination classes have produced littleconsensus about their effects. In a synthesis of the literature that combines over35 previously published studies, with sample sizes ranging from 42 to 10,000 stu-dents, Veenman (1995) concludes that the median effect size of mixed grade classeson student achievement is 0.00. Restricting the sample to studies conducted withrandomly drawn samples yields four with significant positive estimates of the effectof combination classes on achievement and four with significant negative estimates.
However, Burns and Mason (2002; Mason & Burns, 1996) are critical of Veenman’sconclusions. They find that principals are more likely to assign students with posi-tive attributes to combination classes and suggest that this positive selection masksthe true negative effects of combination classes. Furthermore, most prior studiesrely on a control function approach, in which numerous observable factors areincluded in the regression, to provide identification of the parameter of interest. Inthe event that factors outside the researchers’ observation differentially affect theachievement of students in combination classes, their estimates are biased. The fewstudies that employ either school or student level matching strategies have smallersample sizes, often 400–500 students, and still find contrasting positive and nega-tive effects, with a median effect size of 0.00. More recent work, such as that of Rus-sell, Rowe, and Hill (1998), uses larger samples, and finds negative combinationclass effects but fails to address the identification issue.6
The present study draws on a dataset with greater size and scope than most pre-vious investigations of the effects of combination classes on student achievement,with observations on over 15,000 school grade years. Additionally, it focuses on aplausibly exogenous source of variation in the use of combination classes. This vari-ation comes from a combination of the school’s enrollment at a grade level and theexternally imposed rules of class size reduction. As such it provides an importantstudy of mixed grade classes in a policy relevant context.
DATA
I use data drawn from two sources. Data from the California Standardized Testingand Reporting (CSTAR) program are provided by the assessment division of the California Department of Education. The CSTAR program began with the
Journal of Policy Analysis and Management DOI: 10.1002/pamPublished on behalf of the Association for Public Policy Analysis and Management
6 These results stand in contrast with the literature on non-graded subjects where individuals aregrouped by ability rather than age. Here the work of Guttierez and Slavin (1992) and Pavan (1992) sug-gests positive effects on achievement.
PAM273_02_20353.qxd 5/30/08 1:17 AM Page 460

A Strategic Response to Class Size Reduction / 461
administration of standardized tests to students in grades two and above in thespring of 1998. In 1998–2000, the test years examined in this paper, the elementaryCSTAR included the Stanford 9 norm-referenced test.
I use scores for second and third graders from the mathematics and language sec-tions of the test to measure educational achievement. These scores are available ona school by grade level basis rather than classroom by classroom. Specifically, I usethe National Percentile Rank (NPR) of a hypothetical mean student in a particulargrade for a specific school in math or language as dependent variables.7
The remainder of the data come from the Educational Demographics Office ofthe California Department of Education. These include detailed reports fromschools and teachers about their classes, and contain information on a variety ofteacher characteristics such as experience, education level, and class sizes. The dataalso provide demographic information including the number and ethnicity of stu-dents in each grade, the number of English learners, and the number of studentsreceiving free or subsidized meals. I aggregate this data to the school-grade levelwhere necessary and match it to test scores.
The data set consists of observations on second graders from the 1998–2000 testyears and third graders from the 1999–2000 test years.8 I eliminate observations forwhich the necessary demographic and testing information is unavailable and obser-vations for which average class size cannot accurately be figured.9 The bulk of theanalysis also excludes observations of grades for which the school did not partici-pate in Class Size Reduction that year. Although this may limit the applicability ofthe study results to external settings, it ensures that systematic differences inschools that determine Class Size Reduction participation do not bias the estimates.
An important limitation of the data is the lack of appropriate statewide standard-ized test score data for pre-program years. This pre-program data would provide avaluable check on the identification strategy and allow estimation of “value-added”models. This shortcoming also eliminates a potentially useful source of information: thetime series response of test scores to the advent of class size reduction.
Another serious data limitation is the inability to measure outcomes at the class-room level. As a result, I am unable to look specifically at the test scores of studentsin combination classes. Because test score measures are available at the schoolgrade level, I would like to treat the percentage of students in a school and gradethat are in combination classes as the variable of interest. However, because theCalifornia data does not include direct information about how many students ineach combination class are from a specific grade, I am forced to calculate the per-centage combination students for a grade in each school as the remainder oncethose in normal single classes and special programs are subtracted out. Though thisalmost certainly introduces measurement error, the pattern of results is robust toconsidering the raw number of combination classes (K–3) in the school as the vari-able of interest.10
Journal of Policy Analysis and Management DOI: 10.1002/pamPublished on behalf of the Association for Public Policy Analysis and Management
7 According to CSTAR, this hypothetical mean NPR is calculated by converting the individual NPRs ofall students in a grade into normal curve equivalents, taking the mean, and listing the corresponding per-centile rank.8These correspond to the 1997–98 through 1999–2000 school years and 1998–99 to 1999–2000 schoolyears, respectively. Third graders from test year 1998 were omitted because of their lower participationrate and the inability to classify them as participants or nonparticipants in the program.9 Neither of these seems to be a systematic error. I eliminate the few schools that had more than 240 stu-dents in a grade. A few schools with fewer than 10 students in a grade have no testing data and are notconsidered.10 A similar issue arises in the calculation of average class size. The class size for all students in single-graded classes is available in the data as is the class size of all students in combination classes (but notseparately by grade). The analysis in the paper uses only the former measure. However, the class sizeaverages for combination classes fall close enough to those in the relevant grades (especially for secondgraders) that using a composite measure of single and all combination classes class size produces nomeaningful changes to the presented estimation results.
PAM273_02_20353.qxd 5/30/08 1:17 AM Page 461

462 / A Strategic Response to Class Size Reduction
Descriptive statistics are reported in Table 1. Program participants scored close tothe national average on standardized tests (slightly above average in math butbelow average in reading). The two grades also had fairly similar demographiccharacteristics. However, a higher percentage of second grade students (15.05%)than third grade students (12.23%) were in combination classes. Also, secondgraders in program schools appear to have slightly less experienced teachers andslightly higher poverty and English learner percentages than third graders.
GRAPHICAL ANALYSIS
Despite its limitations, this data provides clear graphical evidence of three unex-pected effects of the class size reduction program. The primary effect of note is theperverse pattern of student test scores shown in Figure 1. It plots average test scoresfor a school-grade observation by enrollment relative to the nearest 20-student mul-tiple (for example, enrollments of 19, 39, 59, 79, etc., all show up as �1 on thisgraph). The dashed lines provide a 95% confidence band. Because the reduction pro-gram enforces a maximum class size of 20 students, participating schools with gradelevel enrollments that are exact multiples of 20 students should have the highest classsizes. Those with enrollments just over this level will have the smallest classes.
For example, a school with 40 second grade students in reduced classes mightexpect to have two classes of 20 students each, while a school with 42 students
Journal of Policy Analysis and Management DOI: 10.1002/pamPublished on behalf of the Association for Public Policy Analysis and Management
Table 1. Descriptive statistics.
Grade 2 Grade 3
Math NPR 51.80 55.30(19.56) (18.52)
Language arts NPR 47.94 49.63(20.80) (18.63)
Percentage students in combination classes 15.05 12.23(15.66) (13.76)
Combination classes (school) 2.68 2.55(2.90) (2.90)
Average class size 18.03 18.15(1.22) (1.42)
Average teacher experience 12.58 12.90(6.38) (6.37)
Percentage novice teachers (�3 years exp) 25.15 23.66(25.66) (25.22)
Percentage with emergency credential 9.32 9.27(17.52) (17.39)
Percentage with credential waiver 0.57 0.49(4.81) (4.26)
Percentage of free lunch students (school) 52.41 52.01(29.71) (29.70)
Percentage non-white students (grade) 61.16 60.69(28.61) (28.92)
Percentage English learner students (grade) 28.77 27.15(23.92) (23.44)
Grade enrollment 98.87 97.84(39.51) (39.35)
School enrollment 621.70 617.00(229.79) (236.03)
n � 9,974 6,079
Standard deviations are in parentheses below means. The unit of observation is the schoolgrade year. NPR is the national percentile rank of the hypothetical average student.
PAM273_02_20353.qxd 5/30/08 1:17 AM Page 462

A Strategic Response to Class Size Reduction / 463
would need three classrooms to stay under the program limit. Without combinationclasses, the expectation would be for the school with 42 students to have a muchlower second grade average class size of 14 students. If the only effect of the pro-gram were a reduction in class size, and if the reduction in class size from forminga new class led to higher test scores, we would observe test scores rising after cross-ing a 20-student threshold. Instead, test scores appear to rise as they approach anenrollment threshold and drop off immediately afterward. This graph strongly sug-gests that there is a significant decrease in test scores associated with schools thatshould have smaller classes under class size reduction.
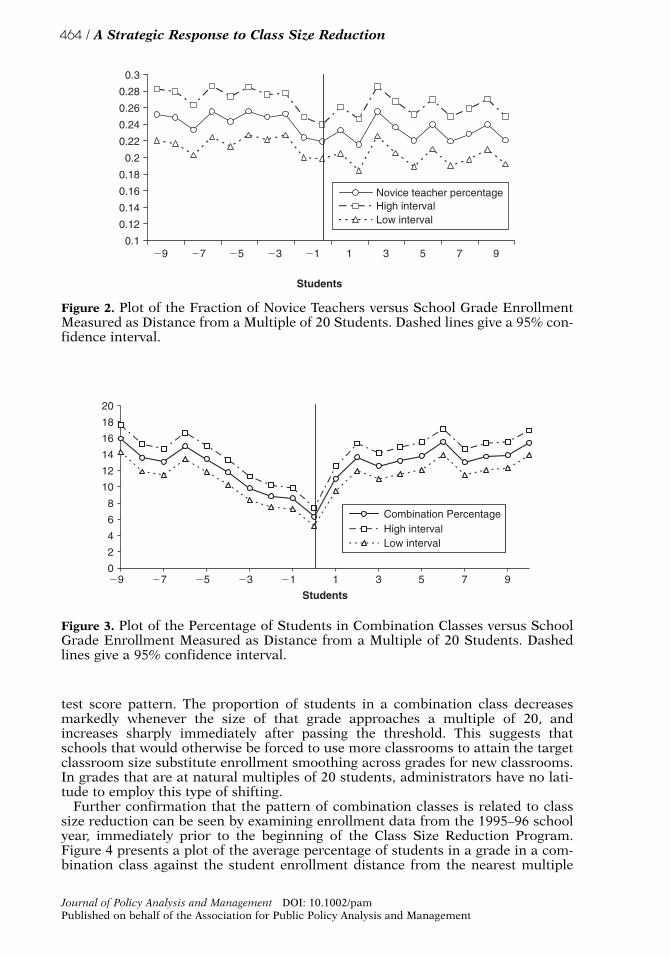
Since it seems unlikely that smaller class sizes are themselves causing the drop intest scores, I next examine other plausible suspects. One promising potential expla-nation involves the Rivkin and Jepsen findings that schools adding classes may hireinexperienced teachers, and a change in teacher experience leads to the drop in testscores. Unfortunately, further graphical investigation does not support this connec-tion. In a manner analogous to Figure 1, Figure 2 plots the percentage of noviceteachers (less than three years experience) in a grade against the student enrollmentdistance from the nearest multiple of 20. This measure of teacher experience doesnot exhibit the nonlinear pattern of rising near the cutoffs and falling thereafter.Rather, it appears to be a relatively smooth function of enrollment. Intuitively, thismay occur because some experienced teachers from other grades are willing toswitch grades to teach smaller second or third grade classes. This does not mean thatthe use of inexperienced teachers is unrelated to test scores in general, merelythat it is a poor candidate to explain the particular pattern of test scores examinedin this paper. Similar graphical exercises suggest average teacher experience andmeasures of teacher credentialing are also poor candidates to explain the test scorepattern.
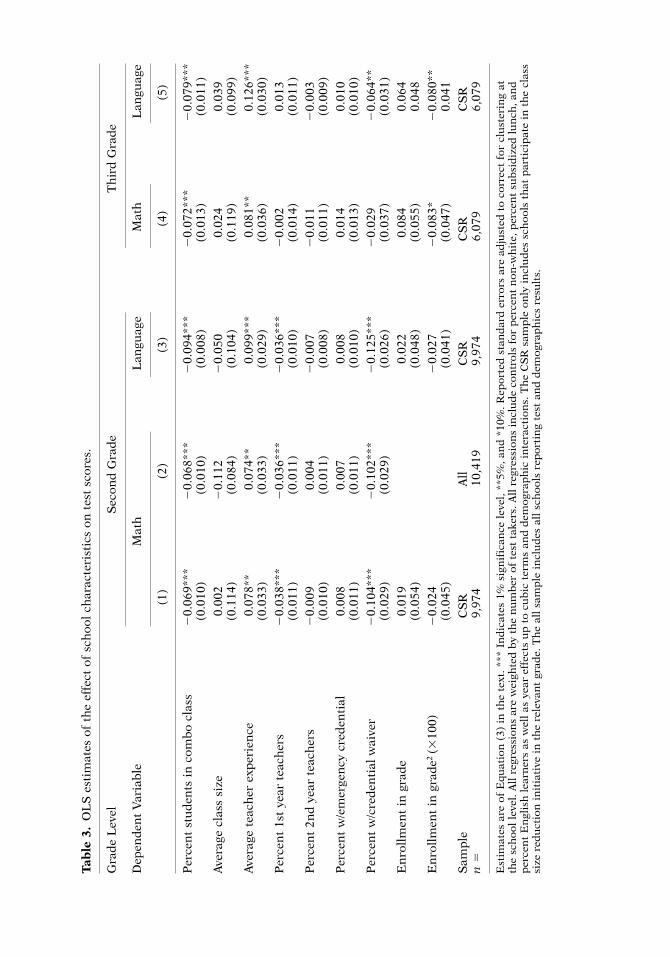
A second unexpected effect of the reduction program was the previously notedresponse of administrators to incentives to increase the use of combination classes.Figure 3 presents a plot of the average percentage of students in a grade in a com-bination class against the student enrollment distance from the nearest multiple of20 pupils. The nonlinear pattern is striking both for its support of the idea that classsize reduction leads to the use of combination classes, and for its match with the
Journal of Policy Analysis and Management DOI: 10.1002/pamPublished on behalf of the Association for Public Policy Analysis and Management
Students�9 �7 �5 �3 �1 1 3 5 7 9
50
52
54
56
58
60 Mathscore
Lowinterval Highinterval
Figure 1. Plot of Math Test Scores versus School Grade Enrollment Measured asDistance from a Multiple of 20 Students. Dashed lines give a 95% confidence interval.
PAM273_02_20353.qxd 5/30/08 1:17 AM Page 463
464 / A Strategic Response to Class Size Reduction
test score pattern. The proportion of students in a combination class decreasesmarkedly whenever the size of that grade approaches a multiple of 20, andincreases sharply immediately after passing the threshold. This suggests thatschools that would otherwise be forced to use more classrooms to attain the targetclassroom size substitute enrollment smoothing across grades for new classrooms.In grades that are at natural multiples of 20 students, administrators have no lati-tude to employ this type of shifting.
Further confirmation that the pattern of combination classes is related to classsize reduction can be seen by examining enrollment data from the 1995–96 schoolyear, immediately prior to the beginning of the Class Size Reduction Program.Figure 4 presents a plot of the average percentage of students in a grade in a com-bination class against the student enrollment distance from the nearest multiple
Journal of Policy Analysis and Management DOI: 10.1002/pamPublished on behalf of the Association for Public Policy Analysis and Management
0.1
0.12
0.14
0.16
0.18
0.2
0.22
0.24
0.26
0.28
0.3
�9 �7 �5 �3 �1 1 3 5 7 9
Students
Novice teacher percentageHigh intervalLow interval
Figure 2. Plot of the Fraction of Novice Teachers versus School Grade EnrollmentMeasured as Distance from a Multiple of 20 Students. Dashed lines give a 95% con-fidence interval.
0
2
4
6
8
10
12
14
16
18
20
�9 �7 �5 �3 �1 1 3 5 7 9
Students
Combination PercentageHigh intervalLow interval
Figure 3. Plot of the Percentage of Students in Combination Classes versus SchoolGrade Enrollment Measured as Distance from a Multiple of 20 Students. Dashedlines give a 95% confidence interval.
PAM273_02_20353.qxd 5/30/08 1:17 AM Page 464

A Strategic Response to Class Size Reduction / 465
of 20 pupils calculated on this earlier year. The graph is much different from theprevious figure, showing a lower and relatively flat distribution of combinationclass students across different school enrollments.
A grade smoothing hypothesis predicts that observed average class size will fallby less in California than in a world with no combination classes. Indeed, thatpattern is the third unexpected result of class size reduction and can be seen in Figure 5, which presents a plot of average class size by student enrollment. Forcomparison I also present a plot for expected class size in a counterfactual worldwhere there is no mixing of students across grades. This predicted class size func-tion was introduced by Angrist and Lavy (1999) as an instrument for actual classsize and is obtained by first estimating the smallest number of equal-sized classes
Journal of Policy Analysis and Management DOI: 10.1002/pamPublished on behalf of the Association for Public Policy Analysis and Management
02468
101214161820
�9 �7 �5 �3 �1 1 3 5 7 9
Students (distance from multiple of 20)
Combination percentage 95High intervalLow interval
Figure 4. Plot of the Percentage of Students in Combination Classes versus SchoolGrade Enrollment, 1995–96, the Year before CSR.
Students
Class sizePredicted size
16 124
10.5
20
Figure 5. A Plot of the Predicted Class Size Function versus Actual Class Size. Thepattern depicted here continues at higher enrollment levels.
PAM273_02_20353.qxd 5/30/08 1:17 AM Page 465

466 / A Strategic Response to Class Size Reduction
of at most 20 students that would accommodate the enrollment of each schoolgrade. The predicted number of classes is:
(1)
where Esgt is the student enrollment in school s for grade g at time t. Int(•) repre-sents the integer function, meaning that int(n) in the largest integer less than orequal to n. Using this variable, the predicted class size can be defined as:
(2)
This function predicts the average class size if students are divided into the pre-dicted number of classes. Comparing this with observed class size data in Figure 5shows that actual class size is generally greater than the predicted class size.Notably, they come closest to matching at 20-student intervals. This is preciselywhat we would expect if combination classes were being used to smooth class sizeacross grades.
IDENTIFICATION
Although the graphical evidence is intriguing, it provides neither a statistically per-suasive case for linking combination classes and test scores nor an estimate quan-tifying the effect’s size. To remedy this I place the above data into an analyticalregression framework. The causal relationship of interest is:
Ysgt � X�sgt a � �Zsgt � dCsgt� gg � tt � hsgt (3)
where indexing remains as previously defined. Y is a test score measure of studentoutcomes, Z is the average class size of students in that school grade year, and C isthe percentage of those students in combination classes. X is a vector of demographiccontrols including grade level enrollment, percentage of black and Hispanic students,percentage of English learners, and percentage of students that qualify for free orsubsidized meals. Also, g is a grade effect, t a time effect, and hsgt is the error term.
OLS estimates of equation (3) are unlikely to have a causal interpretation since thedemographic variables included in the regression likely fail to control for all the fac-tors that relate classroom organization to test scores. Identification in this OLS settingrelies on the assumption that there are no omitted factors, such as parental incomeand involvement level, that are correlated with the extent of combination classes aswell as test scores. When this assumption is violated, the OLS coefficients are biased.
To overcome this difficulty, I adopt an instrumental variables framework thatexploits variation in student test scores from a source that is related to combinationclasses but unrelated to the potential omitted variables. Specifically, I use smalldifferences in student enrollment levels around the 20-student cutoff defined byreduction program rules to construct instruments for the percentage of students incombination classes. Because of the discrete nature of the program cutoff, smallenrollment changes generate discontinuous changes in combination class percent-ages and student test scores. Furthermore, because my instruments depend onnonlinear enrollment variation, I can control for smooth functions of enrollment in the estimation. The idea of using a policy-induced discontinuity as a source
PCSE
CLNsgtsgt
sgt
�⎛
⎝⎜⎜
⎞
⎠⎟⎟ .
CLNE
sgtsgt�
� � [int ]
1
201
⎛
⎝⎜⎜
⎞
⎠⎟⎟
Journal of Policy Analysis and Management DOI: 10.1002/pamPublished on behalf of the Association for Public Policy Analysis and Management
PAM273_02_20353.qxd 5/30/08 1:17 AM Page 466

A Strategic Response to Class Size Reduction / 467
of identification is well established. Campbell (1969) discusses the use of regression-discontinuity designs in empirical research. More recently, Angrist and Lavy (1999),Hoxby (2000), and Jacob and Lefgren (2004), among others, make use of dis-continuities to form instruments for instrumental variables estimation in education-related investigations.
Both the number of predicted classes in a grade, previously defined in equation(1), and the predicted class size, defined in equation (2) and shown in Figure 5, varyin a nonlinear fashion with respect to 20-student multiples of enrollment and arethus likely correlated with the percentage of students in combination classes. How-ever, the potential endogeneity of actual class size, another correlate of both of thesefactors, creates doubts about their suitability as instruments. The possibility ofclass size endogeneity is discussed in greater detail in the Appendix.11
One approach to dealing with this issue is to generate an instrument that is cor-related with combination classes but uncorrelated with actual class size, condi-tional on enrollment. In this case the instrumental variables estimate of the effect ofcombination classes on student achievement is consistent even if class size is omit-ted from the regression altogether. My preferred candidate instrument consists of acombination classes predictor (CSP) that by design is purged of correlation withclass size. This instrument is formed by calculating the number of classes of fewerthan 20 students required for the students in a grade and the grade below, then sub-tracting this number from the predicted number of classes of fewer than 20 studentsthe school would require to avoid mixing these two grades. I use the preceding gradebecause the program rules guarantee that in my sample it will also be a class sizeparticipant. Intuitively, the predictor indicates whether a school would be able tosave resources by creating combination classes in lieu of some class size reduction.The formula is:
(4)
Returning to the earlier example with 60 students in a school, 30 in first grade and30 in second grade, if no combination classes are used I would predict four classeswould cover these grades. However, only three classes would be needed to holdthe combined students. The positive difference between the number of classes in non-combined versus combined scenarios means this school receives a value of one for itssecond grade combination size predictor. The variation in this instrument comesentirely from the between school differences in the relative distance from a 20-studentthreshold of two grades’ separate enrollments versus the grades’ combined enroll-ments. Thus, a school with 40 students in each of first and second grade would havea combination predictor value of zero for second grade, but a different school with 39first graders and 41 second graders would have a combination predictor value of one.
To help show the likely effect of the instrument, Table 2 presents average studenttest scores by combination predictor status and tests for simple differences in aver-ages across the groups. Students in schools with the combination class predictorequal to 1 score significantly lower on both math and language exams. As expected,they also have a significantly higher percentage of students in combination classes.A simple ratio of the differences would suggest that an extra 1 percentage point ofstudents in combination classes would lower test scores by half a percentile. Fur-thermore, this table shows that class size, teacher experience, and teacher creden-tialing fail to show a statistically significant correlation with instrument status even
CSP CLN CLN CLNsgt sgt s g t s g g
� � �� �( - ) [ ( )1 1( ) ]]t
⎡⎣
⎤⎦
Journal of Policy Analysis and Management DOI: 10.1002/pamPublished on behalf of the Association for Public Policy Analysis and Management
11 This appendix is available at the end of this article as it appears in JPAM online. Go to the publisher’sWeb site and use the search engine to locate the article at http://www3.interscience.wiley.com/cgi-bin/jhome/34787.
PAM273_02_20353.qxd 5/30/08 1:17 AM Page 467

468 / A Strategic Response to Class Size Reduction
without conditioning on enrollment levels. Although other demographic controls doshow significant unconditional differences across instrument values, conditioningon enrollment leaves a statistically significant difference in only one demographicmeasure, the percentage of students eligible for free lunch. This highlights theimportance of conditioning on enrollment in my analysis and controlling for the freelunch variable.
When I condition on smooth enrollment controls, the exclusion restrictionassumes that there are no omitted factors that determine the test scores at theseschools that are correlated with these small grade level enrollment differences. Thelack of a significant relationship between the combination classes predictor andalmost all available covariates supports this assumption. However, exclusionrestrictions are not explicitly testable and are always vulnerable to counterexample.Further, the correlation of the instrument with free lunch status suggests some cau-tion in interpreting these estimates.
Another possible instrument is the predicted class size of the immediately lowergrade. If a school reduced class size at the second or third grade level, the gradeimmediately below the observed grade likely participated, since schools were farless likely to combine students in non-eligible grades. The lower grade class sizepredictor is:
Journal of Policy Analysis and Management DOI: 10.1002/pamPublished on behalf of the Association for Public Policy Analysis and Management
Table 2. Achievement and attributes by combination predictor status.
Enrollment Unconditional Conditioned
CSP � 1 CSP � 0 Difference Difference
(1) (2) (3) (4)
Math scores 51.93 53.98 �2.05 �1.88(�6.64)** (�6.22)**
Language scores 47.29 49.49 �2.20 �2.00(�6.86)** (�6.41)**
Percentage combination 16.13 12.37 3.76 3.87(15.70)** (16.33)**
Class size 19.07 19.08 �0.01 �0.01(�0.31) (�0.61)
Teacher experience 12.66 12.71 �0.05 �0.04(�0.48) (�0.05)
Novice teachers 0.25 0.24 0.01 0.01(1.86) (1.51)
Emergency credential 0.10 0.09 0.01 0.004(1.95) (1.47)
Credential waiver 0.01 0.01 0.001 0.001(1.28) (1.47)
Free lunch percentage 53.64 51.27 2.36 2.07(4.96)** (4.63)**
English learner percentage 28.75 27.78 0.97 0.64(2.55)** (1.78)
Non-white percentage 61.63 60.64 0.99 0.64(2.14)** (1.46)
n � 6,663 9,313
Figures in parentheses are test statistic values for the null hypotheses of equality of variable means.Column 4 conditions the difference in means on student enrollment. CSP stands for the combinationclass predictor, which is defined in the text. ** Indicates 5% significance level.
PAM273_02_20353.qxd 5/30/08 1:17 AM Page 468

A Strategic Response to Class Size Reduction / 469
(5)
I will use this instrument for robustness checks in the results section below.
LEAST SQUARES RESULTS
Table 3 presents ordinary least squares estimates of equation (3) as a descriptive ref-erence point. Columns 1 and 2 consider the relationship between second grade mathscores and school characteristics. Column 1 presents a specification comparable tomany previous studies of class size, with the national percentile rank of the hypothet-ical average student in mathematics as the dependent variable. The major differenceis the presence of the percentage of students in combination classes in the specifica-tion. The coefficient estimate of �0.069 implies that a 5 percentage point change instudents in combination classes would lead to a drop of about one-third of a percentilein math scores. This seems like a modest effect. This result is robust to the addition ofhigher order demographic and enrollment controls.12 Also, consistent with the Rivkinand Jepsen (2002) findings, some measures of teacher experience are significantpredictors of student achievement. Both the percentage of first year teachers and thepercentage of teachers with credential waivers have negative significant coefficients.13
The class size coefficient estimate is small and insignificant, a marked differencefrom much of the recent research documenting large class size effects. However,even supposing a causal interpretation, these OLS results do not demonstrate thatthe class size changes caused by the California Class Size Reduction Program had noeffect on test scores because my sample makes a pre-treatment versus post-treatmentcomparison impossible; and because my sample is composed of schools that haveall implemented the program, the variation in class size in the sample is smallerthan in most populations, with a standard deviation of only 1.22 students. This lackof variation relative to other observed factors may account for the failure to findclass size effects in this paper and is similar to Hoxby (2000), which finds no classsize effects when examining natural population variation.
If the lack of variation in class size is partially responsible for the small classsize coefficient estimates, then OLS estimation using a sample with more varia-tion should yield larger coefficients. Column 2 of Table 3 confirms this hypothe-sis. It reestimates the specification in column 1 on a sample which adds the 445second grade classes that did not participate in the Class Size Reduction Pro-gram. Here the coefficient on class size is larger (in absolute value) and negative,though still statistically insignificant.
Columns 3–5 demonstrate that the percentage of students in combination classes haslarger effects on second grade language scores and all third grade scores. The coefficientestimate of the combination class effect on second grade language scores is �0.094,about 40 percent greater than the math estimates. Class size effects are positive but arestill small and imprecisely estimated. In some specifications the percentage of first yearand credential waiver teachers has a significant negative relationship with test scores.
PCSE
CLNs g ts g t
s g t( )
( )
( )
.�
�
�
�1
1
1
⎛
⎝⎜⎜
⎞
⎠⎟⎟
Journal of Policy Analysis and Management DOI: 10.1002/pamPublished on behalf of the Association for Public Policy Analysis and Management
12 Except where otherwise specified, the tabulated models contain the full set of demographic controlsup to cubic terms, as well as year effects and grade effects when relevant.13 To get a teaching credential in California, a candidate must take 30 credit hours, often referred to asthe “fifth year,” beyond a bachelor’s degree in a recognized education program. Teachers with a bache-lor’s degree who pass other certification requirements can get an emergency credential that allows themto teach for a few years while completing the other requirements. A credential waiver releases theteacher from even more requirements of the credentialing process. Because a large part of credentialingis gaining classroom understanding, experience, and performing student teaching, these variables canstill be thought of as a type of experience measure.
PAM273_02_20353.qxd 5/30/08 1:17 AM Page 469
Tab
le 3
.O
LS
est
imat
es o
f th
e ef
fect
of
sch
ool
char
acte
rist
ics
on t
est
scor
es.
Gra
de
Lev
elS
econ
d G
rad
eT
hir
d G
rad
e
Dep
end
ent
Var
iab
leM
ath
Lan
guag
eM
ath
Lan
guag
e
(1)
(2)
(3)
(4)
(5)
Per
cen
t st
ud
ents
in
com
bo
clas
s�
0.06
9***
�0.
068*
**�
0.09
4***
�0.
072*
**�
0.07
9***
(0.0
10)
(0.0
10)
(0.0
08)
(0.0
13)
(0.0
11)
Ave
rage
cla
ss s
ize
0.00
2�
0.11
2�
0.05
00.
024
0.03
9(0
.114
)(0
.084
)(0
.104
)(0
.119
)(0
.099
)
Ave
rage
tea
cher
exp
erie
nce
0.07
8**
0.07
4**
0.09
9***
0.08
1**
0.12
6***
(0.0
33)
(0.0
33)
(0.0
29)
(0.0
36)
(0.0
30)
Per
cen
t 1s
t ye
ar t
each
ers
�0.
038*
**�
0.03
6***
�0.
036*
**�
0.00
20.
013
(0.0
11)
(0.0
11)
(0.0
10)
(0.0
14)
(0.0
11)
Per
cen
t 2n
d y
ear
teac
her
s�
0.00
90.
004
�0.
007
�0.
011
�0.
003
(0.0
10)
(0.0
11)
(0.0
08)
(0.0
11)
(0.0
09)
Per
cen
t w
/em
erge
ncy
cre
den
tial
0.00
80.
007
0.00
80.
014
0.01
0(0
.011
)(0
.011
)(0
.010
)(0
.013
)(0
.010
)
Per
cen
t w
/cre
den
tial
wai
ver
�0.
104*
**�
0.10
2***
�0.
125*
**�
0.02
9�
0.06
4**
(0.0
29)
(0.0
29)
(0.0
26)
(0.0
37)
(0.0
31)
En
roll
men
t in
gra
de
0.01
90.
022
0.08
40.
064
(0.0
54)
(0.0
48)
(0.0
55)
0.04
8
En
roll
men
t in
gra
de2
(�10
0)�
0.02
4�
0.02
7 �
0.08
3*�
0.08
0**
(0.0
45)
(0.0
41)
(0.0
47)
0.04
1
Sam
ple
CS
RA
llC
SR
CS
RC
SR
n�
9,97
410
,419
9,97
46,
079
6,07
9
Est
imat
es a
re o
f E
quat
ion
(3)
in
th
e te
xt.
***
Ind
icat
es 1
% s
ign
ific
ance
lev
el,
**5%
, an
d *
10%
. R
epor
ted
sta
nd
ard
err
ors
are
adju
sted
to
corr
ect
for
clu
ster
ing
atth
e sc
hoo
l le
vel.
All
reg
ress
ion
s ar
e w
eigh
ted
by
the
nu
mb
er o
f te
st t
aker
s. A
ll r
egre
ssio
ns
incl
ud
e co
ntr
ols
for
per
cen
t n
on-w
hit
e, p
erce
nt
sub
sid
ized
lu
nch
, an
dp
erce
nt
En
glis
h l
earn
ers
as w
ell
as y
ear
effe
cts
up
to
cub
ic t
erm
s an
d d
emog
rap
hic
in
tera
ctio
ns.
Th
e C
SR
sam
ple
on
ly i
ncl
ud
es s
choo
ls t
hat
par
tici
pat
e in
th
e cl
ass
size
red
uct
ion
in
itia
tive
in
th
e re
leva
nt
grad
e. T
he
all
sam
ple
in
clu
des
all
sch
ools
rep
orti
ng
test
an
d d
emog
rap
hic
s re
sult
s.
PAM273_02_20353.qxd 5/30/08 1:17 AM Page 470

A Strategic Response to Class Size Reduction / 471
INSTRUMENTAL VARIABLES RESULTS
First Stage Estimation
Panel A of Table 4 presents estimates of the first stage relationship between the per-centage of students in combination classes and some potential instruments. Allthese instruments are nonlinear functions of student enrollment and are definedearlier in the paper. The combination classes predictor (equation 4), predicted classsize (equation 2), and the predicted class size of a lower grade (equation 5) all showa strong significant correlation with the percentage of students in a combinationclass, conditional on smooth enrollment controls.14 The strength of the first
Journal of Policy Analysis and Management DOI: 10.1002/pamPublished on behalf of the Association for Public Policy Analysis and Management
Table 4. First stage estimates for pooled second and third graders.
(1) (2) (3) (4)
A. Dependent Variable � Percentage of Students in Combo Classes Instruments:Combination classes predictor 1.720*** 0.734***
(0.174) (0.174)
Predicted class size �1.794*** �1.599*** �1.632***(0.102) (0.110) (0.100)
Predicted lower grade class size �1.172***(0.111)
Enrollment Controls:Own-grade enrollment �0.115*** �0.026 �0.048** �0.070***
(0.023) (0.017) (0.024) (0.025)
Own-grade enrollment2 (�100) 0.018** �0.003 0.002 0.006(0.009) (0.007) (0.009) (0.010)
Lower grade enrollment 0.028 0.015 0.080***(0.021) (0.021) (0.023)
Lower grade enrollment2 (�100) �0.005 �0.002 �0.019**(0.008) (0.008) (0.008)
Root MSE 13.797 13.677 13.705 13.64
B. Dependent Variable � Average Class SizeCombination classes predictor 0.001 0.034
(0.016) (0.018)
Predicted class size 0.061*** 0.070*** 0.057***(0.009) (0.010) (0.009)
Predicted lower grade class size 0.019**(0.008)
Root MSE 1.2105 1.2076 1.2085 1.2083
n � 15,976 16,053 15,976 15,976
The table estimates a potential first stage relationship between combination class percentage or averageclass size and instruments based on the nonlinear enrollment patterns described in the text. The samplepools second and third graders. *** Indicates 1% significance level, ** 5%. Reported standard errorsare adjusted to correct for clustering at the school level. The full set of demographic controls up tocubic terms is included in all regressions though results are not reported.
14 Regressions using higher order (up to cubic) enrollment controls yield essentially the same results,with the higher enrollment terms having insignificant coefficients.
PAM273_02_20353.qxd 5/30/08 1:17 AM Page 471

472 / A Strategic Response to Class Size Reduction
stage relationship suggests that a weak instruments problem is unlikely in thiscontext. Columns 3–4 demonstrate that the use of multiple nonlinear enrollmentpredictors as instruments does not substantially improve the fit of the prediction.This is likely because the instruments rely on similar underlying variation in stu-dent enrollment.
Panel B of Table 4 examines the relationship between class size and the potentialinstruments.15 Columns 1 and 3 demonstrate that the combination classes predic-tor is not a significant predictor of class size, even in specifications that include pre-dicted class size as a regressor. The results also indicate that class size is correlatedwith the other nonlinear enrollment functions, suggesting the combination classespredictor provides the best instrument for the percentage of students in a combi-nation class since it avoids issues of possible class size endogeneity. Curiously, itappears that all the instruments, including predicted class size, do a better job pre-dicting combination classes than class size in my data.16
Two-Stage Least Squares Estimation
Table 5 presents the results of a two-stage least squares estimation of equation (3).Panel A considers the effect of combination class percentage on second grade stu-dent test scores. The first two columns present results for language achievement.Instrumenting the percentage of combination classes with the combinationclass predictor yields a significant coefficient estimate of �0.195. This impliesthat a 5 percentage point increase in students in combination classes leads to a 1 percentile fall in test scores. Column 2 reports results from estimation using thepredicted class size instruments. The combination classes coefficient estimate isslightly smaller than in column 1 but remains statistically significant. Columns 3–4indicate a 5 percentage point increase in combination class students also results ina 1 percentile drop in average math test scores.
The two-stage least squares estimates are generally 2–2.5 times the magnitude ofthe OLS estimates, suggesting that the OLS estimates are in fact biased. Part of thisdisparity is likely attributable to attenuation in the OLS estimates that arises fromerrors in measuring the percentage of students in combination classes. Beyond this,the direction of the bias is consistent with the story of positive selection found byBurns and Mason (2002); namely, combination classes may consist of students withpositive unobservable characteristics. This would occur if principals act strategicallyin filling combination classes with better than average students. In this case, mymeasured effects may represent a lower bound (in absolute value) for the true effectof putting random students in a combination class in this institutional setting.
In all of these specifications, the class size coefficient estimates range from one-third to one-half the magnitude of the combination class coefficients but are veryimprecisely estimated. In addition to the insignificant class size estimates, the tablereveals that the coefficients on the smooth enrollment controls are not significantlydifferent from zero in any specification.
Panel B of Table 5 presents the results of two-stage least squares regressions usingthird grade test scores as the dependent variable. The estimated coefficient forthe percentage of students in a combination class is larger (in absolute value) than thesecond grade estimates and is robust to the use of different instruments. Estimatesfor math and language scores are about �0.36, implying that a 5 percentage pointincrease in combination class students corresponds to a 1.5 percentile drop in aver-age test scores for the entire grade. The larger third grade effects may be due to
Journal of Policy Analysis and Management DOI: 10.1002/pamPublished on behalf of the Association for Public Policy Analysis and Management
15 The specifications are analogous to those for the corresponding column in panel A.16 Using specifications similar to Table 4, I determine that none of the nonlinear enrollment functions isa statistically significant predictor of average teacher experience, the percent of novice teachers, orteacher credentialing. While teacher experience may have predictive power for test scores on average, itcannot explain the pattern of scores shown in Figure 1.
PAM273_02_20353.qxd 5/30/08 1:17 AM Page 472

A Strategic Response to Class Size Reduction / 473
Journal of Policy Analysis and Management DOI: 10.1002/pamPublished on behalf of the Association for Public Policy Analysis and Management
Tab
le 5
.2S
LS
est
imat
es o
f th
e d
eter
min
ants
of
stu
den
t te
st s
core
s.
Dep
end
ent
Var
iab
leL
angu
age
Sco
res
Mat
h S
core
s
Cla
ss S
ize
Con
trol
:C
lass
Siz
e E
xoge
nou
sP
aram
eter
Fix
ed
(1)
(2)
(3)
(4)
(5)
(6)
A.
Sec
on
d g
rad
e (n
�9
,95
0)
Per
cen
tage
of
stu
den
ts
�0.
195*
**�
0.17
7***
�0.
180*
**�
0.16
7***
in c
omb
inat
ion
cla
sses
(0.0
60)
(0.0
45)
(0.0
70)
(0.0
49)
Ave
rage
cla
ss s
ize
�0.
095
�0.
086
�0.
051
�0.
044
(0.1
10)
(0.1
09)
(0.1
22)
(0.1
21)
En
roll
men
t in
gra
de
�0.
034
�0.
032
�0.
021
�0.
019
(0.0
27)
(0.0
27)
(0.0
29)
(0.0
29)
En
roll
men
t in
low
er g
rad
e0.
016
0.01
60.
004
0.00
3(0
.021
)(0
.021
)(0
.024
)(0
.024
)
B.
Th
ird
gra
de
(n�
6,0
26
)P
erce
nta
ge o
f st
ud
ents
�0.
368*
**�
0.32
8***
�0.
360*
**�
0.32
3***
�0.
360*
**
�0.
362*
**
in c
omb
inat
ion
cla
sses
(0.1
02)
(0.0
60)
(0.1
21)
(0.0
69)
(0.1
20)
(0.1
25)
Ave
rage
cla
ss s
ize
0.10
20.
093
0.07
80.
069
0.00
�0.
370
(0.1
20)
(0.1
15)
(0.1
41)
(0.1
35)
En
roll
men
t in
gra
de
�0.
078*
*�
0.07
5**
�0.
054
�0.
051
�0.
053
�0.
025
(0.0
31)
(0.0
30)
(0.0
36)
(0.0
35)
(036
)(0
.078
)
En
roll
men
t in
low
er g
rad
e�
0.00
8�
0.00
7�
0.00
1�
0.00
1�
0.00
1�
0.00
1(0
.028
)(0
.028
)(0
.033
)(0
.033
)(0
.033
)(0
.033
)
Inst
rum
ents
CS
PP
CS
CS
PP
CS
CS
PC
SP
PC
S-1
PC
S-1
Th
is t
able
pre
sen
ts t
he
resu
lts
of 2
SL
S r
egre
ssio
ns
for
seco
nd
an
d t
hir
d g
rad
ers.
Com
bin
atio
n c
lass
per
cen
tage
is
the
end
ogen
ous
regr
esso
r. C
SP
sta
nd
sfo
r th
e co
mb
inat
ion
cla
ss p
red
icto
r, P
CS
for
pre
dic
ted
cla
ss s
ize,
an
d P
CS
-1 f
or t
he
pre
dic
ted
cla
ss s
ize
of t
he
low
er g
rad
e. A
ll t
hes
e in
stru
men
ts a
red
efin
ed i
n t
he
text
. In
stru
men
t u
se i
s co
nsi
sten
t w
ith
in a
col
um
n e
ven
th
ough
eac
h p
anel
rep
rese
nts
sep
arat
e re
gres
sion
s. *
**In
dic
ates
1%
sig
nif
ican
cele
vel
and
**5
%.
All
reg
ress
ion
s ar
e w
eigh
ted
by
the
nu
mb
er o
f te
st t
aker
s. R
epor
ted
sta
nd
ard
err
ors
are
adju
sted
to
corr
ect
for
clu
ster
ing
at t
he
sch
ool
leve
l. T
he
full
set
of
dem
ogra
ph
ic c
ontr
ols
is i
ncl
ud
ed i
n a
ll r
egre
ssio
ns.
PAM273_02_20353.qxd 5/30/08 1:17 AM Page 473

474 / A Strategic Response to Class Size Reduction
third graders’ greater propensity to be placed in combination classes with lowergraded students. It is important to note, however, that the tests differ across grades,complicating cross-grade comparisons. Estimates of average class size effects arepositive but small and extremely imprecise.
As a further specification check, columns 5–6 estimate the effect of classroomorganization on the math scores of third graders under different assumptions aboutthe true effect of class size. In the first instance, a zero coefficient is assumed (thatis, class size is excluded). Since the combination classes predictor is uncorrelatedwith average class size, excluding class size from the regression should leave thecoefficient on combination classes the same. The regression results bear this out. In the second instance, I impose a class size coefficient constraint drawn from theRivkin and Jepsen estimates of the effects of the class size reduction.17 Again, thereis almost no change in the coefficient of interest. This exercise was conceived toshow that the effect of combination classes is robust to class size effects across the range found in the literature. However, the effect is robust in a range of esti-mates beyond anything suggested in the literature. In fact, a class size coefficientmore than 10 times the Rivkin and Jepsen estimate must be imposed to move thecoefficient of interest a standard deviation. Even specifications treating class size asjointly endogenous, reported in the Appendix, fail to provide precise class size effectestimates.18
These two-stage least squares estimates provide consistent evidence that combi-nation class students explain the perverse effect seen in Figure 1. Furthermore, theeffect of combination classes on test scores is larger than OLS estimates suggest.The coefficient estimates are robust across different control strategies for class sizeand different instruments. The estimates of class size effects, on the other hand, aresmall and imprecise, and should not be taken as meaningful statements about classsize effects for which there is a well established literature (for example, Finn &Achilles, 1990; Angrist & Lavy, 1999; Krueger, 1999; Hoxby, 2000).
COMPARISON AND INTERPRETATION
To put these results in context, I calculate a hypothetical net effect of the CaliforniaClass Size Reduction Program. Measured as an effect size, combination classesalone reduced overall second grade scores by 0.04–0.05 standard deviations, andthird grade achievement 0.09–0.10 standard deviations. If the effect worked onlythrough the students actually in a combination class, the effect rises to about �0.3standard deviations for affected second graders and �0.6 standard deviations foraffected third graders. 19
A calculation that also includes the effects of class size and inexperienced teach-ers depends critically on the true effects of smaller classes. For example, usingHoxby’s (2000) class size estimates suggests that class size reduction reduced over-all achievement by about 0.12 standard deviations for all third graders and abouthalf of that for second graders. A more generous estimate of the class size effect, forexample that estimated by Rivkin and Jepsen, produces a net program benefit of
Journal of Policy Analysis and Management DOI: 10.1002/pamPublished on behalf of the Association for Public Policy Analysis and Management
17 See Rivkin and Jepsen (2002), Table 4, p. 36. The coefficient is adjusted to reflect the different scale ofthe test score measure used by Rivkin and Jepsen.18 This appendix is available at the end of this article as it appears in JPAM online. Go to the publisher’sWeb site and use search engine to locate article at http://www3.interscience.wiley.com/cgi-bin/jhome/34787.19 Much of the literature uses student-level standard deviations. This will always produce smaller effectsizes than the grade-level standard deviations used here. I am unable to use the student-level effect sizes,as the student-level standard deviations for my sample are unavailable. Assuming that standard deviationsfor all California students and the sampled students of the same grade level were the same, a translationbased on the relative variances of student-level versus grade-level standard deviations suggests effect sizesof about �0.15s for second grade students placed into combination classes and �0.33s for similar thirdgrade students.
PAM273_02_20353.qxd 5/30/08 1:17 AM Page 474

A Strategic Response to Class Size Reduction / 475
about 0.03 standard deviations for second graders and double that for third graders.However, even in such an optimistic scenario, those students placed in combinationclasses would be worse off under the program.
Why do the results show unambiguous negative effects of combination classesdespite the mixed results of previous research? Though the directional bias of OLSestimates suggests that schools selected their better students to participate incombination classes, it is plausible that California in the late 1990s provided a sortof worst case institutional environment for mixed grade classes. For example, thereis little evidence that California schools attempted to select teachers who were expe-rienced with or well suited to combination classes for those assignments. Further-more, almost no specialized training or guidance was initially available to theseteachers.
It seems clear that combination classes in California might be different in someother important respects from those studied in other contexts. California exercisesan unusual amount of centralized control over school curriculum. In addition, since1998, the state has required that grade-specific standardized tests be administeredto all students in grades two and above. These tests reinforce the need to teachdistinct skills to students at different grade levels. This structure and testing meanthat a combination class teacher in California is less likely to rely on thematic orcommon curriculum elements than teachers in other settings. In effect, the teachermust teach two separate classes within one classroom. The education literature sug-gests that a prime source of benefit in combination classes is the ability of studentsto work together in accomplishing mutual tasks, an advantage that is lost if the stu-dents are involved in different tasks.
Though it might seem that this rigid structure limits the applicability of this studyto other combination class contexts, education policy trends indicate otherwise.These emerging trends involve a shift toward centralized standards and curriculumand greater grade-specific testing. This makes the California model of the combi-nation class a good approximation for what many states might choose in the future.
If curriculum choice and testing structure make a difference in the achievementeffects of combination classes, other school characteristics might also influencehow a school responds to the increased use of these mixed grade classes. Someschools might be able to better deal with additional combination classes because theyhave different students or programs.
Table 6 shows that the treatment effect of combination classes varies by schoolcharacteristics. The table divides the sample of schools according to three charac-teristics of the student body that are correlated with educational achievement: thepercentage of students eligible for free meals, the percentage non-white students,and the percentage of English learner students.20 For example, panel A comparesthe schools with the most free lunch eligible students with schools that have thefewest such students. Although differential use of combination classes betweensuch schools is small and statistically insignificant, the achievement effect is not.Columns 1 and 3 show that a 1 percentage point increase in combination class stu-dents has no effect on schools with few free lunch students but decreases the scoresof students at schools with many free lunch students by nearly a third of a per-centile. While third graders in all schools have their test scores reduced by combi-nation classes, columns 2 and 4 show that the effect is larger for those in schoolswith many free lunch students. This pattern repeats itself in panels B and C.Schools with a large number of disadvantaged students are more severely impactedby combination classes. This supports Rivkin and Jepsen’s argument that the nega-tive by-products of class size reduction fell disproportionately on schools with largedisadvantaged populations.
Journal of Policy Analysis and Management DOI: 10.1002/pamPublished on behalf of the Association for Public Policy Analysis and Management
20 For each grade, the sample was divided into thirds by school characteristics, and the middle third wasexcluded from the analysis.
PAM273_02_20353.qxd 5/30/08 1:17 AM Page 475

Tab
le 6
.E
ffec
t of
com
bin
atio
n c
lass
es o
n a
chie
vem
ent
by
sch
ool
char
acte
rist
ics.
Mat
h S
core
L
angu
age
Sco
re
Com
bin
atio
n P
ct
Gra
de
Lev
el2n
d3r
d2n
d3r
d2n
d3r
d(1
)(2
)(3
)(4
)(5
)(6
)
A.
Fre
e L
un
ch S
tatu
sL
ow0.
070
�0.
348*
**�
0.00
6�
0.31
6***
13.7
8310
.532
(0.0
99)
(0.1
22)
(0.0
87)
(0.1
05)
Hig
h�
0.34
6**
�0.
398*
�0.
294*
**�
0.41
7**
15.6
5912
.950
(0.1
44)
(0.2
30)
(0.1
17)
(0.1
90)
B.
No
n-w
hit
e P
erce
nta
geL
ow�
0.03
1�
0.21
9*�
0.09
0�
0.22
4**
14.6
4611
.382
(0.1
03)
(0.1
14)
(0.0
91)
(0.0
96)
Hig
h�
0.30
2**
�0.
443*
�0.
280*
**�
0.42
0**
15.5
4412
.878
(0.1
36)
(0.2
49)
(0.1
13)
(0.2
10)
C.
En
glis
h L
earn
ers
Low
�0.
150
�0.
255*
*�
0.19
9**
�0.
235*
*14
.325
10.9
46(0
.107
)(0
.129
)(0
.096
)(0
.110
)
Hig
h�
0.32
4**
�0.
520*
�0.
239*
�0.
542*
*15
.271
12.4
02(0
.154
)(0
.286
)(0
.124
)(0
.249
)
Col
um
ns
1–4
pre
sen
t 2S
LS
coe
ffic
ien
t es
tim
ates
of
the
effe
ct o
f co
mb
inat
ion
cla
ss p
erce
nta
ge o
n t
est
scor
es s
imil
ar t
o co
lum
n (
1) o
f Ta
ble
s 4
and
5.
Low
in
dic
ates
th
at t
he
sam
ple
is
rest
rict
ed t
o ob
serv
atio
ns
inth
e b
otto
m t
hir
d o
f th
at s
choo
l ch
arac
teri
stic
s d
istr
ibu
tion
an
d h
igh
in
dic
ates
th
e to
p t
hir
d.
***I
nd
icat
es 1
%si
gnif
ican
ce l
evel
, **
5%,
and
*10
%.
PAM273_02_20353.qxd 5/30/08 1:17 AM Page 476

A Strategic Response to Class Size Reduction / 477
Should policy makers have foreseen this unintended consequence of Class Size Reduction? Perhaps it is unrealistic to expect that they would anticipate the connection between program incentives and low test scores for some students.However, the assumption that the results of a small controlled experiment, such asProject STAR, could be reproduced wholesale in such a different institutional envi-ronment seems at best naïve. A trial implementation of the program would havelikely uncovered these institutional details before they could generate widespreadperverse consequences.
CONCLUSION
This study relates a cautionary tale about an unintended consequence of wholesaleclass size reduction. The California Class Size Reduction Program spent billions ofdollars to reduce class sizes for early elementary school children. However, the pro-gram focused solely on achieving a certain class size without understanding howclass size affects student outcomes. As a result the program adopted a nonlinearincentive scheme that rewarded schools for meeting a target threshold. Theseincentives led schools to shift students into combination classes as a substitute foradding classes. This paper shows how program rules match with both school gradeobservations that have more students in combination classes, and a pattern of lowrelative test scores.
In the process, it offers strong evidence against increasing student age hetero-geneity through the use of combination classes. Combination classes have anunambiguously negative effect on student achievement and the effect is greater forthird graders than second graders. Students placed in combination classes by theprogram were almost certainly worse off in achievement terms. Further researchinto age-based student heterogeneity is necessary to discover whether the negativeeffect of combination classes generalizes outside the California context. Additionalwork might also examine cross state variation in class size reduction policies to bet-ter estimate the magnitude of the class size effect.
An additional lesson is the renewed caution that effective reforms cannot ignorethe caveats attached to program evaluation efforts. Randomized experiments suchas Tennessee’s Project STAR are commonly considered the best possible source ofinformation on the effect of education reforms. The experience of the CaliforniaClass Size Reduction program shows that scholars must give serious considerationto the limits on external validity that are inherent in experimental designs. Reformproposals are rarely sufficiently flexible to accommodate radical shifts in institu-tional environments or policy details without an understanding of the mechanismby which policy changes affect student achievement.
DAVID P. SIMS is Assistant Professor in the Economics Department at BrighamYoung University.
ACKNOWLEDGEMENTS
I would like to thank Joshua Angrist, Daron Acemoglu, David Autor, Alexis Leon, Cindy Perry,James Poterba, Mark Showalter, Michael Steinberger, and participants in the MIT Bradley Pub-lic Economics/Labor Economics Seminar and MIT Labor lunch as well as anonymous review-ers for helpful comments and suggestions. Remaining errors are the author’s responsibility.
REFERENCES
Acemoglu, D., Kremer, M., & Mian, A. (in press). Incentives in markets, firms and governments.Journal of Law, Economics and Organizations.
Angrist, J. D., & Lavy, V. (1999). Using Maimonides’ rule to estimate the effect of class sizeon scholastic achievement. Quarterly Journal of Economics, 114, 533–575.
Journal of Policy Analysis and Management DOI: 10.1002/pamPublished on behalf of the Association for Public Policy Analysis and Management
PAM273_02_20353.qxd 5/30/08 1:17 AM Page 477

478 / A Strategic Response to Class Size Reduction
Blanco, E. C., Bohrnstedt, G., & Stecher, B. M. (1999). Class size reduction in California:Early evaluation findings, 1996–98. Palo Alto, CA: American Institutes for Research.
Burns, R. B., & Mason, D. A. (2002). Class composition and student achievement in elemen-tary schools. American Educational Research Journal, 39, 207–233.
Campbell, D. T. (1969). Reforms as experiments. American Psychologist, 24, 409–429.
Figlio, D. N., & Page, M. E. (2002). School choice and the distributional effects of abilitytracking: Does separation increase inequality? Journal of Urban Economics, 51, 497–514.
Finn, J. D., & Achilles, C. M. (1990). Answers and questions about class size: A statewideexperiment. American Educational Research Journal, 27, 557–577.
Gutierrez, R., & Slavin, R. E. (1992). Achievement effects of the non-graded elementaryschool: A best evidence synthesis. Review of Educational Research, 62, 333–376.
Hoxby, C. M. (2000). The effects of class size on student achievement: New evidence fromnatural population variation. Quarterly Journal of Economics, 115, 1239–1285.
Jacob, B., & Levitt, S. (2003). Rotten apples: An investigation of the prevalence and predic-tors of teacher cheating. Quarterly Journal of Economics, 118, 843–77.
Jacob, B., & Lefgren, L. (2004). The impact of teacher training on student achievement. Jour-nal of Human Resources, 39, 50–79.
Krueger, A. B. (1999). Experimental estimates of education production functions. QuarterlyJournal of Economics, 114, 497–532.
Lazear, E. P. (2001). Educational production. Quarterly Journal of Economics, 116, 777–803.
Mason, D. A., & Burns, R. B. (1996). Simply no worse and simply no better may simply bewrong. Review of Educational Research, 66, 307–322.
Pavan, B. N. (1992). The benefits of non-graded schools. Educational Leadership, 50, 22–25.
Rivkin, S. G., & Jepsen, C. (2002). What is the tradeoff between smaller classes and teacherquality? National Bureau of Economic Research Working Paper 9205. Cambridge, MA.
Russell, V. J., Rowe, K. J., & Hill, P. W. (1998). Effects of multi-grade classes on studentprogress in literacy and numeracy: Quantitative evidence and perceptions of teachers andschool leaders. Melbourne, Australia: University of Melbourne.
Sims, D. P. (2007) Crowding Peter to educate Paul: Lessons from a class size reduction exter-nality. Manuscript submitted for publication.
Veenman, S. (1995). Cognitive and noncognitive effects of multi-grade and multi-age classes:A best evidence synthesis. Review of Educational Research, 65, 319–381.
Journal of Policy Analysis and Management DOI: 10.1002/pamPublished on behalf of the Association for Public Policy Analysis and Management
PAM273_02_20353.qxd 5/30/08 1:17 AM Page 478


![1 Carbon Nanostructures: Covalent and Macromolecular Chemistry · 1.2 Fullerene-Containing Polymers Since the achievement of [60]fullerenes in ponderable amounts [1], its combination](https://img.pdfslide.net/doc/110x75/5afe37407f8b9a944d8e86aa/1-carbon-nanostructures-covalent-and-macromolecular-chemistry-fullerene-containing.jpg)