Embed Size (px)
Citation preview
A STRATEGY TO ENHANCE TEACHING AND LEARNING THEORETICAL
PROBABILITY WITH THE USE OF A SCHOOL VEGETABLE GARDEN
by
G.L. Legodu
B.AGRIC, B.AGRIC (HONS) AND PGCE (UFS)
Student Number: 2009153020
Dissertation in fulfilment of the requirements for the degree
MAGISTER EDUCATIONIS (MSc Curriculum Studies)
Faculty of Education
University of the Free State
Bloemfontein
Supervisor: Prof. M. Nkoane
Co-Supervisor: Prof. M.G. Mahlomaholo
June 2018
i
DECLARATION
I declare that the thesis A STRATEGY TO ENHANCE TEACHING AND LEARNING
THEORITICAL PROBABILITY WITH THE USE OF A SCHOOL VEGETABLE
GARDEN, hereby submitted for the qualification of Masters at the University of the
Free State, is my own independent work and that I have not previously submitted the
same work for a qualification at/in another university/faculty.
I hereby cede copyright to the University of the Free State.
------------------------------------
GL Legodu
June 2018
ii
ACKNOWLEDGEMENTS
I wish to extend my gratitude to the following:
I thank God (Ramarumo) who turns the impossibility to possibility.
All my ZCC Pastors and members who supported me from junior degree to
date.
My supervisors, Prof Milton Nkoane and Prof MG Mahlomaholo, for their
wisdom, support and guidance.
My beautiful wife, Makgosi Portia Legodu, for her continuous support and
sacrifice throughout the study.
Sule/Surlec for creating conditions conducive for the completion of this study.
Really appreciate, colleagues.
Last but not least, my parents, Tatlhego J Legodu and Regina N Legodu, for
ever believing in me.

iii
DEDICATION
This thesis is dedicated to my son, Omolemo Joel Legodu, and my beautiful wife,
Makgosi Portia Legodu.
iv
LIST OF ABBREVIATIONS/ACRONYMS
CCK Curriculum content knowledge
CDA Critical discourse analysis
CEP Cultural emergent properties
CK Content knowledge
CL Critical linguist
DBE Department of Basic Education
ELRC Employment labour relation council
FET Further education and training
PAR Participatory action research
PCK Pedagogical content knowledge
PEP People emergent properties
NCS National Certificate System
SADC South African Development Community
SEP Social emergent properties
SGB School governing body
SMT School management team
SRT Social realist theory
SVG School vegetable garden
SWOT Strength, weakness, opportunity AND threats
v
ABSTRACT
The study aimed at developing a school vegetable garden to enhance teaching and
learning of theoretical/experimental probability. SVG is a strategy which is based in
three domains, which are curriculum, content and pedagogy knowledge. These three
domains plays a significant role in teacher vocabulary to understand how to present
probability concepts meaningfully to learners. The three knowledge domains, together
with the SVG, were used to define knowledge needed for teaching and learning with
the aid of improved application skills. Furthermore, in the context of this study,
integrated SVG were employed in the teaching of theoretical probability as a teaching
aid.
The study viewed the challenges that teachers were facing when employing SVG and
teaching aids, such as a lack of background knowledge of SVG and
theoretical/experimental probability. Some teachers experience difficulty in the
teaching of mathematical probability in Grade 7, 8 and 9 as a result of content
knowledge. The difficulty is that the teacher cannot keep up with using a school
vegetable garden as a teaching aid in line with the mathematical curriculum. Thus, the
study was motivated to formulate a teaching aid as a strategy for responding to the
challenges. However, the challenge is that the content knowledge needed for teaching
is difficult to comprehend as a result of a lack of training of teachers in mathematical
probability. Thus, the study adopted a theoretical lens which guides the study. In this
study, SRT enabled the study to consider a theoretical lens from the social class and
to consider how people can interact peacefully without being criticised for their views.
Through the multiplicity of theoretical lenses provided by SRT, the study will reveal
multiple strategies.
The study understands that the strategy was made possible by a group of people who
come together with different skills and knowledge. In this study, mathematics teachers
who are faced with everyday challenges of teaching theoretical/experimental
probability managed to engage as a team to resolve their own challenges in a subject.
The idea of meeting and engaging on the matter of their challenges will be driven by
knowledge of production and participatory action research, which enabled improving
production knowledge of mathematical probability.
vi
The study used different tools to generate data, such as audio and video recordings
of learner scripts and learner scores in Mathematics. The study employed critical
discourse analysis in three levels: textual, discursive and social structures. The CDA
depends on diverse experience by improving mathematical probability with the use of
an SVG. This was done to propose possible solutions and strategies that can be
developed to address the success of the study. In addition, the study analysed threats
and risks that were affected in the setting of SVG as a teaching aid, preventing the
implementation of strategies. The threats and risk of implementing the strategy of
teaching mathematical probability will be overcome by the success indicators and
responses in solutions.
vii
TABLE OF CONTENTS
DECLARATION ....................................................................................................... i
ACKNOWLEDGEMENTS ........................................................................................ ii
DEDICATION ......................................................................................................... iii
LIST OF ABBREVIATIONS/ACRONYMS ............................................................... iv
ABSTRACT ............................................................................................................ v
CHAPTER 1 : THE ORIENTATION TO AND BACKGROUND OF THE STUDY ....... 1
1.1 INTRODUCTION ........................................................................................... 1
1.2 BACKGROUND OF THE STUDY ................................................................. 1
1.3 PROBLEM STATEMENT .............................................................................. 4
1.3.1 Research Question ................................................................................. 5
1.3.2 The Aim of the Study .............................................................................. 5
1.3.3 Objectives ............................................................................................... 5
1.4 THEORETICAL FRAMEWORK FOR THE STUDY ....................................... 5
1.4.1 The origin of social realist theory ............................................................ 6
1.4.2 Formats of social realist theory ............................................................... 7
1.4.3 Epistemology .......................................................................................... 8
1.4.4 Ontology ................................................................................................. 8
1.4.5 Role of Researcher ................................................................................. 8
1.4.6 Relationships between researcher and participants ............................... 9
1.5 DEFINE AND DISCUSS OPERATIONAL CONCEPTS OF THE STUDY ..... 9
1.5.1 Teaching and Learning ......................................................................... 10
1.5.2 Theoretical Probability .......................................................................... 10
1.5.3 Experimental Probability ....................................................................... 10
1.5.4 Teaching of Theoretical Probability ...................................................... 11
1.5.5 Content knowledge ............................................................................... 11
1.5.6 Pedagogical knowledge ........................................................................ 12
1.5.7 Curriculum Knowledge.......................................................................... 12
1.6 LAYOUT OF CHAPTERS ........................................................................... 13
CHAPTER 2 : SUMMARY OF RELATED LITERATURE ......................................... 15
2.1 INTRODUCTION ......................................................................................... 15
2.1.1 The Need to Teach Theoretical/Experimental Probability Using SVG .. 15
2.1.2 The Need for the Use of SVG ............................................................... 16
viii
2.1.3 Literature Review Challenges of Teaching and Learning of Theoretical Probability Using SVG ....................................................................................... 17
2.1.4 A Review of Literature to Justify the Components of a Strategy to Improve Theoretical/Experimental Probability through the use of SVG ............. 18
2.1.5 The Conditions Conducive to Theoretical Probability ........................... 20
2.1.6 Threats and Risks That May Negatively Impact Proposed Strategies .. 22
2.1.7 Success Indicators to Teach Theoretical Probability Through the Use of SVG 24
2.2 SWOT ANALYSIS ....................................................................................... 25
2.3 DESIGN, DATA GENERATION AND ANALYSIS ....................................... 25
2.3.1 Methodology ......................................................................................... 25
2.3.2 Data collection ...................................................................................... 26
2.3.3 Data analysis: critical discourse analysis .............................................. 26
2.3.4 Value of the study ................................................................................. 27
2.3.5 Ethical consideration ............................................................................ 28
CHAPTER 3 : THEORETICAL FRAMEWORK ........................................................ 29
3.1 INTRODUCTION ......................................................................................... 29
3.2 SOCIAL REALIST THEORY AS A THEORETICAL FRAMEWORK ........... 29
3.2.1 The origin of social realist theory .......................................................... 29
3.2.2 Justifying the need for social realist theory (SRT) as a framework ....... 30
3.2.3 Formats of social realist theory (SRT) .................................................. 31
3.2.4 Epistemology ........................................................................................ 32
3.2.5 Ontology ............................................................................................... 33
3.2.6 Role of researcher ................................................................................ 33
3.2.7 Relationships between researcher and participants ............................. 34
3.3 DEFINITIONS OF OPERATIONAL CONCEPTS ........................................ 35
3.3.1 Teaching and Learning ......................................................................... 35
3.3.2 Theoretical probability........................................................................... 35
3.3.3 Teaching of Theoretical Probability ...................................................... 36
3.4 REVIEW OF RELATED LITERATURE ....................................................... 36
3.4.1 Demonstrating and Justifying the Need to Teach Theoretical Probability Using SVG ........................................................................................................ 37
3.4.2 Exploring Challenges of Teaching and Learning of Theoretical Probability ......................................................................................................... 39
3.4.3 Demonstrating and Justifying the Need to Teach Theoretical Probability Using SVG ........................................................................................................ 41
3.4.4 The Component of Teaching and Learning of Theoretical Probabilities 43
3.5 CONDITIONS CONDUCIVE TO THE TEACHING AND LEARNING OF THEORETICAL PROBABILITY USING SVG ....................................................... 45
ix
3.5.1 Condition of Teaching Theoretical Probability Effectively ..................... 45
3.5.2 Conditions for Using Curriculum Knowledge of Theoretical Probability Effectively .......................................................................................................... 46
3.6 THREATS AND RISKS OF TEACHING AND LEARNING OF THEORETICAL PROBABILITY USING SVG ....................................................... 46
3.6.1 Teachers attitude towards mathematical probability ............................. 46
3.6.2 Teacher commitment towards SVG ...................................................... 47
3.6.3 Teacher Workload ................................................................................ 47
3.7 THE SUCCESS INDICATORS USING SVG TO ENHANCE TEACHING AND LEARNING ................................................................................................... 47
3.7.1 Review of SADC countries ................................................................... 48
3.7.2 Theoretical Probability to Improve Teacher CK .................................... 50
3.7.3 Control System for Growing Vegetables in Relation to Experimental Probability ......................................................................................................... 50
3.7.4 Sample space to improve CK and PCK of teachers ............................. 52
3.8 SWOT ANALYSIS ....................................................................................... 55
3.9 SUMMARY OF CHAPTER .......................................................................... 55
CHAPTER 4 : THE USE OF PARTICIPATORY ACTION RESEARCH .................... 56
4.1 INTRODUCTION ......................................................................................... 56
4.2 PARTICIPATORY ACTION RESEARCH ORIGIN AND METHODOLOGY. 56
4.3 DESIGN STRUCTURE ............................................................................... 58
4.3.1 Establish a team of participants ............................................................ 58
4.3.2 Ethical Consideration ............................................................................ 59
4.3.3 Profiling of Research Participants ......................................................... 59
4.4 SWOT ANALYSIS ....................................................................................... 61
4.4.1 Strengths .............................................................................................. 62
4.4.2 Weaknesses ......................................................................................... 62
4.4.3 Opportunities ........................................................................................ 62
4.4.4 Threats ................................................................................................. 62
4.5 THE PROCESS OF GENERATING DATA ................................................. 63
4.5.1 Techniques of co-researchers .............................................................. 63
4.6 DATA ANALYSIS ........................................................................................ 73
4.4.1 Theoretical origin of critical discourse ................................................... 73
4.4.2 Textual analysis .................................................................................... 74
4.4.3 Social analysis ...................................................................................... 75
4.4.4 Discursive practice ............................................................................... 75
4.5 SUMMARY OF CHAPTER .......................................................................... 76
x
CHAPTER 5 : ANALYSIS AND INTERPRETATION OF DATA, PRESENTATION AND DISCUSSION OF FINDINGS .......................................................................... 77
5.1 INTRODUCTION ......................................................................................... 77
5.2 THE NEED TO DESIGN SVG AS A TEACHING AID TO TEACH THEORETICAL PROBABILITY ............................................................................ 77
5.2.1 Learning and Teaching of Theoretical Probability ................................. 78
5.2.2 Allocation of Time to Use the SVG as Teaching Aid ............................. 81
5.2.3 Lack of Strategic Planning for the use of SVG in Mathematical Probability ......................................................................................................... 83
5.3 AN ANALYSIS OF STRATEGIC PLANNING TO OVERCOME CHALLENGES FACED BY THE USE OF SVG .................................................... 84
5.3.1 Lesson Facilitation With the Aid of SVG to Teach Theoretical Probability 84
5.4 THE COMPONENTS OF TEACHING AND LEARNING OF THEORETICAL PROBABILITY ...................................................................................................... 88
5.4.1 Content Knowledge .............................................................................. 88
5.4.2 Pedagogical Content Knowledge of Theoretical Probability ................. 89
5.4.3 Curriculum Content Knowledge ............................................................ 90
5.5 CONDITIONS OF TEACHING AND LEARNING OF THEORETICAL PROBABILITY USING AN SVG ........................................................................... 92
5.5.1 Conditions conducive to teaching and learning of theoretical probability using SVG ......................................................................................................... 92
5.5.2 Condition of teaching theoretical probability effectively ........................ 93
5.5.3 Condition of Using Curriculum Knowledge of Theoretical Probability ... 94
5.6 THREATS AND RISKS FOR THE USE OF SVG ........................................ 95
5.6.1 Teachers’ Attitude Towards Mathematical Probability .......................... 95
5.6.2 Teacher commitment towards SVG ...................................................... 96
5.6.3 The impact of teacher’s workload ......................................................... 96
5.7 THE SUCCESS INDICATORS FOR THE USE OF AN SVG TO TEACH THEORETICAL PROBABILITY ............................................................................ 97
5.7.1 Linking of SVG and Theoretical Probability .......................................... 98
5.7.2 The Importance of Content Knowledge to Teach Theoretical Probability 98
5.7.3 The Experimental Probability in an SVG and Assessment for Learners 100
5.8 CONCLUSION .......................................................................................... 101
CHAPTER 6 : SUMMARY OF FINDINGS, CONCLUSION, RECOMMENDATIONS AND SUGGESTIONS FOR FURTHER RESEARCH ............................................. 103
6.1 INTRODUCTION ....................................................................................... 103
6.2 BACKGROUND AND PROBLEM STATEMENT ....................................... 103
xi
6.2.1 Research Question ............................................................................. 105
6.2.2 Aim and Objectives of the Study ......................................................... 105
6.2.3 The Objectives of the Study Were: ..................................................... 105
6.3 FINDINGS AND RECOMMENDATIONS .................................................. 106
6.3.1 Recommended Strategies .................................................................. 107
6.3.2 Strategies Recommended for Sufficient Preparation .......................... 111
6.4 SUMMARY OF THE STUDY BASED ON CONCEPTS OF EXPERIMENTAL AND THEORETICAL PROBABILITY .................................................................. 124
6.5 CONCLUSION .......................................................................................... 127
REFERENCES ................................................................................................... 128
LIST OF ANNEXURES
ANNEXURE A: ETHICAL CLEARANCE LETTER
ANNEXURE B: CONSENT FORM FOR PARENTS
ANNEXURE C: CONSENT FORM FOR LEARNERS
ANNEXURE D: PERMISSION LETTER FOR THE SCHOOL
ANNEXURE E: TRANSCRIPTS
ANNEXURE F: STRATEGIC PLANNING
xii
LIST OF TABLES
Table 3-1: Relationship of events and possible outcomes ....................................... 50
Table 3-2: Vegetables .............................................................................................. 52
Table 3-3: Number of plots ....................................................................................... 54
Table 4-1: Examples of errors .................................................................................. 72
Table 5-1: Relationship of events and possible outcomes ....................................... 92
Table 5-2: Table indicating results ......................................................................... 101
LIST OF FIGURES
Figure 3.1: Tunnel .................................................................................................... 51
Figure 4.1: Spiral science (Kemmis et al., 2013: 276) .............................................. 66
Figure 4.2: Figure 3.2: Lesson Plan ........................................................................ 67
Figure 6.1: Tossing a coin ...................................................................................... 114
Figure 6.2: Theoretical probability and experimental probability using SVG .......... 121
1
CHAPTER 1 : THE ORIENTATION TO AND BACKGROUND OF THE
STUDY
1.1 INTRODUCTION
This study aims at developing an approach to enrich teaching and learning of
theoretical and experimental probability using a school vegetable garden (SVG). This
chapter provides an overview of the study by demonstrating a brief background to
elaborating on a problem statement. It continues by outlining theoretical framework,
methodology and design, literature review and the design of an approach which
enhances teaching and learning of theoretical probability.
1.2 BACKGROUND OF THE STUDY
This study aims at developing an approach to enrich teaching and learning of
theoretical and experimental probability using a school vegetable garden. Probability
is known as the impossible or possible, the chance or unlikeliness of the event
occurring at the particular time. Theoretical probability is another way to measure the
chances of an event to get the exact number of outcomes (Dellacherie and Meyer,
2011), which in this instance relates to the example of using a coin. The use of a coin
can demonstrate to learners that we only have two chances of getting tails and heads.
Experimental probability shows the extent to which an experiment can be done many
times sequentially to measure the chances of getting tails and heads. In this case,
tossing a coin more than two times to measure how many times we can get heads or
tails is an example of experimental probability. In this study, learners will be exposed
to factors affecting the chances of developing and growing a vegetable garden under
a variety of circumstances (Graven & Browne, 2008:187). Mathematical probability is
not a difficult concept to understand and is not a major concern. However, most
learners cannot apply theoretical probabilities in a real-life situation and therefore the
integration of a school vegetable garden might demonstrate theoretical probability
using an SVG to overcome the challenges learners encounter in application questions
of theoretical probabilities.
2
A variety of ways exists to deliver mathematics in a meaningful way. It is important to
combine a real-life situation with mathematics, which makes it explicit. For this reason,
the researcher in this study aims to develop an approach which will improve teaching
and learning through growing a school vegetable garden. The school vegetable
garden will serve as a model for explaining theoretical probabilities, which will enable
learners to relate classroom activities to outdoor activities. In this study, the use of
SVG was defined as the knowledge and skills that teachers need to manage and
demonstrate experimental and theoretical probability for positive outcomes which
benefit both teachers and learners. Lastly, in this study, content knowledge (CK) refers
to facts such as the following: (i) theoretical probability: the use of a coin in relation to
an SVG (ii) sample space on how the plot will be sampled after harvesting vegetable;
(iii) experimental probability: the use of dice in relation to the use of an SVG. Hence,
the study aims at improving the teacher’s knowledge and skills, so that he or she can
use a vegetable garden as a teaching aid to facilitate lessons in a manner that will
bring more resources to (i) grab the attention of learners; (ii) enable learners to relate
lessons to real-life situations; and (iii) allow learners to interact with nature and
Mathematics. The study intends to create new initiatives which cater for new
knowledge that enhances concepts of mathematical probability.
The revised National Curriculum Statement for Grades R-9 (schools) argues that
integration in learning is important. The Curriculum of South Africa’s core value is to
support and expand opportunities and to develop attitudes and values across the
curriculum (DoE, 2011). The complexity of translating curriculum expectations into
practice in Mathematics using an SVG will form a building block of our efforts to comply
with the requirements of the South African curriculum. Most learners show below-
average performance in Mathematics, which may be caused by a number of factors,
such as family background, peer pressure and teaching techniques. As a result,
teachers need to be introduced to teaching aids that will enhance teaching and
learning. The emphasis is thus on searching for models that may be used everywhere
by anyone to enable them to explain theoretical probability. Therefore, the use of an
SVG was recommended to be utilised to improve CK of teachers. This model, it is
believed, may be used to improve performance, as teachers will be able to consider
other teaching methods which might be fun for learners. The school vegetable garden
will not be used merely as a teaching technique, but will also cater to a feeding scheme
3
and to the community. We wish to establish a relationship between the community
and the learners (Presmeg 2006:205) to demonstrate and justify the need for a school
vegetable garden. However, the study intends to explore the challenges of teaching
and learning carefully. The challenge will be to convince teachers and learners to
adapt to using the school garden as a teaching and learning technique. The
components of the school vegetable garden need to be highlighted to constitute a
strategy that will enhance learning and teaching. Some threats or risks may exist
regarding the use of a school vegetable garden, like a lack of resources and
environmental challenges that may negatively affect the development of the vegetable
garden. However, best practices for the implementation of a strategy to use a school
vegetable garden will be used and the outcome will depend on the improved
performance of learners and how well they are able to use theoretical probabilities in
a real-life situation. To ensure the success of this integrated SVG with mathematical
probability, the study elaborated on the conditions that are conducive to the success
of this teaching aid. The purpose of this implementation is to ensure that teaching is
effective and efficient for learners.
In South Africa, at most schools where teachers have developed a vegetable garden,
they only had one main purpose. In schools throughout South Africa, a high number
of learners used to be absent due to a lack of food. Therefore, schools decided to
develop vegetable gardens to reduce absenteeism due to a lack of nutrition. Vegetable
gardens were then used to supply the learners in need with nutrition. This initiative
was only focused on giving back to the community, not on multiple implementations.
In Botswana and Asia, teachers use SVG as a teaching aid and as a source of
vegetables for those in need. In these two regions, their focus area was exclusively
English, as they were teaching learners parts of speech using a vegetable garden.
Those were the success indicators of other countries.
However, implementing an SVG as a teaching aid also poses problems. For example,
the teachers and learners can find it time-consuming and this can result in the misuse
of school resources. Teachers should take advantage of an SVG, as it can help during
the process of facilitation and it creates an effective communication platform for
teachers and learners (Sherwyn, Morreale, Michael, Osborn & Pearson, 2000).
Teachers need to be able to identify the strengths of using an SVG in relation to
experimental probability and theoretical probability of how learners will interpret the
4
concepts better with the use of only a textbook as a resource (Ghahramani, 2000).
Teachers could alternate between using different concepts of mathematical probability
during the lesson to allow members with knowledge to share with the ones that need
to improve their CK concepts of probability. If the members cannot meet to understand
these concepts through integration, this will lead to a lack of planning. To prevent the
dangers listed above, members have to meet and understand concepts through the
use of an SVG.
Lastly, I evaluated the success of this teaching aid in ensuring planning before lesson
facilitation, which involves: (i) theoretical probability: the use of a coin in relation to the
SVG; (ii) sample space on how the plot will be sampled after harvesting vegetables;
(iii) experimental probability: the use of dice in relation to the use of the SVG; and (iv)
collaborative teaching, which allows members to do team teaching with the aim of
improving one another’s CK.
Hence, the study aims at improving the teacher’s knowledge and skills, so that he or
she can use a vegetable garden as a teaching aid to facilitate lessons in a manner
that will bring more resources which can (i) grab the attention of learners; (ii) enable
learners to relate the lesson to real-life situations; and (iii) allow learners to interact
with nature and mathematics. The study is intended to create new initiatives which
cater for new knowledge that enhances concepts of mathematical probability.
1.3 PROBLEM STATEMENT
Mathematics seems to be a serious challenge, as is the ability of learners to apply
classroom activities to real-life situations (Schleppegrell, 2007:139). The South African
curriculum lacks a teaching aid or model that can be used for the integration of learning
to enrich teaching and learning of theoretical probabilities. The idea of empowering
learners to apply acquired knowledge (theory) in their everyday lives is that when
knowledge and skills are integrated, learners will be able to handle matters outside the
classroom through application of theory using SVG.
5
1.3.1 Research Question
How can the school vegetable garden be used as an aid to enhance teaching and
learning of theoretical probabilities in Mathematics?
1.3.2 The Aim of the Study
The aim of the study was to design a teaching aid to improve teachers’ content
knowledge for teaching theoretical and experimental probability with the use of an
SVG. This idea was to ensure that learners can also apply lessons in real-life
situations.
1.3.3 Objectives
To demonstrate and justify the need for the use of a school vegetable garden
as an aid to enhance teaching and learning of theoretical probabilities in
Mathematics.
To carefully explore the challenges of teaching and learning of theoretical
probabilities in Mathematics.
To highlight the components that constitute a strategy to use a school vegetable
garden as an aid to enhance teaching and learning of theoretical probabilities
in Mathematics.
To outline the threats or risks of using a school vegetable garden as an aid to
enhance teaching and learning of theoretical probabilities in mathematics.
To demonstrate the success indicators from best practices for the
implementation of a strategy to use a school vegetable garden as an aid to
enhance teaching and learning of theoretical probabilities in mathematics.
1.4 THEORETICAL FRAMEWORK FOR THE STUDY
This study will adopt the social realist theory as a theoretical framework. Social realists
believe that people gain knowledge through an interactive process (Wals, 2006:549).
Schwandt, Cater and Little (2007:187) mention that epistemology is referred to as the
6
justification of knowledge. The ontological stance of the social realists debate that
human observation and interaction indeed perceive that the world exists. This section
validates the choice of SRT as an appropriate theoretical position in designing a
teaching aid to improve CK for teaching theoretical and experimental probability
through the use of a school vegetable garden by ensuring that learners can apply
lessons in real-life situations. The study will then unfold the choice of the study in this
manner by looking at: theoretical origin; formats; ontology; epistemology; the role of
the researcher; and the relationship between the researcher and the participants.
1.4.1 The origin of social realist theory
Social realist theory was established in the Soviet Union in the 19th century. As a
literary movement it started in France with the writings of Gustave Flaubert (1821 –
1880) and Honoré de Balzac (1799 – 1850). It was regarded as a realist art which
became popular in Russia in the 1920s. Social realist theory is known as a theory that
marks artistic movements, puts an emphasis on racial discrimination and social
injustice and ties an unpainted picture of life struggles (Brown & Matthe, 1940: 45).
Social realist theory, which is a combination of the two terms ‘social’ and ‘realism’, was
supported by the Marxist aesthetic to elaborate more on how people construct
knowledge through interpretation of pictures. Many American writers wanted to
explore the economic imbalances with social realist theory and draw attention to urban
lives, as they believed they are responsible for transformation of the nation. The reality
of social life was probe to explore the inconsistent and unconscious desires that shape
the character of these lives (Philadelphia & Lippincott, 1954: 88). The development in
SRT was made to shift the idea which perceives new ways of comprehending SRT,
from the elite to the working class, and its association with culture and society
(Hayward, 1983: 65).
This framework then enabled me to understand the challenges of teachers in teaching
theoretical probability through the use of SVG, which was not experienced only by
those who were around me. A universal perspective of these challenges was obtained
through a literature review at national, regional, Southern African Development
Community (SADC) and international levels, to establish whether there were common
7
and/or related challenges in the teaching and learning of theoretical and experimental
probability.
1.4.2 Formats of social realist theory
Social realist theory is analysed by Archer (1995: 7) by developing mechanisms which
are at the level of realism they are outlined. These mechanisms are structure, culture
and agency and are used to address issues around power relations and gender. The
purpose of formats is to guide this study in divulging other interpretive methods when
analysing SVG aid in teaching theoretical probability. It also allows better
understanding of complex issues around linking SVG with theoretical probabilities. In
this case, the resources in our study are referred to as water, seeds, equipment,
curriculum development and co-researchers that are going develop SVG, and these
are said to be structural emergent properties (SEPs). The SEPs further explain that
social behaviour is controlled by societal elements such as gender, marriage, race and
education (Archer 1995: 168). The format SEPs in sense of availability of resources
such as co-researchers and which be responsible for the development of vegetable
garden. This format emphasises that during this process there is not one correct
perspective. Instead, each and every piece of shared knowledge shall reflect in
someone’s perspective.
Furthermore, the study employed cultural emergent properties (CEPs), which is a
process of employing multiple ideas or strategies developed by people to understand
the complexities of the research problem and how they can best be addressed. The
set of beliefs, values, attitudes and customs in social realist theory are classified as
CEPs and form part of the cultural landscape (Archer, 1995: 180; Archer, 1996: 107).
According to Archer’s social realist theory, these mechanisms (CEPs) elaborate on
how people think about and perceive the world based on their values, beliefs and
customs. These ideologies are comprehended through discourse at a particular time
(Quinn, 2012: 33; Boughey, 2010: 70).
Thus, using the format of SEPs and CEPs allowed me to use an approach for
analysing and interpreting data to enhance the teaching and learning of experimental
and theoretical probability with the use of SVG. In addition, as a CEP, I used it as a
format that will show, in greater depth, the challenges and solutions in using SVG to
8
teach theoretical and experimental probability as a teaching tool for understanding the
importance of bringing real-life situations to a classroom and for better interpretation
of concepts of probability.
1.4.3 Epistemology
The epistemology on the premises of social realist theory indicates that we cannot fully
say we understand the world (Archer, 1995: 7). The work of Schwandt, Cater and Little
(2007: 36) indicates that justification of knowledge depends upon someone’s
perspective in reality. Hence, the study understands that successful development of
SVG aid to teach theoretical probabilities will involve a combination of ideas from
different domains, irrespective of their capacity and background (Dillon & Walls, 2006:
550).
1.4.4 Ontology
Ontology is concerned with the nature of reality on social practice. It also emphasises
the existence of things that contribute to the social environment, determining how
people behave (Blaike, 2007: 48). The ontological theory of SRTT clearly
demonstrates that indeed nature and the social world exists in one’s observations.
This limits the chances of there being biases. Furthermore, I understand that there are
multiple interpretations of the world and that people relate and connect to the world
around them differently. These multiplicities of interpretations inform SRT of the
significance of forming collaborations to create a better understanding of concepts of
probability from different backgrounds.
1.4.5 Role of Researcher
This study employs social realist theory (SRT) as a tool to convene a team which will
find a strategy on how theoretical and experimental probability can be taught with the
use of SVG. The theory unfolds to the idea of moving away from individualism and
finding your role within the team to achieve the study objective. Archer (1995: 7)
indicates that we cannot fully say we understand the world, hence I perceive myself
9
as co-researcher. The study understands that it takes a team with different role players
to realize the common goal and that collaboration will benefit the study. Therefore all
the participants in this study, including myself, are referred to as co-researchers to
embrace uniformity and equality. My role will be co-relating between utility in the daily
lives of co-researchers and allowing a sense of empowerment by creating a conducive
environment among co-researchers, allowing them to express themselves. These co-
researchers are mainly learners who will have a choice of their learning in the social
setting classroom (Denzin, 2001: 326).
1.4.6 Relationships between researcher and participants
Gramsci (1991: 28) indicates that power has a role in any social class, which needs to
be realized. The relationship between researchers is shaped by social realist theory
(SRT), which understands that working in a team can be complex and changeable and
thus can affect the development of SVG to teach theoretical probabilities if power
relations are not well-presented amongst co-researchers (Maxwell, 1986: 77). The
influence of power, according to Archer (1996: 99), can be determined by
demographics and CEPs, based on how they perceive their position, culture, values
and beliefs in a social setting. Hence, Mahlomaholo (2012: 67) indicated that
knowledge of production brings a sense of equality between co-researchers. These
establish a sense of belonging from all members who partake in the study. The
members can articulate the challenges and threats imposed on the idea of the study.
As a result, solutions to the uncertainty of theoretical probability concepts during
interactive processes are created. In this study, the opinions or suggestions of co-
researchers is taken into consideration irrespective of power, age and culture, which
will instil a sense of equality amongst the co-researchers.
1.5 DEFINE AND DISCUSS OPERATIONAL CONCEPTS OF THE STUDY
The study defined the operational concepts of theoretical probability and the use of
SVG. The concepts which are to be defined and discussed in this section will bring us
closer to the link or use of language that is to be used to show how relationships of
operational concepts are to be implemented. The operational concepts of this study
10
are as follows: teaching, learning, theoretical probability, experimental probability,
teaching of theoretical probability, content knowledge, pedagogical knowledge and
curriculum knowledge. All of these operational concepts will positively influence the
strategy of the teaching and learning of theoretical probability with the use of SVG.
1.5.1 Teaching and Learning
Learning is defined as the process of acquiring knowledge or skills, while teaching is
defined as the process of delivering knowledge or bringing about an understanding of
complex matters (Hattie, 2009:55). This section aims to show the significance of the
learning and teaching of theoretical probability.
1.5.2 Theoretical Probability
Theoretical probability is defined as the extent to which something is likely or unlikely
to happen (Gillies, 2000: 20). In the case of heads and tails, there are only two
chances. Furthermore, the theoretical probability of an event is the ratio of the number
of favourable outcomes in an event to the total number of possible outcomes, when
all possible outcomes are equally likely. Mathematical probability is a branch that deals
with calculating the chances of a given event and in this study, the event is a vegetable
garden. The origin of probability was based on gambling games in the 16thcentury
such as dice, card games and lotteries. These gambling games had a significant role
in social and economic states (Hald, 2003: 79). The fundamentals of theoretical
probability were developed by two mathematicians, Blaise Pascal and Pierre de
Fermat (Burton, 2007: 47).
1.5.3 Experimental Probability
The use of experimental probability in this study is one of the significant topics used
to teach learners using SVG. Experimental probability is known as the ratio of the
number of favourable outcomes in an event to the number of possible outcomes
(sample space) observed in simulations and experiments. In this case, the plots of
vegetable gardens will be sampled based on the amount of water each carries, so we
11
can measure the possibility that each plot (event) can produce. This will enable
learners to relate probability concepts with nature (SVG). With such knowledge, the
study is confident that it will last in learners’ memories. The probability in many
situations cannot be characterised as equally likely and as a result, each plot will give
us different results based on the amount of water utilised. Therefore, theoretical
probability will be difficult to determine. In such cases, experiments may be conducted
to identify the probability of each plot. Learners should know that before conducting
experiments, they should predict the probability whenever possible and use the
experiment.
1.5.4 Teaching of Theoretical Probability
Teaching remains in great demand, as it is required to empower and educate people
on a daily basis. The Macquarie Dictionary (1997) defines the term ‘teaching’ as a
process or platform whereby authority transfers knowledge according to learners’
needs and experiences through intervention. Relating to some definitions of teaching
and drawing from them shows that we are all teachers and therefore the study is
confident about the success of developing SVG aid to teach theoretical probabilities.
Developing SVG will require teamwork, which will allow co-researchers to construct
ideas to demonstrate theoretical probabilities in real-life situations (Parker & Palmer,
1998: 4).
1.5.5 Content knowledge
Content knowledge (CK) is defined as knowledge needed by the teacher to transfer
skills to the other recipient effectively. It is therefore important to take into
consideration that as a teacher, you need CK at its optimal depth to be able to
demonstrate the teaching of theoretical probability. A teacher who can teach learners
any subject in such a way that learners can understand and implement it in any
environment, can be considered a competent teacher. The conceptualisation of the
kind of knowledge needed by teachers can be traced to the work of Lee Shulman
(1986). Ward, Kim, Ko and Li (2015:130), drawing from Shulman, state that content
knowledge (CK) must be transformed and packaged in such a way that learners can
12
understand the content. Thus, in the context of the current study, a teacher will be
considered competent when he/she is able to transform the content of theoretical
probability in such a way that learners can comprehend and interpret information. This
should enable learners to apply teachings in real-life situations. Making sense of
theoretical probability means that learners can understand that probability is about the
possibility and impossibility of a particular event and that they must be able to apply
that to growing a school vegetable garden.
1.5.6 Pedagogical knowledge
The study understands that a teacher is a key aspect in learning as well as in the
learning of theoretical and experimental probability. A teacher who can transfer
theoretical and experimental probability in a lesson so that learners can easily
understand it can be considered competent and a master of the subject. Knowledge
of content and knowledge of pedagogy are not enough to obtain effective teaching
practice without the knowledge of students, curriculum, education objectives and
teaching materials. Hence, in this study we took into consideration the significance of
curriculum knowledge by ensuring that the scope of the work is aligned to the
curriculum and that all learners are involved in the development of SVG. Shulman
explained that Pedagogical Content Knowledge (PCK) is a specific kind of knowledge
which forms the basic knowledge for teachers. It includes the connection of various
kinds of knowledge and skills of representation and the ability to deal with
misconceptions or conceptions of learners. According to Lee, a teacher’s way of
transferring mathematical knowledge to learners through an understandable
technique is the core of PCK. In this case, the teacher should enable learners to apply
lessons in real-life situations, such as linking sample spaces through the use of SVG.
In addition, it is explained that teachers’ PCK is an important element for being an
effective Mathematics teacher.
1.5.7 Curriculum Knowledge
This section draws on studies about the development of Mathematics teachers based
on the prescription of the used curriculum. Watson (1995: 12) states that probability
13
and mathematical statistics were introduced late in the curriculum. As a result, many
educators find it very hard to teach probability. Therefore, in this study, the inability of
educators to comprehend was discussed under the challenges of the study.
Curriculum knowledge is defined as the skills and knowledge learners are expected to
learn at a given time. This includes learning standards or learning objectives they are
expected to meet at the end of the lesson. The educators had to be developed in order
to be aligned with the curriculum. This means that the educators have to be trained to
ensure that they understand theoretical and experimental probability as it appears in
the curriculum, to ensure that they receive an effective education. Curriculum
knowledge merits more in-depth application for considering the work and professional
development of Mathematics teachers. Moreover, the study took a positive stance
towards forming a team which will improve teacher CCK, CK and PCK in the teaching
and learning of theoretical and experimental probability through the use of SVG.
1.6 LAYOUT OF CHAPTERS
Chapter 2 reviews the literature relating to the design of a strategy on how
theoretical/experimental probability can be learned and taught with the use of a school
vegetable garden. This chapter starts with a theoretical framework and elaborates
more on the five (5) objectives of the study and the conceptual framework that
underpins the study.
Chapter 3 discusses the appropriateness of PAR as a methodology. Chapter 3 also
discusses the research design, which entails how team members will express their
background knowledge during their meetings. By so doing, the research team will be
formed to establish the common problem and find the common solution. The chapter
discusses methods of data generation and data analysis, which employed Van Dijk’s
CDA.
Chapter 4 presents, discusses and analyses data and provides the interpretation for
each of the five objectives of the study. The chapter analyses the challenges
experienced by teachers who teach theoretical/experimental probability, which will
take the initiative of using a teaching aid SVG. This was done to establish the possible
solutions and strategies that can be developed, adopted and adapted to address the
challenges of teaching mathematical probability.

14
Chapter 5 Presents the findings and recommends the strategies designed in Chapter
4 for each finding discussed.
15
CHAPTER 2 : SUMMARY OF RELATED LITERATURE
2.1 INTRODUCTION
This section reviews literature related to improving teaching and learning of theoretical
and experimental probability through the use of SVG. The literature reviews the best
practices in SADC and South Africa, which aims at improving the objectives of the
study.
The literature review justifies the need for using SVG to teach theoretical probability.
This section will review related literature on the teaching and learning of theoretical
probability through the use of SVG. This strategy will be drawn from other countries
looking at challenges, thereby justifying the need for SVG, components, threads and
success indicators of teaching and learning of theoretical probability using SVG.
2.1.1 The Need to Teach Theoretical/Experimental Probability Using SVG
Mathematical probability is one of the topics which are included in the curriculum of
South Africa (DBE, 2010: 5). Mathematics is one of the more challenging subjects in
South Africa. It is therefore important to find strategies which can improve the subject.
Jarvis (2007: 45) mentions that one of the factors contributing to the poor performance
of learners is a lack of content knowledge in educators. The authors state that we will
continue having this problem from generation to generation if teachers lack a
fundamental knowledge of probability. Hence, the study searches for strategies to
enhance teachers’ and learners’ fundamental knowledge of mathematical probability
by investigating and addressing the concepts of mathematical probability. The study
then unfolded topics within probability, such as theoretical and experimental
probability, to investigate the level of understanding or application in real-life situations.
This is done to improve learners’ performance and skills in basic concept such as (i)
theoretical probability; (ii) experimental probability; and (iii) sample space.
16
2.1.2 The Need for the Use of SVG
In this study, the use of SVG plays an important role in acquiring knowledge through
gaining information about the fundamentals of nature and theoretical/experimental
probability. The focus is not only on educating learners about theoretical probabilities,
but is also on demonstrating the importance of nutrition to their bodies (Bradley, 2001:
35). Developing a teaching aid which integrates SVG with theoretical probability is
meaningful and can be applied in daily situations. In the late 1880s, the focus of
vegetable gardens was on production of plants. However, lately the idea has shifted
to production purposes, as well as safety and health, linking it with academics
(Lineberger & Zajicek: 2005: 56). SVG in South Africa and other African countries is
used as a tool to assist learners who come from poor backgrounds by giving them
vegetables on a weekly basis. The idea was to improve attendance of learners at
school by giving them food. Countries in Asia use SVG as a teaching aid for English
while they were giving vegetables after harvesting. This study then adopted the idea
of using SVG as a teaching aid to teach theoretical/experimental probability to
enhance teaching and learning.
The study understands that researching strategies concerning how SVG can be linked
with Mathematics offers opportunities for enhancing the teaching of Mathematics using
SVG. This will develop teachers who can keep up with the pace of how the application
of learners’ skills can be improved through the use of SVG. SVG is able to meet the
demands of the day by promoting effective teaching and learning of
theoretical/experimental probability. Furthermore, research provides a platform for
teachers to be creative and innovative. Creativity and innovativeness in this regard
includes integrating theoretical and experimental probability with the use of SVG. This
environment will be brought to life in a classroom were learners will be free to engage
the educators when trying to find out ways of using SVG and Mathematics. For
instance, in order for good teaching to take place, teachers must do extensive
research to find different materials that will enable learners to acquire the requisite
skills. This suggests that, for learners to have skills in theoretical probability, there is
a need for teachers to conduct extensive research to find appropriate ways to make
content accessible and improve application skills.
17
2.1.3 Literature Review Challenges of Teaching and Learning of Theoretical
Probability Using SVG
2.1.3.1 Lack of content knowledge by the educator
It is unfortunate that some teachers need to be equipped with sources or material and
sufficient teaching aids to enrich learning. Some teachers still need CK and PCK
formal knowledge of how learners should learn (Booth, 1998: 166). The insufficiency
of any effect in learning can create a negative attitude towards the learning of things.
The term ‘learning’ is defined as a process whereby learners acquire knowledge and
perceive the world (Zimmerman & Schunk, 2001: 313). The term ‘learning’ should
encompass a process of understanding abstract principles, remembering and
developing behaviour through reasoning.
2.1.3.2 Allocation of time to teach probability using SVG management
Teachers should be able to manage time when using this teaching aid (SVG) to teach
theoretical probability. It is important to know that when time is managed effectively,
this teaching aid can be implemented effectively and learners will be able to
understand the concept of lining up SVG with mathematical probability. There is,
however, a growing body of research that suggests that time management is positively
related to academic performance (Adamson, Covic, & Lincoln, 2004; Britton & Tesser,
1991; Lahmers & Zulauf, 2000; Liu et al., 2009; Macan et al., 1990; Trueman & Hartley,
1996). The education council of South Africa designed time allocation per subject per
week. Mathematics is allocated eight (8) hours per week (elrc, 2000: 66). It is important
for educators to allocate strategically so that they do not fall behind with the syllabus
(Liu et al., 2009). The SVG aid might require extra time that can interrupt the time
allocated for teaching mathematical probability. Strong efforts and ability in planning
can make you good educator (Eilam & Aharon, 2003: 67).
18
2.1.4 A Review of Literature to Justify the Components of a Strategy to Improve
Theoretical/Experimental Probability through the use of SVG
2.1.4.1 Content knowledge
Teachers’ content knowledge of theoretical probability should enable them to apply
different techniques/aids to demonstrate the ability to handle probability to learners.
An educator should have the ability to assess learners from various perspectives, such
as self-report questions (post-test and pre-test) (Borovcnik & Peard, 1996: 43). The
idea is to ensure that the educator knows the area of focus, which will enable them to
handle theoretical probability strategically. Mathematical probability involves general
questions such as ‘average’ and ‘sample’, which can be used to check learners’
understanding of theoretical probability (Watson, 1994a). The ability to understand and
explain what probability is and to use it to solve or test the questions related to
probability is important in our information society. Learners should be able to use the
concepts of probability to deal with the questions they meet in their daily lives, because
the concepts and implementation of probability are common in daily life. Teachers
should be able to facilitate a lesson through the use of SVG as a teaching aid to ensure
that learners can apply their lesson on their daily lives.
Teachers should first understand that the term ‘probability’ is about estimation and the
possibility/impossibility of an event. They should be able to describe all possible
outcomes for an experiment. In this case, teachers should be able to show learners
the possibility of the growth of vegetables in each plot. Through this lesson, learners
can develop their logical mathematical estimation for the chance of an event in order
to make a decision for this event in SVG.
The main idea of teaching theoretical/experimental probability using SVG is to let
learners have hands-on experience and use nature to have more common sense
regarding knowledge of probability. Improve teacher CK is done through team
teaching as co-researchers share skills on how theoretical and experimental
probability can be linked using SVG. Teachers should introduce learners to common
examples of theoretical/experimental probability, such as rolling dice and tossing a
coin. It will also bring educators and learners to the curriculum expectation, as
prescribed in the pace setter. For a professional development program, it will be highly
recommended that content knowledge is of low quality, since it is well known that
19
mathematical statistics/probability are introduced later, after educators are qualified
for teaching as a profession.
2.1.4.2 Pedagogical knowledge of theoretical probability
The first item is about having a conceptual understanding of the mathematics of
theoretical probability. This explains the pedagogical knowledge required from the
teacher in order to deliver content of theoretical probability effectively. Fennema and
Franke (1992) argue that if a teacher has a conceptual understanding of probability,
this influences classroom instruction in a positive way. Therefore, it is important to
have mathematical knowledge as teachers. Teachers’ interrelated knowledge is very
important, as are procedural rules, as this will ensure that learners can relate to the
content of probability through the use of SVG. Fennema and Franke (1992: 153) state:
‘If teachers do not know how to translate those abstractions into a form that enables
learners to relate the mathematics to what they already know, they will not learn with
understanding.’ The use of SVG will help teachers to easily demonstrate theoretical
probability, from the abstract to the concrete. This will enable learners to understand
the concepts and be able to apply them in real-life situations.
According to Shulman (1995: 130), pedagogical content knowledge includes: the ways
of representing and formulating the subject that make it comprehensible to others; an
understanding of what makes the learning of specific topics easy or difficult; and the
conceptions and preconceptions that learners of different ages and backgrounds bring
with them to the learning of those most frequently taught topics and lessons. Based
on Shulman’s (1987) notion of pedagogical content knowledge, effective teachers can
possess an in-depth knowledge of theoretical/experimental probability to present this
topic to learners (Parker & Heywood, 2000). Shulman (1987) states that pedagogical
content knowledge must include the knowledge of learners and their characteristics,
knowledge of educational contexts, knowledge of educational ends, purposes and
values, and their philosophical and historical bases. Additionally, in this current study,
the concept of teaching learners about how to relate to SVG with theoretical concepts
encourages application of skills and the knowledge of learners will be well measured.
The characteristics of learners in the educational context refers to the ability of learners
to approach abstract matters positively, given that quality skills were transferred.
20
2.1.4.3 Curriculum knowledge
Curriculum knowledge refers to learning objective learners are expected to meet. Like
in theoretical probability, we are aiming to get quality results. This encourages
teachers as they set the tests, assignments or informal tasks, which should be of a
good standard and on par with the requirements of the curriculum of Mathematics. In
this study, it was realised that most teachers were to be trained to teach mathematical
probability, as it was introduced after completion of degrees of mathematical teachers.
The study therefore encourages professional development.
This idea was approached in such a way that teachers will not be undermined,
discouraged, or classified as incompetent. The study saw a need to form collaboration
teaching, which will mould teachers who still lack the skills to deliver
theoretical/probability knowledge with the use of SVG. Teacher development will be
based on curriculum needs as prescribed for the standards of the subject. Teachers
should be able to teach effectively by linking theoretical/experimental probability to the
use of SVG. Team teaching will be a strategy to enhance the learning of theoretical
probability. Challenging content on sample techniques will be demonstrated by team
members to capacitate other members with a curriculum need of theoretical and
experimental probability.
2.1.5 The Conditions Conducive to Theoretical Probability
This section will be demonstrating the condition conducive to teaching
theoretical/experimental probability to improve teacher CK, PCK and CCK, which will
address proposed solution and components in Section 2.4.1.
2.1.5.1 Conditions conducive to the learning of theoretical probability using
SVG to improve CK
It is important to develop teachers by capacitating them to improve on their
performance in Mathematics. The study realised that teaching and learning of
theoretical probability was affected by a lack of CK. Hence, the study formulated a
team of co-researcher which was used as a platform to improve other CKs. Many

21
teachers were struggling with the concepts of theoretical probability, such as the
tossing of a coin and relating that to the use of SVG. Team teaching and collaboration
is an idea which can be used to capacitate each other by improving knowledge of
theoretical and experimental probability. Continuous professional development of
teachers has become significant for many countries around the world (Jita & Mokhele,
2014: 3). Due to the complexity of teaching, which is dynamic and fluid, continuous
professional development becomes essential for keeping up with changes. Thus,
scholars such as Day (1999: 4) find it necessary to emphasise that continuous
professional development is a ‘continuous’ activity. Within the context of professional
development programs, the study improved the information gathered from the teacher
to reinforce the areas of CK which need to be addressed in a classroom setting to
improve the performance of learners.
2.1.5.2 Condition of teaching theoretical probability effectively to improve
PCK
The teaching of theoretical probability using SVG need to outline its condition, which
can best suit the ability of learners to use SVG and mathematics in real-life situations.
The essential process of the teaching and learning of theoretical probability requires
an understanding of how theoretical probability can be meaningful to learners. The
process of teaching theoretical probability forms an underlying part in developing SVG
as knowledge by both learners, teachers and the community. The significance of PCK
in Mathematics is to ensure that, as team members, we are able to integrate teaching
and learning Mathematics through the use of SVG and that we able to form concrete
platforms, which unfolds the concepts of theoretical/experimental probability
systematically. This influences classroom instruction in a positive way. It is therefore
important to have mathematical knowledge as teachers. Teachers’ interrelated
knowledge is very important, as are procedural rules, as these will ensure that learners
can relate to the content of probability through the use of SVG.
22
2.1.5.3 Condition of using curriculum knowledge of theoretical probability
effectively
Since reasoning and proof are central to mathematics and mathematical learning, we
recommend that any Mathematics curriculum represents reasoning. In this study,
reasoning and proofing is done through linking mathematics to the use of SVG. It is
known that reasoning and proofing require teachers who are equipped with curriculum
knowledge, which will indicate if teachers know how to present theoretical concepts to
learners. Teachers who are well-equipped can reason and proof the concepts, as well
as link the concepts to the use of SVG. The study revealed that teachers lack
knowledge of how to present a lesson which will enable learners to proof and reason
concepts of Mathematics. Thus, all team members have the opportunity to experience
these roles. In this way, a sense of belonging and appreciation is bestowed on them
(Keegan, 2012: 901). According to Mickan and Rodger (2000: 22), trust is a necessary
condition for the success of a team. Thus, in the current study we should consider
ensuring that co-researchers have developed trust between them. In addition, Mickan
and Rodger (2000: 204) argue that, in order to have an effective team, there needs to
be good communication between the members. Team teaching is one of the criteria
used to equip educators who lack curriculum knowledge of theoretical and
experimental probability.
2.1.6 Threats and Risks That May Negatively Impact Proposed Strategies
This section addresses the threats and risks of teaching theoretical and experimental
probability using SVG as a teaching aid.
2.1.6.1 Teachers’ attitude towards mathematical probability
The Mathematics curriculum started introducing statistics (probability) during the
nineties (Watson, 1998: 478). Probability was introduced after mathematicians
realised that most learners fail to understand and apply theoretical probability in real-
life situations (Batanero, Godino & Rao, 2004; Gal, 2002: 222). The teaching of
probability remains a challenge for teachers, because they did not do probability while
earning their degree (Batanero, Burrill & Reading, 2011; Watson, 1998: 46). This may
23
have a negative impact on the teaching of theoretical probability and, as a result, the
objective of a lesson won’t be realised. The teacher does not do justice to the topic if
they don’t have the skills to deliver theoretical probability. A lack of CK and PCK in
teachers on theoretical probability will influence their confidence and self-esteem in
classroom management. Teacher attitude can be changed if PCK and CK of
theoretical probability is improved through team teaching and collaborative work. It is
significant to improve CK and PCK of teachers, which will improve the attitude towards
teaching and learning of theoretical probability through the use of SVGs.
2.1.6.2 Teacher commitment towards SVG
In most schools around South Africa, SVGs were used as an initiative to assist learners
and communities in need. The study decided to use SVGs as teaching aids to
demonstrate theoretical probability, rather than to serve one purpose, i.e. supplying
vegetables to learners in need. Teachers were concerned about the allocation of time
to their subject and how an SVG is going to be implemented. This may impose
negative attitudes towards the use of SVGs as teaching aids to help embrace the
concepts of theoretical and experimental probability.
2.1.6.3 Co-researchers’ workload
Workload is one of the major threats to the utilisation of theoretical probability using
SVGs in both lesson planning and facilitation. Buabeng-Andoh (2012: 142), in his
investigation into factors that influence teachers’ adaptation and integration of SVGs
into teaching, reveals that heavy workload is one of the threats to both integration and
adaptation of SVGs in lesson planning and preparation. Similarly, Raman and Yamat
(2014: 15) conducted a study to investigate threats to the integration of SVG in
teaching and learning by teachers and how learners can easily interpret mathematical
probability concepts in real-life situations.
24
2.1.7 Success Indicators to Teach Theoretical Probability Through the Use of
SVG
The research has been done by different countries to find ways to link Mathematics
and SVGs. Researchers believed that teaching only in a classroom cannot be the only
technique to teach theoretical probability (Morris, Briggs, & Zidenberg-Sherr, 2000: 2).
This section will reveal strategies for relating to SVGs with theoretical probability to
improve teacher CK, PCK and CCK.
2.1.7.1 Theoretical probability to improve teacher CK
Theoretical experiments are known as the process of an event where the outcomes
are unpredictable (Gal & Wagner, 1992: 5). The notion, which describes the transition,
is a clear explanation of theoretical probability. Theoretical probability leads to many
possible outcomes. Hence, its transitions relates to the use of SVGs. It allows learners
to understand that not all events have equal likelihood, since we cannot predict the
outcomes of vegetables during the planting process because of external and internal
factors that might have an impact on the development of SVGs. Therefore, this notion
should enable learners to know the influence of water and climatic conditions, since it
can bring unpredictable results to SVGs. In the CK of teachers, they will understand
the importance of relating to concepts and how they should link them.
2.1.7.2 Improving PCK of teachers through the use of a controlled system
Many farmers prefer to use a controlled system, because they can take charge of the
pattern of their vegetables. In this case, the study will use a controlled system for SVG
so that direct control of the quantity of water and nutrients utilised per plot can be
conducted. The study decided to use four plots to study the probability of each plot
producing. The control system is more effective than an open field system, because it
will give relevant results for our study. A controlled system uses tunnels or a hoop
house, which will reach success by ensuring that plants are covered with a plastic
cover and are free from negative influences from biological and climate change (Bright
& Tremblay, 1994: 31). Teacher PCK and CK will be improved, as it will show how
25
vegetables can grow, and the relations between agriculture and mathematics will be
demonstrated as well.
2.1.7.3 Sample space to improve CK and PCK of teachers
The set of all elements of possible outcomes are known as the sample space
(McDuffy, 2004: 56). The denoted outcomes are written with their notation and the
sample space by S. Thus, in set-theory notations 𝑆 = {𝑂1, 𝑂2, }. An event is a
collection or set of one or more simple events in a sample space. The vegetable
garden then will be expressed in this notation based on their plots. The quantity of
water will be measured to see the probability of each plot producing.
2.2 SWOT ANALYSIS
A swot analysis is a strategic evaluation tool that the coordinating team uses to assess
the strengths, weaknesses, opportunities and threats in pursuit of responding to the
challenges they face in the teaching and learning of theoretical probability through the
use of SVG (Ayub & Razzaq, 2013: 93). The SWOT analysis can be used as an
information-gathering tool concerning the team’s competencies. This tool will therefore
assist the study in the allocation of duties of the team to improve the CK and PCK of
mathematical probability.
2.3 DESIGN, DATA GENERATION AND ANALYSIS
This section shows how information will be extracted and analysed from a team of
researchers with the guidance of PAR and CDA.
2.3.1 Methodology
Participatory Action Research (PAR) will be nominated in this project as an approach
to engage teachers and learners through development of SVGs as an aid in teaching
theoretical probabilities. The use of SVG is considered as research conducted by
researchers inspecting local people (communities) that emphasise participation and
26
action (Denzin, 2005: 154). The purpose of such research is to pursue change in the
world by changing their mind-set collaboratively, during processes of participation and
action by local people. In this study, collegiate is a tool in PAR that emphasises who
is referred to as the co-researchers (Chris, 2010: 57). Therefore, in the study, I find
PAR appropriate and relevant, because I understand that, in order to respond to the
five objectives of the study, the co-researchers’ lived experiences are key factors.
Thus, this chapter justifies the use of PAR by explaining PAR as a research
methodology and as a research design. Cook (2003: 4) elaborates that qualitative
research is a method used in this study to enrich insightful results on the importance
of developing a vegetable garden as a teaching aid.
2.3.2 Data collection
The focus group (PAR) will be among the methods used to conduct the study. The
focus group will be outlined in the following groups: One is two mathematical teachers,
40 learners and 2 feeding scheme members. The frequent meetings with co-
researchers will be conducted using the school vegetable garden as a method to
generate data. The minutes of each meeting will serve as an evidence tool that will
demonstrate the success indicators from best practices to implement the strategy to
use a school vegetable garden as an aid to enhance teaching and learning of
theoretical probabilities, as it will explore experiences of feedback. The audio-
recording equipment will be used during our meeting to record the responses of co-
researchers through the communication process (Selvini palazzoli (1984: 45). After all
our meetings, the co-researcher will consolidate the information gathered during the
meetings to draw up a written feedback form.
2.3.3 Data analysis: critical discourse analysis
The conversation level between two parties, where it is used every day in the sense
of ‘talk’, referred to as ‘discourse’ (Robinson-Pant, 2001: 98), is used on a social level
which is the micro level of the social order (Van Dijk, 1998). Critical discourse analysis
(CDA) focuses on the way discourse structures enact, authenticate, legitimate, imitate
or challenge relations of power and political dominance in a society. In this paper, CDA
27
is used to understand people’s interactions through the teaching and learning of
theoretical probabilities using a school vegetable garden. Their perceptions thereof is
used to examine the social relationships and identities of the users in under-resourced
schools in South Africa. It aims to assist in the understanding of different
interpretations and how the interpretations affect use (Stahl, 2004: 60). It explores
possible new insights into the execution of school interventions related to vegetable
gardens, as well as policy evaluation, through using the conceptual lens of discourse
analysis. This knowledge may, in turn, assist those implementing the findings, hence
we train a group of teachers within the school to analyse the impact of the study and
to empower other educators through the use of the school vegetable garden.
2.3.4 Value of the study
According to Desmond, Grieshop and Subramaniam (2002), the importance of linking
vegetable gardens with learning can be an excellent source for education and health
benefits for learners. Regarding the fact that our school is experiencing below-average
results in mathematics, a vegetable garden can be used as a model to explain
mathematical theoretical probability to improve performance and achieve a better
understanding of theoretical probabilities to enable them to apply this knowledge to
real-life situations. However, this study can also be used in other schools and, as a
result, the department of basic education can distribute the idea to consolidate the
idea of integration learning within the curriculum (DoE, 2002). The vegetable garden
in schools will contribute to the community by providing them with vegetables for their
families and forming relationships between learners and parents. The vegetable
garden-based learning will also show learners the importance of the environment
through positive engagement by greater scientific knowledge and understanding of
nature. The school management team (SMT) and school governing body (SGB) will
be satisfied by the idea of a school vegetable garden, as it will be used as a teaching
aid that is effective and can effectively reduce the cost of schooling.

28
2.3.5 Ethical consideration
The co-researchers are my own learners, two other Mathematics teachers and one
kitchen staff member of the feeding scheme. The co-researchers will be given the
indemnity form to abide with. However, all co-researchers will be free to withdraw at
any time if they feel like they do not want to be a part of the study anymore. In any
case, the co-researchers will remain anonymous in this study. As they will be working
with dangerous equipment, learners will wear safety clothing and the first aid kit will
be available during the gardening process.
Regarding the differences between co-researchers, dominant groups who hold power
can increase interpersonal conflicts between co-researchers with different interests in
the development of school vegetable garden decisions. Where co-researchers felt
intimidated by working with adults in our project and verbally attacked each other when
they shared different ideas and opinion about our project, such conflict was addressed
in such a way that no one was treated differently, irrespective of their level.
The use of PAR, which our project will be driven by, will not ignore the fact that
confidentiality in terms of age will furthermore be taken into consideration. Parental
permission in our project will be taken into consideration, as most learners will be
required to stay after school hours to complete the research and hence the consent
form will have been issued to parents

29
CHAPTER 3 : THEORETICAL FRAMEWORK
3.1 INTRODUCTION
This study focuses on the teaching and learning of theoretical probabilities with a
school vegetable garden (SVG) as teaching aid. This study saw the need for
developing a teaching aid that will demonstrate how theoretical probability can be
applied in our daily lives or in a real-life situation. The study presents a theoretical
framework relating to social realist theory (SRT). Regarding SRT, this chapter will
unfold its origin, justification, formats, epistemology, ontology, the role of researchers
and relationships with co-researchers. The operational concepts are defined and the
literature review demonstrates the best practices of other countries by recognising the
five objectives that will shape and conceptualise an approach of the teaching and
learning of theoretical probabilities using SVG. Teaching and learning of theoretical
probability using SVG is used to guide this study in such a way that they make logical
sense when interpreting the data that will be generated in Chapter 3.
3.2 SOCIAL REALIST THEORY AS A THEORETICAL FRAMEWORK
3.2.1 The origin of social realist theory
Social realist theory was established in the Soviet Union in the 19th century. As a
literary movement, it began in France with the writings of Gustave Flaubert (1821–
1880) and Honoré de Balzac (1799–1850). It was concerned with realist art, which
became popular in Russia in the 1920s. Social realist theory is known as a theory that
marks an artistic movement, puts an emphasis on racial discrimination and social
injustice, and paints a picture of life’s struggles (Bown & Matthe, 1940: 45).
Social realist theory is a combination of two terms: ‘social’ and ‘realism’. It was
supported by the Marxist aesthetic to elaborate more on how people construct
knowledge through interpretation of images. Many American writers wanted to explore
the economic imbalances with social realist theory and draw attention to urban lives,
as they believed they are responsible for the transformation of the nation. The reality
of social life was probed to find how their inconsistent and unconscious desires shaped
30
their characters (Philadelphia & Lippincott, 1954: 88). The developments in SRT were
made to shift ideas and perceive new ways of comprehending society’s elite and
working-class, as well as its association with culture and society (Hayward, 1983: 65),
through SRT.
Social realist theory becomes a straightforward means of bureaucratic and
administrative control of culture by the state. Vaughan (1973: 39) states that if artists
portray our lives correctly, we cannot fail to understand social realist theory. Gramsci
(1991: 28) indicates that power relations have an influential role in a social class, which
needs to be realised by socialists. He understood the disadvantage of social classes
ruling by coercion.
The work of Archer (1996) was on social realist theory and emphasises how people
see and think about things. This forms parts of culture, values, ideas and concepts
which shows explicitly trough interactive processes used at that time (Quinn, 2012;
Boughey, 2010: 233). The works of Archer were reviewed by Boughey and Niven
(2012: 643) and they argued that social realist theory shouldn’t be analysed only on
matters conflating culture and agency. Rather, one should understand the epistemic
fallacy that we often do not see and experience things empirically at a level of reality
(Bhaskar, 1978: 16).
3.2.2 Justifying the need for social realist theory (SRT) as a framework
Social realist theory (SRT) is formulated in this study as a framework that guides and
brings about an understanding of how people see things in their social world and how
they play an influential role in our lives (Archer, 2003: 233). The realism is not just a
literary movement, but a philosophical school that believes that people are social
animals and that social influences cannot be neglected (Boughey, 2010: 33).
The social realist theory setting relates to teaching and learning using a school
vegetable garden to enhance the teaching of theoretical probability. It is impossible to
ignore the fact that learning has a relationship with social practice and that it does not
need not take place in a classroom. Therefore, a school vegetable garden will be used
for the teaching of theoretical probabilities (Biggs, 1999; Falk & Dierking, 2000;
Goodrum, 2007; Preston & Rooy, 2007). This informs us that learners and teachers
31
may enjoy creating meaning in different classroom environments, where they have a
choice over learning (Griffins, 2004: 58; Scoot, 1998: 68). The social mediates the
learning environment, since it will involve different structures in developing the SVG,
which I believe will stimulate learner interest in the teaching of theoretical probability.
The co-researchers have control over the amount of seeds to use per plot, the amount
of water that will be required and to measure probability or chances of growth of
vegetable garden, and it will come to the realisation (realism) of the co-researcher
when sharing ideas about developing the school vegetable garden.
The national curriculum statement of South Africa (DoE, 2011) emphasises that
integrating learning is important, as it is defined as a movement towards intergraded
lessons helping learners make connections across the curriculum. It is equally
important to understand that the SRT framework supports this study, as well as the
curriculum of South Africa. Lave and Wenger (1991: 87) view learning as social
practices, rather than just cognitive processes. Preparing learners and teachers to
interrogate and make connections with SVG helps to ensure that learners are able to
apply theoretical probability in real-life situations. Each of these are necessary and
internal relations between the Department of Education (DoE) and schools involve a
mutual understanding of the importance of curriculum development (Jakobsen &
Karlsson, 2002: 23).
3.2.3 Formats of social realist theory (SRT)
Social realist theory is analysed by Archer (1996) by developing mechanisms which
are at the level of realism. They are outlined as follows: structure, culture and agency
to address issues around power relations and gender. The purpose of formats is to
guide this study to divulge on other interpretive methods when analysing SVG aid to
teach theoretical probability. It also allows better understanding of complex issues
around linking SVG with theoretical probabilities.
According to Archer (1995), the existence of the world depends upon the availability
of resources, including people. In this case, the resources in our study are referred as
water, seeds, equipment, curriculum development and co-researchers that are going
develop SVG. This is said to be structural emergent properties (SEPs). The SEPs
further explains that social behaviour is controlled by societal elements such as

32
gender, marriage, race and education (Archer 1995: 168). The set of beliefs, values,
attitudes and customs in social realist theory are classified as cultural emergent
properties (CEPs) and forms part of the cultural landscape (Archer, 1995: 180; Archer,
1996: 107). According to Archer’s social realist theory, these mechanisms (CEPs)
elaborate on how people think about and perceive the world based on their values,
beliefs and customs. These ideologies are comprehended through discourse at a
particular time (Quinn, 2012: 33; Boughey, 2010: 70).
In using this SVG aid to teach theoretical probabilities, the co-researchers may come
from different systematic beliefs, attitudes, values and ideas, which will have an
influential role in the development of the SVG. These will shape the impact of the agent
on this study (Archer, 1995: 39). The mechanism of the agent (people) emergent
properties (PEPs) are said to be people in social realist theory involved in interactive
processes that can be interpreted in different contexts, which require them to exercise
sets of power relations. As a result, they can produce other emergent properties if is
successfully exercised.
The relationship between three mechanisms shows clear descriptions of social realist
theory. The SEP and CEP ideas on social structure, with the availability of resources
and culture with sets of beliefs, as well as idea agents, have the power to destroy or
to retain (Kinvinen & Pirroinen 2006: 255). Hence, the use of agents (PEPs) in this
study insists that power will not reflect to certain domains, but will reflect to all co-
researchers. Therefore, the study is shaped by participatory action research (PAR),
which explains that no one will be submissive or an object in this study. Co-researchers
(agents) will have the freedom of engaging with ideas during the process of SVG aid
to teach theoretical probabilities.
3.2.4 Epistemology
The epistemology, on the premise of social realist theory, indicates that we cannot
fully say we understand the world (Archer, 1995: 7). The work of Schwandt, Cater and
Little (2007: 36) indicates that justification of knowledge depends upon someone’s
perspective in realism. Hence, the study understands that for success of development
of SVG aid to teach theoretical probabilities, a combination of ideas from different
domains, irrespective of their capacity, will be needed (Dillon & Walls, 2006: 550).
33
3.2.5 Ontology
Ontology is concerned with the nature of reality in social practice. It also emphasises
the existence of things that contribute to the social environment to determine how
people behave (Blaike, 2007: 48). The ontological theory of SRT clearly demonstrates
that nature and the social world indeed comes into existence from one’s observations.
This limits the chances of being biased. The event that can be experienced by co-
researchers in developing SVG aid to teach theoretical probabilities ontologically will
depend on whether or not we are aware of the scientific factors that might pose
negative or positive influences on a development of the school vegetable garden,
which will permit construction of knowledge in co-researchers (Ramey & Grubb, 2009:
76).
3.2.6 Role of researcher
This study employs social realist theory (SRT) as a tool to convoke co-researchers to
develop the school vegetable garden to teach theoretical probabilities. Archer (1995:
7) indicates that we cannot fully say we understand the world. Hence, I perceive myself
as co-researcher, because to develop teaching aid (SVG) to teach theoretical
probabilities will be a collaborative work that will benefit myself and my co-researchers.
Therefore, all the participants in this study, including myself, are referred to as co-
researchers to embrace uniformity and equality amongst the co-researchers. Social
realist theory understands that people see things in the social world and that they play
an influential role towards the construction of knowledge and skills amongst co-
researchers (Grubb, 2009: 555). However, my role is to ensure that I understand the
basis of epistemology on social realist theory and I will contribute positively to
collective knowledge and skills to development SVG to teach theoretical probabilities.
My role will be co-relating between utility in the daily life of co-researchers and allow
a sense of empowerment by creating a conducive environment between co-
researchers to express themselves in any way. They are mainly learners who will have
a choice of their learning in the social setting classroom (Denzin, 2001: 326). It is
equally important to demonstrate to co-researchers that school is a mirror of society.
Bauzon and Prisciliama (2004: 195) elaborates that it is significant that the study is
conducted efficiently and effectively to embrace the importance of theoretical
34
probability using SVG by considering different contributions of co-researchers towards
the study for the benefit of a society.
3.2.7 Relationships between researcher and participants
Gramsci (1991: 28) indicates that power has a role in any social class, which needs to
be realised. The relationship between researchers is shaped by social realist theory
(SRT), which understands that working in a team can be complex and changeable and
can thus affect the development of SVG to teach theoretical probabilities if power
relations are not well-presented amongst co-researchers (Maxwell, 1986: 77). The
influence of power, according to Archer (1996: 99), can be determined by
demographics and CEPs, based on how they perceive their position, culture, values
and beliefs in a social setting. Mahlomaholo (2012: 67) indicates that knowledge of
production brings a sense of equality between co-researchers, providing answers for
conflict and misunderstanding during the interaction process.
In this study, the opinions or suggestions of co-researchers is taken into consideration
irrespective of power, age and culture. As a result, it will instil a sense of equality
amongst the co-researchers. People who are taking part in this study, including
myself, are referred to as co-researchers, which brings them very close to the study
without know one being labelled and being submissive, rather than being part of a
development of SVG aid. Co-researchers become free to express their ideas, skills
and knowledge to gain an understanding of scientific and application skills through the
use of the SVG.
The relationship between co-researcher is at the basis of social realist theory, which
indicates that on a social class, power has an effect on the decision-making of co-
researcher (Archer, 1996). Badat (2004: 44) states that inequity is differentiated along
the lines of race and ethnicity and designed to propagate inequality between co-
researchers, which might pose a challenge towards the study. Adhav (2009: 37)
observed the disadvantage of oppressing people based on demographics and culture,
which can threaten co-researcher’s ability to express themselves or be able to engage
each other during the process of using SVG aid to teach theoretical probability.
35
Power relations need to be realised through the lens of SRT to avoid bias or lack of
objectivity, which might lead to conflict and misunderstanding. To advocate for proper
interaction among co-researchers, effective communication needs to take place,
which will encourage co-researchers to feel free when engaging on matters that are
related to the development of SVG to teach theoretical probability using SVG. As
Young (2007: 33) states, realists have accepted that education, as a social institution
through which an individual is constructed, implies that co-researchers advocate self-
learning, which ought to take place through training. Jones and Alun (1999: 55) says
that working together as a team is significant, as the realists indicated that education
is an instrument that is used to build, not individually, but on the level of society.
3.3 DEFINITIONS OF OPERATIONAL CONCEPTS
Operational concepts are subsequently defined and discussed.
3.3.1 Teaching and Learning
This section will show the significance of learning and teaching of theoretical
probability. Learning is defined as the process of acquiring knowledge or skills, while
teaching is known as the process of delivering knowledge or bringing an
understanding of complex matters (Wood, 2001: 97).
3.3.2 Theoretical probability
Probability theory is defined as the extent to which something is likely or unlikely to
happen (Gillies, 2000: 20). Mathematical probability is a branch that deals with
calculating the chances of given event. In this study, the event is a vegetable garden.
The origin of probability was done based on gambling games in the 16thcentury, such
as dice, card games and lotteries. These gambling games had a significant role in
social and economic states (Hald, 2003: 79). The fundamentals of theoretical
probability were developed by two mathematicians, Blaise Pascal and Pierre de
Fermat (Burton, 2007: 47).
36
It is equally important to understand that probability consists of the following: chapter
units, sampling space, data handling and experimental probability. Probability can be
approved by three more methods, but this study decided to choose the following:
classical approach, relative-frequency approach and subjective approach. These
approaches will be substantiated in this section. These three methods of probability
will again be utilised in the linking of theoretical probability and SVG to illustrate the
objectives of the study further.
In the 21st century, theoretical probability is now applied in all kinds of risk assessment,
such as in the insurance industry, medical research and genetic makeup of human
endeavours. In this study, co-researchers should be able to comprehend the risk or
chances of growing vegetables under controlled and open field systems of farming.
Learners and teachers should be aligned to the risk of using required and not required
quantities of water. If this is the case, it will be required of learners to know the impact
it would have on the production of vegetables. The objective of this study is to ensure
that learners can apply what has been taught by teachers in real-life situations by
integrating the teaching of theoretical probability with measuring the chances of SVG
under certain circumstances.
3.3.3 Teaching of Theoretical Probability
Teaching remains in great demand, as it is required to empower and educate people
on a daily basis. The Macquarie Dictionary (1997) defines the term ‘teaching’ as a
process or platform whereby authority transfers knowledge according to learners’
needs and experiences through intervention. Relating to some definitions of teaching
and drawing from them shows that we are all teachers, hence the study is confident
about the success of developing SVG aid to teach theoretical probabilities. Developing
SVG will require teamwork, which will allow co-researchers to construct ideas to
demonstrate theoretical probabilities in real-life situations (Parker & Palmer, 1998: 4).
3.4 REVIEW OF RELATED LITERATURE
This section will review related literature on the teaching and learning of theoretical
probability with the use of SVG. This strategy will be drawn from other countries
37
looking at challenges and justifying the need for SVG, as well as the components,
threads and success indicators of the teaching and learning of theoretical probability
using SVG.
3.4.1 Demonstrating and Justifying the Need to Teach Theoretical Probability
Using SVG
3.4.1.1 The significance of mathematical probability
This section demonstrates how theoretical probability can be taught using SVG by
addressing challenges (see 2.4.1.2). It is evident that not all learners can learn
everything from the book and classroom. The teaching of theoretical probability using
SVG will be a different setting of learning that can demonstrate how mathematical
probability can be applied in every situation of our lives. These types of learning help
to address the means of reducing threats and challenges faced under the teaching of
theoretical probabilities, in order to identify the need for a model such as SVG (Wood,
2001: 97).
This study will use a vegetable garden to demonstrate how learners can understand
theoretical probability concepts. The co-researchers will be learning through observing
this type of learning based on knowledge that is acquired by watching others behave
and considering the consequences (Herbert & Harsch, 1994: 66). Therefore, this study
believes that this type of learning is relevant and applicable, since co-researchers will
be developing SVG by observing one another to understand the probability of plants
and how they grow. This idea is supported by a methodology called participatory action
research (PAR), which is used to generate data and encourage positive participation.
This method supports this type of learning, because it instils a sense of freedom of
mind and allows free participation without intimidation, regardless of your background
(Kemmis and McTaggart, 2000: 22). This study therefore believes that co-researchers,
as they generate data, will construct knowledge by watching others during the process
of preparing soil before plantation takes place to develop SVG and to measure the
probability of measuring plants by applying the required quantity of water.
The idea of teaching theoretical probability using SVG is a systematic process of
learning, which is regarded as cognitive learning and which revolves around the ability
38
of learners to retain information and problem solving (Levin, 1985: 35). This type of
learning fits in with this study, because learners/co-researchers will be able to
construct the link between SVG and theoretical probability. This study developed SVG
as a teaching aid to encourage learners who fail to apply theoretical probability in real
life. Many learners who did not follow the systematic approach cognitively will
eventually find it difficult to apply mathematical probability in real-life situations. If
information is not retained correctly in memory from the initial point of developing SVG
in their memory, misinterpretation of theoretical probability can occur. It is equally
important to instil knowledge systematically into their thoughts to demonstrate the
relationship of SVG with theoretical probabilities. This SVG model will enable learners
to remember to be good thinkers when solving problems in relation to natural
phenomena and application of theoretical probabilities.
It is important to note that the above-mentioned types of learning shows how learners
learn things through theories such as constructivism, behaviourism, social
constructivism and many more. These theories demonstrate how learners interpret
acquired knowledge and how best they can learn through the use of different theories.
Brown and Cooking (2001: 39) states that to develop learners in the social setting,
learners should firstly have a deep foundation of factual knowledge. Secondly, they
should understand facts. Thirdly, they must have the ability to organise knowledge in
ways that facilitate retrieval and application. Such competencies match the objectives
in this study, as its intention is to produce learners who are competent and can apply
knowledge of theoretical probabilities in real-life situations through the application of
SVG.
3.4.1.2 The importance of SVG
The SVG plays an important role in acquiring knowledge in this study by gaining
information about the fundamentals of nature and theoretical probability. The focus is
not on educating learners about theoretical probability, but is also on demonstrating
the importance of nutrition in their body (Bradley, 2001: 35). Developing a teaching aid
integrating SVG with theoretical probability is meaningful and can be applied in daily
situations. In the late 1880s, vegetable gardens were focused on the production of
plants. Lately, the idea has shifted from production purposes and safety and health to
39
the link with academics (Lineberger & Zajicek: 2005: 56). The objective of the SVG is
to ensure that it enables learners to apply skills learned in real-life situations, namely
probability, vocation and life skills, as well as social and personal development.
“...To open the child mind to his natural existence, develop his sense of responsibility and
of self-dependence, train him to respect the resources of the earth, teach him the
obligations of citizenship, interest him sympathetically in the occupations of men, touch his
relation to human life in general, and touch his imagination with the spiritual forces of the
world…” (Bailey, 1909).
The strategy of SVG is to ensure that it employs the idea of Bailey (1909:81),
emphasising how it can enable learners to understand the world better and being able
to discover the use of probability in a process of plantation. The idea of teaching and
learning in a social setting as integrated through the curriculum is motivated by the
framework of this study, i.e. social realist theory. The SVG is an amalgamation of
theoretical probability as experiential education, ecological literacy and agricultural
literacy. This strategy is aimed at teaching children through personal discovery in
natural principles that govern all life, as well as develop a sense of connection with
land (Sealy, 2001: 234).
The focus of the SVG is not on preparing co-researchers to be future gardeners or to
provide an agreeable way to pass the time. The objective of the SVG is to ensure that
lessons learned are applied in real-life situations. Learners are supposed to
understand the chances of plants growing under certain conditions. Experimental
probability demonstrates that co-researchers measure the probability of plants using
different quantities of water per plot.
3.4.2 Exploring Challenges of Teaching and Learning of Theoretical Probability
3.4.2.1 Lack of content knowledge by the educator
It is unfortunate that some teachers need to be equipped with sources or material and
sufficient teaching aids to enrich learning. Some teachers still need CK and PCK and
a formal knowledge of how learners should learn (Booth, 1998: 166). The insufficiency
of any effect in learning can cause a negative attitude towards the learning of things.
The term ‘learning’ is defined as a process whereby learners acquire knowledge and
40
perceive the world (Zimmerman & Schunk, 2001: 313). The term ‘learning’ should not
be understood solely as it is, but should be regarded as a process of understanding
abstract principles, remembering and developing behaviour through reasoning.
Researchers proved that it is difficult to translate knowledge to practical implications
in real-life situations. The researchers further highlighted that learners are from
different background and hence there is no relevance regarding how learners learn
and how teachers transfer meaningful knowledge of SVG (Becher & Trowler, 2001:
55). The relationship between teaching and learning is incomplete, as its attitude and
action determine the unknown outcome. It is therefore significant in this study to take
a positivism stance by teaching theoretical probability to enrich learning through the
use of SVG aid.
3.4.2.2 Allocation of time to teach probability using SVG management
Teachers should be able to manage time when using this teaching aid (SVG) to teach
theoretical probability. It is important to know that when time is managed effectively,
this teaching aid can be implemented effectively and learners will be able to
understand the concept of lining up SVG with mathematical probability. There is,
however, a growing body of research that suggests time management is positively
related to academic performance (Adamson, Covic, & Lincoln, 2004; Britton & Tesser,
1991; Lahmers & Zulauf, 2000; Liu et al., 2009; Macan et al., 1990; Trueman & Hartley,
1996). The education council of South Africa designed time allocation per subject per
week. Mathematics is allocated eight (8) hours per week (elrc, 2000: 66). It is important
for educators to allocate strategically to ensure that they do not fall behind with the
syllabus (Liu et al., 2009). The SVG aid might require extra time that can interrupt the
allocated time to teach mathematical probability, but through good planning, efforts
and ability, it can make you good educator (Eilam & Aharon, 2003: 67). If the ability to
effectively manage time was indeed positively related to academic performance,
interventions that improve time management would be of value to learners.
41
3.4.3 Demonstrating and Justifying the Need to Teach Theoretical Probability
Using SVG
3.4.3.1 Teaching and learning of theoretical probability
This section demonstrates how theoretical probability can be taught using SVG by
addressing the challenges (2.4.2.1). It is evident that not all learners can learn
everything as it is from the book and classroom. Teaching of theoretical probability
using SVG will be a different setting of learning that can demonstrate how
mathematical probability can be applied in every situation of our lives. These types of
learning help to address means of reducing threats and challenges faced under the
teaching of theoretical probabilities to identify a need for a model such as SVG
(McTaggart, 2000: 22).
This study will use a vegetable garden to demonstrate how learners can understand
theoretical probability concepts. The co-researchers will be learning through observing
this type of learning based on knowledge that is acquired by watching others behave
and considering the consequences (Herbert & Harsch, 1994: 66). Therefore, this study
believes that this type of learning is relevant and applicable, since co-researchers will
be developing SVG by observing one another to understand the probability of plants
growing. This idea is supported by a methodology called participatory action research
(PAR), which is used to generate data and encourage positive participation. These
methods support this type of learning because they instil a sense of freedom of mind
and allows free participation without intimidation, whatever your background (Kemmis
& McTaggart, 2000: 22). This study therefore believes that co-researchers, as they
generate data, will construct knowledge by watching others during the process of
preparing soil before plantation takes place to develop SVG and to measure the
probability of plants growing by applying the required quantity of water.
Teaching theoretical probability using SVG is a systematic process of learning, which
is regarded as cognitive learning and which revolves around the ability of learners to
retain information and solve problems (Levin, 1985: 35). This type of learning fits in
this study because learners/co-researchers will be able to construct the link between
SVG and theoretical probability. This study developed SVG as a teaching aid to
encourage learners who fail to apply theoretical probability in real life. Many learners
who did not follow the systematic approach cognitively will eventually find it difficult to
42
apply mathematical probability in real-life situations. If information is not retained
correctly in memory from the initial point of developing SVG in their memory,
misinterpretation of theoretical probability can occur. It is equally important to instil
knowledge systematically into their thoughts to demonstrate the relationship of SVG
with theoretical probabilities. This SVG model will enable learners to remember to be
good thinkers when solving problems in relation to natural phenomena and application
of theoretical probabilities.
It is important to note that the above-mentioned types of learning shows how learners
learn things through theories such as constructivism, behaviourism, social
constructivism and many more. These theories demonstrate how learners interpret
acquired knowledge and how best they can learn using different theories. Brown and
Cooking (2001: 39) states that to develop learners in the social setting, firstly, learners
should have deep foundation of factual knowledge. Secondly, they should understand
facts. Thirdly, they must have the ability to organise knowledge in ways that facilitates
retrieval and application. Such competencies match the objectives of this study, as its
intention is to produce learners who are competent and have ability to apply
knowledge of theoretical probabilities in real-life situations through the application of
SVG.
3.4.3.2 The importance of SVG
The SVG plays an important role in acquiring knowledge in this study by gaining
information about the fundamentals of nature and theoretical probability. The focus is
not only on educating learners about theoretical probability, but is also on
demonstrating the importance of nutrition in their body (Bradley, 2001: 35). Developing
a teaching aid whereby SVG is integrated with theoretical probability is meaningful
and can be applied in daily situations. In the late 1880s, vegetable gardens were
focused on production of plants. Lately, the idea has shifted from production purposes,
as well as safety and health, linking it with academics (Lineberger & Zajicek: 2005:
56). The objective of the SVG is to ensure that it enables learners to apply skills
learned in real-life situations, mainly probability, vocation and life skills, as well as
social and personal development.
43
“…To open the child mind to his natural existence, develop his sense of responsibility and
of self-dependence, train him to respect the resources of the earth, teach him the
obligations of citizenship, interest him sympathetically in the occupations of men, touch his
relation to human life in general, and touch his imagination with the spiritual forces of the
world…” (Bailey, 1909)
The strategy of SVG is to ensure it employs the idea of Bailey (1909:81), emphasising
how it can enable learners to understand the world better and be able discover the
use of probability in a process of plantation. The idea of teaching and learning in a
social setting as integrated through the curriculum is motivated by framework of this
study, which is social realist theory. The SVG is an amalgamation of theoretical
probability as experiential education, ecological literacy and agricultural literacy. This
strategy is aimed at teaching children through personal discovery according to natural
principles that govern all life, as well as develop a sense of connection with the land
(Sealy, 2001: 234).
The focus of the SVG is not on preparing co-researchers to be future gardeners or to
provide an agreeable way to pass the time. Rather, the objective of the SVG is to
ensure that lessons learned are applied in real-life situations. Learners are supposed
to understand the chances of plants growing under certain circumstances.
Experimental probability demonstrates that co-researchers measure the probability of
plants growing using different quantities of water per plot.
3.4.4 The Component of Teaching and Learning of Theoretical Probabilities
3.4.4.1 Content Knowledge
Teachers’ content knowledge of theoretical probability should involve applying
different techniques/aids to demonstrate the ability to handle probability to learners.
An educator must be able to assess learners from various perspectives, such as self-
reporting questions, for example post-test and pre-test (Borovcnik & Peard, 1996: 43).
This idea is to ensure that the educator knows the area of focus. As a result, this will
enable them to handle theoretical probability strategically. Mathematical probability
involves general questions such as ‘average’ and ‘sample’, which can be used to
check learners’ understanding of theoretical probability (Watson, 1994a). Teacher
44
confidence in teaching theoretical probability is best taken into account when
delivering content linking SVG with theoretical probability.
In terms of confidence about teaching individual topics, some variation was observed,
but generally, there were no extremes (Gal & Wagner, 1992: 75). Regarding the
confidence of educators to teach theoretical probability content using SVG, one
approach was to ask the question: ‘What do you think of when you hear the word
“average”? Similar questions were asked for the words ‘sample’, ‘chances’,
‘unlikelihood’ and ‘likelihood’. The responses provided an indication of the
understanding of theoretical probability, which can bring the majority of learners to
concepts of probability, linking it with the SVG. It will also bring the educator and
learner to the curriculum expectation, as prescribed in the pace setter. A professional
development program will be highly recommended if content knowledge is of low
quality, since it is well-known that mathematical statistics/probability was introduced
later, after educators are qualified for teaching as a profession.
3.4.4.2 Pedagogical content knowledge of theoretical probability
Pedagogical content knowledge refers to the ability of the teacher to transform content
into forms that are pedagogically powerful and yet adaptive to the variations in ability
and background presented by the teachers (Kulm and Wu, 2004: 65). Pedagogical
content knowledge for the teachers was illustrated in the structuring of lessons
described and in descriptions of theoretical/experimental probability with the use of the
SVG. According to Shulman (1986), mathematical probability content knowledge and
pedagogical content knowledge are needed by the teacher to ensure that the strategy
of using SVG as a teaching aid integrates parts of effective mathematical instruction.
In order to construct mathematical concepts in learners’ minds, PCK and CK are
crucial, as teachers will give constructive instruction on how the probability of growth
of vegetables will be measured. Learners will be able to see the relationship between
nature and mathematical concepts (Cochran, DeRuiter & King, 1993).

45
3.4.4.3 Curriculum knowledge
Curriculum knowledge is an awareness of different prescribed programs. Material
such as SVG includes knowledge which will enhance the teaching and learning of
theatrical/experimental probability. CCK entails how topics are developed and the
duration of the topic is supposed to take into account how it should be delivered to
learners effectively. The term ‘curriculum’ refers to a document which is instructive to
teachers and learners, giving an effective way of teaching theoretical probability, i.e.
using the tossing of a coin to explain theoretical probability and the rolling of dice to
explain experimental probability (Remillard & Smith, 2007: 99). Teachers who lack
CCK will mislead learners with relevant information or the topic might not be taken into
consideration. It is therefore important that training for such a teacher be implemented
to improve their CCK.
3.5 CONDITIONS CONDUCIVE TO THE TEACHING AND LEARNING OF
THEORETICAL PROBABILITY USING SVG
This section shows the condition conducive to teaching theoretical probability
effectively, improving CK, PCK and CCK.
3.5.1 Condition of Teaching Theoretical Probability Effectively
The teaching of theoretical probability using SVG needs to outline its condition, which
can best suit the ability of learners to use SVG and Mathematics in real life situations.
The essential process of the teaching and learning of theoretical probability requires
an understanding of how theoretical probability can be meaningful to learners. The
process of teaching theoretical probability forms an underlying part in the development
of SVG knowledge by both learners and the community. The significance of CK in
mathematics is to ensure that, as team members, we are capable of integrating
mathematics across the curriculum and in real-life situations.
46
3.5.2 Conditions for Using Curriculum Knowledge of Theoretical Probability
Effectively
Since reasoning and proof are central to mathematics and mathematical learning, we
recommend that any Mathematics curriculum represents reasoning. In this study,
reasoning and proofing is done through linking theoretical probability with the use of
the SVG. Furthermore, teachers will first show the conditions through the use of
examples such as rolling dice or tossing a coin to explain theoretical and experimental
probability. Thus it will ultimately relate this knowledge to demonstrating the
relationship between vegetables and mathematical probability. Learners need to prove
and provide reasons, which then shows the different lengths of vegetables when
different amounts of water was used per plot to show the probability of each production
of a plot.
3.6 THREATS AND RISKS OF TEACHING AND LEARNING OF THEORETICAL
PROBABILITY USING SVG
This section addresses the threats and risks of using an integrated SVG to teach
theoretical/experimental probability. These challenges will assist the literature in
finding the solution on how we can best link theoretical/experimental probability with
the use of SVG to enhance learning and teaching.
3.6.1 Teachers attitude towards mathematical probability
The mathematics curriculum started introducing statistics (probability) during the
nineties (Watson, 1998: 478). Probability was introduced after mathematicians
realised that most learners fail to understand and apply theoretical probability in real-
life situations (Batanero, Godino & Rao, 2004; Gal, 2002: 222). The teaching of
probability remains a challenge to teachers, because they did not do probability during
their preparatory degree (Batanero, Burrill & Reading, 2011; Watson, 1998: 46). Many
teachers find it more difficult to deliver the concept of mathematical probability to
learners than in any other subjects that they might have trained for. This will impose a
challenge to teacher attitude towards the teaching and learning of theoretical
probability. In the curriculum of South Africa, many textbooks under theoretical

47
probability do not have many practical examples. Teaching aids can make theoretical
probability interesting.
3.6.2 Teacher commitment towards SVG
In most schools around South Africa, the use of SVG aid to teach theoretical probability
is another initiative that can be used to solve the problems of teachers. However,
threats around this idea are teacher commitment and the availability of resources to
advance the idea of other teaching skills, mainly SVG aid. The Department of Basic
Education emphasises in the Revised Curriculum Statement (DoE, 2011) that data
handling and theoretical probability were considerably broadened to enable learners
to solve real-life problems. Malnutrition remains a threat in many schools around South
Africa, which results in a high number of dropouts and deficiencies, which might cause
disease outbreaks.
3.6.3 Teacher Workload
Workload is one of the major threats to the utilisation of theoretical probability using
SVG in both lesson planning and facilitation. Buabeng-Andoh (2012: 142), in his
investigation into factors that influence teachers’ adaptation and integration of SVG
into teaching, reveals that heavy workload is one of the threats to both integration and
adaptation of SVG in lesson planning and preparation. Similarly, Raman and Yamat
(2014: 15) conducted a study to investigate threats to the integration of SVG in
teaching and learning by teachers. Their findings reveal that, despite some schools
being resourceful with vegetable garden tools such as soil, land and seeds, which
finalise the SVG for teaching theoretical probability, Mathematics teachers’ workloads
continue to threaten the integration of SVG and remains a threat.
3.7 THE SUCCESS INDICATORS USING SVG TO ENHANCE TEACHING AND
LEARNING
Garden-based learning advocates every child having access to a garden in which they
are encouraged to use all their thinking ability to relate the nature of plants to
48
mathematics (Weed, 1909: 76). The research has been done by different countries to
find ways to link mathematics and vegetable gardens. They believed that teaching
only in a classroom cannot be the only technique to teach theoretical probability
(Morris, Briggs, & Zidenberg-Sherr, 2000: 2). This section will reveal strategies for how
to relate to SVG with theoretical probability to improve teacher CK, PCK and CCK.
3.7.1 Review of SADC countries
Concerning teaching and learning of theoretical probability in the United States, they
have historically been performing the outdoor technique, specifically with vegetable
gardens, to enhance Mathematics. It was not an easy method to implement, but they
found ways to relate vegetable gardens to mathematics. They used material called
‘Making Mathematics Delicious’, which demonstrates the nature of plants with
mathematical concepts through standard-based maths tasks, following the harvest of
peas. A jam recipe would be introduced, after which the students would be given
mathematical questions to complete based on the recipe. The task was
conceptualised for dependent and independent variables of recipes to draw the graph
by calculating the slope of a line and writing an algebra formula to relate to the final
product of the recipe (Bogner, 2002: 11).
The teaching of theoretical probability remains vital in this study, as it will encourage
educators to deliver probability using other sources of examples, which are meaningful
and practical. In these instances, this will unlock the potential and ability for learners
to apply probability in vegetable gardens. The definition of probability is a measure of
the likelihood or unlikelihood that a certain event will actually occur (Batanero, 2015:
22). In United States, teachers used to demonstrate probability by indicating to them
that probability has numerical values between 1 and 0. In the case of an impossible
event, the probability of occurring is 0. When the event is possible, it lies in 1 and all
other events will have a probability between 0 and 1 (Finlay & Lowe, 1993: 6). The
focus point will be units of theoretical probability such as sampling. Experimental
probability will have been addressed as follows in the classroom.
The United Kingdom government raised a concern that outdoor learning is declining
year by year in England. The onus was on the government to address the decline of
teaching mathematical probability using school vegetable gardens. The United
49
Kingdom’s Field Studies Council (FSC) is used to ensure that all schools adhere to
SVG programmes. The vegetable garden is classified as outdoor learning, although it
is the responsibility of teachers and learners to ensure that the project is run
accordingly. The educator would move learners around the vegetable garden to find
the multiplication problems, for example: With seven pepper plants and five peppers
on each plant, how many peppers are there? Alternatively, students create word
problems using plants and exchange them with another student to solve (Andrews,
2001: 55).
The garden provides opportunities for all learners to practice basic mathematical
activities, such as calculations, comparisons, measurements and varied
representations of data (charts, graphs, etc.) (Littlejohn 2001: 477). In Asia,
Mathematics becomes practical and relevant when students implement concepts they
have learned in the classroom in a real-life garden setting. In India, teachers have
showed learners how to measure the growth of plants and display the results on the
different types of graphs by making predictions regarding future growth.
The African continent promoted the idea of having vegetable gardens in the
schoolyard. In southern Africa, the idea of building vegetable gardens has been
supported by many companies, who provide funding for the development of gardens
as a way of giving back to the community. The use of vegetable gardens by schools
served the dual purpose of also addressing nutritional problems. On the African
continent, the concept of having vegetable gardens in the schoolyard is driven by the
fact that government believes that learners fail or perform poorly because they cannot
afford healthy food, which results in socio-economic problems (Drake, 1998: 99).
Learners will be taught how to grow fruits or vegetables and they will be identified
based on their background when the harvesting period commences. Learners will take
portions of fruits and vegetables home to cook and other portions will have been used
as fundraising for school (Nyabanyaba, 2007: 88). In Africa, there has been little
emphasis on practical skills in the curriculum until recent years (Horst, Morna and
Jonah, 1990: 5). The scenario is gradually changing, with gardens being the main
element in Nigeria’s new educational policy and in Sierra Leone, where up to 80
percent of all schools have hands-on gardening classes. After gardening in schools,
children are more likely to help their parents farm at home, eager to show them what
they have learned. This develops prestige for farming in the minds of children.
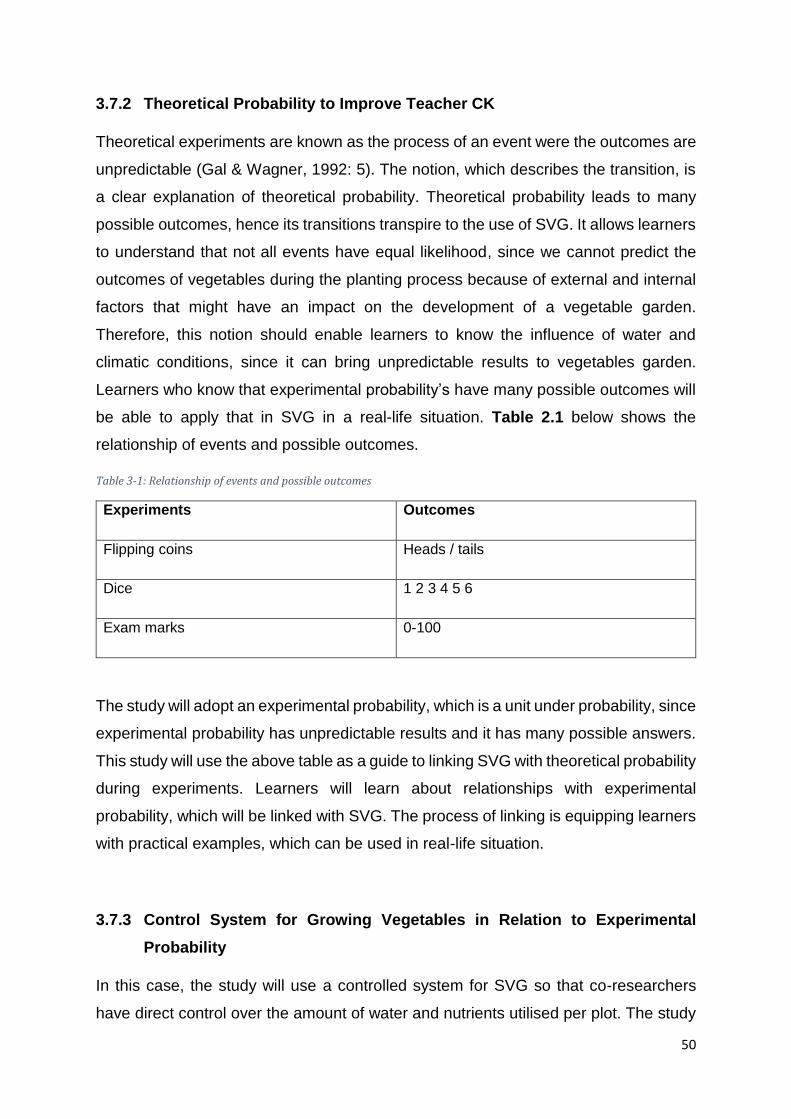
50
3.7.2 Theoretical Probability to Improve Teacher CK
Theoretical experiments are known as the process of an event were the outcomes are
unpredictable (Gal & Wagner, 1992: 5). The notion, which describes the transition, is
a clear explanation of theoretical probability. Theoretical probability leads to many
possible outcomes, hence its transitions transpire to the use of SVG. It allows learners
to understand that not all events have equal likelihood, since we cannot predict the
outcomes of vegetables during the planting process because of external and internal
factors that might have an impact on the development of a vegetable garden.
Therefore, this notion should enable learners to know the influence of water and
climatic conditions, since it can bring unpredictable results to vegetables garden.
Learners who know that experimental probability’s have many possible outcomes will
be able to apply that in SVG in a real-life situation. Table 2.1 below shows the
relationship of events and possible outcomes.
Table 3-1: Relationship of events and possible outcomes
Experiments Outcomes
Flipping coins Heads / tails
Dice 1 2 3 4 5 6
Exam marks 0-100
The study will adopt an experimental probability, which is a unit under probability, since
experimental probability has unpredictable results and it has many possible answers.
This study will use the above table as a guide to linking SVG with theoretical probability
during experiments. Learners will learn about relationships with experimental
probability, which will be linked with SVG. The process of linking is equipping learners
with practical examples, which can be used in real-life situation.
3.7.3 Control System for Growing Vegetables in Relation to Experimental
Probability
In this case, the study will use a controlled system for SVG so that co-researchers
have direct control over the amount of water and nutrients utilised per plot. The study

51
will use four plots for the planting process under a plastic tunnel. The control system
is more effective than the open field system, because it will give relevant results for
our study. A controlled system is known as tunnels or a hoop house, for which its
success will be reached by ensuring that plants are covered with a plastic cover and
are free from negative influences through biological and climate change (Bright &
Tremblay, 1994: 31).
The control system for SVG will use four (4) plots with tomatoes, whereby they will
provide a constant amount of nutrients, but with different amounts of water per plot.
The idea is to show learners the importance of water and that it contributes to the
probability/chances of plant growth. Experimental probability, from its definition, will
show learners that there are many things that contribute to possible outcomes in an
event.
Figure 3.1: Tunnel
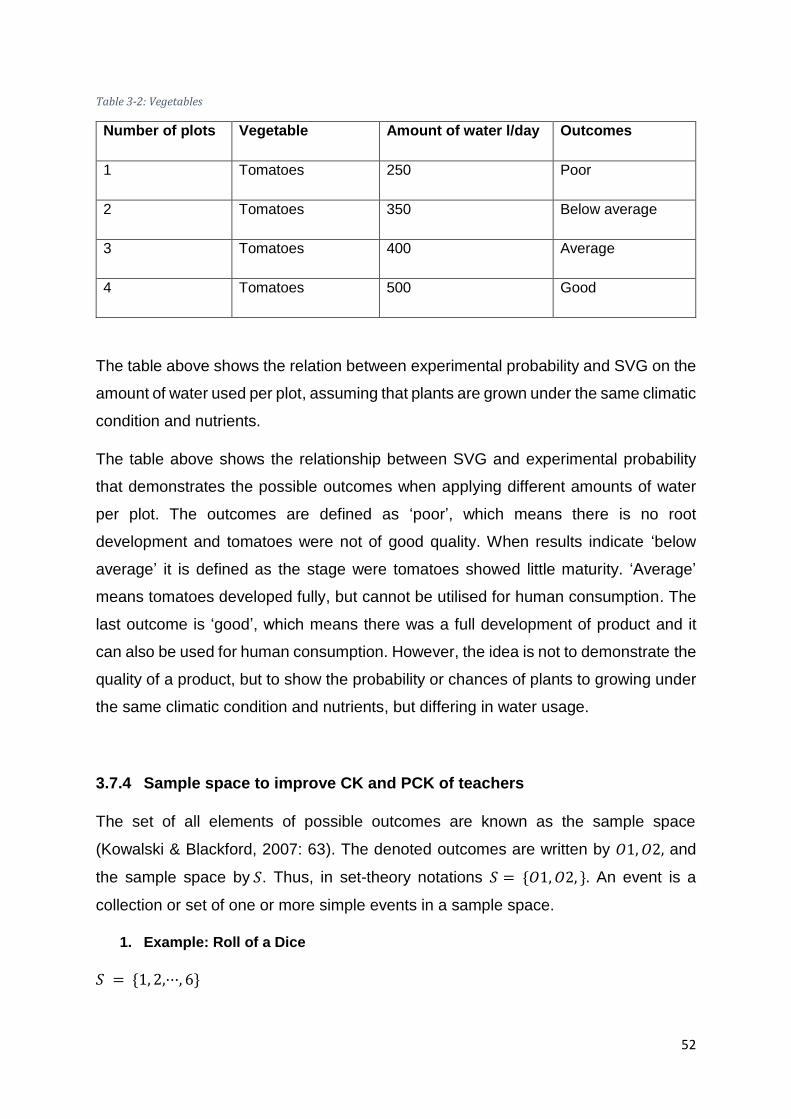
52
Table 3-2: Vegetables
Number of plots Vegetable Amount of water l/day Outcomes
1 Tomatoes 250 Poor
2 Tomatoes 350 Below average
3 Tomatoes 400 Average
4 Tomatoes 500 Good
The table above shows the relation between experimental probability and SVG on the
amount of water used per plot, assuming that plants are grown under the same climatic
condition and nutrients.
The table above shows the relationship between SVG and experimental probability
that demonstrates the possible outcomes when applying different amounts of water
per plot. The outcomes are defined as ‘poor’, which means there is no root
development and tomatoes were not of good quality. When results indicate ‘below
average’ it is defined as the stage were tomatoes showed little maturity. ‘Average’
means tomatoes developed fully, but cannot be utilised for human consumption. The
last outcome is ‘good’, which means there was a full development of product and it
can also be used for human consumption. However, the idea is not to demonstrate the
quality of a product, but to show the probability or chances of plants to growing under
the same climatic condition and nutrients, but differing in water usage.
3.7.4 Sample space to improve CK and PCK of teachers
The set of all elements of possible outcomes are known as the sample space
(Kowalski & Blackford, 2007: 63). The denoted outcomes are written by 𝑂1, 𝑂2, and
the sample space by 𝑆. Thus, in set-theory notations 𝑆 = {𝑂1, 𝑂2, }. An event is a
collection or set of one or more simple events in a sample space.
1. Example: Roll of a Dice
𝑆 = {1, 2,···, 6}
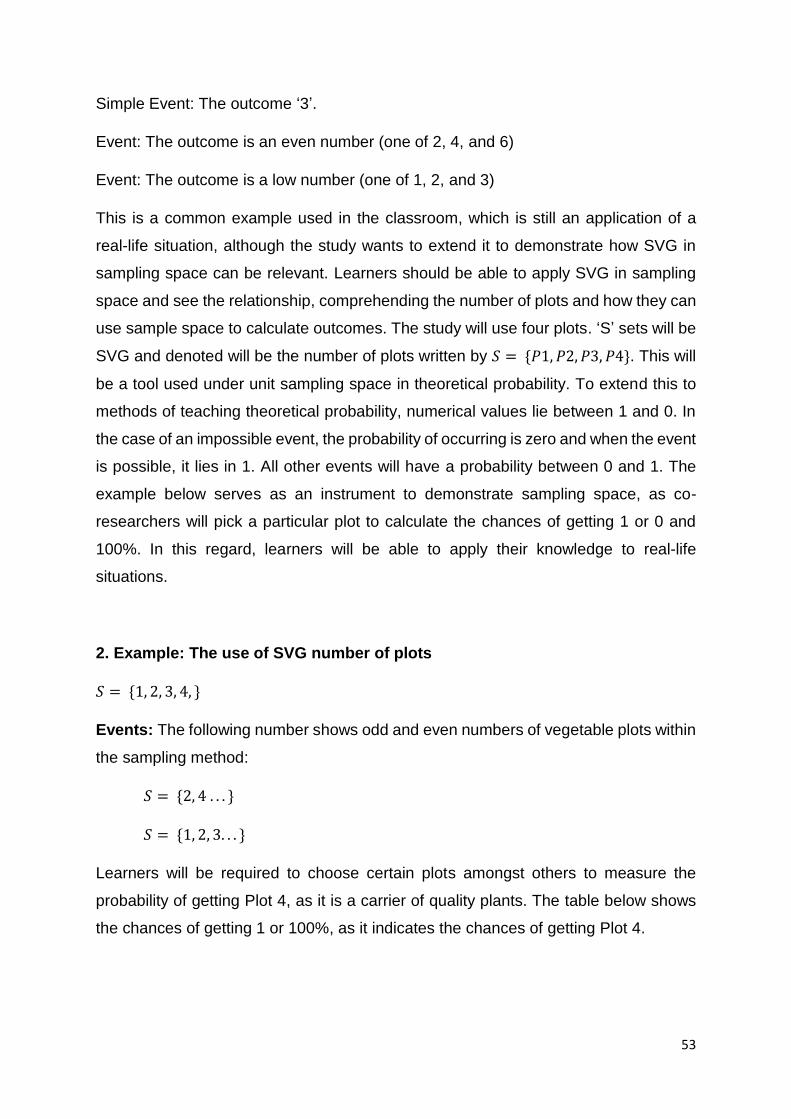
53
Simple Event: The outcome ‘3’.
Event: The outcome is an even number (one of 2, 4, and 6)
Event: The outcome is a low number (one of 1, 2, and 3)
This is a common example used in the classroom, which is still an application of a
real-life situation, although the study wants to extend it to demonstrate how SVG in
sampling space can be relevant. Learners should be able to apply SVG in sampling
space and see the relationship, comprehending the number of plots and how they can
use sample space to calculate outcomes. The study will use four plots. ‘S’ sets will be
SVG and denoted will be the number of plots written by 𝑆 = {𝑃1, 𝑃2, 𝑃3, 𝑃4}. This will
be a tool used under unit sampling space in theoretical probability. To extend this to
methods of teaching theoretical probability, numerical values lie between 1 and 0. In
the case of an impossible event, the probability of occurring is zero and when the event
is possible, it lies in 1. All other events will have a probability between 0 and 1. The
example below serves as an instrument to demonstrate sampling space, as co-
researchers will pick a particular plot to calculate the chances of getting 1 or 0 and
100%. In this regard, learners will be able to apply their knowledge to real-life
situations.
2. Example: The use of SVG number of plots
𝑆 = {1, 2, 3, 4, }
Events: The following number shows odd and even numbers of vegetable plots within
the sampling method:
𝑆 = {2, 4 . . . }
𝑆 = {1, 2, 3. . . }
Learners will be required to choose certain plots amongst others to measure the
probability of getting Plot 4, as it is a carrier of quality plants. The table below shows
the chances of getting 1 or 100%, as it indicates the chances of getting Plot 4.
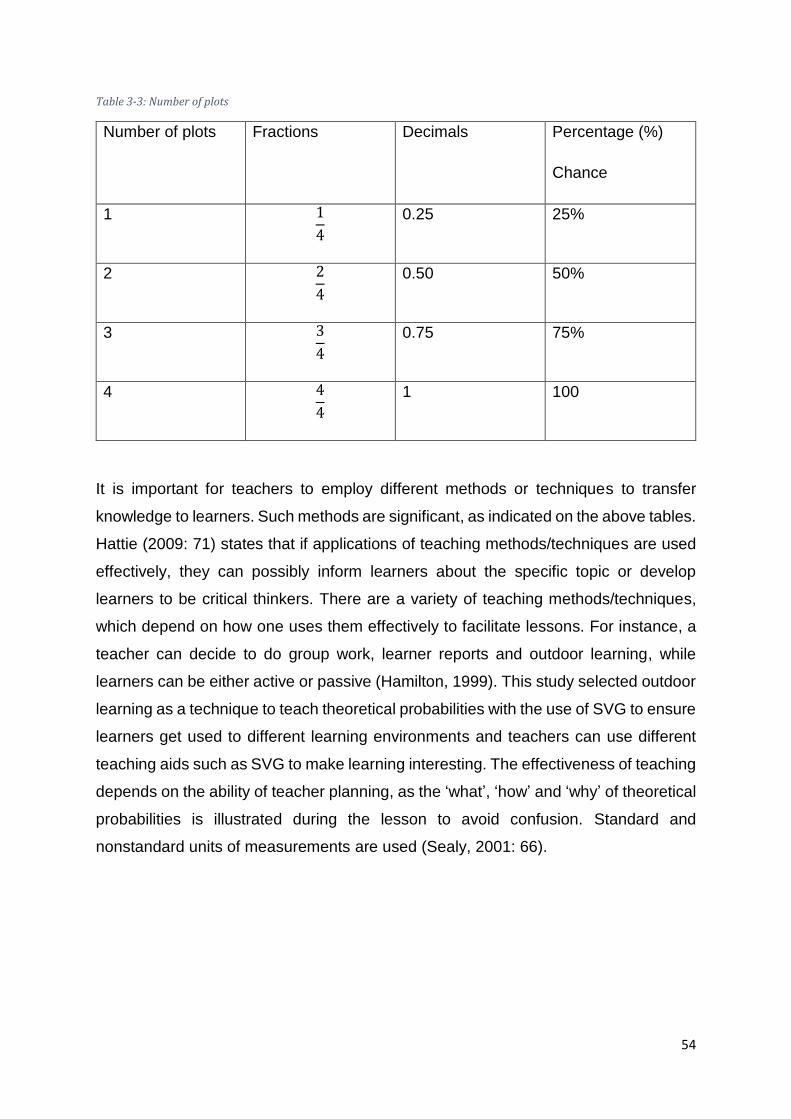
54
Table 3-3: Number of plots
Number of plots Fractions Decimals Percentage (%)
Chance
1 1
4
0.25 25%
2 2
4
0.50 50%
3 3
4
0.75 75%
4 4
4
1 100
It is important for teachers to employ different methods or techniques to transfer
knowledge to learners. Such methods are significant, as indicated on the above tables.
Hattie (2009: 71) states that if applications of teaching methods/techniques are used
effectively, they can possibly inform learners about the specific topic or develop
learners to be critical thinkers. There are a variety of teaching methods/techniques,
which depend on how one uses them effectively to facilitate lessons. For instance, a
teacher can decide to do group work, learner reports and outdoor learning, while
learners can be either active or passive (Hamilton, 1999). This study selected outdoor
learning as a technique to teach theoretical probabilities with the use of SVG to ensure
learners get used to different learning environments and teachers can use different
teaching aids such as SVG to make learning interesting. The effectiveness of teaching
depends on the ability of teacher planning, as the ‘what’, ‘how’ and ‘why’ of theoretical
probabilities is illustrated during the lesson to avoid confusion. Standard and
nonstandard units of measurements are used (Sealy, 2001: 66).
55
3.8 SWOT ANALYSIS
A SWOT analysis is a strategic evaluation tool that the coordinating team uses to
assess the strengths, weaknesses, opportunities and threats in pursuit of responding
to the challenges they face in the teaching of mathematics (Ayub & Razzaq,
2013: 93). The SWOT analysis can be used as an information-gathering tool
concerning the team’s competencies. In this study, SWOT analysis was used to map
the information provided by the analysis to the information gathered from literature
about the skills and resources needed to improve concepts under theoretical
probability, thereby directing the strengths of the team to the opportunities identified
(Ayub & Razzaq, 2013: 93). Furthermore, SWOT analysis is used to identify threats
and weaknesses to improve theoretical probability with SVG.
3.9 SUMMARY OF CHAPTER
Teaching and learning using school vegetable gardens has evolved through the ages,
changing with the philosophies of our education systems and the values of our times.
It is reasonable to expect that our current ideals of educating children through an
integrated curriculum, dealing with issues relevant today and recognising the unique
potential of every child, could be practically realised through the stable establishment
of school vegetable gardens. Further study of teaching and learning of theoretical
probability influences the lives of children and is needed to better understand how to
apply mathematical probability in a real-life situation. In the future, different ways to
incorporate this form of learning may be explored to ensure random and sampling
methods can be interpreted in different contexts of life.
56
CHAPTER 4 : THE USE OF PARTICIPATORY ACTION RESEARCH
4.1 INTRODUCTION
The study will discuss an approach that will be operationalised towards developing a
model (SVG) that will demonstrate theoretical probability. The teaching and learning
of theoretical probability in this study will improve with a school vegetable garden
(SVG). This chapter will glance at the procedure used for sampling, various research
instruments and generating data with participatory action research (PAR). The study
understands that realising its five objectives is done through PAR, which states that
co-researchers will be in a position to provide sufficient knowledge for the study and it
is possible to attempt to answer research questions. In attempting to answer these
research questions, we engaged in a PAR process that will be conducted in this study.
PAR is an inclusionary approach that involves education and action directed to social or
organisational change. Its use in the present study will be discussed later in this study
(Ledwith, 2007: 598). The co-researcher are the ones facing daily challenges and
hence it is significant to employ PAR to involve anyone who might contribute by
sharing ideas to achieve objectives and answer research questions. Social realist
theory (SRT) is used as a framework for the study, as was demonstrated in Chapter
2. SRT is based on knowledge gained through interactive processes and by observing
things. Therefore, the study believes that PAR is relevant, as it will allow free
participation without undermining, underestimating and criticising one another based
on our intellectual capacity or any other form of power relation. Chapter 3 will be
responding to Chapter 2, where ideas will be put into practice by analysing data with
the use of critical discourse analysis (CDA). However, this chapter will rationalise the
use of PAR as a research methodology and a design.
4.2 PARTICIPATORY ACTION RESEARCH ORIGIN AND METHODOLOGY
McDonald (2012; 35) regarded PAR as a body that allows action research. Gills and
Jackson (2012: 264) traced the origin of PAR in 1994, which was conceptualised as
an approach of action during research in the works of Kurt Lewin, who was regarded
as a father of action research. Lewin (1994: 67) elaborated on action during research
57
as a platform that allows anyone who is involved in a study to partake in decision-
making. Such a philosophy will motivate people involved in this study as part of the
study, rather than as tools used to gather information. Lewin established the term PAR
and he highlighted issues of segregation, power relation and discrimination (McNiff &
Whitehead, 2006: 36). According to Lewin, the process of PAR as an action and
reflection between co-researcher is known as spiral science (Kemmis & McTaggart,
1990: 8). Therefore, in this study, we regard teachers as the centre of knowledge in
improving mathematical probability, as they are at the forefront of the class. They
dictate the process of teaching through their involvement in planning, acting, reflecting
and observing during the development of SVG. Together with learners, they can
evaluate the results.
This study adopted PAR as a methodology to generate data, because it complements
the framework of my study of social realism (SR) by the fundamental lens used in the
study. One of the driving forces of PAR is to empower the knowledge of co-researchers
and improve their thinking capacity through action research (Hawkins, 2008: 2). PAR
is relevant for this study, because knowledge is socially constructed and should be co-
constructed with co-researchers. Social realism as framework is therefore also
important (Eruera, 2010: 3), because learners will be interacting about ways to
improve theoretical probability with a school vegetable garden.
The research focuses on human beings, who are referred to as agents under the lens
of SR, meaning that data will have been generated rather than collected from ‘experts’.
This study chooses PAR based on the following three elements of research: ownership
project, social problems and community action (Shea, Poudrier, Thomas, Jeffrey &
Kiskotagan, 2013:4; Kemmis, 2006:462; Titterton & Smart, 2008:57; Kemmis,
2010c:19). The aim of PAR is to ensure that it shapes the lives of community members
through action research by sharing ideas and ensuring that all voices are heard and
respected (Reason, 2000: 328). Members of the community and everyone involved in
this study will be invited to participate. Through engagement and involvement, they
will have an opportunity to partake in the study willingly. Therefore, PAR is a research
approach that takes a stance against oppression and inequalities that are prevalent in
everyday life (Netshandama & Mahlomaholo, 2012: 12).

58
4.3 DESIGN STRUCTURE
The research is guided by PAR, which will show how its objectives are outlined in this
section and executed. The sequence that the research is going to follow includes the
criteria used to establish a team of participants, to divulge on each one of the co-
researcher’s roles and profiles. The study will further offer discussions that will begin
in an informal and formal meeting, followed by the spiral science, which involves
planning, acting, reflecting and observing during the development of the SVG.
4.3.1 Establish a team of participants
The coordinating team was established through a consultative rather than informative
forum, taking into consideration that PAR opposes such tendencies (Kiskotagan,
2013: 4). The research used the school community to generate data. Before then, all
members of the community (teachers, learners, members’ of the feeding scheme and
members of the SMT) will be invited to a meeting where they will be informed about
the research that they can participate in willingly. The coordinating team (co-
researcher) had an understanding about the aim of the research, namely that it is to
ensure that it improves the teaching and learning of Mathematics, as well as nutritional
issues within the school (Hoegl & Schulze, 2005: 266).
The idea of recruiting people into this project was to ensure that knowledge is gained
and aimed at changing their lives. The reason for inclusion of co-researchers is having
an understanding that the product of their historical backgrounds are influenced by
their social context. Therefore, it takes a collective leadership to achieve the goal of
the study, which is to improve teaching and learning of theoretical probability. The
study also included two members of a feeding scheme, because they understand the
importance of vegetables to the health of learners. The only way to realise the success
of the study is involve the school management team (SMT) and their legislative power.
Therefore, the aim is to support the school’s needs, as well as the principal, by bringing
new ideas that can contribute positively to the teaching and learning of mathematics
and nutrition.

59
4.3.2 Ethical Consideration
The study ensured that co-researchers are informed about the objectives of this
project. During the informal and formal meetings, it is important that those co-
researchers are aware that this study was certificated with ethical clearance for the
conducting of research. The study understood that putting the lives co-researchers in
danger or allowing participation without clarity might lead to cognitive dissonances and
might undermine the principles of PAR. The co-researchers understood that
permission for the generation of data was granted by the Free State Department of
Education and the Bainsvlei Combined School. The co-researchers will be given a
consent form with a clear understanding that they are taking part in this research
voluntarily and that they can withdraw at any time without having to provide a reason.
PAR, which our project will be driven by, will not ignore the fact that confidentiality in
terms of age must be taken into consideration. Parental permission for our project will
be taken into consideration, as most learners will be required to stay after school hours
to complete the research. The consent form will therefore have to be issued to parents.
4.3.3 Profiling of Research Participants
The research outlines the profile of co-researchers in the table below, indicating where
they belong, who are they and their responsibility in this study.
Table 3.1 indicates the profiles of co-researchers in their respective working
environments.
Who are they? From? Their responsibility
Principal SMT Resource person
10 learners GRADE 8 Preparation of soil and
planting
10 learners GRADE 9 Watering of plants
Teacher GRADE 8-9 Mathematics
Teacher GRADE 10-12 Mathematics
Teacher GRADE 11-12 Agriculture-science
(chairperson)
60
Female Feeding scheme Secretary
Male SGB Deputy chairperson
We decided to work with 26 members to ensure that we aligned ourselves with the
principals of PAR by ensuring that co-researchers participate willingly in the study.
This is one way that PAR can ensure that quality, assurance and validation of the
research process is taken into account (Reason & Bradbury, 2001: 22; De Vos, 2005:
28; Ryan, 2006: 257). The study will indicate in more depth the profile of each of the
co-researchers. However, it is important to note that names will replaced by
pseudonyms.
4.3.3.1 Learners
The study will invite 10 learners from Grade 8 and 9, since all of them are doing
Mathematics based on the current CAPS syllabus. It is with principles of PAR that the
study should include those who are affected to extract accurate and critical information
of mathematical probability (De Vos, 2005: 44). The study understands that outcomes
of the study will be realised by the learners, since they are affected and, as a result,
their contribution to the study can make them feel a sense of ownership over the final
product (Conder, 2011: 33).
4.3.3.2 Teachers
The actual pillars of this project, considering the experience of being at the forefront
of the class, are teachers. The study includes two Mathematics educators in different
phases. The first teacher is in further education and training (FET) and the other one
is in senior phase (GET), teaching agriculture studies. The reason to include this
educator is mainly that this study is combination of Mathematics and Agriculture
Studies. The educators will provide with different expert knowledge for the study.
61
4.3.3.3 The school management team (SMT)
The SMT member will be the head of the department (HOD) in Mathematics. The SMT
has the legislated responsibility that enables all participants to achieve the desired
outcomes of this study. The contribution of the HOD in the use of SVG to teach
mathematics will establish a sound relationship with learners.
4.3.3.4 Members of the feeding scheme
The study will include feeding scheme members as the secretary of our project. The
contribution of these members will positively influence the study, as they know the
importance of vegetables for learners. They can give expert advice on what to plant
on the field. There is one member who is knowledgeable about the process of planting,
which can help in our study.
4.3.3.5 The school governing body
The SGB member will be the chairperson of our project. The member of the SGB
represents parents of the school. The involvement of the SGB in this study will
automatically be a way to reach out to parents about our project. The involvement will
also give assurance that school resources are not exploited, but that they are going to
benefit the interests of academics and nutritional values.
4.4 SWOT ANALYSIS
SWOT analysis stands for Strengths, Weaknesses, Opportunities and Threats. The
analysis is a tool used to evaluate the performance of our project based on the
components of a SWOT analysis. The team will respond to the challenges of the
project, particularly learners, in the study of Mathematics. This tool will be used to
gather information about the difficulty of applying mathematical probability in our daily
lives. The SWOT analysis will be the strategic tool to improve the teaching and learning
of mathematical probability with SVG (Razzaq, 2013: 93).
62
4.4.1 Strengths
The research team is composed of qualified members from different disciplines, such
as Mathematics and Agriculture Studies. The study involves members of the
community who have ideas on what it takes to make the study succeed. The study
consists of learners who are flexible and energetic. They are willing to learn in the
process of developing a school vegetable garden. The Agriculture Science teacher,
together with one member of the feeding scheme, will give expert advice on how and
when to plant the vegetables. The school has the hostel, which the study will make
use of, as they will be available to irrigate the plants based on prescribed time.
4.4.2 Weaknesses
The process of planting vegetables requires quality resources like equipment and
fertilizers. The study still needs to need find a way to ensure that resources are utilised
correctly, since the study will involve learners. The irrigation system that supplies water
is far from the point where the water will be needed the most to grow our vegetables.
4.4.3 Opportunities
Learners who are involved in this study all stay on the school premises (hostel). The
study will be at the most advantageous site, as learners will be able to monitor the
plants during the process of developing the garden. The success of the study will
improve teaching and learning of mathematical probability across all grades, as we
have involved different teachers from different phases. This strategy will improve and
bring about an understanding of mathematical probability in real-life situations across
all grades. This study allows all the co-researchers involved in this study to learn about
the importance of mathematical probability and how to grow plants.
4.4.4 Threats
Since the study will involve movable equipment, theft will be major risk that can affect
the success of the study. The idea of teaching and learning using the vegetable garden

63
will be implemented for the first time. Therefore, it might pose a threat to teachers who
need to adapt to a strategy that needs to be used across all gardens.
4.5 THE PROCESS OF GENERATING DATA
This section will elaborate on how data was generated and the procedure that needs
to be followed during the generating of data using PAR, as a guideline for this process.
PAR emphasises matters such as oppression, unfairness, bias and power relations,
which should not guide the study, as co-researchers will be coming from different
backgrounds, a fact that needs to be taken into consideration (De Vos, 2005: 17).
Mahlomaholo (2009: 229) elaborates on the balance between the co-researchers in
terms of age, position and gender, which encourage effectiveness of data generation.
The data was generated through the discussions and audio and video recordings of
captured data. The use of video recordings will be utilised for data analysis purposes.
Permission was requested and obtained from researchers. The recordings were later
transferred onto the computer for labelling per assigned co-researchers. It is the
responsibility of researchers to listen to the recording and make notes. The
transcription of significant phrases or relevant information to this study will be captured
and coded as prescribed by Groenwoud (2008: 44).
In addition, the co-researcher will also use learner’s workbook and test scripts to
expose them to research questions. The results will be used to identify learner’s
misconceptions and how learners approach questions in theoretical probability. Since
the research is based on vegetable gardens and mathematics, an analysis of soil
samples will be utilised in order to check suitability of plants in particular types of soil.
4.5.1 Techniques of co-researchers
4.5.1.1 First meeting
The purpose of this meeting is to introduce all the co-researchers to the idea of the
teaching and learning of theoretical probability with a school vegetable garden. The
co-researchers embarked on building relationship between all parties involved in this
study. The reason behind this was establishing self-empowerment so that the co-
64
researcher can see the significance of this study. This process will help with
identification of strengths and weaknesses of co-researchers, as well their personality
traits. The research question will be addressed to give direction on how the SVG will
relate to theoretical probability compared to the current implementation of
mathematical probability.
The certificate of ethical clearance from the University of the Free State and the
permission letter from the Free State DoE were circulated amongst co-researchers.
The ethical standards were met and the study was genuine, as the University of the
Free State and the DoE have approved it. The aim of such processes is to ensure that
the principles of PAR are taken into consideration and that the study will remain
accountable to them.
The procedural rules were also mentioned during this meeting, so that they can
understand the methodology of generating data. It is important to take note of such
procedural rules to maintain good working relationships between co-researchers. The
purpose of the ground rules during the process of generating data is not to threaten or
make the co-researchers feel obliged to participate in this study. The procedural rules
of generating data are outlined as follows:
The explanation of the study (teaching and learning of theoretical probability)
was explained to the co-researchers before commencement.
The purpose of the team as co-researchers was explained to them.
The permission from ETC, the school and the DoE to use the school facilities
and to record the research was explained.
There is no order in the communication structure.
Undermining each other is not allowed.
Power at your work place is not going to play a role in this study.
All ideas are valid.
All suggestion and answers are taken into account.
Only one person speaks at a time.
Commenting negatively on the viewpoints of other co-researchers is not
allowed.
Respect each other at all costs.
65
Furthermore, the co-researchers were informed that no one is better than the other at
the end of the day. No suggestions or answers will have been classified as good or
poor in this study. It was mentioned that that all parties involved in this study should
feel free to respond and to disagree, but that they should rather comment with an
alternative or additional idea. Any disagreement should be in a good way which will
be helpful for anyone involved in this study.
This idea was once again used to reassure the co-researchers about the ground rules
of this study to ensure that we have genuine dignified researcher conduct. The above-
mentioned procedural ground rules were identified, because we don’t want a situation
where a team of co-researchers will feel superior or inferior to the others (Naties &
Borgati, 1998: 83).
4.5.1.2 Plan of action
The plan of action is demonstrated by the team of co-researchers based on the
research question of the study, to look at ways of addressing the objectives of study.
The plan of action will direct the team regarding what needs to be achieved by the
study. Vaara (2010: 882) mentioned that it is significant to show how the strategies or
plans on how to address problems in mathematical probability can instil a sense of
applying knowledge in real-life situations. The team will follow three (3) approaches
designed by them to show how learners and teachers can understand the use of SVG.
Approach no. 1 will focus on the importance of lesson plan, which are normally used
by educators to prepare lessons before meeting the class. This tool is important, as it
will instil greater encouragement in educators to understand how to show the
relationship between SVG and theoretical probability to learners. The teaching and
learning of theoretical probability and its application should be investigated through
the use of approaches designed by co-researchers. This study adopted PAR as a
guide to this study. We used its cycle, which is called the spiral science, as a strategy
that will guide our study in order to achieve the objectives. The components of cycles
are outlined as follows: planning; acting and observing; observing; reflecting; re-
planning acting and observing and reflecting again, as shown in the figure below.
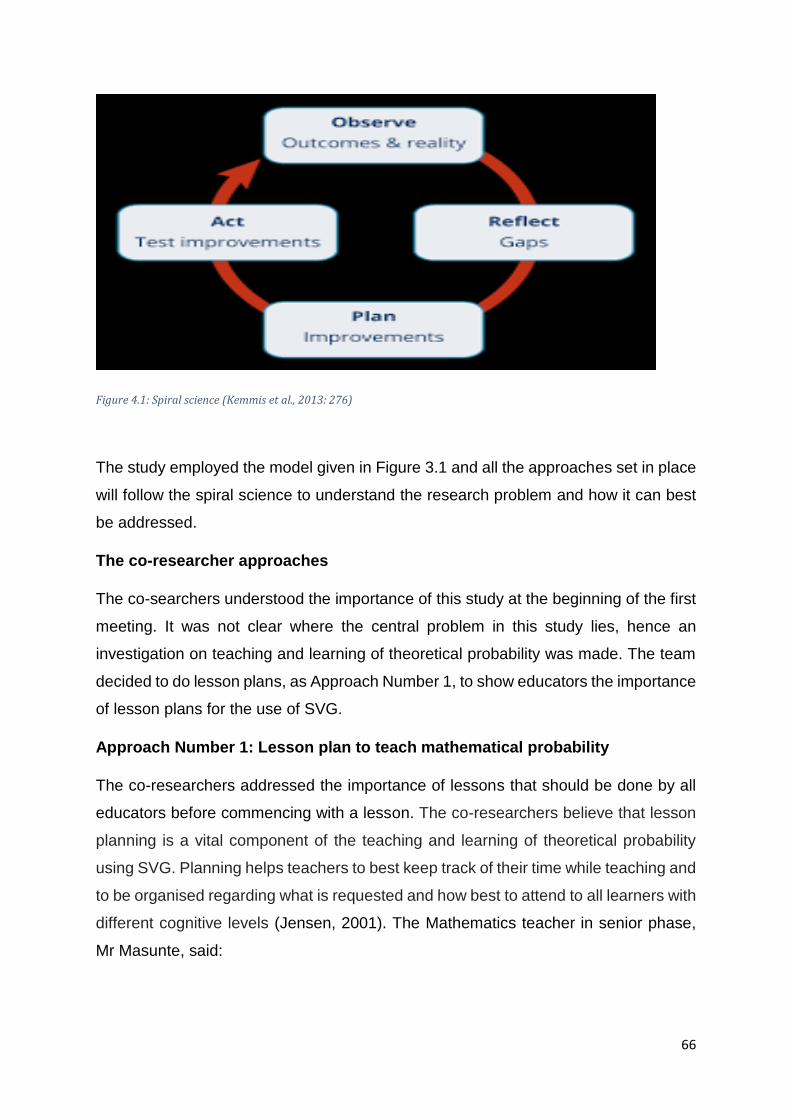
66
Figure 4.1: Spiral science (Kemmis et al., 2013: 276)
The study employed the model given in Figure 3.1 and all the approaches set in place
will follow the spiral science to understand the research problem and how it can best
be addressed.
The co-researcher approaches
The co-searchers understood the importance of this study at the beginning of the first
meeting. It was not clear where the central problem in this study lies, hence an
investigation on teaching and learning of theoretical probability was made. The team
decided to do lesson plans, as Approach Number 1, to show educators the importance
of lesson plans for the use of SVG.
Approach Number 1: Lesson plan to teach mathematical probability
The co-researchers addressed the importance of lessons that should be done by all
educators before commencing with a lesson. The co-researchers believe that lesson
planning is a vital component of the teaching and learning of theoretical probability
using SVG. Planning helps teachers to best keep track of their time while teaching and
to be organised regarding what is requested and how best to attend to all learners with
different cognitive levels (Jensen, 2001). The Mathematics teacher in senior phase,
Mr Masunte, said:

67
Go botlhokwa go dula o itukisa pele ga oka ruta bana ka gore oka kgona go araba morutwa
yo mongwe le mongwe kadi di nako tsotlhe. It is important for an educator to adhere to lesson
plans, as it helps them to be ready to assist any learners at any time.
The team had a common understanding about the internal and external forces which
contribute to learner performance difficulty in applying knowledge in real-life situations.
The lesson plan was developed by the co-researchers to adhere to the principles of
PAR, which agree that a tool that is utilised to improve other lives is said to be a vision
of PAR. In this case, educators will plan a lesson in such a way that learners can relate
theoretical probability to real-life situations (SVG). Based on observations and
reflection on analysis, a further plan of action was drawn up (see Figure 3.2) as a vital
component to demonstrate its significance:
Figure 4.2: Figure 3.2: Lesson Plan
68
Explanation of column headings
Lesson aim/objective
This component elaborates on the rationale behind theoretical probability for
educators and learners. This section is used to express the goal of theoretical
probability and the focus point that it wants to portray to learners. The research
problem is based on challenges learners face in the application of theoretical
probability in real-life situations. This section is therefore relevant for enabling
educators to plan lessons that enable learners to apply knowledge in real-life situations
using SVG. Use this section to express the intermediate lesson goals that draw upon
previous plans and activities and set the stage by preparing students for future
activities and further knowledge acquisition.
This section centres only on what learners will do to acquire further knowledge and
skills in theoretical probability using SVG. The objectives and aims of daily planning
are vital for the daily lesson and are drawn from the broader aims of the unit plan, but
are achieved over a well-defined time. The aim/objectives show what learners will be
expected to know during the lesson and under what conditions this lesson will take
place. It also emphasises under what degree or criterion based on SVG the lesson will
satisfactorily help in the attainment of the objectives. It also helps the learners to
understand the objectives of theoretical probability that they have learned and
understood by the end of a lesson.
Material
This section helps educators to determine how much time is required to teach
theoretical probability using SVG. It also acts as a support tool for all educators to use,
since teaching without material can prove difficult. This section considers the fact that
this study will use a vegetable garden for the learning and teaching of theoretical
probability. This section should mention material that will be used in carrying out a
lesson such as books, equipment, soil, fertilizers, seeds and resources. They will need
to be ready at the beginning of a lesson.
Common core stands
This section is optional in terms of requirements, but useful in considering the
readiness state of learners for the lesson activities. It allows teachers, replicating the

69
lesson plan, to factor in necessary preparation of activities that teachers want to deliver
to learners, looking at the quality needed to meet lesson objectives.
Motivation
This stage of a lesson plan is critical, because educators should elaborate on how
they will motivate or stimulate learners’ interest in theoretical probability. It may involve
asking learners provoking question about the basics of theoretical probability and the
development of a vegetable garden. The provoking questions are questions such as:
‘Did you know we can measure any tree on the playground without climbing it?’ It is
important that each lesson includes some method to stimulate the learners’ interests.
The kind of motivation that we care about involves sustained effort, not just temporary
excitement. Getting learners interested or enthusiastic about teaching and learning of
theoretical probability using SVG is a good start, but motivation to learn entails a
sustained commitment to developing scientific knowledge and using it to make sense
of the material world (Brophy, 1998: 66).
Approach Number 2: To conduct assessment
According to Ruth Sutton, assessment is a vital tool used to measure subjects. It is
inevitable for human processes to be judged on what they have acquired (Sutton,
1994: 2). In this sense, assessment is a form of communication between learners and
educators to measure competence in the theoretical probability, one in which learners
communicate their knowledge and skills learned using SVG. In schools, the most
visible tool is assessments, which ensure standards on the way to progress to the next
grade. Assessment provides assurance to the department of providing quality
education.
Assessment of children in learning and progress is central to effective teaching and
learning. A report on assessment and testing, cited by Sutton, categorically states:
“Promoting children’s learning is a principal aim of schools. Assessment lies at the heart of
this process. It can provide a framework in which educational objectives may be set, and
pupils’ progress charted and expressed. It can yield a basis for planning the next
educational steps in response to children’s needs. By facilitating dialogue between
teachers, it can enhance professional skills and help the school as a whole to strengthen
learning across the curriculum and throughout its age range.”
70
Teaching and learning of theoretical probability using the SVG will need assessment,
in the form of tests and exams, which is so much a part of our experience of schools
and learning that it seems natural. The tests or exams serve as ways to measure if
learners had an understanding of theoretical probability using the SVG. The test will
consist of real life situational questions that will require an understanding and ability of
learners to relate their knowledge to nature.
The formative assessment in the classroom refers to frequent interactive assessment
of learners’ progress in theoretical probability understanding and to indicate the
learning need to ensure that teachers can adjust the teaching of mathematical
probability. The use of differentiation and adaptation can be a technique used by
mathematical teachers to classify learners. The use of formative assessment can be
used to raise the levels of learners’ learning in mathematical probability to achieve
greater equity of outcomes. The use of formative assessment can be used by the
Department of Education to hold the schools accountable according to the result of
learners (Monsen, 2002; Simmons, 2002; Lander and Ekholm, 1998).
Approach number 3: Error analysis of results
The approach is commonly used in many schools. However, in this study, it helps us
to identify the cause of the errors learners consistently commit in mathematical
probability. With the use of error analysis, most learners cannot answer questions that
require application skills. The purpose of error analysis is to evaluate learners’ work in
theoretical probability and to look at patterns of mistakes they make, which can be
factual, procedural and conceptual (Riccomini, 2005). The procedural mistakes
learners often make occur when they did not follow the correct steps when solving
theoretical probability. The factual errors occur when learners cannot recall the basic
facts of theoretical probability, like when experimental probabilities and the sample
technique of probability should be applied (Ginsburg, 1987). When learners do not
fully understand the concept of theoretical probability, such as when to do
experimental probability, it is referred to as conceptual errors. This approach requires
educator with conceptual and analytical skills to detect such errors and come up with
strategies that can help learners to avoid such errors. These study-realised errors are
made by learners. Therefore, the use of SVG is relevant to this study, as it requires
learners to have application skills and will enable learners to have an understanding
71
of procedural, conceptual and factual errors (Hudson & Miller, 2006). The use of SVG
is one of the important teaching aids that educators can use when teaching theoretical
probability to show learners the procedural, conceptual and factual requirements. The
theoretical can be demonstrated while instilling a sense of the probability of application
in real-life situations.
How to identify error analysis in theoretical probability
Give learners assessments (tests, projects and examinations) in mathematical
probability.
1. Collect a sample of learners’ work under a unit of theoretical probability and
identify their misconceptions (e.g. experimental probability, heads and tails and
practical questions).
2. Record all learner responses in written format.
3. The educator should apply analytical skills based on learner responses and
evaluate their common mistakes in theoretical probability.
4. Describe the patterns of mistakes learners made if they are procedural,
conceptual and factual, e.g. if learners did not show an understanding that in
experimental probability, like in the tossing of a coin, there are two chances that
it might yield. It might be that learners lack a concept of probability.
5. The educators, once they have identified common mistakes, can begin to
implement remedial strategies to address such mistakes, e.g. the use of
teaching theoretical probability using SVG, correction of assessment with
learners to take them through their errors by showing them how can they best
avoid them (Howell, Fox, & Morehead, 1993: 33).
The table below provides examples with a description of the error pattern and possible
causes for each errors in theoretical probability (Lecoutre, 1992: 35).
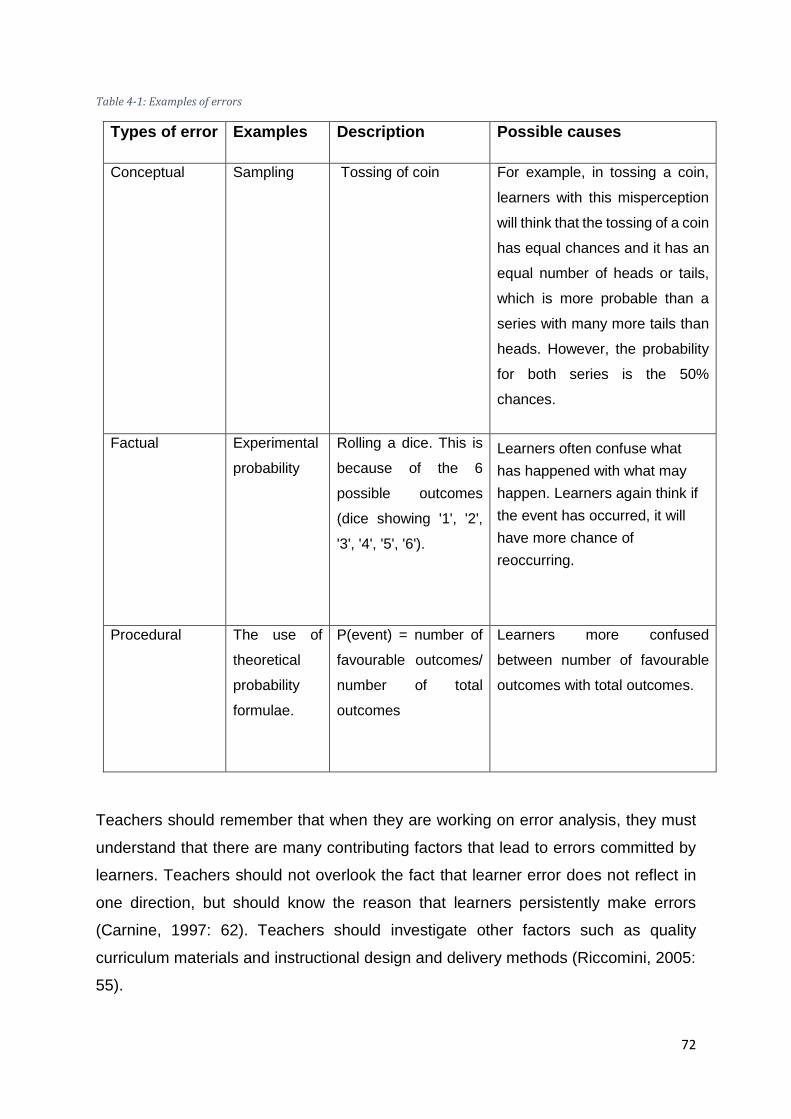
72
Table 4-1: Examples of errors
Types of error Examples Description Possible causes
Conceptual
Sampling Tossing of coin For example, in tossing a coin,
learners with this misperception
will think that the tossing of a coin
has equal chances and it has an
equal number of heads or tails,
which is more probable than a
series with many more tails than
heads. However, the probability
for both series is the 50%
chances.
Factual Experimental
probability
Rolling a dice. This is
because of the 6
possible outcomes
(dice showing '1', '2',
'3', '4', '5', '6').
Learners often confuse what
has happened with what may
happen. Learners again think if
the event has occurred, it will
have more chance of
reoccurring.
Procedural The use of
theoretical
probability
formulae.
P(event) = number of
favourable outcomes/
number of total
outcomes
Learners more confused
between number of favourable
outcomes with total outcomes.
Teachers should remember that when they are working on error analysis, they must
understand that there are many contributing factors that lead to errors committed by
learners. Teachers should not overlook the fact that learner error does not reflect in
one direction, but should know the reason that learners persistently make errors
(Carnine, 1997: 62). Teachers should investigate other factors such as quality
curriculum materials and instructional design and delivery methods (Riccomini, 2005:
55).
73
4.6 DATA ANALYSIS
The use of critical discourse analysis (CDA) in this study is of the utmost importance,
as it will help the study to analyse the words and spoken words. This analysis will give
a deeper understanding once we reflect on data that was collected and to have an
idea of pressing social issues (Dressman, 2008: 9). Furthermore, we opted for critical
discourse, because CDA requires a relationship between properties of text and verbal
interaction, which play a role in modes of power relation issues, justice, economy,
race, class, gender, religion, education and sexual orientation, as well as concealment
of dominance (Mirzaee & Hamidi, 2012: 183). The CDA understands that people use
subject texts to have a sense of the environment they live in and which can permit
them to construct their own knowledge on social action, using texts on a daily basis to
allow people to develop their own version of meaning (Shopen, 2013: 221; Paltridge,
2006: 10). Teaching and learning policies and curriculum of mathematics can be better
understood by looking at the social issues of the community, as well as the language
and type of texts used (Van Dijk, 2011: 93; Govender & Muthukrishna, 2012: 29).
4.4.1 Theoretical origin of critical discourse
In this section, we first provide an origin of critical discourse analysis (CDA), where it
all began. In mid-1960 and 1970, Teun Van Dijk exposed us to related issues, which
started to emerge in people and social action on a daily basis. Van Dijk (1970)
mentions that, irrespective of different backgrounds, the use of text and speaking
influence how people construct knowledge. After such a realisation, conversion
analysis and discourse studies all deal with how text and spoken words require
analysis to have understanding of how people interpret things on a social level (Van
Dijk, 2007: 4; Wodak, 2008: 77).
The co-researchers will have an understanding of the objectives of the study, which
aims at teaching theoretical probability using SVG. The terms Critical Linguistics (CL)
and Critical Discourse Analysis (CDA) are often used interchangeably. The use of CL
is equally important in this study, because it brings an understanding of social reality
and its analysis aims at uncovering the role of language in constructing social
knowledge and examine relationship in the social world (Fairclough, 1989; Fowler,
1987).

74
The purpose behind adopting CDA in this study is because it tolerates the way people
use language, which again emphasises that there are no masters of correct teaching
in a social setting. Therefore, the aim of CDA relates to the perception of our theoretical
framework (social realist theory), which is more concerned with the use of power
relations and gender issues during communication processes. Furthermore, the
appropriateness of CDA is clear when it focuses on relations between ways of talking
and ways of thinking in written text, which can improve the use of SVG to teach
theoretical probability.
4.4.2 Textual analysis
Van Dijk (1980: 9) mentioned that text analysis is of the utmost importance on a social
level. The study believes that the use of text in written words or spoken words on
theoretical probability and the way it was perceived can change co-researchers’ way
of thinking once the use of SVG is applied. The study aims at teaching theoretical
probability using SVG, which is intended to enable learners to apply knowledge in real-
life situations. When the study generates data, co-researchers need to identify themes
which are about identifying meaningful categories which adequately reflect on text and
spoken words, which were used when creating strategies to improve the teaching and
learning of theoretical probability using SVG (Fulcher, 2010: 6). In textual analysis,
Barnnet (2006: 109) mentioned that analysis of text and spoken words is mainly used
in channels of communication, which require cooperation and coherence. For the co-
researcher, to understand and interpret the meanings of text or spoken words in
theoretical probability like sampling and experimental probability using SVG, they must
be placed within the context under which text is rendered (Okot, 2007: 7).
Teaching theoretical probability using SVG as a model uses all resources of teaching
or individual support which aim at creating positive teamwork among co-researchers
and their input on spoken words to use SVG as a model to demonstrate theoretical
probability, which can be realised during their feedback or reflection. I shall refer to the
‘author’ of a text as co-researcher in this study, as they are responsible for putting
ideas forward when developing the SVG as a model. Furthermore, this study profiled
co-researchers based on SWOT analysis, which will guide the study during the
process of generating data. The co-researchers were tasked based on principles of
75
PAR, given that they are from different disciplines. Textual descriptions and analysis
should not be seen as prior to and independent, since it can influence the contribution
of co-researchers because of power relations. Textual analysis should be considered
a tool which can open processes, which can be enhanced through dialogue across
disciplines when developing SVG as a model to teach theoretical probability.
4.4.3 Social analysis
The structural arrangement and societal behaviour is examined by social analysis,
which guides the study when co-researchers give their inputs on the teaching and
learning of theoretical probability. These structures of society give an expression of
attitude, values and co-researcher behaviour (Sheyholislami, 2011: 4). The study
analysed these social structures to establish their impact or influence on teaching and
learning of theoretical probability using SVG, which will demonstrate the connection of
co-researchers and the objectives of these studies. The social structure is interested
in and focused on co-researcher’s backgrounds and how they relate to the objectives
of this study. The physical location of co-researchers and the DoE are structures that
have an influence on the school environment and thus the connection between all
societal structures have an impact on developing the SVG (Van Dijk, 2008: 9).
4.4.4 Discursive practice
The rules, norms and the specific social behaviour of the co-researchers are examined
by the discursive practice through interpreting the message when developing SVG.
The co-researchers will give their input, which is constituted by rules which govern
how individuals think or act and speak in all the social positions they occupy in their
focus group discussion to develop the SVG (Hinson, 1977: 65). The discursive practice
gives an individual identity and a recognisable position within the group. In this study,
all co-researchers are recognised and given a role to play based on principles of PAR
(Gee, 1990: 4). The profiling in Section 5.1 of participants in this study is done to show
a clear understanding that all participants’ positions and their input are recognised
when developing the SVG as a model to teach theoretical probability.
76
Finally, an understanding of the social context in this study opens a distinct setting in
which discourse occurs during the development of the SVG and the classroom, with a
set of conventions that will determine how best to implement the SVG to teach
theoretical probability (Huckin, 1997: 4). The critical approach to discourse is taken,
as it might be expected that its analysis of text is at a micro level. However, within the
underlying power structure, spoken words or text analysis is at a macro level and,
through discursive practice, which text was drawn at the meso level.
These are three approaches used in discursive practice to show how analysis of text
and spoken words is analysed (Thompson, 2002: 87). In another way, a text, a
description of methods of using SVG to teach mathematics, is happening in a larger
social context. The issues of power relation to include SVG in a curriculum can play a
crucial role. However, an interpretation and being acted upon by learners depends on
their rules and norms of socially acceptable behaviour, which govern how learners can
best understand the link between SVG and theoretical probability.
4.5 SUMMARY OF CHAPTER
This chapter showed the importance of PAR as a tool which is used as methodology
in this study. The principle of PAR guided the study throughout to ensure that no one
feels lesser in this study. The study design elaborated more to give context to
generated data, which will be closely analysed in the following chapter.
77
CHAPTER 5 : ANALYSIS AND INTERPRETATION OF DATA,
PRESENTATION AND DISCUSSION OF FINDINGS
5.1 INTRODUCTION
The study intends to design a teaching aid to improve the teaching and learning of
theoretical probability using a school vegetable garden (SVG). The study focuses on
theoretical probability, because probability plays a huge daily role. The aim is to teach
theoretical probability using the SVG to ensure that learners can apply probability in
every event of their lives. The study focuses on theoretical probability in Grade 9, as
it is the foundation of further education and training (FET). It is important to deal with
the basics of theoretical probability using a teaching aid such as the SVG to
demonstrate the relationship between nature and mathematics in a real-life situation.
The study demonstrates the challenges experienced by learners and teachers in
theoretical probability through discussions and analysis of data. The interpretation of
spoken words will be analysed for each of the five objectives of the study. This is done
with a view towards learners being able to apply theoretical probability in all events of
their daily lives.
The study will formulate solutions and strategies that can be implemented during the
process of learning and teaching. However, the study is fully aware that all these
strategies may pose threats which may impede success in establishing the SVG as a
model. The five objectives will give this chapter shape regarding how we should go
about analysing and interpreting data. Finally, the deeper meaning of the texts is
analysed using CDA at three levels, namely text, discursive practice and social
structure, in line with the social realist theory.
5.2 THE NEED TO DESIGN SVG AS A TEACHING AID TO TEACH THEORETICAL
PROBABILITY
The study involves three (3) educators from different fields, 10 mathematics learners,
members of the SGB and myself. The team of co-researchers identified challenges
which might pose negative feedback for the success of developing an SVG to teach
78
mathematical probability (see paragraph 2.2.1). The main objective of a team is to
ensure that their inputs during the process are used to realise the objectives of the
study, as teachers using the experience to solve problems by coming up with possible
solutions. The team initiated meetings in order to maintain the progress of the study
by ensuring that identified challenges are well attended to. The team then outlined the
challenges which can affect the objectives of a study. These challenges are: 1.
learning of theoretical probability; 2. Allocation of time; and 3. Lack of strategic
planning for the use of SVG in mathematical probability.
5.2.1 Learning and Teaching of Theoretical Probability
The effectiveness of the teaching and learning of theoretical probability is done by
availing enough material or resources to deliver mathematical probability. The
teaching of theoretical probability remains a challenge to both teachers and learners,
because mathematical statistics and probability were introduced late in the current
curriculum (Konold, 2000: 139). Teachers who were majoring in mathematics didn’t
do mathematical statistics and probability, because it was not part of the current
curriculum. As a result, there are not enough resources and material to teach
mathematical probability. This was evident when I had a conversation with Mr
Makheta, who is a Mathematics teacher for Grade 8 and 9 (senior phase) and also
part of this study as co-researcher. Mr Makheta mentioned that there is a vast need
for material and resources such as teaching aids and a lot of examples in the current
curriculum of Mathematics for Grade 8 and 9.
Ntate! ke mathata fela, ke ne ke ipotsa hore e kaba re ka etsa jwang ho fumana thuso
ka bana ba rona. (Sir! Everything is troublesome, I was wondering how I can assist
our learners.)
The phrase ‘ke ipotsa’, which translates to ‘I was wondering’, when read in context of
the statement above, suggests that Mr Makheta had been thinking about finding ways
to help the Grade 8 and 9 learners in Mathematics (Van Dijk, 1970: 45). The fact that
Mr Makheta was wondering this implies that he tried to help the Grade 8 and 9
learners, but it means the challenges are still there in theoretical probability. Mr
Makheta in this regard talks about helping other learners together with other teachers
in all phases they have in their school. The narrative above suggests that he cannot
79
do it alone by saying ‘our teachers’. This suggests that there were other Mathematics
teachers who were not teaching Grade 8 and 9 Mathematics. The kind of help that Mr
Makheta provided to the Grade 8 and 9 Mathematics learners did not include making
enough resources and material, such as teaching aids, available, creating an
understanding of theoretical probabilities. This became evident during a meeting when
I asked about what was working for teachers at that moment. I asked the team:
‘What do you currently use to teach theoretical probability?’
Mrs Khatiti, who taught mathematics at the same school as Mr Makheta, responded:
Ntate … rona re ntse re sebedisetsa buka fela (Sir, what is really happening is that we
only use textbooks.)
The above narrative explains that educators had not been taking efforts to go to trouble
for their learners by depending only on textbooks to explain theoretical probability. For
instance, the phrase ‘we only use textbooks’ suggests that teachers did not put more
efforts in or they do not have enough resources to teach theoretical probability.
Furthermore, the use of the phrase ‘rona’, which, in the context of this study, means
‘us’, seems to suggest that their school had only been using textbooks and they didn’t
think of other methods that can be applied to the teaching of theoretical probability. It
also implies that whatever they had been using did not really work, as they did not
have enough material or resources to teach mathematical probability.
This could also be understood as meaning that the current methods of depending only
on textbooks was not effective for learners. This supports the view of Hargreaves and
Fullan (2004: 53) that putting more effort in is self-development in your working
environment when implementing extra strategies to teach theoretical probability, such
as teaching aids. However, it seems that the teachers were not equipped with enough
material, or even sharing their challenges regarding the teaching and learning of
mathematics probability. This became clearer when Mrs Khatiti mentioned the
importance of suggesting that extra teaching aids will help learners and teachers. She
said:
Retlo bona thuso ntate, ka ho qala re sebetsa ka thata ho fumana me futa e mengwe
ya ruta bana ba rona (We will find help, sir, by working hard to ensure that we find new
methods to teach our learners.)
80
The phrase, ‘retlo bona thuso’ in the statement above refers to the study. Therefore,
prior to the study, teachers had not been using other methods. This was also evident
when Mrs Khatiti used the phrase ‘we find new methods’, which suggests that she
believed the study will show them other ways to teach theoretical probability, which
had been lacking (Rahikainen & Lehtinen, 2001: 16). Failure to implement other
methods or providing enough resources to improve the teaching and learning of
theoretical probability actually delays the process of enabling learners to understand
theoretical probability at a different spectrum. This was confirmed by Mr Makheta in
the same meeting, by saying:
Ntho ena ya ho sebedisa buka fela la bona hae sebetse, e fapane le ntho ena ya ho
sebedisa mefuta e mengwe ya ruta dipalo. (This thing of using only textbooks, it
doesn’t work, it is totally different from this one of using other methods to teach
mathematics.)
From above extract, ‘ntho ena ya ho sebedisa buka fela hae sebetse’, which translates
to ‘this thing of using only textbooks is not working’, implies that they have been using
textbooks as the only methods of teaching theoretical probability. This shows that prior
to the study, it is clear that teachers had been limiting themselves regarding expanding
their content knowledge by using one method of teaching theoretical probability. This
was evident when Mr Makheta said ‘using other methods to teach mathematics’, which
I understand as a reference to the kind of help that he provided, which was to teach
learners only using textbooks. However, Mr Makheta, by mentioning ‘other methods’,
shows that he understands the importance of using other methods to expand content
knowledge of teachers and learners to achieve the result of teaching theoretical
probability effectively. These ‘other methods’ is in support of the best practices which
can be used to teach mathematical probability to ensure learners can apply probability
in real-life situations.
Furthermore, this is connected to the views of Smith (2013: 219), who informs us about
teacher education using practical pedagogies to integrate tangible resources
meaningfully into teaching. According to Smith’s study, integrating learning could
occur when teachers connect theory and practical work to bring about an
understanding of how learners can relate to real-life situations. Failure to integrate
learning denies learners the opportunity to relate theory to practical work. This can be
done by means of other methods or by availing enough material to bring meaningful
81
integration learning into Mathematics (Choi & Lee, 2008: 31). This was evident when
Mrs Khatiti concludes, after teachers had shared their challenges during the meeting,
to establish ways on how they can provide help by means of practical methods to
teach mathematics: ‘Our challenges are the same.’
The team had to come to an agreement on how their challenges can be addressed
due to a lack of material or enough resources to teach mathematics, in particular
theoretical probability as a topic (see Section 4.2.1). I then decided to join the meeting
to support the team and the challenges were highlighted to me which were facing the
team in their teaching of theoretical probability. As co-researcher during the visit, I then
had an opportunity to make my own observation. I saw teachers were using the same
methods to teach theoretical probability, which I feel limited them in terms of exploring
other examples to teach theoretical probability. These visits gave me the opportunity
to observe different teaching methods being used by the team members, who used
only examples in textbooks. The observations I made at this time was that failure to
apply other methods to teach theoretical probability will make it difficult for learners to
apply knowledge to real-life situations. As a result, it will also limit the pedagogical
content of teachers in teaching theoretical probability (PCK).
5.2.2 Allocation of Time to Use the SVG as Teaching Aid
During the intervention process at the school, we observed that in the school as a
whole, the allocation of time to allow educators to use teaching aids such as the school
vegetable garden (SVG) remains a challenge. There were some signs of the use of
teaching aids, such as chats and the SVG. The SVG was mainly used to feed learners
around the school and it was not used for education.
There were also individual attempts to use SVG to teach other subjects like English,
but allocating time as an educator was the biggest challenge. However, none of these
initiatives, such as using the SVG to teach mathematical probability, were coordinated,
which suggests a lack of teamwork. The actions of the coordinating team served as
an inspiration to educators to acquire the knowledge, skills, and strategies to manage
time effectively (McDuffie, Mastropieri & Scruggs, 2009). The necessity to manage
time to accommodate teaching aids such as the SVG was to ensure that the objective
of the study is realised. However, educators feel like implementing such strategies in
82
the past used to make them fall behind in their work, as they have to move in
accordance with the curriculum (see 2.4.1.2) The education council of South Africa
designed time allocation per subject per week and Mathematics is allocated eight (8)
hours per week (elrc, 2000: 66). It is important for educators to allocate time
strategically to ensure that they do not fall behind with the syllabus (Liu et al., 2009).
This was clear when Mr Mabaso, who is a Mathematics teacher in Grade 12, said:
Ntate, matichere a mangata a lekile ho sebedisa thuto ea ho ruta ka hore nako e nyane.
(Sir, a lot of educators tried to use teaching aids, but the time is not enough.)
The above phrase, analysed on a textual basis and the spoken words ‘re lekile’, which
means ‘we tried’, shows that the concept of utilising the SVG to teach Mathematics
and not only to feed the learners, had been contemplated. However, time allocation
has been a challenge. The allocated time to keep up with the curriculum is a problem,
as it requires them to move out of a classroom, which takes time, to develop a garden
and to use it for teaching and learning. Mr Mabaso indicated that school garden was
meant to feed learners who were in need of food.
Due to the fact that educators used the school garden as a source of food to give back
to the less fortunate, the statement will be analysed from a social perspective. The
statement made by Mr Mabaso was analysed from a social perspective which was
aimed at three aspects. The first aspect he raises was equal treatment of people at
the school, particularly regarding access to the vegetable garden. Mr Mabaso’s
second aspect was to ensure that all learners who are less fortunate have access to
quality vegetables. The government policy document requires that learners should not
be absent from school because of a lack of food. Hence, feeding schemes were
introduced to ensure that all learners have access to food (DoE, 2011:7). The third
aspect Mr Mabaso raises is that the school is providing back to the community. As a
school, they do not concentrate only on the curriculum, but on giving back to people.
However, teachers and the community are also consciously aware that teamwork is
crucial for collective survival (Kemmis, 2013:5). The team understands that the study
takes action to solicit support for a revolutionary action by reflecting on the results of
Mathematics in Grade 9 learners’ teamwork. Kemmis (2010:11) describes the
changing of practices for personal development and collective gains as self-reflection.
83
5.2.3 Lack of Strategic Planning for the use of SVG in Mathematical Probability
The designed co-researchers were able to meet to prepare for strategies to link SVG
with mathematical probability. The team combined ideas and designed activities that
would enable them to achieve the objective of the study. This is in agreement with the
CAPS document, which encourages integration learning across all fields or by means
of a tangible structure to enable the SVG to take place (DoE, 2007). The use of the
SVG in mathematics is in the directive principles of the CAPS document, which
encourages integration learning across all fields of subjects. Furthermore, in the
framework of the study (SRT), one of its principles is to enhance teaching and learning.
This strategic plan enables the co-researcher to determine the actions that are needed
to enhance the link between the SVG and mathematical probability. The co-
researchers mentioned that the school has a vegetable garden, but a link to the
curriculum does not exist in their schools.
The following extracts indicate that strategic planning using SVG is not a reality at the
school:
Mr Nkhetia is the Agricultural Science educator. He is a co-researcher in this study. Mr
Nkhetia mentioned that it is quite a shock that we don’t realise the importance of SVGs.
We are always in the dark as a school. He thought strategic plans are meant only for
big companies and as a school we always depend on the Department of Education.
The above extract indicates that the school had not undertaken strategic planning
before to teach mathematics. According to the analysis from a textual discourse, when
Mr Nkhetia said ‘shock’, it means that Mr Nkhetia and the other co-researchers learnt
about strategic planning for mathematics during their engagement as a team. The
emphasis on ‘we depend on the Department of Education for plans in Mathematics’
confirms on a textual basis that the school lacks strategic planning and shows signs
of very little communication at the school. The idea of introducing strategic plans to
link mathematical probability with the SVG, when it is analysed according to discursive
analysis, indicates that the phrase shows there has never been strategic plans at the
school. However, on the basis of discursive analysis, it suggests there is a need of
competency in teaching and learning of theoretical probability using SVG. The phrase
above shows that it takes a great team to understand and to bring to light to the
importance of integration learning.
84
5.3 AN ANALYSIS OF STRATEGIC PLANNING TO OVERCOME CHALLENGES
FACED BY THE USE OF SVG
This section explores strategies as a solution to challenges that were experienced by
the study to teach theoretical probability using the SVG (see Section 4.2). These
solutions are aligned with components of the study to demonstrate the possibility of
using the SVG as a teaching aid in mathematical probability. Hence, the study is a
response to how learners can learn theoretical probability with the use of the SVG.
This section also shows the importance of allocating time for the use of SVG and
responding to the challenges of the study that were demonstrated through the use in
Section 4.2.
5.3.1 Lesson Facilitation With the Aid of SVG to Teach Theoretical Probability
The teaching of theoretical probability using SVG instils a sense of good relations
between learners and educators. This involves social interaction, which brings
community, learners and educators together to achieve a common goal. The
framework of the study (SRT), which encourages a classless society, is in agreement
with the idea of working together. The current curriculum of South Africa, the CAPS
document (DoE, 2012; 5), understands the importance of social interaction between
learners and the community, as well as educators. The social interaction between
them will ultimately allow learners and educators to interact through talking and
demonstration. The use of the SVG to teach theoretical probability should ensure that
it allows interaction between learners and educators during the teaching of theoretical
probability. During the lesson facilitation, learners work individually on a vegetable
garden to search for a link between SVG and theoretical probability. While monitoring
the learners, the educators should address the challenges faced by them. It is
significant that learners should also feel free to engage each other on areas they do
not understand and to share ideas about probability.
5.3.1.1 Experiments in probability
Experimental probability is defined as the process of events were the outcomes are
unpredictable (Gal & Wagner, 1992: 5). Mr Mabaso facilitated a lesson on
85
experimental probability, showing the likelihood and unlikelihood of an event. The
other coordinating team members observed the lesson facilitation and were required
to take notes on specific items for purposes of post-lesson reflection. The facilitator
during lesson ensured that he linked the learners’ prior knowledge with what he wants
to demonstrate, e.g. relative frequency and sample technique. Mr Mabaso, at the
beginning of the class, emphasised the importance of interacting with each other as
learners to understand mathematical probability. Mr Mabaso said this in the class and
we agreed, as a class, that it is a must that everyone in a class should understand the
mathematical probability concept and be able to see the relation with SVG. The above
phrase ‘we’ shows social interaction processes taking place amongst the learners and
teacher. The fact that there was an emphasis on ensuring that learners understand
probability concepts really shows that the level of determination by the educator is
satisfying.
It is evident from the extract above that there were instances where, during the lesson
facilitation, learners supported each other by forming groups which allowed varied
questions from learners. This is in line with the best practice on learner-centred
methods, namely that learning takes place when learners are able to interact with one
other in pursuit of making meaning of an experimental probability to link it with SVG
(Schweisfurth, 2015: 259). Moreover, the attitude of the educator was tolerant towards
learners of different cognitive levels, which can help a lot of learners to better
understand probability concepts. What the educator demonstrated during lesson
facilitation confirms the importance of using learner-centred methods encouraging
social constructivism of knowledge. This social interaction permitted by the educators
is the result of multiple efforts by each learner during the lesson (Leannas, 2014).
Mr Mabaso presented a lesson on experimental probability, he said:
Bana hare etseng dihlopha pele re qala ka dithuto tsa. (Learners, let us form groups
before we start with the topic of experimental probability.)
By encouraging learners to form groups on contextual analysis, it indicates that Mr
Mabaso encouraged learners to work as team. This shows a sense of social
interaction. Learners will work together regardless of their cognitive level. Thus, as a
result, learners who struggle to understand the topic will be able to explain to each
other after Mr Mabaso’s presentation. By saying ‘hare etseng’, which means ‘let us’,
86
Mr Mabaso shows that he includes himself in the lesson. To the learners, this means
that the teacher is part of them. As a result, this shows that learners will feel free to
engage with the educator at any time when they struggle to understand certain aspects
of experimental probability.
Mr Mabaso demonstrated the lesson by first explaining what experimental probability
is. To learners, experimental probability is the probability of the chances that their
outcome is not yet known. Mr Mabaso showed the class one example of the
experimental probability of rolling dice. Mr Mabaso then said that before rolling a die,
you do not know the result. This is an example of an experimental probability. An
experimental probability is a process by which we observe something uncertain. After
the experiment, the result of the experimental probability is known. An outcome is the
result of an experimental probability.
The set of all possible outcomes is called the sample space. Thus, in the context of an
experimental probability, the sample space is our universal set. Here are some
examples of experimental probability and their sample spaces: Experimental
probability: toss a coin; sample space: S= {heads, tails} S= {heads, tails}, or as we
usually write it, {𝐻, 𝑇} {𝐻, 𝑇}. Experimental probability: roll a die; sample space: 𝑆 =
{1,2,3,4,5,6}𝑆 = {1,2,3,4,5,6}. Then Mr Mabaso asked the learners to observe the
number of vegetables sold by the school to the community at random in a 2016 sample
space:
𝑆 = {0,1,2,3, ⋯ }𝑆 = {0,1,2,3, ⋯ }.
Mr Mabaso showed the coordinating team the possibility of linking the SVG with
experimental probability using sample material to place a vegetable garden as 𝑆 =
{0,1,2,3, ⋯ }, as it indicates the number of plots to which vegetables are allocated. After
the presentation by Mr Mabaso, learners can see the relation between experimental
probability and the SVG. The teacher extended the thinking capacity of learners by
bringing real-life situations into the classroom. The lesson was interesting to learners
to such an extent that a learner asked the educator for more examples.
The learner Omolemo said:
Sir, ke kopa o etse mo futa o mongwe hore re kgone ho bona tsela tse dingwe tsa ho
araba.
87
(Sir, can you please do another example so that we can know other ways to do
experimental probability.)
The fact that learners were able to ask the educator questions during the lesson means
that learners are not afraid to approach the educator if they feel they are not sure about
certain aspects of probability. Then Mr Mabaso replied: Class, let us look at another
example like Omolemo asked. Let us toss a coin three times and observe the
sequence of heads/tails. The sample space here may be defined as first set and
second set:
𝑆 = {(𝐻, 𝐻, 𝐻), (𝐻, 𝐻, 𝑇), (𝐻, 𝑇, 𝐻), (𝑇, 𝐻, 𝐻), (𝐻, 𝑇, 𝑇), (𝑇, 𝐻, 𝑇), (𝑇, 𝑇, 𝐻), (𝑇, 𝑇, 𝑇)}.
𝑆 = {(𝐻, 𝐻, 𝐻), (𝐻, 𝐻, 𝑇), (𝐻, 𝑇, 𝐻), (𝑇, 𝐻, 𝐻), (𝐻, 𝑇, 𝑇), (𝑇, 𝐻, 𝑇), (𝑇, 𝑇, 𝐻), (𝑇, 𝑇, 𝑇)}.
The goal is to assign probability to certain events. For example, learners, suppose that
we would like to know the probability that the outcome of rolling a fair die is an even
number. In this case, learners, the event presented as the set 𝑆 = {2, 4, 6} 𝑆 = {2,4,6}.
If the result of our experimental probability belongs to the set S, we say that the event
S has occurred. Thus, an event is a collection of possible outcomes. In other words,
an event is a subset of the sample space to which we assign a probability. Although
we have not yet discussed how to find the probability of an event, you might be able
to guess that the probability of {2, 4, 6} {2, 4, 6} is 50/50 percent (Batanero, 2013:
405).
Learner Omolemo then said:
Ka leboga ntate, ka thuso ya hao, jwale nka thusa bana bangwe (Thank you, sir, for
your assistance. I can now assist other learners.)
In the above extract, ‘thank you, sir’ shows the learners’ sense of appreciation for the
educator, which can encourage the educator to do more of the good work. The learner,
in the above extract, then said ‘I can now assist’ on a contextual analysis, which means
that the learner is aware he is part of the team. This confirms that the team members
consider it important to know what they want to achieve. This opinion was
strengthened by the word ‘assist’, which describes the manner in which the team is
united and the learner understands the importance of working as a team.
88
5.4 THE COMPONENTS OF TEACHING AND LEARNING OF THEORETICAL
PROBABILITY
Mathematical probability requires an understanding of the importance of pedagogical,
curricular and content knowledge for educators and learners. The significance of
considering this teacher component is that we understand that teacher content
knowledge should cater for all learners at their respective cognitive levels. This is done
simply because quality education is prioritised to produce quality results. The
challenges that are faced by learners and teachers can be evaluated through SWOT
analysis to assess the strengths, weaknesses, opportunities and threats in the scope
of mathematical probability (Razzaq, 2013: 78). In this section, SWOT analysis will
be used as a gathering tool concentrating on the ability of co-researchers and
competence. The gathered information will be pulled from the literature looking at the
skills and knowledge that teachers and learners need to improve their ability to bring
a sense of theoretical probability. This section presents the SWOT analysis organised
under the subtitles CK, PCK and CUK.
5.4.1 Content Knowledge
CK as subject matter refers to knowledge of facts, theories and ideas of a particular
subject. Lee Shulman’s PCK describes CK as ‘accepted truths’ within a particular
discipline (Shulman, 1986: 8). Teachers’ content knowledge in theoretical probability
should be presented according to different techniques/aids, so that they can
demonstrate the ability to deliver mathematical probability to learners. The ability of an
educator to assess learners from various perspectives, such as self-report questions
(both post-test and pre-test), will improve the CK level of teachers (Borovcnik & Peard,
1996: 43). This idea is to ensure that the educator knows the area of focus, which, as
a result, will enable them to teach theoretical probability strategically.
Mathematical probability has general questions such as ‘average’ and ‘sample’, which
can be used to check learners’ understanding of theoretical probability (Watson,
1994). Therefore, in order to operate optimally as a team in formulating a strategy to
teach theoretical probability using SVG, it was clear during our coordinating team that
one of the co-researchers has a deeper understanding of theoretical probability. Mr
Makheta was confident to say that he can demonstrate theoretical probability content
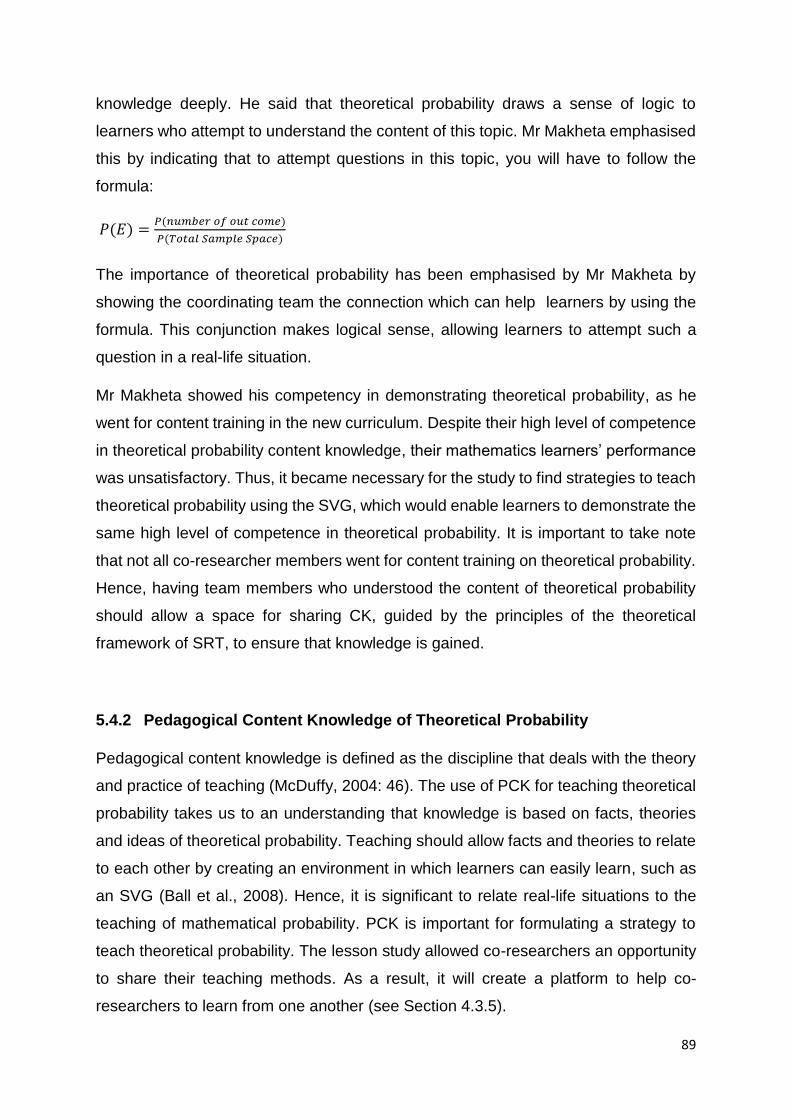
89
knowledge deeply. He said that theoretical probability draws a sense of logic to
learners who attempt to understand the content of this topic. Mr Makheta emphasised
this by indicating that to attempt questions in this topic, you will have to follow the
formula:
𝑃(𝐸) =𝑃(𝑛𝑢𝑚𝑏𝑒𝑟 𝑜𝑓 𝑜𝑢𝑡 𝑐𝑜𝑚𝑒)
𝑃(𝑇𝑜𝑡𝑎𝑙 𝑆𝑎𝑚𝑝𝑙𝑒 𝑆𝑝𝑎𝑐𝑒)
The importance of theoretical probability has been emphasised by Mr Makheta by
showing the coordinating team the connection which can help learners by using the
formula. This conjunction makes logical sense, allowing learners to attempt such a
question in a real-life situation.
Mr Makheta showed his competency in demonstrating theoretical probability, as he
went for content training in the new curriculum. Despite their high level of competence
in theoretical probability content knowledge, their mathematics learners’ performance
was unsatisfactory. Thus, it became necessary for the study to find strategies to teach
theoretical probability using the SVG, which would enable learners to demonstrate the
same high level of competence in theoretical probability. It is important to take note
that not all co-researcher members went for content training on theoretical probability.
Hence, having team members who understood the content of theoretical probability
should allow a space for sharing CK, guided by the principles of the theoretical
framework of SRT, to ensure that knowledge is gained.
5.4.2 Pedagogical Content Knowledge of Theoretical Probability
Pedagogical content knowledge is defined as the discipline that deals with the theory
and practice of teaching (McDuffy, 2004: 46). The use of PCK for teaching theoretical
probability takes us to an understanding that knowledge is based on facts, theories
and ideas of theoretical probability. Teaching should allow facts and theories to relate
to each other by creating an environment in which learners can easily learn, such as
an SVG (Ball et al., 2008). Hence, it is significant to relate real-life situations to the
teaching of mathematical probability. PCK is important for formulating a strategy to
teach theoretical probability. The lesson study allowed co-researchers an opportunity
to share their teaching methods. As a result, it will create a platform to help co-
researchers to learn from one another (see Section 4.3.5).
90
The teaching of theoretical probability requires content educators who are more
knowledgeable about their subjects and teach effectively and clearly (Batanero,
2013). PCK for educators in theoretical probability should be able to teach in ways
that show a relation between probability and SVG. In the structuring of lessons,
educators should be able to demonstrate basic terms such as ‘average’ or ‘sample’,
or ‘likelihood’ and ‘unlikelihood’, through the use of teaching aids such as calculators
and SVG. As an example, the educators can teach theoretical probability by
measuring the production of vegetables with the quantity of water provided in a
vegetable garden. Many educators knew how to explain the context of basic terms of
probability and how to approach questions related to ‘sample’ and ‘average’ and
‘likelihood’ and ‘unlikelihood’, but a limited description was given on how to use such
terms in real-life situations (Peard, 1996: 23).
5.4.3 Curriculum Content Knowledge
Teachers’ knowledge of theoretical probability in the curriculum is informed by what
the learner should expect to learn, which includes learning standards and learning
objectives. Curriculum knowledge emphasises the concepts educators should know,
such as the effectiveness of a self-report and preparation for lessons to improve our
pedagogical practices further by looking closely to the use of SVG to teach theoretical
probability, for instance knowing about theoretical probability, like linking the SVG with
content that is required to be covered in a curriculum such as experimental probability,
sampling and dice technique (Poehner, 2012: 610). The curriculum outlines and
elaborates on the level of competency of educators to teach theoretical probability and
how teachers should be able to apply it in real-life situations. In addition, theoretical
probability has few practical examples that are prescribed in the curriculum material.
It was of considerable concern that teachers were not making greater use of practical
examples, such as SVG. The use of SVG to teach theoretical probability will be a
success if educators do the practical demonstration when dealing with mathematical
probability. The curriculum document will serve as a pace setter for educators to be
aligned with the time set to teach mathematics. Hence, it is important that educators
acknowledge all prescription identified in the teaching of mathematical probability,
such as experimental probability. Experimental probability leads to many possible
91
outcomes. Hence, its transitions apply to the use of the SVG. It allows learners to
understand that not all events have equal likelihoods, since we cannot predict the
outcomes of vegetable gardens during the planting process because of external and
internal factors that might have an impact in the development of a vegetable garden.
This suggestion came from one of the team members who happened to have
knowledge about teaching theoretical probability using a different setting of
environment to elaborate on theoretical probability. The coordinating team suggested
that one member should demonstrate the linking of SVG with theoretical probability,
specifically experimental probability, without falling out of the curriculum scope.
Using experimental probability to teaching learners how it can relate to the use of SVG
is shown on a table below. This will improve teacher content knowledge and pedagogy
content knowledge. It was evident that working as a team during the process of using
SVG to teach mathematics probability will improve communication skills,
demonstrating an experimental probability to learners not only verbally, but also
pictorially. This was supported by Mr Mabaso, who said: Guys, ntho ena ya sebetse, o
kgona le ho bona relationship ya dijalo le experimental probability. (Guys, this thing is
working, you can see by the table relationship of vegetable garden and mathematical
probability.)
Mr Mabaso said that this notion should enable learners to know the influence of water
and climatic condition, since it can bring unpredictable results in a vegetable garden.
Learners, knowing that experimental probability has many possible outcomes, will be
able to apply this knowledge in SVG in real-life situations. Using the SVG to explain
theoretical probability as a concept will not expand only learners’ knowledge, but also
the knowledge of the team, specifically teachers. For instance, using experimental
probability shows learners that their many outcomes are unpredictable in the
production of a vegetable garden, thus bringing understanding of experimental
probability to a real-life situation. Mr Mabaso demonstrated this by using the table
below, which shows different events which indicate the numbers of chances that an
event can occur.
The below shows the relationship of events and possible outcomes.
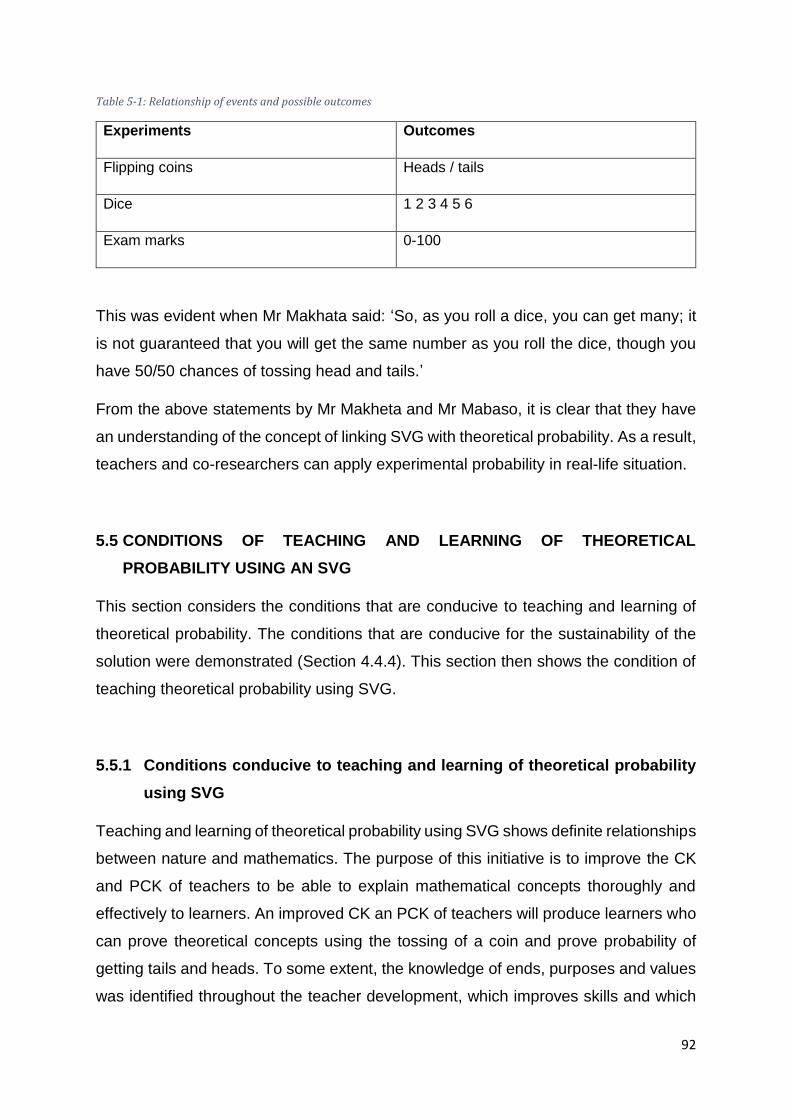
92
Table 5-1: Relationship of events and possible outcomes
Experiments Outcomes
Flipping coins Heads / tails
Dice 1 2 3 4 5 6
Exam marks 0-100
This was evident when Mr Makhata said: ‘So, as you roll a dice, you can get many; it
is not guaranteed that you will get the same number as you roll the dice, though you
have 50/50 chances of tossing head and tails.’
From the above statements by Mr Makheta and Mr Mabaso, it is clear that they have
an understanding of the concept of linking SVG with theoretical probability. As a result,
teachers and co-researchers can apply experimental probability in real-life situation.
5.5 CONDITIONS OF TEACHING AND LEARNING OF THEORETICAL
PROBABILITY USING AN SVG
This section considers the conditions that are conducive to teaching and learning of
theoretical probability. The conditions that are conducive for the sustainability of the
solution were demonstrated (Section 4.4.4). This section then shows the condition of
teaching theoretical probability using SVG.
5.5.1 Conditions conducive to teaching and learning of theoretical probability
using SVG
Teaching and learning of theoretical probability using SVG shows definite relationships
between nature and mathematics. The purpose of this initiative is to improve the CK
and PCK of teachers to be able to explain mathematical concepts thoroughly and
effectively to learners. An improved CK an PCK of teachers will produce learners who
can prove theoretical concepts using the tossing of a coin and prove probability of
getting tails and heads. To some extent, the knowledge of ends, purposes and values
was identified throughout the teacher development, which improves skills and which
93
ensures that teachers can demonstrate experimental probability effectively (Gal &
Wagner, 1992). Within the context of professional development programs, the
information gathered from the teacher about a lack of knowledge on the initiative of
using an SVG as a teaching aid will negatively impact the performance of learners.
The programme of developing teachers will reinforce the areas of content and
pedagogical knowledge, which need to be addressed in a classroom. While teachers
wished for ‘hands on’ activities to be used immediately in the classroom, there were
also needs such as an SVG for greater content knowledge, exposure to the curriculum
documents and awareness of learners’ reaction to the idea of using SVG to teach
mathematics.
5.5.2 Condition of teaching theoretical probability effectively
The teaching of theoretical probability using the SVG needs to outline its condition
which can best suit the ability of learners to use the SVG and mathematics in real-life
situations. The essential process of the teaching and learning of theoretical probability
requires an understanding of how theoretical probability can be meaningful to learners.
The process of teaching theoretical probability forms an underlying part in the
development of SVG knowledge by both learners and the community. The significance
of CK in mathematics is to ensure that, as team members, we are capable of
integrating mathematics across the curriculum and in real-life situations. The study
realised a need to capacitate co-researchers to teach mathematical probability
meaningfully, thus subscribing to the objective of the study and its framework, which
encourages social interaction amongst educators and learners. The framework of the
study believes that social interaction will allow co-researchers who have a deeper
understanding of theoretical probability to share with other team members. However,
Mr Kaneli asked a rhetorical question: ‘Colleagues, are you aware that linking the SVG
and mathematical probability will be interesting and fun to our learners by relating
nature with mathematical probability?’
Mr Mabaso responded by saying:
Though you don’t need an answer sir, I am aware sir, because bana ba batlo lemoga
hore haba nosetsa dijalo ka di-litre tse sa tshwaneng batla fumana dijalo tse fapaneng.
94
(I am aware, sir, because learners will see when as they irrigate the vegetables with
different amount of litres per plot, they will get different results.)
Then Mr Mabaso said that the role of teaching probability by linking it with the SVG,
as the above statement indicated, involves that we use different quantities of water to
get different results. This is an example of experimental probability. Experimental
probability is about the unexpected outcomes which are not predictable. Hence, it is
going to be fun in the sense of allowing educators to understand the nature of CK and
its importance (Mudaly, 2004: 77). The SVG is used in the school environment to
influence the complex process of understanding the perception of their peers and
community at large during demonstrations of teaching theoretical probability in outdoor
settings.
5.5.3 Condition of Using Curriculum Knowledge of Theoretical Probability
Since reasoning and proof are central to Mathematics and mathematical learning, we
recommend that any mathematics curriculum represent reasoning. In this study,
reasoning and proofing is done through linking mathematics with the use of SVG. It is
known that reasoning and proving mathematical operations can be done in a hierarchy
of stages through which learners progress depending on their age, experiences and
the culture in which they can learn mathematical probability. This hierarchy method
emphasises the condition of the CK and PCK in such a way that curriculum content
caters for the age, experience and study culture of our learners. Mr Mabaso said:
Ho ruta mathematics ntate, tshwanetse re utlwisise hore content ya mathematics ya
fapana hoya ka dilemo tsa bana (Teaching of mathematics, sir, we must understand
that content knowledge of mathematics should cater for a different age group).
Mr Mabaso, from the above phrase, indicated that CK should cater for a different age
group, which is one of the conditions that educators should understand. The
curriculum is designed in such a way that age is addressed per cognitive level of
learners. The earlier the learners begin to learn about reasoning at a given age, the
stronger their understanding of proofs and proving will be. The curriculum must
emphasise the central nature of reasoning and proof with its presence in mathematical
probability in each of the content strands within the curriculum. In addition, reasoning
and proof must be valued by inclusion in formative and summative assessment.
95
Learners should have access to a flexible learning environment that allows for
individual and collaborative learning. The use of the SVG caters for flexible learning in
the environment setting and will collaboratively exchange concepts of theoretical
probability. The resources that will be used to develop the SVG should have be safe,
comfortable and well-equipped for study, such as textbooks, writing equipment, and
vegetable garden material (Lampert, 2001: 54). Access to the use of resources for a
limited teacher should involve collaboration in developing an SVG through the
creativeness of learners and all parties involved in SVG. For example, the theoretical
probability can be explored by linking samples and measuring the chances of
production of plants using different quantities of water.
5.6 THREATS AND RISKS FOR THE USE OF SVG
For teaching and learning of mathematical probability to take place effectively, it is
vitally important that the conditions are conducive for all learners, through the use of
SVG. These conditions are inherited with an understanding of the risk and threats
which can be imposed on the implementation of the strategies for the teaching and
learning of mathematical probability through the use of an SVG.
5.6.1 Teachers’ Attitude Towards Mathematical Probability
It is vitally important that educators always remain positive regarding initiatives such
as linking an SVG and mathematical probability. The implementation of an SVG to
teach mathematical probability will be easily formulated. The use of an SVG in
teaching mathematics contributes significantly to learners’ understanding of
mathematical probability in real-life situations. Mathematical probability was
introduced late in the curriculum, resulting in a majority of the educators not being
trained in this skill during completion of their degrees. Therefore, teacher attitude
towards teaching mathematical probability was negative (see paragraph 2.4.4.1).
In this study, the co-researcher’s attitude was positive towards the use of SVG. This
was evident when Mrs Khatiti asked: ‘Is it possible to be trained or developed?’
96
This showed great character of attitude towards learning as educators, so they can be
capacitated in delivering mathematical probability meaningfully. Mr Mabaso then
volunteered to the team that he will demonstrate mathematical probability to them.
This was ultimately seen as a sign of good attitude by co-researchers. They showed
a good sign of collective leadership in the current study, including sharing
responsibilities, such as convening and chairing meetings, and finding out how
mathematical probability can be linked with the use of SVG.
5.6.2 Teacher commitment towards SVG
Teacher commitment towards the use of the SVG is equally important to the co-
researchers to understand the value of integrated learning. This initiative might impose
either positive or negative attitudes toward the use of the SVG. The use of the SVG in
the past was used just to provide vegetables to learners and the community. It was
not serving a dual purpose of also being used as a teaching aid. The threats are the
ability of educators to use the SVG as a teaching aid and the ability of educators to
adjust to the use of the SVG. This initiative can be used to solve the problems of
teachers. However, threats around this idea are teacher commitment and the
availability of resources to progress the idea of other teaching skills mainly, SVG aid
(RNC, 2002).
5.6.3 The impact of teacher’s workload
The heavy workload is one of the threats to both integration and adaptation of the SVG
in lesson planning and preparation. The idea of using the SVG might be considered
an additional material for teaching mathematics. The educators should adjust to the
use of the SVG, as this can be done if proper training and planning has taken place to
facilitate the process of using the SVG. The process of allowing educators to adapt
the use of the SVG into the teaching of mathematics should be investigated, though
workload will remain a threat to our educators. However, the study investigated means
of planning to reduce the workload of educators, which can cause serious
misunderstandings or a negative attitude towards the use of an SVG. The co-
researchers then worked on methods to deal with threats which can delay or sabotage
97
the idea of using an SVG. The preparation was done in terms of planning for facilitation
of the teaching of mathematical probability through the use of an SVG.
Mr Mabaso mentioned that he was trained in the teaching of mathematical probability.
He began by saying: ‘Colleagues, by virtue of understanding the importance of SVGs,
we should adhere to the pace setter and we should know each week what it is that we
have to do. We need to find out what topics we are teaching this week and who we
are observing.’
From the above phrase, it is clear that co-researchers are preparing the lessons
together. However, not only do they prepare lessons together, but they were also
considering the pace set by the DoE. This was confirmed by Mr Mabaso, who said: ‘I
will handle mathematical probability this week and I will be doing experimental
probability this week, integrating it with the use of the SVG.’
It is clear from the above phrase that Mr Mabaso volunteered. He wasn’t forced to
teach mathematical probability, which shows co-operation and a spirit of good team
work amongst the co-researchers. This made co-researchers own the research project
as an activity that seeks to respond to their challenges. In doing so, the co-researchers
did add to their workload. This was indication of reducing the workload of co-
researchers by sharing responsibility and ideas that can enhance the teaching and
learning of mathematical probability through the use of an SVG.
5.7 THE SUCCESS INDICATORS FOR THE USE OF AN SVG TO TEACH
THEORETICAL PROBABILITY
The study understands that it should address the problems and challenges that were
facing the study by demonstrating the success indicators (2.4). It is the objective of the
study to show that it understands the challenges and they can show initiatives which
can be used to show the importance of SVGs. The success of this study will be
identified when co-researchers partake in the idea and demonstrate strategies which
can instil a sense of team work into teaching and learning. In addition, the teachers
will work effectively to show the possibility in integrating the strategy of teaching
theoretical probability using an SVG.
98
5.7.1 Linking of SVG and Theoretical Probability
Garden-based learning advocates that every child should have access to a garden in
which they are encouraged to use all their thinking ability to relate nature to
mathematics (Weed, 1909: 76). The research has been done by many countries to
find ways to link mathematics and vegetable gardens. They believed that teaching
only in a classroom cannot be the only technique for teaching theoretical probability
(Morris, Briggs & Zidenberg-Sherr, 2000: 2). The study had to search for other
techniques which were relevant to the objective of the study. The co-researchers then
interrogated the idea and checked if it would work or not. The study looked at the
content knowledge and pedagogical knowledge needed to teach mathematical
probability using an SVG.
5.7.2 The Importance of Content Knowledge to Teach Theoretical Probability
The importance of content knowledge for the use of an SVG to teach theoretical
probability is constructed in the form of pedagogical, curriculum and pedagogical
knowledge. The study understands that CK is the main component, whereby PK and
CCK are bound in the basis of CK (Ball et al., 2008: 401).
Mr Makheta said:
I think we should demonstrate once more the relationship of SVG and theoretical
probability with the use of experimental probability.
Mr Makheta mentioned that theoretical probability consists of experimental probability,
which can be linked with the use of SVG.
Learner Khumalo said: ‘Sir, can I ask? The class should take into consideration that
experimental probability is about which unexpected possible endings could occur. So
does it mean that tossing a coin and the rolling of a die is an example of experimental
probability? So how can it relate to the use of an SVG?’
The learner wants to know the possibility of linking SVG and theoretical probability. It
is clear that Khumalo understands how to define random probability. She even
mentioned the examples of experimental probability, such as the tossing of a coin and
the rolling of a die. Khumalo wanted clarity on how to show the link between the use
99
of an SVG and theoretical probability. This is one of the success indicators of the study,
as learners begin to understand the CK of theoretical probability.
Mr Mabaso replied: Yes, Khumalo, you are correct. The experimental probability is
about unexpected endings, and I also like that you understand the examples that fall
under the experimental probability, such as the use of dice and tossing of a coin. The
experimental probability also can expand to sample techniques which can be used to
sort the plots of the vegetable garden to understand the probability of production of
each plot, since variety in the quantity of water will be utilised. Therefore, the sample
technique shows the following: denotes = {heads, tails} S= {heads, tails} or, as we
usually write it, {H, T} {H, T}. Experimental probability: roll a die; sample space: 𝑆 =
{1,2,3,4,5,6}𝑆 = {1,2,3,4,5,6}. The success indicator shows the learner the relationship
of SVG and theoretical probability, which was proven, as learners should be able to
apply SVG in sampling space and see the relationship. To comprehend the number of
plots, they can use sample space to calculate outcomes. The study will use four plots,
which then “S” sets will be SVG, and denotes will be the number of plots written by 𝑆 =
{𝑃1, 𝑃2, 𝑃3, 𝑃4}. This will be a tool used under unit sampling space in theoretical
probability. To elaborate on methods of teaching theoretical probability, numerical
values lie between 1 and 0. In the case of an impossible event, the probability of
occurring is zero. When the event is possible, it lies in 1. All other events will have a
probability between 0 and 1. The example below serves as an instrument to
demonstrate sampling space, as co-researchers will pick a particular plot to calculate
the chances of getting 1 or 0 and 100%. In this regard, learners will be able to apply
the knowledge to a real-life situation.
Example: The use of the number of plots in the SVG
𝑺 = {𝟏, 𝟐, 𝟑, 𝟒, }
Events: The following numbers show odd and even numbers of vegetable plots within
the sampling method:
𝑆 = {2, 4 . . . }
𝑆 = {1, 2, 3. . . }
Learners will be required to choose certain plots amongst others to measure the
probability of getting Plot 4, as it is a carrier of quality plants. It should be said that Mr
100
Mabaso is the same teacher who presented a lesson in Section 4.2.1. He
demonstrated a deeper understanding of the sampling techniques of tossing a coin
and rolling dice in relation to the use of the SVG. It took the efforts of co-researchers
through proper channels of communication for the successful implementation of this
initiative. The use of CK, PCK and CCK was understood and improved to learners.
This was evident from the connection that Ms Khatiti made with Mr Mabaso, as she
said: ‘Yes sir, the idea of sampling the plots and using different quantities of water for
different plots indicates that we might produce different plants (length, width and
production).’ However, from the above extract they were now sharing ways in which a
particular experimental probability can be understood by learners able to apply the
lesson taught in class in a real-world situation.
5.7.3 The Experimental Probability in an SVG and Assessment for Learners
The experimental probability in an SVG and assessing learners can be used to show
the success indicators of this initiative. The implementation of the strategy is to assess
learners to see how well they understand the concept of theoretical probability in a
real-world situation. The results of the production of a vegetable garden will be proven
by the use of experimental probability to show the results of each plot, which was
controlled by concepts of theoretical probability.
The importance of assessing learners is emphasised by the use of CCK, which is more
concerned with the reliability of the initiative. The study understands that measuring
the effectiveness the study is done through assessment by linking the SVG and
theoretical probability. The test was given to learners to reflect on the objective of the
study and to measure the understanding of theoretical probability by learners (Aslan,
2015: 97). The integration of SVG in the classroom as a teaching aid created an
opportunity for learners for learning the table below, which shows the results of
learners. This table shows the effectiveness of formulation of the initiative.
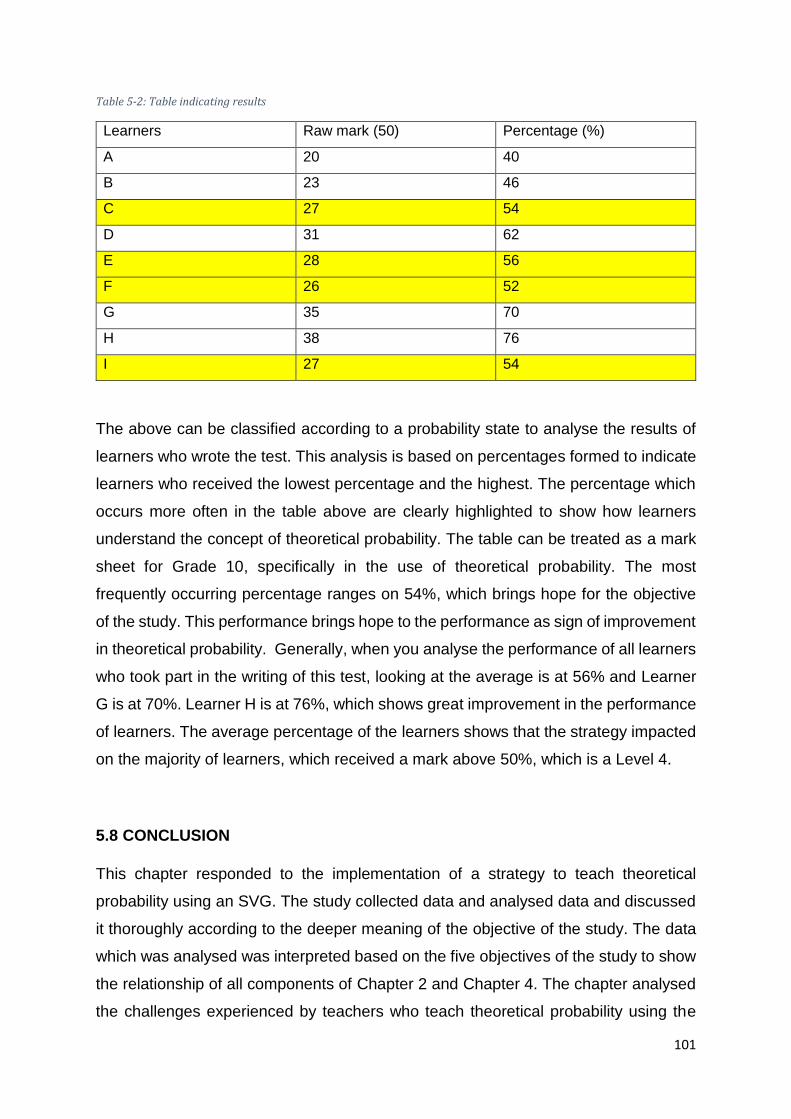
101
Table 5-2: Table indicating results
Learners Raw mark (50) Percentage (%)
A 20 40
B 23 46
C 27 54
D 31 62
E 28 56
F 26 52
G 35 70
H 38 76
I 27 54
The above can be classified according to a probability state to analyse the results of
learners who wrote the test. This analysis is based on percentages formed to indicate
learners who received the lowest percentage and the highest. The percentage which
occurs more often in the table above are clearly highlighted to show how learners
understand the concept of theoretical probability. The table can be treated as a mark
sheet for Grade 10, specifically in the use of theoretical probability. The most
frequently occurring percentage ranges on 54%, which brings hope for the objective
of the study. This performance brings hope to the performance as sign of improvement
in theoretical probability. Generally, when you analyse the performance of all learners
who took part in the writing of this test, looking at the average is at 56% and Learner
G is at 70%. Learner H is at 76%, which shows great improvement in the performance
of learners. The average percentage of the learners shows that the strategy impacted
on the majority of learners, which received a mark above 50%, which is a Level 4.
5.8 CONCLUSION
This chapter responded to the implementation of a strategy to teach theoretical
probability using an SVG. The study collected data and analysed data and discussed
it thoroughly according to the deeper meaning of the objective of the study. The data
which was analysed was interpreted based on the five objectives of the study to show
the relationship of all components of Chapter 2 and Chapter 4. The chapter analysed
the challenges experienced by teachers who teach theoretical probability using the

102
SVG. However, the study managed to address solutions which occurred through the
strategies or approaches which were developed to address challenges experienced in
Chapter 4. The study will subsequently show the recommendation of findings in
Chapter 5.
103
CHAPTER 6 : SUMMARY OF FINDINGS, CONCLUSION,
RECOMMENDATIONS AND SUGGESTIONS FOR FURTHER
RESEARCH
6.1 INTRODUCTION
The study understands the importance of linking school vegetable gardens (SVGs) to
demonstrate theoretical probability. The aim of the study is to ensure that it introduces
the strategy of using an SVG for the teaching and learning of theoretical probability so
that learners can apply this knowledge in real-life situations. This chapter briefly
articulated the study background, the problem statement and the objective of the
study, which in turn reminds us of the aim of the study. Thereafter, the chapter
presents the findings of the study as organised according to the objectives of the study.
I then present the stages of a tested and implemented strategy, which serves as a
recommendation for all challenges that emerged during the investigation process.
6.2 BACKGROUND AND PROBLEM STATEMENT
The study designed a strategy, because it saw a need for extra teaching aids or
methods that can be used to teach theoretical probability. The study then designed an
SVG as a teaching aid to improve the content knowledge of theoretical probability. The
use of an SVG was in line with the components which mould the objective, such as
pedagogy and content knowledge, as well as curriculum knowledge in relation to the
teaching of theoretical probability. Teachers’ and learners’ knowledge can be
expanded from the components which are in relation to the study objectives and
identification of dynamic strategies to implement the use of SVG. These strategies
contribute greatly to both teachers’ and learners’ performance in Mathematics. This
study understands the definition of pedagogical knowledge as the knowledge which
focuses on the skills of teachers to deliver theoretical probability in such a way that
learners can understand and apply probability concepts in real-life situations (Koehler
et al., 2013: 3).
104
Furthermore, it was evident from the reports that teachers were not well-capacitated
on how to teach theoretical probability. This had a negative impact on delivering the
probability concepts through the use of an SVG (Tella et al., 2007: 1308). Furthermore,
teachers were found to experience pedagogical difficulty in designing, ordering and
organising class activities and alternating between different types of theoretical
probability, as this chapter was not introduced during the time when teachers were still
studying at their respective institutions (Leendertz et al., 2013: 5). In the reports,
teachers find probability concepts too difficult to teach or even to elaborate on the use
practical examples, which influenced the effectiveness of teaching mathematical
probability (Nkhwalume & Liu, 2013: 27; Ratliff, 2011: 6).
In response to these pedagogical challenges in Mathematics, the department of
education decided to train educators who were affected. The DoE then suggested
taking teachers for content training in mathematical probability. This was done to
capacitate and instil a sense of confidence and transparency between teachers and
learners. This was done to promote quality education and creativity of the methods
which will be utilised to demonstrate mathematics with the use of SVG (Kaino, 2008:
1844; Nkhwalune & Liu, 2013: 26-34).
Despite the use of an SVG in teaching theoretical probability, learners still struggle to
apply their knowledge in a real-life situation. This became evident when we observed
their performance during question analysis under the section of probability, where
most learners performed badly. In the higher order question which incorporated the
real-life examples, learners still performed poorly in mathematical probability.
Teachers, together with learners, still experience difficult with content knowledge.
Teachers especially struggle, as they were not taught mathematical probability and
statistics during their study time. The pedagogical difficulties faced by educators in
improving their teaching skills to enable learners to access higher-order reasoning
remained a challenge. As a result, suggestions in terms of approaching the certain
challenges of pedagogy difficulties was to respond to challenges faced by educators.
1. Teachers then suggested that they identify mathematical probability concepts
that learners find difficult to comprehend and teachers find difficult to teach
effectively.
105
2. The study designed a method which outlined all of the key concepts of
mathematical probability to make a lesson easier
3. A facilitator designed the SVG teaching aid to ensure that co-relation of
mathematical probability concepts is shown and can be understood in a real-
life situation.
6.2.1 Research Question
How can the vegetable garden enhance understanding of theoretical probabilities in a
real life situation?
6.2.2 Aim and Objectives of the Study
The aim of the study was to design a teaching aid (SVG) to ensure that theoretical
probability can be applied in a real-life situation.
6.2.3 The Objectives of the Study Were:
To carefully explore the challenges of the teaching and learning of theoretical
probabilities in mathematics.
To analyse the different strategies that have been used to improve teachers’
use of an SVG to teach theoretical probability
To highlight the components that constitute a strategy to use a school vegetable
garden as an aid to enhance the teaching and learning of theoretical
probabilities in mathematics.
To outline the threats or risks of using a school vegetable garden as an aid to
enhance teaching and learning of theoretical probabilities in mathematics.
To demonstrate the success indicators from best practices for the
implementation of a strategy to use a school vegetable garden as an aid to
enhance the teaching and learning of theoretical probabilities in mathematics
106
This chapter then presents the study finding and recommendation under the body
of its objectives to improve teaching and learning of theoretical probability in a real-
life situation.
6.3 FINDINGS AND RECOMMENDATIONS
This unit demonstrates the results of the study by presenting the findings and
recommendations of the co-researchers pertaining to its own objectives. The study
then unfolds its findings as follows, as they emerged from Chapter 3 and 4.
a) Mathematical probability was introduced late, after the majority of educators
had completed their degrees.
b) There is a challenge with time allocation to cater for the use of SVG.
c) Mathematical probability is one of the most frequently failed Mathematics
topics, especially in application questions.
d) Teachers have negative attitudes when they have to teach mathematical
probability.
e) Teachers do not prepare for this unit, as they were not exposed to this topic
during their studies.
f) Teachers facilitate and assess their lessons with inadequate practical teaching
aids.
g) Teachers use only examples that appear on their textbooks.
h) Lack of strategic planning for the use of an SVG in teaching mathematical
probability.
The above-mentioned findings were not just left unattended. Recommendations had
to be drawn from the strategies that co-researchers suggested in Chapter 4 (see
paragraph 4.3). This recommendation was done to improve the teaching and learning
of theoretical probability with the use of an SVG. In Section 4.4, conditions conducive
to SVG aid were observed to ensure that implementation of strategies are effective for
both teachers and learners. The spectrum of the risk and threats were mitigated to
make us realise the objective of the study. The recommended mitigations were
implemented.

107
The strategies were then analysed before recommendation, so that implementation
could be done. The study showed that there was a challenge in mathematical
probability concepts among learners and teachers. Teachers were especially
challenged, as they had not been exposed to mathematical probability during the
completion of their degrees. During the facilitation of lessons, we observed insufficient
and inadequate work under this probability, which is the signal of a lack of confidence
or a negative attitude towards the topic. The study further found that the lack of
confidence and lack of key concepts on probability can demoralise educators when
engaging the learners. To respond to the challenges stated above, the study
recommends the implementation of the following stages of the strategies, formulated
in Section 4.3.
6.3.1 Recommended Strategies
The above challenge was addressed in the spectrum of PAR as a strategy to address
teacher challenges pertaining to concepts of theoretical probability. This strategy was
used to respond to the challenges of the study, which ultimately contributed critically
to the success of study objectives. This critical approach understands the importance
of improving teacher pedagogical knowledge, as well as content knowledge of
theoretical probability. This is recommended with the understanding that the principle
of this approach explains that knowledge is not centred on a certain individual. This
approach encourages teamwork and it respects the views of all co-researchers,
regardless of their backgrounds, and it values positive team creation. This
implementation directs co-researchers to the common interest of addressing the
problems inherent in theoretical probability, which power relations should not dictate.
The production of the study will be maximised due to teamwork in a classless society,
depowering the individual. This will create a positive attitude and space, allowing co-
researchers to find solutions to their own problems. The following are the steps the
study recommends for the formulation of teamwork. In Chapter 3 we then unfolded
this principles of PAR in the following procedure.
108
6.3.1.1 First meetings
The co-researchers formed a team that had to meet on a frequent basis to discuss the
importance of the objectives of the study. The co-researchers then had their first
meetings as a strategic plan to create the sense of unity and trust amongst members
of the team. The main purpose of this meetings was to create a communicative space
which ultimately values the inputs of everyone involved.
The importance of this meetings is to ensure that a system of communication is
effective and efficient, bringing a sense of team collaboration. Team collaboration is
empowered by the principles of PAR to bring adherence to freedom of speech
amongst the members and to allow a free flow of ideas without discouraging the
exchange of opinions. Social realist theory supports these principles to ensure that it
promotes a positive climate amongst the co-researchers. The SRT theory embraces
the idea of allowing members to exchange opinions without being discouraged and
values multiple perspectives, where each member of the research team could freely
give voice to their perspectives. These meetings are conducted in face-to-face and
one-on-one sessions, with the understanding that the study will ensure that
implementation of strategies will be implemented based on multiple perspectives
during the first meetings of the study.
6.3.1.2 The aim of the first meeting
The major purpose of these meetings was to identify the common problem or interest
in theoretical probability during the face-to-face sessions. The meetings initiated the
collaboration of members to form a strong team, which could strive to reach the
objectives of the study. The meetings were conducted in such a way that it reminds
members of the objectives of the teaching and learning of theoretical probability. After
the members have realised the objectives of the study during the face-to-face
meetings, the study recommended that formal meetings should be designed to
address the challenges of the study. This is done because, through different
perspectives, people understood the challenges lying under theoretical probability and
the possibility of approaching all problems better.
109
The study suggested that the first formal meeting will be attended by six teachers from
intermediate, senior and further education and training (FET). The idea was to allow
the exchange of opinions on how theoretical probability can be delivered to learners
using an SVG. The aim of formulating a team was to exchange ideas which cater to
interest of people and address learner challenge in mathematical probability. After the
team identified common challenges and reached agreement on challenges faced by
the study, teamwork was strengthened during the meeting. The study recommends
that the team responds to research questions or objectives, which co-researchers will
address after challenges have been identified.
The study understands the importance of the team functioning optimally and
responding to the research question. The study recommends a SWOT analysis as an
evaluation tool that the team can employ to assess the strengths, weaknesses,
opportunities and threats in relation to the common problem identified.
This enabled the research team to identify the strengths, weaknesses, opportunities
and threats in their meeting during their sessions to come up with solutions to identified
challenges.
The SWOT analysis assisted the team member in reviewing the internal and external
matter, which can support or impact the study negatively when designing an SVG to
teach mathematical probability. A SWOT analysis was employed as a strategic
planning tool to show the external and internal challenges and opportunities to reach
the objectives of the study successfully.
6.3.1.3 The conditions that are conducive to a working team
The study recommends that for the success of the study, we needed a quality team
which aligned themselves with the principles of PAR. The collective effort means
collective leadership. In this study, however, we saw the signs of collective leadership
through sharing responsibilities during the meetings. The co-researchers were
organising the logistical issues, such as ensuring that the land is prepared before
planting and seeds are available, as well as facilitating lesson to demonstrate to other
members while they were observing. Collective effort becomes a necessary condition
for preventing misunderstandings amongst the members. This is to avoid a situation

110
where duties will be assigned to certain individuals, which will create conflict, as other
members may not see the need to offer their ideas. It is significant that the duties and
responsibilities were assigned and that all members of the team were involved, as this
will be an indication that we adhere to the principles of PAR.
The study further recommends that, for optimal functionality of a team, it is imperative
that there is a sense of belonging and appreciation among the team members. For
team functionality to be sustained, the study recommends that a sense of tolerance
for different and contradictory views or perspectives is developed. Moreover, respect,
mutual benefit, equality and humility are recommended as characteristic features of
an optimally functioning team.
The study recommends that, to have a sustainable team, the policy which will guide
members should be developed to ensure that the daily activities of the team are done
accordingly. The policy will be guiding the team members in such a way that a vision
and mission will foster a shared purpose in the study among members of the team.
Furthermore, the study recommends that the guiding policy should be worded in such
a way that it not be a threatening document, but a document which serves as
motivation to ensure that behaviour, attitude and the level of commitment amongst the
members is fully displayed during the daily activities. This idea of developing policy
will again cultivate the performance of all members of the team by ensuring that they
are motivated to do their duties all of the time.
6.3.1.4 Threats and risks towards a team
The strategies in Section 4.3.1.1, which dealt with a team approach to the CK and
PCK for teaching and learning of theoretical probability using a school vegetable
garden (SVG), has inherent risks and threats. These risks and threats include the
challenge of finding a convenient time for all team members to meet, as well as
miscommunication. Because they are working collectively, team members suggested
that they communicate the time of the meeting a week in advance and that they would
choose a time which suits all members, specifically after working hours. This was done
with an understanding that not all members are from same school and not all members
are educators. Hence, team members had to look for a convenient time. For instance,
111
during the study intervention, the team members developed a programme which
indicated the date and time.
The risk and threats continued, as educators mentioned that they do not have
background knowledge of mathematical probability. This was evident through the
attitude of educators towards teaching mathematical probability, as they were not
giving learners enough work at the end of a lesson. Teachers do insufficient lesson
preparation when they are teaching mathematical probability.
The results of the study revealed that teachers do not assess learners’ prerequisite
knowledge and skills. This was observed during teachers’ lesson facilitation. The
educators had been assuming that learners are reluctant towards the topic and that
they do not want to put more effort into their work. This was evident when, during their
lesson facilitation, Miss Kgatiti used only one example when demonstrating theoretical
probability. She decided to use only tossing a coin. It could have been better for the
understanding of learners if more examples were used (4.2.2). Furthermore, the
results of the study revealed that teachers do not prepare measurable lesson
objectives during their preparation. This was evident when teachers could not
demonstrate the lesson objective within a period specified by the school timetable.
6.3.2 Strategies Recommended for Sufficient Preparation
This showed great character when one member volunteered to assist the educator by
showing other practical examples, such as the use of an SVG. Mr Mabaso then
volunteered to the team that he will demonstrate mathematical probability to the team.
This ultimately showed signs of a good attitude by co-researchers. It is vitally important
that educators always remain positive to initiatives such as linking SVG and
mathematical probability to add more practical examples. The implementation of SVG
to teach mathematical probability will be easily formulated. The use of SVG in teaching
mathematics contributes significantly towards learners’ understanding of
mathematical probability in real-life situations. Thus, teacher attitude towards the topic
of teaching mathematical probability was negative (see paragraph 2.4.4.1).
The study recommended that the team formulate a plan which can be demonstrated
to other members on how to demonstrate the use of SVG to teach theoretical
112
probability. This should serve as a guide that will enhance teacher pedagogical
knowledge and content knowledge pertaining to mathematical probability. The
research had to review the strong points of the team so that it can be easy to develop
a segment of activities within the time allocated, specifying which unit will be done and
by whom. The team identified the topic in mathematical probability, which will be
demonstrated by one of the members to outline probability concepts specifically. For
instance, during a teams’ lesson preparation meetings, members could volunteer to
teach sample technique because member feels comfortable and member can teach
sample techniques using a lot of practical examples. It is vitally important that we allow
members to volunteer, as this act is a clear indication of a willingness to work and
assist members in getting the value of being observed amongst team members. This
act will show transparency between the team members in relation to their teaching
practices and that there are no members who are highly favoured.
The study recommends that, before the facilitation of lessons, teachers should plan in
such a way that the aim of the topic it clear and measurable. The lesson plan is a guide
that will help the teacher to take into account the amount of time that will be spent per
topic (see Section 4.3.2).
Furthermore, the study recommends that, when preparing a lesson that uses an SVG
as a teaching aid to teach theoretical probability, the priority should not be on designing
a well-structured concept, but should be on making it useable and accessible to all
learners across all grades. The use of SVG to teach theoretical probability should be
designed to improve the content knowledge of mathematical probability concepts. The
teaching of theoretical probability with the use of SVG should improve content
knowledge, curriculum knowledge and pedagogical knowledge of both educators and
learners. The content knowledge (CK) of theoretical probability can be improved
through team teaching, where all views and understandings of sampling techniques
can be addressed to learners during lessons. This will improve members’ content
knowledge of both observer and presenter, as they will be showing their deeper
understanding of the probability concepts.
For instance, in the current study, to improve the content of sample techniques, each
member will show all practical examples, excluding the use of an SVG, such as tossing
coins and rolling dice. The team will share their experience of how this can be used to
113
such an extent that it improves theoretical probability through the use of an SVG. The
strategy unfolds as such to show a link between theoretical probability and the SVG.
The strategy is as follows:
1. Identify the main concepts of mathematical probability.
2. Classify or show the sub topics of mathematical probability.
3. Use equal numbers of plots to plough the same vegetable.
4. Pour different quantities of water per day to show the probability of growth using
sampling techniques.
5. Learners should be able to see that not all vegetables after harvesting come in
the same size, shape and length.
Moreover, the study suggest that it is important, as we are improving each other’s PCK
and CK, that all the shared ideas amongst the members should be implemented
effectively. During lesson preparation, members should share ideas on how to use the
SVG to link to lessons when teaching theoretical probability concepts, which
represents concepts that learners find difficult to comprehend. This is also done during
the analysis of results, after the teacher gave learners class activities to evaluate their
performance (see paragraph 4.7.3). For instance, in the current study, during the
preparation to teach theoretical probability using sample techniques, it is stated that it
utilises some form of random selection to check differences in the results. In this case,
vegetable size, shape and length will be looked at, whether or not we get the same
results. This is done with an understanding that SVG will enable teachers to prepare
before they present, as it boosts their CK and PCK, since they will have been exposed
to different teaching approaches.
Furthermore, the study suggests that, with the use of the SVG, the team should meet
during or after the lesson preparation to reflect on the knowledge they had and the
new knowledge they have learnt, and how that is going to improve the confidence of
the educator, as well the performance of the learners. Therefore, since they lack
practical examples in theoretical probability, the study recommends that the SVG
should be used as an additional teaching aid to be utilised as a practical example. This
idea of adding to more comprehensive examples of theoretical probability was to
ensure that learners understand and are able to apply lesson learnt in a real-life
situation.
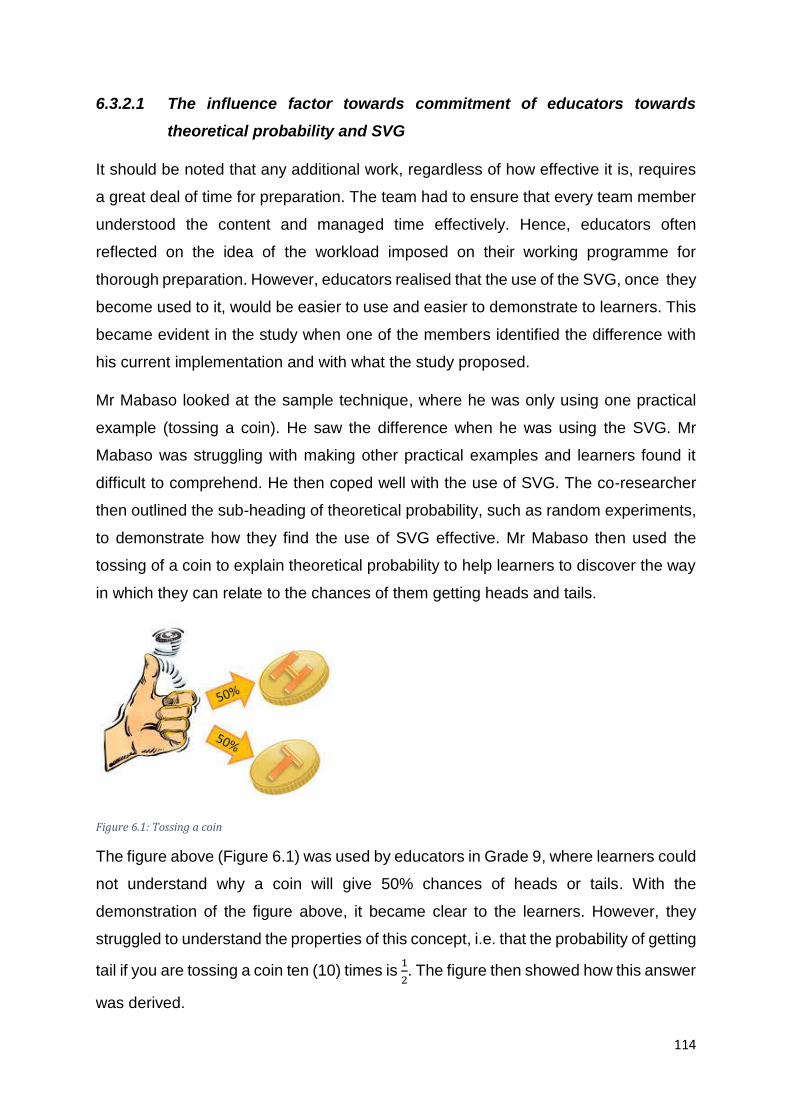
114
6.3.2.1 The influence factor towards commitment of educators towards
theoretical probability and SVG
It should be noted that any additional work, regardless of how effective it is, requires
a great deal of time for preparation. The team had to ensure that every team member
understood the content and managed time effectively. Hence, educators often
reflected on the idea of the workload imposed on their working programme for
thorough preparation. However, educators realised that the use of the SVG, once they
become used to it, would be easier to use and easier to demonstrate to learners. This
became evident in the study when one of the members identified the difference with
his current implementation and with what the study proposed.
Mr Mabaso looked at the sample technique, where he was only using one practical
example (tossing a coin). He saw the difference when he was using the SVG. Mr
Mabaso was struggling with making other practical examples and learners found it
difficult to comprehend. He then coped well with the use of SVG. The co-researcher
then outlined the sub-heading of theoretical probability, such as random experiments,
to demonstrate how they find the use of SVG effective. Mr Mabaso then used the
tossing of a coin to explain theoretical probability to help learners to discover the way
in which they can relate to the chances of them getting heads and tails.
Figure 6.1: Tossing a coin
The figure above (Figure 6.1) was used by educators in Grade 9, where learners could
not understand why a coin will give 50% chances of heads or tails. With the
demonstration of the figure above, it became clear to the learners. However, they
struggled to understand the properties of this concept, i.e. that the probability of getting
tail if you are tossing a coin ten (10) times is 1
2. The figure then showed how this answer
was derived.
115
These Grade 9 learners had been taught the properties of tossing a coin in Grade 7
and 8 based on the CAPS curriculum policy document. It was not surprising that these
learners were not able to comprehend, with theoretical probability, the concepts of
tossing a coin, because educators have only one example. The educators also
mentioned that it is problem in Grade 12 due to a lack of a proper foundation of this
concept. This often results in teachers having to present extra classes to teach the
learners the work that they should have mastered in previous grades. However, with
the use of the SVG educators, can use it as an extra example to emphasise more on
probability concepts, which will stick in their memory for a long time, since SVG is a
practical example which shows learners the link between probability concepts and a
school garden.
6.3.2.2 The impact of workload and teacher commitment towards the use of
SVG
Teacher commitment towards the use of SVG is equally important for the co-
researchers to understand the value of integrated learning. This initiative might impose
either positive or negative attitudes towards the use of SVG. The data analysis showed
that, during lesson facilitation before the study intervention, the use of the SVG
impacted on teacher workloads due to the allocation of time per class. It was revealed
that teachers like Mr Mabaso used only the examples that appear in the text-book.
This proved that learners were taught the concepts of theoretical probability according
to one way of solving the problem, which is why learners could not apply the
knowledge in real-life situations, like in the example of tossing a coin.
Mr Mabaso taught the theoretical probability using tossing a coin as the only example
which appears in a textbook, which showed learners the odds of getting tails or heads.
A lack of practical examples challenges learners’ cognitive levels, as they are not
exposed to situations in the real-world, denying them the possibility of applying this
knowledge. Moreover, lesson facilitation of theoretical probability was presented in a
classroom environment and the teacher was using textbooks as a reference guideline
to learners. Learners were supposed to watch and listen to the educator as he
presented the lesson, which limited their thinking capacity as well as application skills.
116
The data further revealed that the process of allowing educators to adapt the use of
SVG into the teaching of mathematics should be investigated, though workload will
remain a threat to our educators. However, the study investigated the means of
planning to reduce the workload of educators, which is a threat and can cause serious
misunderstandings or negative attitudes towards the use of an SVG. The ability to
assess learners’ prior knowledge resulted in the teacher facilitating lessons that did
not first establish what learners already knew in relation to the new information. The
study further showed that the way in which lessons were facilitated reflected on the
teachers’ attitude towards the use of SVG and the workload, which resulted in
improper preparation of lessons and a lack of quality assessment. The study revealed
that teachers did not pay attention on the objectives of the lesson and the teachers
complained that they don’t have much time to use additional teaching aids.
The activities that were given by the teacher were not connected to the concept of
probability, which will be mapped together in a way that is built together. This showed
little effort by educators towards theoretical probability, as it mentioned that educators
were not trained for mathematical statistics during the completion of their degrees.
Moreover, this showed a lack of knowledge by the educator, which in turn will impact
on how learners can be assessed.
6.3.2.3 The conducive condition recommended for the use of an SVG for
lesson facilitation
The study recommends that, for using an SVG to teach theoretical probability to work
effectively, it is the responsibility of the educator to create a conducive condition to
facilitate their lesson properly. In this case, the study suggests that teachers should
create a space which allows learners to interact with them easily. For instance, the
relationships that the educator forms should allow learners to think, do and work extra
hard to achieve the goal of the lesson. This was evident when learners Khumalo and
Omolemo were asking the teacher, Mr Mabaso, if they could ask questions. The class
should take into consideration that random experiments are about unexpected
possible endings that could occur, so does it mean that tossing a coin and rolling a die
is an example of random experiment? So how can it relate to the use of the SVG?
117
In the above extract, Mr Mabaso created a platform which is conducive to learners by
creating social interaction between learners and creating conditions for learning by
creating social interaction among learners. In the above extract, two learners are
working together to grapple with the content of theoretical probability and the teacher
did not ignore them. Instead, he assisted them thoroughly, which is a sign of reliability.
The study suggested that an opportunity be created for learners to work independently
when writing their activities and in groups when dealing with the use of specific
sections of mathematical probability. When using the SVG during the lesson, the
educator monitored them as he grouped them per plot in the vegetable garden. Doing
so ensured that learners followed the lesson and prevented them from losing the
thread due to a lack of knowledge of particular software. The learners should also feel
free to engage each other on areas they deem fit and to share ideas about the theorem
as they work individually and as a group. This shows collaboration amongst learners
and the ability to share knowledge, which is promoted by the body of the study (PAR).
The study further suggested that a team should meet and prepare for the effective
lesson as a collective. The importance of the meeting will allow teachers and learners
to find the best way of learning and teaching theoretical probability. This plan moreover
emphasises the objective of a lesson, which shows what it is that the learners should
learn and how they should apply the knowledge. In this case, during their preparation,
one member volunteered to teach theoretical probability, specifically sample
techniques.
Miss Kgatiti: The figure above shows the tossing and its unexpected endings.
Therefore, the sample technique shows the following: denotes = {heads, tails} S=
{heads, tails} or as we usually write it, {H, T} {H, T}. Random experiment: roll a die;
sample space: 𝑆 = {1,2,3,4,5,6}𝑆 = {1,2,3,4,5,6}. The fact that she volunteered without
anyone pressuring her showed cooperation and teamwork amongst the member of
her team. Together, the objective of the study can be realised.
Furthermore, the act of volunteering and knowing that you will be observed by other
members shows your level of confidence and the value of your work perceived by
team members. The purpose of the team when meeting before preparation is to
choose the topic. A member volunteered to do the particular topic before it is presented
to learners. This allowed members to realise how best they can formulate the lesson
118
aim and how the topic can be delivered to learners meaningfully. For instance, in
relation to the above abstract, the lesson aim was to teach learners how to prove that
a coin has only two chances. When using an SVG to teach theoretical probability, the
attention should not be on vegetables, but on the theoretical probability content. This
means experiences and ideas that were shared should be centred on improving one
another’s PCK and CK. For instance, the team, in order to improve the team members’
CK and PCK of theoretical probability concepts, suggested that the teacher should
collaborate and come forward with ideas on how to improve these concepts,
particularly their CK and PCK. During this study, the team created a platform for
discussing and sharing their understanding of the sample technique methods in
relation to the use of the SVG. The sample technique shows that a random selection
method is any method of sampling that utilises some form of random selection. To
have a random selection method, you must set up some process or procedure that
gives the assurance that the different units in your population have equal probabilities
of being chosen. In the pursuit of understanding these procedures, Mr Mabaso,
suggested that we list all the tools needed and how these concepts can be related to
the use of the SVG, rolling dice and tossing a coin. The component of theoretical
probability was discussed by team members, which is to improve their CK. Mr Mabaso
unfolded the tools of theoretical probability, such as experimental and theoretical
probability.
Mr Makheta:
Can I show how sample technique can be applied to learners in the current curriculum
and how it can be linked with SVG?
Miss Kgatiti:
I will also demonstrate experimental probability in the current curriculum, as well as
how it can be linked with the use of SVG.
Mr Mabaso:
OK! Colleagues, I think will be able to deal with theoretical and experiment probability
and how it can be linked with the use of SVG as a teaching aid.
119
The dialogue above shows the act of volunteering towards improving one another’s
CK and the value of each member towards their work and how they will build each
other positively.
Mr Makheta’s inputs on sample technique and how learners can relate to this concept
relates to using the tossing of a coin and an SVG. He firstly explained that sample
technique is a space in which the set of all possible outcomes in the experiment are
shown. It is usually denoted by the letter S. Sample space can be written using the set
notation, {S}.
Mr Makheta referred to the picture above, which shows the tossing of a coin and its
expected outcomes. Therefore, sample technique shows the following: denotes =
{heads, tails} S= {heads, tails}, or as we usually write it, {H, T} {H, T}. Random
experiment: tossing a coin; sample space: 𝑆 = {1, 2} 𝑆 = {1, 2}. Mr Makheta then said
that learners will then be able to see that the chances of tossing a coin shows a
probability of 50% chances of getting tails and heads with the use of a tree diagram.
This method can also be used with rolling a dice, which shows the chances of getting
1 out of 6 chances in a random experiment: roll a die; sample space: 𝑆 =
{1,2,3,4,5,6}𝑆 = {1,2,3,4,5,6}. This means that learners understand that rolling a dice to
get 1 should be 1/6 and 2/6 chances, etc. The way the two concepts were related was
discussed during the meeting. Mr Mabaso then asked how all this can be applied with
the use of an SVG. Mr Mabaso demonstrated the concepts of linking SVG with sample
techniques. He then gave Mr Makheta a chance to see if his CK has really improved.
This shows that team members implemented what was discussed and that the
objective of the study was achieved, simply because other member can now
demonstrate to other team members.
Mr Makheta then said: The following number shows odd and even numbers of
vegetable (plots) within the sampling method:
𝑺 = {𝟐, 𝟒 . . . }
𝑺 = {𝟏, 𝟐, 𝟑. . . }
Learners will be required to choose a certain plot amongst others to measure the
probability of getting Plot 4 out of the number plots used, as it is a carrier of quality
plants. It should be said that Mr Mabaso is the same teacher who presented a lesson.
120
He demonstrated a deeper understanding of the sampling technique, specifically of
tossing a coin and rolling a dice in relation to the use of the SVG. This actually teaches
learners not to assume that all vegetables can give the same results in terms of
production or quality of vegetables. Now the probability of getting the same quality of
vegetables will depend on the amount of water used per plot. Now learners can see
that probability can be applied in real-life situations.
After the presentation of Mr Makheta, Miss Kgatiti was impressed. She said that she
was clear on this topic. Miss Kgatiti said she was ready to present a lesson on the
experimental probability in comparison with theoretical probability with Mr Mabaso.
This would help learners to see the difference between mathematical probability
concepts and how it can be explained meaningfully.
Experimental probability is found by repeating an experiment such as an SVG by
constantly irrigating a vegetable garden to observe the outcomes in the afternoon and
morning. We will use the tossing of a coin as an example.
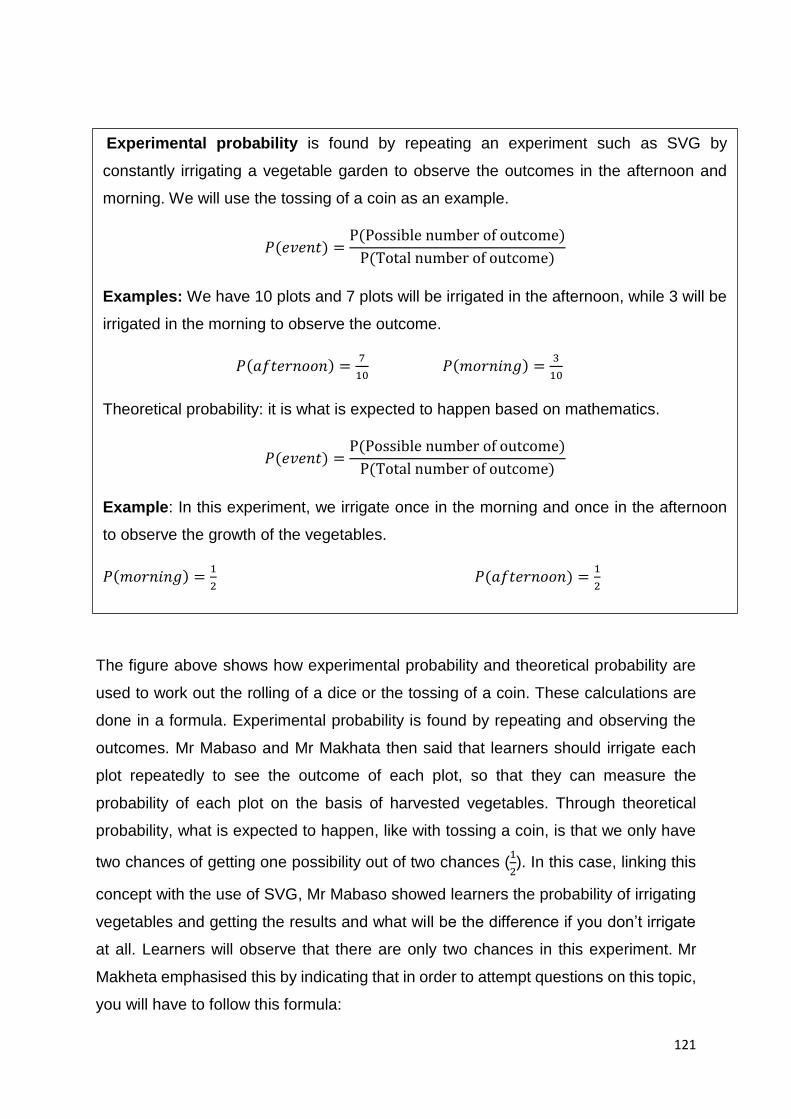
121
1
Figure 6.2: Theoretical probability and experimental probability using SVG
The figure above shows how experimental probability and theoretical probability are
used to work out the rolling of a dice or the tossing of a coin. These calculations are
done in a formula. Experimental probability is found by repeating and observing the
outcomes. Mr Mabaso and Mr Makhata then said that learners should irrigate each
plot repeatedly to see the outcome of each plot, so that they can measure the
probability of each plot on the basis of harvested vegetables. Through theoretical
probability, what is expected to happen, like with tossing a coin, is that we only have
two chances of getting one possibility out of two chances (1
2). In this case, linking this
concept with the use of SVG, Mr Mabaso showed learners the probability of irrigating
vegetables and getting the results and what will be the difference if you don’t irrigate
at all. Learners will observe that there are only two chances in this experiment. Mr
Makheta emphasised this by indicating that in order to attempt questions on this topic,
you will have to follow this formula:
Experimental probability is found by repeating an experiment such as SVG by
constantly irrigating a vegetable garden to observe the outcomes in the afternoon and
morning. We will use the tossing of a coin as an example.
𝑃(𝑒𝑣𝑒𝑛𝑡) =P(Possible number of outcome)
P(Total number of outcome)
Examples: We have 10 plots and 7 plots will be irrigated in the afternoon, while 3 will be
irrigated in the morning to observe the outcome.
𝑃(𝑎𝑓𝑡𝑒𝑟𝑛𝑜𝑜𝑛) =7
10 𝑃(𝑚𝑜𝑟𝑛𝑖𝑛𝑔) =
3
10
Theoretical probability: it is what is expected to happen based on mathematics.
𝑃(𝑒𝑣𝑒𝑛𝑡) =P(Possible number of outcome)
P(Total number of outcome)
Example: In this experiment, we irrigate once in the morning and once in the afternoon
to observe the growth of the vegetables.
𝑃(𝑚𝑜𝑟𝑛𝑖𝑛𝑔) =1
2 𝑃(𝑎𝑓𝑡𝑒𝑟𝑛𝑜𝑜𝑛) =
1
2
122
𝑃(𝐸) =𝑃(𝑛𝑢𝑚𝑏𝑒𝑟 𝑜𝑓 𝑜𝑢𝑡 𝑐𝑜𝑚𝑒)
𝑃(𝑠𝑎𝑚𝑝𝑙𝑒 𝑠𝑝𝑎𝑐𝑒)
The importance of theoretical probability has been emphasised by Mr Makheta by
showing the coordinating team the connection which can help learners by using the
formula. This conjunction makes logical sense whereby learners can attempt such
questions in real-life situations.
Mr Makheta showed his competency in demonstrating theoretical probability, as he
went for content training in the new curriculum. Despite their high level of competence
in theoretical probability content knowledge, their mathematics learners’ performance
was unsatisfactory. Thus, it became necessary for the study to find strategies to teach
theoretical probability with the use of SVG that would enable learners to demonstrate
the same high level of competence in theoretical probability
The dialogue above shows that co-researchers were improving the CK of each other
and, as a result, PCK was also improved. This was evident when the co-researcher
shared the topics amongst each other. These topics were shared voluntarily. Team
members volunteered to teach other members on the basis that they understood it
better and they saw a need to assist one another so they can be able to present it to
learners better. This shows collaboration amongst the team members, which enabled
different views of experimental probability and theoretical probability. Jita and Mokhele
(2014: 24) says that this is significant, because they contribute positively to teachers’
CK and PCK. The shared views improved teacher knowledge on concepts of
probability and how they can be delivered to learners meaningfully. This
implementation of the strategy, which was presented by team members, allowed
different perspectives, which resulted in finding ways to analyse the sample, according
to the theoretical and theoretical probability figures above. Team members embraced
the idea of sharing knowledge and that learners should also adapt to the concept of
working as team in order to understand the experimental probability so that they are
able to understand. Mr Mabaso supported the idea of allowing learners to adapt to the
idea of working in collaboration, which showed how this idea benefited the team as a
whole. This was evident when Mr Mabaso’s learners also had to do the same, which
confirms that, indeed, the manner in which the team members interacted to share
123
ways of analysing and teaching experiments and theoretical probability, in this case,
seemed to have been effective and beneficial for both teachers and learners.
This statement, which was suggested by Mr Mabaso, will help learners to know how
to link the concepts of theoretical and experimental probability with the use of SVG
and any other practical examples. For example, learners will have the skill on how to
identify the key concepts that enable them to attempt any practical question asked by
the examiner. This also benefits teachers, as they will be able to diagnose learners’
prerequisite knowledge and application skills to practical questions.
6.3.2.4 Factors threatening the use of SVG with regards to allocation of time
Using SVG as a teaching aid for teaching is often a threat to teacher workload and
poses a challenge to how this will be fitted into the periods allocated per topic. For
instance, it has been reported that teachers do not use extra teaching aids to facilitate
their lessons, because they find it time consuming and it adds more work to their
workloads. However, in this current study, we were able to avoid this problem. The
teachers’ workload did not increase as a result of using the SVG. Instead, team
members were sharing ideas on how to present experimental and theoretical
probability and this reduced the time spent on theoretical probability, because teachers
knew how to link each concept with the use of SVG and they showed each other how
it can be presented to learners.
In the social interaction between teachers quoted above, this will allow learning to take
place meaningfully. The way teachers presented these concepts has been analysed,
which allowed learners to discover the properties of mathematical probability which
had first been taught in Grade 8 and 9. In this case, when learners are at their highest
grade, they won’t find it difficult to comprehend, as the basic concepts of probability
will be dealt with at the lower grades. Under normal circumstances, when teachers
didn’t assist each other by improving one another’s CK and PCK, learners and
teachers would struggle to link theoretical and experimental probability with the use of
SVG.
124
6.4 SUMMARY OF THE STUDY BASED ON CONCEPTS OF EXPERIMENTAL AND
THEORETICAL PROBABILITY
The study saw a need to introduce the idea of teaching experimental and theoretical
probability with the use of SVG. However, it is equally important to note how these
concepts can be delivered to learners meaningfully. It was realised in this study that
theoretical and experimental probability should be delivered strategically to learners
to enable them to apply it in real-life situations. Hence, the co-researchers, with the
guidance of PAR, created a platform where they could present each of the concepts
based on their willingness and ability to demonstrate a particular topic. The co-
researchers then then decided to do the first approach, which was:
Part 1: Preparation
This approach starts amongst the members to decide the area of concern pertaining
to learners’ performance, teachers’ development and all stakeholders who will need
to teach or to be taught in order to improve CK and PCK. The idea was to centralise
people with common problem that could join forces and contribute to the team to
demonstrate their different skills and perfect the teaching and learning of theoretical
and experimental probability.
Part 2: Establishing teams with first meeting
Since the co-researchers managed to establish people with the same interests and
common problems, it was evident that this would create a platform of people with the
same vision, which should involve all the team members’ expectations to achieve the
study objective. When members agreed on how and why they want to achieve the
study objective, the team would have an easy guide to all the activities needed to be
performed by team members. This shared visioning exercise provided a useful
framework for a team to consider and develop a coherent, shared set of
conceptualisations, goals and values for a given study. By providing an opportunity for
each team member to articulate and shape hopes and expectations for a study, it also
helps to create a culture that values the full and effective participation for teaching and
learning of experimental and theoretical probability with the use of an SVG.
125
Part 3: The significances of SWOT analysis in theoretical probability
At this stage, after team members realised their vision, they understood that to achieve
their expectation, they need members to do self-introspection. Team members then
allowed members to perform an analysis of their strengths, weaknesses, opportunities
and threats in relation to a common problem. This is how members performed self-
introspection (SWOT analysis) for the allocation of duties pertaining to the activities of
the study and the threats that can challenge the vision of the study. The strengths are
internal factors which are favourable to the study, such as members within the team
teaching particular concepts in mathematical probability. Weaknesses are internal
factors which are unfavourable condition to the study, but they can be managed based
on the study strengths. Opportunities are external factors which are favourable to the
conditions of the study, for instance to pursue members outside the school as
members to share their knowledge with other members. Threats are also external
factors which are not favourable for the study, but which can be managed when
necessary strategies are in place. A SWOT analysis gives the team an opportunity to
expand beyond the teaching fraternity to other people, whose knowledge and skills
would enable the team to achieve its objectives.
Part 4: Duties and responsibility of members in theoretical probability concepts
After the study developed a SWOT analysis of team members, the roles and
responsibilities of the team had to be drawn up to manage time effectively. The
purpose was developing roles and responsibilities, but it was restricted to external
inputs to be evaluated and implemented. This idea allowed other inputs to be
considered, because the study is guided by the principle of PAR, which supports
collaboration leadership within members. All members will also have the opportunity
to play an individual role. In this way, members have a sense of a belonging and
appreciation by other members, regardless of individual background.
Part 5: Developing activities for teaching and learning
Now that all members are clear on their vision and responsibilities, as well as SWOT
analysis, a plan of action had to be implemented. The plan of action is a detailed plan
presenting a breakdown of all the activities and how they were implemented to achieve
the objective of the study. The study started, firstly, by developing activities that were
performed during the linking of the SVG and theoretical probability to enable learners
126
to apply lessons learnt in real-life situations. Secondly, the study allocated members
who were responsible for performing the activities of the study, such as: a person
responsible for performing or facilitating the activity; the time when the activity will be
performed; what resources will be needed to perform the activity; and indicators of
success. The purpose of shared responsibility was to abide by the principle of PAR,
to ensure that the vision of the study is achieved successfully. This also reminded the
participants in the study that information cannot be extracted only from one person,
but we can always learn from other people. By so doing, each member shall improve
their CK and PCK.
Part 6: The importance of lesson demonstration
It is of the utmost importance that members, as they share responsibilities, take into
consideration that by doing so, they will be learning from each other. The concept of
theoretical probability will be clear, as members will be developing each other during
lesson facilitation. This process will not be reflected only on certain individuals.
Members will meet before lesson presentation so that they can be a part of the lesson
as well. The preparation should ensure that it improves all parts of knowledge, such
as content knowledge, pedagogical content knowledge and curriculum content
knowledge.
During lesson preparation, sharing CK should be made a priority, such as theoretical
and experimental probability concepts. This is done with the understanding that the
knowledge and skills that learners are supposed to demonstrate at the end of
schooling are embedded in the content which need well-trained educators who can
make sure learners can easily relate to it as prescribed by the curriculum policy
document. Thus, it is important that a teacher be able to interpret the content of
mathematics in relation to its content aim. However, understanding the content of
theoretical and experimental probability alone is not sufficient for a teacher. This can
be sufficient if all the teachers with best practices can ensure that they improve one
another’s CK, PCK and CCK to enable them to teach effectively. It important, as
teachers will be collaborating to ensure all the gaps are filled which are related to the
needs of learners. This exercise will be to assist teachers with new knowledge
informed by discussion of members with different experiences in theoretical
127
probability. Knowledge is a product of human activities, created through their
interactions and their interaction with the world around them.
6.5 CONCLUSION
The current chapter revealed that teachers were working individually, though they
were working in the same school. The analysis showed that teachers prepared
inadequately for the lesson, which led to difficulty for learners in comprehending basic
concepts of mathematical probability. The findings allowed team members, guided by
the principle of PAR, to decide to formulate a strategy that will improve teachers’ CK
and PCK in theoretical and experimental probability.
128
REFERENCES
Ali, I. (2014). Performance of geometry among the secondary school students of
Bhurbandha CD Block of Morigaon District, Assam, India. International Journal of
Innovative Research and Development, 3(11), 73-77.
Archer, M. (1995). Realist Social Theory: the morphogenetic approach. Cambridge:
Cambridge University Press.
Ayub, A. & Razzaq, A. (2013). A conceptual framework on evaluating SWOT analysis
as the mediator in strategic marketing planning through marketing intelligence.
European Journal of Business and Social Sciences, 2(1), 91-98.
Ball, D. L. & MacDiarmid, G. W. (1990). The subject matter preparation of teachers. In
Ball, D. L., Thames, M. H. & Phelps, G. (2008). Content knowledge for teaching: What
makes it special? Journal of Teacher Education, 59, 389-407.
Ball, D. L., Thames, M. H. & Phelps, G. (2008). Content knowledge for
teaching. Journal of Teacher Education, 59(5), 389–407.
Barrett, D. & Green, K. (2009). Pedagogical content knowledge as a foundation for an
interdisciplinary graduate program. Spring, 18(1), 17-28.
Batanero, C. (2013). Teaching and learning probability. In S. Lerman
(Ed.), Encyclopedia of Mathematics Education (pp. 491–496). Heidelberg: Springer.
Brown, G. T., Chaudhry, H. & Dhamija, R. (2015). The impact of an assessment policy
upon teachers' self-reported assessment beliefs and practices: A quasi-experimental
study of Indian teachers in private schools. International Journal of Educational
Research, 71, 50-64.
Buabeng-Andoh, C. (2012). Factors influencing teachers’ adoption and integration of
information and communication technology into teaching: A review of the literature.
Cardon, P. W. & Marshall, B. (2015). The hype and reality of social media use for work
collaboration and team communication. International Journal of Business
communication, 52(3), 273-293.
Choi, I., & Lee, K. (2008). A case-based learning environment designed for real-world
classroom management problem solving. TechTrends, 52(3), 26-31.
129
Clapton, G., & Cree, V. (2004). Integration of learning for practice: Literature review.
In Learning for effective and ethical practice. Edinburgh: Scottish Institute for
Excellence in Social Work Education.
Cook, Tina (2012). Where participatory approaches meet pragmatism in funded
(health) research: The challenge of finding meaningful spaces. Forum Qualitative
Sozialforschung / Forum: Qualitative Social Research, 13(1), Art. 18, http://nbn-
resolving.de/urn:nbn:de:0114-fqs1201187.
DBE (Department of Basic Education) (2008). Compliance with Section 16a and 58b
of the South African Schools Act, 1996 with regard to school performance and the
procedures to be followed by and for underperforming primary and secondary schools.
DBE (Department of Basic Education) (2011). Curriculum and Assessment Policy
DBE (Department of Basic Education) (2012). National protocol for assessment. South
Africa
Denzin, N. K. & Lincoln, Y. S. (2005). Introduction: The discipline and practice of
qualitative research. In N. K. Denzin & Y. S. Lincoln. The Sage Handbook of
Qualitative Research. Thousand Oaks: CA: Sage.
Denzin, N. K. & Lincoln, Y. S. (Eds). (1999). The Sage Handbook of Qualitative
Research (3rd ed.). Thousand Oaks, CA: Sage.
Denzin, N. K. (2001). The seventh moment: Qualitative inquiry and the practices of a
more radical consumer research. Journal of Consumer Research, 28(2), 324-330.
Department of Education. (2007). National Policy on Assessment and Qualifications
for Schools in the General Education and Training Band. Government Notice No. 124
in Government Gazette 29626, 12 February. Pretoria: Government Printers.
Department of Education (DoE). (2011). National Curriculum Statement Grades R-12,
11 September. Available at http://www.education.gov.za (accessed on 4 June 2012).
Dillon, J. & Wals, A. 2006. On the dangers of blurring methods, methodologies and
ideologies in environmental educational research. Journal of environmental education
research, vol 12, no. 3/4, pp. 549 – 558.
130
Dodson, L. & Schmalzbauer, L. (2005). Poor mothers and habits of hiding:
Participatory methods in poverty research. Journal of Marriage and Family, 67, 949
Doig, B. & Groves, S. (2011). Japanese lesson study: Teacher professional
development through communities of inquiry. MTED, 13(1), 77-93.
Hense, J. & Mandl, H. (2012). Learning in or with games? Quality Criteria for Digital
Houston, W.R. Handbook for research on teacher education. New York: Macmillan.
Human Geography, 22. London: Routledge. Ideologies, 11(2), 115-140.
Jita L. (2013). Teachers’ content knowledge and pedagogical content knowledge: The
role of structural differences in teacher education. Journal of Teacher Education,
64(1), 90.
Jita, L. C., Maree, J. G. & Ndlalane, T. C. (2007). Lesson study (jyugyo kenkyu).
Journal of Personality and Social Psychology 51, 1173-1182.
Kemmis, S., McTaggart, R. & Nixon, R. (2013). The action research planner: Doing
critical participatory action research. Springer Science & Business Media.
Kemmis, Stephen and McTaggart, Robin (2005). Participatory action research.
Communicative action and the public sphere. In Norman K. Denzin & Yvonne S.
Kleickmann, T., Richter, D., Kunter, M., Elsner, J., Besser, M., Krauss, S. & Baumert.
Konold, C. (1996). Representing probabilities with pipe diagrams. Mathematics
Teacher, 5,378-382.
Konold, C. (2000). Understanding students’ beliefs about probability. In Von
Glasersfeld, E. (Ed.) Radical Constructivism in Mathematics Education (pp. 139-156).
Dordrecht: Kluwer Academic Press.
Learning games from the perspectives of learning, emotion and motivation theory.
Mahlomaholo, S. & Vhonani, N. (2012). Post-apartheid organic intellectual and
knowledge creation. At the Interface/Probing the Boundaries, 78, 36-54.
McDuffie, K.A., Mastropieri, M.A. & Scruggs, T.E. (2009). Differential effects of peer
tutoring in co-taught and non-co-taught classes: Results for content learning and
student-teacher interactions. Exceptional Children, 75:493-510.

131
McDuffy, A. (2004). Mathematics teaching as a deliberate practice: An Investigation
of elementary pre-service teachers’ reflective thinking during student teaching. Journal
of Mathematics Teacher Education 7, pp. 33–61.
Minkler, M. & Wallerstein, N. (2008b). Community-based participatory research for
health: from process to outcomes (2nd ed.). San Francisco: Jossey-Bass.
Mirzaee, S. & Hamidi, H. (2012). Critical discourse analysis and Fairclough’s model.
Mishra, P. & Koehler, M. J. (2006). Technological pedagogical content knowledge: A
framework for teacher knowledge. Teachers College Record, 108(6), 1017-1054.
Parker, J. & Heywood, D. (2000). Exploring the relationship between subject
knowledge and pedagogic content knowledge in primary teachers’ learning about
forces, International Journal of Science Education, 22 (1), pp. 89-111.
Presmeg, N. C. (2006). Research on visualization in learning and teaching
mathematics, in A. Gutierrez, P. Borero (eds.) Handbook of Qualitative Health
Research, 17, 1316-1328.
Sánchez, V. & Llinares, S. (2003). Four student teachers’ pedagogical reasoning on
functions. Journal of Mathematics Teacher Education 6, pp. 5–25.
Schweisfurth, M. (2015). Learner-centred pedagogy: Towards a post-2015 agenda for
teaching and learning. International Journal of Educational Development, 40, 259-266.
Selenger, D. (1997). Participatory action research and social change. New York.
Selwood, I. & Pilkington. (2005). Teacher workload: Using ICT to release time to teach.
Shaughnessy, J. M. (1981). Misconceptions of probability: From systematic errors to
systematic experiments and decisions. In Schulte, A. P. (Ed.) Teaching Statistics and
Probability (pp. 90-99). Reston, VA: NCTM.
Shulman, L. (1986). Those who understand: Knowledge growth in teaching.
Educational Researcher, 15(2), 414.
South African Journal of Education, 34(3), 1-15.
Stacey, K., Helme, S., Steinle, V., Baturo, A., Irwin, K. & Bana, J. (2001). Pre-service
teachers’ knowledge of difficulties in decimal numeration. Journal of Mathematics
Teacher Education 4, pp. 205–225.
132
Stahl, B.C. (2004) Whose Discourse? A Comparison of the Foucauldian and
Habermasian Statement. Grades 10-12. Mathematics Studies, 45(2), 17-36.
Tella, A., Tella, A., Toyobo, O. M., Adika, L. O. & Adeyinka, A. A. (2007). An
assessment of secondary school teachers’ uses of ICTs: Implications for further
development of ICT’s use in Nigerian secondary schools. The Turkish Online Journal
of Educational Technology, 6(3), 5-17.
Van Dijk, T. A. (1993). Principles of critical discourse analysis. Discourse & Society.
Van Dijk, T. A. (2006a). Discourse and manipulation. Discourse and Society, 3(17).
Van Dijk, T. A. (2006b). Ideology and discourse analysis. London: Sage.
Van Dijk, T. A. (2007). Discourse studies (1st ed.). London: Sage.
Van Dijk, T. A. (2008a). Discourse and context. A socio-cognitive approach. London:
Sage.
Van Dijk, T. A. (2008b). Discourse and power. New York: Palgrave Macmillan.
Van Dijk, T.A. (1981). Studies in the pragmatics of discourse. The Hague/Berlin: Sage.
Watson, J.M. (1995). Conditional probability: Its place in the mathematics
curriculum. The Mathematics Teacher, 88(1), pp.12-17.

ANNEXURE A: ETHICAL CLEARANCE LETTER

ANNEXURE B: CONSENT FORM FOR PARENTS
Parental Consent Form
Dear Parent or Guardian:
My name is Glen Legodu and I am a Master’s degree student at the University of the Free State and I
am asking you to participate in a research project. I am asking your permission for your child to
participate in a focus group discussion that will take place at your child’s school. The focus group
discussion will ask questions about learners’ perceptions and experiences with the use of school
vegetable garden in mathematical probability. It is my hope that data from this focus group discussion
will contribute to a better understanding of the complexities and challenges that school vegetable
garden learning brings to a subject such as Mathematics. I hope that this information can be used to
improve the way Mathematics is being delivered at high school level in South Africa.
Your child’s responses in the focus group discussion will be kept as confidential as possible. This
means that no one outside the focus group and the researcher will know who said what and no
identifiable information will be kept. Only the researcher will know the identity of those participants in
the focus group. However, the data collected may be used in publications or presentations.
Your consent and your child’s participation are completely voluntary and your child may withdraw at
any time. There is no reward for participating or consequence for not participating. Any risks associated
with participation in the study are no greater than those of daily living. We will also seek your child’s
assent to participate before he or she begins the study.
For further information on this research please contact me at 071 7852 632
There are two copies of this letter. After signing them, keep one copy for your records and return the
other one to your child’s school.
“By signing below I agree to allow my child to participate. “
Signature: ____________________________________________________
Name (please print): __________________________________________
Date: ______________________________________________________
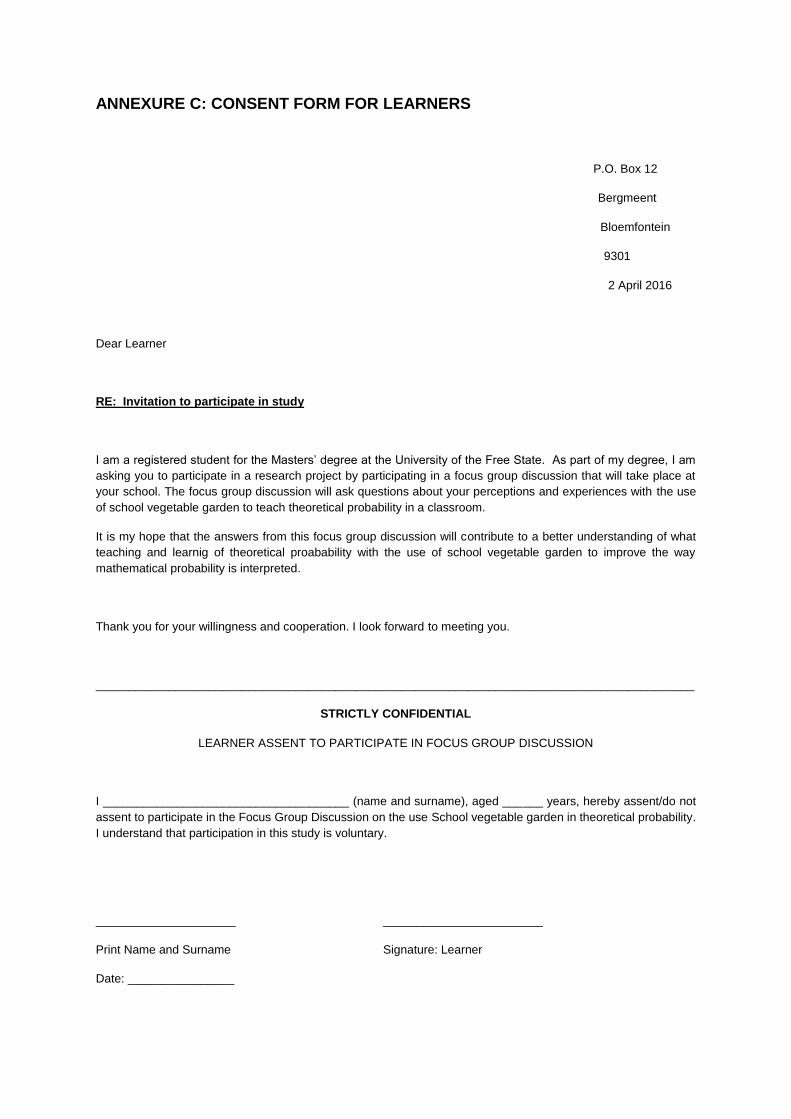
ANNEXURE C: CONSENT FORM FOR LEARNERS
P.O. Box 12
Bergmeent
Bloemfontein
9301
2 April 2016
Dear Learner
RE: Invitation to participate in study
I am a registered student for the Masters’ degree at the University of the Free State. As part of my degree, I am
asking you to participate in a research project by participating in a focus group discussion that will take place at
your school. The focus group discussion will ask questions about your perceptions and experiences with the use
of school vegetable garden to teach theoretical probability in a classroom.
It is my hope that the answers from this focus group discussion will contribute to a better understanding of what
teaching and learnig of theoretical proabability with the use of school vegetable garden to improve the way
mathematical probability is interpreted.
Thank you for your willingness and cooperation. I look forward to meeting you.
__________________________________________________________________________________________
STRICTLY CONFIDENTIAL
LEARNER ASSENT TO PARTICIPATE IN FOCUS GROUP DISCUSSION
I _____________________________________ (name and surname), aged ______ years, hereby assent/do not
assent to participate in the Focus Group Discussion on the use School vegetable garden in theoretical probability.
I understand that participation in this study is voluntary.
_____________________ ________________________
Print Name and Surname Signature: Learner
Date: ________________

ANNEXURE D: PERMISSION LETTER FOR THE SCHOOL
P.O. Box 12
Bergmeent
9301
2 April 2016
The Principal
Dear Sir/Madam
RE: Permission to undertake research at your school
I am a registered student for the Master’s degree at the University of the Free State. As part of my
degree, I need permission to conduct a research project at your school.
The title of my research is: teaching and learning of theoretical probability with the use of school
vegetable garden. The study aims to investigate the perceptions and experiences of theoretical
proability and learners on the use of SVG as a teaching aid.
Data collection will be in the form of interviews with teachers and focus group discussions with learners.
The study will be conducted on a confidential and voluntary basis, and extra care will be exercised to
ensure that the teachers, learners and the schools’ cultures and practices are respected. The exercise
will be structured around the teachers’ and learners’ schedules so that they are not inconvenienced in
their duties and responsibilities. Furthermore, the findings and recommendations from the study would
be made available to the Education Office.
Thank you and I hope to hear back from you soon with a positive response.
Yours Sincerely
……………………………………………. ……………………………………………..
Supervisor
(MEd Student)
ANNEXURE E: TRANSCRIPTS
Introduction:
Mabaso (our team leader): Bana beso kea le dumedisa bohle, kere phuthulohang le
a mohetswe kopanong ena. Sepheo sa kopano ena ke hore retlo theha maano mabapi
le ho thusa bana ka thuto ya bona ya dipalo (Mathematics). Robang monakedi mme
le iketle ele hore kopano ya rona e tsamaye hantle. Nna ke Lentikile Glen Legodu, ke
sebetsa Bainsvlei Secondary School. Ntle le moo, ke moithuti Univesity of the Free
State (ufs), ke ithutela lengolo la Masters in Education. Dithutong tsena, ho lokela hore
ho etswe diphuputso mabapi le ho ruta bana thuto ya dipalo (Mathematical Probability)
re itshetlehile ka ho sebedisa serapa sa meroho (vegetable garden) School Vegetable
Garden (SVG).
Diphutso tsena di itshetlehile sekolong sa Bainsvlei Combined School. Sekolo sa
Bainsvlei se ile sa mpha tumello ya ho tswela pele ho etsa diphuputso tsena, ka hoo
metjha yohle e hlokahalang e latetswe ho etsa diphuputso tsena. Ditokomane tsa
bopaki ke tseo jwalo ka ha le etseditswe dikhophi. Hona ditokomaneng tseo, hona le
mangolo a boitlamo le tumello eo le kupuwang ho nka karolo projekeng ena. Ke kopa
ke hona, hore ka morao ho tlhaloso ena le ntekenele mangolong ao le a fuweng. Batho
bohle ba kopuwa hore ba se tshabe ho botsa moo ba hlokang tlhakisetso.
Jwale baheso, sepheo sa projeke ena ke ho tla ka maano a ho thusa bana le
barutabana ka thuto ya dipalo (mathematics). Hona le diphuputso tse seng di entswe,
empa hona le maano a matjha ao diphuputso tsena di a tlo a fihlella. Dipalo ke thuto
engwe yadi rutwa tse fang bana mathata a mangata. Sepheo sa dithuto tsena seka
fihlellwa ha feela bohle baka nka karolo e lebelletsweng. Projeke e leka hotla ka
maano a ho ruta dipalo (theoretical/experimental probability mathematics) kaho
sebedisa serapa sa meroho(vegetable garden). Ke ye ke utwele ho thwe thuto e
tshwana le pitsa e maoto a mararo mme moo ho akaretswa bana, batswadi le
matitjhere. Projeke ena, e bohlokwa haholo hoka akaretsa tshebediso e tebileng ya
dipalo.
Mokgobo (parent member) :Feela lona matitjhere ke lona le utlwisisang dintho tsena
rona ha re tseba le ho utlwisisa thuto tsa matsatsing ana fela rena le tsebo ka tsa
temo.
Ntando: Matitjhere re na le karolo eo re e bapalang, empa batswadi le bona, setjhaba
ka kakaretso, le bona bana ba lokela ho bapala karolo e itseng. Ho bonahala hore ha
hona diphuputso tse tebileng ho sebediswa temo thutong ya dipalo. Sepheo sa
projeke ena ke ho dula fatshe ha mmoho re bontshane ka ditsela tseo reka fitlhellang
tlholo, ele ho nolofatsa le ho natefisa thuto ya bana.
Bohle: ke tsona ntate/ e hlile / hantle haholo.
Makheta: Ho salejwalo, re mona ho etsa bonnete baha hore di tabatabelo tsa
diphuputso tsena dia fihlellwa. Sena setla thusa ho fihlella sepheopheo ka ho
kenyelletsa bohle ba amahehang thutong ya bana.
Boyseen (parent member):Ke ya utlwa ntate, feela re reng ka karolo e kgolwane ya
batswadi le bana, le ona matitjhere? Na batla amohela feela maano ao le tlang ka
ona?
Kaneli (school principal): Ha ke hopola hantle tsohle tseo komiti eka di tshwaelang di
lokela ho hlomphuwa mme di kenngwe tshebetsong, hosa natse maemo a ba
tshwalag ntlheng tseo ho dumellanweng ka tsona.
Bohle: Ho a utlwahala mme / eya mme.
Ntando: Ke ya leboha.Ntlha ya bohlokwa ke hore na kaofela ha rona reka nka karolo
diphuputsog tsena? Ha hona motho ya qobelletsweng ho nka karolo diphuputing
tsena, bohle ba nang ke kgwao ba koptjwa ho itlaleha nako e sale teng.ha hona
mabitso a tla phatlalatswa qetellong ya diphuputso tsena, bohle ba tsireletsehile. Retla
tsebisa maikarabelo a rona ha re lelekela diphuputso tsa rona, eba ka mora moo, ba
nka karolo bona ha bano phatlalatswa.
Kanedi: Nna Kanedi mosuehlooho wa sekolo sena.
Kgatiti (teacher): Nna ke Kgtiti mosuwe sekolong sena
Makhata: Nna e Makhata ke mosuwe sehlopheng sa 7 le 8 (grade 7 and 8)
Mokhobo: Nna ke Mokhobo ke emong wa batswadi ba ban aba kenang sekolo mona.
Omoleomo: Nna ke moithuti sekolong sena ke etsa thuto ya dipalo.
Glen: Nna ke mosuwe sekolong ena.
Tshepo: Nna ke ngwana wa skolo hona mona Bainsvlei combined school.
Ntando: Mofuta wa research oo projeke e o latelang ke o bitswang Participatory Action
Research – (PAR) ka bokgutshwanane. O itshetlehile haholo ka dintho tse latelang:
Ho batho ba nkang karolo. Hona ho bolela hore re lebala ka maemo a rona mme re
focasa sepheong seo re batlang ho se fihlela; Re sebetsa mmoho, mme tshwaelo ya
emong le emong e bohlokwa; Mmoho re thea maano, re a kenye tshebetsong ha
mmoho le karolo e kgolwane, e be re kgutla re lekodisa tshebetso. Circle ena e a
iphethaphetha hofihlela re fihlela sepheo sa rona. Ka bokgutswane, bohle re nka
seabo.Le dikopanong tsa rona tsa kamehla, re tla fapanyetsana botsamaisi mme re
nke seabo bohle.CDA
Makheta: Ho utlwahala ho le interesting haholo.
Khatiti: Mohlomong ha re qala ka morero ona re tla dumellana le morero oa projeke,
le hoja re ikemiseditse ho nka karolo.
Tshepo: ke ne ke mpa ke botsa hore na morero ona otla nka nako ekae? Hobane le
rona re dula hole le skolo.
Mabaso: Ka kopo re ka etsa qeto ka taba ena. Ke a leboha ka potso eo …mhm…
Tshepo.
Khatiti: Kaha boholo ba rona re dula hole lesekolo ho thoeng ha re tla hang khoeling
ho qobella morero ona.
Mokgobo: Seo se utloahala ka ho lekaneng. Hobane ha rea labella hore morero ona
o ferekanya dithuto tsa bana le diphihlelo tse ding tsa bophelo tse re nang le tsona.
Mabaso: Sepheo sa seboka sena e ene e le ho tsebana, le ho tseba ho eketshehileng
ka lebaka leo re leng teng ka lona. Hae e le hantle re lokela ho kopana le ho dula
fatse ho fumana tharollo matheteng a projeke ena. Sena se tla re thusa ho tseba ho
rarolla ditaba tse tla hlaha nakong ya dipuisano tsa diboka. Retla tlameha ho dula
hammoho le ho hlahisa matla (strength) mefokolo (Weakness), menyatla
(opportunities) le matshosetsi (Threats) ho fihlela boemo bo tsitsitseng mme bo
ntlafetseng ba thuto.
Kaneli: Ho a utlwahala Ntate. Rea ho leboha ka bontsha thahasello me ke Re a leboha
ha o bontshitse thahasello e kana mmeke a dumela hore sena se tla re tswela bohle
molemo o moholo.
Mabaso: Batho ba lokileng joale re fihlile qetellong ya seboko. Re tlameha ho
dumellana hore na re ka qala ho buisana ka ditaba tsa morero wa projeke ena hape.
Khatiti: Projeke ena e utwahala ele ya bohlokwa, so, re se senye nako. Nna ke
suggesta hore re kopane in two weeks’ time.Hona hotla re fa nako yaho lo nahana ka
seo re ka se etsang.
Omolemo: Ke dumellana le Mme Khatiti.
Mabaso: Na nako e loketse ho e mong le e mong bakeng sa bohle? (Bohle: Ha ho
bothata/ Eya) Ke ya leboha bohle. A re kopaneng ka kgwedi e latelang.
ANNEXURE F: STRATEGIC PLANNING
STRATEGIC PLANNING:
Mabaso: Dumelang bomme le bontate, esita le lona bana. Um… ntle le tshenyo ya
nako ho tloha sebokong se fetileng, ke a tshepa hore bohle re utlwisisa lebaka le
morero wa hoba mona. Haeba ke mang kapa mang ya sa utloisiseng lebaka la seboka
sena, ka kopo re tsebise. Ke ya leboha, mme na ho ho supa hore bohle re utlwisisa
sepheo sa kopano ena? Bohle: E, ho jwalo re ya utlwisisa Ntate. Mabaso: Ka
bokhutsoanyane, re ikutlwa re tsoenyehile ka katleho ya sekolo sa rona ka kakaretso
empa ka ho khetheha sehlopa sa dipalo. Mme re dumellana hore ho lokela ho etswa
se seng ka hoo. Ka hoo, mmoho ke kopa hore re phuthulohe mme re kopanye dihloho
ho loha maano ao re ka a etsang ho ntlafatsa tshebetso ya baithuti ya sekolo. E seng
hoo feela, empa re etsa boiteko bo maatla ho etsa bonnete bah ore baithuti ba dule
ba tsepamisitse maikutlo le ho fumana diphello tsa boleng. Ka ho, le matichere a lokela
ho etsa karolo ya bona ho kenya letsoho ditabeng tse ntle. Pejana ke ile ka kopa
tichere ya dipalo hammoho le ntate Kaneli ka moo sekolo se sale se sebetsa ka teng.
Ha re sheba pampitshaneng tseo re nang le tsona, ke qala ka grade 9, re na le bopaki
boo re bo hlokometseng hore barutabana ba dipalo, bana le dithuswa (teaching aids)
tse ho ruta tse tla thusa baithuti ho sebetsa ka katleho.
Ha re le sehlopheng sa 9 re fumane hore dithuso tsa thuto ya dipalo dia fumaneha
empa morero wa projeke o ile wa hlokomela hore ha re na monyetla o moholo wa
dithuso (teaching aids) ho dipalo (mathemetical probabability). Disediswa tsa thuto ke
tsa bohlokwa hobane di etsa thuto ho thahasellisa esitale le taba ka boeona e
khahleha. Mathematical probability ke engowe ya sehlopha se ileng sa kenngwe
morao koano la 7 ho isa ho la 9 (Grade 7 to 9). Ka ho, sepheto sa matichere ho le wa
hlokomelwa hore menyetla oa mathematical probability o ile wa kenngoa morao
nakong ea qeta di-grees tsa matichere.
Khatiti: Ka leboha ntate, Jwalo ka ha re iponela, re bile re tseba, baheso, re lokela ho
etsa ho hong ka sona.Ke seabo se fe seo re nang le sona ntlafatsong ya maemo
ana?Mmm… ke bolela ka bo-mong le mafapheng a fapaneng ao re a e-metseng
komiting ena? Ha re phuthuloheng baheso. (Kgutso) Mohlomong re ka qala pele ka
ho shebisana ka ao re ka hopolang e le mabaka a tshebetso e sa kgotsofatseng,
haholo-holo thutong ya dipalo (mathematics).
Makheta: Engwe ea dikhopolo tseo ke nahanang hore di ka sebetsa ke nakong ea
ha re ka nka mesuoe ho ea koetlisa e le ho ba matlafatsa ka mokhoa oa ho ruta lipalo
(mathematical probability). E tlang ho ba hlahisa 'me e ka ba tumellanong le se
hlokahalang sa thuto ea morao-rao (curriculum). Mesuoe e atlehileng hantle e ka
fetisetsa tsebo ho baithuti le e ka ntlafatsang ho ruta lipalo(mathematics). Ho
sebedisoa ha meroho ea sekolo (SVG) ho tla ba bonolo ho utloisisa ha matichere a
utloisisa tsebo ea dipalo (theoretical probability).
Omolemo: Ke hlile ke rata khopolo eo, ke ikutloa eka ke tla thabela ho sebetsa le
serapa sa meroho ke sa labella (SVG). Serapa sa meroho sa sekolo (SVG) se ile sa
hlahisoa sekolong sa rona empa se ne se sa sebelisetsoe ho se ruta bana ba sekolo.
ba hlokang lijo.
lirapa tsa limela tsa sekolo li ile tsa thehoa haholo ho fa bana ba hlokang lijo.
Mokgobo: Nka ruta batho ba bangata ho jala meroho, ke sebetsa polasing e le hore
kamehla ke bolelle ngoan'a ka hore a ithute ho lema meroho ka tsela eo a tla ithuta
ho etsa dintho ka mong. Ke thabetse sena se tlisoang sekolong 'me se ruta ho itsepa.
Kaneli: ke le molaoli oa sekolo ke thabetse hore ebe re na le boikokobetso sekolong
sa ka. mohato ona oa ho etsa meriti e le sechaba, e hlileng e bonang ts'ehetso ea
batsoali ka tsela eo ke u tiisetsang hore matichere le barupeluoa ba tla ntlafatsa
tshebetso ea bona.
Mabaso: Ka leboha hlooho le basebetsi-'moho. ke nahana hore re lokela ho hlahloba
tsela e ka amanang le thuto ea lipalo (theoretical proability) le meroho ea sekolo kaha
ke e 'ngoe ea mabaka ao bohle re leng teng mona. Ke thabile hore ebe basebetsi-
'moho le bona ba tlisa tsebo ea bona e sa tšoaneng le ka hare ho sena ka pele re
lokela ho tla le maikutlo a ho phethahatsa khopolo. Re ntse re hoopla seo re se
tobileng-ntlafatso ya thuto le boemo ba yona ka kakaretso. Ke sisinya hore re ke re
qale ka ho lekola boemo boo re leng ho bona re sebedisa SWOT analysis. Mona re
tla lekola tse latelang: Matla kapa bokgoni(strength) boo matitjhere, batswadi, bana e
ka sita le community ena bo nang le bona; bokwowa kapa bofokodi-weaknesses;
menyetla(opportunities) e ka sita le matshosetsi a ka bang teng ho sitisa phihlello ya
sepheo sa rona. Ke kopa re photholohe, re arorelaneng maikutlo baheso.
Kaneli: Ntate mabaso nna ke dumela hore enngwe ya di-strength tseo re nang le
tsona ke discipline. Bonneting bana ba rona ba bontsha boitshwaro bo kgtsofatsang.
Ke nnete ho ntse ho na le mathata mona le mane, empa generally ke bana ba utlweng.
Khatiti: Ee, kedumellana le wena ntate Kaneli, le matitjhere lebona, ka nnete ba
bontsha positive attitude mosebetsing wa bona hobane bana le bana ba ba sebelisana
(co-operative). Ntho enngwe hape ke hore re na le matitjhere a qualified ho ruta
subject tsa bona mme kamehla mesuoe e teng sekolong.
Mabaso: Ke matla ha ho tluoa tabeng ea ho ba le mokhoa oa lipalo (theoretical
proability) karolong ea 9. Ke khona ho bonts'a mesuoe eohle e sa nang le tsebo e
khotsofatsang ditabeng tsa dipalo. Ke ne ke e-na le tlotla ha ke fihla sekolong ke
lefapha la thuto le nketseditse ho ea dikopanong ka monyetla wa rutwa ka tsa mofuta
o wa dipalo. Esita le mr Mokgobo o itse o tsebahala ha ho tluoa tabeng ea serapa sa
meroho. Sena se ka hlahisa kamano e ntle e ka etsang hore re lemohe pakane ea
rona ea morero. E tla boela e ntlafatse ho ruta le ho ithuta lipalo haholoanyane. Baithuti
ba tla ba le matsoho 'me ba tla khona ho sebelisa thuto eo ba ithutileng eona
bophelong ba sebele.
Kaneli: Taba ya di-text books le yona ke matla (strength) se seng hobane
bonyane boholo ba bana ba Grade 9 ba na le tsona..
Mabaso: le ha ho le jwalo, re bona tshebetso e ntse e se ntle. Bofokodi ha re itjheba
ka bomong le mafapheng ao re a emetseng, re ka re ke bofe? Khatiti: ke nahana hore
ha re impheng nako bakeng sa mosebetsi wa rona wa sekolo. Bofokodi ba rona
joaloka matichere a mathamtics ho ea ka la 7 ho isa ho la 9 ( Grade 7-9), ha re na
tsebo ea ho iketsetsa dipalo hobane ha rea e etsa sekolong sa hau sa univesithi. Sa
bobeli, re thatafalloa ho tseba ho e hlahisa eo ka dinako tse ding re sa ruteng taba ka
taba e kang ea algebra. Sa boraro, ha re na thuso e ngata ea ho ruta ho ka 'na ha e-
ba le monyetla oa ho tseba ho ka ruta dipalo. Ea bone, matla a lipalo a etsoa qetellong
ea khaolo ea lenane la 9 la thuto 'me matichere a mangata a kenyeletsa le' na hore
ha re na toka. Qetellong, ka dinako tse ling re tšaba ho ea ho Mr Mabaso hore a re
thuse ha a e-na le boitlamo ba hae empa ke na le tšepo ho tloha ha thuto e thehile
mokhoa ona oa ho ba le ditsela tsa ho rarolla taba ena leboha.
Tshepo: le hape ka nako e nngwe ha re sebetse hantle hobane re tshaba ho botsa
ha re sa utlwisise. Re tshaba ho tsheuwa kapa ho phoqwa ke matitjhere, so o ipalla o
lemong. Ke mona moo o nyahamang obe o tlohela o ikela bakgotsing. Ntswaki: feela
na ntho e yaho tsheha ka ba bang e teng, kapa le mpa le nahana hore baka le tsheha.
Tshepo: Yona e teng, empa ka nako e nngwe o tshaba feela hore ha e ka etsahala o

tlashebahala jwalo ka setlatla. Mokgobo: Ntho e 'ngoe eo ke nahanang hore bana
bana ba e hloka ke mekhoa ea ho fumana mehlodi e meng e kang dibuka tse ding. Le
rona batswadi re sitwa ho thusa bana ba rona ka dikuka ntho dithuto tsa bona. Ha re
tsebe thuto tsena tsa hona jwale ene le mosebetsi wa makgowa le ona ke on oka
mona. Rona re sebetsa ho fihlela mantsiboe ene re tjhaisa bosiu. Jwale re a lakatsa
hoba thusa empa re ha re kgone. Kaneli: Bothata bo bong ba batswadi ke boo. O tla
utlwisisa hore ha ba se ba nwele ha ba kgathalle letho la thuto ya bana ba bona mme
ba sitwa le hona ho bona ha bana ba tswa thutong, ke moo bana bana le bona ba
qalang ho nwa he le bona. Jwale bat la ithuta jwang. Makheta: Tsena ke tse fokolang
tse ka etsang hore thuto e hloke dibuka tsa thuto le boitlamo ba diithuti. Ha re qala
seboka seo re se buileng re tla hlahisa dirapa tsa dimela tsa sekolo e le thuso ea ho
ruta, kahoo ho tšoenyeha ha ka ho leng kotsi ho thuto ke ho hloka boitlamo ba
matichere, hobane bongata ba bona ba belaela ka nako ea ho ruta ka letsatsi. Hona
joale ha o nahane hore ba tla ba le dipale tsa majoe a seng makae sekolong se
khabisitsoeng e le thuso ea ho ruta? kea ipotsa hore na ba boetse ba tletleba ka
mosebetsi. tšoso e 'ngoe e ka bang le tšusumetso thutong ke ho hloka tsebo ea hore
na thuto ea dipalo e sebelisa serapa sa maoto sekolo joang
Mokgobo: Ke dumellana le Me khatiti haholo moo. Leha ho le joalo ba tla hlokana
hore ba thuse bana bana. Sena se ka etsoa hafeela re sebetsa hammoho. Menyetla
eo re nang le eona sekolong ke ho tšehetsana mme re khaotsa ho belaela ka
basebeletsi bao e seng basebetsi ba sa tšehetsang ho ruta. Re na le mesuoe e nang
le comptent e ka re bontsang tsela ea ho loka ea ho etsa lintho. Mathematics ke e
'ngoe ea taba e thata, haeba re sa hlokomele ho eona ha ho mohla re tla e fumana
hantle esita le bana ba tla lula ba loana ha ba fihla sehlopheng sa 12.
Mabaso: Re leboha basebetsi-'moho, ho bontša thahasello thutong ena re tšepa hore
bohle ba tla kenngoa ka katleho molemong oa thuto. Re ne re sebetsa hantle re
sebetsa hammoho. E hlile o fane ka ntlha e ntle eo ba bang ba rona re neng re sa e
etsbe. Ho batsoali bohle ka lebaka la ho tla, Ntate mokgobo o ile a bontša mohlokomeli
e moholo ha u bontša mokhoa oa ho lema ho barupeluoa le mesuoe eo re ithutileng
eona ho uena. Re leboha ka kaneli ka ho re bontša hore na re ka sebelisa nako joang
ka lithuso tsa ho ruta ka tlelaseng eo re e tšepang re bile re lumela hore matichere a
tla laola nako e sebetsang hantle. Ho bohle baithuti ba ka ba ileng ba kenya letsoho
thutong ena ka tšepo ea hore le tla bontša baithuti ba bang hore na ba lema joang le

hore na ba ka li phetela joang ka tlelaseng. Matichere a ileng a kenya letsoho thutong
ena ke tšepa hore lipalo ha li sa tla hlola li e-ba bosiu ha re ntse re koetlisoa nakong
ea lipuo tsa thuto. Ho leboha hape ho ba le litlhoko tse hlohonolofalitsoeng ho thusa
ba bang ha ho ntlafatsa ts'ebetso ea sekolo. Ke tšepa hore intiativet ena e qala mona
mme e fela mona re tseba hore likolo tse ling di tla ithuta ho rona. Ke leboha haholo.
KGUTSO.