Embed Size (px)
Citation preview

Ten-year time horizonbrings Goal 2025 into sharp focus
IO
An annual report from Lumina Foundation
A STRONGER
through higher education
A policy brief from Lumina Foundation
In Ohio, the ten-year time horizon brings Goal 2025 into sharp focus
Ohio
2008 2009 2010 2011 2012 2013
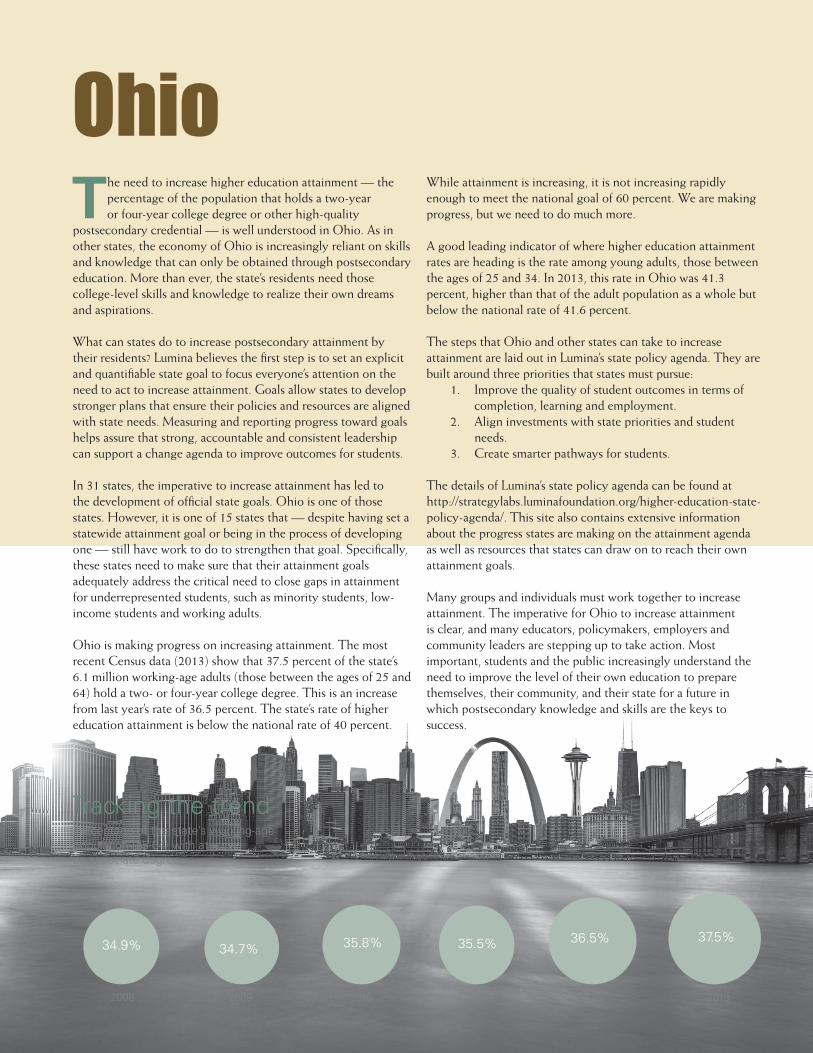
Tracking the trendPercentage of the state’s working-age population (25-64) with at leastan associate degree
The need to increase higher education attainment — the percentage of the population that holds a two-year or four-year college degree or other high-quality
postsecondary credential — is well understood in Ohio. As in other states, the economy of Ohio is increasingly reliant on skills and knowledge that can only be obtained through postsecondary education. More than ever, the state’s residents need those college-level skills and knowledge to realize their own dreams and aspirations.
What can states do to increase postsecondary attainment by their residents? Lumina believes the first step is to set an explicit and quantifiable state goal to focus everyone’s attention on the need to act to increase attainment. Goals allow states to develop stronger plans that ensure their policies and resources are aligned with state needs. Measuring and reporting progress toward goals helps assure that strong, accountable and consistent leadership can support a change agenda to improve outcomes for students.
In 31 states, the imperative to increase attainment has led to the development of official state goals. Ohio is one of those states. However, it is one of 15 states that — despite having set a statewide attainment goal or being in the process of developing one — still have work to do to strengthen that goal. Specifically, these states need to make sure that their attainment goals adequately address the critical need to close gaps in attainment for underrepresented students, such as minority students, low-income students and working adults.
Ohio is making progress on increasing attainment. The most recent Census data (2013) show that 37.5 percent of the state’s 6.1 million working-age adults (those between the ages of 25 and 64) hold a two- or four-year college degree. This is an increase from last year’s rate of 36.5 percent. The state’s rate of higher education attainment is below the national rate of 40 percent.
While attainment is increasing, it is not increasing rapidly enough to meet the national goal of 60 percent. We are making progress, but we need to do much more.
A good leading indicator of where higher education attainment rates are heading is the rate among young adults, those between the ages of 25 and 34. In 2013, this rate in Ohio was 41.3 percent, higher than that of the adult population as a whole but below the national rate of 41.6 percent.
The steps that Ohio and other states can take to increase attainment are laid out in Lumina’s state policy agenda. They are built around three priorities that states must pursue:
1. Improve the quality of student outcomes in terms of completion, learning and employment.
2. Align investments with state priorities and student needs.
3. Create smarter pathways for students.
The details of Lumina’s state policy agenda can be found at http://strategylabs.luminafoundation.org/higher-education-state-policy-agenda/. This site also contains extensive information about the progress states are making on the attainment agenda as well as resources that states can draw on to reach their own attainment goals.
Many groups and individuals must work together to increase attainment. The imperative for Ohio to increase attainment is clear, and many educators, policymakers, employers and community leaders are stepping up to take action. Most important, students and the public increasingly understand the need to improve the level of their own education to prepare themselves, their community, and their state for a future in which postsecondary knowledge and skills are the keys to success.
34.9% 34.7% 35.8% 35.5% 36.5% 37.5%
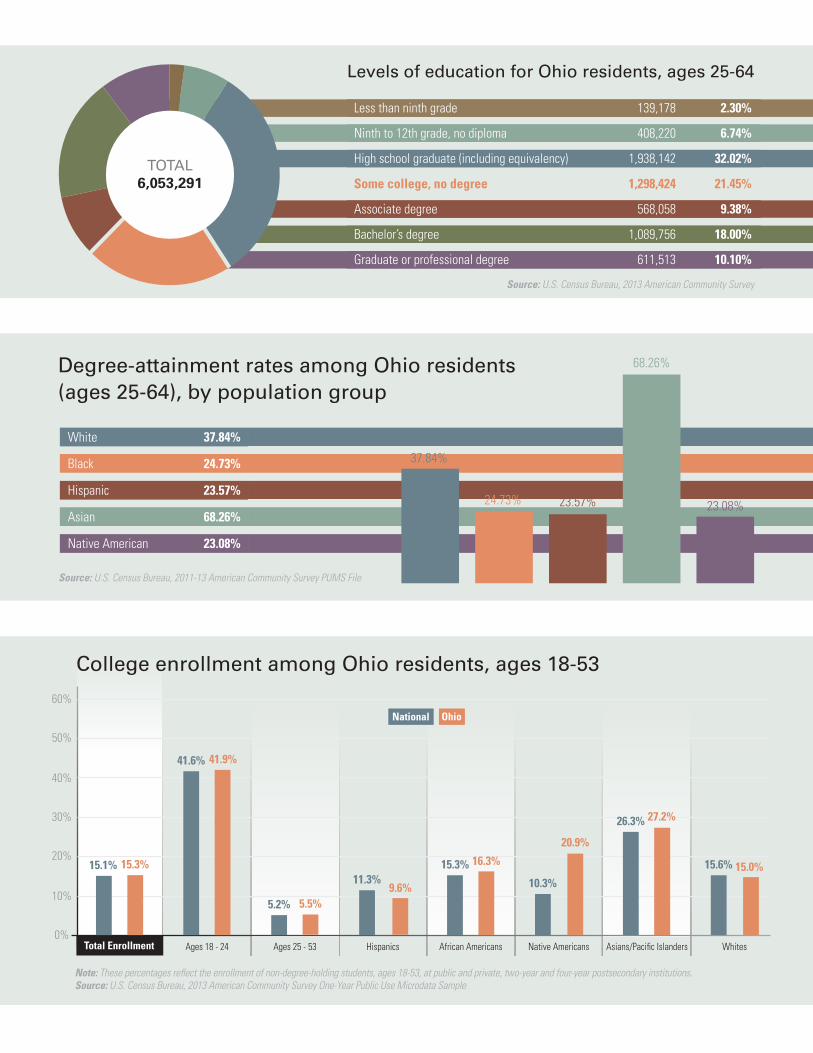
Less than ninth grade 139,178 2.30%
Ninth to 12th grade, no diploma 408,220 6.74%
High school graduate (including equivalency) 1,938,142 32.02%
Some college, no degree 1,298,424 21.45%
Associate degree 568,058 9.38%
Bachelor’s degree 1,089,756 18.00%
Graduate or professional degree 611,513 10.10%
Source: U.S. Census Bureau, 2013 American Community Survey
Levels of education for Ohio residents, ages 25-64
Degree-attainment rates among Ohio residents(ages 25-64), by population group
White 37.84%
Black 24.73%
Hispanic 23.57%
Asian 68.26%
Native American 23.08%
Source: U.S. Census Bureau, 2011-13 American Community Survey PUMS File
37.84%
24.73% 23.57%
68.26%
23.08%
TOTAL6,053,291
Note: These percentages reflect the enrollment of non-degree-holding students, ages 18-53, at public and private, two-year and four-year postsecondary institutions.Source: U.S. Census Bureau, 2013 American Community Survey One-Year Public Use Microdata Sample
Ages 18 - 24 Ages 25 - 53 Hispanics African Americans Native Americans Asians/Pacific Islanders Whites
60%
50%
40%
30%
20%
10%
0%
College enrollment among Ohio residents, ages 18-53
National Ohio
15.1%
41.6%
5.2%
11.3% 10.3%15.3%
26.3%
15.3%
41.9%
5.5%9.6%
20.9%16.3% 15.6%
27.2%
15.0%
Total Enrollment

© Lumina Foundation All rights reserved. April 2015
Lumina Foundation is an independent, private foundation committed to increasing the proportion of Americans with high-quality degrees, certificates and other credentials to 60 percent by 2025. Lumina’s outcomes-based approach focuses on helping to design and build an accessible, responsive and accountable higher education system while fostering a national sense of urgency for action to achieve Goal 2025.
Percentage of Ohio residents (ages 25-64)with at least an associate degree, by county
Source: U.S. Census Bureau, 2009-13 American Community Survey 5-Year Estimates
Adams 18.75Allen 28.54Ashland 29.19Ashtabula 21.02Athens 41.77Auglaize 30.41Belmont 28.12Brown 20.13Butler 37.66Carroll 20.21Champaign 26.73Clark 27.52Clermont 36.44Clinton 24.97Columbiana 24.31
Coshocton 22.30Crawford 23.08Cuyahoga 40.37Darke 22.16Defiance 29.67Delaware 61.39Erie 31.62Fairfield 38.57Fayette 22.36Franklin 45.71Fulton 28.87Gallia 25.53Geauga 47.22Greene 48.48Guernsey 24.33
Hamilton 43.95Hancock 38.60Hardin 21.99Harrison 21.37Henry 27.77Highland 21.16Hocking 24.94Holmes 12.97Huron 22.16Jackson 24.61Jefferson 30.03Knox 29.38Lake 37.25Lawrence 25.43Licking 33.17
Logan 22.93Lorain 34.48Lucas 34.51Madison 27.19Mahoning 31.36Marion 22.42Medina 42.76Meigs 27.07Mercer 30.09Miami 31.73Monroe 24.53Montgomery 36.15Morgan 21.06Morrow 23.06Muskingum 25.24
Noble 17.60Ottawa 32.54Paulding 23.77Perry 20.67Pickaway 24.99Pike 20.09Portage 33.75Preble 20.90Putnam 37.20Richland 26.34Ross 24.88Sandusky 26.62Scioto 24.90Seneca 27.08Shelby 25.83
Stark 32.87Summit 41.34Trumbull 27.39Tuscarawas 25.08Union 38.14Van Wert 28.40Vinton 19.86Warren 50.19Washington 29.48Wayne 28.93Williams 24.12Wood 43.35Wyandot 24.50