Embed Size (px)
Citation preview
A STRUCTURAL APPROACH TO MARKET DEFINITIONWITH AN APPLICATION TO THE HOSPITAL INDUSTRY*
MARTIN S. GAYNOR†
SAMUEL A. KLEINER‡
WILLIAM B. VOGT§
Market definition is common in merger analysis, and often the decisivefactor in antitrust cases. This has been particularly relevant in thehospital industry, where many merger challenges have been denied dueto disagreements over geographic market definition. We compare geo-graphic markets produced using frequently employed ad hoc method-ologies to structural methods that directly apply the ‘SSNIP test’ toCalifornia hospitals. Our results suggest that markets produced usingprevious methods overstate hospital demand elasticities by a factor of2.4 to 3.4 and were likely a contributing factor to the permissive legalenvironment for hospital mergers.
I. INTRODUCTION
THE ASSESSMENT OF MARKET POWER IS KEY IN ANTITRUST CASES. The goal isto assess competitive effects (Federal Trade Commission and U.S.Department of Justice, [2010]). In the past this was done in a fairly rigidway, starting with market definition, leading to measurement of marketshares and construction of concentration indices. This approach hasreceived a great deal of criticism (e.g., Kaplow [2010]; Farrell and Shapiro[2010a]), and consequently the 2010 Horizontal Merger Guidelines (Federal
*We are grateful to the Editor and two anonymous referees for suggestions that substan-tially improved the paper. Thanks are due to Rein Halbersma, R. Forrest McCluer, and MisjaMikkers for their comments and suggestions, and to Rob Jones for his computing assistance.We are grateful to Barry Harris for generously assisting us in replicating Critical LossAnalysis as used in practice in hospital antitrust cases, and to Cory Capps for generouslyassisting us with estimating the Option Demand model. All errors and opinions are the soleresponsibility of the authors.
†Authors’ affiliations: H. John Heinz III College, Carnegie Mellon University, Pittsburgh,Pennsylvania 15213, U.S.A., University of Bristol, and National Bureau of EconomicResearch.e-mail: [email protected]
‡Department of Policy Analysis and Management, Cornell University, 108 Martha VanRensselaer Hall, Ithaca, New York 14853, U.S.A., and National Bureau of EconomicResearch.e-mail: [email protected]
§Department of Economics, Terry College, University of Georgia, 513 Brooks Hall,Athens, Georgia 30602, U.S.A.e-mail: [email protected]
THE JOURNAL OF INDUSTRIAL ECONOMICS 0022-1821Volume LXI June 2013 No. 2
© 2013 The Editorial Board of The Journal of Industrial Economics and John Wiley & Sons Ltd
243
Trade Commission and U.S. Department of Justice [2010]) explicitlyintroduced greater flexibility into this process, making clear that a varietyof methods may be applied, as appropriate to the specifics of the case(Shapiro [2010a]; Farrell and Shapiro [2010b]). While the Guidelinessuggest greater flexibility, the Antitrust Division of the Department ofJustice (DOJ) and the Federal Trade Commission (FTC) have bothrecently emphasized an ongoing role for market definition (2010 Guide-lines, Section 4, Shapiro [2010b]; Fry et al. [2011], Werden [2012]), andcourts have continued to insist on the inclusion of market definition as partof the evidence base.1
While conceptually there exists an approximate consensus about howmarket definition should be done in principle (Baker [2007]), in practice,there is wide variation in how market definition is implemented in antitrustanalysis. Some ad hoc methods have been widely used in practice fordefining markets; however, a number of analysts have recently pointed outthat these methods suffer from serious flaws (Baker [2007]; Capps et al.[2002]; Danger and Frech [2001]; Frech et al. [2004]; Katz and Shapiro[2003]; Langenfeld and Li [2001]; Varkevisser et al. [2008]; Werden[1981/1990]). To our knowledge, these methods have not previously beencompared to empirical antitrust markets that are consistent with economictheory.
In this paper we analyze differences in the scope of geographic marketsdefined by ad hoc methods used in actual merger cases versus those definedusing structural models derived from economic theory, using the hospitalindustry as an illustration. We seek to better understand the extent to whichthese commonly employed methods of market definition define marketsthat are consistent with the criteria for merger analysis described in themerger guidelines.
Market definition often determines the results of antitrust cases (Kaplow[2010]; Farrell and Shapiro [2010a]; Baker [2007]; Areeda et al. [2007];Jacobson et al. [2007]; Pitofsky [1990]; Eastman Kodak Co. v. Image Tech-nical Servs., Inc., 504 U.S. 451, 469 n.15, 1992) and is the focus of intensebattles by the opposing parties. Plaintiffs claim narrower markets anddefendants broader markets (e.g., FTC v. Staples, Inc., 970 F. Supp. 1066(D.D.C. 1997); FTC v. Whole Foods Mkt. Inc.,548 F.3d 1028 (D.C. Cir.2008), United States v. Oracle, Inc., 331 F. Supp. 2d 1098 (N.D. Cal. 2004)).
1 E.g., FTC v. CCC Holdings, Inc., 605 F. Supp. 2d 26, 37, 39–40 (D.D.C. 2009), City ofNew York v. Group Health Inc., No. 10-2286-cv (2d Cir. Aug. 18, 2011); Federal TradeCommission Office of Administrative Law Judges, Docket No. 9346, In The Matter OfProMedica Health System, Inc., December 12, 2011, also Schmalensee [2009]; Kaplow [2010].This is in part because of the role of precedent in case law (e.g., United States v. E.I. du Pontde Nemours and 11 Co., 353 U.S. 586, 593 (1957), ‘Determination of the relevant market isa necessary predicate to a finding of a violation of the Clayton Act because the threatenedmonopoly must be one which will substantially lessen competition within the area of effectivecompetition.’).
MARTIN S. GAYNOR, SAMUEL A. KLEINER AND WILLIAM B. VOGT244
© 2013 The Editorial Board of The Journal of Industrial Economics and John Wiley & Sons Ltd
It is clear that an antitrust market should be defined as the set of productsand locations that exercise a significant competitive constraint on eachother (Motta [2004]). The U.S. Department of Justice introduced the‘hypothetical monopolist’ or ‘SSNIP’ test as a method for delineatingmarkets (U.S. Department of Justice [1982]), and this approach has beenadopted by competition authorities worldwide. The SSNIP (Small butSignificant and Non-transitory Increase in Price) test begins by defining anarrow market and asking whether a hypothetical monopolist in thedefined market could profitably implement a SSNIP (usually a 5% priceincrease for one year). If sufficient numbers of consumers are likely toswitch to alternative products so that the price increase is unprofitable, thenthe firm or cartel lacks the power to raise price. The relevant markettherefore needs to be expanded. The next closest substitute is added and theprocess is repeated until the point is reached where a hypothetical cartel ormonopolist could profitably impose a 5% price increase. The set ofproducts/locations so defined constitutes the relevant market.
However, while the conceptual exercise prescribed by the SSNIP test isstraightforward, in practice implementation is not. This is due in part todata limitations, and in part to analysts’ failure to utilize econometricanalysis. If one has reliable estimates of demand in hand, the SSNIP testcan be implemented in a clear-cut way that is consistent with the conceptualexercise. In the past, data limitations precluded demand estimation. Inaddition, modern econometric methods were not brought to antitrust untilapproximately 25 years ago (Scheffman and Spiller [1987]). As a conse-quence, informal methods of market definition were developed that did notrequire either extensive data or econometric methods (Elzinga and Hogarty[1973/1978]; Harris and Simons [1989]). These simple quantitativeapproaches to market definition have been widely used in antitrust analysisin part due to historical precedent, yet they have been criticized for theirstatic nature, simplifying assumptions and internal inconsistencies, all ofwhich have the potential to affect the conclusions drawn from thesemethods.
Our analysis is particularly relevant given the widespread use of these adhoc market definition methods in antitrust decisions in the hospital indus-try, where 1,425 mergers and acquisitions were successfully consummatedbetween 1994 and 2009 (Kaiser Family Foundation [2005]; Irving LevinAssociates [2007–2010]). These mergers have resulted in increases in theprice of inpatient care (Keeler et al. [1999]; Vita and Sacher [2001]; Cappset al. [2003]; Gaynor and Vogt [2003]; Dafny, [2009]), no effect or decreasesin the quality of care (Hamilton and Ho [2000]; Capps [2005]; Romano andBalan [2011]) and estimated losses of $42 billion in consumer welfare(Town et al. [2005]). While the hospital industry has seen more mergerlitigation in recent years than any other industry (American BarAssociation [2003]), the courts denied all but one government request to
A STRUCTURAL APPROACH TO MARKET DEFINITION 245
© 2013 The Editorial Board of The Journal of Industrial Economics and John Wiley & Sons Ltd
block hospital mergers from 1994–2005, due largely to the inability of theantitrust authorities to convincingly define a geographic market that sup-ports their case. In the eight cases brought to the courts during that period,the primary reason given for denying the government’s request in six ofthese cases centered on geographic market delineation. Even in recentlydecided cases in which geographic market definition was not in dispute, thepresumption of harm based on the undisputed geographic market playedan important role in each decision (In the Matter of ProMedica HealthSystem, Inc., Docket No. 9346 (Opinion of the Commission, March 28,2012), Federal Trade Commission v. OSF Healthcare System, andRockford Health System, No. 11 C 50344, April 5, 2012).2
We proceed by describing the ad hoc approaches to market definitionversus structural methods for market definition. One of the structuralapproaches is based on the familiar differentiated Bertrand oligopolymodel, and uses the methods developed by Berry, Levinsohn and Pakes[2004] and adapted for the hospital industry by Gaynor and Vogt [2003].This structural model allows for the exact implementation of the thoughtexperiment prescribed by the merger guidelines’ SSNIP test. The use ofsuch models has been promoted in the past decade as a theoretically supe-rior approach to merger analysis in differentiated product industries, (e.g.,Nevo [2000]; Motta [2004]; Baker [2007]; Geroski and Griffith [2004]; VanReenen [2004]; Ivaldi and Lorincz [2011]) however, such an approach hasnot been commonly employed in antitrust analysis, and thus little is knownabout the differences in markets produced by these methods relative to themethods used in actual merger cases.3
Using this approach, we define geographic markets in the hospital indus-try and compare the resulting markets to those produced by the techniquesthat have been used by the courts in actual hospital merger cases. We thenproceed empirically to analyze the similarities in the extent of market powerdetermined by the differentiated Bertrand model as compared to that of animportant alternative structural model of hospital competition developedby Capps et al. [2003]. This model (which we refer to as the ‘optiondemand’ model) explicitly allows for an important feature of hospitalmarkets: negotiations between insurers and hospitals. In this model, hos-pitals within a multi-hospital system bargain collectively (hospital systemsare multi-plant firms and are a prominent feature of hospital markets—nearly 60% of all hospitals are in systems). This can make the identificationof markets via the SSNIP test difficult under some circumstances. Specifi-cally, if there is a subset of system hospitals that have significant market
2 We are grateful to an anonymous referee for bringing this to our attention.3 This analysis can provide direct evidence on competitive effects without relying on market
definition, so it can be a useful component of the enforcement agencies’ set of tools. We aregrateful to an anonymous referee for emphasizing this point.
MARTIN S. GAYNOR, SAMUEL A. KLEINER AND WILLIAM B. VOGT246
© 2013 The Editorial Board of The Journal of Industrial Economics and John Wiley & Sons Ltd
overlap with an independent hospital, a merger could generate a SSNIPamong this subset of hospitals, but not for the system as a whole. Themodel is, however, particularly well-suited for identifying SSNIP marketsfor single-plant firms, and we thus compare the results of merger simula-tions for single-plant firms using the two models. Additionally, we computethe average, system-wide price increases implied by the models for multi-system mergers.
Our results suggest that the market definition techniques used in courts’decisions involving hospital mergers have defined overly expansive (geo-graphic) markets. Our analysis of California hospitals using 1995 datasuggests that markets implied by previously employed quantitative marketdefinition methods are, in the majority of cases, substantially larger thanthose that would be implied by a method rooted in the principles set forthin the merger guidelines. Furthermore, we find that both structuralmethods are consistent in their findings that hospital markets are largelylocal in nature, and differ from those produced using the methods that havehistorically been accepted as valid by the courts. While these results arespecific to the hospital industry, they suggest the existence of this phenom-enon more generally.
The paper is organized as follows. Section II provides background on themerger guidelines and their application in the hospital industry. Section IIIdiscusses quantitative approaches to market definition and outlines our useof a structural model to define geographic markets, while section IVdescribes our data. Section V describes our implementation of thesemethods and presents our results. Section VI concludes.
II. THE MERGER GUIDELINES AND MARKET DEFINITION
II(i). The Merger Guidelines
The merger guidelines are a collaborative effort by the FTC and DOJoutlining the enforcement policy of the agencies concerning horizontalacquisitions and mergers subject to section 7 of the Clayton Act, section 1of the Sherman Act, or section 5 of the FTC Act. They are considered to bethe foremost articulation of the government’s policy regarding enforcementstandards for horizontal mergers (Werden [1997]). Their purpose is toconvey the analytical framework by which the government is to go aboutdetermining the extent to which a merger is likely to lessen competition.
Though the first guidelines were released in 1968 and modified as recentlyas 2010, the thrust of the criteria for market definition was pioneeredlargely in the 1982 version, in which the guidelines focused on the centralenforcement-related question of whether a merger would result in a priceincrease through the use of the SSNIP criterion. In the SSNIP criterion, anantitrust market is defined as a group of products and a geographic area inwhich a hypothetical profit-maximizing firm, not subject to price regula-
A STRUCTURAL APPROACH TO MARKET DEFINITION 247
© 2013 The Editorial Board of The Journal of Industrial Economics and John Wiley & Sons Ltd
tion, that was the only present and future seller of those products in thatarea would impose a ‘small but significant and non-transitory increase inprice’ (SSNIP) above all prevailing or likely future levels holding constantthe terms of sale for all products produced elsewhere. As a general matter,it defined a price increase as significant if it were at least 5% and lasted forone year. The general idea in this process is to find the smallest group ofproducts or firms for which there are no close substitutes, thus allowingsuch a hypothetical monopolist to exert market power.
The development of this concept was notable in that the economic rea-soning was comprehensible to both attorneys and economists, and thetheoretical criteria for defining markets clearly articulated. Though thereare still differences in the implementation aspect of market definition analy-sis, the basis for these disagreements is typically methodological rather thanthe fundamental theoretical question of what defines a market (Scheffmanet al. [2002]). To this day the SSNIP criterion continues to be the standardby which courts define antitrust markets.
The antitrust enforcement agencies and courts ‘. . . normally considermeasures of market shares and market concentration as part of theirevaluation of competitive effects’ (Federal Trade Commission and U.S.Department of Justice [2010]). The determination of market boundariesfrom market definition directly influences these measures since it deter-mines which products or firms are in the market.4 The inclusion of manyproducts can understate market concentration, while failure to includerelevant products may overstate concentration. Likewise, the delineation ofgeographic markets can be fundamental to the determination of the degreeof market power. The inclusion of an inappropriately large number of firmscould overstate the degree of competition, while failure to incorporate allfirms involved may understate the prevailing competitive environment.
Once the market boundaries have been set, the merger guidelines specifylevels and changes in the Herfindahl-Hirschmann Index (HHI) which serveas a guide as to when mergers are likely to be anti-competitive.5 Accordingto the 2010 guidelines, markets with a post-merger HHI below 1,500 aresaid to be unconcentrated and are thus unlikely to have adverse competitiveeffects. Markets with post-merger HHI’s between 1,500 and 2,500 areregarded as moderately concentrated and are likely to warrant scrutinyonly if a merger will result in an increase in the HHI of more than 100.
4 The current (2010) guidelines offer more flexibility than in the past, in that ‘The Agencies’analysis need not start with market definition. . ..although evaluation of competitive alterna-tives available to customers is always necessary at some point in the analysis.’ (FTC/DOJ[2010] p. 7).
5 Because the thresholds set by the guidelines are intended to be a reference point, the FTChas been flexible in their enforcement of mergers conforming to these exact HHI thresholds.See Merger Challenges Data, Fiscal Years 1999–2003, at http://www.ftc.gov/os/2003/12/mdp.pdf.
MARTIN S. GAYNOR, SAMUEL A. KLEINER AND WILLIAM B. VOGT248
© 2013 The Editorial Board of The Journal of Industrial Economics and John Wiley & Sons Ltd
Mergers resulting in a post-merger HHI of above 2,500 are regarded asresulting in markets that are highly concentrated and thus mergers produc-ing an increase in HHI of between 100 and 200 are presumed to raisesignificant competitive concerns, with increases of 200 points or moredeemed likely to enhance market power.
II(ii). Application of the Merger Guidelines to Hospital Care
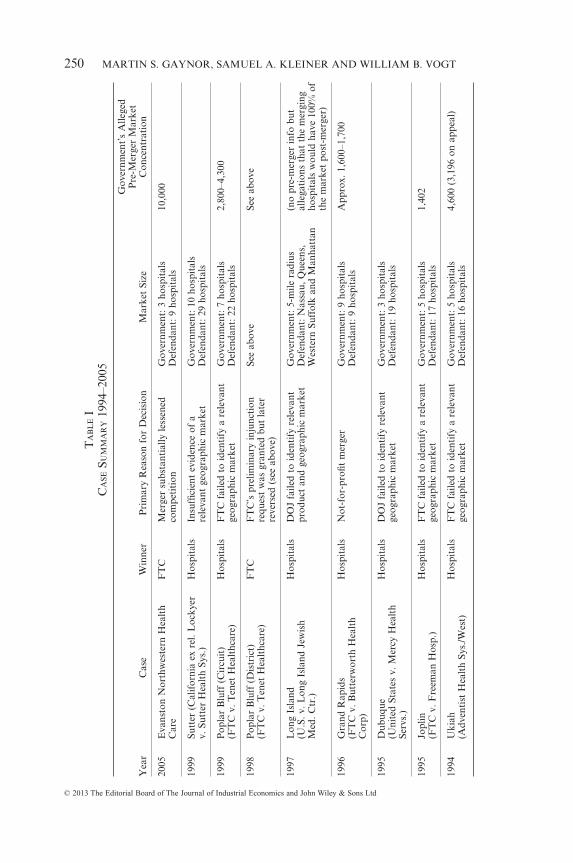
In the case of hospital care, the relevant product market has not been anissue of contention in most merger cases. The generally accepted productmarket definition has been to ‘cluster’ products, leading to a typicalproduct market definition of ‘general acute care hospital services’(American Bar Association [2003] p. 30; Frech et al. [2004]). In only one ofthe last eight cases brought by the government has failure to convincinglydefine a product market been a deciding factor in a hospital merger case(United States of America v. Long Island Jewish Medical Center andNorth Shore Health System, Inc., 983 F. Supp. 121 (1997)).
The inability to convincingly define geographic markets for hospital carewas, however, the primary determining factor in six of the government’seight unsuccessful merger challenges between 1994 and 2005. Table I pre-sents a list of these cases, as well as the size of the geographic markets andlevel of concentration in each market.
III. QUANTITATIVE APPROACHES TO GEOGRAPHIC MARKET DEFINITION
Given our application to the hospital industry and the importance ofgeographic market definition in hospital antitrust disputes, our analysisfocuses on the most widely used methods of geographic market delineationin this industry. It should be understood, however, that the general meth-odological issues are essentially the same regardless of the industry orwhether the focus is on product or geographic markets. In this section wecarefully outline the principles upon which four methods of market defini-tion are based. The first two methods that we describe, Elzinga-Hogarty(EH) and Critical Loss Analysis (CLA), rely in practice on inferring theextent of the market using shipment (discharge) data. These methods havebeen used for defining markets in merger cases involving industries such asbeer (United States v. Pabst Brewing Co., (1966)), photographic film(United States v. Eastman Kodak Co. (1995)) and software (United Statesv. Oracle Corp., (2004)), and are, to the best of our knowledge, the onlyquantitative approaches employed in hospital merger cases. We then con-trast these with two more recent models of hospital competition based onformal economic modeling and whose constructs allow for the direct deter-mination of the price effects of hospital mergers, as opposed to the more adhoc approaches embodied in the less formal shipments-based methods.
A STRUCTURAL APPROACH TO MARKET DEFINITION 249
© 2013 The Editorial Board of The Journal of Industrial Economics and John Wiley & Sons Ltd
TA
BL
EI
CA
SESU
MM
AR
Y19
94–2
005
Yea
rC
ase
Win
ner
Pri
mar
yR
easo
nfo
rD
ecis
ion
Mar
ket
Size
Gov
ernm
ent’
sA
llege
dP
re-M
erge
rM
arke
tC
once
ntra
tion
2005
Eva
nsto
nN
orth
wes
tern
Hea
lth
Car
eF
TC
Mer
ger
subs
tant
ially
less
ened
com
peti
tion
Gov
ernm
ent:
3ho
spit
als
Def
enda
nt:9
hosp
ital
s10
,000
1999
Sutt
er(C
alif
orni
aex
rel.
Loc
kyer
v.Su
tter
Hea
lth
Sys.
)H
ospi
tals
Insu
ffici
ent
evid
ence
ofa
rele
vant
geog
raph
icm
arke
tG
over
nmen
t:10
hosp
ital
sD
efen
dant
:29
hosp
ital
s
1999
Pop
lar
Blu
ff(C
ircu
it)
(FT
Cv.
Ten
etH
ealt
hcar
e)H
ospi
tals
FT
Cfa
iled
toid
enti
fya
rele
vant
geog
raph
icm
arke
tG
over
nmen
t:7
hosp
ital
sD
efen
dant
:22
hosp
ital
s2,
800–
4,30
0
1998
Pop
lar
Blu
ff(D
istr
ict)
(FT
Cv.
Ten
etH
ealt
hcar
e)F
TC
FT
C’s
prel
imin
ary
inju
ncti
onre
ques
tw
asgr
ante
dbu
tla
ter
reve
rsed
(see
abov
e)
See
abov
eSe
eab
ove
1997
Lon
gIs
land
(U.S
.v.L
ong
Isla
ndJe
wis
hM
ed.C
tr.)
Hos
pita
lsD
OJ
faile
dto
iden
tify
rele
vant
prod
uct
and
geog
raph
icm
arke
tG
over
nmen
t:5-
mile
radi
usD
efen
dant
:Nas
sau,
Que
ens,
Wes
tern
Suff
olk
and
Man
hatt
an
(no
pre-
mer
ger
info
but
alle
gati
ons
that
the
mer
ging
hosp
ital
sw
ould
have
100%
ofth
em
arke
tpo
st-m
erge
r)
1996
Gra
ndR
apid
s(F
TC
v.B
utte
rwor
thH
ealt
hC
orp)
Hos
pita
lsN
ot-f
or-p
rofit
mer
ger
Gov
ernm
ent:
9ho
spit
als
Def
enda
nt:9
hosp
ital
sA
ppro
x.1,
600–
1,70
0
1995
Dub
uque
(Uni
ted
Stat
esv.
Mer
cyH
ealt
hSe
rvs.
)
Hos
pita
lsD
OJ
faile
dto
iden
tify
rele
vant
geog
raph
icm
arke
tG
over
nmen
t:3
hosp
ital
sD
efen
dant
:19
hosp
ital
s
1995
Jopl
in(F
TC
v.F
reem
anH
osp.
)H
ospi
tals
FT
Cfa
iled
toid
enti
fya
rele
vant
geog
raph
icm
arke
tG
over
nmen
t:5
hosp
ital
sD
efen
dant
:17
hosp
ital
s1,
402
1994
Uki
ah(A
dven
tist
Hea
lth
Sys.
/Wes
t)H
ospi
tals
FT
Cfa
iled
toid
enti
fya
rele
vant
geog
raph
icm
arke
tG
over
nmen
t:5
hosp
ital
sD
efen
dant
:16
hosp
ital
s4,
600
(3,1
96on
appe
al)
MARTIN S. GAYNOR, SAMUEL A. KLEINER AND WILLIAM B. VOGT250
© 2013 The Editorial Board of The Journal of Industrial Economics and John Wiley & Sons Ltd
III(i). Elzinga-Hogarty (EH)
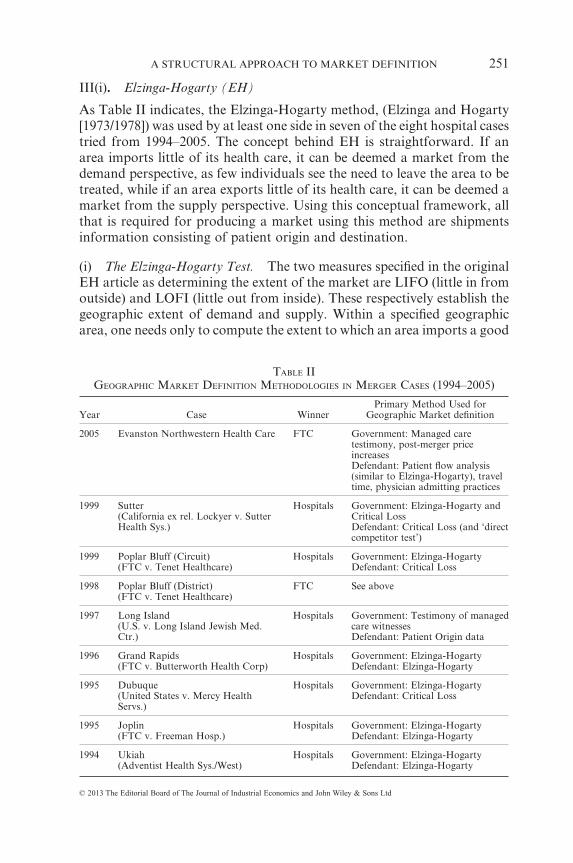
As Table II indicates, the Elzinga-Hogarty method, (Elzinga and Hogarty[1973/1978]) was used by at least one side in seven of the eight hospital casestried from 1994–2005. The concept behind EH is straightforward. If anarea imports little of its health care, it can be deemed a market from thedemand perspective, as few individuals see the need to leave the area to betreated, while if an area exports little of its health care, it can be deemed amarket from the supply perspective. Using this conceptual framework, allthat is required for producing a market using this method are shipmentsinformation consisting of patient origin and destination.
(i) The Elzinga-Hogarty Test. The two measures specified in the originalEH article as determining the extent of the market are LIFO (little in fromoutside) and LOFI (little out from inside). These respectively establish thegeographic extent of demand and supply. Within a specified geographicarea, one needs only to compute the extent to which an area imports a good
TABLE IIGEOGRAPHIC MARKET DEFINITION METHODOLOGIES IN MERGER CASES (1994–2005)
Year Case WinnerPrimary Method Used for
Geographic Market definition
2005 Evanston Northwestern Health Care FTC Government: Managed caretestimony, post-merger priceincreasesDefendant: Patient flow analysis(similar to Elzinga-Hogarty), traveltime, physician admitting practices
1999 Sutter(California ex rel. Lockyer v. SutterHealth Sys.)
Hospitals Government: Elzinga-Hogarty andCritical LossDefendant: Critical Loss (and ‘directcompetitor test’)
1999 Poplar Bluff (Circuit)(FTC v. Tenet Healthcare)
Hospitals Government: Elzinga-HogartyDefendant: Critical Loss
1998 Poplar Bluff (District)(FTC v. Tenet Healthcare)
FTC See above
1997 Long Island(U.S. v. Long Island Jewish Med.Ctr.)
Hospitals Government: Testimony of managedcare witnessesDefendant: Patient Origin data
1996 Grand Rapids(FTC v. Butterworth Health Corp)
Hospitals Government: Elzinga-HogartyDefendant: Elzinga-Hogarty
1995 Dubuque(United States v. Mercy HealthServs.)
Hospitals Government: Elzinga-HogartyDefendant: Critical Loss
1995 Joplin(FTC v. Freeman Hosp.)
Hospitals Government: Elzinga-HogartyDefendant: Elzinga-Hogarty
1994 Ukiah(Adventist Health Sys./West)
Hospitals Government: Elzinga-HogartyDefendant: Elzinga-Hogarty
A STRUCTURAL APPROACH TO MARKET DEFINITION 251
© 2013 The Editorial Board of The Journal of Industrial Economics and John Wiley & Sons Ltd
(equivalent to a patient leaving an area for their hospital care) as well as theextent to which an area exports a good (equivalent to a patient from outsidethe area receiving treatment at a hospital within an area) to define thegeographic extent of a market using these measures. Specifically, the importratio is:
import ratiopatient outflows from area of interest into another ar= eea
total discharges from area of interest
and the export ratio is:
export ratiopatient inflows from other areas into this area
total d=
iischarges from hospitals in this area
LIFO, defined as 1-(import ratio), and LOFI, defined as 1-(export ratio),must be simultaneously above a given threshold for an area to be deemeda geographic market. Thus, the larger the value of LIFO, the lower theproportion of imports into an area, and the larger the value of LOFI, thelower the proportion of exports out of an area. The specific thresholds forboth measures recommended in the original EH article are 0.75 for a ‘weakmarket’ and 0.90 for a ‘strong market.’
While the computation of LIFO and LOFI in a given area is a straight-forward task, an area in which both the LIFO and LOFI criteria aresimultaneously satisfied need not be unique. For example (using zip codesas the ‘building blocks’ with which to construct a geographic market, as iscommon in practice) suppose that for a given zip code, LIFO and/or LOFIdoes not meet the 0.75 threshold. This implies that this zip code in isolationdoes not constitute a geographic market according to the EH criteria, andthus to create a geographic market, additional zip codes need to beincluded. The choice of which zip code(s) should be incrementally added tothe initial zip code can potentially affect the size of a market and thenumber of competitors. For example, adding zip codes based on a fixedradius from an initial geographic point can produce a different market thanif one were to iteratively add zip codes based on the zip code that contrib-utes the most to either the LIFO or LOFI statistic (Frech et al., [2004]).
(ii) Limitations of Elzinga-Hogarty. While EH has frequently beenacknowledged by the courts as an acceptable method by which to definegeographic markets, there is nothing in economic analysis to justify its use;consequently, particular attention has been devoted to its limitations fordefining hospital markets.6 Patient flow methods may lead to overly expan-
6 In the most recent hospital merger case (In the Matter of Evanston NorthwesternHealthcare Corporation, Docket No. 9315, FTC August 2007) Kenneth Elzinga himselftestified that the method is not appropriate for hospital market definition (Elzinga andSwisher [2011]).
MARTIN S. GAYNOR, SAMUEL A. KLEINER AND WILLIAM B. VOGT252
© 2013 The Editorial Board of The Journal of Industrial Economics and John Wiley & Sons Ltd
sive delineation of market boundaries when product attributes are hetero-geneous in the quality or type of service offered (Werden [1990]). Forexample, patients from suburban or rural areas will often flow into anurban area to obtain more specialized care that is only available there. Thiscould lead one to erroneously conclude, based on EH analysis, that therelevant market includes both urban hospitals offering specialized services,and distant rural hospitals which offer only general services. Furthermoremarkets delineated using only patient flow data implicitly assume thattravel by some patients is indicative of the willingness of other patients totravel in a similar fashion in the event of a price increase, an assumptionthat may understate market concentration (Brief for Health Care andIndus. Org. Economists [2010]; Capps et al. [2001]). However, as Werden[1981] notes, the EH test may instead delineate overly small markets. Forexample, when firms that are close substitutes for each other but have nocross-shipments between the regions in which they are located (due toconsumers optimizing based on transportation costs), EH would errone-ously conclude that each firm and its corresponding region constitute amarket, despite the competitive constraints present due to their high cross-price elasticities.
III(ii). Critical Loss Analysis (CLA)
Critical Loss Analysis, first developed by Harris and Simons [1989], hasbeen widely employed in merger analysis since its introduction (Epstein andRubinfeld [2004]). It seeks directly to answer the question posed by themerger guidelines regarding the smallest set of products or firms that wouldhave to be included in the market to make a hypothetical price increase of5% profitable. CLA has played an important role in determining geo-graphic markets in industries such as chewing tobacco (FTC v. SwedishMatch, 131 F. Supp. 2d 151 (D.D.C. 2000)) and supermarkets (FTC v.Whole Foods Mkt., Inc., 502 F. Supp. 2d 1 (D.D.C. 2007)), and in hospitalcases such as the Dubuque, Poplar Bluff and Sutter cases detailed inTable II. In addition, in the Poplar Bluff case mentioned above, the circuitcourt gave substantial weight to the defendant’s CLA in its reversal of thedistrict court’s initial ruling (Langenfeld and Li [2001]).
(i) The CLA Test. The CLA test proceeds in three steps. For a given setof firms, the first step is to determine, for a given price increase, thepercentage reduction in demand that would render such a price increaseunprofitable. Given a constant variable unit cost, c, a pre-merger price of aproduct, p, and a pre-merger total quantity produced of q, the benefit of aprice increase to a hypothetical monopolist would be Δp[q + Δq] and thecost of such a price increase would be −(p − c)Δq, where Δp is a positivenumber and Δq is negative. Given this, the critical loss is the percentage
A STRUCTURAL APPROACH TO MARKET DEFINITION 253
© 2013 The Editorial Board of The Journal of Industrial Economics and John Wiley & Sons Ltd
reduction in quantity such that the benefit of the price increase equates tothe cost of the price increase, or that Δp[q + Δq] = −(p − c)Δq. DefiningX = Δq/q (the ‘critical loss’ or percentage reduction in quantity) andY = Δp/p (percentage increase in price), X can be written as a function of theproposed price increase and the gross margin of the firm, and is given byHarris and Simons [1989] as:
(1) XY
Y CM=
+⎡⎣⎢
⎤⎦⎥
∗100
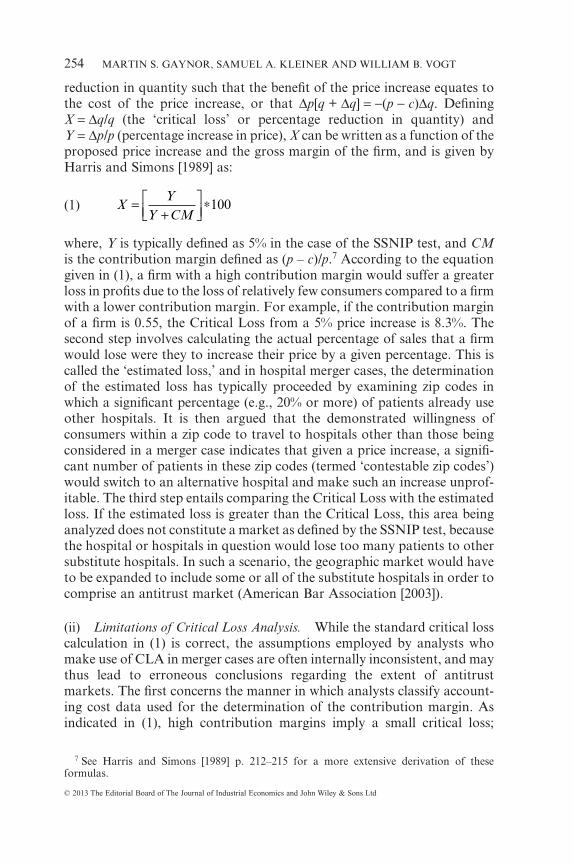
where, Y is typically defined as 5% in the case of the SSNIP test, and CMis the contribution margin defined as (p – c)/p.7 According to the equationgiven in (1), a firm with a high contribution margin would suffer a greaterloss in profits due to the loss of relatively few consumers compared to a firmwith a lower contribution margin. For example, if the contribution marginof a firm is 0.55, the Critical Loss from a 5% price increase is 8.3%. Thesecond step involves calculating the actual percentage of sales that a firmwould lose were they to increase their price by a given percentage. This iscalled the ‘estimated loss,’ and in hospital merger cases, the determinationof the estimated loss has typically proceeded by examining zip codes inwhich a significant percentage (e.g., 20% or more) of patients already useother hospitals. It is then argued that the demonstrated willingness ofconsumers within a zip code to travel to hospitals other than those beingconsidered in a merger case indicates that given a price increase, a signifi-cant number of patients in these zip codes (termed ‘contestable zip codes’)would switch to an alternative hospital and make such an increase unprof-itable. The third step entails comparing the Critical Loss with the estimatedloss. If the estimated loss is greater than the Critical Loss, this area beinganalyzed does not constitute a market as defined by the SSNIP test, becausethe hospital or hospitals in question would lose too many patients to othersubstitute hospitals. In such a scenario, the geographic market would haveto be expanded to include some or all of the substitute hospitals in order tocomprise an antitrust market (American Bar Association [2003]).
(ii) Limitations of Critical Loss Analysis. While the standard critical losscalculation in (1) is correct, the assumptions employed by analysts whomake use of CLA in merger cases are often internally inconsistent, and maythus lead to erroneous conclusions regarding the extent of antitrustmarkets. The first concerns the manner in which analysts classify account-ing cost data used for the determination of the contribution margin. Asindicated in (1), high contribution margins imply a small critical loss;
7 See Harris and Simons [1989] p. 212–215 for a more extensive derivation of theseformulas.
MARTIN S. GAYNOR, SAMUEL A. KLEINER AND WILLIAM B. VOGT254
© 2013 The Editorial Board of The Journal of Industrial Economics and John Wiley & Sons Ltd
consequently the classification of costs as fixed rather than variableincreases the contribution margin and can thus lead to the definition oflarge CLA markets. Second, as O’Brien and Wickelgren [2004] indicate,economic theory asserts that high margins are associated with more inelas-tic demand. Thus, the presence of a large contribution margin implies a lowelasticity of demand and, consequently, a small actual loss (Katz andShapiro [2003]; Danger and Frech [2001]). However, in a number of mergercases, analysts have claimed sizeable contribution margins for merginghospitals, while also arguing that significant numbers of patients wouldlikely switch to alternative hospitals in the event of a price increase (imply-ing relatively elastic demand), thereby rendering such a price increase asunprofitable. This type of misuse of CLA in antitrust has gained a sufficientmeasure of legitimacy such that ‘it is now common for people to assumethat high pre-merger margins imply broader markets and/or a smallerlikelihood of anticompetitive effects.’ (O’Brien and Wickelgren [2004]p. 184).
Furthermore, O’Brien and Wickelgren [2004] highlight the fact thatstandard CLA ignores the importance of the degree of substitutability (e.g.cross elasticities of demand) among products produced by firms contem-plating a price increase. Assuming that firms are profit maximizing, theabsence of cross-price elasticities between the locations of merging firmswould provide no incentive for the firm to raise price in the event of amerger. Alternatively, the presence of large cross-price elasticities betweenfirm locations provides an incentive for a firm to increase price. As Katzand Shapiro [2003] emphasize, this implies that the profitability of a SSNIPis thus dependent not only on profitability at a specific location, but also thefraction of lost sales diverted to other locations, since some of these lostsales will be shifted to the firm’s other locations. Thus, the failure of CLAto account for this diversion in its derivation may lead to unreliable con-clusions about the extent of market power.8
Third, as Frech et al. [2004] note, the contestable zip code method restson an assumption that is closely related to that employed in Elzinga-Hogarty analysis; specifically, both methods are based on the logical leapthat current patient flows indicate a willingness of consumers to switch toalternative hospitals in the event of a small price increase. Simpson [2003]argues that in areas deemed contestable (presumably indicating a highelasticity of demand), price increases at nearby hospitals in actuality inducevery small numbers of patients to switch, thus indicating that demand is infact less elastic in these contestable zip codes than has been claimed inhospital merger cases.
8 We thank an anonymous referee for pointing out this important limitation of CriticalLoss Analysis.
A STRUCTURAL APPROACH TO MARKET DEFINITION 255
© 2013 The Editorial Board of The Journal of Industrial Economics and John Wiley & Sons Ltd
III(iii). Market Delineation Using Structural Methods
In what follows, we outline two recently developed structural economicmodels of hospital competition that explicitly model both the individualdecisions of consumers as well as the conduct of firms. While these modelsdiffer in their setup, both enable an approach to merger analysis thatexplicitly accounts for price changes and are thus based more closely on themethod set forth by the antitrust authorities in the merger guidelines.
(i) Differentiated Bertrand Oligopoly Model (DB). Gaynor and Vogt’s[2003] adaptation for the hospital industry of the methods set forth inBerry, Levinsohn and Pakes’s [2004] model of differentiated product oli-gopoly is particularly well suited to delineating antitrust markets using theSSNIP criteria in that it is a fully specified model of price and quantitydetermination that allows for the calculation of own-price and cross-priceelasticities for each hospital in the data. This model directly estimatesdemand and supply relation parameters and builds on the work of Bakerand Bresnahan [1985], Scheffman and Spiller [1987], and Froeb andWerden [2000]. In addition, it allows for the determination of an initialequilibrium price and quantity for the market, thus allowing for directimplementation of the thought experiment characterized by the mergerguidelines. A number of papers, including work by Hausman et al. [1994],Werden and Froeb [1994], Nevo [2000], Epstein and Rubinfeld [2004], andDubé [2005] have used similar methods to analyze the price effects ofmergers and the introduction of new products (see Werden and Froeb[2008] for a detailed survey on merger simulation). Our approach is veryclose to that of Nevo [2000]. He uses the Berry, Levinsohn and Pakes [1995]random coefficients model to simulate mergers in the ready-to-eat break-fast cereal industry, and finds that the simulated price changes are close tothe actual changes.9
We employ the familiar discrete choice structural model of differentiatedproduct oligopoly with Bertrand conduct (Berry et al. [1995/2004]). In ourapplication there are micro data on individuals. This allows characteristicsat the level of individual consumers to explain hospital choice. While thissection presents the basic constructs of the model, for a full exposition,including parameter estimates, see Gaynor and Vogt [2003].
With a choice set of j (j = 1, . . . J) hospitals, the utility of consumer i (= 1,. . . ,N) is assumed to be of the form:
(2) U p p X X Xij p j j ijp
ij j ij= − − + + + +α α β γ εξ j
9 In recent papers Peters [2006] finds that merger simulation both over- and underpredictedpost-merger price changes in the airline industry. Weinberg [2011] finds that merger simula-tion underpredicts price changes for feminine hygiene products.
MARTIN S. GAYNOR, SAMUEL A. KLEINER AND WILLIAM B. VOGT256
© 2013 The Editorial Board of The Journal of Industrial Economics and John Wiley & Sons Ltd
where pj is the hospital price, αp is the marginal utility of income, X areobservable consumer characteristics, observable hospital characteristicsand their interactions, Xp are consumer and hospital characteristics inter-acted with price and ξj are unobservable hospital characteristics. Consum-ers choose the hospital j that gives them the highest utility. Assuming that∈ij is an i.i.d. extreme value random variable, hospital choice can be treatedas a multinomial logit.
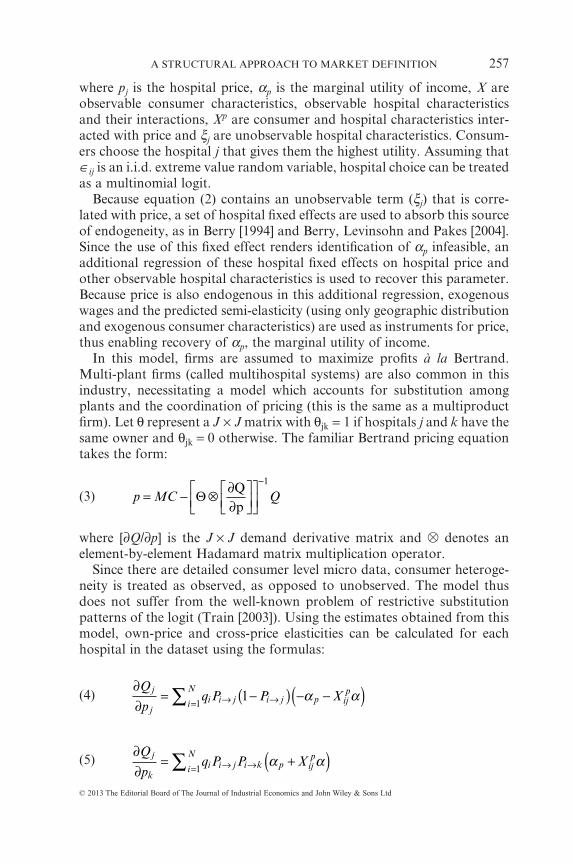
Because equation (2) contains an unobservable term (ξj) that is corre-lated with price, a set of hospital fixed effects are used to absorb this sourceof endogeneity, as in Berry [1994] and Berry, Levinsohn and Pakes [2004].Since the use of this fixed effect renders identification of αp infeasible, anadditional regression of these hospital fixed effects on hospital price andother observable hospital characteristics is used to recover this parameter.Because price is also endogenous in this additional regression, exogenouswages and the predicted semi-elasticity (using only geographic distributionand exogenous consumer characteristics) are used as instruments for price,thus enabling recovery of αp, the marginal utility of income.
In this model, firms are assumed to maximize profits à la Bertrand.Multi-plant firms (called multihospital systems) are also common in thisindustry, necessitating a model which accounts for substitution amongplants and the coordination of pricing (this is the same as a multiproductfirm). Let θ represent a J × J matrix with θjk = 1 if hospitals j and k have thesame owner and θjk = 0 otherwise. The familiar Bertrand pricing equationtakes the form:
(3) p MC Q= − ⊗ ∂∂
⎡⎣⎢
⎤⎦⎥
⎡⎣⎢
⎤⎦⎥
−
Θ Qp
1
where [∂Q/∂p] is the J × J demand derivative matrix and ⊗ denotes anelement-by-element Hadamard matrix multiplication operator.
Since there are detailed consumer level micro data, consumer heteroge-neity is treated as observed, as opposed to unobserved. The model thusdoes not suffer from the well-known problem of restrictive substitutionpatterns of the logit (Train [2003]). Using the estimates obtained from thismodel, own-price and cross-price elasticities can be calculated for eachhospital in the dataset using the formulas:
(4)∂∂
= −( ) − −( )→ →=∑Q
pq P P Xj
ji i j i j p ij
pi
N1
1α α
(5)∂∂
= +( )→ →=∑Q
pq P P Xj
ki i j i k p ij
pi
N α α1
A STRUCTURAL APPROACH TO MARKET DEFINITION 257
© 2013 The Editorial Board of The Journal of Industrial Economics and John Wiley & Sons Ltd
where (4) corresponds to the calculation of the own-price, and (5) to thecross-price elasticity.
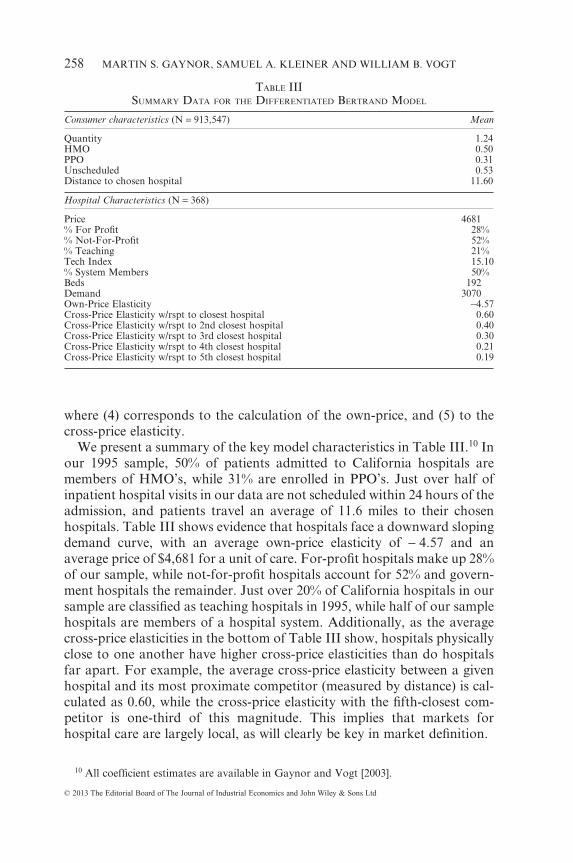
We present a summary of the key model characteristics in Table III.10 Inour 1995 sample, 50% of patients admitted to California hospitals aremembers of HMO’s, while 31% are enrolled in PPO’s. Just over half ofinpatient hospital visits in our data are not scheduled within 24 hours of theadmission, and patients travel an average of 11.6 miles to their chosenhospitals. Table III shows evidence that hospitals face a downward slopingdemand curve, with an average own-price elasticity of − 4.57 and anaverage price of $4,681 for a unit of care. For-profit hospitals make up 28%of our sample, while not-for-profit hospitals account for 52% and govern-ment hospitals the remainder. Just over 20% of California hospitals in oursample are classified as teaching hospitals in 1995, while half of our samplehospitals are members of a hospital system. Additionally, as the averagecross-price elasticities in the bottom of Table III show, hospitals physicallyclose to one another have higher cross-price elasticities than do hospitalsfar apart. For example, the average cross-price elasticity between a givenhospital and its most proximate competitor (measured by distance) is cal-culated as 0.60, while the cross-price elasticity with the fifth-closest com-petitor is one-third of this magnitude. This implies that markets forhospital care are largely local, as will clearly be key in market definition.
10 All coefficient estimates are available in Gaynor and Vogt [2003].
TABLE IIISUMMARY DATA FOR THE DIFFERENTIATED BERTRAND MODEL
Consumer characteristics (N = 913,547) Mean
Quantity 1.24HMO 0.50PPO 0.31Unscheduled 0.53Distance to chosen hospital 11.60
Hospital Characteristics (N = 368)
Price 4681% For Profit 28%% Not-For-Profit 52%% Teaching 21%Tech Index 15.10% System Members 50%Beds 192Demand 3070Own-Price Elasticity −4.57Cross-Price Elasticity w/rspt to closest hospital 0.60Cross-Price Elasticity w/rspt to 2nd closest hospital 0.40Cross-Price Elasticity w/rspt to 3rd closest hospital 0.30Cross-Price Elasticity w/rspt to 4th closest hospital 0.21Cross-Price Elasticity w/rspt to 5th closest hospital 0.19
MARTIN S. GAYNOR, SAMUEL A. KLEINER AND WILLIAM B. VOGT258
© 2013 The Editorial Board of The Journal of Industrial Economics and John Wiley & Sons Ltd
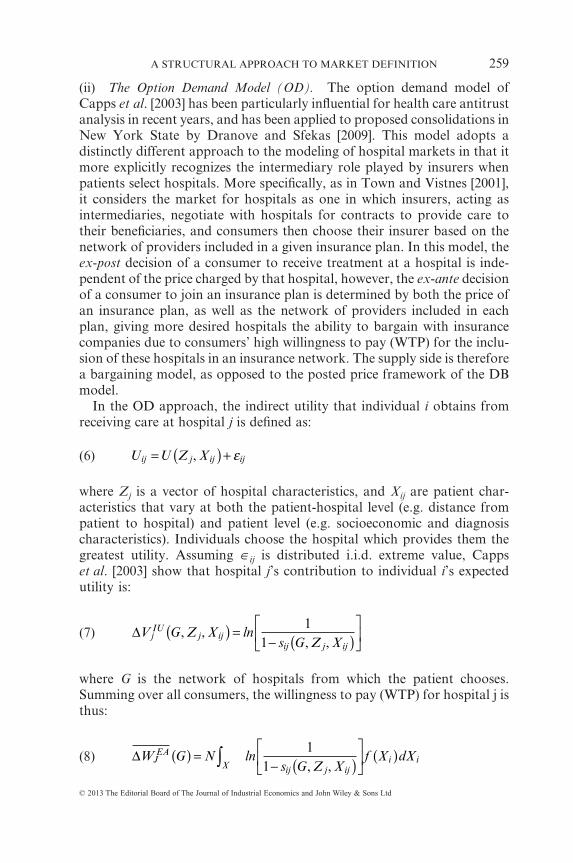
(ii) The Option Demand Model (OD). The option demand model ofCapps et al. [2003] has been particularly influential for health care antitrustanalysis in recent years, and has been applied to proposed consolidations inNew York State by Dranove and Sfekas [2009]. This model adopts adistinctly different approach to the modeling of hospital markets in that itmore explicitly recognizes the intermediary role played by insurers whenpatients select hospitals. More specifically, as in Town and Vistnes [2001],it considers the market for hospitals as one in which insurers, acting asintermediaries, negotiate with hospitals for contracts to provide care totheir beneficiaries, and consumers then choose their insurer based on thenetwork of providers included in a given insurance plan. In this model, theex-post decision of a consumer to receive treatment at a hospital is inde-pendent of the price charged by that hospital, however, the ex-ante decisionof a consumer to join an insurance plan is determined by both the price ofan insurance plan, as well as the network of providers included in eachplan, giving more desired hospitals the ability to bargain with insurancecompanies due to consumers’ high willingness to pay (WTP) for the inclu-sion of these hospitals in an insurance network. The supply side is thereforea bargaining model, as opposed to the posted price framework of the DBmodel.
In the OD approach, the indirect utility that individual i obtains fromreceiving care at hospital j is defined as:
(6) U U Z Xij j ij ij= ( ) +, ε
where Zj is a vector of hospital characteristics, and Xij are patient char-acteristics that vary at both the patient-hospital level (e.g. distance frompatient to hospital) and patient level (e.g. socioeconomic and diagnosischaracteristics). Individuals choose the hospital which provides them thegreatest utility. Assuming ∈ij is distributed i.i.d. extreme value, Cappset al. [2003] show that hospital j’s contribution to individual i’s expectedutility is:
(7) ΔV G Z Xs G Z X
jIU
j ijij j ij
, ,, ,
( ) =− ( )
⎡
⎣⎢
⎤
⎦⎥ln
11
where G is the network of hospitals from which the patient chooses.Summing over all consumers, the willingness to pay (WTP) for hospital j isthus:
(8) ΔW G Ns G Z X
f X dXJEA
ij j ijXi i( ) =
− ( )⎡
⎣⎢
⎤
⎦⎥ ( )∫ ln
11 , ,
A STRUCTURAL APPROACH TO MARKET DEFINITION 259
© 2013 The Editorial Board of The Journal of Industrial Economics and John Wiley & Sons Ltd
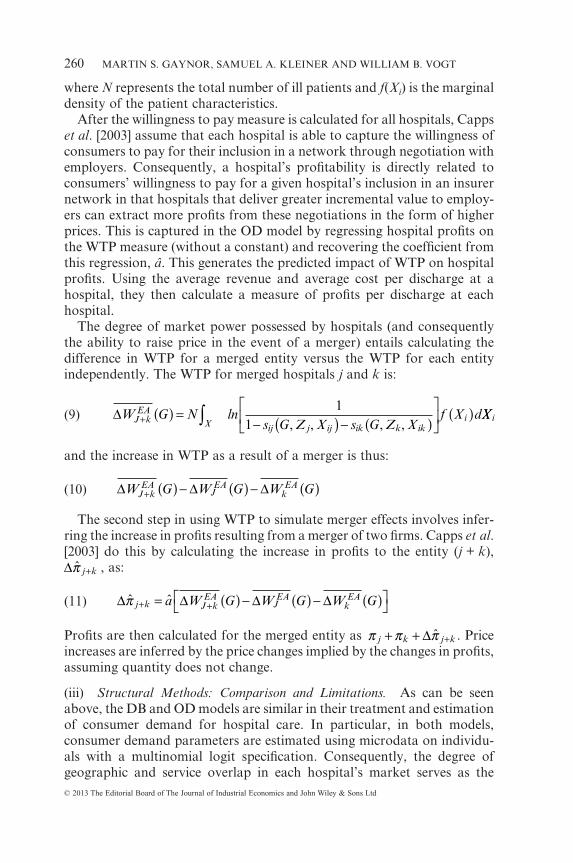
where N represents the total number of ill patients and f(Xi) is the marginaldensity of the patient characteristics.
After the willingness to pay measure is calculated for all hospitals, Cappset al. [2003] assume that each hospital is able to capture the willingness ofconsumers to pay for their inclusion in a network through negotiation withemployers. Consequently, a hospital’s profitability is directly related toconsumers’ willingness to pay for a given hospital’s inclusion in an insurernetwork in that hospitals that deliver greater incremental value to employ-ers can extract more profits from these negotiations in the form of higherprices. This is captured in the OD model by regressing hospital profits onthe WTP measure (without a constant) and recovering the coefficient fromthis regression, â. This generates the predicted impact of WTP on hospitalprofits. Using the average revenue and average cost per discharge at ahospital, they then calculate a measure of profits per discharge at eachhospital.
The degree of market power possessed by hospitals (and consequentlythe ability to raise price in the event of a merger) entails calculating thedifference in WTP for a merged entity versus the WTP for each entityindependently. The WTP for merged hospitals j and k is:
(9) ΔW G Ns G Z X s G Z X
f X dJ kEA
ij j ij ik k ikXi+ ( ) =
− ( ) − ( )⎡
⎣⎢
⎤
⎦⎥ ( )∫ ln
11 , , , ,
XXi
and the increase in WTP as a result of a merger is thus:
(10) Δ Δ ΔW G W G W GJ kEA
JEA
kEA
+ ( ) − ( ) − ( )
The second step in using WTP to simulate merger effects involves infer-ring the increase in profits resulting from a merger of two firms. Capps et al.[2003] do this by calculating the increase in profits to the entity (j + k),Δπ j k+ , as:
(11) Δ Δ Δ Δˆ ˆπ j k J kEA
JEA
kEAa W G W G W G+ += ( ) − ( ) − ( )⎡
⎣⎤⎦
Profits are then calculated for the merged entity as π π πj k j k+ + +Δ ˆ . Priceincreases are inferred by the price changes implied by the changes in profits,assuming quantity does not change.
(iii) Structural Methods: Comparison and Limitations. As can be seenabove, the DB and OD models are similar in their treatment and estimationof consumer demand for hospital care. In particular, in both models,consumer demand parameters are estimated using microdata on individu-als with a multinomial logit specification. Consequently, the degree ofgeographic and service overlap in each hospital’s market serves as the
MARTIN S. GAYNOR, SAMUEL A. KLEINER AND WILLIAM B. VOGT260
© 2013 The Editorial Board of The Journal of Industrial Economics and John Wiley & Sons Ltd
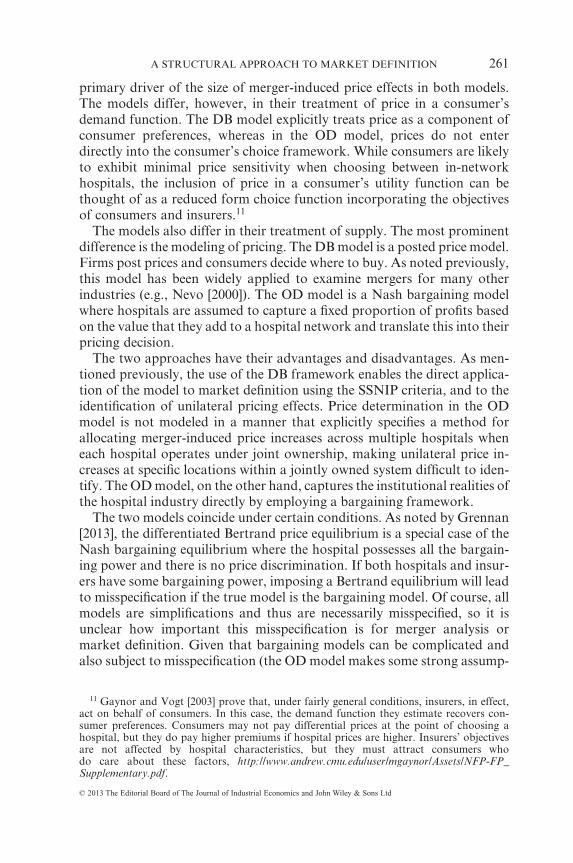
primary driver of the size of merger-induced price effects in both models.The models differ, however, in their treatment of price in a consumer’sdemand function. The DB model explicitly treats price as a component ofconsumer preferences, whereas in the OD model, prices do not enterdirectly into the consumer’s choice framework. While consumers are likelyto exhibit minimal price sensitivity when choosing between in-networkhospitals, the inclusion of price in a consumer’s utility function can bethought of as a reduced form choice function incorporating the objectivesof consumers and insurers.11
The models also differ in their treatment of supply. The most prominentdifference is the modeling of pricing. The DB model is a posted price model.Firms post prices and consumers decide where to buy. As noted previously,this model has been widely applied to examine mergers for many otherindustries (e.g., Nevo [2000]). The OD model is a Nash bargaining modelwhere hospitals are assumed to capture a fixed proportion of profits basedon the value that they add to a hospital network and translate this into theirpricing decision.
The two approaches have their advantages and disadvantages. As men-tioned previously, the use of the DB framework enables the direct applica-tion of the model to market definition using the SSNIP criteria, and to theidentification of unilateral pricing effects. Price determination in the ODmodel is not modeled in a manner that explicitly specifies a method forallocating merger-induced price increases across multiple hospitals wheneach hospital operates under joint ownership, making unilateral price in-creases at specific locations within a jointly owned system difficult to iden-tify. The OD model, on the other hand, captures the institutional realities ofthe hospital industry directly by employing a bargaining framework.
The two models coincide under certain conditions. As noted by Grennan[2013], the differentiated Bertrand price equilibrium is a special case of theNash bargaining equilibrium where the hospital possesses all the bargain-ing power and there is no price discrimination. If both hospitals and insur-ers have some bargaining power, imposing a Bertrand equilibrium will leadto misspecification if the true model is the bargaining model. Of course, allmodels are simplifications and thus are necessarily misspecified, so it isunclear how important this misspecification is for merger analysis ormarket definition. Given that bargaining models can be complicated andalso subject to misspecification (the OD model makes some strong assump-
11 Gaynor and Vogt [2003] prove that, under fairly general conditions, insurers, in effect,act on behalf of consumers. In this case, the demand function they estimate recovers con-sumer preferences. Consumers may not pay differential prices at the point of choosing ahospital, but they do pay higher premiums if hospital prices are higher. Insurers’ objectivesare not affected by hospital characteristics, but they must attract consumers whodo care about these factors, http://www.andrew.cmu.edu/user/mgaynor/Assets/NFP-FP_Supplementary.pdf.
A STRUCTURAL APPROACH TO MARKET DEFINITION 261
© 2013 The Editorial Board of The Journal of Industrial Economics and John Wiley & Sons Ltd
tions), one way to think about the posted price model is that it is a reduced-form way of capturing a complicated underlying bargaining relationship.As will be seen later, the two models’ predictions are nearly identical in ourapplication.
The two models differ in some other details. The DB model allowshospital quantity to change in the event that a hospital merger increasesprice, whereas in the OD model, merger-induced changes in market powertranslate only into profit increases, with an assumption that quantity ismaintained at its current level. The models also differ in the ways theycapture price and economic cost. In the DB model, price is captured via amethod (briefly outlined in section IV(ii)) that creates a single hospital pricefor a unit of hospital care using an output index that is normalized for eachpatient using diagnosis, demographic and hospital characteristics, whilemarginal costs are estimated via the Bertrand pricing equation. In the ODmodel, price and marginal cost are measured using accounting data foraverage revenue per admission and average cost per admission respectively.
Both models are subject to limitations imposed by the use of the logitdemand framework. The logit model has well-known limitations that canaffect merger simulation (Crooke et al. [1999]), although the use of microdata on observable consumer heterogeneity in both the DB and OD modelsgenerates richer substitution patterns than aggregate-level logit models.Separately, these models do not explicitly account for the potential forpost-merger entry or product repositioning. They are, however, well suitedto our task, which is computing equilibrium prices for a given marketstructure. In addition, each model employs a stylized form of firm conduct,which may impose limitations if neither of these models conforms to thenature of real-world competition in the hospital industry. Ultimately, whilethere are limitations to these models (as there are to all models), recentwork by Fournier and Gai [2007] and Akosa Antwi et al. [2009] find thatthese models are reasonable predictors of the price increases that occur foractual hospital mergers.
IV. DATA
We use 1995 data from California’s Office of Statewide Health Planningand Development (OSHPD) which maintains a variety of datasets onvarious aspects of health care in the state. Below we briefly describe each ofthe particular datasets we draw upon and the criteria for selecting subsetsof the data.
IV(i). Discharge Data
Each non-Federal hospital in California is required to submit dischargedata to OSHPD. Each patient discharge during a calendar year generates a
MARTIN S. GAYNOR, SAMUEL A. KLEINER AND WILLIAM B. VOGT262
© 2013 The Editorial Board of The Journal of Industrial Economics and John Wiley & Sons Ltd
separate record. Among the items collected by OSHPD for each dischargeare patient demographics (e.g. race, age, sex), diagnosis (DRG andICD9-CM codes), treatment (multiple ICD9 procedure codes), an identifierfor the hospital at which the patient sought care, the patient’s zip code ofresidence, and charges. Although the charges that appear on a patient’sdischarge record are an imperfect proxy for the exact transaction price paidto the hospital and thus cannot be used solely as a measure of transactionprice, given the way they are calculated, they are related to the amount ofcare a patient consumes and, coupled with the financial data, provide anindication of the price paid for a hospital visit. In addition, a field in thesedata describes in general terms the patient’s health insurance information(e.g., Medicare, Medicaid, Blue Cross, HMO, PPO, other private insur-ance, self-pay and ‘other’).
IV(ii). Annual and Quarterly Financial Data
Annual financial disclosures are submitted each fiscal year and every timea hospital changes ownership. From these data, we use information onlocation of the hospital, ownership of the hospital, type of care provided bythe hospital, whether the hospital is a teaching hospital or not, and wages.Quarterly financial disclosures are submitted by calendar quarters, so thatthey are synchronized both with the discharge data and with one another.Most notably, these quarterly findings include elements that allow themapping of the list ‘gross charges’ for each hospital to a measure that moreclosely proxies for the ‘net charges’ paid by insurers net of contractualdiscounts given to insurers. This allows us to deflate (at a hospital level) themeasure of charges included in the discharge data and allows for a moreaccurate measure of the transaction price paid for each patient stay.
Using this measure, a price is calculated for each hospital for use inthe DB model using a regression-based approach detailed in Gaynor andVogt [2003]. Specifically, a hospital-level measure of the ratio of net-to-gross charges is constructed using information available in the financialdata, and we assume that the quantity of care consumed by person i,qi = exp(Xiβ + vi), where Xi is a vector containing consumer characteristicsrelated to the amount of quantity of care consumed. Thus a regression ofln(pjqi) on a complete set of hospital dummy variables and consumer char-acteristics gives a set of hospital fixed effects that we use to proxy for theprice for a standardized unit of care at each hospital.
IV(iii). Selections
For 1995, there are a total of 3.6 million patient discharges. For ouranalysis we use only those discharges whose payment comes from privatesources. These are discharges in the HMO, PPO, other private, self-pay,
A STRUCTURAL APPROACH TO MARKET DEFINITION 263
© 2013 The Editorial Board of The Journal of Industrial Economics and John Wiley & Sons Ltd
and Blue Cross/Blue Shield categories. This amounts to 1.47 million dis-charges. Our motivation in making these choices is that for patients in thesecategories, some entity is making explicit choices among hospitals, based,at least in part, on price. In the case of the various insurance categories,insurers have discretion both over which hospitals to include in their net-works of approved providers and via any channeling of patients to lessexpensive hospitals. We also eliminate patients with a DRG frequency ofless than 1,000, patients with missing values for any of the variables used inany of our analyses, patients with charges less than $500 or greater than$500,000 and consumers with lengths of stay of zero or greater than 30.After all the exclusions, there are 913,547 remaining observations.
Of the 593 total hospitals in the financial data, we exclude hospitals suchas psychiatric hospitals, children’s hospitals, rehabilitation hospitals, andother specialty institutions, as well as hospitals associated with staff modelHMO’s. In addition we exclude hospitals with either missing or uselessquarterly financial data (some hospitals had larger deductions fromrevenue than they had gross revenue, for example). We also exclude hos-pitals with fewer than 100 discharges for the year. Finally, we drop hospi-tals whose closest competitor (in terms of distance) is in another state. Thisis because our data precludes us from observing hospitals in neighboringstates which could presumably be reasonable substitutes for those hospitalslocated on a state border. This leaves us with an analysis sample of 913,547discharges and 368 hospitals.
V. GEOGRAPHIC MARKETS AND HHI CALCULATIONS
In the following section, we compare markets delineated for all hospitalsin California using the three different methodologies described above,Elzinga-Hogarty, Critical Loss, and the SSNIP market definition using theDB model. Below we describe the specifics of our implementation of eachof the methods, then present the geographic markets defined using eachmethod, as well as the associated concentration measures. We then focuson a specific area (San Diego) as a way of illustrating the differencesbetween markets defined using these three methodologies, and compare theresults of merger simulations for San Diego using the DB and OD models.
V(i). Implementation
(i) Defining Markets Using Elzinga-Hogarty. While there exists no uni-versally accepted method for constructing an Elzinga-Hogarty market, forour analysis, we have developed a method that closely approximates the‘contiguous search’ algorithm, indicated by Frech et al. [2004] to producerealistic geographic markets that are compact and contiguous. Our methodproceeds, as follows: 1) Choose as a starting zip code the zip code of the
MARTIN S. GAYNOR, SAMUEL A. KLEINER AND WILLIAM B. VOGT264
© 2013 The Editorial Board of The Journal of Industrial Economics and John Wiley & Sons Ltd
hospital for which a market is to be defined. 2) Calculate LIFO and LOFIfor this zip code. 3) If either LIFO or LOFI is less than the weak marketthreshold of 0.75, one chooses the zip code that contributes most to theminimum of LIFO and LOFI, from the universe of zip codes contiguous tothe zip code of interest. For each additional zip code, zj, that is contiguousto the combination of zip codes already included in the service area fromprevious iterations, z−j, zip code zi is added, one at a time if it satisfies (foreach iteration)12:
z LIFO z z LOFI z z zi j j j j j= ( )[ ] ( )[ ]{ }∀− −min max , , max ,
We continue to add zip codes using this algorithm until both the LIFO andLOFI are simultaneously greater than 0.75.
(ii) Defining Markets Using Critical Loss. Our analysis of CLA closelyfollows the contestable zip code method used in hospital antitrust cases anddiscussed in section III(ii)(i). Given that our goal is to approximate CLAmarkets as determined by previous cases, we base our assumptions onprevious judicial decisions in which CLA was utilized. Though the esti-mated loss number is not clearly defined and could vary by case, we baseour estimated loss numbers on the determination in the Sutter case (seeTable I) that suggested that the number of patients traveling into the pro-posed market that would have to switch is between one-third and two-thirds (Langenfeld and Li [2001]).
Given that the court ruled in favor of the defendant, we interpret thisfigure to be indicative of the court’s conclusion of the likely substitutionpatterns of hospital patients.13 In actual cases, a hospital’s contributionmargin has been assumed to range from 41.4% in State of California v. SutterHealth System to 65.9% in FTC v. Tenet (Langenfeld and Li [2001]). In oursimulation of CLA, we apply a contribution margin of 55%, which implies aCritical Loss of approximately 8.3% for a 5% increase in price. We define zipcodes as contestable if 25% or more patients travel to hospitals other thanthose being defined in a hypothetical merger, an admittedly conservativeassumption, given the use of a 20% contestable zip code threshold in thePoplar Bluff case (Scheffman et al. [2002]). Finally, we assume that of thepatients that currently receive care at one of the merging hospitals, 30% ofthese patients from zip codes deemed contestable (i.e., zip codes that have atleast 25% outflows under the pre-merger terms of sale) would substitute to
12 Because of data limitations, we use a fixed radius between zip code centroids to create theuniverse of zip codes by which to expand the market, rather than shared zip code borders.
13 We do acknowledge, however that the number of patients that were determined to travelinto the market accounted for only 15% of the total discharges in question. The set ofcontestable zip codes often does constitute a larger subset of discharges than was determined‘out of the market’ in the Sutter case.
A STRUCTURAL APPROACH TO MARKET DEFINITION 265
© 2013 The Editorial Board of The Journal of Industrial Economics and John Wiley & Sons Ltd
another hospital as a result of a 5% increase in price. Thus, our exactalgorithm for implementing critical loss proceeds as follows:
1. Start with a hospital and the hospital closest to this hospital.2. Find the universe of Diagnosis Related Groups (DRG) served by the
hospitals chosen.14
3. Find the contestable zip codes given this universe of DRG’s, given our25% threshold.
4. Calculate the actual loss by assuming that 30% of the patients currentlyattending the hospitals of interest in the contestable zip codes acquiretheir care elsewhere.
5. Compare the loss calculated in (4) to the critical loss figure of 8.3% oforiginal demand. If actual loss is greater than critical loss, we add thenext closest hospital and repeat steps 1–4. If not, the set of hospitals isdetermined to be a market.
(iii) Geographic Market Definition Using the Differentiated BertrandModel. A distinct advantage of using the DB model to define SSNIPmarkets is that it can explicitly account for the response of consumers toprice changes using available data, rather than relying on imperfect proxies,such as patient flows. The DB model in particular is well suited to imple-menting the SSNIP test for geographic markets, as the price paid by aconsumer directly affects hospital choice in this setup, thereby enabling thedirect application of the thought experiment prescribed by the mergerguidelines. In order to define geographic markets that conform to theMerger Guidelines using this model, we define the SSNIP test for a givenhospital as the smallest set of hospitals (inclusive of the hospitals for whichwe are attempting to define a SSNIP market) for which a given priceincrease would be profitable, holding constant price at all other hospitals.Intuitively, the SSNIP criterion states that for a given hospital, j, a SSNIPmarket is the smallest set of hospitals for which an increase in price at thisset of hospitals (including hospital j) would increase the collective profits inthe systems of which these hospitals are members. This approach allows forthe definition of geographic markets that take into account system mem-bership, making it consistent with the current (2010) revision of the mergerguidelines in its explicit treatment of firms that own multiple plants in thesame geographic area.
To illustrate the criterion, consider four hospitals, A, B, C and D, and letA and B be members of the same hospital system. Suppose hospitals A andC act as a ‘hypothetical monopolist’ and increase the price of their services
14 The inclusion of this step was due to our desire to make the algorithm correspond asclosely as possible to methods used in antitrust cases. The inclusion of all DRG’s in ouralgorithm produces critical loss markets of very similar size.
MARTIN S. GAYNOR, SAMUEL A. KLEINER AND WILLIAM B. VOGT266
© 2013 The Editorial Board of The Journal of Industrial Economics and John Wiley & Sons Ltd
by 5% (holding the terms of sale constant at all other locations), resultingin a decrease in demand at both hospitals and a decrease in profits at thecombined hospital entity of A and C. Suppose, however, that B is a suffi-ciently adequate substitute for care at these hospitals so that the increase inprofits as a result of the increase in demand for hospital B’s services isgreater than the decrease in profits at the combined hospital entity of A andC. Hospitals A and C would be a market under the SSNIP criterion, as thecollective profits in the systems of which these hospitals are members hasincreased. Likewise, if hospital D is a close substitute for the care renderedat A and C while hospital B is not, hospital B would see little or no increasein demand or profits and thus hospitals A and C would not be considereda market according to the SSNIP criterion.
In the event that a price increase at a given location results in a reductionof sales sufficiently large enough such that a hypothetical monopolistwould not find it profitable to impose an increase in price, the mergerguidelines suggest adding the location from which production is the next-best substitute for production at the merging firm’s location. Becausespatial differentiation is an important attribute of hospital care, when aSSNIP is not profitable, we include additional hospitals in order of theirgeographic proximity to the location of the merging hospital(s) in question.While this market expansion criteria is likely to lead to markets that arelarger than if we were to expand based purely on ‘next best’ substitution,this algorithm ensures that comparisons of the various market definitionmethods are uniform, since neither EH nor CLA allows for the expansionof markets based on diversion ratios or cross-price elasticities, but doesallow for expansion based on geographic distance. Our algorithm forimplementing SSNIP markets using the DB model (SSNIP Market Defi-nition) is as follows:
1. Begin with a hospital for which one would like to define a geographicmarket.
2. Find the hospital geographically closest to the hospital chosen in step 1.3. Raise the price of only these hospitals by a given percentage (we use 5%)
and allow demand to change as a result of the price increase.15
4. If the total difference in profits for the hospital system (given diversionto other hospitals in the same system) is positive, this constitutes a
15 Since we use current prices, we note the possibility of a ‘cellophane fallacy effect’ forhospitals that already exercise considerable market power. As Werden [2000] says, ‘When afirm has already raised price substantially above competitive levels, it makes no sense todetermine whether that firm is a monopoly by asking if it could increase its profits throughfurther price increases.’ If there is a cellophane effect it will have the impact of makingmarkets defined using prevailing prices too big. We retain the use of current prices in order tofacilitate comparison with the other methods and for consistency with the Merger Guidelines(Federal Trade Commission and U.S. Department of Justice [2010], Section 4.1.2, p. 10). Inaddition, this leads to conservative comparisons between SSNIP and EH and CLA markets.We are grateful to an anonymous referee for drawing our attention to this point.
A STRUCTURAL APPROACH TO MARKET DEFINITION 267
© 2013 The Editorial Board of The Journal of Industrial Economics and John Wiley & Sons Ltd
market by the SSNIP test. If it does not, we add the next hospital that isgeographically closest to the hospital in step 1.
We repeat this process until the increase in price for the chosen hospitalsresults in a positive difference in profits.
(iv) Defining Markets Using the Option Demand Model. While the deline-ation of SSNIP markets for independently owned hospitals using the ODmodel is straightforward, the structure of the OD model is such that theidentification of SSNIP markets for individual hospitals operating as partof a jointly owned hospital system is difficult, since multi-hospital systemsare assumed to bargain as a unit. Within the framework of Capps et al.[2003], if the OD model is estimated on a set of hospitals already operatingunder joint ownership, the allocation to any single within-system hospitalof the system-wide willingness to pay (from equation 8), is not explicitlydefined. Thus for a merger of a hospital system and an unaffiliated hospitalwhere only a subset of the system hospitals have substantial geographic andservice overlap with the unaffiliated hospital, there exists no straightfor-ward manner by which to allocate the price effects of the merger to indi-vidual hospital locations within the system. Consequently, while a systemcan be combined and treated as a single hospital within the OD framework(as we do in section V(v)), a SSNIP market definition algorithm based onthe identification of individual hospital-level price increases cannot bedirectly applied using this model. However, we can determine the model’slikely conclusions about the size of SSNIP markets by comparing the extentto which the OD model produces price increases similar in magnitude tothose of the DB model via merger simulation. While this does not allow forthe direct delineation of geographic markets for individual hospitals withina system, it provides insight into whether these models differ in theirassessment of the likelihood of a price increase in the event of a merger. Weaddress this issue in detail in section V(v) below.
V(ii). Statewide Analysis
Table IV reveals substantial differences in the markets defined by the meth-odologies in both the number of hospitals in each market, as well as thedegree of concentration as defined by both the hospital-based HHI andhospital system-based HHI (in the discussion that follows, we reference thesystem-based calculations). SSNIP market definition using the DB model(termed ‘SSNIP Mkt. Def.’ in the tables) determines that the median hos-pital in California operates in a market of 3 hospitals with an HHI of3,814.16 This is well above the threshold determined by the merger guide-
16 We use available beds in our calculation of HHI by market. The correlation betweenbeds, total discharges and total patient days and other standard measures of hospital outputis above .9 for all measures.
MARTIN S. GAYNOR, SAMUEL A. KLEINER AND WILLIAM B. VOGT268
© 2013 The Editorial Board of The Journal of Industrial Economics and John Wiley & Sons Ltd
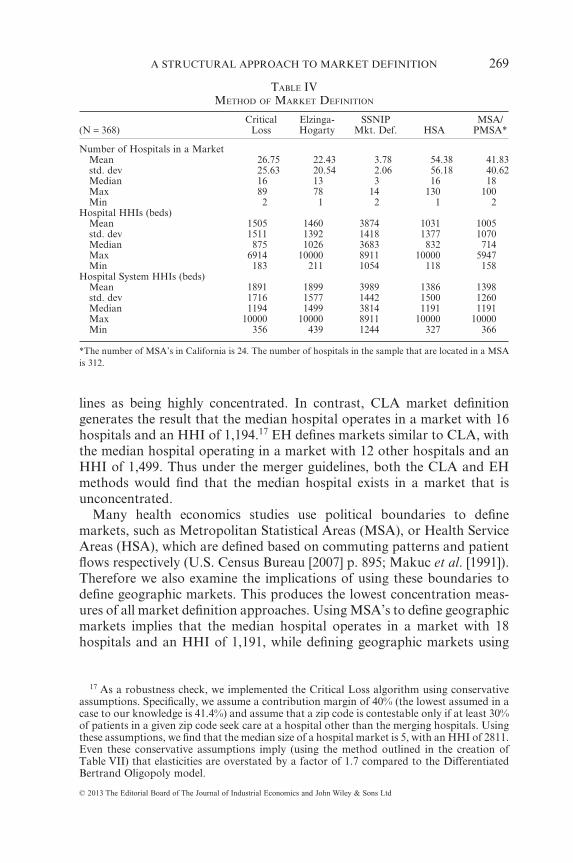
lines as being highly concentrated. In contrast, CLA market definitiongenerates the result that the median hospital operates in a market with 16hospitals and an HHI of 1,194.17 EH defines markets similar to CLA, withthe median hospital operating in a market with 12 other hospitals and anHHI of 1,499. Thus under the merger guidelines, both the CLA and EHmethods would find that the median hospital exists in a market that isunconcentrated.
Many health economics studies use political boundaries to definemarkets, such as Metropolitan Statistical Areas (MSA), or Health ServiceAreas (HSA), which are defined based on commuting patterns and patientflows respectively (U.S. Census Bureau [2007] p. 895; Makuc et al. [1991]).Therefore we also examine the implications of using these boundaries todefine geographic markets. This produces the lowest concentration meas-ures of all market definition approaches. Using MSA’s to define geographicmarkets implies that the median hospital operates in a market with 18hospitals and an HHI of 1,191, while defining geographic markets using
17 As a robustness check, we implemented the Critical Loss algorithm using conservativeassumptions. Specifically, we assume a contribution margin of 40% (the lowest assumed in acase to our knowledge is 41.4%) and assume that a zip code is contestable only if at least 30%of patients in a given zip code seek care at a hospital other than the merging hospitals. Usingthese assumptions, we find that the median size of a hospital market is 5, with an HHI of 2811.Even these conservative assumptions imply (using the method outlined in the creation ofTable VII) that elasticities are overstated by a factor of 1.7 compared to the DifferentiatedBertrand Oligopoly model.
TABLE IVMETHOD OF MARKET DEFINITION
(N = 368)Critical
LossElzinga-Hogarty
SSNIPMkt. Def. HSA
MSA/PMSA*
Number of Hospitals in a MarketMean 26.75 22.43 3.78 54.38 41.83std. dev 25.63 20.54 2.06 56.18 40.62Median 16 13 3 16 18Max 89 78 14 130 100Min 2 1 2 1 2
Hospital HHIs (beds)Mean 1505 1460 3874 1031 1005std. dev 1511 1392 1418 1377 1070Median 875 1026 3683 832 714Max 6914 10000 8911 10000 5947Min 183 211 1054 118 158
Hospital System HHIs (beds)Mean 1891 1899 3989 1386 1398std. dev 1716 1577 1442 1500 1260Median 1194 1499 3814 1191 1191Max 10000 10000 8911 10000 10000Min 356 439 1244 327 366
*The number of MSA’s in California is 24. The number of hospitals in the sample that are located in a MSAis 312.
A STRUCTURAL APPROACH TO MARKET DEFINITION 269
© 2013 The Editorial Board of The Journal of Industrial Economics and John Wiley & Sons Ltd
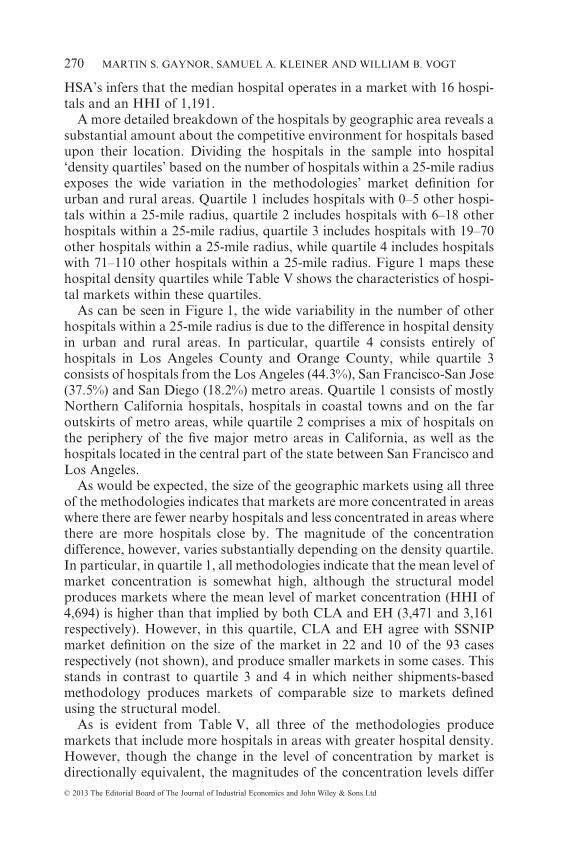
HSA’s infers that the median hospital operates in a market with 16 hospi-tals and an HHI of 1,191.
A more detailed breakdown of the hospitals by geographic area reveals asubstantial amount about the competitive environment for hospitals basedupon their location. Dividing the hospitals in the sample into hospital‘density quartiles’ based on the number of hospitals within a 25-mile radiusexposes the wide variation in the methodologies’ market definition forurban and rural areas. Quartile 1 includes hospitals with 0–5 other hospi-tals within a 25-mile radius, quartile 2 includes hospitals with 6–18 otherhospitals within a 25-mile radius, quartile 3 includes hospitals with 19–70other hospitals within a 25-mile radius, while quartile 4 includes hospitalswith 71–110 other hospitals within a 25-mile radius. Figure 1 maps thesehospital density quartiles while Table V shows the characteristics of hospi-tal markets within these quartiles.
As can be seen in Figure 1, the wide variability in the number of otherhospitals within a 25-mile radius is due to the difference in hospital densityin urban and rural areas. In particular, quartile 4 consists entirely ofhospitals in Los Angeles County and Orange County, while quartile 3consists of hospitals from the Los Angeles (44.3%), San Francisco-San Jose(37.5%) and San Diego (18.2%) metro areas. Quartile 1 consists of mostlyNorthern California hospitals, hospitals in coastal towns and on the faroutskirts of metro areas, while quartile 2 comprises a mix of hospitals onthe periphery of the five major metro areas in California, as well as thehospitals located in the central part of the state between San Francisco andLos Angeles.
As would be expected, the size of the geographic markets using all threeof the methodologies indicates that markets are more concentrated in areaswhere there are fewer nearby hospitals and less concentrated in areas wherethere are more hospitals close by. The magnitude of the concentrationdifference, however, varies substantially depending on the density quartile.In particular, in quartile 1, all methodologies indicate that the mean level ofmarket concentration is somewhat high, although the structural modelproduces markets where the mean level of market concentration (HHI of4,694) is higher than that implied by both CLA and EH (3,471 and 3,161respectively). However, in this quartile, CLA and EH agree with SSNIPmarket definition on the size of the market in 22 and 10 of the 93 casesrespectively (not shown), and produce smaller markets in some cases. Thisstands in contrast to quartile 3 and 4 in which neither shipments-basedmethodology produces markets of comparable size to markets definedusing the structural model.
As is evident from Table V, all three of the methodologies producemarkets that include more hospitals in areas with greater hospital density.However, though the change in the level of concentration by market isdirectionally equivalent, the magnitudes of the concentration levels differ
MARTIN S. GAYNOR, SAMUEL A. KLEINER AND WILLIAM B. VOGT270
© 2013 The Editorial Board of The Journal of Industrial Economics and John Wiley & Sons Ltd
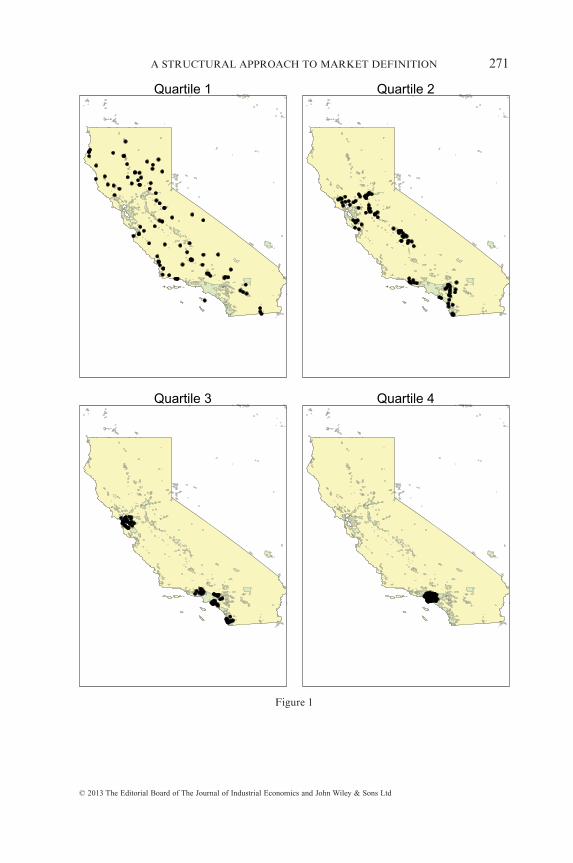
Quartile 1 Quartile 2
Quartile 3 Quartile 4
Figure 1
A STRUCTURAL APPROACH TO MARKET DEFINITION 271
© 2013 The Editorial Board of The Journal of Industrial Economics and John Wiley & Sons Ltd
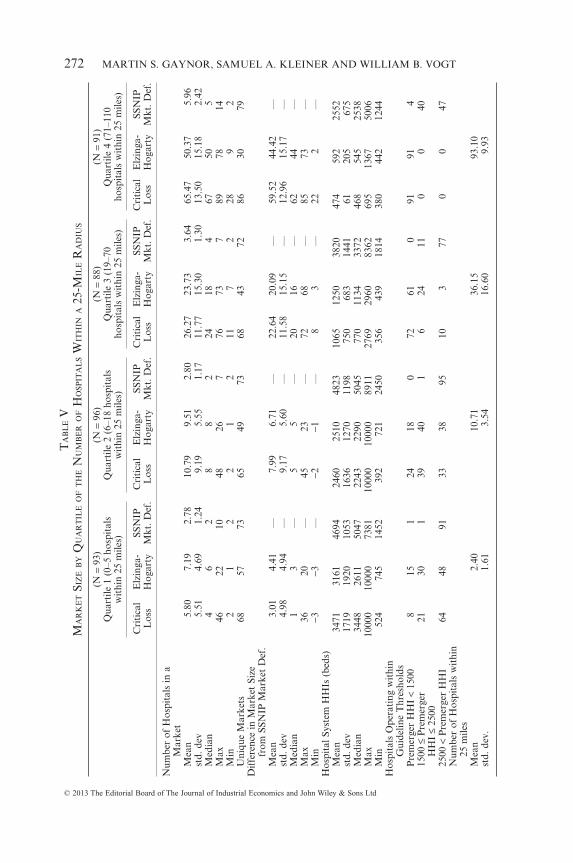
TA
BL
EV
MA
RK
ET
SIZ
EB
YQ
UA
RT
ILE
OF
TH
EN
UM
BE
RO
FH
OSP
ITA
LS
WIT
HIN
A25
-MIL
ER
AD
IUS
(N=
93)
(N=
96)
(N=
88)
(N=
91)
Qua
rtile
1(0
–5ho
spit
als
wit
hin
25m
iles)
Qua
rtile
2(6
–18
hosp
ital
sw
ithi
n25
mile
s)Q
uart
ile3
(19–
70ho
spit
als
wit
hin
25m
iles)
Qua
rtile
4(7
1–11
0ho
spit
als
wit
hin
25m
iles)
Cri
tica
lL
oss
Elz
inga
-H
ogar
tySS
NIP
Mkt
.Def
.C
riti
cal
Los
sE
lzin
ga-
Hog
arty
SSN
IPM
kt.D
ef.
Cri
tica
lL
oss
Elz
inga
-H
ogar
tySS
NIP
Mkt
.Def
.C
riti
cal
Los
sE
lzin
ga-
Hog
arty
SSN
IPM
kt.D
ef.
Num
ber
ofH
ospi
tals
ina
Mar
ket
Mea
n5.
807.
192.
7810
.79
9.51
2.80
26.2
723
.73
3.64
65.4
750
.37
5.96
std.
dev
5.51
4.69
1.24
9.19
5.55
1.17
11.7
715
.30
1.30
13.5
015
.18
2.42
Med
ian
46
28
82
2418
467
505
Max
4622
1048
267
7673
789
7814
Min
21
22
12
117
228
92
Uni
que
Mar
kets
6857
7365
4973
6843
7286
3079
Dif
fere
nce
inM
arke
tSi
zefr
omSS
NIP
Mar
ket
Def
.M
ean
3.01
4.41
—7.
996.
71—
22.6
420
.09
—59
.52
44.4
2—
std.
dev
4.98
4.94
—9.
175.
60—
11.5
815
.15
—12
.96
15.1
7—
Med
ian
13
—5
5—
2016
—62
44—
Max
3620
—45
23—
7268
—85
73—
Min
−3−3
—−2
−1—
83
—22
2—
Hos
pita
lSys
tem
HH
Is(b
eds)
Mea
n34
7131
6146
9424
6025
1048
2310
6512
5038
2047
459
225
52st
d.de
v17
1919
2010
5316
3612
7011
9875
068
314
4161
205
675
Med
ian
3448
2611
5047
2243
2290
5045
770
1134
3372
468
545
2538
Max
1000
010
000
7381
1000
010
000
8911
2769
2960
8362
695
1367
5006
Min
524
745
1452
392
721
2450
356
439
1814
380
442
1244
Hos
pita
lsO
pera
ting
wit
hin
Gui
delin
eT
hres
hold
sP
rem
erge
rH
HI
<15
008
151
2418
072
610
9191
415
00≤
Pre
mer
ger
HH
I≤
2500
2130
139
401
624
110
040
2500
<P
rem
erge
rH
HI
6448
9133
3895
103
770
047
Num
ber
ofH
ospi
tals
wit
hin
25m
iles
Mea
n2.
4010
.71
36.1
593
.10
std.
dev.
1.61
3.54
16.6
09.
93
MARTIN S. GAYNOR, SAMUEL A. KLEINER AND WILLIAM B. VOGT272
© 2013 The Editorial Board of The Journal of Industrial Economics and John Wiley & Sons Ltd
substantially. This suggests that although the shipments-based methods areconsistent in their determination that antitrust markets encompass a largernumber of hospitals in areas with greater hospital density (i.e., urbanareas), the difference in market sizes determined by these methods aresubstantially larger than those implied by the DB model, and these differ-ences are greater as the number of surrounding hospitals increases.
In Los Angeles, for example, in density quartile 4, EH must include anaverage of 50.37 hospitals (and over 100 zip codes) in order to produce amarket, whereas CLA must include an average of 65.47 hospitals in orderfor the loss from contestable zip codes to be sufficiently small so as toproduce a market. In contrast, SSNIP market definition using the DBmodel finds that the average hospital in this quartile operates in a marketwith just under 6 hospitals. In quartile 1 on the other hand, EH specifies amarket with an average of 7.19 hospitals and CLA determines that anaverage market in this quartile includes 5.8 hospitals. Market definitionusing the DB model determines that in this quartile, the average hospitalmarket consists of just 2.78 hospitals.
The bottom panel of Table V also reveals a great deal about the marketconcentration according to the prescribed thresholds set by the mergerguidelines. Across quartiles, both CLA and EH indicate that marketsbecome less concentrated as we move from quartile 1 to quartile 4. Thepercentage of hospitals operating in markets with HHI’s of less than 1,500for CLA increases from 8.6% in quartile 1 to 100% in quartile 4. Likewise,for EH, the percentage of hospitals in markets with HHI’s of less than 1,500increases from 16.1% in quartile 1 to 100% in quartile 4. SSNIP marketdefinition using the DB model finds only five markets with HHI’s of lessthan 1,500 in any concentration quartile.
The number of markets considered highly concentrated (HHI greaterthan 2,500) also show significant changes across concentration quartiles.The percentage of hospitals operating in markets with HHI’s of greaterthan 2,500 according to CLA decreases from 68.8% in quartile 1 to 0% inquartile 4. Similarly, the EH method determines that 51.6% of hospitalsoperate in markets with an HHI of greater than 2,500 in quartile 1, while inquartile 4 no hospitals operate in a market with an HHI of such magnitude.SSNIP market definition conversely shows all but three hospitals operatingin a market with an HHI of greater than 2,500 in quartiles 1 and 2, and just12.5% and 48.4% of hospitals in quartiles 3 and 4 operating below the 2,500threshold respectively.
V(iii). Elasticities
The DB model allows for the calculation of the elasticity of demand foreach hospital. As shown in Table III, the average own-price elasticity ofdemand for a hospital in the sample is calculated as −4.57. Table VI indi-
A STRUCTURAL APPROACH TO MARKET DEFINITION 273
© 2013 The Editorial Board of The Journal of Industrial Economics and John Wiley & Sons Ltd
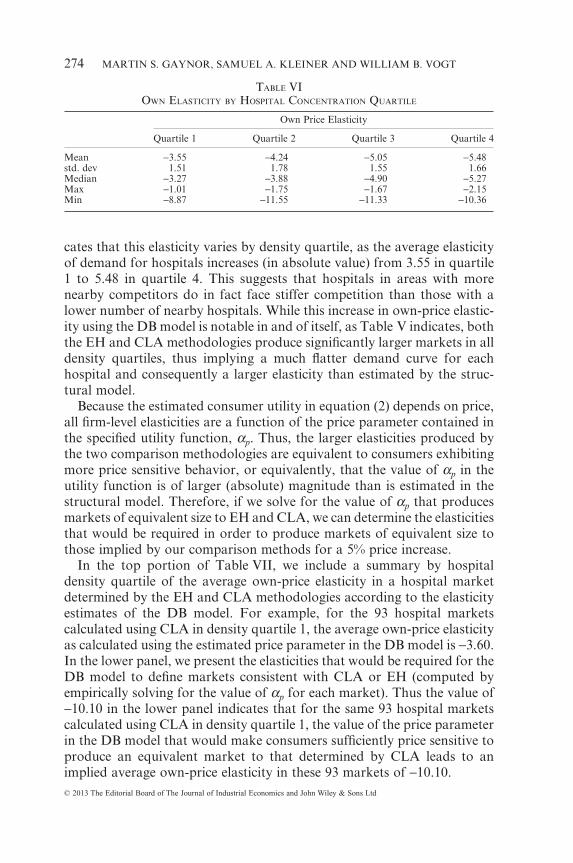
cates that this elasticity varies by density quartile, as the average elasticityof demand for hospitals increases (in absolute value) from 3.55 in quartile1 to 5.48 in quartile 4. This suggests that hospitals in areas with morenearby competitors do in fact face stiffer competition than those with alower number of nearby hospitals. While this increase in own-price elastic-ity using the DB model is notable in and of itself, as Table V indicates, boththe EH and CLA methodologies produce significantly larger markets in alldensity quartiles, thus implying a much flatter demand curve for eachhospital and consequently a larger elasticity than estimated by the struc-tural model.
Because the estimated consumer utility in equation (2) depends on price,all firm-level elasticities are a function of the price parameter contained inthe specified utility function, αp. Thus, the larger elasticities produced bythe two comparison methodologies are equivalent to consumers exhibitingmore price sensitive behavior, or equivalently, that the value of αp in theutility function is of larger (absolute) magnitude than is estimated in thestructural model. Therefore, if we solve for the value of αp that producesmarkets of equivalent size to EH and CLA, we can determine the elasticitiesthat would be required in order to produce markets of equivalent size tothose implied by our comparison methods for a 5% price increase.
In the top portion of Table VII, we include a summary by hospitaldensity quartile of the average own-price elasticity in a hospital marketdetermined by the EH and CLA methodologies according to the elasticityestimates of the DB model. For example, for the 93 hospital marketscalculated using CLA in density quartile 1, the average own-price elasticityas calculated using the estimated price parameter in the DB model is −3.60.In the lower panel, we present the elasticities that would be required for theDB model to define markets consistent with CLA or EH (computed byempirically solving for the value of αp for each market). Thus the value of−10.10 in the lower panel indicates that for the same 93 hospital marketscalculated using CLA in density quartile 1, the value of the price parameterin the DB model that would make consumers sufficiently price sensitive toproduce an equivalent market to that determined by CLA leads to animplied average own-price elasticity in these 93 markets of −10.10.
TABLE VIOWN ELASTICITY BY HOSPITAL CONCENTRATION QUARTILE
Own Price Elasticity
Quartile 1 Quartile 2 Quartile 3 Quartile 4
Mean −3.55 −4.24 −5.05 −5.48std. dev 1.51 1.78 1.55 1.66Median −3.27 −3.88 −4.90 −5.27Max −1.01 −1.75 −1.67 −2.15Min −8.87 −11.55 −11.33 −10.36
MARTIN S. GAYNOR, SAMUEL A. KLEINER AND WILLIAM B. VOGT274
© 2013 The Editorial Board of The Journal of Industrial Economics and John Wiley & Sons Ltd
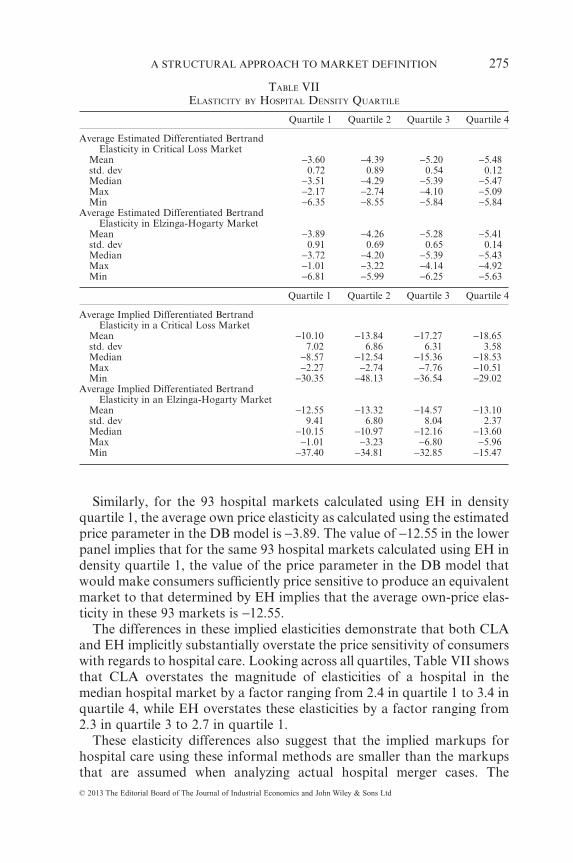
Similarly, for the 93 hospital markets calculated using EH in densityquartile 1, the average own price elasticity as calculated using the estimatedprice parameter in the DB model is −3.89. The value of −12.55 in the lowerpanel implies that for the same 93 hospital markets calculated using EH indensity quartile 1, the value of the price parameter in the DB model thatwould make consumers sufficiently price sensitive to produce an equivalentmarket to that determined by EH implies that the average own-price elas-ticity in these 93 markets is −12.55.
The differences in these implied elasticities demonstrate that both CLAand EH implicitly substantially overstate the price sensitivity of consumerswith regards to hospital care. Looking across all quartiles, Table VII showsthat CLA overstates the magnitude of elasticities of a hospital in themedian hospital market by a factor ranging from 2.4 in quartile 1 to 3.4 inquartile 4, while EH overstates these elasticities by a factor ranging from2.3 in quartile 3 to 2.7 in quartile 1.
These elasticity differences also suggest that the implied markups forhospital care using these informal methods are smaller than the markupsthat are assumed when analyzing actual hospital merger cases. The
TABLE VIIELASTICITY BY HOSPITAL DENSITY QUARTILE
Quartile 1 Quartile 2 Quartile 3 Quartile 4
Average Estimated Differentiated BertrandElasticity in Critical Loss Market
Mean −3.60 −4.39 −5.20 −5.48std. dev 0.72 0.89 0.54 0.12Median −3.51 −4.29 −5.39 −5.47Max −2.17 −2.74 −4.10 −5.09Min −6.35 −8.55 −5.84 −5.84
Average Estimated Differentiated BertrandElasticity in Elzinga-Hogarty Market
Mean −3.89 −4.26 −5.28 −5.41std. dev 0.91 0.69 0.65 0.14Median −3.72 −4.20 −5.39 −5.43Max −1.01 −3.22 −4.14 −4.92Min −6.81 −5.99 −6.25 −5.63
Quartile 1 Quartile 2 Quartile 3 Quartile 4
Average Implied Differentiated BertrandElasticity in a Critical Loss Market
Mean −10.10 −13.84 −17.27 −18.65std. dev 7.02 6.86 6.31 3.58Median −8.57 −12.54 −15.36 −18.53Max −2.27 −2.74 −7.76 −10.51Min −30.35 −48.13 −36.54 −29.02
Average Implied Differentiated BertrandElasticity in an Elzinga-Hogarty Market
Mean −12.55 −13.32 −14.57 −13.10std. dev 9.41 6.80 8.04 2.37Median −10.15 −10.97 −12.16 −13.60Max −1.01 −3.23 −6.80 −5.96Min −37.40 −34.81 −32.85 −15.47
A STRUCTURAL APPROACH TO MARKET DEFINITION 275
© 2013 The Editorial Board of The Journal of Industrial Economics and John Wiley & Sons Ltd
commonly used Lerner Index, p mcp
− = 1ε , relates elasticity to margins,
implying that the determination of high margins indicates a low elasticity ofdemand. In the calculation of the Critical Loss, the contribution margindefined in section III(ii)(i) is equivalent to the left-hand side of a LernerIndex (assuming constant returns to scale). Thus from our elasticity esti-mates in Table VII, we can infer that the percentage markup over marginalcost implied by the CLA market size is substantially lower than the 55%that was actually used in our definition of the CLA markets, which is withinthe range used by analysts in antitrust suits. As Table VII indicates, even inthe lowest hospital concentration quartile, the implied markup for a hos-pital in the median hospital market using the CLA methodology is nearly12%, while in quartile 4, the implied markup in the market for the medianhospitals is 5.4%. Although EH in its implementation does not explicitlypostulate the implied markup, it suffers from similar shortcomings in thatit suggests markups ranging from 7.4%–9.9% for a hospital in the medianhospital market, well below those implied by the elasticity estimates in theDB model. Both of these findings suggest that the market definition tech-niques used in previously decided merger cases are inappropriate for hos-pital market definition; that is, using shipments-based techniques will byand large produce overestimates of the price elasticity of demand faced byhospitals, thus resulting in substantially larger markets than intended in themerger guidelines.
V(iv). An Analysis of San Diego
To further demonstrate market definition under the SSNIP criteria, weexamine markets defined in a localized area of the state. Specifically, weperform market definition in the San Diego area. Our selection of SanDiego is strategic in that it is an area with few geographic barriers and itcontains a reasonable number of hospitals so as to allow for methodologi-cal illustration while still being computationally feasible. It also allows fora comparison of the DB and OD models, as the original study conducted byCapps et al. [2003] was estimated using data on San Diego.
A summary of the San Diego area hospitals is presented in Table VIII,while a map of the hospitals in the area is presented in Figure 2. San Diegocontains hospitals that fall into hospital density quartiles 2 and 3. Thedominant systems in the area in our 1995 data are the Scripps and Sharpsystems, with each controlling 6 and 5 of the 23 hospitals respectively.While 19 of the 23 hospitals were members of a multi-hospital system, 4 ofthese hospitals, Alvarado, Harbor View, Mission Bay and Paradise Valleywere owned by corporations that controlled no other hospitals in the SanDiego area. The other two multi-hospital systems, University of California(UC) and Palomar Pomerado, each controlled only two hospitals.
MARTIN S. GAYNOR, SAMUEL A. KLEINER AND WILLIAM B. VOGT276
© 2013 The Editorial Board of The Journal of Industrial Economics and John Wiley & Sons Ltd
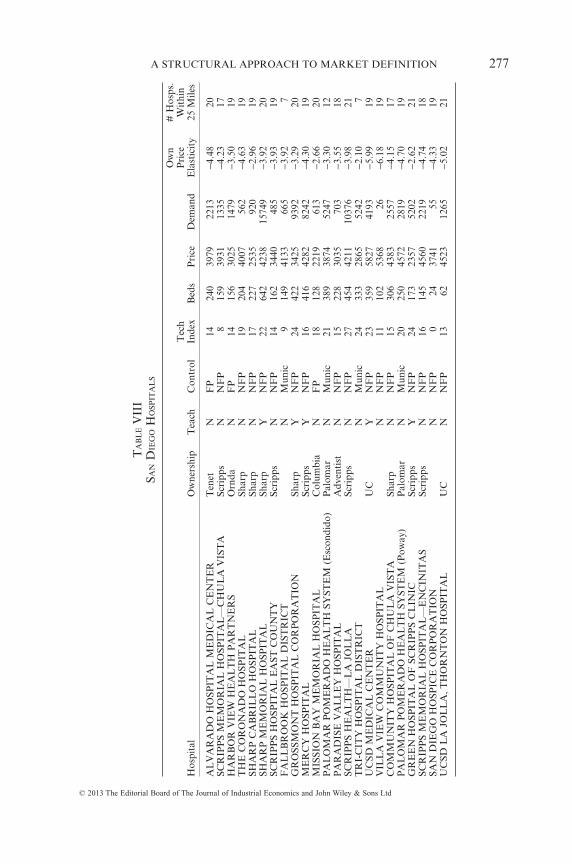
TA
BL
EV
III
SAN
DIE
GO
HO
SPIT
AL
S
Hos
pita
lO
wne
rshi
pT
each
Con
trol
Tec
hIn
dex
Bed
sP
rice
Dem
and
Ow
nP
rice
Ela
stic
ity
#H
osps
.W
ithi
n25
Mile
s
AL
VA
RA
DO
HO
SPIT
AL
ME
DIC
AL
CE
NT
ER
Ten
etN
FP
1424
039
7922
13−4
.48
20SC
RIP
PS
ME
MO
RIA
LH
OSP
ITA
L—
CH
UL
AV
IST
ASc
ripp
sN
NF
P8
159
3931
1335
−4.2
317
HA
RB
OR
VIE
WH
EA
LT
HP
AR
TN
ER
SO
rnda
NF
P14
156
3025
1479
−3.5
019
TH
EC
OR
ON
AD
OH
OSP
ITA
LSh
arp
NN
FP
1920
440
0756
2−4
.63
19SH
AR
PC
AB
RIL
LO
HO
SPIT
AL
Shar
pN
NF
P17
227
2535
920
−2.9
619
SHA
RP
ME
MO
RIA
LH
OSP
ITA
LSh
arp
YN
FP
2264
242
3815
749
−3.9
220
SCR
IPP
SH
OSP
ITA
LE
AST
CO
UN
TY
Scri
pps
NN
FP
1416
234
4048
5−3
.93
19F
AL
LB
RO
OK
HO
SPIT
AL
DIS
TR
ICT
NM
unic
914
941
3366
5−3
.92
7G
RO
SSM
ON
TH
OSP
ITA
LC
OR
PO
RA
TIO
NSh
arp
YN
FP
2442
234
2593
92−3
.29
20M
ER
CY
HO
SPIT
AL
Scri
pps
YN
FP
1641
642
8282
42−4
.30
19M
ISSI
ON
BA
YM
EM
OR
IAL
HO
SPIT
AL
Col
umbi
aN
FP
1812
822
1961
3−2
.66
20P
AL
OM
AR
PO
ME
RA
DO
HE
AL
TH
SYST
EM
(Esc
ondi
do)
Pal
omar
NM
unic
2138
938
7452
47−3
.30
12P
AR
AD
ISE
VA
LL
EY
HO
SPIT
AL
Adv
enti
stN
NF
P15
228
3035
703
−3.5
518
SCR
IPP
SH
EA
LT
H—
LA
JOL
LA
Scri
pps
NN
FP
2745
442
1110
376
−3.9
821
TR
I-C
ITY
HO
SPIT
AL
DIS
TR
ICT
NM
unic
2433
328
6552
42−2
.10
7U
CSD
ME
DIC
AL
CE
NT
ER
UC
YN
FP
2335
958
2741
93−5
.99
19V
ILL
AV
IEW
CO
MM
UN
ITY
HO
SPIT
AL
NN
FP
1110
253
6826
−6.1
819
CO
MM
UN
ITY
HO
SPIT
AL
OF
CH
UL
AV
IST
ASh
arp
NN
FP
1530
643
8325
57−4
.15
17P
AL
OM
AR
PO
ME
RA
DO
HE
AL
TH
SYST
EM
(Pow
ay)
Pal
omar
NM
unic
2025
045
7228
19−4
.70
19G
RE
EN
HO
SPIT
AL
OF
SCR
IPP
SC
LIN
ICSc
ripp
sY
NF
P24
173
2357
5202
−2.6
221
SCR
IPP
SM
EM
OR
IAL
HO
SPIT
AL
—E
NC
INIT
AS
Scri
pps
NN
FP
1614
545
6022
19−4
.74
18SA
ND
IEG
OH
OSP
ICE
CO
RP
OR
AT
ION
NN
FP
024
3741
55−4
.33
19U
CSD
LA
JOL
LA
,TH
OR
NT
ON
HO
SPIT
AL
UC
NN
FP
1362
4523
1265
−5.0
221
A STRUCTURAL APPROACH TO MARKET DEFINITION 277
© 2013 The Editorial Board of The Journal of Industrial Economics and John Wiley & Sons Ltd
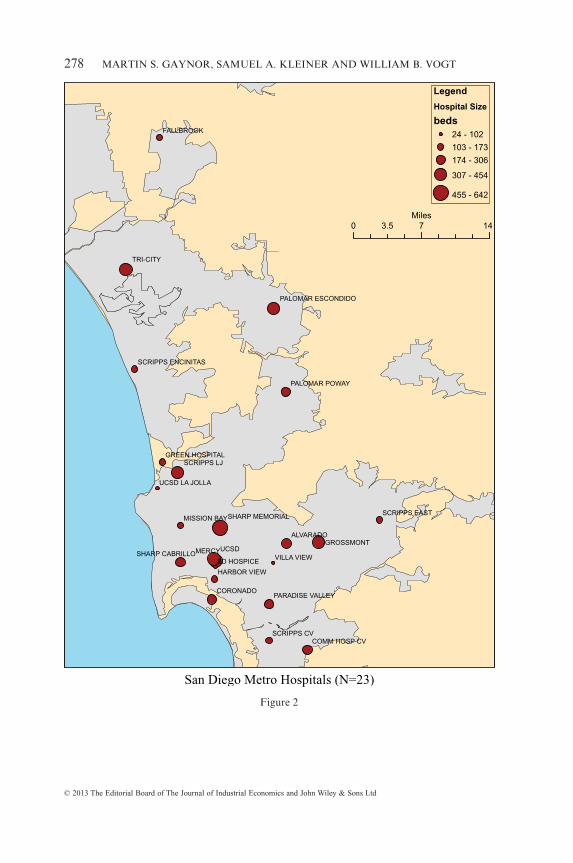
UCSDMERCY
TRI-CITY
CORONADO
ALVARADOGROSSMONT
FALLBROOK
SD HOSPICEVILLA VIEW
SCRIPPS LJ
SCRIPPS CV
MISSION BAY
HARBOR VIEW
COMM HOSP CV
SCRIPPS EAST
UCSD LA JOLLA
PALOMAR POWAY
GREEN HOSPITAL
SHARP MEMORIAL
SHARP CABRILLO
PARADISE VALLEY
SCRIPPS ENCINITAS
PALOMAR ESCONDIDO
0 7 143.5Miles
Legend
Hospital Size
beds
24 - 102
103 - 173
174 - 306
307 - 454
455 - 642
San Diego Metro Hospitals (N=23)
Figure 2
MARTIN S. GAYNOR, SAMUEL A. KLEINER AND WILLIAM B. VOGT278
© 2013 The Editorial Board of The Journal of Industrial Economics and John Wiley & Sons Ltd
Table IX presents the results of market definition for the San Diego areafor each of our three market definition methodologies. With the exceptionof Fallbrook Hospital, all methods produce a market which is a subset ofthe hospitals in this county. CLA in column one of Table IX definesmarkets as consisting of 13–38 hospitals, each of which comprises substan-tial subsections of the San Diego area, and in the case of Fallbrook Hos-pital, portions of the Los Angeles area. Similarly, EH market definition incolumn two determines that markets are anywhere from 14–19 hospitals insize. The DB model in column three, however, shows that SSNIP marketsconsist instead of small sets of no more than four hospitals, with a medianmarket size of two hospitals. This difference in methodology evidentlyaffects the degree of concentration implied in the San Diego area. Both ofthe comparison methods produce markets with the majority of HHI’sfalling in the 2,000–3,000 range, while no SSNIP market produced by theDB model has an HHI lower than 3,000 and 18 of the 23 hospitals operatein a market with an HHI of more than 5,000.
Figure 3 illustrates the differences in markets produced by the threemethodologies, using as an example the definition of a market for ScrippsMemorial Hospital–Chula Vista (Scripps Chula Vista), a 159-bed hospitallocated in the southern portion of the San Diego metropolitan area. SSNIPmarket definition indicates that Scripps Chula Vista and Community Hos-pital of Chula Vista, a 306-bed hospital located in the same area, representa geographic market, with an HHI of 5,500. Using EH, a geographic marketwould include these two hospitals, as well as 16 other facilities in the SanDiego area, producing a market with an HHI of 2,228. The market pro-duced using CLA shows a similar pattern, as a critical loss market wouldinclude a total of 17 hospitals in the San Diego metropolitan area, implyingthat Scripps Chula Vista operates in a market with an HHI of 2,692.
V(v). Comparison with the Option Demand Model
As we describe in section III(iii)(iii) and section V(i)(iv), a direct compari-son of merger effects using the OD and DB models necessitates the simu-lation only of mergers between independently owned hospitals, as well asentire hospital systems. Thus, we use our data to estimate the OD model,employing the same variables in our utility function as were used by Cappset al. [2003], with minor exceptions.18 We note that our use of the ODmethod necessitates a different sample of consumers than was used in thework of Capps et al. [2003], since the original estimation sample used by
18 Instead of the ‘equipment intensity’ variable, we use a ‘tech index’ variable which is thesum over dummy variables for the presence of 28 technologies reported in the annual hospitalfinancial data (such as presence of an MRI, open heart surgical suite, etc.). Also, instead oftravel time, we use distance.
A STRUCTURAL APPROACH TO MARKET DEFINITION 279
© 2013 The Editorial Board of The Journal of Industrial Economics and John Wiley & Sons Ltd
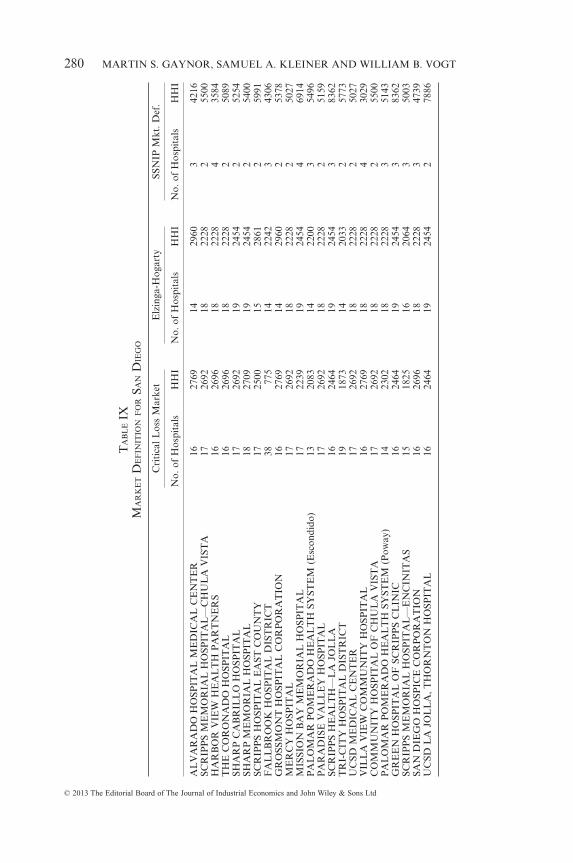
TA
BL
EIX
MA
RK
ET
DE
FIN
ITIO
NF
OR
SAN
DIE
GO
Cri
tica
lLos
sM
arke
tE
lzin
ga-H
ogar
tySS
NIP
Mkt
.Def
.
No.
ofH
ospi
tals
HH
IN
o.of
Hos
pita
lsH
HI
No.
ofH
ospi
tals
HH
I
AL
VA
RA
DO
HO
SPIT
AL
ME
DIC
AL
CE
NT
ER
1627
6914
2960
342
16SC
RIP
PS
ME
MO
RIA
LH
OSP
ITA
L—
CH
UL
AV
IST
A17
2692
1822
282
5500
HA
RB
OR
VIE
WH
EA
LT
HP
AR
TN
ER
S16
2696
1822
284
3584
TH
EC
OR
ON
AD
OH
OSP
ITA
L16
2696
1822
282
5089
SHA
RP
CA
BR
ILL
OH
OSP
ITA
L17
2692
1924
542
5254
SHA
RP
ME
MO
RIA
LH
OSP
ITA
L18
2709
1924
542
5400
SCR
IPP
SH
OSP
ITA
LE
AST
CO
UN
TY
1725
0015
2861
259
91F
AL
LB
RO
OK
HO
SPIT
AL
DIS
TR
ICT
3877
514
2242
343
06G
RO
SSM
ON
TH
OSP
ITA
LC
OR
PO
RA
TIO
N16
2769
1429
602
5378
ME
RC
YH
OSP
ITA
L17
2692
1822
282
5027
MIS
SIO
NB
AY
ME
MO
RIA
LH
OSP
ITA
L17
2239
1924
544
6914
PA
LO
MA
RP
OM
ER
AD
OH
EA
LT
HSY
STE
M(E
scon
dido
)13
2083
1422
003
5496
PA
RA
DIS
EV
AL
LE
YH
OSP
ITA
L17
2692
1822
282
5159
SCR
IPP
SH
EA
LT
H—
LA
JOL
LA
1624
6419
2454
383
62T
RI-
CIT
YH
OSP
ITA
LD
IST
RIC
T19
1873
1420
332
5773
UC
SDM
ED
ICA
LC
EN
TE
R17
2692
1822
282
5027
VIL
LA
VIE
WC
OM
MU
NIT
YH
OSP
ITA
L16
2769
1822
284
3029
CO
MM
UN
ITY
HO
SPIT
AL
OF
CH
UL
AV
IST
A17
2692
1822
282
5500
PA
LO
MA
RP
OM
ER
AD
OH
EA
LT
HSY
STE
M(P
oway
)14
2302
1822
283
5143
GR
EE
NH
OSP
ITA
LO
FSC
RIP
PS
CL
INIC
1624
6419
2454
383
62SC
RIP
PS
ME
MO
RIA
LH
OSP
ITA
L—
EN
CIN
ITA
S15
1825
1620
643
5003
SAN
DIE
GO
HO
SPIC
EC
OR
PO
RA
TIO
N16
2696
1822
283
4739
UC
SDL
AJO
LL
A,T
HO
RN
TO
NH
OSP
ITA
L16
2464
1924
542
7886
MARTIN S. GAYNOR, SAMUEL A. KLEINER AND WILLIAM B. VOGT280
© 2013 The Editorial Board of The Journal of Industrial Economics and John Wiley & Sons Ltd
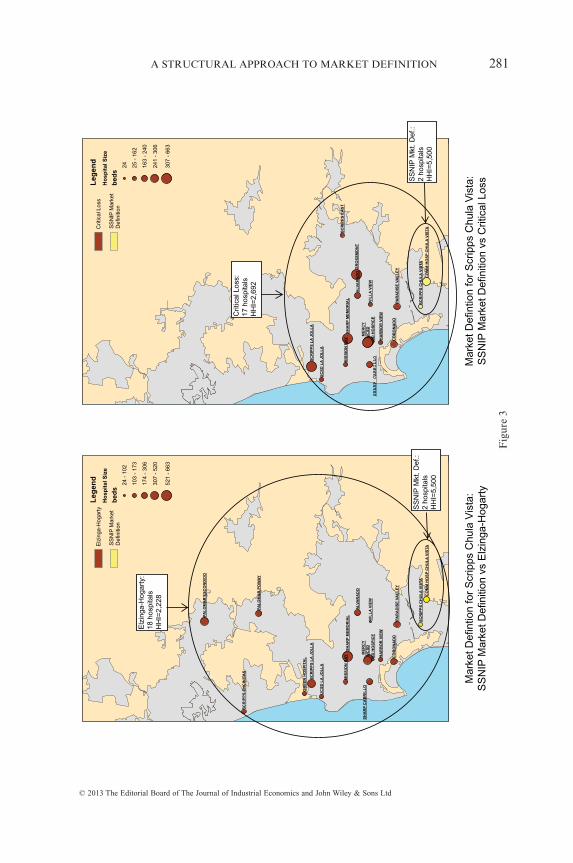
UC
SD
ME
RC
Y
ALV
AR
AD
O
CO
RO
NA
DO
GR
OS
SM
ON
T
SD
HO
SP
ICE
VIL
LA
VIE
W
MIS
SIO
N B
AY H
AR
BO
R V
IEW
SC
RIP
PS
EA
ST
UC
SD
LA
JO
LL
A
SH
AR
P M
EM
OR
IAL
PA
RA
DIS
E V
AL
LE
Y
SC
RIP
PS
LA
JO
LL
A
SC
RIP
PS
CH
UL
A V
ISTA
CO
MM
HO
SP
CH
UL
A V
ISTA
Le
ge
nd
Ho
sp
ita
l S
ize
be
ds
24 25 -
162
163
- 24
0
241
- 30
6
307
- 66
3
Mar
ket D
efin
tion
for
Scr
ipps
Chu
la V
ista
:S
SN
IP M
arke
t Def
initi
on v
s C
ritic
al L
oss
Crit
ical
Los
s
SS
NIP
Mar
ket
Def
initi
on
UC
SD
ME
RC
Y
CO
RO
NA
DO
ALV
AR
AD
O
SD
HO
SP
ICE
VIL
LA
VIE
W
MIS
SIO
N B
AY H
AR
BO
R V
IEW
UC
SD
LA
JO
LL
A
PA
LO
MA
R P
OW
AY
GR
EE
N H
OS
PIT
AL
SH
AR
P M
EM
OR
IAL
SH
AR
P C
AB
RIL
LO
PA
RA
DIS
E V
AL
LE
Y
SC
RIP
PS
LA
JO
LL
A
SC
RIP
PS
EN
CIN
ITA
S
PA
LO
MA
R E
SC
ON
DID
O
SC
RIP
PS
CH
UL
A V
ISTA
CO
MM
HO
SP
CH
UL
A V
ISTA
Le
ge
nd
Ho
sp
ita
l S
ize
be
ds
24 -
102
103
- 17
3
174
- 30
6
307
- 52
0
521
- 66
3
Mar
ket D
efin
tion
for
Scr
ipps
Chu
la V
ista
:S
SN
IP M
arke
t Def
initi
on v
s E
lzin
ga-H
ogar
ty
Elz
inga
-Hog
arty
SS
NIP
Mar
ket
Def
initi
on
SHARP
CABRILLO
Elz
inga
-Hog
arty
:18
hosp
itals
HH
I=2,
228
SS
NIP
Mkt
.Def
.:2
hosp
itals
HH
I=5,
500
SS
NIP
Mkt
.Def
.:2
hosp
itals
HH
I=5,
500
Crit
ical
Loss
:17
hosp
itals
HH
I=2,
692
Fig
ure
3
A STRUCTURAL APPROACH TO MARKET DEFINITION 281
© 2013 The Editorial Board of The Journal of Industrial Economics and John Wiley & Sons Ltd
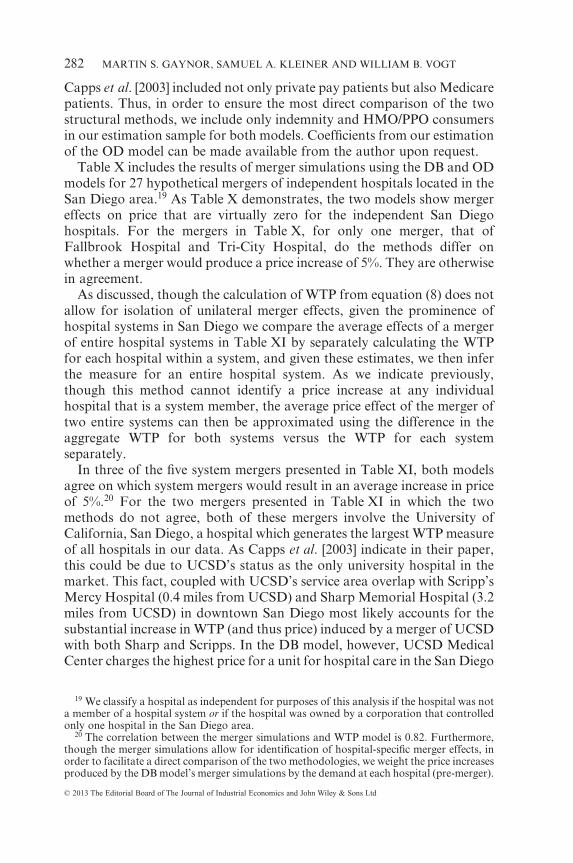
Capps et al. [2003] included not only private pay patients but also Medicarepatients. Thus, in order to ensure the most direct comparison of the twostructural methods, we include only indemnity and HMO/PPO consumersin our estimation sample for both models. Coefficients from our estimationof the OD model can be made available from the author upon request.
Table X includes the results of merger simulations using the DB and ODmodels for 27 hypothetical mergers of independent hospitals located in theSan Diego area.19 As Table X demonstrates, the two models show mergereffects on price that are virtually zero for the independent San Diegohospitals. For the mergers in Table X, for only one merger, that ofFallbrook Hospital and Tri-City Hospital, do the methods differ onwhether a merger would produce a price increase of 5%. They are otherwisein agreement.
As discussed, though the calculation of WTP from equation (8) does notallow for isolation of unilateral merger effects, given the prominence ofhospital systems in San Diego we compare the average effects of a mergerof entire hospital systems in Table XI by separately calculating the WTPfor each hospital within a system, and given these estimates, we then inferthe measure for an entire hospital system. As we indicate previously,though this method cannot identify a price increase at any individualhospital that is a system member, the average price effect of the merger oftwo entire systems can then be approximated using the difference in theaggregate WTP for both systems versus the WTP for each systemseparately.
In three of the five system mergers presented in Table XI, both modelsagree on which system mergers would result in an average increase in priceof 5%.20 For the two mergers presented in Table XI in which the twomethods do not agree, both of these mergers involve the University ofCalifornia, San Diego, a hospital which generates the largest WTP measureof all hospitals in our data. As Capps et al. [2003] indicate in their paper,this could be due to UCSD’s status as the only university hospital in themarket. This fact, coupled with UCSD’s service area overlap with Scripp’sMercy Hospital (0.4 miles from UCSD) and Sharp Memorial Hospital (3.2miles from UCSD) in downtown San Diego most likely accounts for thesubstantial increase in WTP (and thus price) induced by a merger of UCSDwith both Sharp and Scripps. In the DB model, however, UCSD MedicalCenter charges the highest price for a unit for hospital care in the San Diego
19 We classify a hospital as independent for purposes of this analysis if the hospital was nota member of a hospital system or if the hospital was owned by a corporation that controlledonly one hospital in the San Diego area.
20 The correlation between the merger simulations and WTP model is 0.82. Furthermore,though the merger simulations allow for identification of hospital-specific merger effects, inorder to facilitate a direct comparison of the two methodologies, we weight the price increasesproduced by the DB model’s merger simulations by the demand at each hospital (pre-merger).
MARTIN S. GAYNOR, SAMUEL A. KLEINER AND WILLIAM B. VOGT282
© 2013 The Editorial Board of The Journal of Industrial Economics and John Wiley & Sons Ltd
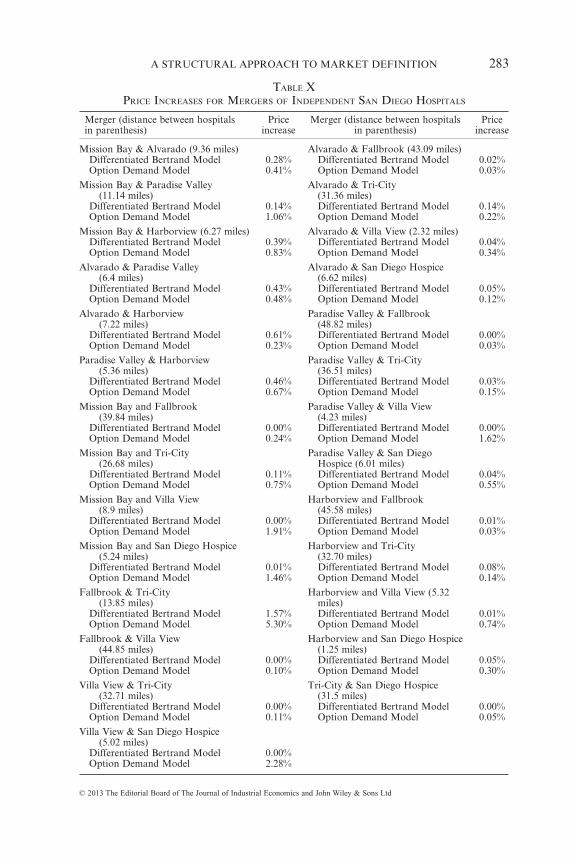
TABLE XPRICE INCREASES FOR MERGERS OF INDEPENDENT SAN DIEGO HOSPITALS
Merger (distance between hospitalsin parenthesis)
Priceincrease
Merger (distance between hospitalsin parenthesis)
Priceincrease
Mission Bay & Alvarado (9.36 miles) Alvarado & Fallbrook (43.09 miles)Differentiated Bertrand Model 0.28% Differentiated Bertrand Model 0.02%Option Demand Model 0.41% Option Demand Model 0.03%
Mission Bay & Paradise Valley(11.14 miles)
Alvarado & Tri-City(31.36 miles)
Differentiated Bertrand Model 0.14% Differentiated Bertrand Model 0.14%Option Demand Model 1.06% Option Demand Model 0.22%
Mission Bay & Harborview (6.27 miles) Alvarado & Villa View (2.32 miles)Differentiated Bertrand Model 0.39% Differentiated Bertrand Model 0.04%Option Demand Model 0.83% Option Demand Model 0.34%
Alvarado & Paradise Valley(6.4 miles)
Alvarado & San Diego Hospice(6.62 miles)
Differentiated Bertrand Model 0.43% Differentiated Bertrand Model 0.05%Option Demand Model 0.48% Option Demand Model 0.12%
Alvarado & Harborview(7.22 miles)
Paradise Valley & Fallbrook(48.82 miles)
Differentiated Bertrand Model 0.61% Differentiated Bertrand Model 0.00%Option Demand Model 0.23% Option Demand Model 0.03%
Paradise Valley & Harborview(5.36 miles)
Paradise Valley & Tri-City(36.51 miles)
Differentiated Bertrand Model 0.46% Differentiated Bertrand Model 0.03%Option Demand Model 0.67% Option Demand Model 0.15%
Mission Bay and Fallbrook(39.84 miles)
Paradise Valley & Villa View(4.23 miles)
Differentiated Bertrand Model 0.00% Differentiated Bertrand Model 0.00%Option Demand Model 0.24% Option Demand Model 1.62%
Mission Bay and Tri-City(26.68 miles)
Paradise Valley & San DiegoHospice (6.01 miles)
Differentiated Bertrand Model 0.11% Differentiated Bertrand Model 0.04%Option Demand Model 0.75% Option Demand Model 0.55%
Mission Bay and Villa View(8.9 miles)
Harborview and Fallbrook(45.58 miles)
Differentiated Bertrand Model 0.00% Differentiated Bertrand Model 0.01%Option Demand Model 1.91% Option Demand Model 0.03%
Mission Bay and San Diego Hospice(5.24 miles)
Harborview and Tri-City(32.70 miles)
Differentiated Bertrand Model 0.01% Differentiated Bertrand Model 0.08%Option Demand Model 1.46% Option Demand Model 0.14%
Fallbrook & Tri-City(13.85 miles)
Harborview and Villa View (5.32miles)
Differentiated Bertrand Model 1.57% Differentiated Bertrand Model 0.01%Option Demand Model 5.30% Option Demand Model 0.74%
Fallbrook & Villa View(44.85 miles)
Harborview and San Diego Hospice(1.25 miles)
Differentiated Bertrand Model 0.00% Differentiated Bertrand Model 0.05%Option Demand Model 0.10% Option Demand Model 0.30%
Villa View & Tri-City(32.71 miles)
Tri-City & San Diego Hospice(31.5 miles)
Differentiated Bertrand Model 0.00% Differentiated Bertrand Model 0.00%Option Demand Model 0.11% Option Demand Model 0.05%
Villa View & San Diego Hospice(5.02 miles)
Differentiated Bertrand Model 0.00%Option Demand Model 2.28%
A STRUCTURAL APPROACH TO MARKET DEFINITION 283
© 2013 The Editorial Board of The Journal of Industrial Economics and John Wiley & Sons Ltd
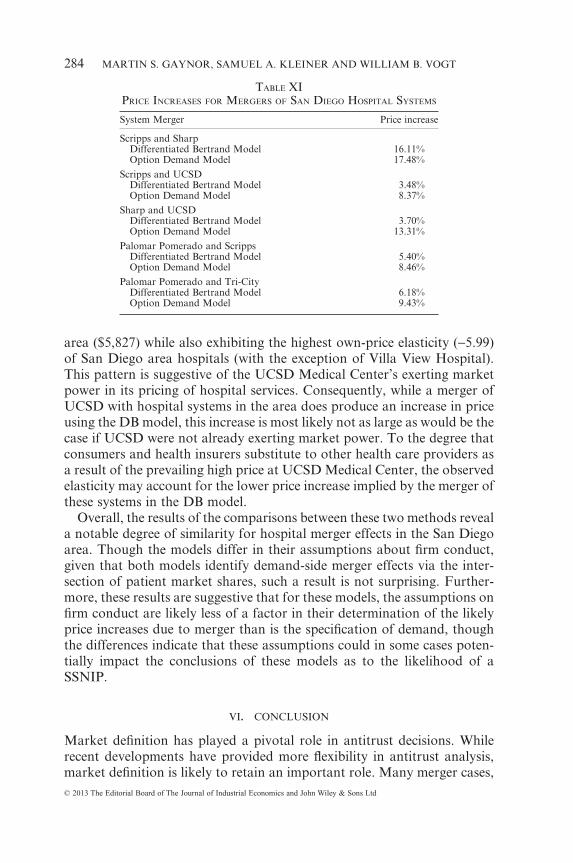
area ($5,827) while also exhibiting the highest own-price elasticity (−5.99)of San Diego area hospitals (with the exception of Villa View Hospital).This pattern is suggestive of the UCSD Medical Center’s exerting marketpower in its pricing of hospital services. Consequently, while a merger ofUCSD with hospital systems in the area does produce an increase in priceusing the DB model, this increase is most likely not as large as would be thecase if UCSD were not already exerting market power. To the degree thatconsumers and health insurers substitute to other health care providers asa result of the prevailing high price at UCSD Medical Center, the observedelasticity may account for the lower price increase implied by the merger ofthese systems in the DB model.
Overall, the results of the comparisons between these two methods reveala notable degree of similarity for hospital merger effects in the San Diegoarea. Though the models differ in their assumptions about firm conduct,given that both models identify demand-side merger effects via the inter-section of patient market shares, such a result is not surprising. Further-more, these results are suggestive that for these models, the assumptions onfirm conduct are likely less of a factor in their determination of the likelyprice increases due to merger than is the specification of demand, thoughthe differences indicate that these assumptions could in some cases poten-tially impact the conclusions of these models as to the likelihood of aSSNIP.
VI. CONCLUSION
Market definition has played a pivotal role in antitrust decisions. Whilerecent developments have provided more flexibility in antitrust analysis,market definition is likely to retain an important role. Many merger cases,
TABLE XIPRICE INCREASES FOR MERGERS OF SAN DIEGO HOSPITAL SYSTEMS
System Merger Price increase
Scripps and SharpDifferentiated Bertrand Model 16.11%Option Demand Model 17.48%
Scripps and UCSDDifferentiated Bertrand Model 3.48%Option Demand Model 8.37%
Sharp and UCSDDifferentiated Bertrand Model 3.70%Option Demand Model 13.31%
Palomar Pomerado and ScrippsDifferentiated Bertrand Model 5.40%Option Demand Model 8.46%
Palomar Pomerado and Tri-CityDifferentiated Bertrand Model 6.18%Option Demand Model 9.43%
MARTIN S. GAYNOR, SAMUEL A. KLEINER AND WILLIAM B. VOGT284
© 2013 The Editorial Board of The Journal of Industrial Economics and John Wiley & Sons Ltd
including the vast majority of hospital merger cases, have utilized ad hocmethods of market definition that rely heavily upon shipments data, withno explicit economic model used to justify such methods. Our use of a fullyspecified structural model of hospital competition compares commonlyemployed geographic market definition approaches used in actual hospitalmerger cases to geographic markets rooted in the principles set forth by themerger guidelines. This method explicitly models consumer and producerbehavior, and also accounts for firms operating at multiple locations, asrequired by the 2010 Merger Guidelines.
We find that the use of approaches frequently utilized in previous caseslargely overstates the size of geographic markets for hospitals, particularlyin areas with greater hospital density. In addition, these informalapproaches imply elasticities ranging from 2.4–3.4 times as large as thosecalculated from a structural model of hospital competition. Furthermore,our analysis of the San Diego area shows that different structural methodsgenerate results that are largely consistent with each other and inconsistentwith ad hoc methods.
The results have important implications for merger analysis in both thehospital industry and other industries involving differentiated products.They illustrate the importance of economic modeling for defining markets,and indicate that reliance on imprecise methods of market definition hasthe potential to mislead the courts as to the appropriate extent of geo-graphic markets. The markets presented here are most consistent withthose identified in merger cases by plaintiffs rather than by defendants, incontrast to the court’s frequent rejection of markets alleged by the antitrustauthorities. Thus the use of such an approach should be emphasized whenassessing the extent of market power in this and other differentiatedproduct industries.
REFERENCES
Akosa Antwi, Y.; Gaynor, M. S. and Vogt, W. B., 2009, ‘Evaluating the Performance ofMerger Simulation: Evidence from the Hospital Market in California,’ CarnegieMellon working paper, (Carnegie Mellon University, Pittsburgh, Pennsylvania,U.S.A.)
American Bar Association, 2003, Health Care Mergers and Acquisitions Handbook(ABA Publishing, Chicago, Illinois, U.S.A.).
Areeda, P.; Hovenkamp, H. and Solow, J., 2007, Antitrust Law, 3rd ed. (Aspen Publish-ers, New York, New York, U.S.A.).
Baker, J., 2007, ‘Market Definition: An Analytical Overview,’ Antitrust Law Journal, 74,pp. 129–173.
Baker, J. and Bresnahan, T., 1985, ‘The Gains From Merger or Collusion in Product-Differentiated Industries,’ The Journal of Industrial Economics, 33(4), pp. 427–444.
Berry, S., 1994, ‘Estimating Discrete-Choice Models of Product Differentiation,’ TheRAND Journal of Economics, 25(2), pp. 242–262
Berry, S.; Levinsohn, J. and Pakes, A., 1995, ‘Automobile Prices in Market Equilib-rium,’ Econometrica, 63(4), pp. 841–890.
A STRUCTURAL APPROACH TO MARKET DEFINITION 285
© 2013 The Editorial Board of The Journal of Industrial Economics and John Wiley & Sons Ltd
Berry, S.; Levinsohn, J. and Pakes, A., 2004, ‘Differentiated Products From a Combi-nation of Micro and Macro Data: The New Car Market,’ Journal of PoliticalEconomy, 112(1), pp. 68–105.
Brief for Health Care and Indus. Org. Economists as Amici Curiae Supporting Peti-tioners, Little Rock Cardiology Clinic, Prof’l Ass’n v. Baptist Health and BaptistMed. Sys. HMO, Inc., No. 09-1183 (U.S. Apr. 30, 2010).
Capps, C., 2005, ‘The Quality Effects of Hospital Mergers,’ unpublished manuscript.(Bates White LLC, 1300 Eye Street NW, Washington, D.C., U.S.A.)
Capps, C.; Dranove, D.; Greenstein, S. and Satterthwaite, M., 2001, ‘The Silent Major-ity Fallacy of the Elzinga-Hogarty Criteria: A Critique and New Approach toAnalyzing Hospital Mergers,’ National Bureau of Economic Research working paperNo. W8216, (NBER, 1050 Massachusett Avenue, Cambridge, Massachesetts, U.S.A.)
Capps, C.; Dranove, D. and Satterthwaite, M., 2002, ‘Antitrust Policy and HospitalMergers: Recommendations for a New Approach,’ Antitrust Bulletin, 47(4), pp. 677–714.
Capps, C.; Dranove, D. and Satterthwaite, M., 2003, ‘Competition and Market Powerin Option Demand Markets,’ RAND Journal of Economics 34(4), pp. 737–763.
Crooke, P.; Froeb, L.; Tschantz, S. and Werden, G.J., 1999, ‘Effects of AssumedDemand Form on Simulated Postmerger Equilibria,’ Review of Industrial Organiza-tion, 15(3), pp. 205–217.
Dafny, L. 2009, ‘Estimation and Identification of Merger Effects: An Application toHospital Mergers,’ Journal of Law and Economics, 52(3), pp. 523–550.
Danger, K. L. and Frech, H.E. III, 2001, ‘Critical Thinking about Critical Loss inAntitrust,’ Antitrust Bulletin, 46(2), pp. 339–355.
Dranove, D. and Sfekas, A., 2009, ‘The Revolution in Health Care Antitrust: NewMethods and Provocative Implications,’ The Milbank Quarterly, 87(3), pp. 607–632.
Dubé, J-P., 2005, ‘Product Differentiation and Mergers in the Carbonated Soft DrinkIndustry,’ Journal of Economics and Management Strategy, 14 (4), pp. 879–904.
Elzinga, K.G. and Hogarty, T.F., 1973, ‘The Problem of Geographic Market Definitionin Antimerger Suits,’ Antitrust Bulletin, 18(1), pp. 45–81.
Elzinga, K.G. and Hogarty, T.F., 1978, ‘The Problem of Geographic Market Delinea-tion Revisited: The Case of Coal,’ Antitrust Bulletin, 23 (1), pp. 1–18.
Elzinga, K.G. and Swisher, A.W., 2011, ‘Limits of the Elzinga–Hogarty Test in HospitalMergers: The Evanston Case,’ International Journal of the Economics of Business,18(1), pp. 133–146.
Epstein, R.J. and Rubinfeld, D.L., 2004, ‘Effects of Mergers Involving DifferentiatedProducts. Technical Report for Directorate-General Competition, European Commis-sion [Online]’. Available at: http://ec.europa.eu/competition/mergers/studies_reports/effects_mergers_involving_differentiated_products.pdf (Accessed 13 June 2010).
Farrell, J. and Shapiro, C., 2010a, ‘Antitrust Evaluation of Horizontal Mergers: AnEconomic Alternative to Market Definition,’ The B.E. Press Journal of TheoreticalEconomics, 10(1), pp. 1–39.
Farrell, J. and Shapiro, C., 2010b, ‘Upward Pricing Pressure and Critical Loss Analysis:Response,’ The CPI Antitrust Journal, February, pp. 1–17.
Federal Trade Commission and U.S. Department of Justice, 2010, Horizontal MergerGuidelines, Available at: http://www.ftc.gov/os/2010/08/100819hmg.pdf (Accessed 5December, 2010).
Fournier, G. M. and Gai, Y., 2007, ‘What Does Willingness-to-Pay Reveal aboutHospital Market Power in Merger Cases?’ (April, 2007). iHEA 2007 6th WorldCongress: Explorations in Health Economics Paper. Available at SSRN: http://ssrn.com/abstract=993213 (Accessed 12 August, 2011).
MARTIN S. GAYNOR, SAMUEL A. KLEINER AND WILLIAM B. VOGT286
© 2013 The Editorial Board of The Journal of Industrial Economics and John Wiley & Sons Ltd
Frech, H. E. III; Langenfeld, J. and McCluer, R. F., 2004, ‘Elzinga-Hogarty Tests andAlternative Approaches for Market Share Calculations in Hospital Markets,’ Anti-trust Law Journal, 71(3), pp. 921–947.
Froeb, L. M. and Werden, G. J., 2000, ‘An Introduction to the Symposium on the Useof Simulation in Applied Industrial Organization,’ International Journal of the Eco-nomics of Business, 7(2), pp. 133–137.
Fry, A.; McGuire, M. R. and Schmierer, C., 2011, ‘Horizontal Market Power: TheEvolving Law and Economics of Mergers and Cartels,’ George Mason Law Review,18(4), pp. 819–832 Available at: http://www.georgemasonlawreview.org/doc/18-4-CONFERENCE-REPORT.pdf.
Gaynor, M. and Vogt, W. B., 2003, ‘Competition Among Hospitals,’ RAND Journal ofEconomics, 34(4), pp. 764–785.
Geroski, P. and Griffith, R., 2004, ‘Identifying Anti-trust Markets,’ in Neumann, M.and Weigand, J. (eds.), International Handbook of Competition (Edward Elgar,Cheltenham, Gloucestershire, England).
Grennan, M., 2013. ‘Price Discrimination and Bargaining: Empirical Evidence fromMedical Devices,’ American Economic Review, 103(1), pp. 145–177.
Hamilton, B. and Ho, V., 2000, ‘Hospital Mergers and Acquisitions: Does MarketConsolidation Harm Patients?’ Journal of Health Economics, 19(5), pp. 767–791.
Harris, R. and Simons J.J., 1989, ‘Focusing Market Definition: How Much Substitutionis Necessary?’ Research in Law and Economics, 12, pp. 207–226.
Hausman, J.; Leonard, G. and Zona, J. D., 1994, ‘Competitive Analysis with Differen-tiated Products,’ Annales d’Economie et de Statistique, 34, pp. 159–180.
Irving Levin Associates, Inc., 2010, ‘Deals and Dealmakers: The Health Care M&AYear in Review,’ Norwalk, Connecticut, 15th edition. Available at: http://www.levinassociates.com/compallconfirm?sid=6050 (Accessed 16 July, 2010).
Irving Levin Associates, Inc., 2009, ‘Deals and Dealmakers: The Health Care M&AYear in Review,’ Norwalk, Connecticut, 14th edition. Available at: http://www.levinassociates.com/compallconfirm?sid=6050 (Accessed 16 July, 2010).
Irving Levin Associates, Inc., 2008, ‘Deals and Dealmakers: The Health Care M&AYear in Review,’ Norwalk, Connecticut, 13th edition. Available at: http://www.levinassociates.com/compallconfirm?sid=6050 (Accessed 16 July, 2010).
Irving Levin Associates, Inc., 2007, ‘Deals and Dealmakers: The Health Care M&AYear in Review,’ Norwalk, Connecticut, 12th edition. Available at: http://www.levinassociates.com/compallconfirm?sid=6050 (Accessed 16 July, 2010).
Ivaldi, M. and Lörincz, Sz., 2011, ‘Implementation Relevant Market Tests in AntitrustPolicy: Application to Computer Servers,’ Review of Law and Economics, 7(1), pp.31–73.
Jacobson, J. et al., (eds.), 2007, ABA Section of Antitrust Law, Antitrust Law Develop-ments, 6th edition, (American Bar Association, Chicago, Illinois, U.S.A.).
Kaiser Family Foundation, 2005, ‘Trends and Indicators in the Changing Health CareMarketplace,’ publication number 7031. Available at: http://www.kff.org/insurance/7031/print-sec5.cfm (Accessed 16 July, 2010).
Kaplow, L., 2010, ‘Why (Ever) Define Markets?’ Harvard Law Review, 124:437, pp.437–517.
Katz, M. and Shapiro, C., 2003, ‘Critical Loss: Let’s Tell the Whole Story,’ Antitrust,17(2), pp. 49–56.
Keeler, E. B., Melnick, G. and Zwanziger, J., 1999, ‘The Changing Effects of Compe-tition on Non-Profit and For-Profit Hospital Pricing Behavior,’ Journal of HealthEconomics, 18(1), pp.69–86.
Langenfeld, J. and Li, W., 2001, ‘Critical Loss Analysis in Evaluating Mergers,’ Anti-trust Bulletin, 46(2), pp. 299–337.
A STRUCTURAL APPROACH TO MARKET DEFINITION 287
© 2013 The Editorial Board of The Journal of Industrial Economics and John Wiley & Sons Ltd
Makuc, D.; Haglund, B.; Ingram, D. and Kleinman, J., 1991, ‘Health Service Areas forthe United States,’ Vital and Health Statistics, Series 2, No. 112 (National Center forHealth Statistics, 1600 Clifton Road, Atlanta, Georgia, U.S.A.).
Motta, M., 2004, Competition Policy: Theory and Practice (Cambridge University Press,Cambridge, England).
Nevo, A., 2000, ‘Mergers with Differentiated Products: The Case of the Ready-to-EatCereal Industry,’ RAND Journal of Economics, 31(3), pp. 395–421.
O’Brien, D. and Wickelgren, A., 2004, ‘A Critical Analysis of Critical Loss,’ AntitrustLaw Journal, 71, no.1, pp. 161–84.
Peters, C., 2006, ‘Evaluating the Performance of Merger Simulation: Evidence fromthe U.S. Airline Industry,’ The Journal of Law and Economics, 49(2), pp. 627–649.
Pitofsky, R., 1990, ‘New Definitions of Relevant Market and the Assault on Antitrust,’Columbia Law Review, 90(7), pp. 1805–1864.
Romano, P. and Balan, D., 2011, ‘A Retrospective Analysis of the Clinical QualityEffects of the Acquisition of Highland Park Hospital by Evanston NorthwesternHealthcare,’ International Journal of the Economics of Business, 18(1), pp. 45–64.
Scheffman, D. and Spiller, P., 1987, ‘Geographic Market Definition Under the U.S.Department of Justice Merger Guidelines,’ Journal of Law and Economics, 30(1), pp.123–147.
Scheffman, D.; Coate, M. and Silvia, L., 2002, ‘20 Years of Merger Guidelines Enforce-ment at the FTC: An Economic Perspective,’ Federal Trade Commission. Availableat: http://www.justice.gov/atr/hmerger/11255.pdf (Accessed 8 March, 2010).
Schmalensee, R., 2009, ‘Should New Merger Guidelines Give UPP Market Definition?’GCP: The Antitrust Chronicle, December (1), pp. 1–7.
Shapiro, C., 2010a, ‘The 2010 Horizontal Merger Guidelines: from Hedgehog to Fox inForty Years,’ Antitrust Law Journal, 77, pp. 701–759.
Shapiro, C., 2010b, ‘Update From The Antitrust Division: Remarks as Prepared for theAmerican Bar Association Section of Antitrust Law Fall Forum.’ Available at: http://www.justice.gov/atr/public/speeches/264295.pdf (Accessed 26 January, 2012).
Simpson, J., 2003, ‘Geographic Markets in Hospital Mergers: A Case Study,’ Interna-tional Journal of the Economics of Business, 10(3), pp. 291–303.
Town, R. and Vistnes, G., 2001, ‘Hospital Competition in HMO Networks,’ Journal ofHealth Economics, 20(5), pp. 733–753.
Town, R.; Wholey, D.; Feldman, R. and Burns, L. R., 2005. ‘The Welfare Consequencesof Hospital Mergers,’ National Bureau of Economic Research working paper No.12244, (NBER, 1050 Massachusetts Avenue, Cambridge, Massachusetts, U.S.A.).
Train, K., 2003, Discrete Choice Methods with Simulation (Cambridge University Press,Cambridge, England).
United States Census Bureau, 2007, The 2007 Statistical Abstract: The National DataBook.
U.S. Department of Justice, 1982, 1982 Merger Guidelines, Available at: http://www.justice.gov/atr/hmerger/11248.htm (Accessed 14 August, 2012).
Van Reenen, J., 2004, ‘Is There a Market for Work Group Servers? Evaluating MarketLevel Demand Elasticities using Micro and Macro Models,’ (Centre for EconomicPerformance, London School of Economics and Political Science, London,Houghton Street in England).
Varkevisser, M.; Capps, C. S. and Schut, F. T., 2008, ‘Defining Hospital Markets forAntitrust Enforcement: New Approaches and Their Applicability to the Nether-lands,’ Health Economics, Policy and Law, 3, pp. 7–29.
Vita, M. G. and Sacher, S., 2001, ‘The Competitive Effects of Not-for-Profit HospitalMergers: A Case Study,’ Journal of Industrial Economics, 49(1), pp.63–84.
MARTIN S. GAYNOR, SAMUEL A. KLEINER AND WILLIAM B. VOGT288
© 2013 The Editorial Board of The Journal of Industrial Economics and John Wiley & Sons Ltd
Weinberg, M., 2011, ‘More Evidence on the Performance of Merger Simulations,’American Economic Review: Papers and Proceedings, 101(3), pp. 51–55.
Werden, G. J., 1981, ‘The Use and Misuse of Shipments Data in Defining GeographicMarkets,’ Antitrust Bulletin, 26(4), pp. 719–737.
Werden, G., 1990, ‘The Limited Relevance of Patient Migration Data in Market Deline-ation for Hospital Merger Cases,’ Journal of Health Economics, 8(4), pp. 363–376.
Werden, G. J., 1997, ‘Simulating the Effects of Differentiated Products Mergers: APractitioners’ Guide,’ in Caswell, J. A. and Cotterill, R. W. (eds.), Strategy and Policyin the Food System: Emerging Issues (Food Marketing Policy Center, Storrs, Con-necticut, U.S.A.).
Werden, G. J., 2000, ‘Market Delineation under the Merger Guidelines: MonopolyCases and Alternative Approaches,’ Review of Industrial Organization, 16(2), pp.211–218.
Werden, G. J., 2012, ‘Why (Ever) Define Markets? An Answer to Professor Kaplow,’ athttp://ssrn.com/abstract=2004655
Werden, G. J. and Froeb, L. M., 1994, ‘The Effects of Mergers in DifferentiatedProducts Industries: Logit Demand and Merger Policy,’ Journal of Law, Economicsand Organization, 10, pp. 407–426.
Werden, G. J. and Froeb, L. M., 2008, ‘Unilateral Competitive Effects of HorizontalMergers,’ in Buccirossi, P. (ed.), Handbook of Antitrust Economics (MIT Press, Cam-bridge, Massachusetts, U.S.A.).
A STRUCTURAL APPROACH TO MARKET DEFINITION 289
© 2013 The Editorial Board of The Journal of Industrial Economics and John Wiley & Sons Ltd