Embed Size (px)
Citation preview

A Study into the Kinetic Formation and Oxidation
States of Gold Nanoparticles Produced
via Laser Ablation Synthesis in Solution
Yuen-Yan Fong (Mable)
A thesis submitted in total fulfilment of the requirements for the degree of Doctor of Philosophy
Date: December 2011 School of Chemistry and Physics
The University of Adelaide

II
AFFIDAVIT
This work contains no material which has been accepted for the award of any other degree or
diploma in any university or other tertiary institution and, to the best of my knowledge and
belief, contains no material previously published or written by another person, except where
due reference has been made in the text.
I give consent to this copy of my thesis, when deposited in the University Library, being
available for loan and photocopying, subject to the provisions of the Copyright Act 1968. I also
give permission for the digital version of my thesis to be made available on the web, via the
University’s digital research repository, the Library catalogue, the Australasian Digital Theses
Program (ADTP) and also through web search engines, unless permission has been granted by
the University to restrict access for a period of time.
---------------------------------------------------
Yuen-Yan Fong (Mable)

III
ABSTRACT
Nano-sized gold particles are generated by exploiting the laser ablation synthesis in solution
technique (LASiS) from gold metal disc. We report on the kinetics of gold nanoparticle (AuNP)
production during LASiS and the resulting size distributions. Studies were conducted as a
function of laser irradiation in pure water samples, with anionic surfactants, sodium
dodecylsulphate (SDS), and cationic surfactants, cetyltrimethylammonium bromide (CTAB)
and cetyltrimethylammonium chloride (CTAC), in water. Our investigations provide a
mechanistic insight into the laser-induced formation kinetics involved in AuNP production via
1064 nm laser irradiation in aqueous solution. This has been achieved by developing a kinetic
model involving three different AuNP size regimes. Specifically, we have found that there is no
apparent influence of the SDS concentration around the surfactant critical micelle
concentration (CMC) on particle size during AuNP production. This is in contrast to results
observed for size reduction via 532-nm irradiation where a clear CMC effect has previously
been observed. [Yamada et al, J. Phys. Chem. B, 2006, 110, 11751-11756] In addition, we also
explore the surface oxidation states of produced AuNPs in various surfactants using X-ray
photoelectron spectroscopy (XPS). Our investigations shows the AuIII chemical oxidation state
was present in produced AuNPs in high concentrations of CTAB and CTAC, but absent in those
produced in pure water and SDS solution.
Prior to XPS investigations on the LASiS prepared AuNPs, a study to observe the behavior of
gold during irradiation of X-rays was performed. We report on the time evolution of the Au
oxidation state in sodium tetrachloroaurate NaAuCl4 as a function of soft X-ray exposure time.
Our investigations provide mechanistic insight into the photoreduction kinetics from AuIII to
AuI and then subsequently AuI to Au0.We unambiguously show that XPS photoreduction
occurs in stepwise fashion via the AuI state.

IV
ACKNOWLEDGMENTS
I would first like to thank my principle supervisor Professor Mark Buntine for granting me
an opportunity to study this PhD. His passion and enthusiasm on science has inspired me to
become a “great” scientist over the years (it is too memorable). In particular, he has given me
all the freedom to pursue new ideas. Moreover, Mark is a generous man who sincerely cares
for my colloid project since he is a spectroscopist.
I also thank my co-supervisor Associate Professor Greg Metha for his encouragement that
he has given me over the past few years. Especially in the early stage of my PhD, he has
never given up on communicating with me due to my poor language skill which is well
known as “Mablish”.
Dr Jason Gascooke has been a great mentor and friend throughout my PhD, almost like my
supervisor. He has taught me to be patient, advice me on perseverance with my research and
encourage me on how to write a logic scientific paper which is my weakness. Without his
passion of love in science, I would not have finished my PhD. There are so much to thank
him for. In here, I sincerely thank him for everything in my PhD life from the bottom of my
heart.
The past and present laser lab members at the University of Adelaide has shared in the joy
of working hours in the lab, other activities outside the lab e.g. camping trip, student
conferences, barbeques and retreats etc and the core component involved in these activities is
“Alcohol”. I specially thank my academic sister, Dr Olivia Maselli, for sharing the joy of
discussions and her moral and science support. I also thank Australian Government for
granting me the Endeavour Awards to study at University of Tokyo, Japan.
Finally, I sincerely thank my parents, Fook-Cheung Fong and Po-Wah Yam for supporting
me morally and financially throughout my life. They specially flow over to Adelaide,
Australia from Hong Kong every year to support me. The memorable moment is Mum’s
cooking which I missed the most. I also thank my sister (Fiona Fong) and my brother in law
(Cyrus Shum) for their loves and cares. My niece (Eleanor Shum) has given me a lot of
happiness during her first trip of Oz land. I hope my most adorable pets, JoJo, BB and QuQu,
would excuse my absence on their last journey of their lives. The last, during every day of my
tough PhD journey, I would like to thank my be-loved cat, GoGo, who always loves me,
cheers me up on my good and bad days and be there for me.

V
PUBLICATIONS TO DATE
Laser-Based Formation and Properties of Gold Nanoparticles in Aqueous Solution:
Formation Kinetics and Surfactant-Modified Particle Size Distributions.
Fong, Y. Y.; Gascooke, J. R.; Visser, B. R.; Metha, G. F.; Buntine, M. A. J. Phys. Chem. C 2010,
114, 15931-15940.
Photoreduction Kinetics of Sodium Tetrachloroaurate under Synchrotron Soft X-ray
Exposure
Fong, YY; Visser, BR; Gascooke, JR; Cowie, BCC; Thomsen, L; Metha, GF; Buntine, MA; Harris,
HH Langmuir 2011, 27(13), 8099-8104.
Influence of Surfactant Concentration on Laser-Based Gold Nanoparticle Formation
and Stability
Fong, Y. Y.; Gascooke, J. R..; Metha, G. F.; Buntine, M. A.Aus. J. Chem 2011, 65(2), 97-104.

ABBREVIATIONS
AS Australian Synchrotron
Au Gold
Au0 Zero oxidation state of gold
AuI First oxidation state of gold
AuIII Third oxidation state of gold
AuNP Gold Nanoparticles
AuNP(small) Small gold nanoparticles
AuNP(med) Medium gold nanoparticles
AuNP(large) Large gold nanoparticles
AuNP(bulk) Bulk gold nanoparticles
CMC Critical micelle concentration
FWHM Full width half max
HAuCl4 Tetrachloroauric acid
Hz Hertz
Ksol Solubility constant
kl Rate constant for forward reaction of large particle
k-l Rate constant for reverse reaction of large particle
km Rate constant for forward reaction of medium particle
k-m Rate constant for reverse reaction of medium particle
ks Rate constant for forward reaction of small particle
k-s Rate constant for reverse reaction of small particle
kml Rate constant for forward reaction from medium to large particle
klm Rate constant for reverse reaction from medium to large particle
ksm Rate constant for forward reaction from small to medium particle
kms Rate constant for reverse reaction from small to medium particle
ksl Rate constant for forward reaction from small to large particle
kls Rate constant for reverse reaction from small to large particle
k1 Rate constant for forward reaction from AuIII to AuI
k-1 Rate constant for reverse reaction from AuIII to AuI
k2 Rate constant for forward reaction from AuI to Au0
k-2 Rate constant for reverse reaction from AuI to Au0

ABBREVIATIONS VII
LASiS Laser ablation synthesis in solution
NaAuCl4 sodium tetrachloroaurate
nm nanometre
SD Standard Deviation
SDS Sodium dodecylsulphate
Si silicon
SPB Surface plasmon band
TEM Transmission electron microscopy
XPS X-ray photoelectron spectroscopy
Wavelength
Standard deviation

TABLE OF CONTENTS
Affidavit II
Abstract III
Acknowledgments IV
Publications to Date V
Abbreviations VI
Table of Contents VIII
List of Figures XI
List of Tables XVI
Chapter 1.
Overview 1
1.1 Reference 10
Chapter 2.
Experimental Details
2.1 Production of gold nanoparticles 13
2.2 Characterisation of UV-Visible spectroscopy 16
2.2.1 Surface plasom band 16
2.2.2 UV-Vis procedure 19
2.3 Characterisation of transmission electron microscope (TEM) 20
2.3.1 TEM procedure 21
2.3.1.1 Particle size analysis 21
2.4 Characterisation by X-ray photoelectron spectroscopy (XPS) 21
2.4.1 What is photoelectron spectroscopy? 21
2.4.2 Why use synchrotron radiation over an X-ray line source? 22

TABLE OF CONTENTS IX
2.4.3 Synchrotron experiment chamber 26
2.4.4 XPS procedure 27
2.4.4.1 XPS peak analysis 28
2.4.4.2 Error analysis 32
2.5 References 34
Chapter 3.
Kinetic Model Development of Laser-Based AuNP Formation via LASiS 36
Part A: Laser-Based Formation and Properties of Gold Nanoparticles in Aqueous
Solution with sodium dodecylsulphate (SDS): Formation Kinetics and Surfactant-
Modified Particle Size Distributions
3a.1 Introduction 37
3a.2 Experimental Method 39
3a.3 Result and Discussion
3a.3.1 Laser Irradiation of 1064 nm 40
3a.3.1.1 Modelling AuNP Formation and Size Transformations 46
3a.3.1.2 Characterising AuNP Size Regimes 54
3a.3.2 Laser Irradiation of 532 nm 61
3a.4 Summary 69
Part B: Influence of Surfactant Concentration in anionic surfactant (SDS) on Laser-
Based Gold Nanoparticle Formation and Stability
3b.1 Introduction 70
3b.2 Experimental Method 72
3b.3 Micellar Effect 73
3b.4 Summary 86
3.1 Reference 87

TABLE OF CONTENTS X
Chapter 4
The Photoreduction Kinetics of Sodium Tetrachloroaurate under Synchrotron Soft
X-ray Exposure
4.1 Introduction 91
4.2 Experimental Method 93
4.3 Results and Discussion
4.3.1 X-ray Photoelectron Spectra 94
4.3.2 Reinterpretation of previous investigations 96
4.3.3 Kinetic modelling of the photo-reduction of sodium tetrachloroaurate 98
4.4 Conclusion 106
4.5 References 107
Chapter 5.
Influence of Cationic Surfactants on the Formation, Stability and Surface Chemistry
on Gold Nanoparticles produced via the LASiS method
5.1 Introduction 110
5.2 Experimental Method 112
5.3 Results and Discussion
5.3.1 Production of AuNP 113
5.3.2 X-ray Photoelectron spectroscopy (XPS) 120
5.4 Conclusion 128
5.5 References 129
Chapter 6.
Summary 133
The END

LIST OF FIGURES
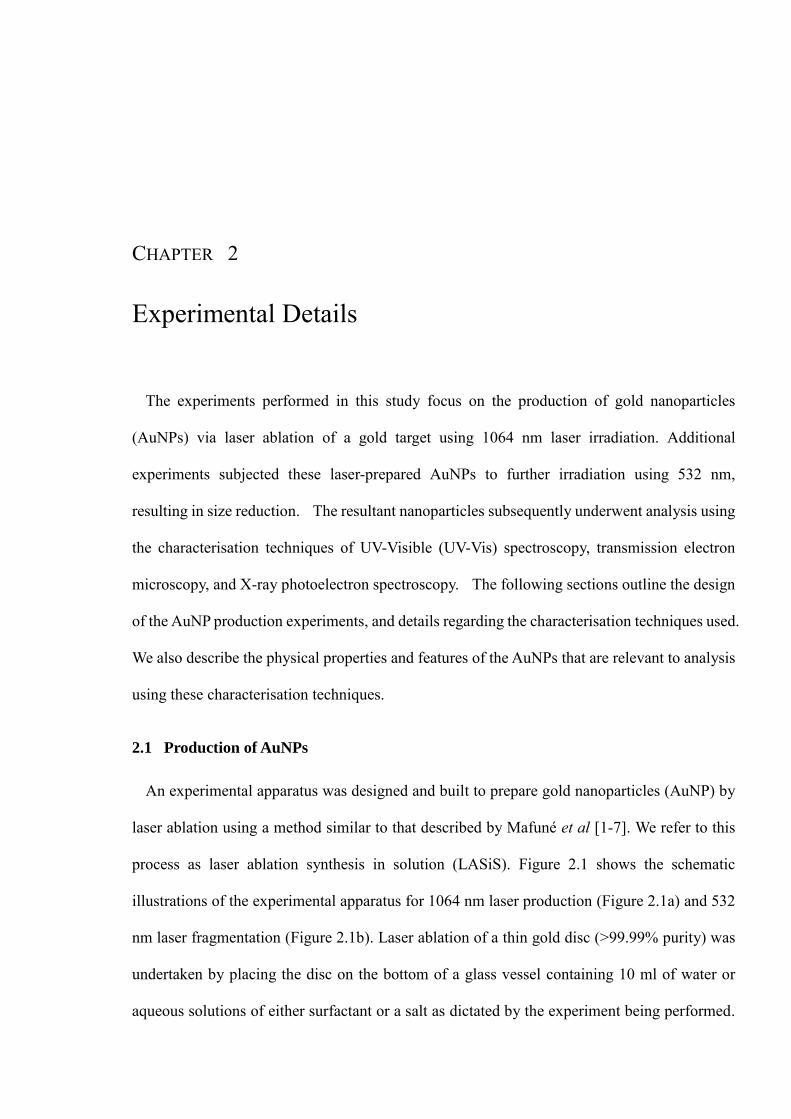
Figure 2.1. Schematic diagrams of experimental apparatus (a) for 1064nm laser production, (b) 532nm laser fragmentation. --------------------------------------------------------- 15
Figure 2.2. Surface plasmon resonance in nanoparticle ------------------------------------------ 16
Figure 2.3. UV − Visible − Near IR absorption spectra of AuNP samples produced via 1064 nm laser irradiation in aqueous solution with 10-2M SDS present, in solution using Cary 5000. Spectra are displayed at 20 min intervals up to a maximum irradiation time of 220 min. ------------------------------------------------------------- 19
Figure 2.4. Schematic Diagram of transmission electron microscope -------------------------- 20
Figure 2.5. Energy-level diagram showing core electron energy levels and the XPS process. ---------------------------------------------------------------------------------------------- 22
Figure 2.6. Schematic diagram of monochromatic X-ray source. ------------------------------ 23
Figure 2.7. Schematic diagram of non-monochromatic X-ray source. ------------------------- 24
Figure 2.8. A schematic diagram of the third generation synchrotron light source at the Australian Synchrotron. ----------------------------------------------------------------- 25
Figure 2.9. Schematic diagram of synchrotron radiation travels through the mirrors towards the experiment chamber at the soft X-ray beamline, Australian Synchrotron. -- 26
Figure 2.10. A schematic diagram of a hemispherical electron analyser. ----------------------- 27
Figure 2.11. Lineshape of Gaussian (G) function, Lorentzian (L) function and sum of Gaussian (30%) and Lorentzian(70%) function (GL). ------------------------------ 30
Figure 2.12. Typical XPS spectrum (a) showing parameters I1, I2, E1, and E2 required and (b) showing the areas (A1 and A2) used for determining the Shirley background. - ---------------------------------------------------------------------------------------------- 31
Figure 3.1. UV-visible absorption spectra of AuNP samples produced via 1064 nm laser irradiation in aqueous solution (a) with no surfactant present, (b) with 10-4M SDS present, and (c) with 10-2M SDS present, in solution. For each surfactant solution concentration, spectra are displayed at 20 min intervals up to a maximum irradiation time of 220 min. ------------------------------------------------ 41

LIST OF FIGURES XII
Figure 3.2. Representative TEM images, together with histograms indicating their associated particle size distributions, of AuNP samples prepared in (a) 0M, (b) 10-4M, and (c) 10-2M SDS concentration after 90 min of 1064 nm laser irradiation. The scale bar in the lower right-hand corner of each image is 100 nm. ---------------------------------------------------------------------------------------------- 43
Figure 3.3. Variation in absorbance of the AuNP in aqueous solution with no surfactant present, with 10-4M SDS present, and with 10-2M SDS present in solution as a function of 10 Hz 1064 nm laser irradiation at (a) SPB max and (c) at 450 nm (within the intervalence transition region ). Panels (b) and (d) show a magnified view of the early time data of panels (a) and (c) respectively. The error bars represent a maximum uncertainty of 0.01 absorbance units found for differences between experiments. See text for a discussion of the phenomena involved. --- 45
Figure 3.4. Variation in absorbance of the AuNP in aqueous solution with no surfactant present as a function of 5Hz (open circle) and 10 Hz (solid square) 1064 nm laser irradiation at (a) SPB max, and (c) at 450 nm (within the inter-valence transition region). The same data recorded within the first 10 minutes of laser irradiation are presented in panels (b) and (d), respectively. ----------------------- 53
Figure 3.5. Absorbance values of the AuNP SPB max and at 450 nm recorded following 40 minutes of 10Hz 1064 nm laser irradiation of a gold disc in 0M SDS solutions with, (a) no further laser irradiation and with the Au disk removed from solution, (b) on-going laser irradiation and with the Au disk removed from solution, and (c) no further laser irradiation and with the Au disk remaining in solutions. ---- 55
Figure 3.6. Data used for the determination of AuNP diameters associated with the „small‟, „medium‟ and „large‟ size regimes for each surfactant concentration. The top panel for each SDS concentration are predictions of the relative concentrations of each AuNP size type resulting from the kinetic model described used to generate the fits in Figure 3.3. The middle panels show the AuNP size distributions presented in Figure 3.2 converted to distributions of the number of atoms in a particle of a given diameter. The lower panels display the resultant cumulative particle size distribution functions, generated following integration and normalization of the data in the middle panels. --------------------------------- 57
Figure 3.7. UV-visible absorption spectra of AuNP samples in aqueous solution produced via 90 minutes of 1064-nm irradiation followed by 532-nm laser irradiation, (a) with no surfactant present, (b) with 10-4 M SDS present, and (c) with 10-2 M SDS present in solution. For each surfactant solution concentration, spectra are displayed at 20-minute intervals up to a maximum 532-nm irradiation time of 120 minutes. ------------------------------------------------------------------------------- 62

LIST OF FIGURES XIII
Figure 3.8. Representative TEM images, together with histograms indicating their associated particle size distributions, of AuNP samples prepared at each surfactant concentration after 90 minutes of 1064-nm laser irradiation followed by 120 minutes of 532-nm irradiation. The horizontal size bar in the lower right-hand corner of each image represents 100 nm. -------------------------------------- 64
Figure 3.9. Variation in absorbance of the AuNP in aqueous solution with no surfactant present, with 10-4M SDS present, and with 10-2M SDS present in solution as a function of 10 Hz 532 nm laser irradiation at (a) SPB max and (b) at 450 nm (within the intervalence transition region ). The error bars represent a maximum uncertainty of 0.01 absorbance units found for differences between experiments. See text for a discussion of the phenomena involved. ------------------------------ 65
Figure 3.10.UV-visible absorption spectra of AuNP samples produced via 1064 nm laser irradiation in aqueous solution (a) with pure water, (b) with 10-4M SDS present, (c) with 10-3M SDS present, (d) with 6 x 10⁻³M SDS present, (e) with 10-2M SDS present, and (f) with 2 x 10⁻²M SDS present in solution. For each surfactant solution concentration, spectra are displayed at 20 min intervals up to a maximum irradiation time of 220 min. ---------------------------------------------- 74
Figure 3.11.Variation in absorbance of the AuNP in aqueous solution in pure water and at various SDS concentrations as a function of 10 Hz 1064 nm laser irradiation. Panels (a), (b), (c) and (e) report absorbances at the surface plasmon band max. Panels (d) and (f) report absorbances at 450 nm (within the intervalence transition region ). Panel (a) reproduces previously reported data; all other panels present data collected for this study. All SDS concentrations are indicated within each panel. Panels (e) and (f) show a magnified view of the early time data of panels (c) and (d), respectively. The error bars represent a maximum uncertainty of 0.01 absorbance units found for differences between experiments. See text for a discussion of the phenomena involved. ------------------------------ 77
Figure 3.12. Representative TEM images, together with histograms indicating their associated particle size distributions, of AuNP samples prepared at (a) 10-3 M, (b) 6 х 10-3 M, and (c) 2 х 10-2 M SDS concentrations after 90 min of 1064 nm laser irradiation. The scale bar in the lower right-hand corner of each image represents 100 nm. ----------------------------------------------------------------------- 82
Figure 3.13.Particle size distributions of AuNP as a function of SDS concentration after 90 min of 1064 nm laser irradiation. The dashed line represents the critical micelle concentration of SDS in aqueous solution (8mM). The solid white line represents the average particle diameter (i.e. not the most probable size) at each concentration and is intended to merely guide the eye. See text for a discussion of the observed trends. ------------------------------------------------------------------- 83

LIST OF FIGURES XIV
Figure 4.1. XPS spectra of sodium tetrachloroaurate as a function of time under synchrotron X-ray exposure. The dotted lines represent the peak position of the 4f5/2 peaks of each gold species. ------------------------------------------------------------------------ 95
Figure 4.2. Fitted XPS spectra of sodium tetrachloroaurate at select times during synchrotron X-ray irradiation. Superimposed on each experimental spectrum are fits using our kinetic model, the “individual fits” on the left-hand panel and the “global fits” on the right-hand panel (see text for details). The spectra are. (a) scan 1, (b) scan 2, (c) scan 4, (d) scan 8 and (e) scan 15. The following colour scheme is used to display the individual components of the fit. experimental data (orange); Au0 (green); AuI (red); AuIII (blue); and total (black). ------------------- 99
Figure 4.3. (a) Population of the different gold species as a function of synchrotron exposure time. (b) The same data recorded within the first 400 seconds of exposure. The data points represent the relative population of each oxidation state. The lines represent best fits to the data using our model (see text for more details). The error bars represent 3 standard deviations as determined by the least squares fitting procedure. ------------------------------------------------------- 101
Figure 4.4. Population of the different gold species as a function of synchrotron exposure
time. The activated kinetic transformation channels are k1 and k2. AuI and Au
III
calculated data does not fit with the experimental data. The resultant rate
constants are k1 = 4.61 x 10⁻²
s-1
and k2 = 1.43 x 10⁻³
s-1
. ------------------------- 103
Figure 4.5. Relative population of the different gold species as a function of synchrotron
exposure time. The activated kinetic transformation channels are k1, k-1 and k2.
The calculated fit to the AuIII
experimental data is quite good, but not for Au0 at
intermediate time, nor the AuI species at long exposure times. The resultant rate
constants are k1 = 6.95 x 10⁻²
s-1
, k-1 = 2.32 x 10⁻²
s-1
and k2 = 1.49 x 10⁻³
s-1
.
-------------------------------------------------------------------------------------------- 104
Figure 4.6. Population of the different gold species as a function of synchrotron exposure
time. The activated kinetic transformation channels are k1, k2 and k-2. AuI and
AuIII
calculated data does not fit with the experimental data. The resultant rate
constants are k1 = 4.28 x 10⁻²
s-1
, k2 = 1.99 x 10⁻³
s-1
and k-2 = 8.13 x 10⁻⁴
s-1
.
-------------------------------------------------------------------------------------------- 104
Figure 5.1. UV-visible absorption spectra of AuNP smaples produced via 1064 nm laser irradiation in aqueous solution in aqueous solution with (a) 10-5M CTAB, (b) 10-
3M CTAB, (c) 10-5M CTAC, and (d) 10-3M CTAC present in solution. For each surfactant solution concentration, spectra are displayed at 20 min intervals up to a maximum irradiation time of 220 min. -------------------------------------------- 114

LIST OF FIGURES XV
Figure 5.2. Normalised UV-visible absorption spectra of AuNP smaples produced via 1064 nm laser irradiation in aqueous solution in aqueous solution with (a) 10-5M CTAB, (b) 10-3M CTAB, (c) 10-5M CTAC, and (d) 10-3M CTAC present in solution. For each surfactant solution concentration, spectra are displayed at 2 min intervals for the first 10 min and then 20 min intervals up to a maximum irradiation time of 220 min. ----------------------------------------------------------- 116
Figure 5.3. Variation in absorbance of the AuNP in aqueous solution with no surfactant present with (a) 10-5M CTAB and (b) 10-3M CTAB present in solution as a function of 10 Hz 1064 nm laser irradiation at the SPB max . See text for discussion of the phenomena involved. --------------------------------------------- 118
Figure 5.4. Representative TEM images, together with histograms indicating their associated
particle size distributions, of AuNP samples prepared at each surfactant concentration after 300 min of 1064 nm laser irradiation. The horizontal bar in the lower right-hand corner of each image represents 200 nm. ------------------ 121
Figure 5.5. Fitted XPS spectra of gold nanoparticles generated in aqueous solution with (a) pure water, (b) 10-2M SDS, (c) 10-5M CTAB, (d) 10-3M CTAB, (e) 10-5M CTAC, and (f) 10-3M CTAC present at first interaction with synchrotron X-ray irradiation. ------------------------------------------------------------------------------- 123
Figure 5.6. Fitted XPS spectra of gold nanoparticles generated in aqueous solution with (a) pure water, (b) 10-2M SDS, (c) 10-5M CTAB, (d) 10-3M CTAB, (e) 10-5M CTAC, and (f) 10-3M CTAC present at 15th scan with synchrotron X-ray irradiation. ------------------------------------------------------------------------------- 125
Figure 5.7. Fitted XPS spectra of gold nanoparticles generated in aqueous solution with (a) 10-3M NaBr, (b) 10-3M NaCl present, at 15th scan with synchrotron X-ray irradiation. ------------------------------------------------------------------------------- 127

XVI
LIST OF TABLES
Table 3.1. Resultant 1064 nm Kinetic Paremeters Determined Following a Nonlinear Least Squares Fit of the Absorbance Data to the Kinetic Model Given in Scheme 2; all reported uncertainties represent three standard deviations error (3) SDS: sodium dodecyl sulphate; klm, kms, ksm: rate constants for interconversion between the different gold nanoparticle species as defined in Scheme 3. Ksol: solubility constant which is derived from independent data fit for each SDS concentration. See text for details. ---------------------------------------------------- 51
Table 3.2. Resultant 532-nm kinetic parameters determined following a non-linear least squares fit of the absorbance data to the kinetic model given in Scheme 3; all reported uncertainties represent three standard deviations error (3) SDS: sodium dodecyl sulphate; klm, kms, ksm: rate constants for interconversion between the different gold nanoparticle species as defined in Scheme 3. Ksol: solubility constant which is derived from independent data fit for each SDS concentration. See text for details. ------------------------------------------------------ 67
Table 3.3. Resultant 1064 nm Kinetic Parameters (Rate Constants) Determined Following a Nonlinear Least Squares Fit of the Absorbance Data to the Kinetic Model Given in Scheme 1a. All reported uncertainties represent 3 Standard Deviations Error (3). SDS: sodium dodecyl sulphate; kl, km, ks, k-m: rate constants for interconversion between the different gold nanoparticle species as defined in Scheme 2. -------------------------------------------------------------------------------- 79
Table 3.4. Determination of the Concentration of AuNP in Solution and the Number of SDS Molecules Available per AuNP following 300 Minutes of Laser Irradiation. See Text for Details. ------------------------------------------------------------------------- 85
Table 4.1. Rate Constants for the Photo-reduction of Sodium Tetrachloroaurate. See Text For Kinetic Model Details. ----------------------------------------------------------------- 105
Table 5.1. Resultant 1064 nm Kinetic Paremeters Determined Following a Nonlinear Least Squares Fit of the Absorbance Data to the Kinetic Model Given in Scheme 2. ; all reported uncertainties represent three standard deviations error (3) CTAB: Cetyltrimethylammonium bromide, CTAC: Cetyltrimethylammonium chloride; kl, km, ks, k-m: rate constants for interconversion between the different gold nanoparticle species as defined in Scheme 2. See text for details. ---------- 119

CHAPTER 1
Overview
Gold is a prototypical transition metal used to study the changing properties of clusters as
their size increases from several atoms up to the bulk. In particular, for small gold nanoparticles
(AuNPs) it has been found that differing numbers of gold atoms results in specific physical and
chemical properties [1-6]. Physical properties that depend on the particle size include the
surface plasmon resonance of metal particles (strong absorption band) [7,8] and quantum
confinement [9,10], whilst changes to chemical properties such as chemical oxidation [11,12]
and bonding interactions with other molecules [13,14] have been observed. It is anticipated that
the tuneability of these properties will result in their potential use in diverse applications such as
catalysts [2,3], biochemical sensors [4,5], cancer therapy [15] and separation science [16].
The standard method for producing gold nanoparticles is via chemical reduction of a gold salt,
such as HAuCl4, by an oxidant such as NaClO4 [17-20]. It is necessary to perform the
reduction in the presence of stabilising molecules, such as surfactants or citrate, to prevent the
formed nanoparticles from coagulating. The earliest modern scientific reports of AuNPs date
back to Faraday’s work over 150 years ago [21]. Renewed interest in the production of gold
nanoparticles occurred in the 1950s and 1960s when detailed investigations on AuNP synthesis
were undertaken. These studies focussed on optimising reaction conditions for producing
AuNPs, and investigated the effect of coagulation. For example, Turkevich and co-workers
[22,23] studied the coagulation kinetics of synthesised AuNP by varying the ion concentration
of citrate and reported that the ion concentration is directly proportional to the coagulation rate

1. OVERVIEW 2
of the nanoparticle. Since the 1970s, synthesis of gold nanoparticles of a pre-chosen particle
size has been investigated using various combinations of metal precursors [24], solvents [24],
reducing agents [18,25,26], stabilising molecules [24,26,27], and reaction conditions [28].
Frens undertook pioneering work on the production of monodispersed gold nanoparticles by
changing the reducing agent and stabilising molecule (in this case citrate)-to-gold ratio. It is
now possible to produce particles of a specific size in the diameter range from 10 to 150 nm
[29]. Turkevich and Kim [30] have performed a similar work on nano-sized palladium metals
where they altered the reducing agents and preparation techniques. The study showed the
reduction of a palladium salt suspended in a polyacrylate sol yields monodispersed
nanoparticles with a controlled diameter within the range 5.5 to 45 nm. The majority of metal
nanoparticle research throughout the 1970s, 1980s and 1990s was based on refining the
parameters to synthese monodispered nanoparticles of a desired size. Additionally during this
period of time, biological approaches to the synthesis of AuNPs having controlled size
distributions were explored. For example, Murray and co-workers [31] showed that it was
possible to synthese monodispersed AuNP in the presence of a natural enzyme (coenzyme A) or
a drug such as tiopronin.
Furthermore, it was found that by varying experimental parameters the morphology of the
nanoparticles could be controlled allowing shapes such as nano-rod, nano-cube, nano-triangle,
nano-octahedron etc., to be produced [1]. For example, Turkevich and Kim [30] discovered
triangular shaped nano-sized particles can be produced by changing the reducing agent. The
optical properties and the surface structure of various shaped nanoparticles have extensively
been studied [1]. A summary of nanoparticle production using the shape control agent,
poly(vinyl pyrolidone) polymer, via reduction methods has been reported by Yang and
co-workers [1]. They have also reported that the variously shaped nanoparticles have a

1. OVERVIEW 3
structure that is bound by {111}, {100}, and {110} crystallographic planes. Interestingly, the
rod shaped nanoparticles have the ability to alter the optical properties (position of the surface
plasmon band) [32]. Nano-rods were found to have two distinct surface plasmon peaks, one for
the longitudinal direction and one for the axial direction. By increasing in the length of the
nano-rod, the wavelength maximum of the longitudinal surface plasmon peak shifts further
towards longer wavelength [33].
Surface functionalisation of gold nanoparticles is routinely used to enhance properties of the
nanoparticles, such as solubility, and reactivity for tasks, such as a spectroscopic labelling for
biological sensing. A process of producing functionalised nanoparticles is to produce
nanoparticles in solution in the presence of a ligand that has already been suitably
functionalised. However, this synthesis can be problematic [28]. This attributed to the
properties of stabilisers, i.e., surface packing, bond strength and solubility. The normal process
for synthesising nanoparticles is to use a ligand for nanoparticle synthesis that subsequently
undergoes a further chemical reaction to produce the desired functionality. In the case of thiol
ligand gold nanoparticles, however, ligand exchange reactions are the preferred method.
Chechik and Caragheorgheopol [28] have undertaken ligand exchange reactions to replace the
thiol ligands used during AuNP synthesis with the desired functionalised thiol ligands. These
studies reported that ligand exchange reactions cannot fully complete due to interchain
interactions, solvent-chain interactions and steric effects. They have also determined not all
types of thiol ligands are suitable for ligand exchange reactions. Fernig and co-workers [34]
have undertaken a similar ligand exchange experiment using peptide ligands and gold
nanoparticles produced in the presence of citrate. They concluded that the size of peptide ligand
prevents complete ligand exchange with citrates on the surface of the nanoparticles.
Some of the issues highlighted above surrounding the functionalisation of nanoparticles

1. OVERVIEW 4
would be negated if alternative synthesis approaches existed that didn’t require the presence of
stabilisers. Other complications associated with chemical reduction methods involve long
reaction times, high temperature and mulit-step processes. An alternative metal nanoparticle
production technique that offers the potential to overcome many of these complications is laser
ablation synthesis in solution (LASiS). LASiS is a laser-based technique for producing
nanoparticles in situ from a metal target. This nanoparticle production technique is straight
forward, and fast comparing with synthesis using standard chemical reduction methods. It
doesn’t necessarily involve chemical precursors and thus extra contamination in the solution
can be avoided. Briefly, a high intensity laser is fired onto the metal target that is located in a
liquid. The resulting plasma ejects atoms into the surrounding liquid where they coalesce into
nanoparticles. In the case of AuNP LASiS, the nanoparticles can undergo further laser
irradiation using high powered 532-nm laser to modify the particle size distribution. The
intense laser pulses provide energy to allow the AuNPs to rapidly heat up and cause
fragmentation to smaller in particle sizes. A significant advantage of LASiS is that AuNPs can
be produced in liquid without the presence of stabilising molecules. Thus, these nanoparticles
can be easily functionalised as desired.
Research on AuNPs involving laser-based techniques is divided into two categories – (a) the
production of AuNPs using a laser ablation technique (LASiS), and (b) laser modification of
nanoparticles prepared via LASiS or chemical reduction. First category of studies involves
determining the mechanism of the production process through the use of theory, simulations,
and experiments. The second category investigates the physical properties of nanoparticles
irradiated by laser absorption such as melting, size reduction and reformation.
Considerable effort has been directed towards understanding the mechanism of AuNP
production using LASiS. Theoretical and experimental methods have been employed to gain

1. OVERVIEW 5
insight into the production process. Itina [35] has reported a series of theoretical calculations
exploring the role of experimental parameters on processes such as generation of shock waves,
laser plume development, and the role of cavitation bubbles during nanoparticle formation. The
results show that the solution temperature affects the size distributions of nanoparticles and
confirms that a narrow size distribution of small nanoparticles can be generated with ultrashort
(picosecond) laser ablation. Henglein and co-workers [25] pioneered experimental work on
LASiS when they used laser ablation of a thin silver film in solvents to produce nanometre-sized
particles. Cristoforetti and co-workers [36] have conducted experiments producing gold
nanoparticles in surfactant solution via LASiS. They reported that at laser fluences around 12
Jcm-2 a large number of bubbles form and float to the surface of the liquid. These bubbles
significantly absorb the laser energy resulting in reduced photon density at the target surface.
Campagnini and co-workers [37] have demonstrated the possibility of producing gold
nanoparticles in solution without ligands using 1064-nm LASiS at a laser fluence of
10 – 20 J cm-2. Amendola and Meneghetti [13,38,39] have studied the production of AuNPs in
organic solvents, such as n-hexane and toluene, and aqueous salt solutions, using 532-nm
irradiation. Mafuné and co-workers have also reported a similar production of AuNPs using
surfactant solutions and 532-nm irradiation [40]. Note that in this case 532 nm corresponds to
the SPB in AuNPs, therefore shape modification of the AuNPs can occur.
Laser modification of nanoparticles pre-formed via a variety of methods has been studied
extensively. One of the early works was performed by Hartland and co-workers where they
irradiated chemically synthesised silver nanoparticles with 355-nm laser irradiation resulting in
size reduction of the nanoparticles. Subsequently, size reduction studies for metal nanoparticles
with and without ligands or surfactant [7,13,37,40-42] has been investigated to observe the
modification of the particle size distribution. For the case of AuNPs, 532-nm laser irradiation is
routinely used since this wavelength corresponds to the strong surface plasmon absorption band
1. OVERVIEW 6
in AuNPs. Amendola and Meneghetti [13,38,39] have reported a series of studies where AuNPs
produced in organic solvents, such as n-hexane and toluene, and aqueous salts underwent size
reduction using 532-nm laser irradiation. These results show that the average diameter of gold
nanoparticles depend on the solvent, with nanoparticles produced in toluene having an average
diameter of 1.8 nm and those produced in salt solutions varying between 6 – 21 nm depending
on the salt’s concentration. Mafuné and co-workers have also performed a series of experiments
with surfactant in aqueous solution and conclude that the size distribution of gold nanoparticle
has reduced significantly at concentrations of surfactant above the critical micelle
concentration (CMC) [40].
An interesting application is that laser irradiation of a solution containing two different
metals nanoparticles. Hartland and co-workers [43] have demonstrated that laser-induced
heating of a solution containing both synthesised gold and silver nanoparticle results in
formation of gold-silver alloy nanoparticles. Dawson and Kamat [44] have reported that
synthesised AuNPs anneal together with titanium dioxide after laser irradiation to enhance the
charge-transfer efficiency. Mafuné and co-workers [45] have also explored that nanoscale
soldering behaviour consisting of platinum nanoparticles soldered by AuNP under laser
irradiation onto a mixed solution of laser-produced gold and platinum nanoparticles.
Inasawa and co-workers [42] have undertaken transient absorption spectroscopic studies of
aqueous AuNP samples on the nanosecond timescale. Spectra recorded following 355 nm laser
pulses of solutions containing AuNPs (formed from laser-induced size reduction of initial gold
nanoparticles). The workers attribute shape transformation and size reduction mechanisms to
melting and vaporization of AuNP, respectively. The melting (shape transformation) process is
found to occur on a time scale of ~30 ps under “moderate” irradiation laser powers (6-17 mJ
cm-2 pulse-1) whilst the vaporization (size reduction) process dominated under “high”

1. OVERVIEW 7
irradiation laser powers (> 17 mJ cm-2 pulse-1) with a time constant said to be, “much less than
5 ns” [42]. Mafuné and co-workers have undertaken similar experiments and conclude that AuNP
size reduction is caused by a Coulombic explosion [46]. Further recent studies under single and
double nanosecond 532-nm laser pulse conditions have explored the fragmentation and
aggregation behaviour of AuNP formed in aqueous SDS solutions [47,48]. The exact
mechanism for nanoparticle formation remains unclear, and consequently there are numerous
theoretical and experimental studies devoted to elucidating the processes responsible for
nanoparticle formation [49].
Although many laser-based studies have been performed with AuNPs, an understanding of
the kinetics involved in the production and size reduction of AuNPs remains to be developed.
Furthermore, there is an open question as to whether micelle stabilisation plays a role in the
initial 1064-nm LASiS AuNP production stage. Additionally, the role that surfactants play on
the surface chemistry of the LASiS produced nanoparticle has not been extensively investigated.
This thesis contains a comprehensive study on the formation kinetics of AuNPs produced in
surfactants using the laser ablation synthesis in solution (LASiS) method. By determining their
size distributions and oxidation state of gold an insight into the LASiS method can be inferred.
Thesis Structure
Chapter 2 of this thesis contains an overview of the experimental apparatus for producing
gold nanoparticles using the LASiS technique. Additionally, the chapter discusses the
techniques of UV-Visible spectroscopy (UV-Vis), transmission electron microscopy (TEM),
and X-ray photoelectron spectroscopy (XPS), which were used to characterise the nanoparticles
after production. The application of these techniques to characterising the properties of AuNPs
is also discussed.

1. OVERVIEW 8
Chapter 3 present a study on the time evolution of AuNPs produced via the LASiS technique
in pure water samples and in the presence of sodium dodecylsulphate (SDS) surfactant at
various concentrations. During the production process, UV-Vis spectra were recorded at regular
intervals and the final size distributions were measured. This allowed a kinetic model to be
developed that explained the production and fragmentation process of the AuNPs prepared in
SDS solutions. Part A of Chapter 3 presents a study at concentrations above and two
concentrations below the SDS critical micelle concentration (CMC) in water. This study
provides a mechanistic insight into the laser-induced formation kinetics involved in AuNP
production via 1064 nm laser irradiation in aqueous solution, as well as the determination of
different AuNP size regimes. Following preparation via laser ablation at 1064 nm, we show that
532 nm laser irradiation in the absence of surfactant generates AuNP that are both small in size
and possess a narrow particle size distribution. This distribution remains narrow and shifts to
smaller average particle size with increasing surfactant concentration. Previous studies by
Mafune and co-workers [46,50,51] have indicated that size reduction using 355 nm and 532 nm
irradiation is strongly dependent on the surfactant, particularly concentration around the CMC.
Part B of Chapter 3 presents an extensive analysis of the 1064-nm LASiS produced gold
nanoparticles around the CMC. The results show that while a low concentration of SDS plays a
role in the formation kinetics, there is no apparent influence of the SDS concentration near the
CMC on particle size during AuNP production. The work contained in Chapter 3 has been
published [41] and content from Part B of Chapter 3 has also been published [52].
Chapter 4 outlines the photoreduction kinetics of NaAuCl4 under synchrotron soft X-ray
exposure. The molecule sodium tetrachloroaurate (NaAuCl4) was investigated due to this
molecule being a precursor for producing nanoparticles chemically. The time evolution of the
NaAuCl4 oxidation states were reported as a function of soft X-ray exposure time on a silicon
1. OVERVIEW 9
surface using XPS. Our investigations provide mechanistic insight into the photoreduction
kinetics where gold is reduced from AuIII to AuI and then AuI to Au0.We unambiguously show
that XPS photoreduction occurs in a stepwise fashion via the AuI state via first-order kinetics.
This work has also been published [53].
In Chapter 5, we explore the time evolution of AuNPs produced via LASiS method in the
presence of the cationic surfactants, cetyltrimethylammonium bromide (CTAB) and
cetyltrimethyl ammonium chloride (CTAC). We apply our laser-induced formation kinetics
model involving the relative stabilities of different AuNP size regime from Chapter 3.
Furthermore, the AuNPs produced in these surfactants, as well as those produced in SDS and
pure water, were examined using synchrotron based XPS. Our investigation showed that the
AuNPs produced in the presence of cationic surfactant contain oxidised gold on the surface of
the nanoparticles, whereas only metallic gold is produced in SDS and pure water.
Finally, Chapter 6 summarises all the highlights of AuNP produced in surfactants at various
concentrations via LASiS technique in the production and/or fragmentation processes. This
includes the findings from each chapter using the techniques of UV-Vis spectra, transmission
electron microscope, and X-ray photoelectron spectroscopy. All the results of gold nanoparticle
have been summarised together into this final chapter.

1. OVERVIEW 10
1.1 References
(1) Tao, A. R.; Habas, S.; Yang, P. Small 2008, 4, 310-325.
(2) Deng, W.; Frenkel, A. I.; Si, R.; Flytzani-Stephanopoulos, M. Journal of Physical Chemistry C 2008, 112, 12834 - 12840.
(3) Lim, D. C.; Hwang, C. C.; Gantefor, G.; Kim, Y. D. Physical Chemistry Chemical Physics 2010, 12, 15172-15180.
(4) Li, L. D.; Chen, Z. B.; Zhao, H. T.; Guo, L.; Mu, X. J. Sensors and Actuators B-Chemical 2010, 149, 110 -115.
(5) Zhang, Y. Z.; Wang, J.; Xu, M. L. Colloids and Surfaces B-Biointerfaces 2010, 75, 179 -185.
(6) Daniel, M. C.; Astruc, D. Chemical Reviews 2004, 104, 293-346.
(7) Amendola, V.; Meneghetti, M. Journal of Physical Chemistry C 2009, 113, 4277-4285.
(8) Link, S.; El-Sayed, M. A.; Mohamed, M. B. Journal of Physical Chemistry B 2005, 109, 10531-10532.
(9) Varnavski, O.; Ramakrishna, G.; Kim, J.; Lee, D.; Goodson, T. J. Am. Chem. Soc. 2010, 132, 16-17.
(10) Varnavski, O. P.; Goodson, T.; Mohamed, M. B.; El-Sayed, M. A. Physical Review B 2005, 72.
(11) Sylvestre, J. P.; Poulin, S.; Kabashin, A. V.; Sacher, E.; Meunier, M.; Luong, J. H. T. Journal of Physical Chemistry B 2004, 108, 16864-16869.
(12) Karadas, F.; Ertas, G.; Ozkaraoglu, E.; Suzer, S. Langmuir 2005, 21, 437-442.
(13) Amendola, V.; Meneghetti, M. Physcial Chemistry Chemical Physics 2009, 11, 3805-3821.
(14) Lim, T. W.; Park, S. H.; Yang, D. Y.; Kong, H. J.; Lee, K. S. Applied Physics a-Materials Science & Processing 2006, 84, 379-383.
(15) Cai, W.; Gao, T.; Hong, H.; Sun, J. Nanotechnology, Science and Applications 2008, 1, 17-32.
(16) Liu, F. Journal of Chromatography A 2009, 1216, 9034 - 9047.
(17) Turner, M.; Golovko, V. B.; Vaughan, O. P. H.; Abdulkin, P.; Berenguer-Murcia, A.; Tikhov, M. S.; Johnson, B. F. G.; Lambert, R. M. Nature 2008, 454, 981 - 983.
(18) Henglein, A. Chemistry of Materials 1998, 10, 444-450.
1. OVERVIEW 11
(19) Lim, T. W.; Park, S. H.; Yang, D. Y.; Kong, H. J.; Lee, K. S. Applied Physics A - Materials Science & Processing 2006, 84, 379-383.
(20) Johnson, S. R.; Evans, S. D.; Brydson, R. Langmuir 1998, 14, 6639 - 6647.
(21) Faraday, M. Philosophical Transactions Royal Society London 1857, 147, 145-181.
(22) Enustun, B. V.; Turkevich, J. Journal of the American Chemical Society 1963, 85, 3317-&.
(23) Turkevich, J.; Stevenson, P. C.; Hillier, J. Discussions of the Faraday Society 1951, 55.
(24) Daniel, M. C.; Astruc, D. Chem. Rev. 2004, 104, 293 - 346.
(25) Henglein, A. Journal of Physical Chemistry 1993, 97, 5457-5471.
(26) Henglein, A.; Giersig, M. Journal of Physical Chemistry B 1999, 103, 9533-9539.
(27) Grabar, K. C.; Brown, K. R.; Keating, C. D.; Stranick, S. J.; Tang, S. L.; Natan, M. J. Analytical Chemistry 1997, 69, 471-477.
(28) Caragheorgheopol, A.; Chechik, V. Physical Chemistry Chemical Physics 2008, 10, 5029-5041.
(29) Frens, G. Nature-Physical Science 1973, 241, 20-22.
(30) Turkevic.J; Kim, G. Science 1970, 169, 873-879.
(31) Templeton, A. C.; Chen, S. W.; Gross, S. M.; Murray, R. W. Langmuir 1999, 15, 66-76.
(32) Sardar, R.; Funston, A. M.; Mulvaney, P.; Murray, R. W. Langmuir 2009, 25, 13840-13851.
(33) Vernon, K.; Funston, A. M.; Novo, C.; Gomez, D. E.; Mulvaney, P.; Davis, T. J. Nano Letters 2010, 10, 2080-2086.
(34) Levy, R.; Thanh, N. T. K.; Doty, R. C.; Hussain, I.; Nichols, R. J.; Schiffrin, D. J.; Brust, M.; Fernig, D. G. Journal of the American Chemical Society 2004, 126, 10076-10084.
(35) Itina, T. E. Journal of Physical Chemistry C 2011, 115, 5044-5048.
(36) Cristoforetti, G.; Pitzalis, E.; Spiniello, R.; Ishak, R.; Muniz-Miranda, M. Journal of Physical Chemistry C 2011, 115, 5073-5083.
(37) Compagnini, G.; Scalisi, A. A.; Puglisi, O. Physical Chemistry Chemical Physics 2002, 4, 2787-2791.
(38) Amendola, V.; Rizzi, G. A.; Polizzi, S.; Meneghetti, M. Journal of Physical Chemistry B 2005, 109, 23125-23128.
(39) Amendola, V.; Meneghetti, M. Journal of Materials Chemistry 2007, 17, 4705-4710.

1. OVERVIEW 12
(40) Mafune, F.; Kondow, T. Chemical Physics Letters 2003, 372, 199-204.
(41) Fong, Y. Y.; Gascooke, J. R.; Visser, B. V.; Metha, G. F.; Buntine, M. A. Journal of Physical Chemistry C 2010, 114, 15931-15940.
(42) Inasawa, S.; Sugiyama, M.; Noda, S.; Yamaguchi, Y. Journal of Physical Chemistry B 2006, 110, 3114-3119.
(43) Hodak, J. H.; Henglein, A.; Giersig, M.; Hartland, G. V. Journal of Physical Chemistry B 2000, 104, 11708-11718.
(44) Kamat, P. V.; Flumiani, M.; Hartland, G. V. Journal of Physical Chemistry B 1998, 102, 3123-3128.
(45) Mafune, F.; Kohno, J.; Takeda, Y.; Kondow, T. Journal of the American Chemical Society 2003, 125, 1686-1687.
(46) Yamada, K.; Tokumoto, Y.; Nagata, T.; Mafune, F. Journal of Physical Chemistry B 2006, 110, 11751-11756.
(47) Matsuo, N.; Muto, H.; Miyajima, K.; Mafune, F. Physical Chemistry Chemical Physics 2007, 9, 6027-6031.
(48) Muto, H.; Miyajima, K.; Mafune, F. Journal of Physical Chemistry C 2008, 112, 5810-5815.
(49) Mortazavi, S. Z.; Parvin, P.; Reyhani, A.; Golikand, A. N.; Mirershadi, S. Journal of Physical Chemistry C 2011, 115, 5049-5057.
(50) Mafune, F.; Kohno, J.; Takeda, Y.; Kondow, T. Journal of Physical Chemistry B 2002, 106, 7575-7577.
(51) Shoji, M.; Miyajima, K.; Mafune, F. Journal of Physical Chemistry C 2008, 112, 1929-1932.
(52) Fong, Y.-Y.; Gascooke, J. R.; Metha, G. F.; Buntine, M. A. Australian Journal of Chemistry 2011, 65, 97-104.
(53) Fong, Y. Y.; Visser, B. V.; Gascooke, J. R.; Cowie, B. C. C.; Thomsen, L.; Metha, G. F.; Buntine, M. A.; Harris, H. H. Langmuir 2011, 27, 8099-8104.
CHAPTER 2
Experimental Details
The experiments performed in this study focus on the production of gold nanoparticles
(AuNPs) via laser ablation of a gold target using 1064 nm laser irradiation. Additional
experiments subjected these laser-prepared AuNPs to further irradiation using 532 nm,
resulting in size reduction. The resultant nanoparticles subsequently underwent analysis using
the characterisation techniques of UV-Visible (UV-Vis) spectroscopy, transmission electron
microscopy, and X-ray photoelectron spectroscopy. The following sections outline the design
of the AuNP production experiments, and details regarding the characterisation techniques used.
We also describe the physical properties and features of the AuNPs that are relevant to analysis
using these characterisation techniques.
2.1 Production of AuNPs
An experimental apparatus was designed and built to prepare gold nanoparticles (AuNP) by
laser ablation using a method similar to that described by Mafuné et al [1-7]. We refer to this
process as laser ablation synthesis in solution (LASiS). Figure 2.1 shows the schematic
illustrations of the experimental apparatus for 1064 nm laser production (Figure 2.1a) and 532
nm laser fragmentation (Figure 2.1b). Laser ablation of a thin gold disc (>99.99% purity) was
undertaken by placing the disc on the bottom of a glass vessel containing 10 ml of water or
aqueous solutions of either surfactant or a salt as dictated by the experiment being performed.

2. EXPERIMENTAL DETAILS 14
All water samples were purified with a Waters Milli-Q system and subsequently distilled prior
to use. The immersed metal plate was irradiated with the fundamental output (1064 nm) of a
Nd:YAG laser (Quantel YG-981C) which was focused by a planoconvex lens with a focal
length of 250 mm. (Figure 2.1a) The laser operated at a repetition rate of 10 Hz, with a pulse
width of 7 ns (full width at half maximum, FWHM) and a beam diameter (before focusing) of 8
mm. All reports in this thesis describe 10 Hz laser irradiation repetition rates unless explicitly
mentioned otherwise. To prevent the laser ablation process burning a hole through the thin gold
disc, a rotation stage rotating at 1 rev min-1 was constructed. The laser was operated at a power
of 7.5 mJ pulse-1, focused to a spot size of 66 μm, yielding an ablation fluence of 2.2 × 10⁵ mJ
cm-2pulse-1. Samples were irradiated for at least 220 minutes. UV-Vis spectra are also recorded
at regular intervals during laser irradiation.
For fragmentation experiments, samples of AuNP prepared by the above method, but for a
maximum irradiation time of 90 minutes, were further irradiated with the second harmonic
output (532 nm) of the Nd:YAG laser. For these subsequent experiments, the thin Au disc was
removed and the laser focal point was raised from the bottom of the glass vessel to the middle of
the liquid. (Figure 2.1b) A magnetic stirring bar was introduced to provide uniform mixing
and was located at the bottom of the glass vessel. The 532-nm laser power was maintained at
20.5 mJ pulse-1 with a focal spot size of 33 μm, corresponding to a fluence of 2.4 × 10⁵ mJ
cm-2pulse-1. Samples were irradiated for 120 minutes and UV-Vis spectra taken at regular
intervals during laser irradiation.

2. EXPERIMENTAL DETAILS 15
Figure 2.1. Schematic diagrams of experimental apparatus (a) for 1064nm laser production,
(b) 532nm laser fragmentation.
Au
Nd:YAG laser1064 nm
Magnetic Stirrer
Nd:YAG laser532 nm
(a) (b)
f =
25
0 n
m
f = 25
0 n
m

2. EXPERIMENTAL DETAILS 16
2.2 Characterisation using UV-Visible (UV-Vis) spectroscopy
2.2.1 Surface Plamon Band
Unlike bulk gold, nano-sized spherical gold has a distinctive absorption band in the visible
region whose peak position, max , depends on the size of the nanoparticle [8]. This absorption
feature is known as the surface plasmon band (SPB) and is observed in many nanoparticle
systems. When the gold nanoparticle is excited by visible light at frequencies corresponding to
SPB absorption, the electron cloud surrounding the nanoparticle is driven into oscillations
(Figure 2.2).
Figure 2.2. Surface plasmon resonance in nanoparticles [8].
The SPB feature results from a combination of absorption and scattering by the nano-sized
metallic particles. It can be explained using Mie’s scattering theory, which is based upon
Maxwell’s theories of electromagnetism, by considering the interference of electric fields
inside and outside a spherical particle. Mie’s scattering theory gives the extinction coefficient,
, for N particles of volume, V, as [9]:

2. EXPERIMENTAL DETAILS 17
(2.1)
where is wavelength of the absorbing radiation and is the dielectric constant of the
surrounding medium. and represent the real and imaginary parts of the material
dielectric function, respectively. That is, the dielectric function, is given by
, where is the angular frequency of the incident radiation. The absorbance,
A, is given by
where L is the path length [8]. Equation 2.1 shows that does not
explicitly depend on the particle size, but may be affected via changes in as a function of
particle size. Kreibig [10,11] evaluated how changes with particle size and temperature.
If does not depend strongly on , then the absorption peak position is governed by the
minimum of the denominator of equation 2.1. Thus, the maximum extinction coefficient
occurs when . This implies the SPB extinction coefficient and absorption peak
position of nanoparticle can be affected by the local changes in the dielectric function.
Although Mie scattering theory explains the SPB peak position as a function of particle size,
it is important to note that previous research has observed that the bandwidth of the SPB
absorption feature increases as the particle size decreases [5,7,12-15]. Both SPB bandwidth and
the absorption peak position of the nanoparticle can be explained with the Drude-Sommerfeld
theory which gives an expression for the size-dependent electron collision frequency. This
theory has been discussed in detailed by Kreibig [10,11,16] and Kubo et al [17]; the dielectric
function can be expressed as , where is the contribution from
the interband term for d electrons and is a Drude term for quasi-free electrons. The
functional form for is given by [9,18]:
(2.2)

2. EXPERIMENTAL DETAILS 18
where
is the plasmon frequency, is free electron density, e is electron
charge, is the vacuum permittivity, is effective mass of the electrons. is a damping
constant from the electron scattering process in bulk material. These scattering processes are
mainly electron-electron (e-e), electron-phonon (e-p) and electron-defect (e-d) scattering [16] .
The bulk damping constant is given by:
, (2.3)
where is the lifetime of the electron excitation. For the case of nanoparticles, the electron
mean free path of conduction electrons is limited because the conduction electrons collide with
the surface of the particle. Thus, electron-surface scattering is important and consequently the
damping constant for nanoparticles requires modification of the bulk damping constant through
the addition of an extra term. Consequently, the damping constant for nanoparticles, ,
becomes a function of the particle radius and is related to the bulk damping constant, , by the
following expression: [9]
(2.4)
where is the Fermi velocity in bulk material ( =1.39 × 108 cm s-1 in bulk gold), r is the
radius of nanoparticle, and A is a theory-dependent parameter that includes details of the
scattering processes.
The dependence in equation 2.4 directly effects the nanoparticle’s dielectric constant.
Kreibig [10,11] and Kubo et al [17] have reported, in detail, the relationships between the volume of
the nanoparticles, dielectric constant and broadening of the surface plasmon band both theoretically
and experimentally. The theoretical study [10,11,17] reported that a decrease in the volume of a
nanoparticle will result in an increase in the dielectric constant. Experimental studies [14] have
shown the size- dependent dielectric constant for silver clusters produced in the gas phase and
deposited on silicon oxide surfaces influenced the broadening of the plasmon band due to a

2. EXPERIMENTAL DETAILS 19
charge-transfer process.
2.2.2 UV – Vis procedure
During the experimental procedures detailed above, UV − Visible spectra of samples
undergoing laser irradiation were recorded at 10-minute intervals with a UV – Vis
spectrophotometer (Cary, Bio 300). Errors in absorbance measurements between consecutive
runs of a LASiS experiment using the same experimental setup have a maximum uncertainty of
±0.01 absorbance units; the uncertainty in absorbance within a given experiment (investigating
the same sample) is several orders of magnitude smaller. When it was necessary to investigate
absorption in the near infrared (NIR), a UV – Visible − NIR spectrophotometer (Cary 5000)
was used. Typical UV – Visible − NIR spectra recorded during the synthesis of gold
nanoparticles are shown in Figure 2.3. The spectra show no appreciable absorption at 1064 nm
and thus, we expect minimal influence from the 1064 nm ablation laser during nanoparticle
production.
Figure 2.3. UV − Visible − Near IR absorption spectra of AuNP samples produced via 1064
nm laser irradiation in aqueous solution with 10-2M SDS present, in solution
using Cary 5000. Spectra are displayed at 20 min intervals up to a maximum
irradiation time of 220 min.
0.0
0.5
1.0
1.5
2.0
2.5
400 600 800 1000 1200
Absorb
ance
Wavelength /nm
220 mins
20 mins

2. EXPERIMENTAL DETAILS 20
2.3 Characterisation using Transmission Electron Microscopy (TEM)
Transmission electron microscopy (TEM) is a technique with the ability to image the
nano-scale dimensions of the AuNP samples. Images were captured using a Philips CM100
electron microscope housed at Adelaide Microscopy (The University of Adelaide, Australia).
As shown in Figure 2.4, the TEM instrument is an evacuated chamber consisting of (from the
top, see Figure 2.4) electron gun, condenser aperture, specimen port, objective aperture,
objective lens, diffraction lens, intermediate lens, projector lens, CCD camera, and fluorescent
screen. A tungsten filament electron gun is used to produce electrons that are accelerated to high
kinetic energies (40-120keV). The electrons then pass through lens and condenser aperture
before reaching the sample at the specimen port. After passing through the sample, the electron
beam passes through a series of electromagnetic lens. By changing these magnetic fields of the
lens, an image of the sample can be magnified up to 240 000 times its original size. The
resulting magnified images are recorded using a CCD camera that is inserted before the
fluorescent screen.
Figure 2.4. Schematic Diagram of transmission electron microscope [19].

2. EXPERIMENTAL DETAILS 21
2.3.1 TEM procedure
Samples following laser irradiation were prepared for TEM analysis using a Philips CM100
electron microscope. AuNP solutions were placed on copper mesh TEM grids coated on one
side with cellulose nitrate. The solutions were deposited on the coated side of the grids before
being left to dry at room temperature since the coated film is easily destroyed in a heated
environment. The sample is then secured to the grid holder of the TEM microscope by a metal
ring located at the end of the holder. The sample holder is inserted into the microscope ready for
examination. The images were captured with an emission energy of 80kV, and a magnification
factor of 130 000 times.
2.3.1.1 Particle Size Anaylsis
All recorded images were analysed using an analysis program (Olympus, iTEM) to measure
the particle sizes. The diameter of each particle was measured manually using the “arbitrary”
tool in the program. It is important to note that the resolution of the images generated by the
TEM allows the analysis program to measure particle sizes down to 2 nm. Each measured
particle was recorded on a spreadsheet within the program to build up a size distribution. To
improve the statistics of the particle size distribution determinations, multiple images were
analysed to produce the final histogram.
2.4 Characterisation by X-ray photoelectron spectroscopy (XPS)
2.4.1 What is photoelectron spectroscopy?
Photoelectron spectroscopy records the kinetic energy of electrons emitted from solids,
liquids and gases following excitation from electromagnetic radiation. Commonly,
photoelectron spectroscopy interrogates core electrons from an atom, corresponding to energies
in the range of ultraviolet and gamma rays region ie ~ 20 – 700 eV. A commonly used ionization
source is X-ray photons and the technique is called X-ray photoelectron spectroscopy (XPS).

2. EXPERIMENTAL DETAILS 22
XPS is used for determining the chemical composition of the surface of materials. Photons from
an X-ray source are absorbed by the core-level electrons causing these electrons to be emitted
(Figure 2.5). The kinetic energy, KE, of emitted electrons is measured and the binding energy
determined using the expression [20]:
(2.4)
where is the energy of the incoming photon, BE is the binding energy of the atomic orbital
from which the electron originates, and
is the spectrometer work function. Small
differences in the electron binding energy are observed depending upon the chemical
environment of the atom, e.g. determination of the oxidation state of the gold atom at the
AuNPs. Moreover, the scans can be recorded as a function of time to observe X-ray induced
changes.
Figure 2.5. Energy-level diagram showing core electron energy levels and the XPS process.
2.4.2 Why use synchrotron radiation over an X-ray line source?
The sources of the X-ray radiation for accessing core electrons in XPS experiments are X-ray
line sources in laboratory instruments and synchrotron radiation available at synchrotrons. It is
X-ray photons(hv)
Photoelectrons
1s
2s
2p
3s
3p

2. EXPERIMENTAL DETAILS 23
important to understand how X-rays are generated. In the case of a laboratory-based X-ray
source, commonly two X-ray energies are generated; from aluminium K(E = 1486 eV) and
magnesium K (E = 1254 eV) X-rays. The X-ray source is a vacuum sealed tube consisting of
an electron gun (filament), aluminium or magnesium anode, and/or quartz crystal. The
electrons are emitted from the electron gun onto a water cooled metal anode target generating
the X-rays. Monochromatic X-rays (Figure 2.6)are generated by diffraction from a curved
quartz crystal allowing a narrow range of X-ray wavelengths to be focussed to a spot size of
20 – 200m before irradiating the sample. Non-monochromatic X-rays (Figure 2.7) are not
been focused and have a broad (10-30 mm) beam spot size. Whilst the bandwidth from
non-monochromatic sources is wider than that from monochromatic assemblies, it is important
to note that in both cases the X-ray emission energy is fixed.
Figure 2.6. Schematic diagram of monochromatic X-ray source.
CrystalAdjustment
Electron Gun
AngleAdjustment
Anode
Sample
Crystal

2. EXPERIMENTAL DETAILS 24
Figure 2.7. Schematic diagram of non-monochromatic X-ray source [21].
Synchrotron based X-rays are generated by a synchrotron light source. Figure 2.8 shows a
schematic diagram of the third generation synchrotron light source at the Australian
Synchrotron (AS). The production of synchrotron light involves in 6 major components;
electron gun (1), linear accelerator or linac (2), booster ring (3), storage ring (4), beam exit
position (5) and customised facilities or end stations (6). Photons are generated from a high
energy electron gun and travel through a linear accelerator. At this point, the electrons are
accelerated close to the speed of light. These accelerated electrons then travel into the booster
ring which is controlled by electromagnets to force the electrons into circular path. This booster
ring increases the electron energy to 3 GeV (giga electron volts) before travelling to the storage
ring. This storage ring consists of straight sections and arcs. Each arc contains bending magnets
to force the electrons to change direction. At the same time, emission of a photon occurs and
this is called “synchrotron radiation”.

2. EXPERIMENTAL DETAILS 25
Figure 2.8. A schematic diagram of the third generation synchrotron light source at the
Australian Synchrotron [22].
When synchrotron radiation is emitted out of the storage ring, it travels through filters,
monochromators, and mirrors etc to the analysis chamber. The soft X-ray beamline was used in
these experiments. Figure 2.9 shows the beamline diagram from the front end to the analysis
chamber (end station). The Apple II EPU (undulator) and radiation shutter (both highlighted in
Figure 2.9) are software controlled. An undulator is a device consisting of an array of dipole
magnets of alternating polarity. Electrons are forced to undergo oscillations resulting in the
emission of electromagnetic radiation. Through adjustment of the undulator, the incident
energy of synchrotron radiation at the Australian Synchrotron soft X-ray beamline can be tuned
between 80-2500eV. The advantage of using synchrotron radiation is that it is tuneable to
photon energies lower than that of laboratory-based X-ray sources. Since it is well known that
the XPS sampling depth is directly proportional to the incident energy [23], this allows
synchrotron X-rays to probe different depths of sample materials. The sampling depth for
samples probed by typical the laboratory-based XPS is fixed to ~10 nm, whereas for
synchrotron based XPS the sampling depth can be reduced to 2 nm [24].

2. EXPERIMENTAL DETAILS 26
Figure 2.9. Schematic diagram of synchrotron radiation travels through the mirrors
towards the experiment chamber at the soft X-ray beamline, Australian
Synchrotron [22].
2.4.3 Synchrotron Experiment chamber
At the end station, a specific designed XPS instrument for soft X-ray beamline by the
beamline scientists was setup to analyse the nanoparticle samples. A selected photon energy (as
discussed in section 2.4.2) is directed into the experimental chamber. The photoelectron emitted
from the samples can then be detected via the lens system and hemispherical analyser to
measure the kinetic energy. From a knowledge of the incident photon energy, the binding
energy of each ejected electron can be determined.
Figure 2.10 shows the schematic diagram of the emitted electron passing through the lens
system and the hemispherical analyser. The lens system acts very similar to time-of-flight
which allows slowing down the incoming electrons, known as the pass energy with a range
between 10 – 200 eV. The hemisphere analyser allows the passing emitted electrons disperse
onto the detector as a function of kinetic energy [25].

2. EXPERIMENTAL DETAILS 27
Figure 2.10. A schematic diagram of a hemispherical electron analyser.
2.4.4 XPS procedure
Samples undergoing XPS analysis were prepared by depositing one drop of the nanoparticle
mixture onto a clean 6 x 6 mm n-doped silicon (Si) wafer (SPI supplies), with subsequent
drying under vacuum. The Si wafer was then fixed to double-sided copper tape to ensure the
electrical conductivity of the sample. Photoelectron spectra were recorded at the Soft X-Ray
Beamline at the Australian Synchrotron (AS) using a SPECS Phoibos 150 Hemispherical
Electron Analyser. Samples were continuously irradiated for a period of 900 seconds.
During this irradiation, sequential XPS spectra were recorded by scanning the electron analyser
from 95 to 70 eV in 0.05 eV increments. This corresponds to the 4f region of gold. Each scan
required 50 seconds to complete followed by ~16 second delay before the next scan started.
The synchrotron radiation was set to a photon energy of 650eV [26], and adjusted to yield an
irradiation spot size of ~600 m. The electron analyser pass energy was set to 10 eV, yielding
an instrumental resolution of 295 meV in terms of resultant electron kinetic energy [26]. XPS
e¯
V1 V2
Electron detector
hv
e¯
e¯e¯
Sample
HemisphericalAnalyser

2. EXPERIMENTAL DETAILS 28
spectra in the region of the Au 4f peaks were calibrated using the Au 4f7/2 peak (84.0 eV) of gold
foil [27].
We employed an X-ray photon flux at the AS of approximately 1012 photons mm-2 s-1,
conditions similar to those recently discussed by Hu et al. [28] Under these conditions, it is
highly unlikely that we are inducing localised heating of the sample or the substrate. For
example, at a photon energy of 650 eV, the total irradiation power is approximately 100 W
over an area of ~600 m2. The temperature rise of the sample can be estimated using Fourier’s
Law, where q is the conductive heat transfer (W), K is the thermal conductivity of material
(Wm-1K-1), A is the heat transfer area (m2), is the temperature difference across the material (K),
and S is the material thickness (m). Assuming the thickness of the sample on the surface is 1m,
the temperature difference across the sample is determined to be less than 0.1 °C. Fourier’s Law
assumes a steady state approximation, but in reality the synchrotron radiation is pulsed, having
a pulse width of ~0.1 ns and ~2 ns between pulses. This will cause the instantaneous
temperature rise to increase by approximately a factor of 20. Thus, this is insufficient
monochromatic X-ray power to result in thermal damage. Moreover, under the defocussed
irradiation conditions, combined with the low detector pass energy of 10 eV, the
synchrotron-based XPS studies reported here afford more photoelectrons being produced and
recorded at higher resolutions than is possible in laboratory-based instruments.
2.4.4.1 XPS peak analysis
For each recorded XPS spectrum, the data were de-convoluted to obtain the relative
population of gold in each oxidation state. This was achieved by fitting the spectra to a sum of
peaks using non-linear least squares minimisation using a Microsoft Excel spreadsheet
algorithm. This was preferred over the specialist XPS program, CasaXPS [29], since the
CasaXPS program does not have the capability to fit the ratio of the basis functions defining the

2. EXPERIMENTAL DETAILS 29
lineshape and, furthermore, is not designed to simultaneous fit of all the XPS spectra to a
kinetic model (required for investigating X-ray induced changes in gold). The observed peaks
from the recorded spectra were modelled using a combination of Gaussian and Lorentzian
functions [30].
The Gaussian function is given by:
, (2.5)
and the Lorentzian function is given by:
(2.6)
where E is the binding energy of the electron, Epeak is the binding energy corresponding to
maximum intensity, and F is the full width at half maximum (FWHM). For a Gaussian function,
the lineshape appears as a symmetric bell curve. Similarly, a Lorentzian function has a
symmetric lineshape, but is slower to return to baseline compared to the Gaussian function.
Examples of the two functions are displayed in Figure 2.11.
The shape of a peak in an XPS spectrum results from measurement and instrumental
broadening combined with lifetime broadening. Lifetime broadening is modelled using a
Lorentzian function, whereas other sources of broadening are assumed to be Gaussian. Thus the
experimental lineshape will be a convolution of the two functions, which is referred to as a
Voigt function. It is common practice not to use the Voigt function, but instead use a functional
form that is simpler yet mimics the function. These simpler functions are termed pseudo-Voigt
functions, the most common of which is the sum of a Gaussian and Lorentzian function [30].

2. EXPERIMENTAL DETAILS 30
The sum of Gaussian and Lorentzian (SGL) function is given by:
(2.7)
where m is the percentage of Lorentzian lineshape. Figure 2.11 shows this type of lineshape
overlayed with the Gaussian and Lorentzian basis functions. For the fitting of our XPS spectra,
we have found that a pseudo-Voigt function comprised of the sum of Gaussian (30%) and
Lorentzian (70%) functions gave the best fit when comparing all scans.
Figure 2.11. Lineshape of Gaussian (G) function, Lorentzian (L) function and sum of
Gaussian (30%) and Lorentzian(70%) function (GL).
In order to model the recorded XPS spectra, a Shirley background was applied to model the
electron scattering background resulting from baseline asymmetry due to energy loss process
occurring as the photoelectrons are ejected from the surface material and maintain the intrinsic
lineshape from the computed data [31,32]. Firstly, we define the baseline parameters in Figure
828486889092
Gaussian (G)
Lorentzian (L)
Sum of GL
Counts
/ arb
itra
ry u
nits
Binding Energy (eV)

2. EXPERIMENTAL DETAILS 31
2.12 (a). The intensities I1 and I2 are intensities of the background at the end points E1 and E2
that bracket the peaks of interest.
Figure 2.12. Typical XPS spectrum (a) showing parameters I1, I2, E1, and E2 required and
(b) showing the areas (A1 and A2) used for determining the Shirley
background.
The Shirley background intensity, Is, at an energy E is determined using the areas marked A1
and A2 in Figure 2.12(b) to generate the background intensity from the raw data via:
. (2.9)
80828486889092
Cou
nts
/ a
rbitra
ry u
nits
Binding Energy (eV)
I1I2
E1
E2
(a)
(b)

2. EXPERIMENTAL DETAILS 32
Here, is the background rise, (I1 - I2), A1(E) and A2(E) are the areas between point E and E1
and E2, respectively.
The Au 4f spin-orbit (4f7/2 and 4f5/2) energy splitting was fixed at 3.67eV, but the absolute
peak positions were allowed to vary. The ratio of peak areas between the 4f7/2 and 4f 5/2 peaks
are expected to appear as 4:3 due to the (2j+1) multiplicity of each spin-orbit state [20,24].
This ratio was either held constant, or allowed to vary, depending upon the fitting procedure
used. The full-width-at-half-maximum of all Au species peaks were forced to be the same,
however, this value was varied. A value of 1.28 eV resulted in the best least-squares fit for all
data presented in this thesis. A comprehensive discussion of the fitting procedures employed is
given in the chapters 4 and 5.
2.4.4.2 Error analysis
The inbuilt minimisation routine used in the spreadsheet program (Solver, Microsoft Excel)
does not provide standard deviations with the best fit values. Consequently the error matrix was
determined manually as discussed by Bevington [33] and Press et al [34]. The error matrix is
derived from the curvature matrix, which is one half of the Hessian matrix. This Hessian matrix
is the matrix (H) of second order partial derivatives of a function, f, at particular point (P) with
respect to all the variables and it is expressed as:
(2.10)
where a1, a2…, ai are the fitted parameters. In the case of a non-linear least squares fitting, the
function ( f ) is the merit function
. (2.11)

2. EXPERIMENTAL DETAILS 33
The curvature matrix , then becomes
. (2.12)
The inverse of the curvature matrix is taken which gives the covariance matrix (commonly
called the error matrix) of the standard errors :
(2.13)
where i2 is variance of parameter i and ij is covariance between parameter i and j. The above
equations reply on being known. If we proceed by minimising the function
and, assuming the fit to the experimental data is believed to be a good fit,
then , where N is the number of data points, M is the number of fitted parameters.
All data points in the spectrum are assumed to have the same the standard deviation ( ) which
can therefore be expressed as:
. (2.14)
We then use this value to determine the error matrix using Equations 2.11 to 2.13.

2. EXPERIMENTAL DETAILS 34
2. 5 References
(1) Mafune, F.; Kohno, J.; Takeda, Y.; Kondow, T. Journal of Physical Chemistry B 2001, 105, 9050-9056.
(2) Mafune, F.; Kohno, J.; Takeda, Y.; Kondow, T.; Sawabe, H. Journal of Physical Chemistry B 2001, 105, 5114-5120.
(3) Mafune, F.; Kohno, J. Y.; Takeda, Y.; Kondow, T. Journal of Physical Chemistry B 2002, 106, 8555-8561.
(4) Mafune, F.; Kohno, J. Y.; Takeda, Y.; Kondow, T. Journal of Physical Chemistry B 2002, 106, 7575-7577.
(5) Mafune, F.; Kohno, J.; Takeda, Y.; Kondow, T. Journal of Physical Chemistry B 2003, 107, 12589-12596.
(6) Mafune, F.; Kohno, J.; Takeda, Y.; Kondow, T. Journal of the American Chemical Society 2003, 125, 1686-1687.
(7) Mafune, F. Chemical Physics Letters 2004, 397, 133-137.
(8) Link, S.; El-Sayed, M. A. Journal of Physical Chemistry B 1999, 103, 8410-8426.
(9) Bohren, C. F.; Huffman, D. R. Absorption and Scattering of Light by Small Particles; Wiley-Interscience: New York, 1983.
(10) Kreibig, U. Zeitschrift Fur Physik 1970, 234, 307-&.
(11) Kreibig, U. Journal of Physics F-Metal Physics 1974, 4, 999-1014.
(12) Sonnichsen, C.; Franzl, T.; Wilk, T.; von Plessen, G.; Feldmann, J.; Wilson, O.; Mulvaney, P. Physical Review Letters 2002, 88.
(13) Mafune, F.; Kohno, J.; Takeda, Y.; Kondow, T. J. Phys. Chem. B 2002, 106, 8555-8561.
(14) Hovel, H.; Fritz, S.; Hilger, A.; Kreibig, U.; Vollmer, M. Physical Review B 1993, 48, 18178-18188.
(15) Sonnichsen, C.; Franzl, T.; Wilk, T.; von Plessen, G.; Feldmann, J. New Journal of Physics 2002, 4.
(16) Kreibig, U.; Vollmer, M. Optical Properties of Metal Clusters; Berlin: Springer, 1995.
(17) Kawabata, A.; Kubo, R. Journal of the Physical Society of Japan 1966, 21, 1765-&.
(18) Sharma, V.; Park, K.; Srinivasarao, M. Materials Science and Engineering R 2009, 65, 1-38.
(19) Britannica, E. electron microscope, Retrieved from http://www.britannica.com/EBchecked/topic/183561/electron-microscope, 2011.

2. EXPERIMENTAL DETAILS 35
(20) Moulder, J. F.; Stickle, W. F.; Sobol, P. E. Handbook of X-Ray Photoelectron
Spectroscopy; Perkin-Elmer Corporation: Minnesota, 1993.
(21) Jezierski, G. Classification of X-ray tubes, Retrieved from http://www.xraylamp.webd.pl/files/podzial_lamp_rentgenowskich_3(4)en.pdf, 7th
August 2011.
(22) Australian Synchrotron, B. R., Clayton, VIC 3168, Australia.
(23) Vickerman, J. C. Surface analysis - the principle techniques; John Wiley & Sons, 1997.
(24) Stöhr, J.; Siegmann, H. C. Magnetism From Fundamentals to Nanoscale Dynamics; Springer: New York, 2006.
(25) Wicks, R. C.; Ingle, N. J. C. Review of Scientific Instruments 2009, 80, 053108.
(26) Cowie, B. C. C.; Tadich, A.; Thomsen, L. AIP Conference Proceedings 2010, 1234, 307 - 310.
(27) Beattie, D. A.; Kempson, I. M.; Fan, L. J.; Skinner, W. M. International Journal of Mineral Processing 2009, 92, 162-168.
(28) Hu, B. B.; Yu, L. F.; Wang, G. J.; Hutton, S.; Huang, H. Z.; Du, Z. L. Measurement 2010, 43, 1299-1304.
(29) Fairley, N. CasaXPS Version 2.3.14 ed.; [email protected], 1999-2008.
(30) Hughes, H. P.; Scarfe, J. A. Journal of Physics-Condensed Matter 1996, 8, 1421-1438.
(31) Shirley, D. A. Physical Review B 1972, 5, 4709-4714.
(32) Vegh, J. Journal of Electron Spectroscopy and Related Phenomena 2006, 151, 159-164.
(33) Bevington, P. R.; Robinson, D. K. Data Reduction and Error Analysis for the Physical Sciences, Third ed.; McGraw - Hill New York, 2003.
(34) Press, W. H.; Teukolsky, S. A.; Vetterling, W. T.; Flannery, B. P. Fortran Numerical Recipes, Second ed.; the Press Syndicate of the University of Cambridge: United States of America, 2001.

CHAPTER 3
Kinetic Model Development of Laser-Based AuNP
Formation via LASiS
In this chapter, an investigation into the production of gold nanoparticles in solutions
containing the anion surfactant sodium doceylsulphate (SDS) is presented. Gold nanoparticles
are generated using the laser ablation synthesis in solution (LASiS) method. This chapter
contains two parts that represent two distinct studies: Part A, titled “Laser-Based Formation and
Properties of Gold Nanoparticles in Aqueous Solution: Formation Kinetics and
Surfactant-Modified Particle Size Distributions” describes the time evolution of gold
nanoparticles produced via LASiS technique in pure water samples and in the presences of SDS
at one concentration above, and two concentrations below, the SDS critical micelle
concentration (CMC) in water. The kinetic model for production and fragmentation process
was developed using the UV-Vis spectra recorded at regular intervals and measured size
distributions. Part B, titled “Influence of Surfactant Concentration on Laser-Based Gold
Nanoparticle Formation and Stability” expands on the study in part A, by investigating the time
evolution of produced gold nanoparticles in SDS at more concentrations, especially near the
CMC value.

37
Part A: Laser-Based Formation and Properties of Gold
Nanoparticles in Aqueous Solution: Formation Kinetics and
Surfactant-Modified Particle Size Distributions
3a.1 Introduction
Gold nanoparticles (AuNP) have attracted considerable attention due to their size dependent
physical and chemical properties [1], which have found wide-ranging applications [2-10]. The
synthesis of AuNP by direct laser ablation in a variety of solvents has become a well established
technique[11-21]. Apart from the experimental simplicity of the laser ablation approach, the
laser-based preparation of AuNP has the ability to influence the particle size and shape
distributions [14,22-32]. Moreover, recent exciting work has demonstrated the ability to use
laser irradiation of AuNP to form ohmic contacts, both between individual AuNP [33], and with
other metal nanoparticles [34].
Laser irradiation has been reported to result in both AuNP aggregation and fragmentation,
depending upon a variety of experimental conditions including the irradiating laser wavelength
and power, and the concentration of any surfactant present in solution [11,15,16,35].
Considerable effort has been directed towards understanding the mechanism(s) of
photo-initiated transformations in AuNP. For example, the aggregation and morphological
changes in gold nanorods are thought to be induced by melting of the AuNP after
photoabsorption [28-30,36]. Other studies have suggested fragmentation, or dissociation,
mechanisms that involve multiphoton absorption followed by melting and vaporisation of the
gold particles [27,37]. Mafuné and co-workers have published a series of studies reporting that
AuNP in aqueous solution can aggregate or dissociate depending upon the concentration of
surfactant present. For the anionic surfactant sodium dodecylsulphate (SDS), when the

3A. LASER-BASED FORMATION OF AUNPS VIA LASIS 38
surfactant concentration is below the solution critical micelle concentration (CMC) laser
irradiation is reported to lead to particle aggregation. Conversely, at surfactant concentrations
above the CMC laser irradiation is said to result in particle dissociation [16,17,32].
Inasawa and co-workers [38] have undertaken transient absorption spectroscopic studies of
aqueous AuNP samples on the nanosecond timescale. These studies attribute 355 nm induced
transient spectral signatures to, “the formation of smaller gold nanoparticles resulting from
laser-induced size reduction of initial gold nanoparticles”. These workers ascribe melting and
vaporisation of AuNP to shape transformation and size reduction mechanisms, respectively.
The melting (shape transformation) process is found to occur on a time scale of ~30 ps under
“moderate” irradiation laser powers (6-17 mJ cm-2 pulse-1) whilst the vaporisation (size
reduction) process dominated under “high” irradiation laser powers (> 17 mJ cm-2 pulse-1) with
a time constant said to be, “much less than 5 ns” [38]. Hartland and co-workers [39,40] have
also demonstrated that size reduction occurs via a melting process. These studies show that the
nanoparticles emit electrons into the solvent to increase the temperature around the particles
thus causing melting. Mafuné and co-workers have undertaken similar experiments and
conclude that AuNP size reduction is caused by a Coulombic explosion [32]. Further recent
studies under single and double nanosecond 532-nm laser pulse conditions have explored the
fragmentation and aggregation behaviour of AuNP formed in aqueous SDS solutions [41,42].
The transient absorption studies, in particular, provide considerable insight into the kinetics
of laser-induced shape transformations and size reductions of AuNP on a single-shot basis.
Amendola and Meneghetti have very recently published a comprehensive overview of current
thinking on aspects of noble metal nanoparticle production on a single-shot basis [43].
Nonetheless, an understanding of the competition kinetics between the purported laser-induced
AuNP aggregation and fragmentation, particularly over longer timescales and in the presence of

3A. LASER-BASED FORMATION OF AUNPS VIA LASIS 39
surfactant, remains to be fully developed. In Part A of this chapter we explore the formation
kinetics of AuNP created by nanosecond laser ablation. We report on the time evolution of
AuNP size distributions as a function of 1064- and 532-nm laser irradiation in pure water
samples and at surfactant concentrations both above and below the SDS CMC in water. Our
investigations provide new insight into the photochemistry and kinetics involved in AuNP
production via nanosecond laser irradiation in aqueous solution.
In terms of particle size distributions, we show that two-stage laser irradiation (1064-nm
AuNP production followed by 532-nm irradiation) in the absence of surfactant generates AuNP
that are both small in size and possess a narrow particle size distribution. This distribution
remains narrow and shifts to smaller average particle size with increasing surfactant
concentration.
3a.2 Experimental Method
Gold nanoparticles (AuNP) were prepared by laser ablation following the method described
in Chapter 2.1. Laser ablation of a thin gold disc (>99.99%) was undertaken by placing the disc
on the bottom of a glass vessel containing 10 ml of either 0 M (pure water), 10-4 M or 10-2 M
aqueous solutions of SDS. The CMC of SDS in water is 8 mM [44,45], so the concentrations of
SDS used here correspond to being below and just above the aqueous CMC. SDS
concentrations above and below the CMC were chosen for study based upon the work of
Mafuné and co-workers where distinct AuNP behaviour was reported above and below the
CMC [32]. The laser-generated AuNPs were analysed using UV-Visible absorption
spectroscopy (as discussed in Chapter 2.2.2) and transmission electron microscopy (see
Chapter 2.3.1).

3A. LASER-BASED FORMATION OF AUNPS VIA LASIS 40
3a.3 Results and Discussion
3a.3.1 Laser Irradiation at 1064 nm
The absorption spectra of samples following 1064-nm irradiation of the Au disc at 10-minute
intervals for each of the 0 M, 10-4 M and 10-2 M SDS solutions are presented in Figure 3.1. Each
spectrum shows a growth in intensity of the characteristic surface plasmon band (SPB) of
AuNP at approximately 520 nm [46]. The most noticeable characteristic of the spectra shown in
Figures 3.1a-c is the steady increase in absorbance at longer irradiation times. The intensity of
the SPB is indicative of the number of AuNPs in solution of sufficient size to support the
surface plasmon transition; the absorbance at the inter-valence band, between approximately
350-450 nm, is indicative of the total number of gold atoms in solution, whether they be in
SPB-supporting AuNPs or otherwise [46]. It is evident by inspection of the spectra presented in
Figure 3.1 that at each SDS concentration, both the number of SPB-supporting AuNPs as well
as the overall concentration of gold atoms grows at similar rates as a function of laser
irradiation time. Later, we present a more detailed investigation of the relationship between
absorption and laser irradiation time which forms the basis for proposing a mechanism of
laser-based AuNP production.
A less obvious characteristic of Figure 3.1 is the position of the wavelength maximum of the
SPB (λmax), which does not appreciably change over the 220 minute experimental timescale. At
each surfactant concentration, λmax shifts to the blue by no more than 1.5 nm over the first 100
minutes of laser irradiation, after which time it remains steady. This indicates that at each SDS
concentration, for particles that are large enough to support the SPB, the average particle size
does not change significantly over the duration of the experiment. However, the actual λmax
values are dependent upon surfactant concentration. After 100 mins, the 0 M and 10-4 M data
exhibit a λmax = 524 nm whereas the 10-2 M data exhibits a λmax = 521 nm.

3A. LASER-BASED FORMATION OF AUNPS VIA LASIS 41
Figure 3.1. UV-visible absorption spectra of AuNP samples produced via 1064 nm laser
irradiation in aqueous solution (a) with no surfactant present, (b) with 10-4M SDS
present, and (c) with 10-2M SDS present, in solution. For each surfactant solution
concentration, spectra are displayed at 20 min intervals up to a maximum
irradiation time of 220 min.
0.0
1.0
2.0
400 500 600 700 800 900
Absorb
ance
Wavelength /nm
220 mins
20 mins
(a) 0 M SDS
0.0
1.0
2.0
400 500 600 700 800 900
Absorb
ance
Wavelength /nm
220 mins
20 mins
(b) 10-4
M SDS
0.0
1.0
2.0
400 500 600 700 800 900
Absorb
ance
Wavelength /nm
220 mins
20 mins
(c) 10-2
M SDS

3A. LASER-BASED FORMATION OF AUNPS VIA LASIS 42
Mie scattering theory [46] and previous studies into the optical absorption properties of
AuNPs [14,15,47,48] conclude that a blue shift in the wavelength maximum of the SPB of
AuNP is an indicator of smaller average particle sizes. However, a very recent study by
Amendola and Meneghetti provides direct experimental evidence indicating that this simple
interpretation can be unreliable because the value of the AuNP SPB λmax varies, for example,
with changes in dielectric strength that accompany changes in the SDS concentration [49]. As
such we cannot use the spectra in Figure 3.1 to comment with certainty on whether the average
particle size is smaller above the CMC.
However, confirmation of the smaller particle size above the CMC can be made by
comparing the TEM images of AuNP samples prepared at each SDS concentration.
Representative TEM images, together with histograms indicating their associated particle size
distributions, of AuNP samples prepared in 0, 10-4, and 10-2 M SDS solutions after 90 min of
1064 nm laser irradiation are presented in Figure 3.2. To improve the statistics of the particle
size distribution determinations, each histogram was generated by analysing multiple images,
rather than just the image presented above it. Note that large particles have been counted but a
few in numbers and thus not evidence on the histogram.
Each TEM image shows that the AuNP adopts a roughly spherical geometry with a range of
particle sizes evident. For the case of pure water solvent, the particle size distribution peaks at
approximately 15 nm with a relatively broad distribution of sizes out to a maximum of
approximately 45 nm. Closer analysis of the particle size distribution reveals an average
particle size of 19.1 nm with a standard deviation (1σ) of 7.3 nm. The sample containing 10-4 M
SDS shows a similar peak in the particle size distribution, but the number of particles above
∼25 nm in diameter is significantly reduced in abundance. Here, the average particle size is
13.0 nm with a standard deviation (1σ) of 5.1 nm. Finally, in the case of 10-2 M SDS, a much

Figure 3.2. Representative TEM images, together with histograms indicating their associated particle size distributions, of AuNP samples prepared in (a) 0M, (b)
10-4M, and (c) 10-2M SDS concentration after 90 min of 1064 nm laser irradiation. The scale bar in the lower right-hand corner of each image is 100
nm.
0
10
20
30
40
50
60
0 5 10 15 20 25 30 35 40 45 50
Num
ber
of P
art
icle
s
Particle Diameter (nm)
(a) 0 M SDS
0
5
10
15
20
25
0 5 10 15 20 25 30 35 40 45 50
Nu
mb
er
of
Pa
rtic
les
Particle Diameter (nm)
(b) 10-4
M SDS
0
50
100
150
0 5 10 15 20 25 30 35 40 45 50
Nu
mb
er
of
Part
icle
s
Particle Diameter (nm)
(c) 10-2
M SDS

3A. LASER-BASED FORMATION OF AUNPS VIA LASIS 44
narrower distribution of smaller particles is observed. Here, the peak in the size distribution is
∼4 nm with very few particles larger than 15 nm present and particles as small as 1 nm in
diameter are observed in high relative abundance. The average particle size is 4.7 nm with a
standard deviation (1σ) of 2.6 nm.
As stated previously, the relative independence of λmax at the SPB with laser irradiation time
indicates that particles large enough to support the SPB do not change in size over the duration
of the experiment. Nonetheless, the absorption data provide valuable insight into the formation
mechanism of the AuNPs. In Figure 3.3a, we present the absorbance at the SPB λmax as a
function of the number of laser irradiation pulses (lower x-axis) and 10 Hz laser irradiation time
(upper x-axis) for each SDS concentration. Here, the data points represent absorbance readings
taken after a specified number of laser pulses, while the solid lines represent fits to a kinetic
model yet to be presented.
Inspection of Figure 3.3a,c indicates that the absorbance increases linearly after
approximately 2 × 10⁻⁴ laser pulses. However, inspection of the absorbance values at early
irradiation times shows significant curvature. This curvature is highlighted in Figure 3.3b,
which presents an expansion of the early time data from Figure 3.3a. As such, the solid curves
in Figure 3.3a,b represent the same fit to the same data set. Figure 3.3c,d shows equivalent data
for the intervalence band absorbance values at 450 nm. For each SDS concentration, the
variations in absorbance at each wavelength display near identical behaviour at long (linear)
and short (curved) irradiation times. From this, we can immediately conclude that the kinetics
for the laser-based production of AuNPs in solution is independent of whether the particles can
support the SPB, or not. We have used this data to develop a model to explain the in situ 1064
nm laser-induced production of AuNPs.

3A. LASER-BASED FORMATION OF AUNPS VIA LASIS 45
Figure 3.3. Variation in absorbance of the AuNP in aqueous solution with no surfactant
present, with 10-4M SDS present, and with 10-2M SDS present in solution as a
function of 10 Hz 1064 nm laser irradiation at (a) SPB max and (c) at 450 nm
(within the intervalence transition region ). Panels (b) and (d) show a magnified
view of the early time data of panels (a) and (c) respectively. The error bars
represent a maximum uncertainty of 0.01 absorbance units found for differences
between experiments. See text for a discussion of the phenomena involved.
0
0.5
1
1.5
2
0 5x10⁴
1x10⁵
1.5x10⁵
2x10⁵
Absorb
ance
Number of laser pulses
0M SDS
10-4
M SDS10-2
M SDS
a) SPB
0
0.5
1
1.5
2
0 5x10⁴
1x10⁵
1.5x10⁵
2x10⁵
Absorb
ance
Number of laser pulses
0M SDS
10-4
M SDS
10-2
M SDS
c) 450nm
0
0.05
0.1
0.15
0.2
0.25
0.3
0.35
0.4
0 2000 4000 6000 8000 1x10⁴
Absorb
ance
Number of laser pulses
0M SDS
10-4
M SDS
10-2
M SDS
b) SPB
0
0.05
0.1
0.15
0.2
0.25
0.3
0 2000 4000 6000 8000 1 104
Abso
rba
nce
Number of laser pulses
0M SDS
10-4
M SDS
10-2
M SDS
d) 450nm

3A. LASER-BASED FORMATION OF AUNPS VIA LASIS 46
3a.3.1.1 Modelling AuNP Formation and Size Transformations
Upon the basis of the discussion thus far, we first consider two types of AuNPs being
generated as a result of laser irradiation of the bulk gold surface; those too small to support the
SPB and those large enough to exhibit this spectral signature. It is well established that this
differentiation occurs at a particle diameter of approximately 4 nm [46], and we denote these
two distinct nanoparticle sizes as AuNP(small) and AuNP(large), respectively. We note that these
two types of AuNPs are not necessarily generated as an intact entity from bulk gold, but
represent the species eventually formed and present during the recording of the UV-Vis spectra.
Indeed, simulations suggest that formation of nanoparticles result from the rapid coalescence of
atomic gold species within the solution [30]. Furthermore, this coalescence process may play
a role in the interconversion steps.
We now consider that laser irradiation of bulk gold initiates two parallel reaction channels to
form AuNP(small) and AuNP(large), each at a distinct rate of production. Each process is
considered reversible. Moreover, we consider that each type of species, AuNP(small) or
AuNP(large), can interconvert because at least one interconversion step is required to account for
the observed curvature in the time-dependent absorbance data. Overall, this simple reaction
scheme can be described by the series of equilibrium steps given in Scheme 1.
Scheme 1. Model reaction scheme highlighting the reversible formation of AuNP too small to support a surface Plasmon band (SPB), AuNP(small), and those large enough to support a SPB, AuNP(large), from bulk gold, as well as the inter-conversion between the two forms of nanoparticle.
AuNP(small) AuNP(large)
Au(bulk)
ks
k-s kl
k-l
ksl
kls

3A. LASER-BASED FORMATION OF AUNPS VIA LASIS 47
Rate expressions for the formation of each type of AuNP immediately follow:
][AuNP][AuNP][AuNPpulse
][AuNP(large)(small)(small)450
(small)450lsslss kkkk
dd
][AuNP][AuNP][AuNPpulse
][AuNP(small)(large)(large)450
(large)450sllsll kkkk
dd
where ε450 is the extinction coefficient at 450 nm (the intervalence band), ℓ is path length and
the quantities in square brackets represent the number of gold atoms per unit volume; these
quantities are not the respective molar concentrations of AuNPs in each size regime. Our
detailed analysis involving nonlinear least-squares fitting of the model to the experimental data
shows that under no circumstances can this simple model account for the experimental
observations. It is clear that a more flexible reaction scheme is required.
We extend our modeling by explicitly considering three, rather than just two, distinct AuNP
size regimes. This modified model includes small non-SPB supporting AuNPs (denoted
AuNP(small)), “medium”-sized AuNPs having weak, but measurable, SPB molar absorbances
(denoted AuNP(med)), and “large” AuNPs with larger SPB molar absorbances (denoted
AuNP(large)). The rationale for introducing the three-size AuNP model is based on the
well-established notion, both experimentally [28,50,51] and theoretically [46,52,53], that the
AuNP absorption coefficient increases with particle-size, while simultaneously limiting the
number of variables in the reaction scheme to the absolute minimum number required to
account for the experimentally observed behavior. The overall modified reaction scheme is
described by the series of equilibrium steps given in Scheme 2.
(3.1)
(3.2)

3A. LASER-BASED FORMATION OF AUNPS VIA LASIS 48
Scheme 2. Model reaction scheme highlighting the reversible formation of AuNP too small
to support a surface Plasmon band (SPB), AuNP(small); those just large enough to
support a SPB, AuNP(med); and those large enough to more easily support a SPB,
AuNP(large), from bulk gold, as well as the inter-conversion between the three
forms of nanoparticle.
The modified model is not meant to convey that only three distinct size regimes of AuNPs are
produced via the in situ laser ablation method. Rather, the model represents the simplest
extension to the binary-size model described in Scheme 1 to account for the curvature in the
time-dependent absorbance data and is presented as an aid to understanding the laser-induced
AuNP formation process.
When considering the three-size AuNP model, it is important to recall what is being observed
experimentally. At the intervalence band (450 nm), contributions to the absorbance spectra are
made from each of the AuNP(small), AuNP(med), and AuNP(large) nanoparticles and each contribute
equally (i.e., they have the same extinction coefficient at 450 nm, ε450nm) since the total
absorption at this wavelength represents the total number of Au atoms in solution regardless of
their form. In other words, the absorbance at 450 nm can be expressed as
][AuNP][AuNP][AuNP largemedsmallnm450nm 450 A
AuNP(small) AuNP(large)
Au(bulk)
ks
k-s kl
k-l
ksm
kmsAuNP(med)
kml
klm
km k-m
ksl
kls
(3.3)

3A. LASER-BASED FORMATION OF AUNPS VIA LASIS 49
where ℓ =1 cm and the quantities in square brackets represent the number of gold atoms per
unit volume; these quantities are not the respective molar concentrations of AuNPs in each size
regime.
However, this is not the case at the SPB maximum absorption wavelength, λSPB, where
contributions from both the SPB absorption itself as well as the “tail” of the intervalence band
extending to longer wavelengths are evident. From the absorption spectra presented in Figure
3.1, interpolating the non-SPB absorption trends across the SPB wavelength region indicates
that the non SPB-based absorbance at ∼520 nm is approximately equal to 0.73 of the observed
absorbance at 450 nm (this ratio is more apparent in the spectra presented in Figure 3.7, which
will be discussed in more detail in the following Section). As before, the non-SPB extinction
coefficient is identical for each type of AuNP in the model. However, as previously mentioned,
the AuNP absorption coefficient increases with particle-size [28,46,50-53]. As a result, the
absorbance at the SPB λmax, relative to that at 450 nm, can be expressed as:
][AuNP][AuNP][AuNP][AuNP][AuNP73.0 largemedlargemedsmallnm450max YXA
where the values of X and Y, representing the extinction coefficient ratios of the SPB
component of the SPB-supporting nanoparticles, are determined by a simultaneous nonlinear
least squares fit of all species concentrations and absorbances at both 450 nm and λmax. (As
before, the quantities in square brackets represent the number of gold atoms per unit volume;
these quantities are not the respective molar concentrations of AuNPs in each size regime).
The kinetic model presented in Scheme 2 contains up to 12 unique AuNP transformation
channels. Numerical integration of the resultant rate expressions yields:
(3.4)

3A. LASER-BASED FORMATION OF AUNPS VIA LASIS 50
][AuNP][AuNP][AuNP][AuNP][AuNPpulse
][AuNP(large)(small)(med)(small)(small)450
(small)450lsslmssmss kkkkkk
dd
][AuNP][AuNP][AuNP][AuNP][AuNP
pulse][AuNP
(large)(med)(small)(med)(med)450(med)450
lmmlsmmsmm kkkkkkd
d
][AuNP][AuNP][AuNP][AuNP][AuNP
pulse][AuNP
(small)(large)(med)(large)(large)450(large)450
sllsmllmll kkkkkkd
d
which, combined with a nonlinear least-squares fit to the absorbance data, yields the lines of
best fit presented in Figure 3.3. In terms of extinction coefficients, the fitting reveals possible
values for X and Y in Equation 3.4 of 0.61 and 0.86, respectively. We use the well-established
notion that the SPB extinction coefficients of AuNPs increase with particle size [27,46,50-53]
to assign the extinction coefficient ratio for medium-sized AuNPs to X = 0.61 and that of the
large sized AuNPs to Y = 0.86.
The most important aspect of the data fitting is that to generate the curves in Figure 3.3 only
three of the twelve possible transformation channels are required to fit the data for 0 and 10-4 M
SDS solutions with a fourth channel required for the 10-2 M SDS solution. Extensive
exploration of the kinetic model has determined that these transformation channels (represented
in Scheme 2 by kl, km, and k-m; plus ks for 10-2 M SDS solutions) are the minimum number
required accounting for the observed behaviour, and for each surfactant concentration represent
a unique solution with this minimum set of parameters. The critical transformation channels
involve production of large and medium AuNPs directly from bulk gold with a medium AuNP
sink channel represented as a reversible conversion back to bulk (we will comment more on the
nature of this decay channel later). For an SDS concentration of 10-2 M, the fourth channel
involves direct formation of small AuNPs from the bulk.
The solution involving the transformation channels identified above is indeed unique. For
example, attempts to invoke a large sink channel (k-l) rather than the medium sink channel
(3.5)
(3.6)
(3.7)

3A. LASER-BASED FORMATION OF AUNPS VIA LASIS 51
simply do not fit the experimental data. Moreover, invoking both the large and medium sinks
channels concurrently makes no significant improvement in the quality of fit compared to
invoking only the medium sink channel.
Interestingly, there is no interconversion between the three types of AuNPs required to
account for the observed behaviour, indicating that on the time scales and laser fluences being
investigated, smaller species do not appreciably aggregate into larger particles, nor do larger
particles appreciably fragment. The values of the critical rate constants for each surfactant
concentration are reported in Table 3.1.
Table 3.1. Resultant 1064 nm Kinetic Paremeters Determined Following a Nonlinear Least Squares Fit of the Absorbance Data to the Kinetic Model Given in Scheme 2a ; all reported uncertainties represent three standard deviations error (3) SDS: sodium dodecyl sulphate; kl, km, ks, k-m: rate constants for interconversion between the different gold nanoparticle species as defined in Scheme 3. Ksol: solubility constant which is derived from independent data fit for each SDS concentration. See text for details.
0 M SDS 10-4
M SDS 10-2
M SDS
kl (pulse-1
) (6.07 ± 0.09) × 10-6
(6.04 ± 0.06) × 10-6
(1.01 ± 0.01) × 10-5
km (pulse-1
) (1.35 ± 0.42) × 10-5
(1.18 ± 0.12) × 10-5
(2.61 ± 0.59) × 10-5
ks (pulse-1
) - - (1.37 ± 0.17) × 10-6
k-m (pulse-1
) (1.76 ± 0.60) × 10-4
(7.93 ± 1.07) × 10-5
(2.13 ± 0.60) × 10-4
Ksol = km/k-m 0.08 0.15 0.13
a All data refer to 10Hz laser irradiation. See text for additional details.
In considering these data, it is important to ascertain whether the rate constants reported in
Table 3.1 should be expressed in terms of the number of laser irradiation pulses or the time over
which the irradiation experiments were performed. That is, to ascertain whether the AuNP size
transformation processes occur only during the periods of actual laser irradiation or over longer

3A. LASER-BASED FORMATION OF AUNPS VIA LASIS 52
time scales. If the former situation applies, expressing the rate constants in terms of the number
of laser pulses is appropriate. If the latter scenario applies, it would be necessary to express the
rate constants in terms of time.
To explore this issue, freshly prepared surfactant-free solutions were irradiated at 1064 nm
for two hours under both 10 and 5 Hz laser repetition rates (maintaining a constant laser power
of 7.5 mJ/pulse). Under both sets of conditions the same variation of absorbance at both the
SPB λmax and 450 nm as a function of the number of laser pulses is observed (see Figure 3.4).
This indicates that the AuNP production and transformation processes occur on a shot-by-shot
basis, and as such, expressing the rate constants in terms of the number of laser pulses rather
than the time over which the irradiation experiments were performed is appropriate.
A key feature of the kinetic analysis using the AuNP size regime model represented in
Scheme 2 is that the medium sink channel, represented in the model as a reversible conversion
back to bulk, is the only decay channel identified to account for the early time curvature in the
experimental absorbance data presented in Figure 3.3. One simple possible explanation for the
existence of this decay channel is that under the experimental conditions employed, a saturation
concentration of medium AuNPs is reached whereby any further production of AuNPs results
in their removal from solution. The solubility constant under such circumstances can be
expressed as Ksol = km/k-m and its value derived from the independent data fits for each SDS
concentration is presented in Table 3.1.
Additional experiments were undertaken to explore the conditions under which this k-m decay
channel is operative. Specifically, three distinct “control” experiments (Figure 3.5) were
undertaken where the AuNP production channels were deactivated, but where the decay
channel could still operate. Each control experiment began with 10 Hz 1064 nm laser

3A. LASER-BASED FORMATION OF AUNPS VIA LASIS 53
Figure 3.4. Variation in absorbance of the AuNP in aqueous solution with no surfactant
present as a function of 5Hz (open circle) and 10 Hz (solid square) 1064 nm laser
irradiation at (a) SPB max, and (c) at 450 nm (within the inter-valence transition
region). The same data recorded within the first 10 minutes of laser irradiation
are presented in panels (b) and (d), respectively.
0
0.5
1
1.5
2
0 2 x 10⁴
4 x 10⁴
6 x 10⁴
8 x 10⁴
1 x 10⁵
Absorb
ance
Number of laser pulses
a)SPB
0
0.5
1
1.5
2
0 2 x 10⁴
4 x 10⁴
6 x 10⁴
8 x 10⁴
1 x 10⁵
Abso
rba
nce
Number of laser pulses
c)450nm
0
0.05
0.1
0.15
0.2
0.25
0.3
0.35
0.4
0 2000 4000 6000 8000 10000
Absorb
ance
Number of laser pulses
b)SPB
- zoom
0
0.05
0.1
0.15
0.2
0.25
0.3
0 2000 4000 6000 8000 10000
Abso
rba
nce
Number of laser pulses
d)450nm - zoom

3A. LASER-BASED FORMATION OF AUNPS VIA LASIS 54
irradiation of a gold disk in a 0 M SDS solution for 40 min.Following this common period of
irradiation, the absorbance of the resultant AuNP-containing solutions at both the SPB λmax and
at 450 nm was regularly measured over a 3 h period with
- no further laser irradiation, but with the Au disk remaining in solution,
- no further laser irradiation, and with the Au disk removed from solution, and
- ongoing laser irradiation with the Au disk removed (laser induced sputtering of the glass
vessel was avoided by lowering the sample reservoir so that the laser focal region was
relocated to the center of the AuNP sample volume).
No significant change in absorbance at either wavelength over the 3 h observation period was
observed in any of the control experiments (see Figure 3.5). This indicates that the k-m decay
channel is not spontaneous and is only operative under conditions where direct laser irradiation
onto the solid Au disk is occurring. Invoking the solubility limit described by Ksol in Table 3.1 is
consistent with such findings.
3a.3.1.2 Characterising AuNP Size Regimes
We now turn our attention to characterising the small, medium, and large size regimes
invoked in the modelling of the time-dependent UV-vis absorption spectra. Currently, these size
regimes are only differentiated by their ratio of extinction coefficients at the SPB wavelength
and at 450 nm. However, by combining the results of the kinetic modelling with the particle size
distribution histograms presented in Figure 3.2, the bounds of each size regime can be
determined. Analysis of the absorption spectra presented in Figure 3.1 yields the concentration
ratio of each size regime as a function of the number of laser shots.

3A. LASER-BASED FORMATION OF AUNPS VIA LASIS 55
Figure 3.5. Absorbance values of the AuNP SPB max and at 450 nm recorded following 40
minutes of 10Hz 1064 nm laser irradiation of a gold disc in 0M SDS solutions with,
(a) no further laser irradiation and with the Au disk removed from solution, (b)
on-going laser irradiation and with the Au disk removed from solution, and (c) no
further laser irradiation and with the Au disk remaining in solutions.
0
0.5
1
1.5
2
2.5
0 2000 4000 6000 8000 10000
Abso
rba
nce
Time (second)
450 nm
a) no Au Disc + no 1064 irradiation
SPB
0
1
2
3
4
0 2 x 10⁴
4 x 10⁴
6 x 10⁴
8 x 10⁴
1 x 10⁵
0 2000 4000 6000 8000 10000
Absorb
ance
Number of laser pulses
450 nm
b) no Au Disc + 1064 nm irradiation
Time (second)
SPB
0
0.5
1
1.5
0 2000 4000 6000 8000 10000
Abso
rba
nce
Time (second)
450 nm
c) Au Disc + no 1064 irradiation
SPB

3A. LASER-BASED FORMATION OF AUNPS VIA LASIS 56
Consider the AuNP particle size distributions presented in Figure 3.2 where 54 000 laser
shots (90 min of 10 Hz 1064 nm laser irradiation) generates the AuNP distributions observed.
Correlation of the particle size distributions in Figure 3.2 with the relative concentrations of
each of the three AuNP size regimes in the kinetic model is achieved by converting the
distributions of particle sizes into distributions of the number of atoms in a particle of a given
diameter. This conversion is necessary since the extinction coefficient of a AuNP at 450 nm is
directly proportional to the number of atoms present in that particle [46] and is achieved by
multiplying the intensities in each histogram in Figure 3.2 by the cube of the particle diameter
to account for the volume of the nanoparticle (assumed from the TEM images in Figure 3.2 to
be spherical). Appropriate integration and normalisation yields the cumulative particle size
distribution function, that is, a function describing the fraction of atoms in AuNPs with a
diameter less than that of a given value. The results of this analysis, for SDS concentrations of 0,
10-4 and 10-2 M are presented in Figure 3.6.
The final stage of the analysis makes use of predictions of the relative concentrations of small,
medium, and large AuNPs as a function of time from the kinetic model described above (Figure
3.6). By comparing the predicted small, medium, and large AuNP concentration functions with
the cumulative particle size distribution functions, it becomes a straightforward task to
determine the size regimes. However, before making these determinations, it should be noted
that the size regimes determined via this method rely on the accuracy of the size distributions
determined from the TEM images. In particular, the presence (or absence) of just a few large
AuNPs can skew the cumulative distribution function because of the multiplication of
intensities by the cube of the AuNP diameter. To this end we have ensured that the distributions
we analyse are truly representative of the sample by analysing multiple TEM images.

0M SDS 10-4M SDS 10-2M SDS
Figure 3.6. Data used for the determination of AuNP diameters associated with the „small‟, „medium‟ and „large‟ size regimes for each surfactant concentration. The top panel for each SDS concentration are predictions of the relative concentrations of each AuNP size type resulting from the kinetic model described used to generate the fits in Figure 3.3. The middle panels show the AuNP size distributions presented in Figure 3.2 converted to distributions of the number of atoms in a particle of a given diameter. The lower panels display the resultant cumulative particle size distribution functions, generated following integration and normalisation of the data in the middle panels.
0
0.05
0.1
0.15
0.2
0.25
0.3
0.35
0.4
0 1 104
2 104
3 104
4 104
5 104
6 104
7 104
Number of laser pulses
�AuNP(med)
AuNP(large)
450l
[Au
NP
]
x x x x x x x
0
0.05
0.1
0.15
0.2
0.25
0.3
0.35
0.4
0 1 104
2 104
3 104
4 104
5 104
6 104
7 104
450l
[Au
NP
]
Number of laser pulses
AuNP(med)
AuNP(large)
x x x x x x x
0
0.1
0.2
0.3
0.4
0.5
0.6
0.7
0 1 104
2 104
3 104
4 104
5 104
6 104
7 104
Number of laser pulses
AuNP(med)
AuNP(large)
AuNP(small)
450l
[AuN
P]
x x x x x x x
0 5 10 15 20 25 30 35 40 45 50
Num
ber
of ato
ms in p
art
icle
s
of giv
en d
iam
ete
r
Particle Diameter (nm)
0 5 10 15 20 25 30 35 40 45 50
Num
ber
of ato
ms in p
art
icle
s
of giv
en d
iam
ete
r
Particle Diameter (nm)
0 5 10 15 20 25 30 35 40 45 50
Num
ber
of ato
ms in p
art
icle
s
of giv
en d
iam
ete
r
Particle Diameter (nm)
0
0.2
0.4
0.6
0.8
1
0 10 20 30 40 50
Fra
ction
of ato
ms in p
art
icle
s w
ith d
iam
ete
r less t
han that of
giv
en d
iam
ete
r
Size Diameter (nm)
0
0.2
0.4
0.6
0.8
1
0 10 20 30 40 50
Fra
ction
of ato
ms in p
art
icle
s w
ith d
iam
ete
r less t
han that of
giv
en d
iam
ete
r
Size Diameter (nm)
0
0.2
0.4
0.6
0.8
1
0 10 20 30 40 50
Fra
ction
of ato
ms in p
art
icle
s w
ith d
iam
ete
r less t
han that of
giv
en d
iam
ete
r
Size Diameter (nm)

3A. LASER-BASED FORMATION OF AUNPS VIA LASIS 58
As an illustrative example, applying the above approach to the 1064 nm data, the upper limit
for the diameter for the small AuNP size regime can only be determined from 10-2 M SDS data
(since this is the only surfactant concentration where small AuNPs form). In this case, after
54 000 laser pulses we find that 10% of the atoms are in small AuNPs (upper panel Figure 3.6).
This equates (using the cumulative distribution function) to a maximum small AuNP diameter
of 5.5 ± 0.5 nm, where the uncertainty derives from the experimentally derived cumulative
distribution function. This outcome is in excellent agreement with the 0 and 10-4 M SDS AuNP
particle size distributions presented in Figure 3.2 where particles of a diameter less than 5 nm
are not observed, and where the kinetic model predicts that the production of such small AuNPs
is not required. The boundary between medium and large AuNPs is determined from an
analysis of the each of the 0, 10-4, and 10-2 M SDS data sets (see Figure 3.6) and is found to be
17 ± 3 nm, where the uncertainty derives from each cumulative distribution function. That is, in
our kinetic model small AuNPs have diameters less than 5.5 ± 0.5 nm, medium AuNPs have
diameters between 5.5 ± 0.5 and 17 ± 3 nm, and large AuNPs have diameters greater than 17 ±
3 nm.
A number of mechanistic details can be inferred from the modelling described above. First,
very small AuNPs that are too small to support the SPB are only formed when the SDS
concentration is above the CMC. Such small particles are stabilised, possibly within micellar
SDS.‡ The electron micrographs presented in Figure 3.2 show that AuNP production at particle
diameters below 5 nm is only observed at SDS concentrations above the CMC, in agreement
with the kinetic model and consistent with previous reports on the topic [16,32,47].
__________ ‡The role, or otherwise, of micelles in the 1064-nm AuNP LASiS approach will be discussed in Part B of this Chapter.

3A. LASER-BASED FORMATION OF AUNPS VIA LASIS 59
In addition, our model indicates that the 1064 nm ablation process generates medium-sized
AuNPs that are large enough to support the SPB optical transition, but are not sufficiently stable
under laser irradiation to remain in aqueous solution for more than a few minutes. This
instability is especially evident within the first 5 min of laser irradiation (3000 laser shots at
10 Hz) where the curvature in the absorbance traces is most apparent. Our modelling indicates
that after ∼10 min of irradiation (∼6000 laser shots at 10 Hz) for each surfactant concentration
the abundance of medium-sized AuNPs reaches a steady state, suggesting that this is the
average lifetime for these particles in aqueous solution. Our kinetic model accounts for the
limited medium AuNP lifetime in terms of a decay channel back to the bulk. Our control
experiments discussed earlier indicate that the decay channel is only operative during the 1064
nm laser pulses.
Upon the basis of the earlier reports [16,17,27,32,37], it is tempting to attribute the
medium-sized AuNP decay channel to either fragmentation to small AuNPs or aggregation to
larger particle sizes, that is, to channels kml and/or kms in our kinetic model (Scheme 2). However,
two considerations discount this possibility. The first is that in our model, we cannot account for
the time-dependent changes in absorbance without invoking the decay channel, k-m.
Substituting decay channel k-m with either fragmentation or aggregation simply results in
inferior fits to the data. In addition, if the fragmentation or aggregation size transformation
channels were operative, we would expect to see a change in the AuNP SPB λmax during the
control experiments (with no concomitant change in the 450 nm absorbance values) as the size
transformations resulted in changes to the net AuNP extinction coefficient.
More significantly, the observation of curvature in the absorbance data at both the SPB and
intervalence bands (450 nm) argues against AuNP size transformations. As previously
mentioned, optical absorbance in the intervalence region depends upon the total number of Au

3A. LASER-BASED FORMATION OF AUNPS VIA LASIS 60
atoms in solution, not on their physical form. If AuNPs were undergoing size transformations
we would expect to see curvature in the SPB region of the spectrum, corresponding to
size-dependent changes in the SPB extinction coefficient, but a steady increase in the
absorbance at 450 nm as more material was ablated from the solid Au disk into solution. The
curvature of the absorbance data at 450 nm indicates the presence of a decay channel removing
Au from solution. This curvature is apparent for several minutes of laser irradiation until a
steady state balance between medium-sized AuNPs being produced and decayed is achieved.
A final possibility that may account for the curvature in the absorbance data in Figure 3.3b,d
at both 450 nm and λmax is that as the number of AuNPs in solution increases in concentration,
the photon flux at the ablation site is reduced, for example, due to light scattering. Considering
the overall photon flux being used in these experiments (recall, the ablation fluence is 2.2 × 10⁵
mJ cm-2 pulse-1), we consider this possibility to be highly unlikely. However, to firmly discount
this possibility, absorption spectra were recorded in a UV-visible-NIR spectrophotometer (Cary,
5000) to monitor any AuNP absorption features in the NIR (800 to 1300 nm). No significant
absorption at 1064 nm was observed.
In concluding this section of the discussion, we confirm that a comprehensive understanding
of the dynamics controlling the formation and relative stability of AuNPs produced via
nanosecond laser ablation relies upon the shot-by-shot vaporisation, nucleation, and
coalescence processes. These dynamics appear to be strongly influenced by the irradiating laser
fluence. In the following section we present data to indicate that our small-medium-large AuNP
kinetic model can also account for AuNP size transformations following 532 nm irradiation of
solutions formed via 1064 nm ablation.

3A. LASER-BASED FORMATION OF AUNPS VIA LASIS 61
3a.3.2 Laser Irradiation of 532 nm
AuNP solutions prepared by 90 min irradiation times at 1064 nm were subsequently
irradiated at 532 nm for up to 120 min. The absorption spectra of samples following 532 nm
irradiation of the 1064 nm generated AuNP solutions at 10 min intervals for each of the 0, 10-4,
and 10-2 M SDS solutions are presented in Figure 3.7. Each spectrum shows a reduction in
intensity of the AuNP SPB with increasing irradiation time. Note that the intensities of the
intervalence band absorptions at 450 nm vary only slightly in Figure 3.7 compared to the
equivalent intensity changes evident in Figure 3.1, indicating no change in the total
concentration of Au atoms in each solution. The absorption spectra of AuNPs with different
diameters recorded by Hartland and co-workers indicates no change in absorption for the
intervalence band at 450 nm [40].
The most noticeable difference between the three sets of spectra in Figure 3.7 is that the
intensity of the SPB decreases only slightly for solutions below the CMC with a concomitant
blue shift in the SPB λmax indicating a reduction in the average AuNP particle size. A more
exaggerated effect is observed at 10-2 M SDS where the intensity of the SPB steadily decreases,
also with a concomitant spectral blue shift, until it almost vanishes into the background after
120 min of irradiation time. The disappearance of the SPB indicates that the AuNPs have
become too small to support the plasmon resonance transition [46].
Representative TEM images, together with histograms indicating their associated particle
size distributions of AuNP samples prepared at each surfactant concentration after 120 min of
532 nm laser irradiation are presented in Figure 3.8. Again, to improve the statistics of the
particle size distribution determinations, each histogram was generated by analysing multiple
images, rather than just the image presented above it. Note that large particles have been
counted but a few in numbers and thus not evidence on the histogram.

3A. LASER-BASED FORMATION OF AUNPS VIA LASIS 62
Figure 3.7. UV-visible absorption spectra of AuNP samples in aqueous solution produced via 90
minutes of 1064-nm irradiation followed by 532-nm laser irradiation, (a) with no
surfactant present, (b) with 10-4 M SDS present, and (c) with 10-2 M SDS present in
solution. For each surfactant solution concentration, spectra are displayed at
20-minute intervals up to a maximum 532-nm irradiation time of 120 minutes.
0
0.2
0.4
0.6
0.8
1
1.2
1.4
400 500 600 700 800 900
Ab
so
rba
nce
Wavlengths (nm)
10 mins
120 mins
(a) 0 M SDS
0
0.2
0.4
0.6
0.8
1
1.2
1.4
400 500 600 700 800 900
Ab
so
rba
nce
Wavelengths (nm)
10 mins
120 mins
(b) 10-4
M SDS
0
0.2
0.4
0.6
0.8
1
1.2
1.4
400 500 600 700 800 900
Abso
rba
nce
Wavelengths (nm)
10 mins
120 mins
(c) 10-2
M SDS

3A. LASER-BASED FORMATION OF AUNPS VIA LASIS 63
Each TEM image shows that the AuNPs adopt a roughly spherical geometry. However,
noticeable differences in the particle size distributions are evident. For the case of pure water
solvent, the particle size distribution peaks at 8 nm with a relatively narrow and symmetric
distribution of sizes evident over the range 4-12 nm. The average particle size in the distribution
is 8.2 nm with a standard deviation (1σ) of 1.6 nm. This remarkable degree of uniformity in the
AuNP particle sizes is clearly evident in the associated electron microscope image presented in
Figure 3.8a.
The sample containing 10-4 M SDS (Figure 3.8b) shows a similarly narrow particle size
distribution with a peak at 5 nm. As with the case of no surfactant added, there are relatively
few particles with sizes smaller than 4 nm. The average particle size in the distribution is 5.4 nm
with a standard deviation (1σ) of 1.4 nm. In the case of 10-2 M SDS, Figure 3.8c shows that the
particle size distribution is very narrow and that there are very few particles greater in size than
5 nm. The average particle size in the distribution is 2.6 nm with a standard deviation (1σ) of 0.8
nm. Recall that the threshold size required to support the AuNP surface plasmon absorption
band is ∼4 nm [46], so this latter observation is in accord with the disappearance of the SPB in
Figure 3.7c. It is clear from Figure 3.8 that 532 nm fragmentations of AuNP samples prepared
via 1064 nm laser ablation is an effective mechanism for preparing small particle sizes with
uniformity in size.
The images in Figure 3.8 show the resultant AuNP particle size distributions following 120
min of laser irradiation at 532 nm. For the cases of 0 and 10-4 M SDS, the absorption spectra in
Figure 3.7 suggest that most of the reduction in average particle size is complete within
approximately 40-60 min. In contrast, the 10-2 M solution shows a continual reduction in
particle size over the 2 h irradiation period.

Figure 3.8. Representative TEM images, together with histograms indicating their associated particle size distributions, of AuNP samples prepared at
each surfactant concentration after 90 minutes of 1064-nm laser irradiation followed by 120 minutes of 532-nm irradiation. The horizontal
size bar in the lower right-hand corner of each image represents 100 nm.
0
50
100
150
200
250
300
350
400
0 5 10 15 20 25 30 35 40 45 50
Num
ber
of P
art
icle
s
Particle Diameter (nm)
(a) 0 M SDS
0
100
200
300
400
500
600
0 5 10 15 20 25 30 35 40 45 50
Num
be
r of
Pa
rtic
les
Particle Diameter (nm)
(b) 10-4
M SDS
0
100
200
300
400
500
600
0 5 10 15 20 25 30 35 40 45 50
Nu
mb
er
of
Pa
rtic
les
Particle Diameter (nm)
(c) 10-2
M SDS

3A. LASER-BASED FORMATION OF AUNPS VIA LASIS 65
In Figure 3.9 we present the absorbance value at the SPB max wavelength and the
intervalence band (450 nm) of AuNPs solutions as they undergo irradiation at 532 nm.
Inspection of Figure 3.9a shows that the absorbance at SPB max decays gradually along with
increasing the number of laser pulses. Again, the solid curves in Figure 3.9 represent the a fit to
the data set using a model described below. Figure 3.9b shows the intervalence band
absorbance values at 450 nm remain constant for each SDS concentration.
Figure 3.9. Variation in absorbance of the AuNP in aqueous solution with no surfactant
present, with 10-4M SDS present, and with 10-2M SDS present in solution as a
function of 10 Hz 532 nm laser irradiation at (a) SPB max and (b) at 450 nm
(within the intervalence transition region ). The error bars represent a maximum
uncertainty of 0.01 absorbance units found for differences between experiments.
See text for a discussion of the phenomena involved.
Although our experiments cannot give an in-depth explanation of the 532 nm laser-induced
size transformation of AuNP in solution, the process can be expressed using a model similar to
that previously described. The only modification being that channels involving bulk gold are
removed. This simplified model is presented in Scheme 3.
0
0.2
0.4
0.6
0.8
1
1.2
0 2 x 10⁴
4 x 10⁴
6 x 10⁴
8 x 10⁴
1 x 10⁵
0 2 x 10³
4 x 10³
6 x 10³
8 x 10³
1 x 10⁴
Abso
rba
nce
Number of laser pulses
0M SDS
10-4
M SDS
10-2
M SDS
a) SPB
Time (second)
0
0.2
0.4
0.6
0.8
1
0 2 x 10⁴
4 x 10⁴
6 x 10⁴
8 x 10⁴
1 x 10⁵
0 2 x 10³
4 x 10³
6 x 10³
8 x 10³
1 x 10⁴
Absorb
ance
Number of laser pulses
0M SDS
10-4
M SDS
10-2
M SDS
b) 450 nm
Time (second)

3A. LASER-BASED FORMATION OF AUNPS VIA LASIS 66
Scheme 3. Model reaction scheme describing the possible transformation pathways for AuNP
following 532-nm laser irradiation of samples prepared via the 1064-nm method
described earlier.
As before, rate expressions for the transformation of each type of AuNP immediately follow
for each of the six possible channels shown in Scheme 3.
][AuNP][AuNP][AuNP][AuNPpulse
][AuNP(large)(small)(med)(small)450
(small)450lsslmssm kkkk
dd
][AuNP][AuNP][AuNP][AuNP
pulse][AuNP
(large)(med)(small)(med)450(med)450
lmmlsmms kkkkd
d
][AuNP][AuNP][AuNP][AuNP
pulse][AuNP
(small)(large)(med)(large)450(large)450
sllsmllm kkkkd
d
Numerical integration of the rate expressions, combined with nonlinear least-squares fitting
to the absorbance data presented in Figure 3.7 at λmax and 450 nm identifies the minimum
number of transformations required to account for the time dependence of the spectral data and
the associated rate constants. The values of the critical rate constants for each surfactant
concentration determined from the fitting of the experimental data are reported in Table 3.2.
In the case of 0 M SDS solutions, only one possible transformation channel is required to
account for the experimental data. This channel involves the fragmentation of large AuNPs to
medium-sized particles (represented in Scheme 3 by klm). Invoking the reversible kml step
makes no significant improvement in the quality of the fit to the absorbance data. It is noted that
the histogram presented in Figure 3.8a shows no AuNPs of a diameter smaller than 5 nm are
AuNP(small) AuNP(large)
ksm
kmsAuNP(med)
kml
klm
ksl
kls
(3.8)
(3.9)
(3.10)

3A. LASER-BASED FORMATION OF AUNPS VIA LASIS 67
observed, supporting the notion that no fragmentation channel involving small particles is
required.
Table 3.2. Resultant 532-nm kinetic parameters determined following a non-linear least squares fit of the absorbance data to the kinetic model given in Scheme 3; all reported uncertainties represent three standard deviations error (3) SDS: sodium dodecyl sulphate; klm, kms, ksm: rate constants for interconversion between the different gold nanoparticle species as defined in Scheme 3. Ksol: solubility constant which is derived from independent data fit for each SDS concentration. See text for details.
0 M SDS 10-4
M SDS 10-2
M SDS
klm (pulse-1
) (1.627 ± 0.003) ×10-5
(1.27 ± 0.64)×10-3
(3.10 ± 0.05)×10-5
kms (pulse-1
) - 3×10⁻⁵
(fixed) (1.31 ± 0.17)×10-4
ksm (pulse-1
) - (6.69 ± 0.01)×10-5
-
Ksol = kms/ksm - 0.45 -
An important issue to emerge from this study is that the laser irradiation fluence plays a
critical role in the resultant surfactant free AuNP particle size distributions. In this study we
have used a relatively large 532 nm laser fluence of 2.4 × 10⁵ mJ cm-2 pulse-1 and see a relative
absence of AuNPs smaller than 5 nm in diameter. By way of contrast, Meneghetti and
co-workers have used much lower laser fluences of between 10 and 500 mJ cm-2 [43,54] and up
to 1100 mJ cm-2 [55] to generate surfactant free AuNPs as small as 1-2 nm in diameter. Clearly
the key AuNP size transformations occur within the period of laser irradiation. Small AuNPs
may well be produced in our studies, but under the much higher laser fluences employed here
they have insufficient stability or lifetimes to remain in solution for detection via either optical
spectroscopy or TEM. The kinetic model reported here does not account for nascent AuNP
particle size distributions resulting from laser irradiation under the conditions employed. Rather,
the modelling accounts for size distributions of stable AuNPs.
For 10-4 M SDS solutions, three transformations steps are required to fit the experimental data;

3A. LASER-BASED FORMATION OF AUNPS VIA LASIS 68
the large to medium fragmentation step (klm) as well as reversible transformations between
medium and small AuNPs (kms and ksm). However, it is not possible to determine a unique
solution to the values of kms and ksm as they are interdependent. The ratio kms/ksm is a measure of
the equilibrium constant for the reversible transformation. We have fixed the value of kms at
numerous values between the 2.85 × 10⁻⁵ pulse-1 and 1.5 × 10⁻⁴ pulse-1, from which ksm, and
ultimately kms/ksm follow from the fitting procedure. Over this range of investigation, kms/ksm
was determined to have values ranging from 0.43 to 0.45. For example, assuming a value of kms )
3 × 10⁻⁵ pulse-1 yields a value for ksm ) 6.69 × 10⁻⁵ pulse-1, and a ratio (equilibrium constant) of
0.45 (see Table 3.2). Inspection of the histogram in Figure 3.8b shows that particles smaller in
diameter than 4 nm are present in only low relative abundance at an SDS concentration of 10-4
M, suggesting that the medium-sized particles have a stability preference over the small
particles. Such a stability preference is consistent with the modelled kms/ksm ratios being less
than unity. Moreover, the rate constants involving the small particles are 2 orders of magnitude
smaller than the large to medium fragmentation step (klm). Overall, this indicates that, below the
SDS CMC, the involvement of small AuNPs is an important, but low-yielding channel in our
kinetic model.
At an SDS concentration of 10-2 M, only two transformation channels are required to be
invoked, the large-to-medium transformation (klm) and the medium-to-small fragmentation
channel (kms). The rate constants determined from the nonlinear least-squares fitting procedure
are reported in Table 3.2. The significant stability preference for small AuNPs evident from the
rate constants presented in Table 3.2 is consistent with the notion of small micelle-stabilised
AuNPs being the favoured size regime, as indicated in the particle size distribution presented in
Figure 3.8c. We will address the role of micelles in 1064-nm AuNP LASiS in the next Part of
this chapter. We also note that the particle size distribution presented in Figure 3.2c shows that

3A. LASER-BASED FORMATION OF AUNPS VIA LASIS 69
very few large AuNPs (defined as being at least 17 ± 3 nm in diameter) are present in solution
prior to 532 nm laser irradiation.
3a.4 Summary
In this Part of Chapter 3, we have reported on the time evolution of AuNP size distributions as
a function of laser irradiation in pure water samples and at SDS surfactant concentrations above
and below the SDS CMC in water. Our investigations provide an insight into the formation
kinetics involved in AuNP production via nanosecond laser irradiation in aqueous solution.
Importantly, our studies highlight the importance of considering size dependent AuNP stability
over a period of several minutes of laser irradiation. We have developed a kinetic model that in
principle involves the reversible laser-induced transformation between small (<5.5 ± 0.5 nm),
medium (5.5 ± 0.5 to 17 ± 3 nm), and large (>17 ± 3 nm) AuNPs. Our kinetic analysis accounts
for the relative abundances of AuNPs within each size regime as a function of SDS
concentration and laser irradiation time.
In terms of resultant particle size distributions, following preparation via laser ablation at
1064 nm we show that 532 nm laser irradiation in the absence of surfactant generates AuNP that
are both small in size and possess a particularly narrow particle size distribution. The
distribution remains narrow and shifts to smaller average particle size with increasing SDS
concentration.
In the following Part, we explore the role of the CMC in AuNP LASiS involving SDS
solutions in more detail.

70
Part B: Influence of Surfactant Concentration on Laser-Based
Gold Nanoparticle Formation and Stability
3b.1 Introduction
In Part A of this chapter, an investigation into the kinetics surrounding nanoparticle
production using 1064-nm LASiS in SDS aqueous solutions was presented. It was found that
performing LASiS in a solution containing a SDS concentration of 10-2 M (which is greater
than the CMC) resulted in nanoparticles having significantly smaller diameters. Moreover,
subsequent size reduction using 532nm irradiation resulted in a significant reduction in the
particle size distributions, especially at SDS concentrations above the CMC. The smaller
particle size distributions have been attributed, at least in part, to the micelle-stabilised AuNPs
being the favoured size regime [16,32,56]. The study poses an interesting question: does the
micelle stabilisation play an important role in the initial 1064 nm LASiS AuNP production
process?
Mafune and co-workers have employed 1064 nm LASiS, with subsequent irradiation of the
resultant AuNPs using either 532-nm (targeting the AuNP surface plasmon resonance) or
355-nm (targeting the AuNP intervalance transition) irradiation. These workers reported
AuNP size reduction in solutions containing the surfactant sodium dodecyl sulphate (SDS).
Size reduction was found to occur at all SDS concentrations between 2×10⁻⁴ M and 10-1 M, but
more significantly, the final AuNP size distributions exhibited a sudden shift to smaller sizes at
the SDS critical micelle concentration (CMC) of 8×10⁻³ M [16,32]. This effect was observed
at 532-nm laser fluences of between 320 and 1200 mJ/pulse/cm2 [14]. A CMC effect has also
been observed in other laser-based AuNP studies, with the CMC affecting the number density

3B. MICELLAR EFFECT 71
of solvated electrons produced after 355nm excitation [32] and the number of ions produced
following laser desorption from a liquid beam [57].
AuNPs can also be prepared in aqueous solution by the reduction of a gold salt (e.g., gold
tetrachloroaurate) in the presence of citrate. This preparation method, described by Turkevich
[58,59], was reviewed in-depth by Kimling and co-workers [60]. The citrate species acts as a
reductant as well as a stabiliser by passivating the surface of the nanoparticle, thereby
preventing further coagulation. Kimling et al determined that the gold-to-citrate concentration
ratio influences the final size distribution of AuNPs. Varying this ratio between 0.2 to 1.5
increases the average diameter from 20 to 130 nm [60].
Chemical synthesis methods have also employed the use of cationic surfactants to change the
shape and morphology of the AuNPs. For example, gold nanorods are produced when
reduction of the gold salt is performed in a solution containing cetyltrimethylammonium
bromide (CTAB) surfactant [61]. Yang et al [62] have reported that when different CTAB
concentrations were added to AuNPs prepared via the citrate reduction method, dramatic
changes in the morphology of the nanoparticles resulted. For instance, the difference between
adding 0.2 mL and 0.3 mL of 0.01M CTAB to 20mL of gold solution yielded vastly different
UV-Vis spectra [62].
Almost all studies of chemically-synthesised AuNPs that include a surfactant in the reaction
mixture use a cationic surfactant. Very few studies have used anionic surfactants due to the
charge interaction between the anionic surfactant and the negative charge of the
tetrachloroaurate ion [63]. An exception to this is the work by Deng and co-workers who have
performed studies on preparing AuNPs in the presence of SDS surfactant [48]. They have
reported there is no significant size differences when using SDS concentration between 20 mM

3B. MICELLAR EFFECT 72
and 100 mM (that is, at concentrations above the CMC). On the other hand, they observed
gold precipitates at concentrations below the SDS CMC [48].
In the chemically-synthesised AuNP studies described above, the concentration of the
stabiliser has an effect on the final particle size distribution. Moreover, the particle size of
AuNP‟s following laser-induced size reduction using 355 and 532nm irradiation has shown a
strong dependence on the concentration of the stabiliser (surfactant), especially around the
surfactant‟s CMC. It remains an open question as to whether micelle stabilisation plays an
equally significant role in the initial 1064-nm LASiS AuNP production stage as in the
post-LASiS size-reduction processes. To explore this issue, in this Part of Chapter 3, we
investigate the size dependence of AuNPs formed by LASiS under varying SDS concentration
conditions above and below the CMC, as well as the associated production kinetics. SDS is a
prototypical surfactant that has been well studied in numerous other investigations, and is thus
an ideal candidate for the current studies. We note that a similar study has been performed
involving the LASiS production of silver nanoparticles using 532nm irradiation [64], but no
systematic study using AuNP‟s has been reported. The results reported herein provide further
insight into the AuNP LASiS production mechanism, and, interestingly, indicate that
surfactants in the micellar state do not appreciably influence either the production kinetics nor
the resultant AuNP particle size distributions.
3b.2 Experimental
Gold nanoparticles (AuNPs) were prepared by laser ablation following the method described
in Chapter 2.1. The gold nanoparticles were produced in 10mL solution in the glass vessel
containing either either pure water, 10-4 M, 10-3 M, 6×10⁻³ M, 10-2 M or 2×10⁻² M aqueous
solutions of SDS. The concentrations of SDS used correspond to being well below, a little

3B. MICELLAR EFFECT 73
below and just above the aqueous CMC. The gold nanoparticles produced were analysed using
UV-Visible absorption spectroscopy (as discussed in Chapter 2.2.2) and transmission electron
microscopy (see Chapter 2.3.1)
3b.3 Micellar Effect
The absorption spectra of each sample resulting from 1064 nm irradiation of the Au disk at 10
min intervals is displayed in Figure 3.10 for each SDS concentration. Each series of spectra
show very similar behaviour, that is, a steady increase in intensity of the distinctive AuNP
surface plasmon band (SPB) at approximately 520 nm. The intensity of the SPB is indicative
of the number of AuNPs in solution of sufficient size to support the surface plasmon transition
[46,56]. The positions of the wavelength maxima of the SPBs (max) presented in Figure 3.10
is a particle-size characterisation [46] that does not change appreciably over the 220 min
experimental time scale. At each surfactant concentration, max shifts to the blue by no more
than 1.5 nm over the first 100 min of laser irradiation, after which time it remains steady. This
indicates that at each SDS concentration, for particles that are large enough to support the SPB,
the average particle size does not change significantly over the duration of the experiment.
This conclusion is supported by Mie scattering theory [46] and previous studies into the optical
absorption properties of AuNPs [14,15,47,48]. However, the actual max values are dependent
upon surfactant concentration; the value of the AuNP SPB max varies with changes in the
dielectric strength that accompany changes in the SDS concentration [65]. After 100 mins of
irradiation, the 0 M and 10-4 M SDS concentration solutions display a max = 523 nm; at
concentrations of 10-3 M and 6×10⁻³ M the value ofmax is 521 nm, whereas the 10-2 M and
2×10⁻² M data exhibit a max of 519 nm.

3B. MICELLAR EFFECT 74
Figure 3.10. UV-visible absorption spectra of AuNP samples produced via 1064 nm laser
irradiation in aqueous solution (a) with pure water, (b) with 10-4 M SDS present, (c)
with 10-3 M SDS present, (d) with 6 × 10⁻³ M SDS present, (e) with 10-2 M SDS
present, and (f) with 2 × 10⁻² M SDS present in solution. For each surfactant
solution concentration, spectra are displayed at 20 min intervals up to a maximum
irradiation time of 220 min.
0.0
1.0
2.0
3.0
400 500 600 700 800 900
Abso
rba
nce
Wavelength /nm
220 mins
20 mins
(a) 0 M SDS
0.0
1.0
2.0
3.0
400 500 600 700 800 900
Abso
rba
nce
Wavelength /nm
220 mins
20 mins
(b) 10-4
M SDS
0.0
1.0
2.0
3.0
400 500 600 700 800 900
Abso
rba
nce
Wavelength /nm
220 mins
20 mins
(c) 10-3
M SDS
0.0
1.0
2.0
3.0
400 500 600 700 800 900
Abso
rba
nce
Wavelength /nm
220 mins
20 mins
(d) 6 x 10⁻³
M SDS
0.0
1.0
2.0
3.0
400 500 600 700 800 900
Abso
rba
nce
Wavelength /nm
220 mins
20 mins
(e) 10-2
M SDS
0.0
1.0
2.0
3.0
400 500 600 700 800 900
Abso
rba
nce
Wavelength /nm
220 mins
20 mins
(f) 2 x 10⁻²
M SDS

3B. MICELLAR EFFECT 75
In Figure 3.11 we present the absorbance at the SPB max as a function of the number of laser
irradiation pulses (lower x-axis) and 10 Hz laser irradiation time (upper x-axis) for the different
SDS concentrations employed. The data points represent absorbance readings taken after a
specified number of laser pulses, while the solid lines represent fits using our previously
published kinetic model in Chapter 3.3.1 [56] (discussed below). Figure 3.11a reproduces the
previously reported data at 0 M, 10-4 M and 10-2 M SDS concentrations presented in Part A of
this chapter. Figure 3.11b presents results for re-recorded data for this subsequent study at the
same SDS concentrations. Figure 3.11c presents the equivalent data for the previously
unreported SDS concentrations of 10-3 M, 6×10⁻³ M, and 2×10⁻² M.
It is important to note that Figures 3.11a and 3.11b present results from near identical
experimental conditions. The only difference between the data in each Figure is that the
experimental equipment was disassembled after the data in Figure 3.11a was collected and
reassembled for these studies (Figure 3.11b). In addition, a new gold disc was employed for
these latest studies. We have consistently found that the time-dependent absorption data are
reproducible for a particular experimental setup. However, it appears that subtle differences
between experimental setups lead to slightly different rates of formation of nanoparticles,
though in all cases the data fit the same kinetic model. Although the actual production rates (as
evidenced by the steepness of the slopes) vary slightly between the setups used to generate the
data in Figures 3.11a and 3.11b, the overall trends remain the same. Obviously, the production
rates are highly dependent on the exact interaction between the laser and gold sample. We
highlight this issue to alert the reader to the difficulties in obtaining quantitatively consistent
kinetic data. Nonetheless, as will be discussed below, the differences between the data
presented in Figures 3.11a and 3.11b do not change the conclusions that are drawn.
Inspection of Figures 3.11a-c indicates that, irrespective of the surfactant concentration, the

3B. MICELLAR EFFECT 76
max absorbance increases linearly after approximately 2×10⁴ laser pulses (i.e., an irradiation
time of ~2×10³ seconds), with significant curvature in the data evident at early irradiation times.
This curvature is highlighted in Figure 3.11e, which presents an expansion of the early time data
in Figure 3.11c. In an overall sense, all traces in Figures 3.11a-c display very similar
behaviour at long (linear) and short (curved) irradiation times. Overall AuNP productions
rates are fastest at SDS concentrations of 6×10⁻³, 10-2 and 2×10⁻² M, with an intermediate rate at
10-3 M, and the slowest rates at 0 and 10-4 M.
The intensity of the SPB is indicative of the number of AuNPs in solution of sufficient size to
support the surface plasmon transition. By contrast, the absorbance at the intervalence band
(approximately 350–450 nm), is indicative of the total number of gold atoms in solution,
whether they be in SBP-supporting AuNPs or otherwise; the extinction coefficient of AuNPs at
450 nm is size independent [46]. In Figure 3.11d we present the time-dependent absorbance
data at the intervalence band wavelength of 450 nm for SDS concentrations of 10-3, 6×10⁻³, and
2×10⁻² M. Figure 3.11f presents an expansion of the early time data in Figure 3.11d, where the
curvature in the time-dependent data is highlighted. As above, in both cases the data points
represent absorbance readings taken after a specified number of laser pulses, while the solid
lines represent fits to the kinetic model presented in Part A of this chapter. As previously
discussed, the absorbance data at 450 nm is used in conjunction with that measured at the
various SPBmax wavelengths in the kinetic model that was introduced in Section 3a.3.1.1 [56].
Insight into the AuNP formation chemistry is obtained by fitting the time-dependent
absorbance data to an appropriate kinetic model. Earlier, in Section 3a.3.1.1, we reported a
model that explains the production of AuNPs via the LASiS approach [56]. This model is used
to fit the experimental data presented in Figure 3.11, and the quality of the fits is evident by

3B. MICELLAR EFFECT 77
Figure 3.11. Variation in absorbance of the AuNP in aqueous solution in pure water and at
various SDS concentrations as a function of 10 Hz 1064 nm laser irradiation.
Panels (a), (b), (c) and (e) report absorbances at the surface plasmon band SPB.
Panels (d) and (f) report absorbances at 450 nm (within the intervalence transition
region). Panel (a) reproduces previously reported data [56]; all other panels
present data collected for this study. All SDS concentrations are indicated within
each panel. Panels (e) and (f) show a magnified view of the early time data of
panels (c) and (d), respectively. The error bars represent a maximum uncertainty
of 0.01 absorbance units found for differences between experiments. See text for a
discussion of the phenomena involved.
0
0.5
1
1.5
2
2.5
3
3.5
0 5 x 10⁴
1 x 10⁵
1.5 x 10⁵
2 x 10⁵
0 5 x 10³
1 x 10⁴
1.5 x 10⁴
2 x 10⁴
Abso
rba
nce
Number of laser pulses
a) SPB
Time (second)
10-2
M SDS
10-4
M SDS
0 M SDS
previously published
0
0.5
1
1.5
2
2.5
3
3.5
0 5 x 10⁴
1 x 10⁵
1.5 x 10⁵
2 x 10⁵
0 5 x 10³
1 x 10⁴
1.5 x 10⁴
2 x 10⁴
Abso
rba
nce
Number of laser pulses
b) SPB
Time (second)
10-2
M SDS10
-4 M SDS
0 M SDS
present study
0
0.5
1
1.5
2
2.5
3
3.5
0 5 x 10⁴
1 x 10⁵
1.5 x 10⁵
2 x 10⁵
0 5 x 10³
1 x 10⁴
1.5 x 10⁴
2 x 10⁴
10-3
M SDS
6 x 10⁻³
M SDS
2 x 10⁻²
M SDS10-3M SDS6 x 10-3M SDS2 x 10-2M SDS
Abso
rba
nce
Number of laser pulses
c) SPB
Time (second)
0
0.5
1
1.5
2
2.5
0 5 x 10⁴
1 x 10⁵
1.5 x 10⁵
2 x 10⁵
0 5 x 10³
1 x 10⁴
1.5 x 10⁴
2 x 10⁴
10-3
M SDS
6 x 10⁻³
M SDS
2 x 10⁻²
M SDS10-3M SDS6 x 10-3M SDS2 x 10-2M SDS
Abso
rba
nce
Number of laser pulses
d) 450 nm
Time (second)
0
0.05
0.1
0.15
0.2
0.25
0.3
0.35
0.4
0 2000 4000 6000 8000 10000
0 200 400 600 800 1000
10-3
M SDS
6 x 10⁻³
M SDS
2 x 10⁻²
M SDS
10-3M SDS
6 x 10⁻³M SDS2 x 10-2M SDS
Abso
rba
nce
Number of laser pulses
e) SPB
Time (second)
0
0.05
0.1
0.15
0.2
0.25
0.3
0 2000 4000 6000 8000 10000
0 200 400 600 800 1000
10-3
M SDS
6 x 10⁻³
M SDS
2 x 10⁻²
M SDS
10-3M SDS
6 x 10⁻³M SDS2 x 10-2M SDS
Abso
rba
nce
Number of laser pulses
f) 450 nm
Time (second)
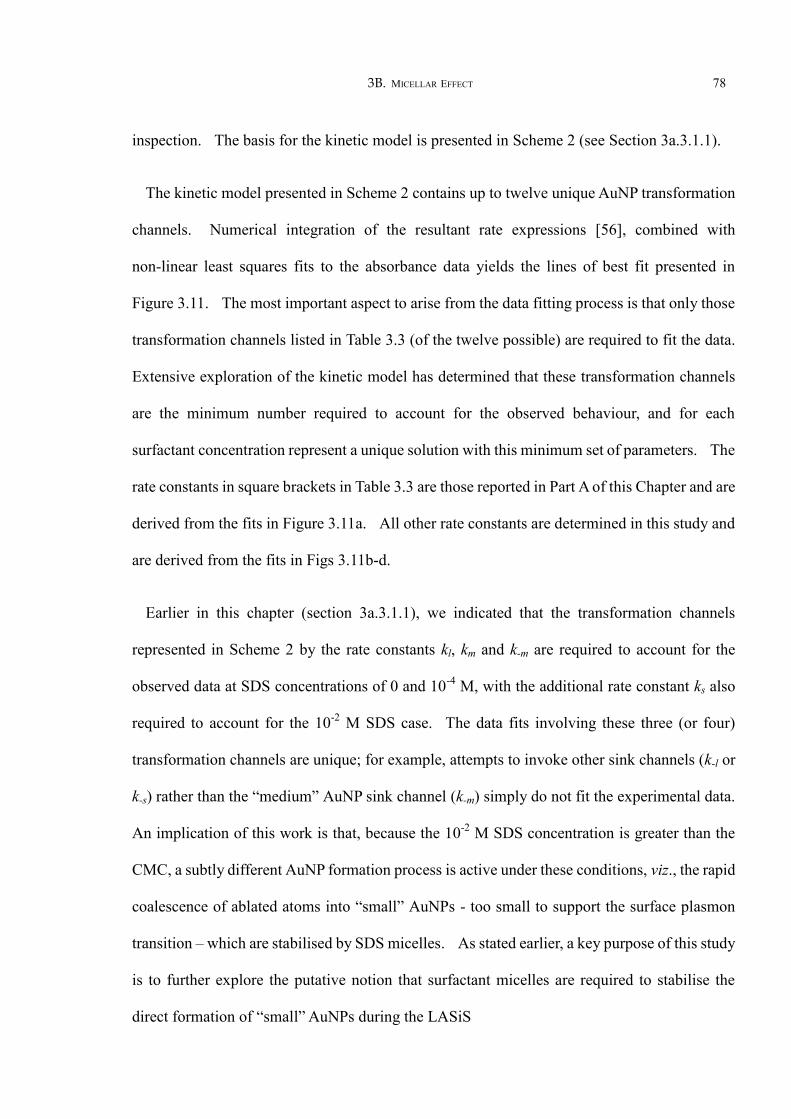
3B. MICELLAR EFFECT 78
inspection. The basis for the kinetic model is presented in Scheme 2 (see Section 3a.3.1.1).
The kinetic model presented in Scheme 2 contains up to twelve unique AuNP transformation
channels. Numerical integration of the resultant rate expressions [56], combined with
non-linear least squares fits to the absorbance data yields the lines of best fit presented in
Figure 3.11. The most important aspect to arise from the data fitting process is that only those
transformation channels listed in Table 3.3 (of the twelve possible) are required to fit the data.
Extensive exploration of the kinetic model has determined that these transformation channels
are the minimum number required to account for the observed behaviour, and for each
surfactant concentration represent a unique solution with this minimum set of parameters. The
rate constants in square brackets in Table 3.3 are those reported in Part A of this Chapter and are
derived from the fits in Figure 3.11a. All other rate constants are determined in this study and
are derived from the fits in Figs 3.11b-d.
Earlier in this chapter (section 3a.3.1.1), we indicated that the transformation channels
represented in Scheme 2 by the rate constants kl, km and k-m are required to account for the
observed data at SDS concentrations of 0 and 10-4 M, with the additional rate constant ks also
required to account for the 10-2 M SDS case. The data fits involving these three (or four)
transformation channels are unique; for example, attempts to invoke other sink channels (k-l or
k-s) rather than the “medium” AuNP sink channel (k-m) simply do not fit the experimental data.
An implication of this work is that, because the 10-2 M SDS concentration is greater than the
CMC, a subtly different AuNP formation process is active under these conditions, viz., the rapid
coalescence of ablated atoms into “small” AuNPs - too small to support the surface plasmon
transition – which are stabilised by SDS micelles. As stated earlier, a key purpose of this study
is to further explore the putative notion that surfactant micelles are required to stabilise the
direct formation of “small” AuNPs during the LASiS

Table 3.3. Resultant 1064 nm Kinetic Parameters (Rate Constants) Determined Following a Nonlinear Least Squares Fit of the Absorbance Data to the
Kinetic Model Given in Scheme 1 a All reported uncertainties represent 3 Standard Deviations Error (3). SDS: sodium dodecyl sulphate; kl,
km, ks, k-m: rate constants for interconversion between the different gold nanoparticle species as defined in Scheme 2.
SDS Conc. 0 M 10-4
M 10-3
M 6 × 10⁻³
M 10-2
M 2 × 10⁻²
M
kl (pulse-1
) (1.031 ± 0.005)×10-5
[(6.07 ±0.09)×10-6] (1.089 ± 0.014)×10-5
[(6.04 ± 0.06)×10-6] (1.153±0.014)×10-5
(1.367 ± 0.008)×10-5
(1.336 ± 0.015)×10-5
[(1.01 ± 0.01)×10-5] (1.359 ± 0.009)×10-5
km (pulse-1
) (1.39 ± 0.09)×10-5
[(1.4 ± 0.4)×10-5] (1.25 ± 0.18)×10-5
[(1.18 ± 0.12)×10-5] (1.26 ± 0.16)×10-5
(1.53 ± 0.14)×10-5
(1.53 ± 0.17)×10-5
[(2.6 ± 0.6)×10-5] (1.39 ± 0.14)×10-5
ks (pulse-1
) - - (1.56 ± 0.15)×10-6
(2.56 ± 0.08)×10-6
(3.17 ± 0.18)×10-6
[(1.37 ± 0.17)×10-6] (2.98 ± 0.09)×10-6
k-m (pulse-1
) (1.03 ± 0.09)×10-4
[(1.8 ± 0.6)×10-4] (8.4 ± 1.7)×10-5
[(7.9 ± 1.1)×10-5] (7.4 ± 1.4)×10-5
(1.32 ± 0.19)×10-4
(8.2 ± 1.2)×10-5
[(2.1 ± 0.6)×10-4] (1.16 ± 0.19)×10-4
a The rate constants in parentheses are those reported in Part A of this Chapter [56]. See text for additional details.

3B. MICELLAR EFFECT 80
process. Inspection of the rate constants reported in Table 3.3 indicates that the direct
formation of these “small” AuNPs (represented by the need to incorporate the ks formation
channel in the kinetic model) is required for SDS concentrations of 10-3 M and greater. Recall
that the CMC for SDS in water is 8×10⁻³ M. This suggests that the surfactant is stabilising the
formation of the smallest AuNPs, but not necessarily in the form of micelles.
The TEM images of AuNPs produced via the LASiS method at SDS concentrations of 0, 10-4
and 10-2 M are presented in Figure 3.2. Representative TEM images, together with histograms
indicating their associated particle size distributions, of AuNP samples prepared in 10-3, 6×10⁻³
and 2×10⁻² M SDS solutions after 90 min of 1064 nm laser irradiation are presented in Figure
3.12. To improve the statistics of each particle size distribution determination, each histogram
was generated by analysing multiple images rather than just the image presented above it.
Each TEM image shows that the AuNPs adopt a roughly spherical geometry, with each
associated histogram indicating relatively narrow particle size distributions. For the case of
10-3 M SDS, the particle size distribution peaks at 4 nm with relatively few particles evident
above 20 nm in diameter. The average particle size is 5.7 nm with a standard deviation (1) in
the distribution of 3.6 nm. However, at SDS concentrations of 6×10⁻³ M and 2×10⁻² M SDS,
significantly narrower, near identical, size distributions are evident. At 6×10⁻³ M SDS the
average particle size is 4.3 nm with a standard deviation (1) of 2.9 nm. At and 2×10⁻² M SDS
the average particle size is 4.0 nm with the standard deviation (1) of 2.2 nm. Close inspection
of the particle size distributions in Figure 3.12 shows that AuNP smaller than 4 nm in diameter
are produced at all three SDS concentrations. We have previously noted that LASiS
production of such small AuNP does not occur at SDS concentrations of 0 and 10-4 M [56]. The
AuNP particle size distributions reported here are broader than others reported in the literature.

3B. MICELLAR EFFECT 81
For example, the production of thiol-derivatised AuNPs prepared by the reduction of AuCl4¯
has been reported to result in very narrow particle size distributions, with particles in the range
1-3 nm [66]. However, it is difficult to comment further on the reported differences in size
distributions owing to both the different AuNP production methods as well as the use of
surfactant- versus ligand-stabilisation of the particles.
To further assess the particle size distributions presented in Figure 3.12, and to explore the
influence (if any) of surfactant micelles on these distributions, in Figure 3.13 we present a
representation of the particle size distributions at each SDS concentration employed in this
study. The intensity of any given particle size is given as a false colour representation. The
solid white line represents the variation in the average particle size at each concentration and is
included merely to guide the eye. The vertical dashed line represents the SDS CMC in
aqueous solution. Based upon the reports of Mafuné and co-workers [14,32,57], we do not
expect that the presence of AuNPs in solution changes the SDS CMC in aqueous solution under
the conditions reported in this study. Therefore, the surfactant will exist in micellar form at the
two highest concentrations used in this study.
The first feature evident in Figure 3.13 is that as the concentration of SDS increases there is a
steady narrowing in the overall particle size distributions, with a concomitant decrease in
average particle size at low surfactant concentrations. Moreover, at an SDS concentration of
10-3 M and above, there is no appreciable change in the average particle size. More
importantly, however, Figure 3.13 clearly shows that the AuNP particle size distributions are
remarkably uniform at SDS concentrations of 10-3 M and greater, with peaks in the distributions
(at a size of 4 nm evident in Figure 3.12), and exhibit no apparent size change that is attributable
to the presence of surfactant micelles. Significantly, the kinetic model described in Scheme 2
requires the direct formation of „small‟ AuNPs (ks) at all SDS concentrations studied from

Figure 3.12. Representative TEM images, together with histograms indicating their associated particle size distributions, of AuNP samples prepared at (a) 10-3 M, (b) 6×10⁻³ M, and (c) 2×10⁻² M SDS concentrations after 90 min of 1064 nm laser irradiation. The scale bar in the lower right-hand corner of each image represents 100 nm
0
50
100
150
200
0 5 10 15 20 25 30 35 40 45 50
Nu
mb
er
of P
art
icle
s
Particle Diameter (nm)
Avg Diameter = 5.7 nm = 3.6 nm
(a) 10-3
M SDS
0
50
100
150
200
250
300
0 5 10 15 20 25 30 35 40 45 50
Nu
mb
er
of P
art
icle
s
Particle Diameter (nm)
Avg Diameter = 4.3 nm = 2.9 nm
(b) 6 x 10⁻³
M SDS
0
50
100
150
200
250
300
0 5 10 15 20 25 30 35 40 45 50
Nu
mb
er
of P
art
icle
s
Particle Diameter (nm)
Avg Diameter = 4.0 nm = 2.2 nm
(c) 2 x 10⁻²
M SDS

3B. MICELLAR EFFECT 83
10-3 M and above to reproduce the experimental data. Together, all of this information
suggests that although the presence of SDS has an effect, the presence of micelles (above the
CMC) is not playing an important role in the production and stability of „small‟ AuNP using the
LASiS method employing 1064-nm irradiation.
Figure 3.13. Particle size distributions of AuNP as a function of SDS concentration after 90
min of 1064 nm laser irradiation. The dashed line represents the critical micelle
concentration of SDS in aqueous solution (8×10⁻³ M). The solid white line
represents the average particle diameter (i.e., not the most probable size) at each
concentration and is intended to merely guide the eye. See text for a discussion of
the observed trends.
One way to account for „small‟ AuNP stability at SDS concentrations near to, but below the
CMC is to consider the LASiS process whereby plasma is generated at the laser-solid metal
interface that ejects gold atoms/clusters from the bulk into solution. Mortazavi and
co-workers have described the mechanistic details of the ablation/plasma process in detail [67].
The nascent atoms/clusters quickly coalesce and evolve into nanoparticles until sufficient SDS
has attached to the nanoparticle surface to stop further growth. This process is influenced by
the concentration of surfactant in solution, but not on the presence of micelles. Mafuné and
co-workers have reported a similar insensitivity to the SDS CMC on silver nanoparticle size
distributions prepared by 532-nm LASiS, although these researchers report an alternative
0
10
20
30
40
50
0
Part
icle
siz
e /nm
10-5
0.0001 0.001 0.01 0.1
SDS Concentration /M
CMC
0
Max

3B. MICELLAR EFFECT 84
nanoparticle formation mechanism [64]. By contrast, the 355-nm and 532-nm size reduction
processes (not LASiS) also reported by Mafuné et al. [16,32] display significant changes at the
SDS CMC because the AuNP are surrounded by surfactant prior to laser irradiation, and „small‟
particle stability is afforded by the presence of micelles.
A remaining possibility to account for the near invariance in AuNP particle size distributions
at SDS concentrations below 10-3 M is that below this surfactant concentration there are
insufficient SDS molecules to fully coat the nanoparticles with a monolayer of surfactant, and
thus allow for enhanced particle aggregation. Based upon the work of Liu and co-workers [68],
we are able to determine the size-dependent optical extinction coefficient of AuNPs at each
SDS concentration, and thus the concentration of AuNP in solution from the Beer-Lambert law.
Assuming spherical AuNP morphology, we can further estimate the „average‟ surface area of
AuNPs at each SDS concentration from the average diameters reported in Figure 3.11.
Almgren and Swarup [69] report that the surface area of each SDS head group is approximately
5.92 х 10-19 m2. From this body of information, we are able to estimate the number of SDS
molecules required to coat the AuNP with a monolayer of surfactant, together with the number
of available SDS molecules per AuNP in solution after 300 minutes of irradiation. The results
of this analysis are presented in Table 4.2. It is clear from the data presented in Table 4.2 that
for all SDS concentrations employed in this study, there is a clear excess of SDS relative to the
number of AuNPs in solution. Thus, the larger AuNP size distributions observed at 10-4 M
SDS cannot be attributed to partial surfactant coverage of the nanoparticles.

Table 3.4. Determination of the Concentration of AuNP in Solution and the Number of SDS Molecules Available per AuNP following 300 Minutes of
Laser Irradiation. See Text for Details.
SDS
Concentration (M)
Average AuNP
diameter (nm)
AuNP extinction
coefficient
(M-1 cm-1)
AuNP
Concentration
(M)
Surface area of
average sized
AuNP (m2)
Number of SDS
required to cover
the AuNP surface
Number of SDS
molecules
available per
AuNP
0 19.1 8.85×10⁸ 3.54×10⁻⁹ 1.15×10⁻¹⁵ - -
1×10⁻⁴ 13.0 2.47×10⁸ 1.00×10⁻⁸ 5.31×10⁻¹⁶ 896.8 9984
1×10⁻³ 5.46 1.38×10⁷ 2.02×10⁻⁷ 9.37×10⁻¹⁷ 158.2 4945
6×10⁻³ 3.88 4.45×10⁶ 7.35×10⁻⁷ 4.73×10⁻¹⁷ 79.9 8163
1×10⁻² 4.74 8.65×10⁶ 3.86×10⁻⁷ 7.06×10⁻¹⁷ 119.2 25880
2×10⁻² 4.08 5.26×10⁶ 6.27×10⁻⁷ 5.23×10⁻¹⁷ 88.3 31911

3B. MICELLAR EFFECT 86
3b.4 Summary
We have reported on the time evolution of AuNP yields as a function of 1064-nm LASiS
irradiation time at SDS concentrations above and below the CMC in water, as well as the
associated particle size distributions after 90 minutes of irradiation. These investigations
provide further insight into the formation kinetics involved in AuNP production via the LASiS
approach, indicating that while the concentration of SDS plays a role in the formation kinetics,
there is no apparent influence of micelles on AuNP stability during LASiS. This conclusion is
supported by both an analysis of the formation kinetics as well as the resultant particle size
distributions.

3B. MICELLAR EFFECT 87
3.1 References and Notes
(1) Buffat, P.; Borel, J.-P. Physical Review A 1976, 13, 2287-2298.
(2) Daniel, M. C.; Astruc, D. Chemical Reviews 2004, 104, 293-346.
(3) Hutter, E.; Fendler, J. H. Advanced Materials 2004, 16, 1685-1706.
(4) Henglein, A. Journal of Physical Chemistry 1993, 97, 5457-5471.
(5) Armendariz, V.; Herrera, I.; Peralta-Videa, J. R.; Jose-Yacaman, M.; Troiani, H.; Santiago, P.; Gardea-Torresdey, J. L. Journal of Nanoparticle Research 2004, 6, 377-382.
(6) Curulli, A.; Valentini, F.; Padeletti, G.; Cusma, A.; Ingo, G. M.; Kaciulis, S.; Caschera, D.; Palleschi, G. Sensors and Actuators B-Chemical 2005, 111, 526-531.
(7) Gao, X. Y.; Matsui, H. Advanced Materials 2005, 17, 2037-2050.
(8) Li, C. Z.; Male, K. B.; Hrapovic, S.; Luong, J. H. T. Chemical Communications 2005, 3924-3926.
(9) Schmid, G.; Simon, U. Chemical Communications 2005, 697-710.
(10) Schmid, G.; Corain, B. European Journal of Inorganic Chemistry 2003, 3081-3098.
(11) Mafune, F.; Kohno, J.; Takeda, Y.; Kondow, T. Journal of Physical Chemistry B 2001, 105, 9050-9056.
(12) Mafune, F.; Kohno, J.; Takeda, Y.; Kondow, T.; Sawabe, H. Journal of Physical Chemistry B 2001, 105, 5114-5120.
(13) Mafune, F.; Kohno, J. Y.; Takeda, Y.; Kondow, T. Journal of Physical Chemistry B 2002, 106, 8555-8561.
(14) Mafune, F.; Kohno, J. Y.; Takeda, Y.; Kondow, T. Journal of Physical Chemistry B 2002, 106, 7575-7577.
(15) Mafune, F.; Kohno, J.; Takeda, Y.; Kondow, T. Journal of Physical Chemistry B 2003, 107, 12589-12596.
(16) Mafune, F.; Kondow, T. Chemical Physics Letters 2003, 372, 199-204.
(17) Mafune, F. Chemical Physics Letters 2004, 397, 133-137.
(18) Compagnini, G.; Scalisi, A. A.; Puglisi, O. Journal of Applied Physics 2003, 94, 7874-7877.
(19) Compagnini, G.; Scalisi, A. A.; Puglisi, O.; Spinella, C. Journal of Materials Research 2004, 19, 2795-2798.

3B. MICELLAR EFFECT 88
(20) Amendola, V.; Rizzi, G. A.; Polizzi, S.; Meneghetti, M. Journal of Physical Chemistry B 2005, 109, 23125-23128.
(21) Sylvestre, J. P.; Poulin, S.; Kabashin, A. V.; Sacher, E.; Meunier, M.; Luong, J. H. T. Journal of Physical Chemistry B 2004, 108, 16864-16869.
(22) Inasawa, S.; Sugiyama, M.; Yamaguchi, Y. Journal of Physical Chemistry B 2005, 109, 9404-9410.
(23) Sylvestre, J. P.; Kabashin, A. V.; Sacher, E.; Meunier, M. Applied Physics a-Materials Science & Processing 2005, 80, 753-758.
(24) Sylvestre, J. P.; Kabashin, A. V.; Sacher, E.; Meunier, M.; Luong, J. H. T. Journal of the American Chemical Society 2004, 126, 7176-7177.
(25) Niidome, Y.; Hori, A.; Sato, T.; Yamada, S. Chemistry Letters 2000, 310-311.
(26) Kurita, H.; Takami, A.; Koda, S. Applied Physics Letters 1998, 72, 789-791.
(27) Takami, A.; Kurita, H.; Koda, S. Journal of Physical Chemistry B 1999, 103, 1226-1232.
(28) Link, S.; El-Sayed, M. A. International Reviews in Physical Chemistry 2000, 19, 409-453.
(29) Link, S.; Hathcock, D. J.; Nikoobakht, B.; El-Sayed, M. A. Advanced Materials 2003, 15, 393.
(30) Link, S.; El-Sayed, M. A.; Mohamed, M. B. Journal of Physical Chemistry B 2005, 109, 10531-10532.
(31) Simakin, A. V.; Voronov, V. V.; Shafeev, G. A.; Brayner, R.; Bozon-Verduraz, F. Chemical Physics Letters 2001, 348, 182-186.
(32) Yamada, K.; Tokumoto, Y.; Nagata, T.; Mafune, F. Journal of Physical Chemistry B 2006, 110, 11751-11756.
(33) Kim, S. J.; Jang, D. J. Applied Physics Letters 2005, 86.
(34) Mafune, F.; Kohno, J.; Takeda, Y.; Kondow, T. Journal of the American Chemical Society 2003, 125, 1686-1687.
(35) Satoh, N.; Hasegawa, H.; Tsujii, K.; Kimura, K. Journal of Physical Chemistry 1994, 98, 2143-2147.
(36) Link, S.; El-Sayed, M. A. Annual Review of Physical Chemistry 2003, 54, 331-366.
(37) Plech, A.; Kotaidis, V.; Lorenc, M.; Wulff, M. Chemical Physics Letters 2005, 401, 565-569.

3B. MICELLAR EFFECT 89
(38) Inasawa, S.; Sugiyama, M.; Noda, S.; Yamaguchi, Y. J. Phys. Chem. B 2006, 110, 3114-3119.
(39) Hodak, J.; Martini, I.; Hartland, G. V. Chemical Physics Letters 1998, 284, 135-141.
(40) Hodak, J. H.; Henglein, A.; Hartland, G. V. Journal of Chemical Physics 1999, 111, 8613-8621.
(41) Matsuo, N.; Muto, H.; Miyajima, K.; Mafune, F. Physical Chemistry Chemical Physics 2007, 9, 6027-6031.
(42) Muto, H.; Miyajima, K.; Mafune, F. Journal of Physical Chemistry C 2008, 112, 5810-5815.
(43) Amendola, V.; Meneghetti, M. Physical Chemistry Chemical Physics 2009, 11, 3805-3821.
(44) Dutkiewicz, E.; Jakubowska, A. Colloid and Polymer Science 2002, 280, 1009-1014.
(45) Gonzalez-Romero, E.; Fernandez-Calvar, M. B.; Bravo-Diaz, C. Langmuir 2002, 18, 10311-10317.
(46) Bohren, C. F.; Huffman, D. R. Absorption and Scattering of Light by Small Particles; Wiley-Interscience: New York, 1983.
(47) Mafune, F.; Kondow, T. Chemical Physics Letters 2004, 383, 343-347.
(48) Deng, J. P.; Wu, C. H.; Yang, C. H.; Mou, C. Y. Langmuir 2005, 21, 8947-8951.
(49) Amendola, V.; Mattei, G.; Cusan, C.; Prato, M.; Meneghetti, M. Synthetic Metals 2005, 155, 283-286.
(50) Link, S.; El-Sayed, M. A. Journal of Physical Chemistry B 1999, 103, 8410-8426.
(51) He, Y. Q.; Liu, S. P.; Kong, L.; Liu, Z. F. Spectrochimica Acta Part a-Molecular and Biomolecular Spectroscopy 2005, 61, 2861-2866.
(52) Jain, P. K.; Lee, K. S.; El-Sayed, I. H.; El-Sayed, M. A. Journal of Physical Chemistry B 2006, 110, 7238-7248.
(53) Kreibig, U.; Vollmer, M. Optical Properties of Metal Clusters; Springer: New York, 1995.
(54) Amendola, V.; Meneghetti, M. Journal of Material Chemistry 2007, 17, 4705-4710.
(55) Amendola, V.; Dini, D.; Polizzi, S.; Shen, J.; Kadish, K. M.; Calvete, M. J. F.; Hanack, M.; Meneghetti, M. Journal of Physical Chemistry C 2009, 113, 8688-8695.
(56) Fong, Y. Y.; Gascooke, J. R.; Visser, B. V.; Metha, G. F.; Buntine, M. A. Journal of Physical Chemistry C 2010, 114, 15931-15940.

3B. MICELLAR EFFECT 90
(57) Shoji, M.; Miyajima, K.; Mafune, F. Journal of Physical Chemistry C 2008, 112, 1929-1932.
(58) Turkevich, J. Gold Bulletin 1985, 18, 86 - 91.
(59) Turkevich, J. Gold Bulletin 1985, 18, 125 - 131.
(60) Kimling, J.; Maier, M.; Okenve, B.; Kotaidis, V.; Ballot, H.; Plech, A. Journal of Physical Chemistry B 2006, 110, 15700-15707.
(61) Nikoobakht, B.; El-Sayed, M. Chemical Materials 2003, 15, 1957 - 1962.
(62) Yang, Y.; Matsubara, S.; Nogami, M.; Shi, J. Materials Science and Engineering B 2007, 140, 172 - 176.
(63) Esumi, K.; Sato, N.; Torigoe, K.; Meguro, K. Journal of Colloid and Interface Science 1992, 149, 295-298.
(64) Mafune, F.; Kohno, J.; Takeda, Y.; Kondow, T.; Sawabe, H. Journal of Physical Chemistry B 2000, 104, 9111-9117.
(65) Amendola, V.; Meneghetti, M. Journal of Physical Chemistry C 2009, 113, 4277-4285.
(66) Valente, A. J. M.; Burrows, H. D.; Cruz, S. M. A.; Pereira, R. F. P.; Ribeiro, A. C. F.; Lobo, V. M. M. Journal of Colloid and Interface Science 2008, 323, 141-145.
(67) Mortazavi, S. Z.; Parvin, P.; Reyhani, A.; Golikand, A. N.; Mirershadi, S. Journal of Physical Chemistry C 2011, 115, 5049-5057.
(68) Liu, X.; Atwater, M.; Wang, J.; Huo, Q. Colloids and Surfaces B-Biointerfaces 2007, 58, 3-7.
(69) Almgren, M.; Swarup, S. J. Phys. Chem. 1982, 86, 4212-4216.

CHAPTER 4
The Photoreduction Kinetics of Sodium
Tetrachloroaurate under Synchrotron Soft X-ray
Exposure
4.1 Introduction
Metal nanoparticles have attracted significant interest due to their potential use in
applications such as microelectronics, photonics, catalysis, and biochemical sensors [1-15].
Gold nanoparticles can be generated with control over size and shape via a number of
techniques. These include chemical reduction from an aqueous tetrachloroaurate solution,
[16,17] X-ray [18,19] and -ray irradiation [20] of a solid gold salt, chemical synthesis of size
specific clusters (e.g., 55-atom Au) [21], direct deposition of size-selected clusters onto a
substrate [22], and laser ablation of a metallic gold disc [23-28]. Earlier in this thesis, we have
described the kinetics involved in nanoparticle formation in solution via laser ablation of gold
in pure water and solutions of sodium dodecylsulphate. We now extend our work to
investigate nanoparticle behaviour under X-ray irradiation. Herein we determine the reaction
pathway and kinetics for the reduction of sodium tetrachloroaurate (NaAuCl4•2H2O) under
X-ray exposure on a silicon substrate as a precursor to understanding nanoparticle
photochemistry.
X-ray photoelectron spectroscopy (XPS) is known to cause chemical and structural changes
within several investigated molecules [29,30]. The technique has been reported to result in the

4. PHOTOREDUCTION KINETICS OF NaAuCl4 92
reduction of metal ions by ion, electron and photon bombardment, referred to as
„radiation-induced damage‟ during the development of the technique. A series of studies have
concluded that inorganic salts undergo redox processes during XPS measurements, such as the
decomposition of ClO4¯ to yield ClO3¯ and Cl¯and of MgCl to form Mg and Cl2 [29].
Complexes of CrVI (e.g., CrO3, K2CrO4) show reduction to CrIII compounds under X-ray
exposure [30-34]. Other studies have reported that X-ray induced decomposition of the
investigated molecules leads to a growth of oxide or halide peaks in the XPS spectra [18,19,29].
Many reports of X-ray exposure leading to desorption of oxygen or chlorine radicals/anions to
generate oxygen or chlorine gas have been made [17-19,29-31,33,35,36].
In 2005 Karadas and co-workers [37] published an overview of the tetrachloroauric acid
(HAuCl4) photo-reduction process from AuIII to Au0 when exposed to 1253.6eV Mg
K(non-monochromatized) radiation. They found that reduction of gold to its metallic state
occurs with the production of chlorine gas and embedment of HCl into the support matrix.
Together with further contributions from Ozkaraoglu et al., Karadas and co-workers showed
that the disappearance of AuIII and Cl peaks in the XPS spectra occur via first order kinetics, but
with differing rates [18,19,37].
In this chapter, we explore the chemical changes and the associated kinetics of sodium
tetrachloroaurate (NaAuCl4) exposed to synchrotron soft X-radiation. This is achieved by
recording high resolution XPS spectra of the gold 4f region as a function of X-ray exposure
time. Our spectra are recorded at a higher resolution than previous studies, providing new
insight into the photo-reduction process. In particular, we unambiguously show stepwise XPS
photo-reduction to occur via the AuI state.

4. PHOTOREDUCTION KINETICS OF NaAuCl4 93
4.2 Experimental Method
A solution containing 0.02g of sodium tetrachloroaurate (NaAuCl4•2H2O, Aldrich, >99%
purity) in 10 ml of water was prepared. One drop of this mixture was deposited on a clean 6 x
6 mm silicon (Si) wafer and subsequently dried under vacuum. The Si wafer was then fixed to
double-sided copper tape to ensure the electrical conductivity of the sample. Photoelectron
spectra were recorded at the Soft X-Ray Beamline at the Australian Synchrotron (AS) using a
SPECS Phoibos 150 Hemispherical Electron Analyser. Samples were continuously irradiated
for a period of 900 seconds. During this irradiation, sequential XPS spectra were recorded by
scanning the electron analyser from 95 to 70 eV in 0.05 eV increments. These scans each took
50 seconds to complete followed by ~16 second delay before the next scan started. The
synchrotron radiation was set to a photon energy of 650 eV [38], and adjusted to yield an
irradiation spot size of ~600 m. The electron analyser pass energy was set to 10 eV, yielding
an instrumental resolution of 295 meV in terms of resultant electron kinetic energy [38]. XPS
spectra in the region of the Au 4f peaks were calibrated using the Au 4f7/2 peak (84.0 eV) of gold
foil [39].
We employed an X-ray photon flux at the AS of approximately 1012 photons mm-2 s-1,
conditions similar to those recently discussed by Hu et al. [40]. Under these conditions, it is
highly unlikely that we are inducing localised heating of the NaAuCl4 or the substrate. For
example, at a photon energy of 650 eV, the total irradiation power is approximately 100 W
over an area of ~600 m2. The temperature rise of the sample can be estimated using Fourier‟s
Law, , where q is the conductive heat transfer (W), K is the thermal
conductivity of material (Wm-1K-1), A is the heat transfer area (m2), is the temperature
difference across the material (K), and S is the material thickness (m). Assuming the thickness
of the sample on the surface is 1m, the temperature difference across the sample is determined

4. PHOTOREDUCTION KINETICS OF NaAuCl4 94
to be less than 0.1 °C. Fourier‟s Law assumes a steady state approximation, but in reality the
synchrotron radiation is pulsed, having a pulse width of ~0.1 ns and ~2 ns between pulses. This
will cause the instantaneous temperature rise to increase by approximately a factor of 20. Thus,
there is insufficient monochromatic X-ray power to result in appreciable thermal damage.
Moreover, under the defocused irradiation conditions, combined with the low detector pass
energy of 10 eV, the synchrotron-based XPS studies reported here afford more photoelectrons
being produced and recorded at higher resolutions than is possible in laboratory-based
instruments. It is these aspects that have enabled our study to provide new insight into the
X-ray photo-reduction of AuIII.
For each recorded XPS spectrum, the data was de-convoluted to obtain the relative
population of each gold oxidation state. This was achieved by fitting the spectra to a sum of
peaks using non-linear least squares minimisation. A Shirley background was applied to
remove the electron scattering background and maintain the intrinsic lineshape from the raw
data [41,42]. A pseudo-Voigt function comprised of the sum of Gaussian (30%) and
Lorentzian (70%) functions [43] was used, with a full-width-at-half-maximum of all peaks
fixed at 1.28 eV. This functional form for the peaks gave the best fit when comparing all scans.
The Au 4f spin-orbit (4f7/2 and 4f5/2) energy splitting was fixed at 3.67eV, but the absolute
position was allowed to vary. The ratio of peak areas between the 4f7/2 and 4f 5/2 peaks are
expected to appear as 4:3 due to the (2j+1) multiplicity of each spin-orbit state [44,45]. This
ratio was either held constant, or allowed to vary, depending upon the fitting procedure used.
A comprehensive discussion of the fitting procedures employed is given in the Results and
Discussion section.
4.3 Results and Discussion
4.3.1 X-ray Photoelectron Spectra
XPS spectra of sodium tetrachloroaurate in the Au 4f region as a function of synchrotron

4. PHOTOREDUCTION KINETICS OF NaAuCl4 95
irradiation time are shown in Figure 4.1. Detailed fitting analysis (see below) indicates that for
each oxidation state of gold there are two peaks separated by 3.67 eV, corresponding to the 4f7/2
(lower binding energy) and 4f5/2 (higher binding energy) spin-orbit states. The XPS spectra in
Figure 4.1 are annotated to highlight three sets of doublets, each representing a different
oxidation state of gold. Using the known electron binding energies for the various oxidation
states of gold [18,19,44], we assign the peaks at 84.0, 85.1 and 87.2 eV as the 4f7/2 peak of Au0 ,
AuI , and AuIII, respectively, and the peaks at 87.6, 88.7 and 91.0 eV as the 4f5/2 peak of Au0 ,
AuI , and AuIII, respectively.
Figure 4.1. XPS spectra of sodium tetrachloroaurate as a function of time under synchrotron
X-ray exposure. The dotted lines represent the peak position of the 4f5/2 peaks of
each gold species.
82848688909294
Rela
tive Inte
nsity
Binding Energy (eV)
Time
Au 4f Au 4f 5/2
7/2
AuIII
AuI
Au0
AuIII
AuI
Au0

4. PHOTOREDUCTION KINETICS OF NaAuCl4 96
The spectra in Figure 4.1 show that the intensity of each gold oxidation state varies as the
sodium tetrachloroaurate sample undergoes continuous irradiation for 900 seconds. For
instance, the intensity of the 4f5/2 AuIII peak decreases quickly as a function of irradiation time,
with a concomitant rapid initial growth of the 4f5/2 AuI peak (as seen by comparing the first two
spectra). This photo-reduction process occurs faster than the timescale of recording each
spectrum (50 seconds). Prior to exposure, we assume that only AuIII is present in the sample.
This assumption is consistent with previous reports highlighting the instability of AuI in
aqueous solution [17,37,46-48]. However, the spectrum at the earliest irradiation times
(lowest panel in Figure 4.1) shows that during the data collection a significant amount of AuIII is
converted to AuI.
Upon further exposure, the 4f5/2 AuIII peak reduces further in intensity and the fully reduced
gold peak, 4f5/2 Au0, slowly grows in. Similar trends are apparent for the Au 4f7/2 XPS peaks.
Over the 900 sec. duration of the experiment, all the peak positions shift by up to 0.4 eV to
higher binding energy as shown by the dotted line of Figure 4.1 for the 4f5/2 peaks. We ascribe
this shift in binding energy to changes in the morphology and chemical environment of the gold
species as the sample undergoes irradiation. This, however, does not affect the identification
of the different oxidation species, which is the salient point of this study.
4.3.2 Reinterpretation of previous investigations
Our results clearly show that photo-reduction of AuIII in the tetrachloroaurate anion proceeds
via reduction to AuI followed by full reduction to metallic Au0. Previous investigations into
the photo-reduction of AuIII have only observed the disappearance of AuIII and the growth of
metallic gold [18,19,37]. We are able to observe an AuI intermediate due to the increased
resolution in our experiment. In the work of Karadas et al, the 4f7/2 peaks of Au0 and AuI are
not resolved, preventing direct observation of the AuI species [37]. Likewise, the 4f7/2 peak of

4. PHOTOREDUCTION KINETICS OF NaAuCl4 97
AuIII, and the 4f5/2 peaks of AuI and Au0 are manifest as a single peak in their spectra. Using
our results, we are in a position to understand better the behaviour of the previously reported
time-dependent XPS spectra.
Karadas et al observed that the 4f7/2 Au0 peak shifted by approximately 0.8 eV to lower
binding energy as the X-ray exposure continued [37], and attributed this to nucleation and
growth of metallic gold clusters. This reported peak shift is seemingly at odds with our
observations, where we detect a shift to higher binding energies. From our results, it is clear
that the shift observed by Karadas et al is actually due to the eventual conversion to Au0 of the
AuI intermediate, which forms rapidly from AuIII on initial exposure. The apparent peak
positions reported by Karadas are, in fact, determined by the relative populations of AuI and
Au0. As such, the peaks appear to shift to lower binding energy with increasing exposure as
the relative AuI and Au0 populations change. The splitting of the 4f7/2 Au0 and AuI peaks is
approximately 1.1 eV, so the 0.8 eV shift to lower binding energy observed by Karadas et al is,
in fact, an ~0.3 eV shift of each component to higher binding energy. This is similar to the ~0.4
eV shift we observe as shown by the dotted lines in Figure 4.1, however the exact cause for this
shift to higher energies remains unclear.
An equivalent argument also holds for what we now understand to be the combined 4f7/2 AuIII
and 4f5/2 AuI and Au0 peak observed by Karadas et al. [37]. These workers observe this peak to
first shift to higher binding energy and then return to lower binding energy as a function of
X-ray exposure. Based upon our observation of AuI, we interpret the shift observed by
Karadas et al. as follows: The initial peak position of the 4f7/2 AuIII component was reported to
appear at 85.3 eV. As time progresses the 4f5/2 AuI intermediate peak grows in intensity,
causing an apparent shift to higher binding energies. Upon further irradiation, AuI is reduced
to metallic gold and consequently the 4f5/2 Au0 component dominates, causing this peak to now
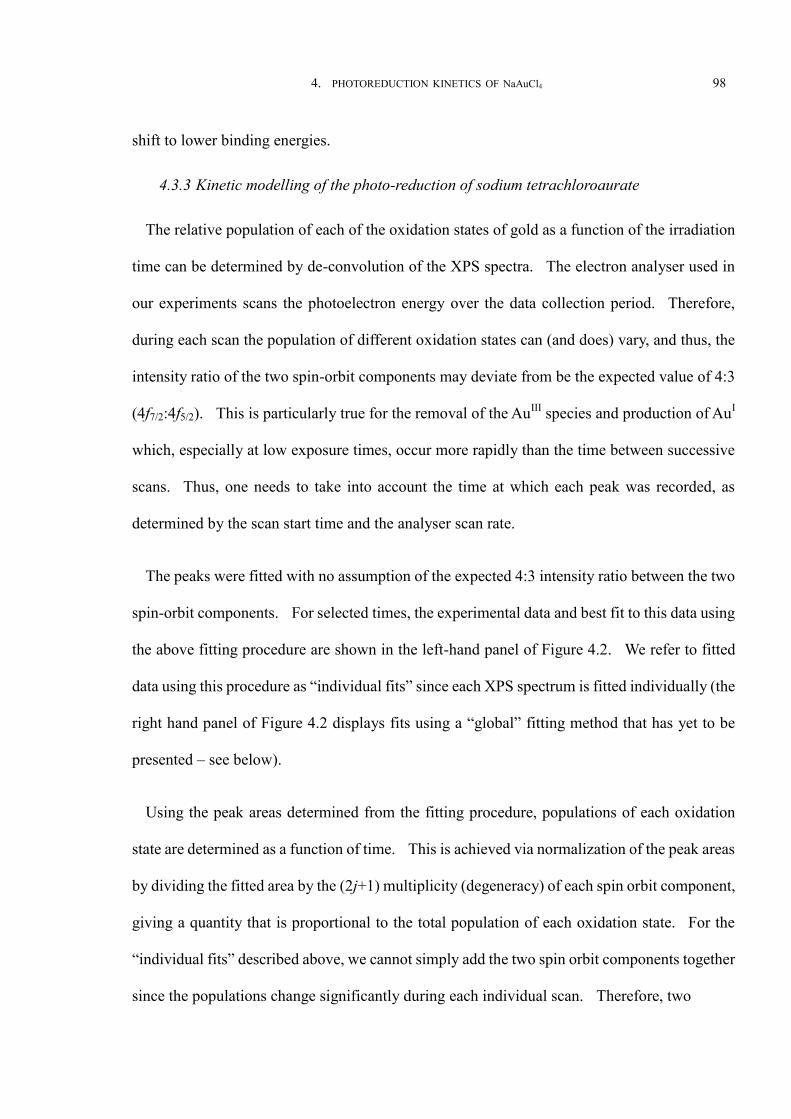
4. PHOTOREDUCTION KINETICS OF NaAuCl4 98
shift to lower binding energies.
4.3.3 Kinetic modelling of the photo-reduction of sodium tetrachloroaurate
The relative population of each of the oxidation states of gold as a function of the irradiation
time can be determined by de-convolution of the XPS spectra. The electron analyser used in
our experiments scans the photoelectron energy over the data collection period. Therefore,
during each scan the population of different oxidation states can (and does) vary, and thus, the
intensity ratio of the two spin-orbit components may deviate from be the expected value of 4:3
(4f7/2:4f5/2). This is particularly true for the removal of the AuIII species and production of AuI
which, especially at low exposure times, occur more rapidly than the time between successive
scans. Thus, one needs to take into account the time at which each peak was recorded, as
determined by the scan start time and the analyser scan rate.
The peaks were fitted with no assumption of the expected 4:3 intensity ratio between the two
spin-orbit components. For selected times, the experimental data and best fit to this data using
the above fitting procedure are shown in the left-hand panel of Figure 4.2. We refer to fitted
data using this procedure as “individual fits” since each XPS spectrum is fitted individually (the
right hand panel of Figure 4.2 displays fits using a “global” fitting method that has yet to be
presented – see below).
Using the peak areas determined from the fitting procedure, populations of each oxidation
state are determined as a function of time. This is achieved via normalization of the peak areas
by dividing the fitted area by the (2j+1) multiplicity (degeneracy) of each spin orbit component,
giving a quantity that is proportional to the total population of each oxidation state. For the
“individual fits” described above, we cannot simply add the two spin orbit components together
since the populations change significantly during each individual scan. Therefore, two

4. PHOTOREDUCTION KINETICS OF NaAuCl4 99
Figure 4.2. Fitted XPS spectra of sodium tetrachloroaurate at select times during synchrotron
X-ray irradiation. Superimposed on each experimental spectrum are fits using
our kinetic model, the “individual fits” on the left-hand panel and the “global fits”
on the right-hand panel (see text for details). The spectra are: (a) scan 1, (b)
scan 2, (c) scan 4, (d) scan 8 and (e) scan 15. The following colour scheme is
used to display the individual components of the fit: experimental data (orange);
Au0 (green); AuI (red); AuIII (blue); and total (black).
0.5
1
1.5
2
Inte
nsity (
CP
S)
(x 1
04)
(a1)Individual fits
0.5
1
1.5
2
Inte
nsity (
CP
S)
(x 1
04)
(b1)
0.5
1
1.5
2
Inte
nsity (
CP
S)
(x 1
04)
(c1)
0.5
1
1.5
2
Inte
nsity (
CP
S)
(x 1
04)
(d1)
0.5
1
1.5
2
82848688909294
Inte
nsity (
CP
S)
(x 1
04)
(e1)
Binding Energy (eV)
(a2)Global fit
(b2)
(c2)
(d2)
828486889092
(e2)
Binding Energy (eV)

4. PHOTOREDUCTION KINETICS OF NaAuCl4 100
since the populations change significantly during each individual scan. Therefore, two unique
data points exist for each XPS spectrum due to the two different spin-orbit states, with their
difference on the time axis resulting from the scan rate of the electron analyser.
Figure 4.3a shows the population of each species as a function of synchrotron exposure,
while Figure 4.3b presents an expansion of the low exposure time data of Figure 4.3a. Here,
the data points are determined from the fitted peak areas of 4f7/2 and 4f5/2 components of the
experimental data, while the solid lines represent fits to a kinetic model yet to be presented.
The error bars on the data represent three standard deviations as determined from the fitting
process. From these data, it is clear that the population of AuIII decreases dramatically within
the first 50 seconds and then decays further at a slower rate. In addition, the AuI population
increases rapidly at low exposure times and subsequently decays slowly at longer exposure
times. The Au0 population increases steadily as function of exposure time. We have used this
data to develop a model to describe the X-ray photo-reduction kinetics of sodium
tetrachloroaurate.
Further inspection of data points in Figure 4.3 suggests that the photo-reduction is proceeding
through a stepwise mechanism, where AuIII is first reduced to AuI and then AuI is reduced
further to Au0. To model this behaviour we have developed a kinetic model for conversion
between the different oxidation states. In this model we allow interconversion between AuIII
and AuI species, and between AuI and Au0 species. Each process has a distinct rate of
production and is considered reversible. Overall, the simple reaction scheme is described by

4. PHOTOREDUCTION KINETICS OF NaAuCl4 101
Figure 4.3. (a) Population of the different gold species as a function of synchrotron exposure
time. (b) The same data recorded within the first 400 seconds of exposure. The
data points represent the relative population of each oxidation state. The lines
represent best fits to the data using our model (see text for more details). The error
bars represent 3 standard deviations as determined by the least squares fitting
procedure.
0 200 400 600 800 10000
0.05
0.1
0.15
0.2
0.25
0.3
0.35
0.4
Time (second)
(a)
Au (0)
Au (I)
Au (III)
Rela
tive P
opula
tion
0 50 100 150 200 250 300 350 400
0
0.05
0.1
0.15
0.2
0.25
0.3
0.35
0.4
Time (second)
(b) zoom
Au (0)
Au (I)
Au (III)Rela
tive P
opula
tion

4. PHOTOREDUCTION KINETICS OF NaAuCl4 102
the series of equilibrium steps in Scheme 4:
Scheme 4. Model reaction scheme highlighting the reversible formation of various gold
oxidation states.
The kinetic model presented in Scheme 4 contains 4 unique channels. The resultant rate
expressions:
and
were integrated numerically to determine the relative populations of each oxidation state as a
function of time. A nonlinear least-squares fit of each species‟ population yields the rate
constants reported below. The resulting best fits are presented as lines in Figure 4.3.
The most important aspect of the data fitting algorithm is that to generate the curves in Figure
4.3, all four channels are required to fit the data. That is, all four channels (k1, k-1, k2, and k-2)
are required to account for the observed behaviour. We refer to the rate constants determined
via this fitting method as being derived from “individual fits” since each XPS spectrum is fitted
individually. The values of the rate constants determined via this fitting method are reported in
Table 4.1. The smaller rate constants determined for the conversion of AuI to Au0 result from
the experimental observation of the slower, steady production of Au0 as a function of exposure
time.
AuIII AuI Au0k1
k-1
k2
k-2

4. PHOTOREDUCTION KINETICS OF NaAuCl4 103
The solution involving the channels identified above is indeed unique. From the
experimental data it is obvious that both reverse reactions are necessary since the AuIII and AuI
population do not asymptote to zero. Attempts to only allow the forward reactions to occur
(i.e., k1 and k2 rate constants only) or allowing only one of the reverse reactions to occur with
both forward reactions, simply do not fit the experimental data (see Figure 4. 4-6) Information).
Figure 4.4. Population of the different gold species as a function of synchrotron exposure time.
The activated kinetic transformation channels are k1 and k2. AuI and AuIII
calculated data does not fit with the experimental data. The resultant rate
constants are k1 = 4.61 x 10⁻² s-1 and k2 = 1.43 x 10⁻³ s-1.
0 200 400 600 800 10000
0.05
0.1
0.15
0.2
0.25
0.3
0.35
0.4
Time (second)
Au (0)
Au (I)
Au (III)
Rela
tive P
opula
tion

4. PHOTOREDUCTION KINETICS OF NaAuCl4 104
Figure 4.5. Relative population of the different gold species as a function of synchrotron
exposure time. The activated kinetic transformation channels are k1, k-1 and k2.
The calculated fit to the AuIII experimental data is quite good, but not for Au0 at
intermediate time, nor the AuI species at long exposure times. The resultant rate
constants are k1 = 6.95 x 10⁻² s-1, k-1 = 2.32 x 10⁻² s-1 and k2 = 1.49 x 10⁻³ s-1.
Figure 4.6. Population of the different gold species as a function of synchrotron exposure time.
The activated kinetic transformation channels are k1, k2 and k-2. AuI and AuIII
calculated data does not fit with the experimental data. The resultant rate
constants are k1 = 4.28 x 10⁻² s-1, k2 = 1.99 x 10⁻³ s-1 and k-2 = 8.13 x 10⁻⁴ s-1.
0 200 400 600 800 10000
0.05
0.1
0.15
0.2
0.25
0.3
0.35
0.4
Time (second)
Au (0)
Au (I)
Au (III)
Rela
tive P
opula
tion
0 200 400 600 800 10000
0.05
0.1
0.15
0.2
0.25
0.3
0.35
0.4
Time (second)
Au (0)
Au (I)
Au (III)
Rela
tive P
opula
tion

4. PHOTOREDUCTION KINETICS OF NaAuCl4 105
The fit to the data in Figure 4.3 is very good at longer exposure times, but the agreement at
times less than 100 seconds (that is, the first two XPS scans) is less satisfactory. To explore the
reasons for this discrepancy we have also fitted the data using a global fitting procedure, such
that all spectra are fitted simultaneously whilst the rate constants are varied. The intensity
ratios between all of the peaks in each XPS spectrum were determined by the population of the
species at the time that the electron analyser was recording that particular peak, and now
assuming that the 4:3 intensity ratio between the 4f7/2 and 4f5/2 peaks holds. All the XPS
spectra were then fitted simultaneously to determine the optimum rate constants. The values
of the fitted rate constants for each Aun (n = 0, I or III) species fitted in this global manner are
reported in Tabel 4.1 alongside those determined by individual fitting of spectra. It can be seen
that the resultant rate constants are very similar from each analysis method.
Table 4.1: Rate Constants for the Photo-reduction of Sodium Tetrachloroaurate. See Text For
Kinetic Model Details.
Fitting Procedure
Individual fit Global fit
k1 (s-1) (6.8 ± 0.3) 10-2 (6.6 ± 0.05) 10-2
k-1(s-1) (2.27 ± 0.14) 10-2 (2.57 ± 0.03) 10-2
k2 (s-1) (1.91 ± 0.06) 10-3 (1.88 ± 0.02) 10-3
k-2 (s-1) (6.2 ± 0.7) 10-4 (5.2 ± 0.3) 10-4
The spectra generated via the global fit are shown in the right hand panel of Figure 4.2.
From inspection of Figure 4.2, it is seen that the spectra fit well at later time, however at early
times there is an intensity discrepancy for the AuI 4f5/2 and AuIII 4f7/2 peaks. Even after taking
into account the different times at which each of the spin-orbit peaks are recorded, the intensity
ratios between each pair of spin-orbit peaks slightly deviate from the expected 4:3 ratio.
Neither fitting the spectra individually, nor employing the global fitting process, results in a

4. PHOTOREDUCTION KINETICS OF NaAuCl4 106
particularly good fit at the shortest exposure times. Recording XPS photo-reduction data at
faster electron analyser scanning rates (not currently possible at the AS) is required to explore
this issue in greater detail.
Over the complete timescale of the experiment we demonstrate that the relative yields of AuIII,
AuI and Au0 vary in a manner explained by predictions that arise from the kinetic model we
propose – whereby photoreduction proceeds via the AuI intermediate. Consistent with this
observation, very recently Marcum et al. have reported on the gas-phase photochemistry of
AuIII and note that the photoreduction process proceeds via, “…either AuII or AuI depending on
the number of neutral ligands lost.” [49] Critically, we are unable to explain the experimental
observations by any kinetic model that involves the direct photo-reduction of AuIII to Au0.
4.4 Conclusions
In this chapter, we have reported on the chemical changes and the associated kinetics of
sodium tetrachloroaurate (NaAuCl4) exposed to synchrotron soft X-radiation. Our
investigation provides a new insight into the photo-reduction process by recording
high-resolution XPS spectra of the gold 4f region as a function of time. Importantly, our
studies highlight the XPS photoreduction to occur via AuI state. We have developed a kinetic
model that involves a stepwise reduction between AuIII, AuI and Au0 using two different
analysing methods; individual fitting and global fitting of the individual gold 4f peaks. Our
kinetic analysis accounts for the population of each Au chemical state as a function of irritation
time.

4. PHOTOREDUCTION KINETICS OF NaAuCl4 107
4. 5 References
(1) Daniel, M. C.; Astruc, D. Chemical Reviews 2004, 104, 293-346.
(2) Hutter, E.; Fendler, J. H. Advanced Materials 2004, 16, 1685-1706.
(3) Henglein, A. Journal of Physical Chemistry 1993, 97, 5457-5471.
(4) Armendariz, V.; Herrera, I.; Peralta-Videa, J. R.; Jose-Yacaman, M.; Troiani, H.; Santiago, P.; Gardea-Torresdey, J. L. Journal of Nanoparticle Research 2004, 6, 377-382.
(5) Curulli, A.; Valentini, F.; Padeletti, G.; Cusma, A.; Ingo, G. M.; Kaciulis, S.; Caschera, D.; Palleschi, G. Sensors and Actuators B-Chemical 2005, 111, 526-531.
(6) Gao, X. Y.; Matsui, H. Advanced Materials 2005, 17, 2037-2050.
(7) Li, C. Z.; Male, K. B.; Hrapovic, S.; Luong, J. H. T. Chemical Communications 2005, 3924-3926.
(8) Schmid, G.; Simon, U. Chemical Communications 2005, 697-710.
(9) Schmid, G.; Corain, B. European Journal of Inorganic Chemistry 2003, 3081-3098.
(10) Alvarez-Puebla, R.; Liz-Marzan, L. M.; Javier Garcia de Abajo, F. Journal of Physical Chemistry Letters 2010, 1, 2428-2434.
(11) Levi, R.; Bar-Sadan, M.; Albu-Yaron, A.; R., P.-B.; Houben, L.; Shahar, C.; Enyashin, A.; Seifert, G.; Prior, Y.; Tenne, R. Journal of the American Chemical Society 2010, 132, 11214-11222.
(12) Liu, J.; He, W. W.; Hu, L. J.; Liu, Z.; Zhou, H. Q.; Wu, X. C.; Sun, L. F. Journal of Applied Physics 2010, 107, 094311.
(13) Minati, L.; Torrengo, S.; Speranza, G. Surface Science 2010, 604, 508-512.
(14) Rodriguez, J. A.; Stacchiola, D. Physical Chemistry Chemical Physics 2010, 12, 9557-9565.
(15) Santori, C.; Barclay, P. E.; Fu, K.-M. C.; Beausoleil, R. G.; Spillane, S.; Fisch, M. Nanotechnology 2010, 21, 274008.
(16) Cohen, L. R.; Pena, L. A.; Seidl, A. J.; Olsen, J. M.; Wekselbaum, J.; Hoggard, P. E. Monatshefte Fur Chemie 2009, 140, 1159-1165.
(17) Holt, K. B.; Sabin, G.; Compton, R. G.; Foord, J. S.; Marken, F. Electroanalysis 2002, 14, 797-803.
(18) Ozkaraoglu, E.; Tunc, I.; Suzer, S. Surface & Coatings Technology 2007, 201, 8202-8204.

4. PHOTOREDUCTION KINETICS OF NaAuCl4 108
(19) Ozkaraoglu, E.; Tunc, I.; Suzer, S. Polymer 2009, 50, 462-466.
(20) Tsuda, T.; Seino, S.; Kuwabata, S. Chemical Communications 2009, 44, 6792-6794.
(21) Turner, M.; Golovko, V. B.; Vaughan, O. P. H.; Abdulkin, P.; Berenguer-Murcia, A.; Tikhov, M. S.; Johnson, B. F. G.; Lambert, R. M. Nature 2008, 454, 981 - 983.
(22) Lim, T. W.; Park, S. H.; Yang, D. Y.; Kong, H. J.; Lee, K. S. Applied Physics a-Materials Science & Processing 2006, 84, 379-383.
(23) Amendola, V.; Meneghetti, M. Physcial Chemistry Chemical Physics 2009, 11, 3805-3821.
(24) Fong, Y. Y.; Gascooke, J. R.; Visser, B. V.; Metha, G. F.; Buntine, M. A. Journal of Physical Chemistry C 2010, 114, 15931-15940.
(25) Hartland, G. V. Journal of Chemical Physics 2002, 116, 8048-8055.
(26) Inasawa, S.; Sugiyama, M.; Noda, S.; Yamaguchi, Y. J. Phys. Chem. B 2006, 110, 3114-3119.
(27) Link, S.; Hathcock, D. J.; Nikoobakht, B.; El-Sayed, M. A. Advanced Materials 2003, 15, 393.
(28) Mafune, F. Chemical Physics Letters 2004, 397, 133-137.
(29) Copperthwaite, R. G. Surface and Interface Analysis 1980, 2, 17-25.
(30) Storp, S. Spectrochimica Acta 1985, 40B, 745-756.
(31) Fleisch, T. H.; Zajac, G. W.; J.O., S. Applied Surface Science 1986, 26, 488-497.
(32) Garbassi, F.; Pozzi, L. Journal of Electron Spectroscopy and Related Phenomena 1979, 16, 199-203.
(33) Sasaki, T.; Williams, R. S.; Wong, J. S.; Shirley, D. A. Journal of Chemical Physics 1978, 68, 2718-1714.
(34) Wallbank, B.; Johnson, C. E.; Main, I. G. Journal of Electron Spectroscopy and Related Phenomena 1974, 4, 263-269.
(35) Imamura, K.; Asai, M.; Tazuke, S.; Okamura, S. Die Makromolekulare Chemie 1973, 174, 91-101.
(36) Sen, P. K.; Gani, N.; Midya, J. K.; Pal, B. Transition Metal Chemistry 2008, 33, 229-236.
(37) Karadas, F.; Ertas, G.; Ozkaraoglu, E.; Suzer, S. Langmuir 2005, 21, 437-442.
(38) Cowie, B. C. C.; Tadich, A.; Thomsen, L. AIP Conference Proceedings 2010, 1234, 307 - 310.

4. PHOTOREDUCTION KINETICS OF NaAuCl4 109
(39) Beattie, D. A.; Kempson, I. M.; Fan, L. J.; Skinner, W. M. International Journal of Mineral Processing 2009, 92, 162-168.
(40) Hu, B. B.; Yu, L. F.; Wang, G. J.; Hutton, S.; Huang, H. Z.; Du, Z. L. Measurement 2010, 43, 1299-1304.
(41) Shirley, D. A. Physical Review B 1972, 5, 4709-4714.
(42) Vegh, J. Journal of Electron Spectroscopy and Related Phenomena 2006, 151, 159-164.
(43) Hughes, H. P.; Scarfe, J. A. Journal of Physics-Condensed Matter 1996, 8, 1421-1438.
(44) Moulder, J. F.; Stickle, W. F.; Sobol, P. E. Handbook of X-Ray Photoelectron Spectroscopy; Perkin-Elmer Corporation: Minnesota, 1993.
(45) Stöhr, J.; Siegmann, H. C. Magnetism From Fundamentals to Nanoscale Dynamics; Springer: New York, 2006.
(46) Greenwood, N. N.; Earnshaw, A. Chemistry of the Elements, 1st ed.; Permagon Press, 1993.
(47) Murphy, P. J.; Stevens, G.; LaGrange, M. S. Geochimica et Cosmochimica Acta 2000, 64, 479-494.
(48) Gmelin Handbook Au Suppl. Vol. B 1; 8th ed.; Hönes, G.; Huisl, W.; Keim, R.; Schwager, B., Eds.; Springer-Verlag: Berlin, 1992.
(49) Marcum, J. C.; Kaufman, S. H.; Weber, J. M. Journal of Physical Chemistry A 2011, 115, 3006-3015.

CHAPTER 5
Influence of Cationic Surfactants on the Formation,
Stability and Surface Chemistry of Gold Nanoparticles
produced via the LASiS method
5.1 Introduction
Gold (Au) is a prototypical transition metal used to study the changing properties of clusters
as their size increases from several atoms up to the bulk. In particular, in small gold
nanoparticles it has been found that differing numbers of gold atoms result in specific physical
and chemical properties [1-4]. Physical properties that change with the particle size include
the peak wavelength and intensity of the surface plasmon resonance in metallic nanoparticles
[5,6] and quantum confinement [7,8], whilst changes to chemical properties such as chemical
oxidations [9,10] and bonding interactions with different organic molecules [11,12] have been
observed. It is anticipated that these unique properties may result in the potential use of gold
nanoparticles (AuNPs) in applications such as catalysts [1,2] and biochemical sensors [3,4].
An understanding of the surface chemistry and catalytic properties of the gold nanoparticle is of
importance since many of these applications require functionalisation of the nanoparticle
surface. Furthermore, the nature of the gold nanoparticles surface is important when studying
catalytic properties.
Gold nanoparticles (AuNP) can be generated in various sizes and shapes via chemical
reduction from gold salts [13,14], size-selected deposition in ultra high vacuum [12,15] or laser

5. KINETICS OF PRODUCED AuNP in CATIONIC SURFACTANTS 111
ablation of a metallic gold disc [16-22]. Following production, AuNPs are often investigated
using various characterisation techniques, such as UV-Vis-NIR spectroscopy [5,6],
transmission electron microscopy (TEM) [16], x-ray photoemission spectroscopy (XPS) [2],
and zeta potential measurements [23] to provide valuable insight into the interaction between
surfactant/ligand and nanoparticle.
Chemical synthesis methods are the most common technique to generate various sizes and
shapes of gold nanoparticles. These methods involve the chemical reduction of a suitable
starting material, such as HAuCl4 or NaAuCl4, in aqueous solution along with organic
molecules that act as a stabilizer [13,14,24]. During the production process, different shapes of
gold nanoparticles, such as nanorods [25], nano-triangles [26], and nano-spheres [13,14,27],
have been generated and their properties analysed using various spectroscopic techniques. One
of the most common stabilisers used for synthesising spherical AuNP are compounds
containing a thiol ligand [28]. These molecules bind to the AuNP via strong sulphur-gold
interactions. Johnson and co-workers [24] have synthesised spherical AuNPs with an average
diameter of 6 nm and less, where the size is dependent on the functional groups present in the
thiol ligand stabiliser. These workers have specifically reported on the effects that different
functional groups have on the AuNPs, and found that changing functional groups in the thiol
ligand leads to differing oxidation states of gold in the AuNPs.
Although chemical synthesis can readily produce nanoparticles, Laser Ablation Synthesis in
Solution (LASiS) is an alternative technique for forming nanoparticles in solution. The
technique involves via laser irradiation of a metal target in a liquid. Importantly, unlike
chemical synthesis methods, nanoparticles can be produced with or without the presence of
stabilisers. Furthermore, considerable effort has been directed toward understanding the
mechanism of aggregation and size reduction of AuNPs in various ligands, solvents and
surfactants [5,11,29-32]. We have used the LASiS method to generate gold nanoparticles in the

5. KINETICS OF PRODUCED AuNP in CATIONIC SURFACTANTS 112
anionic surfactant sodium dodecylsulfate (SDS) and, earlier in this thesis, presented a
comprehensive analysis on the kinetics of nanoparticle production. We reported that the AuNPs
produced at each concentration of SDS can be modelled by assuming three AuNP size regimes;
small (< 5nm), medium (5 – 17nm) and large (> 17 nm).
Sylvestre and co-workers [33] have reported that the laser-produced AuNPs in water (average
diameter 40nm) via LASiS have a surface comprising Au3+ and Au+. Using time-of-flight
secondary ion mass spectrometery, they determined that surface oxidation resulted from
reactions with water molecules to form Au-O¯and Au2O3¯ structures on the AuNP surface. In
the current chapter, we extend our previous work to investigate the production of gold
nanoparticles in the presence of the cationic surfactants cetyltrimethylammonium bromide
(CTAB) and cetyltrimethylammonium chloride (CTAC), via the LASiS method. We report the
size distribution and formation kinetics of the production process, as well as determining Au
oxidation state via X-ray photoelectron spectroscopy on the surface chemistry of AuNPs that
were produced with and without surfactant in solution.
5.2 Experimental Method
Gold nanoparticles (AuNP) were produced by laser ablation method in a similar manner
described in Chapter 2.1 [16,34]. A thin gold disc (>99.99%) with Teflon holder was placed at
the bottom of a glass vessel containing 10ml of either 10-5M, or 10-3M aqueous solutions of
CTAB or CTAC. The critical micelle concentrations (CMC) of CTAB and CTAC are 0.94 and
1.1 mM, respectively. Two concentrations were used to correspond to being below and
approximately equal to the aqueous CMC [35]. Based on our previous work we do not expect a
dramatic change in nanoparticle size at the CMC [19,34,36]. All water samples were purified
with a Waters Milli-Q system. All the samples were examined with UV-Vis spectrometer (Cary,
Bio 300) described in section 2.2.2 of Chapter 2 and TEM with Philips CM 100 electron
microscope described in section 2.3.1.1 of Chapter 2.

5. KINETICS OF PRODUCED AuNP in CATIONIC SURFACTANTS 113
The procedure of prepared samples for X-ray photoelectron microscopy examination was
undertaken and described in section 2.4.4 of Chapter 2. During this irradiation, 15 sequential
XPS spectra were recorded by scanning the electron analyser from 95 to 70 eV in 0.05 eV
increments. These scans took 50 seconds to complete followed by ~16 second delay before the
next scan started.
Survey scan and high-resolution scans were obtained for Au 4f photoelectron regions for all
samples. The instrument was calibrated using the 84.0 eV Au 4f7/2 peak position of gold foil. All
high-resolution spectra were fitted using a least-squares method in a spreadsheet program
(Microsoft Excel). A Shirley background was applied to remove the electron scattering
background and retain the intrinsic lineshape from the raw data. A pseudo-Voigt function
comprising the sum of Gaussian (0.3) and Lorentzian (0.7) functions was used with a full width
at half maximum of all peaks fixed at 1.28eV. This functional form for the peaks gave the best
fit when comparing all scans. The Au 4f spin-orbit (4f7/2, 4f5/2) energy splitting was fixed at
3.67eV but the absolute position was allowed to vary during the fitting process.
5.3 Result and Discussion
5.3.1 Production of AuNP
Absorption spectra of AuNPs produced by 1064 nm irradiation of a gold disc and taken at 20
minute intervals for each of the 10-5 M, 10-3 M CTAB and 10-5 M, 10-3 M CTAC solutions are
presented in Figure 5.1. Each spectrum shows very similar behaviour - a steady increase in
intensity of the distinctive surface plasmon band (SPB) of AuNP at approximately 525 nm.
The position of the wavelength maximum of the SPB (max) is a property of average particle
size [37]. Figure 5.1 shows that max does not appreciably change over the 220 min
experimental time scale, indicating that the average size doesn’t change significantly during
this time.

5. KINETICS OF PRODUCED AuNP in CATIONIC SURFACTANTS 114
Figure 5.1. UV-visible absorption spectra of AuNP samples produced via 1064 nm laser irradiation in aqueous solution with (a) 10-5M CTAB, (b) 10-3M CTAB, (c) 10-5M CTAC, and (d) 10-3M CTAC present in solution. For each surfactant solution concentration, spectra are displayed at 20 min intervals up to a maximum irradiation time of 220 min.
0.0
0.5
1.0
1.5
2.0
2.5
240 320 400 480 560 640 720 800 880
Abso
rba
nce
Wavelength /nm
220 mins
20 mins
(a) 10-5
M CTAB
0.0
0.5
1.0
1.5
2.0
2.5
3.0
240 320 400 480 560 640 720 800 880
Abso
rba
nce
Wavelength /nm
220 mins
20 mins
(b) 10-3
M CTAB
0.0
0.5
1.0
1.5
2.0
2.5
240 320 400 480 560 640 720 800 880
Absorb
ance
Wavelength /nm
220 mins
20 mins
(c) 10-5
M CTAC
0.0
0.5
1.0
1.5
2.0
2.5
240 320 400 480 560 640 720 800 880
Absorb
ance
Wavelength /nm
220 mins
20 mins
(d) 10-3
M CTAC

5. KINETICS OF PRODUCED AuNP in CATIONIC SURFACTANTS 115
Normalised absorption spectra are presented in Figure 5.2, where each spectrum has been
normalised to have equal intensity at the wavelength corresponding to the surface plasmon
band maximum. At the CTAB concentrations of 10-3 M and CTAC concentrations 10-5 M, and
10-3 M, max shifts to the blue by no more than 3 nm over the first 100 min of the laser irradiation,
after which time it remains steady. Again, this indicates the average particle size does not
change significantly over the duration of the experiment. However, the 10-5 M CTAB solution is
observed to have a larger blue shift of approximately 12 nm over the first 20 minutes. Moreover,
there are also weak absorption features at longer wavelengths (~700 nm) present in the first 20
minutes which we attribute to much larger particles. This is based upon previous studies where
the wavelength maximum of the SPB shifts to longer wavelengths for larger particle sizes
[37-39]. After 20 minutes, the ~700 nm feature reduces in intensity relative to the ~515 nm SPB
peak. The observed max values are slightly dependent upon which surfactants are present. After
100 mins, both CTAC concentrations show max = 523 nm, whilst the CTAB solutions exhibit a
max = 526 nm. These are very similar values to those previously reported for pure water (max
=524nm) and using SDS as surfactant (max = 524 nm for 10-4M; max = 521 nm for 10-2M) [16].
The results for differing surfactants and concentrations cannot be used to provide information
on the particle sizes since max varies with changes in dielectric strength that accompany
changes in the surfactant’s identity and concentration [5]. All the spectra clearly show the width
of the surface plasmon band reduce gradually over time, consistent with a reduction in the
particle size [40].
An understanding on the AuNP formation chemistry is achieved by fitting the
time-dependent absorbance data to an appropriate kinetic model using the intensity of the SPB.
We have previously reported a model that explains the production of AuNPs via the LASiS
approach [16,34]. This model is used to fit the experimental data presented in Figure 5.3, and
the quality of the fits is evident by inspection. The basis for the kinetic model is presented in

5. KINETICS OF PRODUCED AuNP in CATIONIC SURFACTANTS 116
Figure 5.2. Normalised UV-visible absorption spectra of AuNP samples produced via 1064 nm
laser irradiation in aqueous solution with (a) 10-5M CTAB, (b) 10-3M CTAB, (c) 10-5M
CTAC, and (d) 10-3M CTAC present in solution. For each surfactant solution
concentration, spectra are displayed at 2 min intervals for the first 10 min and then 20
min intervals up to a maximum irradiation time of 220 min.
0.0
0.5
1.0
1.5
400 500 600 700 800
Norm
alis
ed A
bsorb
ance
Wavelength /nm
220 mins 2 mins
(a) 10-5
M CTAB
2 mins
220 mins
0.0
0.5
1.0
1.5
400 500 600 700 800
Norm
alis
ed A
bsorb
ance
Wavelength /nm
220 mins 2 mins
(b) 10-3
M CTAB
2 mins
220 mins
0.0
0.5
1.0
1.5
400 500 600 700 800
Norm
alis
ed A
bsorb
ance
Wavelength /nm
220 mins 2 mins
(c) 10-5
M CTAC
2 mins
220 mins
0.0
0.5
1.0
1.5
400 500 600 700 800
Norm
alis
ed A
bsorb
ance
Wavelength /nm
220 mins 2 mins
(d) 10-3
M CTAC
2 mins
220 mins

5. KINETICS OF PRODUCED AuNP in CATIONIC SURFACTANTS 117
Chapter 3 Scheme 2. In brief, the model considers (i) AuNPs of a size too small to support a
surface plasmon resonance transition (denoted AuNP(small)) – it is well established that the
minimum size to support a SPB transition in AuNPs is approximately 4 nm [41], (ii)
“medium-sized” AuNPs having a weak, but measurable SPB molar absorbances (denoted
AuNP(med)), and (iii) “large” AuNPs with greater SPB molar absorbances (denoted AuNP(large)).
Interconversion between each type of AuNP is allowed, in principle. The rationale for
employing a three-size AuNP kinetic model is provided in our previous chapter (Chapter 3),
[16,34] and is based on both experimental [37,42,43] and theoretical [40,41,43] observations
that the AuNP absorption coefficient increases with particle size.
The kinetic model presented in Chapter 3, Scheme 2, contains up to twelve unique AuNP
transformation channels. Numerical integration of the resultant rate expressions [16], combined
with non-linear least squares fits to the absorbance data yields the lines of best fit presented in
Figure 5.3. The most important aspect to arise from the data fitting process is that only those
transformation channels listed in Table 5.1 (of the twelve possible) are required to fit the data.
Extensive exploration of the kinetic model has determined that these transformation channels
are the minimum number required accounting for the observed behaviour, and for each
surfactant concentration represent a unique solution with this minimum set of parameters. The
rate constants are determined in this study and are derived from the fits in Figure 5.3.
Representative TEM images, together with histograms indicating their associated particle
size distributions, of AuNP samples prepared in 10-5 M, and 10-3 M CTAB and 10-5 M, and
10-3M CTAC after 300 minutes of 1064 nm laser irradiation are presented in Figure 5.4. To
improve the statistics of the particle size distribution determinations, each histogram was
generated by analysing multiple images, rather than just the image presented above it. Each
TEM image shows that the AuNP adopt a roughly spherical geometry with a range of particle
sizes. In the case of 10-5M CTAB (Figure 5.4a), the particle size distribution peaks at 13nm with

5. KINETICS OF PRODUCED AuNP in CATIONIC SURFACTANTS 118
Figure 5.3. Variation in absorbance of the AuNPs in aqueous solution with no surfactant present with (a) 10-5M CTAB and (b) 10-3M CTAB present in solution as a function of 10 Hz 1064 nm laser irradiation at the SPB max . In both panels the same data is presented in the case where no surfactant is present. See text for discussion of the phenomena involved.
0
0.5
1
1.5
2
0 5 x 10⁴
1 x 10⁵
1.5 x 10⁵
2 x 10⁵
0 5 x 10³
1 x 10⁴
1.5 x 10⁴
2 x 10⁴
Abso
rba
nce
Number of laser pulses
pure water
10-5
M CTAB
10-3
M CTAB
a) SPB
Time (second)
0
0.5
1
1.5
2
0 5 x 10⁴
1 x 10⁵
1.5 x 10⁵
2 x 10⁵
0 5 x 10³
1 x 10⁴
1.5 x 10⁴
2 x 10⁴
Abso
rba
nce
Number of laser pulses
pure water
10-5
M CTAC
10-3
M CTACb)
SPB
Time (second)

Table 5.1. Resultant 1064 nm Kinetic Parameters Determined Following a Nonlinear Least Squares Fit of the Absorbance Data to the Kinetic Model Given in Scheme 2; all reported uncertainties represent three standard deviations error (3) CTAB: Cetyltrimethylammonium bromide, CTAC: Cetyltrimethylammonium chloride; kl, km, ks, k-m: rate constants for interconversion between the different gold nanoparticle species as defined in Scheme 2. See text for details.
0 M (aqueous) 10-5
M CTAB 10-3
M CTAB 10-5
M CTAC 10-3
M CTAC
kl (pulse-1
) (1.031 ± 0.005)×10-5
(2.97±0.05)×10-6
(7.82 ± 0.07)×10-6
(4.47 ± 0.10)×10-6
(8.27 ± 0.057)×10-6
km (pulse-1
) (1.39 ± 0.09)×10-5
(1.61 ± 0.25)×10-5
(1.40 ± 0.25)×10-5
(1.17 ± 0.13)×10-5
(1.20 ± 0.12)×10-5
ks (pulse-1
) - (1.52 ± 0.76)×10-7
(3.51 ± 1.09)×10-8
(1.04 ± 1.81)×10-7
(4.47 ± 0.62)×10-7
k-m (pulse-1
) (1.03 ± 0.09)×10-4
(2.30 ± 0.43)×10-4
(1.52 ± 0.33)×10-4
(7.5 ± 1.20)×10-5
(8.8 ± 1.20)×10-5

5. KINETICS OF PRODUCED AuNP in CATIONIC SURFACTANTS 120
a broadening of the distribution to a maximum of ~50 nm. The average particle size is 15.5nm
with a standard deviation, SD, (1) of 10 nm. For the case of 10-3M CTAB (Figure 5.5b), the
particle size distribution peaks at approximately 10 nm with a relatively broad distribution of
sizes out to a maximum of approximately 45 nm. Closer analysis of the particle size distribution
reveals an average particle size of 11 nm with a SD (1) of 5.1nm. The sample containing
10-5M CTAC (Figure 5.4c) again shows a similar peak in particle size distribution of 10-5 M
CTAB. The average particle size is 14 nm with a SD (1) of 8.5nm. Finally, the sample
containing 10-3M CTAC (Figure 5.4d) again shows a similar peak in particle size distribution.
Here, the average particle size is 12.9nm with a SD (1) of 7.2 nm.
These results show that there is no significant difference between the particle size
distributions of AuNPs produced in CTAB and CTAC surfactants. Furthermore, the size
distribution is very similar to that obtained using pure water (Figure 3.2 in Chapter 3). This is in
contrast to AuNPs produced in SDS solutions, where we have previously found that high SDS
concentrations result in the most number of particle in particle diameter (4.0 nm) compared to
that obtained in pure water (15 nm). It should also be noted that the 10-3M CTAC solution has a
concentration above the CMC yet a similar particle size distribution to the lower concentration
solution. That is, for the CTAC solution, the CMC does not appear to have an effect on the size
distribution. This is consistent with our previous work using SDS as a surfactant where no
dramatic change in diameter was observed at the CMC of SDS (Part B of Chapter 3).
5.3.2 X-ray Photoelectron spectroscopy (XPS)
Additional experiments were undertaken to explore the surface oxidation of AuNPs formed
following 1064 nm laser irradiation at each CTAB and CTAC concentration by using
Synchrotron X-ray Photoelectron Spectroscopy (XPS). For each sample, fifteen sequential,
high resolution XPS spectra were recorded, of which the first spectrum for each sample is
presented in Figure 5.5. Also displayed in this figure is the XPS spectrum recorded for AuNPs

Figure 5.4. Representative TEM images, together with histograms indicating their associated particle size distributions, of AuNP samples prepared at each surfactant concentration after 300 min of 1064 nm laser irradiation. The horizontal bar in the lower right-hand corner of each image represents 200 nm.
0
10
20
30
40
50
60
70
80
0 5 10 15 20 25 30 35 40 45 50
Num
ber
of P
art
icle
s
Particle Diameter (nm)
(a) 10-5
M CTAB
Davg
= 15.5 nm
= 10 nm
0
20
40
60
80
100
120
0 5 10 15 20 25 30 35 40 45 50
Nu
mb
er
of P
art
icle
s
Particle Diameter (nm)
(b) 10-3
M CTAB
Davg
= 11.0 nm
= 5.1 nm
0
10
20
30
40
50
60
70
0 5 10 15 20 25 30 35 40 45 50
Nu
mb
er
of
Part
icle
s
Particle Diameter (nm)
(c) 10-5
M CTAC
Davg
= 14.0 nm
= 8.5 nm
0
20
40
60
80
100
0 5 10 15 20 25 30 35 40 45 50
Nu
mb
er
of
Part
icle
s
Particle Diameter (nm)
(d) 10-3
M CTAC
Davg
= 12.9 nm
= 7.2 nm

5. KINETICS OF PRODUCED AuNP in CATIONIC SURFACTANTS 122
produced in pure water (acting as a control), and in 10-2 M SDS solution (allowing comparison
with an anionic surfactant). Each spectrum shows the photoelectron peaks in Au 4f region. XPS
spectra for the AuNPs produced in pure water and 10-2 M SDS samples (Figure 5.5a-b) consist
of a single pair of peaks at 84.0eV and 87.7eV. These are assigned to Au0 chemical gold species
for the 4f7/2 peak and 4f5/2 peak, respectively. The ratio of the peak areas is the expected 4:3 ratio
based on the spin multiplicity of each spin orbit state [44,45]. For the case of AuNPs produced
in CTAB, the 10-5 M spectrum (Figure 5.5c) shows a similar spectrum to that of pure water and
SDS, whereas 10-3 M CTAB (Figure 5.5d) shows an extra set of peaks at 86.6eV and 90.3eV.
These are assigned to the AuIII 4f7/2 and 4f5/2 chemical species, respectively. When CTAC is
used as the surfactant during AuNP formation, the XPS spectrum of 10-5 M CTAC (Figure 5.5e)
shows predominately peaks for Au0 species and a minor contribution of AuIII species. Likewise,
the 10-3 M sample (Figure 5.5f) displays both Au0 and AuIII species, however there is now a
larger fraction of AuIII.species present.
Figure 5.6 shows the high resolution XPS spectra of the same AuNP samples but after
exposure of synchrotron X-rays for 16.5 minutes (that is the 15th scan of the sample). There are
minimal differences between the first scan and 15th scan for all concentrations except for the
10-3 M CTAC sample. The sample containing gold nanoparticles produced in a 10-3M CTAC
solution (Figure 5.6f) shows that over time there is a production of the AuI oxidation state
(observed at 85.7eV for the 4f7/2 peak and 89.4eV for the 4f5/2 peak) and a lowering of the AuIII
species. We have previously shown that a sample of sodium tetrachloroaurate undergoing
synchrotron exposure results in AuIII species undergoing reduction to firstly form the AuI
species, followed by further reduction to the Au0 species [46]. The XPS spectrum of 10-3M
CTAC indicates that this reduction process is also occurring with exposure to synchrotron
X-ray radiation resulting in approximately 20% of AuIII species being converted into other
species. Furthermore, the sample produced in 10-3M CTAB solution shows a reduction of the

Figure 5.5. Fitted synchrotron XPS spectra for the first scan of gold nanoparticles generated in aqueous solution with (a) pure water, (b) 10-2M SDS, (c) 10-5M
CTAB, (d) 10-3M CTAB, (e) 10-5M CTAC, and (f) 10-3M CTAC present in solution.
0
0.4
0.8
1.2
1.6
2
2.4
2.8
3.2
Inte
nsity (
CP
S)
(x 1
05)
(a) pure water
0.8
1.6
2.4
3.2
4
4.8
Inte
nsity (
CP
S)
(x 1
04)
(c) 10-5
M CTAB
0
0.4
0.8
1.2
1.6
82848688909294
Inte
nsity (
CP
S)
(x 1
05)
(b) 10-2
M SDS
Binding Energy (eV)
0.2
0.4
0.6
0.8
1
1.2
1.4
1.6
Inte
nsity (
CP
S)
(x 1
05)
(e) 10-5
M CTAC
0.2
0.4
0.6
0.8
1
1.2
1.4
82848688909294
Inte
nsity (
CP
S)
(x 1
04)
(d) 10-3
M CTAB
Binding Energy (eV)
0.5
1
1.5
2
2.5
3
3.5
4
4.5
82848688909294
Inte
nsity (
CP
S)
(x 1
04)
(f) 10-3
M CTAC
Binding Energy (eV)

5. KINETICS OF PRODUCED AuNP in CATIONIC SURFACTANTS 124
amount of AuIII during X-ray exposure, although it is interesting that there is no detectable
amount of AuI formed in the sample. The lack of observation for the AuI species in this sample
may be due to either mechanistic or kinetic factors. For example, the reduction process may
not proceed through an AuI intermediate state, (that is AuIII species reduces directly to Au0), or
alternatively the rate constant for the AuI → Au0 reduction process is much faster for
nanoparticles produced in CTAB when compared to those prepared in CTAC.
The appearance of AuIII in the initial XPS scans is observed for gold nanoparticles produced
in 10-3M CTAB, and both 10-5 M and 10-3 M CTAC solutions, but not for those produced in pure
water or SDS solution. Interestingly, Sylvestre and co-workers [9] have reported a similar
experiment on producing AuNPs in pure water using 800-nm LASiS with a Ti/sapphire laser
(120 fs pulse width). These workers showed the presence of AuI and AuIII oxidation states of
AuNPs which they attributed to Au-O and Au-CO3 species from water and dissolved
atmospheric CO2, respectively. The observation of oxidised gold by Sylvester et al. and
non-appearance of these in our spectra is most likely due to the different pulse duration of the
lasers employed. It is known that the pulse width of the laser affects the mechanism of
nanoparticle production [47]. Specifically, when using nanosecond lasers, laser energy can be
absorbed by the associated plasma thereby increasing its internal energy via inverse
Bremsstrahlung processes [48,49].
The observation of AuIII in the cationic surfactant samples indicate that the laser ablation
process produces oxidised gold when performed in an environment containing CTA+ and an
anion. Although CTA+ is not known to be an oxidising agent, it is known to be a catalyst when
present in a micellar form [50]. To determine if the CTA+ is indeed responsible for the oxidation
of gold, or whether the oxidation is due to the presence of anion species used, additional
experiments were undertaken where gold nanoparticles were produced via laser ablation in 10-3
M NaCl and 10-3 M NaBr solutions in the absence of surfactants. The 10-3 M concentration was

Figure 5.6. Fitted synchrotron XPS spectra for the 15th scan of gold nanoparticles generated in aqueous solution with (a) pure water, (b) 10-2M SDS, (c)
10-5M CTAB, (d) 10-3M CTAB, (e) 10-5M CTAC, and (f) 10-3M CTAC present in solution.
0
0.4
0.8
1.2
1.6
2
2.4
2.8
3.2
Inte
nsity (
CP
S)
(x 1
05)
(a) pure water
0.8
1.6
2.4
3.2
4
4.8
Inte
nsity (
CP
S)
(x 1
04)
(c) 10-5
M CTAB
0
0.4
0.8
1.2
1.6
82848688909294
Inte
nsity (
CP
S)
(x 1
05)
(b) 10-2
M SDS
Binding Energy (eV)
0.2
0.4
0.6
0.8
1
1.2
1.4
1.6
Inte
nsity (
CP
S)
(x 1
05)
(e)10-5
M CTAC
0.36
0.72
1.08
1.44
1.8
82848688909294
Inte
nsity (
CP
S)
(x 1
04)
(d) 10-3
M CTAB
Binding Energy (eV)
0.5
1
1.5
2
2.5
3
3.5
4
4.5
82848688909294
Inte
nsity (
CP
S)
(x 1
04)
(f) 10-3
M CTAC
Binding Energy (eV)

5. KINETICS OF PRODUCED AuNP in CATIONIC SURFACTANTS 126
chosen to correspond with the same concentration of anions present in the highest concentration
surfactant solutions. The high resolution Au 4f region XPS spectra for the AuNPs produced in
10-3 M NaBr and 10-3 M NaCl samples (Figure 5.7a-b) consist of a single doublet of peaks
occurring at 84.0eV and 87.7eV which have assigned to Au0 chemical gold species for the 4f7/2
peak and 4f5/2 peak, respectively. The results clearly show that Cl¯ and Br¯ anions are not solely
responsible for the production of the oxidised gold observed in Figure 5.7. Therefore, we
attribute the appearance of AuIII in the XPS spectra to an oxidation mechanism that involves the
presence of CTA+ in solution during the ablation process.
The XPS spectra do not allow us to determine the species that the oxidised gold belongs to.
It is possible that the nanoparticles are produced with a partially oxidised surface, or a gold salt
is formed in solution (ie AuCl4¯or AuBr4¯) during laser ablation and was deposited on the
silicon substrate. The presence of AuCl4¯ anions in solution can be readily determined from
the UV-Vis spectra since AuCl4¯ solutions show absorption maxima at 230 nm [51] and 350 nm
[28]. Our UV-Vis spectra in Figure 5.1 do not appear to have any peaks at either of these
positions suggesting the gold salt is not produced during the formation process. We therefore
attribute the oxidised gold signal seen in the samples to originate from surface oxidation of the
gold nanoparticles.
One possibility to account for the observation of surface oxidised gold is that the surface
atoms on the gold nanoparticles are partially oxidised by water during the ablation process. This
has been observed previously by Sylvestre and co-workers [9] where they have used
time-of-flight static secondary ion mass spectroscopy (TOF-S-SIMS) to show that the surface
of AuNP produced using femtosecond LASiS consists of attached OH¯ and CO3¯ groups. This
was attributed to reactions of gold atoms with oxygen containing species present in the
laser-generated plasma. Mafuné and co-workers [52] have also reported similar results and
again attributed this to oxygen in the water forming Au-O species on the AuNP surface. As

5. KINETICS OF PRODUCED AuNP in CATIONIC SURFACTANTS 127
Figure 5.7. Fitted XPS spectra of gold nanoparticles generated in aqueous solution with (a) 10-3M
NaBr, (b) 10-3M NaCl present, at 15th scan with synchrotron X-ray irradiation.
0
0.4
0.8
1.2
1.6
2
2.4
2.8
3.2In
ten
sity (
CP
S)
(x 1
05)
(a) 10-3
M NaCl
0
0.4
0.8
1.2
1.6
2
2.4
2.8
3.2
82848688909294
Inte
nsity (
CP
S)
(x 1
05)
(b) 10-3
M NaBr

5. KINETICS OF PRODUCED AuNP in CATIONIC SURFACTANTS 128
mentioned previously, we do not see oxidised gold in nanoparticles produced in pure water
SDS, Cl¯, or Br¯ solutions, but is observed in solutions containing CTA+. At this stage, we
cannot definitively identify the mechanism responsible for the production of AuIII species.
5.4 Conclusion
In this chapter, we have reported on the time evolution of AuNP production via 1064 nm laser
ablation of metallic gold in solutions containing the cationic surfactants,
cetytrimethylammonium bromide and cetyltrimethylammonium chloride. This study applied
the laser-induced formation kinetics for different AuNP size regime as developed in Chapter 3
for pure water and SDS solutions. This kinetic model was found to apply equally well to
nanoparticles produced in cationic surfactants. Following the preparation of gold nanoparticles
we show that the AuNPs produced in the presence of cationic surfactant produced oxidised gold
on the surface of nanoparticles, whereas in SDS and pure water only metallic gold is produced.
We conclude that the presence of CTA+ is necessary for AuIII species to be produced via the
laser ablation method.

5. KINETICS OF PRODUCED AuNP in CATIONIC SURFACTANTS 129
5.5 Reference
(1) Deng, W.; Frenkel, A. I.; Si, R.; Flytzani-Stephanopoulos, M. Journal of Physical Chemistry C 2008, 112, 12834 - 12840.
(2) Lim, D. C.; Hwang, C. C.; Gantefor, G.; Kim, Y. D. Physical Chemistry Chemical Physics 2010, 12, 15172-15180.
(3) Li, L. D.; Chen, Z. B.; Zhao, H. T.; Guo, L.; Mu, X. J. Sensors and Actuators B-Chemical 2010, 149, 110 -115.
(4) Zhang, Y. Z.; Wang, J.; Xu, M. L. Colloids and Surfaces B-Biointerfaces 2010, 75, 179 -185.
(5) Amendola, V.; Meneghetti, M. Journal of Physical Chemistry C 2009, 113, 4277-4285.
(6) Link, S.; El-Sayed, M. A.; Mohamed, M. B. Journal of Physical Chemistry B 2005, 109, 10531-10532.
(7) Varnavski, O.; Ramakrishna, G.; Kim, J.; Lee, D.; Goodson, T. J. Am. Chem. Soc. 2010, 132, 16-17.
(8) Varnavski, O. P.; Goodson, T.; Mohamed, M. B.; El-Sayed, M. A. Physical Review B 2005, 72.
(9) Sylvestre, J. P.; Poulin, S.; Kabashin, A. V.; Sacher, E.; Meunier, M.; Luong, J. H. T. Journal of Physical Chemistry B 2004, 108, 16864-16869.
(10) Karadas, F.; Ertas, G.; Ozkaraoglu, E.; Suzer, S. Langmuir 2005, 21, 437-442.
(11) Amendola, V.; Meneghetti, M. Physcial Chemistry Chemical Physics 2009, 11, 3805-3821.
(12) Lim, T. W.; Park, S. H.; Yang, D. Y.; Kong, H. J.; Lee, K. S. Applied Physics a-Materials Science & Processing 2006, 84, 379-383.
(13) Turner, M.; Golovko, V. B.; Vaughan, O. P. H.; Abdulkin, P.; Berenguer-Murcia, A.; Tikhov, M. S.; Johnson, B. F. G.; Lambert, R. M. Nature 2008, 454, 981 - 983.
(14) Boyen, H. G.; Kastle, G.; Weigl, F.; Koslowski, B.; Dietrich, C.; Ziemann, P.; Spatz, J. P.; Riethmuller, S.; Hartmann, C.; Moller, M.; Schmid, G.; Garnier, M. G.; Oelhafen, P. Science 2002, 297, 1533 - 1536.

5. KINETICS OF PRODUCED AuNP in CATIONIC SURFACTANTS 130
(15) Harding, C.; Habibpour, V.; Kunz, S.; Farnbacher, A. N.; Heiz, U.; Yoon, B.; Landman, U. J. Am. Chem. Soc. 2009, 131, 538 - 548.
(16) Fong, Y. Y.; Gascooke, J. R.; Visser, B. V.; Metha, G. F.; Buntine, M. A. Journal of Physical Chemistry C 2010, 114, 15931-15940.
(17) Mafune´, F.; Kohno, J.; Takeda, Y.; Kondow, T. Journal of Physical Chemistry B 2002, 106, 7575 - 7577.
(18) Mafune, F.; Kohno, J. Y.; Takeda, Y.; Kondow, T. Journal of Physical Chemistry B 2002, 106, 8555-8561.
(19) Mafune, F.; Kondow, T. Chemical Physics Letters 2003, 372, 199-204.
(20) Kondow, T.; Mafune, F. Annual Review of Physical Chemistry 2000, 51, 731-761.
(21) Amendola, V.; Bakr, O.; Stellacci, F. Plasmonics 2010, 5, 85-97.
(22) Amendola, V.; Polizzi, S.; Meneghetti, M. Journal of Physical Chemistry B 2006, 110, 7232 - 7237.
(23) Kim, H. J.; Bang, I. C.; Onoe, J. Optics and Lasers in Engineering 2009, 47, 532 - 538.
(24) Johnson, S. R.; Evans, S. D.; Brydson, R. Langmuir 1998, 14, 6639 - 6647.
(25) Hubert, F.; Testard, F.; Spalla, O. Langmuir 2008, 24, 9219 - 9222.
(26) Kealley, C. S.; Arnold, M. D.; Porkovich, A.; Cortie, M. B. Sensors and Actuators B-Chemical 2010, 148, 34- 40.
(27) Warner, M. G.; Reed, S. M.; Hutchison, J. E. Chem. Mater. 2000, 12, 3316- 3320.
(28) Daniel, M. C.; Astruc, D. Chem. Rev. 2004, 104, 293 - 346.
(29) Amendola, V.; Mattei, G.; Cusan, C.; Prato, M.; Meneghetti, M. Synthetic Metals 2005, 155, 283-286.
(30) Amendola, V.; Rizzi, G. A.; Polizzi, S.; Meneghetti, M. Journal of Physical Chemistry B 2005, 109, 23125-23128.
(31) Muto, H.; Miyajima, K.; Mafune, F. Journal of Physical Chemistry C 2008, 112, 5810-5815.

5. KINETICS OF PRODUCED AuNP in CATIONIC SURFACTANTS 131
(32) Muto, H.; Yamada, K.; Miyajima, K.; Mafune, F. Journal of Physical Chemistry C 2007, 111, 17221-17226.
(33) Takahashi, H.; Niidome, Y.; Sato, T.; Yamada, S. Colloids and Surfaces a-Physicochemical and Engineering Aspects 2004, 247, 105-113.
(34) Fong, Y. Y.; Gascooke, J. R.; Metha, G. F.; Buntine, M. A. Australian Journal of Chemistry 2011, accepted for publication.
(35) Mafune, F.; Kohno, J. Y.; Takeda, Y.; Kondow, T. Journal of Physical Chemistry B 2002, 106, 7575-7577.
(36) Yamada, K.; Tokumoto, Y.; Nagata, T.; Mafune, F. Journal of Physical Chemistry B 2006, 110, 11751-11756.
(37) Link, S.; El-Sayed, M. A. Journal of Physical Chemistry B 1999, 103, 8410-8426.
(38) Amendola, V.; Meneghetti, M. Journal of Materials Chemistry 2007, 17, 4705-4710.
(39) Deng, J. P.; Wu, C. H.; Yang, C. H.; Mou, C. Y. Langmuir 2005, 21, 8947-8951.
(40) Kreibig, U.; Vollmer, M. Optical Properties of Metal Clusters; Springer: New York, 1995.
(41) Bohren, C. F.; Huffman, D. R. Absorption and Scattering of Light by Small Particles; Wiley-Interscience: New York, 1983.
(42) Link, S.; El-Sayed, M. A. International Reviews in Physical Chemistry 2000, 19, 409-453.
(43) Jain, P. K.; Lee, K. S.; El-Sayed, I. H.; El-Sayed, M. A. Journal of Physical Chemistry B 2006, 110, 7238-7248.
(44) Moulder, J. F.; Stickle, W. F.; Sobol, P. E. Handbook of X-Ray Photoelectron Spectroscopy; Perkin-Elmer Corporation: Minnesota, 1993.
(45) Stöhr, J.; Siegmann, H. C. Magnetism From Fundamentals to Nanoscale Dynamics; Springer: New York, 2006.
(46) Fong, Y. Y.; Visser, B. V.; Gascooke, J. R.; Cowie, B. C. C.; Thomsen, L.; Metha, G. F.; Buntine, M. A.; Harris, H. H. Langmuir 2011, 27, 8099-8104.
(47) Mortazavi, S. Z.; Parviin, P.; Reyhani, A.; Golikand, A. N.; Mirershadi, S. Journal of Physical Chemistry C 2011, 115, 5049-5057.

5. KINETICS OF PRODUCED AuNP in CATIONIC SURFACTANTS 132
(48) Cristoforetti, G.; Pitzalis, E.; Spiniello, R.; Ishak, R.; Muniz-Miranda, M. Journal of Physical Chemistry C 2011, 115, 5073-5083.
(49) Itina, T. E. Journal of Physical Chemistry C 2011, 115, 5044-5048.
(50) Zhang, X.; Zhang, J.; Song, W.; Liu, Z. Journal of Physical Chemistry B 2006, 110, 1158-1165.
(51) Hӧnes, G.; Koeber, K.; Kreuzbichler, I.; Neu-Becker, U.; Schwager, B.; Swoboda, G. Gmelin Handbook of Inorganic and Organometallic Chemistry, 8th ed.; Springer-Verlag, 1992; Vol. Supplement Volume B 1.
(52) Muto, H.; Yamada, K.; Miyajima, K.; Mafune, F. Journal of Physical Chemistry C 2007, 111, 17221 - 17226.

CHAPTER 6
Summary
This thesis describes the technique of 1064nm laser ablation synthesis in solution (LASiS) to
produce gold nanoparticles (AuNP) in a pure water sample and in solutions containing various
surfactants at varying concentrations. By observing the time evolution of the nanoparticles via
UV-Vis spectroscopy, the size distributions via transmission electron microscopy and the
surface oxidation states via X-ray photoelectron spectroscopy we were able to gain mechanistic
insights into the production and fragmentation of gold nanoparticles.
Gold nanoparticles have a surface plamson band (SPB) absorption feature at ~520 nm which
we have used to follow the production of nanoparticles during LASiS. We observed increasing
absorption at the SPB with increasing laser irradiation time, indicating on-going production of
AuNPs. Surprisingly, we found that for all systems studied (that is, studies where the surfactant
identity and/or concentrations varied) the absorbance values at the SPB wavelength show
significant curvature at very early irradiation times. At later times the absorbance increases
linearly with laser irradiation. The behaviour of the intervalence band (as measured at 450 nm)
displays near identical behaviour as that at the SPB wavelength. This time-dependent
phenomena was reported in Chapter 3 for LASiS in pure water and sodium dodecylsulfate
(SDS) solutions, and in Chapter 5 for cetytrimethylammonium bromide (CTAB) and
cetyltrimethylammonium chloride (CTAC) solutions. The curvature and formation rates were
found to depend on the laser repetition rate indicating the behaviour is a laser-induced
phenomenon (a study in Chapter 3 was undertaken whereby gold nanoparticles were produced
with a reduced repetition rate but maintaining the same laser power). It is noteworthy that the

6. SUMMARY 134
observed curvature has not been reported previously in the literature.
To understand the time evolution of the gold nanoparticles, we have developed a kinetic
model involving small, medium, and large nanoparticles (see Chapter 3). The model allows
for the direct laser production of AuNPs from bulk gold into three different size regimes (called
“small”, “medium” and “large” for convenience). Within the model, once produced, these
different size regimes can interconvert and there is allowance for the nanoparticles to be
removed from the system. Using this model we were able to fit all our time-dependent data.
By correlating the size distributions from the TEM images with the SPB absorption values, we
were able to determine the size regimes for the three differently sized species used in our model.
We determined that the three size regimes are: “small” (5.5 ± 0.5 nm), “medium” (5.5 ± 0.5
nm – 17 ± 3 nm), and “large” (> 17 ± 3 nm). Although these values were determined for
LASiS in SDS solutions (Chapter 3), we have found they remain valid for AuNP production in
both CTAB and CTAC surfactant solutions (see Chapter 5).
In the literature there is extensive evidence that processes involving nanoparticles (such as
size reduction and transient absorption spectroscopy) show sudden changes as the surfactant’s
concentration approaches the critical micelle concentration (CMC). We therefore undertook a
systematic investigation on the size distribution produced via LASiS as the concentration of
SDS was varied. We found that there was no appreciable change in the average particle size at
the CMC. We conclude that there is no influence from surfactant micelles on the size
distribution of gold nanoparticle during the production process.
Surface chemical characterisation of AuNPs produced via LASiS in various surfactant
solutions was performed using synchrotron X-ray photoelectron spectroscopy. This technique
allows the oxidation states of the gold atoms on the nanoparticle’s surface to be determined.
However, when analysing the XPS spectra of the gold nanoparticles, it was observed that the

6. SUMMARY 135
spectra were changing with X-ray exposure time. Thus, it was necessary for us to understand
how the synchrotron radiation was affecting the sample under investigation. In Chapter 4 we
presented a study into the time evolution of gold oxidation states in a sample of sodium
tetrachloraurate as a function of synchrotron exposure time. We observed that the initial AuIII
oxidation state in the tetrachloraurate anion is photoreduced to lower oxidation states by the
X-ray radiation. By recording high resolution XPS spectra at regular time intervals, we
monitored the AuIII, AuI and Au0 oxidation states as a function of exposure time.
Consequently, a kinetic model was developed that involved a stepwise reduction from AuIII to
Au0 via the AuI oxidation state. It was necessary to include reverse rate constants for each step
allowing the system to reach equilibrium. In Chapter 5 we used this kinetic model to
understand the XPS spectra recorded for the gold nanoparticles produced via LASiS.
An investigation presented in Chapter 5 studied the surface chemistry of AuNP produced in
various surfactant solutions via LASiS. We observed that only the Au0 oxidation state exists in
AuNPs produced in pure water and SDS solutions, whereas the AuIII oxidation state was
observed in AuNPs produced in solutions containing the cationic surfactants CTAB and CTAC.
The high resolution XPS spectra were observed to change over time. Specifically, there was a
production of the gold in the AuI oxidation state and a lowering of the AuIII species as the
nanoparticles were exposed to the X-rays. From the studies detailed in Chapter 4, we ascribe
this to due to the stepwise photoreduction of the sample. Interestingly, the rate of AuIII to AuI
conversion for AuNPs produced in each surfactant solutions was different, with CTAB
photoreduction occurring much faster compared to CTAC (the XPS spectra of AuNP produced
in CTAB solutions do not show a peak for the AuI oxidation state).
Interestingly, AuIII species were present in AuNPs produced in solutions containing the
cationic surfactants CTAB and CTAC but not observed in pure water or SDS solutions. To

6. SUMMARY 136
understand the reason behind this, gold nanoparticles were prepared in salt solutions of sodium
bromide and sodium chloride (that is, solutions containing the same anions but different cations
to the CTAC and CTAB solutions). From the XPS spectra displayed in Chapter 5 we found
that the chloride and bromide ions do not play a role in the formation of AuIII species. We
therefore conclude that the presence of CTA+ is necessary for AuIII species to be produced
during the laser ablation method.
This finding, that CTA+ causes AuIII species to be produced during LASiS, raises further
questions regarding the mechanism by which metallic gold is oxidised. The analysis
techniques used in this thesis cannot determine the mechanism of the oxidation process. In
order to fully understand the AuIII species form on nanoparticle surface, further investigations
are required using complimentary techniques. For example, surface enhanced Raman
scattering could potentially identify species bound to the surface of the nanoparticles.
Thus far, we have concentrated on the mechanism and kinetics of gold nanoparticle
production via the 1064 nm LASiS process. We have also extended these studies to investigate
the fragmentation process of the AuNPs produced by 1064 nm LASiS in SDS solutions. In
Chapter 3 we showed that by irradiating the AuNPs using 532 nm laser radiation, that the
absorption value at the SPB peak decreases as a function of the number of laser pulses. In
contrast with the size distribution obtained in the production process, the 532 nm reduction
process results in particle size distributions that display a narrower, symmetric size distribution
with a smaller average diameter. This effect is more dramatic as the SDS surfactant
concentration increases. We were able to use our previously developed kinetic model (with the
modification that channels involving bulk gold are removed) to describe the changes in
absorption observed at the SPB wavelength in the UV-Vis spectra.