Embed Size (px)
Citation preview

A STUDY OF A MODIFIED MEMBKANE FILTER TECHNIQUE FOR THE ENUMERATION OF
STRESSED FECAL COLIFORMS IN URBAN RUNOFF
by
Edward Ryland Brown, Jr.
Thesis submitted to the Graduate Faculty of the
Virginia Polytechnic Institute and State University
in partial fulfillment of the requirements for the degree of
MASTER OF SCIENCE
in
Environmental Sciences and Engineering
APPROVED:
R. C. Hoehn, Chairman
K. E. Benoit P. H. King )
August, 1977
Blacksburg, Virginia
( )

ACKNOWLEDGMENTS
lhe author would like to express his sincere appreciation to
the following people whose assistance made this study possible:
1. Dr. Robert C. Hoehn, Committee Chairman, for his invaluable
guidance, suggestions, and complete editing of this manuscript.
2. Dr. Robert E. Benoit, for his help concerning microbiological
techniques and his service on the Graduate Committee.
3. Dr. Paul H. King, for his service on the Graduate Committee.
4. for his patient assistance in the laboratory.
5. for conducting the heavy metal analyses.
6. , and the Department of Statistics
for their statistical advice.
7. Dr. V. Shanholtz and the Department of Agricultural
Engineering for rainfall data.
8. for her immeasurable laboratory help and advice
at so many times when it was needed.
9. for patiently typing this thesis.
The author also wishes to express his gratitude to his fellow
associates who provided considerable technical and moral support
throughout the year.
ACKNOVJLEDGMENTS
LIST OF TABLES
LIST OF FIGURES .
TABLE OF CONTENTS
LIST OF APPENDIX TABLES
I. INTRODUCTION . . .
II. LITERATURE REVIEW
Historical Aspects of Pathogens Associated with Polluted Water ......... .
Importance of the Coliform Bacteria .. Coliform Physiology ........... . Coliforms Associated with Runoff .... . Standard Tests for Coliform Detection .. . The Concept of Stressed Coliform Organisms Heavy Metal Stress in Parking Lot Runoff .. Modified Tests for Stressed Coliform Recovery
III. MATERIALS AND METHODS ...
IV.
Description of Study Area Sampling Procedures . Heavy Metal Analysis Coliform Enumeration
RESULTS ...
V. DISCUSSION OF RESULTS .
Fecal Coliform Determinations . Heavy Metal Determinations .... Comparison of Recoveries to the Environmental
Conditions ....
VI. SUMMARY AND CONCLUSIONS
VII. RECOMMENDATIONS .
VIII. LITERATURE CITED
iii
ii
v
Vi
vii
4
4 6
11 13 15 21 24 26
29
29 30 30 33
39
59
S9 64
66
69
71
72

APPENDICES
VITA . . ABSTRACT
iv
79
94

LIST OF TABLES
I. Characteristics of Rainfall Durina the Study Period . . . . . . . . . . . . 41
II. Sample Collection Times 42
III. Fecal Coliform Concentrations Determined During the Study Period .......... . 43
IV. Fecal Coliform Concentrations Determined Using Alternate Methods . . . . . . .... 44
V. Log and Percent Differences in Fecal Coliform Recoveries by Various Methods . . . . . . . . . . . . . . . . 51
VI. Statistical Comparison of Various Techniques for Fecal Coliform Recovery .......... . 53
VI I. Verification of Fecal Coliform Colonies from the Modified MF Technique ........... . 54
VI I I. Metal Concentrations in Runoff Durinq the Study Period . . . . . . . . . . . . . . . . . . . . 55
v

Figure
l
2
3
4
5
6
7
8
9
10
11
LIST OF FIGURES
Location of Study Site .
The Kroger's Parking Lot
Membrane Filter Apparatus
Protocol for Standard Membrane Filter-Modified MF-MPN Comparisons and Heavy Metal Analysis ..... .
Comparison of Standard MF and M-5hr Fecal Coliform Recoveries (Trials 1-6) ........... .
Comparison of Standard MF and M-5hr Fecal Coliform Recoveries (Trials 7-12) ........... .
Comparison of Standard MF and M-2hr Fecal Coliform Recoveries ............... .
Comparison of M-2hr and M-5hr Fecal Coliform Recoveries . . . . . . . . . . . . . . . .
Comparison of Fecal Coliform Recoveries Using Three Membrane Filter Techniques to the MPN Technique .................. .
Comparison of the Modified MF (5-hr): Standard MF Fecal Coliform Recoveries to Metal Concen-trati ans . . . . . . . . . . . . . . . . . . .
Comparison of the Modified MF (5-hr): Standard MF Fecal Coliform Recoveries to the Time Since the Previous Storm of at Least 0.3 Inches
vi
Page
31
32
35
31
46
47
48
49
50
56
58

Table
Appendix A
A-I
A-II
A-III
A-IV
A-V
Appendix B
B-I
B-II
B-III
B-IV
B-V
B-VI
LIST OF APPENDIX TABLES
Fecal Coliform Determinations by Various Techniques . . .
MPN Determinations ...
Standard MF Plate Counts
Modified M-5hr Method Plate Counts
Modified M-2hr Method Plate Counts
Standard MF without Rosalie Acid Plate Counts . . . . . . . . . . . .
Statistical Analysis
Standard MF and M-5hr Techniques
Standard MF and M-2hr lechniques
M-2hr and M-5hr Techniques
MPN and M-5hr Techniques
M-2hr and MPN Techniques
Standard MF and MPN Techniques .
Vii
79
80
81
83
85
86
87
88
89
90
91
92
93

I. INTRODUCTION
Communicable diseases have always been a threat to man 1 s health.
Exposure of man to his fellow humans and other components of his
environment increases the risk of illness. Communicable diseases are
transmitted from one organism to another by vectors such as particulate
matter, food, water, or by direct contact with the disease source.
Because of increased city populations, it has become necessary to
establish large public water supplies. Contamination of such water
supplies with pathogenic organisms has been the cause of many epidemics
throughout the world and may have been partially responsible for the
great plagues.
Pathogens may enter a receiving stream from sewage treatment plant
effluents, contaminated groundwater, or storlTll~ater runoff and can
contaminate other streams or impounded water supplies downstream of the
original contamination site, causing, in many instances, serious and
widespread public health problems.
Water-borne pathogens include: the bacteria responsible for
typhoid (Salmonella typhosa), paratyphoid A (i.:_ paratyphi), paratyphoid
B (i.:_ schottmuelleri); bacterial dysentery (Shigella dysenteriae); and
the rather rare pathogenic strains of Escherichia coli, Paracolobacterium,
or other enteric intermediates (1). Water-borne protozoan pathogens
include those causing amoebic dysentery (Endamoeba histolytica) (1) and
giardiosis (Giardia lamblia). Other pathogens which occasionally may
be water-borne include viruses that cause infectious hepatitis,
poliomyelitis, and histoplasmosis; parasitic worms such as tapeworms

2
(Taenia spp.), disease-producing blood flukes (Schistosoma spp.), and
hookworms (Ascaris). Spore-forming bacteria, such as Bacillus
arthracis that causes anthrax, may possibly occur in water (2).
The apparent absence of pathogenic organisms cannot be used as a
basis for judging the safety of water for human consumption. A relatively
elaborate series of procedures must be carried out for their isolation
from mixed cultures. These procedures are not suitable for routine
use. Instead, indicator organisms, i.e. bacteria native to the intestines
of healthy humans and other warm-blooded animals, are used to indicate
the existence of fecal pollution. Their presence evinces fecal
pollution of some form and denotes the potential presence of pathogens.
For control and enforcement purposes, demonstration of pathogenic
organisms themselves is not necessary. The margin of safety afforded
by the use of the indicator organisms depends on the ratio between them
and human pathogens. This margin is quite wide under almost all
circumstances (3), because the bacterial indicator organisms are usually
many times more resistant than specific bacterial pathogens such as
salmonellae.
In recent years, much concern has been expressed that indicator
organisms, stressed by a host of environmental conditions in certain
terrestrial and aquatic environments, may not be serving their intended
purpose because the "stress" makes them susceptible to rigorous
procedures used for their isolation that they normally could withstand.
Bacteria entering the environment outside the intestines are subjected
to a host of adverse environmental influences such as heat, cold,

3
exposure to disinfectants, irradiation, pH variation, the presence of
minimal nutrients, antagonistic response due to other microflora, and
toxic materials, such as heavy metals. These adverse conditions may
generate excessive changes in physiological and morphological properties,
creating a population of stressed organisms (4). Such stressed
organisms may go undetected by routine tests when the relatively
harsh differentation media for enumeration are employed. Failure to
detect stressed indicators may seriously affect water quality
classification based on designated standards. This is especially
important since stressed pathogenic strains have been shown to
maintain their virulence even though subjected to stresses.
The specific objectives of this study were, first, to compare a
proposed assay procedure (to be described) for fecal coliforms in
stormwater runoff from an urban area to the existing membrane filter
(MF) and most probable number (MPN) techniques as prescribed by the
American Public Health Association, et~ (5), and second, to relate,
if possible, any observed differences in the relative recovery
efficiencies to the heavy-metal concentrations in the urban runoff.

II. LITERATURE REVIEW
Much has been written on the use of coliform organisms as
indicators of potentially dangerous polluted water. Extensive studies
have been carried out on water samples from various sources, and the
value of indicator organisms in pollution studies has been well
established. Subpopulations of stressed coliforms, however, cause
difficulties in accurately assessing the extent of fecal contamination
loads. It has been suggested (4) that a period of recovery for these
stressed organisms is needed before they will show up in standard
analytical tests. The research area of this thesis is that of
recovering this stressed subpopulation of coliform organisms. Topics
that have been reviewed in the literature, which will be discussed in
the following sections, are: historical aspects, the importance of
the coliforms, coliform physiology, coliforms in runoff waters, tests
used for detection, the concept of stressed organisms, heavy metal
stress in urban runoff waters, and modified tests for stressed coliform
recovery.
Historical Aspects of Pathogens Associated with Polluted Water
Disease epidemics have occurred at numerous occasions throughout
history, one of the most extensive taking place in the fourteenth
century A.O. when the "Black Death" claimed the lives of nearly 25
percent of the European population. An epidemic in the winter of
1664-1665 killed 14 percent of London's population. Polluted water
may have partially been the cause of these epidemics (6).
4

5
Although water had long been suspected of carrying disease
organisms, it was not until 1854 that this was proven epidemiologically.
In that year, London had one of its recurrent cholera outbreaks, and
700 deaths occurred in the St. James parish alone. Dr. John Snow and
his commission studied the nature of the outbreak and reported that the
source of infection was the Broad Street Pump water supply. The well
had been contaminated by sewage seeping in through a break in an
adjacent masonry sewer. This incident established the fact that water
was important in the transmission of Asiatic Cholera (6).
Water was proven to be a major medium for disease transmittance
in 1875 by Robert Koch, who successfully isolated a pure culture of the
anthrax-causing bacterium and, by doing so, initiated the science of
bacteriology. He later isolated pure cultures of the pathogens causing
Asiatic Cholera (in 1883) and typhoid (in 1884). Also in 1883, he
described a method for estimating bacterial numbers in water.
Modifications of this early method now comprise the standard plate
count (SPC) technique (5).
Despite the effectiveness of modern filtration and disinfection
practices in preventing water borne disease outbreaks, these defenses
still occasionally break down and epidemics occur. A classic example
of this took place in July, 1940, in Seymour, Indiana. The White River
flooded following heavy rains. This, coupled with improper treatment
plant operation, led to the occurrence of an epidemic. Before it was
over, 2,250 cases of gastroenteritis and severe diarrhea had developed.
Some 884 of these cases were diagnosed as typhoid and 27 deaths resulted
( 6}.

6
Importance of the Coliform Bacteria
In 1885, Escherich isolated !h_ coli from the feces of a cholera
patient (6). He insisted that the existence of these microorganisms
in water supplies represented pollution because of their possible
association with the enteric, disease-causing bacterial group present
in the intestines of ill persons. The bacterial group described by
Escherich were later classified in the Escherichia-Aerobacter genera.
It was subsequently found that the group occurred regularly and in
immense numbers in the feces of man and numerous other animals. Many
species of the coliform group were isolated, and several species
biochemically resembling the group were discovered in plants, soils,
and similar sources. Due to the variation in environments in which
coliform bacteria were found, confusion resulted as to their correlation
with fecal pollution.
Smith (7) stated in 1895 that the presence of coliform bacteria
in the physical environment was indicative of fecal pollution and
hazardous to public health regardless of where they were detected.
He maintained that all coliform organisms originated in the intestines
of warm-blooded animals. In 1904, Eijkman presented his opposition
to the accepted belief that only those coliforms, proven to be of fecal
origin, typified dangerous pollution (6). He insisted that ignoring
the source and native habitat of the coliform groups risked public
health. He recommended an elevated-temperature culture incubation
procedure. Fecal coliform organisms would grow at this elevated
temperature, but non-fecal coliforms would not. Modern techniques

7
for coliform enumeration incorporate this 11 Eijkman reaction, 11 as it
came to be called.
Geldreich (8) assembled fecal samples from ten adults living in
a controlled institutional environment. These residents ate the same
food and worked at the same job. When he compared the coliforms in
fecal samples from these adults to those in samples from 33 people
from a variety of environmental backgrounds, he found the same coliform
distributions. Human fecal samples had 11 of the possible 16 indole,
methyl red, Voges-Proskauer, citrate (IMViC) contaminations of
biochemical tests. He also studied the feces of livestock and poultry
and found the coliform component to be almost exclusively Escherichia
coliform (f. coli). Five other types appeared, but only occasionally.
Later research along these lines demonstrated E. coli to be the
dominant coliform in the feces of dogs, cats, and various rodents.
Large numbers of bacteria are contributed to drainage water from
soil. The correlation between coliform bacteria from unpolluted soils
and the fecal coliform test is therefore important. Geldreich (9}
collected 251 soil samples from 26 states and 3 foreign countries and
found that fecal coliforms were absent or present in relatively small
quantities in unpolluted soils. Less than two fecal coliforms per
gram were found in most of the samples. On the other hand, fecal
coliform densities in soils from polluted areas such as animal feedlots,
lands recently flooded with domestic wastewater, and the banks of
heavily polluted streams, varied from 3,300 to 49,000 per gram.

8
Although rain falling to the earth contains insignificant bacterial
contamination (10), it can cause any coliforms associated with vegetation
to enter surface water via storm water drainage. Such organisms
occurring on plants may, in turn, result from contact by insects.
Geldreich (11) examined 152 species of plants and 40 insect specimens
from various ecological environments. Although 13 different IMViC
types on the vegetation specimens and 14 different types on the insects
were found, no type predominated. Geldreich concluded that coliforms
from the intestines of warm-blooded animals contributed a relatively
minor percentage of the microorganisms associated with vegetation and
insects.
Fresh water fish have no permanent coliform populations in the
intestines. The occurrence of fecal coliform bacteria in fish is
apparently related to the pollutional level of their food and the
aquatic environment itself (11). Fish may act as carriers of warm-
blooded animal pollution for up to approximately seven days, however,
and can transport pathogens to areas of clean water (12).
Survival of coliform organisms outside the human body has been
the subject of several studies. Geldreich (12) reported that many
factors affect the persistence of the coliform organisms in the soil.
Such factors as temperature, pH, and soil moisture may indirectly
influence enteric bacterial survival by governing the growth of
antagonistic organisms such as protozoa, fungi, and actinomycetes.
Organic nutrients in the feces may also be conducive to the prolif-
eration of these antagonistic organisms. Other factors of importance
9
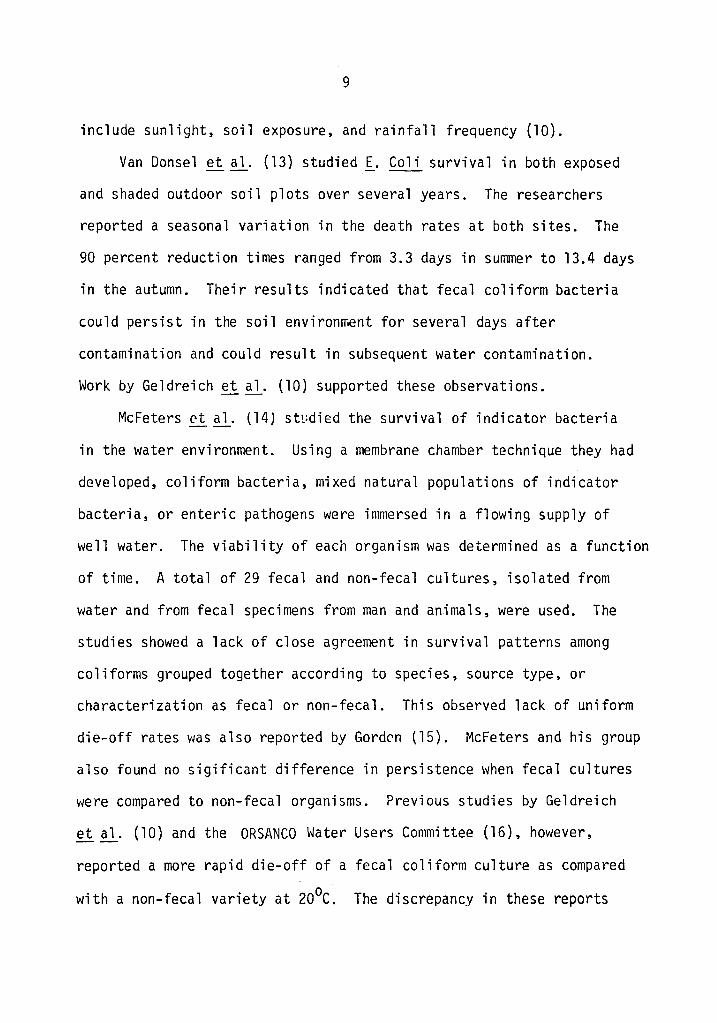
include sunlight, soil exposure, and rainfall frequency (10).
Van Donsel et~- (13) studied f. Coli survival in both exposed
and shaded outdoor soil plots over several years. The researchers
reported a seasonal variation in the death rates at both sites. The
90 percent reduction times ranged from 3.3 days in summer to 13.4 days
in the autumn. Their results indicated that fecal coliform bacteria
could persist in the soil environment for several days after
contamination and could result in subsequent water contamination.
Work by Geldreich et~- (10) supported these observations.
McFeters C't ~- (14) stt:died the survival of indicator bacteria
in the water environment. Using a membrane chamber technique they had
developed, coliform bacteria, mixed natural populations of indicator
bacteria, or enteric pathogens were immersed in a flowing supply of
well water. The viability of each organism was determined as a function
of time. A total of 29 fecal and non-fecal cultures, isolated from
water and from fecal specimens from man and animals, were used. The
studies showed a lack of close agreement in survival patterns among
coliforms grouped together according to species, source type, or
characterization as fecal or non-fecal. This observed lack of uniform
die-off rates was also reported by Gordrn (15). McFeters and his group
also found no sigificant difference in persistence when fecal cultures
were compared to non-fecal organisms. Previous studies by Geldreich
et~- (10) and the ORSANCO Water Users Committee (16), however,
reported a more rapid die-off of a fecal coliform culture as compared
with a non-fecal variety at 20°c. The discrepancy in these reports

10
is probably caused by the diversity of the coliform group.
A few studies also have been carried out to compare the
persistence of some pathogenic organisms with the indicator organisms
(10,14,15,17). The general conclusion from these studies was that a
few indicator bacteria survive somewhat longer than some enteric
pathogens. Few concrete relationships could be determined. ilork bv
McFeters et al. (14) indicated that the survival of the coliforms was
on the same order as some cf the salmonellae they tested. Some of the
shigellae persisted in water slightly longer than some of the more
stable coliforms. A much higher die-off rate was found for Salmonella
typhi and Vibrio cholerae as compared to the coliforms, however. Work
by Andre et~· (17) resulted in similar observations for S. typhi and
V. cholerae.
Under some conditions, indicator bacteria entering the soil or
water environment may proliferate (aftergrow). A good deal of disagree-
ment has been expressed among investigators concerning the causes of
aftergrowth. At least two conditions seem to promote it: the dilution
of polluted water with clean water and the disinfection of sewage or
effluent followed by discharge into the receiving stream. In both of
these conditions, the numbers of indicator bacteria have been shown to
increase, contrary to expectations (3). Sudden ecological upset between
the indicators and their environment may be the cause of this phenomenon.
The more complete destruction by disinfection of organisms preying on
the bacteria or their dilution may be one mechanism for this upset.
11
Some investigators have estimated the aftergrowth period to be
from 9 to 15 hours after initial discharge (18). Evans et~- (19)
found maximum bacterial regrowth occurring in a period from 24 to 72
hours after discharge. Underhill (6) observed instream aftergrowth of
total and fecal coliforms in less than three hours, but it could not be
determined if these coliforms originated in the chlorinated sewage
effluent or in runoff from pastureland located downstream of the sewage
treatment plant. Kittrell (20) reported increases of from 10 to 100
times the initia1 populJticn w·i thin one or two days downstream travel
for some coliforms. These reported differential aftergrowth periods
probably are largely a factor of the coliform group diversity and
·differences in the aquatic environments studied.
Aftergrowth has generally been associated with the non-fecal
portion of the total coliform group (21). Geldreich (12) stated that
aftergrowth is mainly a function of Enterobacter coliform (formerly
Aerobacter), which can grow with very minimal nutrients. Geldreich
concluded that non-fecal coliforms can survive and multiply in waters
containing minimal quantities of nutrients, whereas the fecal coliform
component requires more favorable environmental conditions. In one
study of aftergrowth (6), coliforms attained a peak density, and then
rapidly disappeared from the stream.
Coliform Physiology
Coliform bacteria have been defined as all of the aerobic and
facultative anaerobic, Gram-negative, oxidase-negative, non-spore-
forming, rod-shaped bacteria having the abilities to grow in a medium
12
containing bile salts and to ferment lactose with gas production
within 48 hours at 35°C (22). The group includes all genera having
the same structure and the ability to use either aerobic respiration
or sugar fermentation as a metabolic pathway to derive energy. Included
are the genera Erwinia, Enterobacter (Aerobacter), Escherichia,
Pasteurella, Serratia, and Klebsiella. A~l of these genera can utilize
sugars, amino acids, organic acids, or other simple substrates for
aerobic metabolism.
The two major fermentative patterns characteristic of coliform
bacteria are mixed acid fermentation and butylene glycol fermentation.
The former pattern is characteristic off. coli. This organism
ferments glucose and forms formic acid, lactic acid, acetic acid,
sucinic acid, ethyl alcohol, co2, and hydrogen gas. The co2 to H2 ratio
is 1:1 because they are derived solely from formic acid by the reaction:
HCOOH ~ H2 + C02 (23). The enzyme formic hydrogenlyase catalyzes this
reaction.
In butylene glycol fermentation, more ethyl alcohol is produced
with 2,3-butylene glycol being the exclusive type. Less acid is formed
in this fermentation pattern. Hydrogen and C02 are produced in a
manner duplicate to that in mixed acid fermentation; however additional
co2 is formed during the reactions that yield butylene glycol. The
Voges-Proskauer reaction, the methyl red test, or a comparison of co2-H2 gas ratios may be used to distinguish between the fermentation types.
E. coli is a common intestinal bacteria, and Erwinia is a plant
pathogen. Of the other coliform groups, Enterobacter occurs in the

13
soil and on the plants, and Serratia is found in soil and water.
Members of the genus Klebsiella may be found in human respiratory and
intestinal tracts (23).
Coliforms Associated with Runoff
The traditional approach to water pollution control has been to
eliminate discharges of raw wastewater and untreated industrial wastes
as the main objective. In recent years, however, the importance of
storm water runoff as a source of stream pollution has been given more
and more consideration. According to Bradford (24), studies designated
to quantify pollutant loadings in urban runoff first appeared in the
1950's. Some of these early studies presented substantial evidence
that runoff waters can cause a shock load to the receiving stream
that is 100 to 1000 times greater than that produced by sanitary
wastewater (24).
With the establishment of runoff, both rural and urban, as an
important source of pollution, attention began to focus upon quantifying
the pollutant sources in macro scale. Attempts were made by Weibel
et~· (25) and Geldreich ~~- (10), among others, to determine urban
watershed area loads of various pollutants. Several studies appeared
in the early 1970's stating that nonpoint pollution sources accounted
for more than half of the observed total oollution (26). Since the
late 1960's, efforts have mainly been focused on identifying and
quantifying the individual sources of nonpoint water pollution and on
the development of predictive models for determining the load that
could be expected from a given area based upon several factors (24).
14
The 1972 Federal Water Pollution Act Ammendments included the requisite
that area pollution control planning must include consideration of both
point- and nonpoint sources of pollution.
Some workers have stated that storm water is the greatest inter-
mittent source of bacterial pollution entering receiving streams (27).
Numerous studies have been carried out to determine the quantities of
coliform organisms in runoff waters (10,12,25,28,29,30). Whipple et al.
(29) found coliform counts to be variable and greatly in excess of
concentrations normally considered safe for water contact activities.
Weibel~~- (25) studied storm water from a 27 acre residential and
suburban area that was free of sanitary and industrial waste discharges,
and found fecal coliform levels to average 11,000 per 100 ml. Faust (30)
reported that in a study of the Rhode River watershed, the concentration
of total and fecal coliforms changed seasonally and ranged from 17 to
24,000 per 100 ml, and from 4 to 11,000 per 100 ml, respectively.
Various other studies have reported even greater ranges, with total
coliform levels reported to be up to several million per 100 ml (10).
The coliform levels entering water systems have been reported to depend
on many factors, including: natural background coliform concentrations
and soil types (10,13), the rates of water discharge (31), the hydraulic
regime of the stream (32), seasonal differences (10,13,30), sediment
load (33), and nutrient availability (34). It appears that concen-
trations of total coliforms and fecal coliforms are functions of the
same variables (30). The main sources of fecal coliforms in urban
storm water are animals associated with urban living: mainly cats,
15
dogs, birds, and various rodents. The soil contains naturally
occurring coliform organisms and fecal coliforms from the excreta of
the urban warm-blooded animals.
In recent years, several reports have been published stressing
the importance of storm water runoff as a source of bacterial pollution
in receiving waters. Burgess et~- (35) reported that rural and urban
runoff generated significant inputs of fecal coliforms to Lake Burley
Griffin in Australia, causing recreational use of the lake to often be
interrupted because bacterial standards were violated. It had
originally been thought that the high fecal coliform levels were solely
the result of sewage discharge. Geldreich (36) studied a recreational
lake in Texas having as its source a drainage basin receiving only 15
inches of rainfall a year. The basin supports around 15,000 people
and 180,000 cattle. Here, the water quality was found to be excellent
during dry weather, but storm water runoff introduced fecal coliform
levels well in excess of the recommended levels. Work by Buckingham
et al. (37) indicated that staggered contributing times caused by
intermittent rainfall accounted for high fecal coliform loads entering
receiving waters in a Tennessee Valley study. The problem of coliform
concentrations in storm water has even generated interest in projects
to disinfect runoff waters (38). The feasibility of such treatment has
not been fully established.
Standard Tests for Coliform Detection
In 1904, Eijkman (6) found that coliform bacteria from the
intestines of warm-blooded animals fermented glucose broth and produced

16
gas at 46°C, whereas non-fecal coliforms could not grow. Numerous
improvements on the Eijkman reaction have since been made. Delaney
et £1_. (39) summarized the early work on inconsistencies in the method.
Strains of~- coli (now I· coli) failing to develop in glucose broth
at 46°C were found. A number of methyl red-negative coliforms behaving
in the Eijkman reaction were discovered, detracting from the specificity
of the reaction. One report stated that only a small percentage of
human fecal ~- coli could ferment glucose at 46°C. The necessity of a
more specific method for coliform detection prompted the development
of a new medium with a reduced glucose concentration in 1933 and the
replacement of glucose by lactose in the medium formulation in 1936.
In 1943, an EC medium (buffered tryptose bile salt broth) was
proposed. Subsequent investigations proved it to be unsatisfactory
as a presumptive medium, however, and in 1948 brilliant green bile
(BGB) broth was suggested for use. It too proved to be unsatisfactory
for use as a presumptive medium. In 1957, there was renewed interest
in the use of lactose broth. The EC medium and BGB broth were adopted
for the confirmed test in the MPN for fecal and total coliforms,
respectively. In recent years, lauryl tryptose broth has been
suggested for use instead of lactose because it has been reported to
yield fewer false positive results (4). The incubation temperature
for fecal coliforms was changed from 46°c to 44.5°c. Geldreich (40)
reported on the need for this temperature change. He stated that
inhibition of the gas-forming mechanism of some fecal coliforms can be
significant when the elevated incubation temperature exceeds 45.6°C.

17
He emphasized the need for incubation in a carefully-controlled
water bath at 44.s0c (! 0.2°).
A statistically-based procedure was developed for determining
coliform numbers in water samples using the fermentation of lactose
as its basis. This most probable number (MPN) technique is described
in Standard Methods (S). The technique consists of inoculating three,
five, or more replicate samples of at least three dilutions of sample
into a lactose or lauryl tryptose broth (Presumptive test). This
presumptive test serves as a screening procedure in which a positive
reaction, after incubation of samples at 3S0c, indicates a probability
of the presence of the coliform group and a negative reaction excludes
its presence. This step also ensures an optimal cell density,
generally in excess of 1 ,oaa viable organisms, when culture transfers
are made from positive tubes into the selective broths for coliform
confirmation. Confirmation broths contain inhibitory substances such
as ox bile, bile salts, surfactants, or dyes, allowing for growth of
the coliforms, but excluding growth of other organisms. Brilliant
green bile broth and an incubation temperature of 3S.S ! a.s0c generally constitutes the confirmed test for total coliforms, while
EC broth and an incubation temperature of 44.S ! a.s0c are used for
confirmed fecal coliform determinations. A completed test may then
be employed, followed by a Gram strain, if desired.
The IMViC series of biochemical tests may be used to differentiate
between fecal and non-fecal coliforms (22). The series consists of
various combinations of positive and negative reactions involving

18
indele production, the methyl red reaction, the Voges-Proskauer test,
and citrate utilization. It has been found, however, that the
elevated temperature (MPN) technique is superior for fecal coliform
detection (41). The MPN technique does not require the isolation of
a pure culture, multiple media inoculation, or the four biochemical
reactions. Also, a five-day incubation period is necessary for the
methyl red test in the IMViC series, whereas presumptive MPN results
are obtained in 48 hours and confirmed fecal coliform results in 72
hours.
The membrane filter (MF) technique for bacterial water
examinations was used in Europe for many years before it was formally
introduced into the U. S. in 1947 (42). Since then, much work has
been carried out on the technique to improve it and to evaluate its
advantages and limitations. Several of the first investigators
studied two-step membrane filter techniques for the elevated
temperature reaction (39,43). Later, many media were proposed which
were reported to give adequate results in a simpler one-step
incubation (44,45). Fifield et~- (46) introduced the widely
accepted M-Endo broth for the detection of the total coliform group
in 1958. Geldreich et~- (47) developed the fecal coliform membrane
filter procedure (M-FC) in 1965. This method allowed for direct
quantitative enumeration of the fecal coliform organism group without
the need for prior enrichment or subsequent chemical tests. The M-FC
method was incorporated as an approved analytical procedure for water
analysis into the 13th edition of Standard Methods (5). The MF

19
technique was shown to have several advantages over the MPN method ,
including quickness of analysis, less required labor, less expense,
qreater potential sample volumes, and lack of the statistical bias
found in the MPN technique (39).
The initial M-Endo and M-FC techniques employed the placing of
broths on sterile absorbent pads placed in Petri plates. McCarthy
et~· (48), however, reported a suppressive effect when M-Endo broth
was used in this manner. They found that the use of Endo agar (M-Endo
medium+ 1.5 percent agar-agar) gave consistently higher degrees of
coliform recovery. They also reported that the use of M-Endo plus agar
generated a more-pronounced sheen on the coliform colonies, making them
easier to enumerate, and that this sheen persisted longer than when the
liquid medium was used.
Although some researchers reported close agreement between data
obtained by the MF and the MPN techniques when compared (42,48), the
majority of the studies have demonstrated significantly poorer
recoveries of the coliforms by membrane filter techniques, especially
when the samples were toxic wastes or chlorinated effluents. McKee
et~· (49) showed much lower coliform recoveries from chlorinated,
settled sewage for the MF technique as compared with accepted MPN
procedures. Lin (50) reported similar results when studying
chlorinated, secondary sewage treatment plant effluents, and Shipe
et~· (51) observed this same discrepancy in a study of river water
containing toxic wastes. These observations prompted investigators
to determine if an enrichment step prior to transfer of the sample to
differential media would lead to a better correlation of the two

20
techniques. Lin (52) demonstrated that an enrichment two-step
membrane filter technique, developed by McCarthy et~· (48) at the
Lawrence Experiment Station, significantly improved total coliform
recovery from chlorinated secondary effluent when compared to a one-
step method. He found this LES procedure to be comparable to the
completed MPN technique for total coliform enumeration for chlorinated,
secondary sewage treatment plant effluents. Total coliform recovery
in these effluents by the LES technique was around 1.5 times greater
than results using the M-Endo, one-step technique. Lin concluded that
the standard M-FC membrane filter assay for recovery of fecal coliforms
from chlorinated effluents was less efficient than the confirmed .MPN
procedure. Dufour et ~· (53) developed a modified membrane filter
procedure (me) for defining the quantities of coliforms in sea water.
He showed this mC procedure to be comparable to the completed MPN
method in their coliform recoveries, whereas the M-Endo procedure
yielded substantially lower values.
Another improvement to the coliform enumeration tests was the
development of a delayed-incubation membrane filter technique by
Taylor et~· (54). This method employed a vitamin-free Casitone
(VFC) holding medium, and provided an alternative procedure which
could be used when raw samples could not be analyzed within the
recommended six-hour period. Taylor and his group found this
procedure to yield results comparable to those of the standard
procedures.
21
A number of studies have been carried out to determine the most
effective type of membrane filter to use with the MF procedure.
Sladek et~- (55) found that the primary determinant of coliform
growth on a membrane filter was that of surface pore morphology.
Their data strongly suggested that neither the method of sterilization
nor chemical composition of the filter had any sigificant effect on
recovery. They suggested that an optimum membrane structure with
surface pores slightly larger than the coliform organisms but also
with internal retention pores smaller than the coliforms be used.
This would allow for adequate cellular division, which could be
affected by the extent and nature of the contact of the coliform with
. the membrane filter material. They further argued that nutrient
supply by medium diffusion and subsequent metabolic waste products
removal were also a function of pore morphology and membrane structure.
Until this work, membranes for bacterial testing had been specified
by a retention pore size of 0.45 µm. These membranes typically have
surface opening diameters of one to two µm. Sladek and his coworkers
suggested a change to an optimum membrane having a 2.4 µm surface
opening and a 0.7 µm retention pore size. Subsequent work by Green
et~· (56) and Lin (57) demonstrated the superiority of filters
having these characteristics over the 0.45 µm filters.
The Concept of Stressed Coliform Organisms
As previously mentioned, a host of environmental factors can
cause stresses on coliform organisms entering the terrestrial or
aquatic environment. Numerous studies have been carried out to

22
determine the influence of these environmental factors on the coliform
bacteria. Daubner (4) found that the chemical characteristics of the
aquatic environment could be related to the lowering of I· coli
metabolism. Maeda et al. (58) observed that sudden increases in
temperature caused suppression of cell motility in an f. coli suspension.
High temperatures can cause various cellular damages and can eventually
bring about a collapse of the helical structure of DNA by a dissociation
of the hydrogen bonds (59). The stressed condition of coliform
bacteria not killed by chlorine disinfection has been documented by
McKee et al. (49) and Lin (50,52). Recovery of organisms sublethally
injured by freezing was studied by Ray et~- (60). Postgate et~
(61) studied the stress induced in bacteria in environments with low
nutrient levels. Klein and Wu (62) also did work on the concept of
starved bacterial populations and stated that this condition could
lead to an increased susceptibility to secondary stresses such as
heat. Mitra et~- (63) and Babich and Stotzky (64) have studied the
stress generated by cadmium on bacteria. Mitra and his coworkers
studied the ability off. coli to alter its chemical physiology to
compensate for cadmium toxicity. He found that I· coli appears to
accommodate to the metal by exclusion of the ion from the cell and by
cellular reversal of any damage generated by prior exposure to the ion.
Bissonnette et ~- (65) studied the influence of various environmental
stresses on the indicator bacteria from natural waters. They observed
that a substantial portion of the total coliform population may be
physiologically injured by an assortment of stresses.

23
The nature of the damage the bacteria experience depends on the
types of environmental stress the organism is exposed to. The exact
characteristics of the damages are not well understood. The available
literature along these lines is quite limited and is concerned mainly
with disinfectants and related chemical agents. Some of the possible
means of damage leading to populations of stressed organisms include
(1):
a. Interference with the cell wall integrity.
b. Action against covalent bonds.
c. Disruption or loss in integrity of the cytoplasmic membrane.
d. Action upon cell protein.
e. Interferences with enzyme activity.
f. Interferences with polymerases.
All the environmental factors causing stress in organisms
probably act in one or more of these manners. More work is warranted
along these lines.
Laboratory procedures may also be responsible for stressed
organisms. Such things as excessive sample transit time, extended
holding times in dilution water, types of dilution water, rapid
changes in environmental temperatures, and improper media formulations
may cause stress on the organisms. Precautions must be taken to
avoid such stress conditions.
24
Heavy Metal Stress in Parking Lot Runoff
The major constituent of street and parking lot surface
contaminants has been consistently found to be inorganic mineral-
like matter quite similar to common sand and silt (66). Most of this
material is blown, washed, or carried in from nearby land areas. A
small amount of organic matter is also usually found. Other
constituents of the surface contaminants include heavy metals,
various inorganic nutrients, oil and grease, small quantities of
pesticides, and microorganisms, including both fecal and non-fecal
coliforms (66,67). The heavy metals, plus some of the other
constituents of runoff, can create subpopulations of stressed
coliforms.
Significant amounts of heavy metals have been detected by
numerous investigators in surface contaminants of streets and parking
lots. Satar et tl· (66} found z.inc and lead to be the most prevalent
metals, followed by copper. Other reports listed the highest
concentrations of metals to be iron, lead, manganese, and zinc (68}.
The main source of the lead found on street and parking lot
surfaces is combustion of leaded gasoline by motor vehicles. Lead is
added to gasoline as alkyl lead compounds to improve the fuel 1 s
antiknock quality. In 1965, it was estimated that the annual motor
vehicle exhaust of lead in North America was around 240,000 tons (69).
Assuming deposition of 50 percent of this on the roadbed, and assuming
all of this is carried off in runoff waters, the average concentration
of lead in street runoff would be a significant 0.23 mg/l (70). Actual

25
concentrations on heavily-traveled roadsides have been found to be
much greater (70). Zinc and cadmium on street and parking lot
surfaces are derived mainly from motor vehicle tires and oil (71).
Zinc levels in street and parking lot runoff waters are often
relatively high (66,71), whereas cadmium levels are generally low (71).
The presence of chromium and copper levels are generally from wear on
various parts of motor vehicles. Their concentrations are generally
relatively low (66). Other heavy metals that may be present in low
quantities include nickel from nickled gasoline and nickel-containing
automotive parts (71), magnesium from parts (68), and iron in the form
of rust from the vehicles.
The volume and type of traffic moving over the streets or
parking lots has an effect on the kinds and amounts of contaminants
present (68). Logically, more contaminants will occur on crowded
parking lots than on rural roads. The nature of the road material is
also important. Satar et ~· (66) found that asphalt surfaces had
up to 80 percent greater contaminant loadings t~an concrete surfaces.
The surface physical conditions also exert an influence. Higher
contaminant loadings are generally found on poor surfaces as compared
to good surfaces (68). Other factors of importance concerning the
quantities of surface contaminants in runoff waters are the quantities
of air pollution fallout (68), the intensity and duration of the storm,
the length of the antecedent dry period, and the management practices
of the public works department (72).

26
Modified Tests for Stressed Coliform Recovery
Since the realization that various environmental factors can lead
to subpopulations of stressed coliform organisms, studies have been
carried out to develop modified methods for their detection.
Bissonnette et~· (65) reported that prolonged exposure of£_. coli
to certain aquatic environments often resulted in a substantially
lower amount Qf recovery when differential media as opposed to rich,
non-selective media were used for culturing. He reported that this
nonlethally injured subpopulation was capable of recovering from
injuries if exposed to a rich, non-selective broth before being
placed on the harsh, selective media. Exposure to non-selective broth
supposedly allows the organisms to repair cellular damage and
subsequently multiply, whereas direct exposure to the secondary stress
of the selective medium causes many of the injured cells to die.
The presumptive enrichment of the MPN procedure allows for such
a period of repair and minimum stress. This fact, plus the built-in
statistical bias of the MPN, probably account for the high numbers of
coliform recovery at elevated temperatures with this method as
compared with the standard membrane filter test (73). Application of
enrichment techniques to improve the recovery of indicator organisms
in the MF technique has been advocated by several researchers (48,52,
73,74). Rose and Litsky (74) employed a technique of incubating
membrane filters on an absorbent pad containing an enrichment medium.
This pad was placed over a base layer of selective agar. Cell
recovery was reported to occur before the selective ingredients
27
diffused from the base agar to the membrane. Lin (52) found that the
two-step enrichment LES membrane filtration method significantly
improved recovery of coliforms from chlorinated secondary sewage
treatment plant effluents when compared to the standard, one-step
method. Hartman et~- (75) extended the studies of Rose and Litsky
(73) by developing a method of using a base agar and a violet red
bile (VRB) agar overlay, thus permitting direct-plating. Work by
Speck et~- (76) showed that repair on trypticase soy agar (TSA),
followed by a subsequent VRB agar, generally provided for increased
coliform enumeration by allowing for repair of the injured subpopulation.
Bissonnette et~- (77) recently compared several existing recovery
methods for coliforms by applying their membrane filter chamber
technique. They found that a two-hour enrichment on a rich, non-
selective medium prior to exposure to selective media led to greater
recovery of fecal coliforms with the MF technique. Substantially
greater recoveries of fecal coliforms from raw sewage suspensions
and of _g_. coli from pure-culture suspensions were observed when
compared to values obtained by direct exposure to selective media.
Recently, Rose et~- (73) proposed a membrane filter technique
involving two layers of agar. This technique minimized the inherent
limitations of enrichment techniques, which include the need for more
time, equipment, and manpower, and the greater possibility for
contamination. The use of this two-layer procedure permits the
culture to recover from injury as the selective agar constituents are
diffusing into the enriched medium on which the organisms are growing.

28
The base medium in this technique is M-FC broth plus l .5 percent
agar. Five milliliters of this medium are added to a SO-mm-diameter,
tight-fitting Petri dish and allowed to harden at room temperature.
Then, two milliliters of lactose broth plus 1.5 percent agar are
pipetted on top of this layer. The reason for the controlled
thickness of the agar is that it has been shown that fecal coliform
recovery may be a function of agar thickness (55). The ingredients
of the two-agar medium will eventually diffuse into each other. This
fact provides for the automatic shift of the culture contact from the
enrichment medium to the selective medium. It also requires that the
two-layer plates be prepared within one hour prior to use. The
technique provides for repair and elevated temperature growth to be
confined to a single Petri dish, thus avoiding unnecessary handling
and possible contamination. Rose and his coworkers also incorporated
the use of a two hour incubation at 35°C to allow for optimum growth
and repair prior to a temperature increase to 44.5°c for 22 to 24 hours
to achieve the necessary selectivity. Their preliminary results showed
significant increases in coliform recovery through the use of this
technique. Litsky (78) has suggested that the methodology of Rose et
al. be broadened to include his research on a 5 hour preincubation
period at 35°C, followed by 18 hours at 44.5°c.
III. MATERIALS AND METHODS
The objective of this study, as stated in the introduction,
required the implementation of several different methods and procedures
for data collection. Analyses performed included the standard MPN and
MF fecal coliform enumeration procedures, a modified membrane filter
technique for stressed fecal coliforms, and tests for the heavy metal
concentration of cadmium, copper, chromium, iron, lead, and zinc.
Description of Study Area
Since the main objective of this study was to compare three methods
for fecal coliform enumeration in urban storm water runoff, only one
study site was needed. The nature of this research project did not
necessitate determinations of all constituents of runoff, nor was there
a need to collect samples from sites of varying characteristics. The
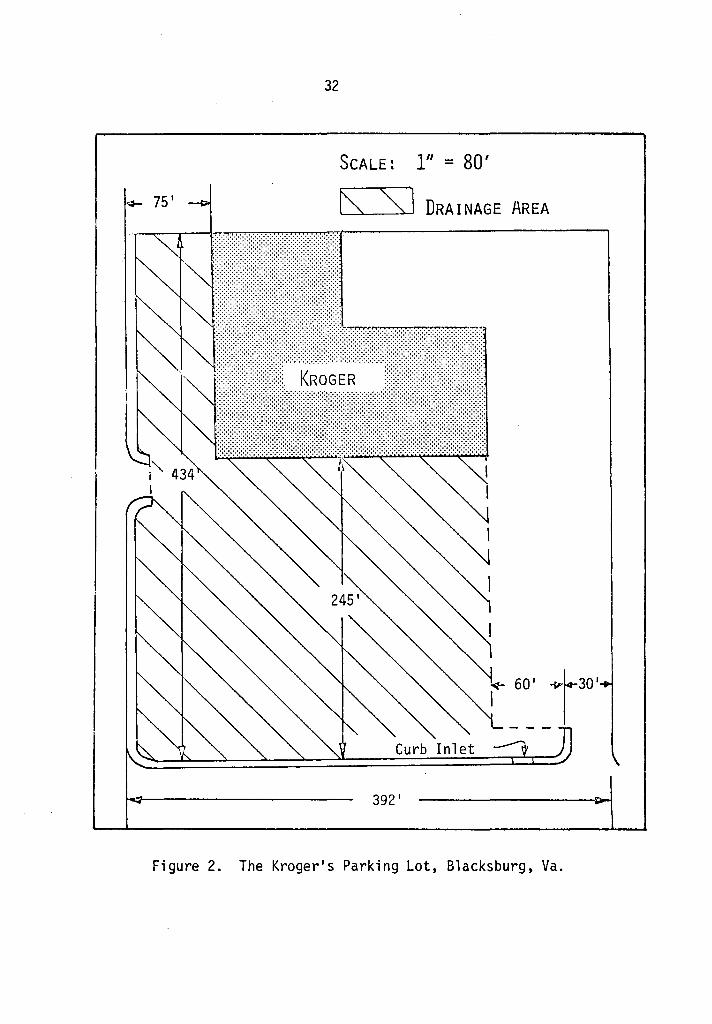
site that was chosen for study was the parking lot of the Kroger
grocery store in Blacksburg, Virginia. This site was chosen for
several reasons, including its intensive use, well-defined drainage
area, and good physical condition. The site is a high density parking
lot with 239 spaces. It has a parking density of about 4.5 cars per
space day (67). This density may vary significantly with the seasons
of the year. The volume of traffic in the parking lot during the
summer months is lower than during the fall and winter due to the
reduced student population at Virginia Tech. The lot has an asphalt
concrete pavement and is in good condition. The total drainage area
of the site is 86,257 square feet. Of this, 79,306 square feet, or
29

30
92 percent is impervious (67). A map showinq the location of the study
site is exhibited in Fiqure 1, and a diagram of the site is shown in
Figure 2.
Sampling Procedures
Twelve trials were made between May 25, 1977, and June 28, 1977.
Samples were collected at the curb inlet in half-gallon plastic
containers. Samples for heavy metal determination were decanted into
500-ml polyethylene bottles that had been washed sequentially with the
following cleaning agents: Tap water plus detergent, 1:1 nitric acid,
tap water, 1:1 hydrochloric acid, tap water, and deionized distilled
water {79). These bottles contained 0.5 ml of concentrated nitric acid
to reduce the sample pH to approximately 2. Samples for coliform
enumeration were decanted into 500 ml polyethylene bottles previously
washed sequentially with the following cleaning agents: Tap water plus
detergent, tap water, and deionized distilled water.
Rainfall data was acquired from the Virginia Tech Department of
Agricultural Engineering. This data was collected at their station
0.3 miles from the Kroger lot. An attempt was made to collect samples
at more than one point on the storm hydrograph when practicable.
Heavy Metal Analysis
The quantities of extractable metals in the sample were determined.
A 100-ml well-mixed sample was acidified with 5 ml of redistilled,
concentrated nitric acid. The solution was heated for 15 minutes on a
Corning Type PC-351 hot plate. The sample was then allowed to cool and

\ ,.·
_ .. )--/
;·· ~
31
..
·'
'\JI ~.>·_ ... ~,: J •, •/ /\:
~.· ~
...::.-~-
,~/ \,~)
Figure 1. Location of Study Site, Blacksburg, Virginia.
32
SCALE: l" = 80' ~ 75' t\ s j DRAINAGE AREA
Figure 2. The Kroger's Parking Lot, Blacksburg, Va.

33
was filtered through a Millipore Type HA 0.45 µm membrane filter.
The sample was then diluted to its original volume by the addition of
deionized, distilled water. The sample was stored in a clean acid-
washed polyethylene bottle until it was analyzed. The analysis was
carried out using a Perkin-Elmer Atomic Absorption Spectrophotometer
Model 403. Two samples consisting of distilled water plus nitric acid
were run as controls to check the adequacy of the acid washing
procedure in cleaning the sample containers.
Coliform Enumeration
A set of serial dilutions was made with the sample for fecal
coliform enumeration. Due to its desirable characteristics (80,81,82),
distilled water plus 0.1% peptone was used as the dilution water. Milk-
dilution bottles containing the dilution water autoclaved at 121 osi for
15 minutes to orovide a final volume of 99 ml were prepared. Dilutions
made from the original sample ranged from 1:10 (10-1) to 1:10,000 (10-4).
A five-tube MPN procedure was employed. Inoculations were made
from the serial dilutions of the original sample into tubes containing
10 ml of lauryl tryptose broth (BBL) and an inverted Durham tube.
Dilutions made were 10° to 10-4. This constituted the presumptive test
for the fecal coliforms. The tubes were incubated at 35°C in a Napco
Model 330 incubator for 48 hours. At the end of this period, those
tubes exhibiting growth and gas production were recorded as positive
in reaction. Transfers were made from these positive tubes to tubes
containing 10 ml of EC broth (BBL) and an inverted Durham tube. These

34
tubes were incubated in a GCA Precision Scientific circulating water
bath at 44.5°C for 24 hours. Growth with gas production at the end of
this incubation period constituted the confirmed test for fecal
coliforms. Statistical tables found in Standard Methods (5) were then
used to determine the fecal coliform concentrations.
In addition, samples were analyzed by the standard membrane filter
technique (MF) for fecal coliforms. A device was designed in the
laboratory for preparing six samples simultaneously (Figure 3). Gelman
magnetic filter funnels (47 mm) and 47 mm Millipore Type HC membrane
filters (2.4 µm surface openings, 0.7 µm retention size) were used. The
volume of the sample filtered was 10 ml in all cases. There were four
replicates of each dilution in trials one through seven. Three 10-ml
replicates were made in trials seven through twelve. Distilled water
was used to thoroughly wash down the sides of the filter apparatus when
the samples were filtered and between filtrations. At least two
membrane filters per trial were prepared by filtering the distilled rinse
water. These filtrations established controls to test the adequacy of
this wash in preventing contamination of subsequent filters. The filter
apparatus was exposed to UV light for 10 minutes between sample trials.
After filtration, the filter membranes were transferred to tight-
fitting 50 mm-diameter Petri dishes containing 5 ml of M-FC medium
(BBL M-FC broth plus 1.5% Difeo agar plus 1% MCB rosolic acid in 0.2
N NaOH). Aseptic techniques were employed at all times. The Petri
plates were then placed in water-tight Nasca Whirl-Pak plastic bags,
put in racks in the 44.5°C circulating water bath, and incubated 24

Gelman Magnetic Filter Funnel Apparatus {6 in series) :::>!
Rubber Stopper-
~ : ..... .
500 ML Flask
Individual 2-Way Stopcocks (one for each funne 1 ) --------.
Rubber Stoppers-~
Non-Co 11apsab1 e Tygon Tubing ---
Figure 3. Membrane Filter Apparatus
Cotton-
Stopcock for System Pressure Rele7
~·
Stuf fed Clean Air Filter --
w U'1

36
hours. At the end of this period, plates from the dilution yielding
counts closest to a range of 20 to 60 blue-colored colonies per plate
were enumerated using a 15-power Bausch and Lomb dissecting microscope,
a fluorescent light source, and a hand counter.
The stressed organism membrane filter technique described by
Rose et~· (73) was also employed. The methodology was essentially
that described for the standard MF technique. In this test, there four
replicates of each dilution for the first seven trials and three
replicates for the remaining trials. Five milliliters of M-FC medium
were added to a 50 mm-diameter tight-fitting Petri dish and allowed
to solidify at room temperature. Two milliliters of lactose broth
(BBL), containing 1.5 gm of agar per 100 ml were then pipetted as a
second layer onto the base agar. This overlay was added within one
hour prior to use. After filtration, the membrane filters were placed
on the media and were incubated for five hours at 35°C. This incubation
period has recently been proposed by Green, et~- (78), and was used
in preference to the 2 hour incubation period used by Rose and his
associates (73). Some tests were performed, however, to compare the
5-hour and 2-hour techniques. Both methods were used in trials seven
through twelve. After this 5 hour period, the plates were placed in
the water-tight plastic bags and incubated in the 44.5°C circulating
water bath for 19 hours. At the end of this period, the fecal coliform
concentrations were determined in the same manner employed in the
standard MF technique. The entire laboratory protocol is shown in
Figure 4.

37
Runoff
~O. Sajle ·Or-·\ 5-Tube MPN <J--- ~ ~ L/
Incubate 44.5 c (24 hrs)
...
~7 Seria1 Di1utions
Heavy Meta1 Ana1ysis
~m~ ~Fqi~ [, ~mw )ti • , -
Incubate 35 c \5 hrs) 44.5 c l19 hrs)
Figure 4. Protoco1 for Standard Membrane Fi1ter-Modified·MF-MPN Comparisons and Heavy Meta1 Analysis.

38
It has recently been suggested by Presswood et ~· (83) that
eliminating rosolic acid from the M-FC medium improves the M-FC
procedure by allowing higher fecal coliform recoveries with greater
ease in counting. To examine this idea, three replicate plates per
dilution were prepared without rosolic acid in trials eleven and
twelve. Verification of fecal coliform colonies isolated in the two
MF techniques was performed by subculturing a percentage of the blue
colonies into lauryl tryptose broth for 48 hours at 35°C. Tubes
exhibiting growth and gas production at the end of this period were
again subcultured to EC broth and incubated at 44.5°C for confirmation.
In trials seven through twelve, the colonies were subcultured directly
into EC broth and incubated at 44.5°C.

IV. RESULTS OF STUDY
Overview
During eight rainfall events, a total of twelve runoff samples
was collected and analyzed for fecal coliforms by several techniques.
The samples were also analyzed for selected heavy-metal concentrations.
In this section, the rainfall data and metals concentrations
corresponding to the monitored rainfall events are presented. Also
presented are the coliform data obtained by the various recovery
procedures and a statistical analysis designed to determine if the
recovery procedures gave significantly different results. Comparisons
made include:
1) the standard MF method with the modified method involving a
five-hour preincubation period at 35°c. The latter will be
referred to as the "M-5hr 11 method.
2) the standard MF with the modified method involving a two-hour
preincubation period at 35°C. The latter will be referred to
as the 11 M-2hr 11 method.
3) the M-2hr method with the M-5hr method.
4) the M-5hr method with the MPN method.
5) the M-2hr method with the MPN method.
6) the standard MF with the MPN method.
An attempt was made to correlate the observed densities in
recoveries by the various techniques with other environmental conditions,
and those results are also presented.
39

40
Rainfall
The twelve runoff samples were collected during the period from
May 25 through June 28, 1977. Rainfall data for this period (Table I)
were obtained from the Department of Agricultural Engineering at VPI & SU.
The rainfall events varied greatly in intensity and duration. The
rainfall intensity calculations for each date were based on the total
elapsed time from the beginning to the end of the rain on any given date.
The times when samples were collected during the storm varied for each
storm, and samples represented different stages on the hydrograph. On
one date, samples were taken that represented early, middle, and late
points on the hydrograph. The times of sample collection and their
relationship to the hydrograph for each event are shown in Table II.
As can be seen, the length of time between rainfalls varied from 4.4
hours to 462.4 hours. The elapsed time since the previous rain of at
least 0.03 inches was used for these determinations because 0.03 inches
has been mentioned as the amount of rain required to initiate runoff (67).
Fecal Coliform Determinations
Recovery data. Mean coliform concentrations, expressed as
organisms per 100 ml, were determined by analysis of the samples by
each MF technique. These data are presented in Tables III and IV. The
MPN's for these samples, obtained by the multiple fermentation technique,
are presented in Appendix Table A-1. Actual MF plate counts and
standard deviations for all replicate tests are presented in Appendix
Tables A-II through A-IV. The standard deviations, in most cases, were
relatively large.

41
TABLE I
Characteristics of Rainfall During the Study Period
Intensity Duration Total Rain Date (In/Hr) (Hours)* (Inches)
May 5 0.027 8.45 0.23 May 22 0.013 0.75 0.01 May 24 0.048 0.42 0.02 May 25 0.019 18.13 0.35 May 26 0.007 9.72 0.07 May 29 l .279 1. 72 2.20 May 30 0.014 3.58 0.05 May 31 0.303 1.88 0.57 June l 0.097 1.03 0.10 June 2 0.009 1.08 0.01 June 6 0.030 13 .45 0.41 June 8 0.020 5.00 0.10 June 9 0.048 7.30 0.35 June 12 0.010 5.87 0.06 June 14 0.062 5.63 0.35 June 15 0.267 0.75 0.20 June 16 0.062 0. 16 o. 01 June 17 0 .171 8.13 1.39 June 20 0.008 8.00 0.06 June 22 0 .051 9. 17 0.47 June 23 0. 121 4.05 0.49 June 24 0.035 15.67 0.55 June 25 0.003 13 .13 0.04 June 27 0.024 1.25 0.03 June 28 0 .015 6.58 o. 10
*Elapsed time from initial rain to end of rain on date, yielding an average overall rainfall intensity.

42
TABLE II
Sample Collection Times During Monitered Storms
Date
May 25
May 31
June 6
June 22
June 23
June 24
June 25
June 28
Begin Rain
0:45b
21:00
3:55
11: 35
4:07
4 :10
0: 15
13:40
End Rain
19:23
22:53
17: 32
20:45
8:10
19:50
13: 23
20: 15
Time Since Sample Collection Previous Raina
Times (Hours)
8:00 462.4 9:30
9:00c 6.8
4:30 124.0 5:40 6:50
14: 10
13: 30 12.6
8:45 7.4
11 :05 20.0
13:05 4.4
16:00 24.3
a Elapsed time since previous rain of at least 0.03 inches.
bAll times based on a 24-hour clock.
c Sample collected day after storm from water remaining along storm curbing.

Trial Number Date
43
TABLE II I
Fecal Coliform Concentrations in Runoffa Detennined During the Study Period
Concentration (FCllOO ml} Ratio Std. MFb Mod. MFc MP Nd Mod. MF:Std. MF
1 May 25 (#l)e 15,300 191 ,000 220,000 12.5:1 2 May 25 (#2) 8,800 83,000 110 ,000 9.4:1 3 May 31 3,900 30,000 35,000 7.7:1 4 June 6 (#1) 2,800 33,600 11 ,000 12.0:1 5 June 6 (#2) 7,200 400,000 17,000 55.6:1 6 June 6 (#3) 6,000 199,000 35,000 33.2:1 7 June 6 (#4) 1,040 11 ,900 5,400 11.4:1 8 June 22 1,000 6,900 7,900 6. 9: 1 9 June 23 2,600 9,400 9,200 3. 6: 1
10 June 24 3,000 7,400 13,000 2. 5: 1 11 June 25 5,900 17,400 24,000 3.0:1 12 June 28 1,600 8,300 9,400 5. 2: 1
aRunoff from the Kroger parking lot, Blacksburg, Va.
bstandard membrane filter technique, as described in Standard Methods (5).
cModified membrane filter technique, with 2 ml lactose agar overlay and 5 hour preincubation at 35°c.
dMost probable number technique.
eNumbers in parenthesis represent trials at different times on a given date.

Trial Number
8
9
10
11
12
aRunoff
Date
June 22
June 23
June 24
June 25
June 28
44
TABLE IV
Fecal Coliform Concentration in Runoffa Determined Using Alternate Methods
Ratio Concentration (FC/100 ml) 2 Hr. Mod. MF
---.::..,:b~.::..:..;c..:-'--'-.;....;.._.;..;._....__,__c '"---<-----.-d : Std . MF Std. MF 2 Hr. Mod. MF Std. MF-R.A.
1 ,000 1,900 Not Run 1. 9: 1
2,600 3,400 Not Run 1. 3: 1
3,000 5,000 Not Run 1. 7: 1
5,900 8,800 7,000 1. 5: 1
1,600 3,800 1,700 2.4:1
from the Kroger parking lot, Blacksburg, Virginia. bStandard membrane filter technique.
cModified membrane filter technique, with 2ml lactose agar overlay and a 2-hour preincubation at 35°c.
dStandard membrane filter technique minus rosolic acid.
45
Graphical comparisons of the data. Recoveries by the various
techniques for fecal coliform determinations are graphically compared in
Figures 5-7. In each determination, the modified technique for stressed
organisms resulted in greater recoveries than the standard MF procedure.
Figure 8 shows the effects of increasing the preincubation period, which
is part of the modified technique, from two hours to five hours. As
can be seen, the recoveries when the five-hour period were used were
higher in all instances.
Figure 9 shows a comparison of the recoveries of the three
membrane filter techniques to the MPN data. This type of graphical
comparison was adopted from Green et~- (78). It can be seen from this
graph that the fecal coliform recoveries using the M-5hr technique
closely approximated the MPN 1 s recorded for most all trials. Recoveries
with the standard MF and M-2hr techniques were consistently lower than
the MPN values.
The differences in recovery by the various methods, expressed
both as logarithms and as percentages, are shown in Table V. The
technique that consistently produced the lowest recoveries, the standard
MF technique, was used as the basis for comparison.
In two trials, M-FC medium without rosolic acid was prepared and
used in parallel with the other techniques. The recoveries obtained
using this medium did not appear to vary greatly from the standard MF
recoveries (Table IV). The actual plate counts for this procedure are
presented in Appendix Table A-V.

__J :£ 0 0 ,...... s... Q)
c... .µ s::: ~ 0 u E s... 0 4-•r-..-0 u ..-It) u Q)
LL.
~
10'
104
, 1 o·
'-
-1--
46
r===J Modified MF Technique
ftt~\l Standard MF Technique
1. 91 I- ...--
._
._
.....
..... '-
.... .__
._
._
,_ .... ..... ..... ..... ..... '-
I-
.....
Trial 1
:~::::::~'.:
•••••••••••••
••••••••••••• Trial 2 Trial 3
2.8 ~
••••••••••••
Trial 4
4.0 -
7.2 7.w I
Trial 5
1. 99 -
. ...
••••••••••••• Trial 6
Figure 5. Comparisons of Fecal Coliform Recoveries from Kroger Parking Lot Runoff (Following Several Storm Events) Using the Standard Membrane Filter (MF) Technique and a Modified MF Technique Requiring a Five Hour Preincubation Step.

--------
c==J Modified MF
Tif}}] Standard MF
47
1. 74
_J
~ 4 lJ.9 0 10 ~4 8.3 0 -.-s.. OJ
0..
.µ s::: :::::l 0 u E s.. 0
'+-.,.. .-0 u .-ro u Q)
u..
--------
103 -I-------
7.4 -
2.6
;w 3.0
••••••••••••
••••••••••••
••••••••••••
-
;: t [ l ll ::::~ :·:·:_: .• ::··:_ •. ·:_.: .• :_.·:_···:·:_:.:_.::.:.·:•.·::•.:. •• . •• ••• . •• • ••••••••••• 2 ·:·:·:·:-:-: ...... :-:-:-:-:·: :·.::::.:: .. _:.::::.::::._::: .. : 10 }}} \}} ;:::::::;:: ;:/:} '---'-~~......._~_._--'"'-'-'-'"'"""-~L.---L.~"---'-~..J.:.:..:..:.:.:.&.~-'-----'C..:...:..:...:..:....1--~L----.l.!.'-'-'-.L..I
-
Tri a 1 7
Figure 6.
Tria1 8 Trial 9 Trial 10 Tria1 11 Trial 12
Comparisons of Fecal Coliform Recoveries from Kroger Parking Lot Runoff (Following Several Storm Events) Using the Standard Membrane Filter (MF) Technique and a Modified MF Technique Requiring a Five Hour Preincubation Step.

_J :;::: 0 0 .-s... (lJ
0..
+-' s:: :J 0 u E s... 0 4-...... r-0 u r-<tl u (lJ
u..
48
104.--~~~~~~~~~~~~~-=--::-~~~~~~~ ...... : 0Modified MF (2 hr) ~ : l;?()] Standard MF
- li
------.....
Trial 8
3. 4 . 2.6 T7::
••••••••••••• ............
5
3.0 ~:~~}~~:~~ ·:-:-:-:-:-:
••••••••••••
1. 6 <<<
•••••••••••••
·•••••••••••• /
IE t ••••••••••••·
·:-:-:-:-:-:-
••••••••••••
Trial 9 Trial 10 Trial 11 Trial 12
Figure 7. Comparisons of Fecal Coliform Recoveries from Kroger Parking Lot Runoff {Following Several Storm Events) Using the Standard Membrane Filter (MF) Technique and a Modified MF Technique Requiring a Two Hour Preincubation Step.

!-. Q)
CL
.µ s:: ::I 0
u E !-. 0 4-..... ,...... 0 u ,...... I'd u Q)
LL.
104
49
~ D Modified MF (5 hr) ...... ._ (//fl Modified MF {2 hr)
--I-
--I-
--1--
6.9 n I
3.4 :::::::::::
:::::::::::: . -:-:-:-:-: ::::::::::::
l. 74 .-
8.3 -~;~.
•••••••••••••
3.8 :-;.;.;.;.:-; ....... ·.· ... ...... :-:-:-:-:-:-:
•••••••••••••
<<Y ....
:.:.:·:-:-:· <·:-:-:·:-: ·.·.-.·.·.·, ·::::.:::::::
•••••••••••• •••••••••••• ••••••••••••• /}
l02~--'--~~i;1~•[~•1~-J..----i:~i~i~·~~-'--~·:~!llli~i·l"~·~"---1'.:.:.:.:..:..:.L---'----J~::::~::~::~:::L--~ Trial 8 Tria 1 9 Trial 10 Trial 11 Trial 12
Figure 8. Comparisons of Fecal Coliform Recoveries from Kroger Parking Lot Runoff (Following Several Storm Events) Using the Modified MF Technique Requiring a Two Hour Preincubation Step and a Modified MF Technique Requiring a Five Hour Preincubation Step.

(/)
-0 0
:5105 ClJ
::E:
_J ::E: 0 0 .--
~ 104 0.. .µ c ~ 0 u E s... 0 4-
~ 103 u
'° u QJ
LL..
50
() Standard MF Method 6 Modified 5-Hr MF Method ~
0 Modified 2-Hr MF Method
0 0
Fecal Coliform Count Per 100 ML (MPN Method)
Figure 9. Comparison of Fecal Coliform Recoveries from Kroger Parking Lot Runoff Using Three Membrane Filter Techniques to the MPN Technique.

51
TABLE V
Log and Percent Differences in Fecal Coliform Recoveries by Various Techniquesa
Trial MP Nb Modified MF{5hr)c Modified MF{2hr)d Number t. log t.percent t.log t.percent t. log t.percent
l.278e l338e 1.263 1148 Not Run
2 l. 279 1150 l .249 843 Not Run
3 l. 265 797 1.248 669 Not Run
4 1 . 171 293 1 . 313 1100 Not Run
5 l .096 136 l. 451 5456 Not Run
6 1. 201 483 1. 402 3217 Not Run
7 1.235 419 1. 351 1044 Not Run
8 1.300 690 1.280 590 1.093 90
9 1.161 254 1. 164 262 1.035 31
10 l . 181 333 1.112 147 1.063 67
11 1. 162 307 1. 125 195 l. 045 49
12 l. 241 488 1.225 419 1.119 138
aUsing the standard membrane filter concentrations as basis for compari-son.
bMost probable number technique.
cModified membrane filter technique with 2 ml lactose agar overlay and 5 hour preincubation at 35°c.
dModified membrane filter tschnique with 2 ml lactose agar overlay and 2 hour preincubation at 35 C.
ePositive numbers indicate recoveries greater than those by the standard membrane filter technique.

52
Statistical analysis of the data. The various analytical
techniques for coliform recovery were compared statistically using the
paired-t test (84). Appendix Tables B-I through B-VI show the actual
comparisons. The results of these comparisons are summarized in
Table VI.
Colony verification. One hundred and eighty nine colonies
observed on the membranes used in the modified MF technique were
verified (Table VII). Of these, 178 (93.7 percent) were confirmed as
fecal coliforms. The standard deviation was 7.2 percent.
Heavy Metal Determinations
The concentrations of heavy metals in runoff varied greatly
throughout the study, but, in most cases, they were low, rarely
greater than 0.5 mg/l. The metal concentrations are presented in
Table VIII.
Comparison of Recoveries to the Environmental Conditions
An attempt was made to determine if any correlation existed
between the stresses suffered by coliforms present on the parking lot
and 1) heavy metal concentrations in the runoff or 2) time between rain-
fall events. In this analysis, the ratio between the numbers of
coliforms observed by the modified and standard MF techniques was used
as the indicator of stress.
A plot of the ratio between the two coliform-recovery methods and
four of the six metals monitored is shown in Figure 10. Cadmium and
chromium were present in essentially insignificant concentrations and,

53
TABLE VI
Statistical Comparison of the Various Techniques for Fecal Coliform Recovery
Number of Samples Statistical Comparison Compared Comparison
Standard MF with M-5hr 12 M-5hr > Std MF
Standard MF with M-2hr 5 M-2hr- > Std MF
M-2hr with M-5hr 5 M-5hr > M-2hr
M-5hr with MPN 12 M-5hr > MPN
M-2h with MPN 5 MPN > M-2hr
Standard MF with MPN 12 MPN > Std MF
Level of Significance
0.025
0.01
0.005
0.20
0.01
0.05

Trial Number
1
2
3
4
5
6
7
8
9
10
11
12
Total
54
TABLE VII
Verification of Fecal Coliform Colonies From the Modified MF Technique
Colonies Colonies Examined Verified*
20 20
20 19
25 24
15 15
15 14
15 15
15 13
12 9
12 11
12 11
12 12
16 15
189 178 Stnd.
Percent Verification
100
95
96
100
93
100
87
75
92
92
100
94
Mean 94 Dev. 7.2
*Colonies were subcultured to lauryl tryptose broth (35°C; 48hrs) and then to EC medium (44.S 0 c; 24hrs) in trials 1-7. Colonies were subcultured directly to EC medium in trials 8-12.

55
TABLE VIII
Metal Concentrations in Runoffa During the Study Period
Trial Concentration (mgLl} Number Cd Cr Cu Fe Pb Zn
1 0.01 0.03 0.28 0.78 0.22 0.37
2 0.01 0.03 0.27 0.28 0.23 0.51
3 0.01 0.01 1.09 0.69 0.63 4.00
4 0.01 0 .01 0.02 0.25 0. 21 0.26
5 0.01 0 0.03 0. 12 0 .12 0.25
6 0 0.01 0.02 0.18 0 .18 0. 19
7 0 0.01 0 0.33 0 .15 0. 18
8 0.01 0 0.03 1.06 0.50 0.51
9 0 0 0.01 0. 14 0.07 0.07
10 0 .01 0.01 0 0.16 0.07 0.09
11 0.01 0 .01 0.01 0.40 0.15 0.14
12 0.01 0 0.12 l.55 0.60 0.40
Blank #lb 0 0 0 0.01 0 0
Blank #2b 0 0 0 0.04 0 0.04
aRunoff from the Kroger parking lot, Blacksburg, Virginia.
bDistilled water plus Sml concentrated nitric acid carried through the extraction process.

"'C s... re
"'C c: re .µ I/)
-
-
0
56
0
O Lead 6 Zinc D Copper O Iron
Metal Concentrations (mg/l)
Figure 10. Comparison of the Modified MF (5 hr): Standard MF Fecal Coliform Recoveries to Metal Concentrations in Runoff Following Several Storm Events.

57
therefore, were not considered. As can be seen, there is no
consistent relationship apparent. A comparison of the ratio to the
time since the previous rain for the eight storm events is shown in
Figure 11. Again, there was no obvious relationship that might be used
to explain the variations in the ratio, which has been assumed to be
a valid way of expressing the extent of stress the coliforms received
prior to their collection and analysis.

58
100 200 300 400 500 Time Since Previous Storm (Hours)
Figure 11. Comparison of the Modified MF (5 hr): Standard MF Fecal Coliform Recoveries to the Time Since the Previous Storm Event of at Least 0.3 Inches.

V. DISCUSSION OF RESULTS
Fecal Coliform Determinations
Recoveries by the various methods. Fecal coliform densities in
runoff varied greatly with each rainfall event, as well as in runoff
collected at different times during the same event. In each trial,
however, the mean fecal coliform count per 100 ml determined with the
modified MF (M-2hr) technique was greater than the recovery by the
standard MF technique. The mean of all M-2hr trials was significantly
greater at the 0.01 level. The ratios of M-2hr to standard MF counts
ranged from 1.3:1 to 2.4:1. The average ratio for five samples
(Table IV) was 1.8:1, with a standard deviation of 0.4:1. Rose et al.
(73), who introduced this modified method in their paper, reported
ratios of l .1:1 to 1.3:1 in runoff. In various other waters, these
workers found ratios of up to 38:1. The source and nature of their
runoff samples were not specified, so it is difficult to compare their
results to those of this study. It is clear, however, that subpopulations
of stressed fecal coliforrns existed in both their study and this one
and that the M-2hr method was of some value in improving the recovery
of these organisms. Both the use of an overlay of enriched agar and
an acclimation period at 35°c prior to the incubation at 44.5°c appear
to provide suitable conditions to permit recovery from stress and
subsequent multiplication of injured fecal coliforms.
Lengthening the 35°C preincubation time in this double agar
modified method to five hours (M-5hr) resulted in even higher recoveries.
The mean population observed by the M-5hr method was statistically
59

60
greater at the 0.025 level than that observed when the standard MF
technique was used. Ratios of recoveries by the M-5hr method to those
by the standard MF method (Table III) ranged from 2.5:1 to 55.6:1.
The average ratio for 12 samples was 13.6:1 but the standard deviation
of 15.6:1 was quite high. No other reports have been located in which
this M-5hr method has been studied. Green et ~- (78) proposed and
evaluated a method employing a five hour preincubation at 35°c. They
found this step to be valuable in recovering stressed fecal coliforms.
However, those investigators did not use the two-layered agar; standard
M-FC agar was used instead. The present study has combined the
favorable aspects of a nutrient-rich agar overlay and a five-hour
preincubation period. The resulting M-5hr method yielded a mean fecal
coliform count statistically greater than that of the M-2hr method at
the 0.005 level, indicating the worth of the longer preincubation
period.
It should be noted that there was a tremendous range of ratios
when the M-5hr method was compared to the standard MF method (2.5:1 up
to 55.1:1). This variation appears to indicate that the stress
conditions were much greater at certain times, yielding the higher
ratios.
One factor associated with the length of this preincubation that
possibly can complicate enumeration of fecal coliforms is the growth of
other types of organisms. Green and her associates (78) found that
preincubation periods exceeding five hours resulted in excessive
background growth and spreading. In the study reported in this thesis,

61
an increase in non-fecal-coliform organisms was noted when both the
modified MF methods were evaluated. In a few instances, the background
growth actually interferred with the enumeration of the fecal coliforms,
and this problem may prove to be one of the factors that will
limit the use of the M-5hr method in waters containing high densities
of other bacteria. Green and her associates also noted that
preincubation periods exceeding five hours caused a significant decrease
in the number of colonies identified as coliforms that actually confirmed
to be coliforms when transferred to lauryl tryptose broth.
In seven out of twelve instances the MPN technique yielded the
greatest mean coliform concentration when compared to the other methods.
In the other five trials, the M-5hr technique gave the greatest
recoveries. When the 95 percent confidence range of the statistically-
based MPN technique is considered in this comparison, however, (Appendix
Table A-I), these two techniques compare relatively well. Only on two
trials (numbered five and six), when the M-5hr data seemed to be unusually
high, did the M-5hr data fall out of the 95 percent confidence interval
of the MPN. The reason for the excessively high recoveries by the M-5hr
technique during these two trials is not known. The M-2hr recoveries
were within the MPN range in four out of five trials.
The recoveries by the standard MF technique were outside of the
MPN 95 percent confidence interval in all trials. Because the MPN method
is based on probability statistics, and because estimates of bacterial
concentration by this method are known to vary as much as one order of
magnitude on identical samples (78), a direct-count membrane filter
62
technique that would give more accurate estimates of coliform
densities is highly desirable. The results of this study showed at
no less than a 97.5 percent level of significance that the standard MF
technique does not permit an accurate estimation of the coliform density
when the nature of the environment has generated stressed subpopulations.
Furthermore, this study has shown that the M-5hr method can be a valuable
tool for obtaining a better indication of water quality under such
conditions.
Statistical analysis. As previously mentioned, the paired-t test
was used to compare the data obtained by the various methods. This
approach, rather than the group-t test, was chosen because there were
great variations among the coliform populations recovered by any one
method during the twelve analyses. The paired-t test provides also for
a reduction in variance over that obtained when the group-comparison
method is used. Had the number of trials involving each method been
the same, a randomized-block statistical design could have been employed.
The M-2hr technique was not introduced as a method for evaluation
in this study until midway through the project. Consequently, there
were only five instances where this method was evaluated. The possibility
that the Duncan's Multiple Range Test could be used to analyze the
data was also investigated, but this technique also would have been
inappropriate because there was an unequal number of trials and the
variation between the data pairs was large. It should be noted that the
statistical analysis involved a comparison of means derived from a set
of replicate plates (three or four replicates in each case). In all
63
cases, the means for each data pair were derived from the same number of
replicates.
Because Presswood and Strong (83) suggested that the elimination
of rosolic acid from the M-FC medium allows for higher fecal coliform
recoveries, two trials during this study incorporated a comparison of
fecal coliforms observed on this medium prepared with and without the
inhibitor. As stated earlier, the recoveries obtained with this
medium did not appear to be very different from the recoveries with
the standard MF procedure. Recoveries in both instances were slightly
higher when the medium without rosolic acid was used, and elimination
of this substance, which was originally suggested as an addition to
M-FC agar to aid in the inhibition of non-fecal-coliform organisms,
may have merit. However, not enough experiments were performed during
this study to confirm that eliminating rosolic acid offers any advantage.
Presswood also stated that when rosolic acid is eliminated, intensely
blue colonies develop that are easier to identify than those that
develop on agar that includes it. Furthermore, deletion of rosolic
acid would eliminate another possible source of stress to the fecal
col iforms.
Plates prepared as blanks showed the use of UV light and distilled
rinse water to be quite effective in removing any coliform organisms
left on the filter apparatus between filtrations. Therefore, no errors
in measured coliform densities were introduced by the filtration
procedures. Twenty-eight blanks were prepared and all exhibited either
one coliform colony or none at all after incubation at the prescribed
tempera tu re.

64
Colony verification. The 94 percent verification of the blue-
colored colonies as fecal coliforms by the modified MF technique
indicated that use of the 35°c preincubation period and the lactose
overlay does not increase the likelihood that coliforms will be falsely
identified more often than would be expected when the standard MF
technique is employed. In trials 1-7, the colonies were confirmed by
subculturing them into lauryl tryptose broth (35°C; 48 hrs) and then to
EC medium (44.5°C; 24 hrs) as reported by Rose et~- {73).
In trials 8-12, colonies were confirmed by direct transfer to the
EC medium. Omission of the lauryl tryptose step did not appear to lower
the percent of verification. This seems logical, because the modified
MF techniques have a preinrichment step built into them, precluding the
need for the lauryl tryptose. It appears from this study that further
evaluations of these modified MF methods could incorporate this
verification by inoculating directly into EC-medium and thus save
considerable time and expense.
Heavy Metal Determinations
As can be seen in Table VII, the heavy metal concentrations varied
considerably from one sample to the next and, generally, were relatively
low. Several factors could account for the variations. The length of
the dry period during which the metals could accumulate, the rainfall
intensity (its flushing ability), and differential traffic densities
are all factors. Several observations can be made concerning the metals
determined.
65
Cadmium and chromium were found to occur in the runoff waters in
very low concentrations. In nine of the trials, the cadmium level was
0.01 mg/l, and in the other three none was detected. Chromium
concentrations ranged from 0 to 0.03 mg/l.
Copper concentrations ranged from 0 to 1.09 mg/l. The high
concentration was found in trial number three. Several other metal
concentrations were uncharacteristically high for this sample also.
The possible explanation for this is the fact that the sample was
collected from a small stream of water along the storm curbing that
persisted several hours after the rainfall had ended. This sample was
highly turbid, and the high metal concentrations are probably the
result of their adsorption to the particles in the water. Copper
concentrations were below 0.15 mg/l in nine of the twelve trials.
Iron concentrations varied from 0.12 mg/l to l .55 mg/l. Seven
iron concentrations were 0.25 mg/l or greater. In general, iron was
present in the greatest concentrations as compared with the other
metals.
Lead concentrations varied from 0.07 mg/l in two trials to 0.63
mg/l. Nine of the twelve samples had lead concentrations below 0.25
mg/l.
Zinc was found in concentrations between 0.15 mg/land 0.5 mg/1.
Two samples taken during a storm that occurred after a short dry period
contained zinc in concentrations less than 0.1 mg/l. An uncharacter-
istically high concentration of 4.0 mg/l zinc was found in the sample
collected several hours after the rainfall had ended. The fact that

66
iron, lead, and zinc were the most prevalent metals agrees with
previous reports (66,68). The lead concentrations found in this study
were in relatively close agreement with the 0.23 mg/l theoretical
value developed by Newton et~· (70) in their study of lead pollution
in street runoff. In the future, lead concentrations could tend to
decrease due to the increased use of unleaded gasoline in automobiles
equipped with catolytic converters.
The metal concentrations determined in this study were repre-
sentative of the amounts which can build up on the parking lot during
the late spring and summer months in Blacksburg. The increased
student population in the fall and winter could likely result in
greater metal concentrations in the runoff waters.
Comparison of Recoveries to the Environmental Conditions
No correlations with coliform stress could be made with either
metal concentrations in the runoff or the time between rainfall
events. When the ratio between populations estimated by the M-5hr and
standard MF techniques was plotted against the heavy metal concentrations
(Figure 10), no correlation could be seen. Ratios varied greatly over
a relatively narrow range of metal concentrations. Evidently, the
heavy metals were not the main source of the stress in these samples,
although there likely would be some correlation if metal concentrations
were higher.
As can be seen in Figure 11, there also was no clearly defined
relationship between the stressed condition and the time elapsed since
the previous rain even though the two largest ratios did occur when the

67
interval between rainfall events was the greatest. It does seem
logical, however, that the longer the organisms are exposed to the
environmental conditions causing stress, the greater the stressed
subpopulation would be.
It is probable that the stressed fecal coliform subpopulation
in urban runoff results largely from other environmental conditions not
monitored in this study. The effects of temperature and exposure to
UV light, dehydration, and the lack of food probably should be
considered. Stressed subpopulations likely result from a combination
of numerous environmental conditions and their interactions and while
further research is warranted, these conditions would be extremely
difficult to monitor.
If enough environmental conditions causing stress affect a water
source, a potentially-dangerous water supply could be regarded as safe
if the standard MF technique is used to evaluate it. Because it has
been demonstrated in this study and others (73,78) that a substantial
portion of the fecal coliform population in certain types of waters may
be injured, it is evident that a modified technique, such as the M-5hr
method, is needed to recover these organisms and, thus, permit effective
evaluation of the water quality. Further work should be carried out to
determine which factors should be given major consideration in deciding
if a modified procedure is needed to evaluate a particular water source.
As suggested by Rose et~· (73), the decision to use the slightly
more involved two-layered medium method in preference to the standard
MF method should be based on a demonstration of increased verified

68
recoveries of fecal colifonns in the samples routinely examined. A
modified technique, such as the M-5hr method, could prove to be
valuable because a major i~terest in the fecal coliform test is
related to the bacterial quality assessment of effluent waters under
the National Pollution Discharge Elimination System. Should it be
decided that a modified MF method is valuable in certain assessments,
the use of a temperature-programmed incubator that automatically makes
the temperature change from 35 to 44.5°c after a prescribed preincubation
period would be a helpful addition to the technique.

VI. SUMMARY AND CONCLUSIONS
Urban runoff samples collected from a parking lot in s·1acksburg,
Virginia were analyzed by several techniques for fecal coliform recovery.
The samples also were analyzed for heavy metal concentrations. The
results of this study indicated that a substantial percentage of the
fecal coliform population found in urban runoff may be injured by a host
of environmental factors and are not recovered adequately by the
standard membrane filter technique (MF). Based on the results of this
study, the following conclusions are warranted regarding the analysis
of fecal coliforms in stormwater runoff from a parking lot:
1. A modification of the standard MF method, employing a thin lactose
agar layer over the M-FC agar and a preincubation period at 35°C
permits recoveries of fecal coliforms that are consistently greater
than those observed when the standard MF technique is used. The
means of three replicates were significantly greater than those
obtained by the standard MF technique in five experiments when a
two-hour preincubation period was used (O.Ol level of significance)
and also in twelve experiments when a five-hour preincubation
period was used (0.025 level of significance). The means for this
comparison were obtained from either three or four replicates,
depending on the trial number.
2. Increasing the incubation in the modified method from two to five
hours (M-5hr) resulted in even greater recoveries of the stressed
fecal coliforms (0.005 level of significance in five experiments
of three replicates in each trial). It was also noted that the
69

70
range of differences between the modified and standard MF techniques
was highly varied.
3. The standard MPN procedure permitted recoveries consistently
greater than those observed when the standard MF and M-2hr
techniques were used. The MPN means were significantly greater
than those obtained by the standard MF in twelve experiments (0.05
level of significance) and significantly greater than those obtained
by the M-2hr method in five experiments {0.01 level of significance).
The M-5hr technique permitted recoveries significantly greater
than those obtained by the MPN technique but the level of significance
was only 0.2 in twelve experiments. Practically speaking, the 0.2
level is not a good enough justification to declare the M-5hr method
superior to the MPN technique.
4. The use of a lactose agar overlay and a 35°c preincubation period
can result in substantial growth of non-fecal-coliform organisms
that can make enumeration of these indicator bacteria more difficult.
This conclusion agrees with statements by others (73,78).
5. No correlation could be made in this study when comparing heavy
metal concentrations in the runoff waters and the elapsed time
between rainfalls with the degree of stress.

VII. RECOMMENDATIONS
1. Investigations should be made to determine what environmental
factors cause the stressed fecal coliform subpopulations in urban
runoff. Such things as extreme temperatures, pH, the quantities
of UV light received over a p~riod of time, and the levels of
pesticides could be examined. The significance of heavy metals
and length of antecedent dry period should be further investigated.
2. The possibility of developing a predictive model for stressed
fecal coliforms should be studied following the above investigations.
3. An investigation could be made to determine the identity of the
non-fecal-coliform organisms that grow in the modified membrane
filter methods.
4. Additional work should be done to determine the effect rosolic
acid addition to the M-FC medium has on fecal coliform recoveries
and whether or not it is actually needed.
71

VIII. LITERATU~E CITED
1. Anderson, D. A., Introduction to Microbiology, C. V. Mosby Co., St. Louis, Mo. (1973).
2. White, G. C., Handbook of Chlorination, Van Nostrand Reinhold Co., New York, N. Y. (1972).
3. Finstein, M. S. Pollution Microbiology, Marcel Dekker, Inc., New York, N. Y. (1972).
4. Geldreich, E. E., "Microbiology of Water," Jour. Water Poll. Control Fed., 49, 1222-1244 (1977).
5. Standard Methods for the Examination of Water and Wastewater, 14th. Edition, American Public Health Assn., American Water Works Assn., Water Poll. Control Fed., New York, N. Y. (1976).
6. Underhill, R. E., "The Regrowth of Coliform and Fecal Streptococcus Bacteria in a Stream Receiving a Municipal Sewage Treatrrent Plant Effluent," M.S. Thesis, Virginia Polytechnic Institute and State University, Blacksburg, Va. (1973).
7. Smith, T., "Notes on Bacillus coli-communis and Related Forms, Together with Sorre Suggestions Concerning the Bacteriological Examination of Water, 11 Am. Jour. Med. Sci., llO, 283 (1895).
8. Geldreich, E. E., "Detection and Significance of Fecal Coliform Bacteria in Stream Pollution Studies," Jour. Water Poll. Control Fed.,'}]_, 1722-1725 (1965).
9. Geldreich, E. E., Huff, C. B., Bordner, R. H., Kabler, P. W., and Cl ark, H. F., "The Fae ca 1 Co 1 i -Aero genes Flora of Soils from Various Geographical Areas," Jour. Appl. Bacterial.,~' 87-92 ( 1962) .
10. Geldreich, E. E., Best, L. C., Kenner, B. A., and Van Danser, D. J., "The Bacterial Aspects of Stormwater Pollution," Jour. Water Poll. Control Fed., 40, 1861-1872 (1968).
11. Geldreich, E. E., Kenner, B. A., and Kabler, P. W., 11 0ccurrence of Coliforms, Fecal Coliforms and Streptococci on Vegetation and Insects," Appl. Microbial., R, 63 (1964).
12. Geldreich, E. E., "Fecal Coliform Concepts in Stream Pollution," Water and Sewage Works, 114, R98-Rll0 {1967).
72

73
13. Van Oonsel, 0. J., Geldreich, E. E., and Clark, N. A., 11 Seasonal Variations in Survival of Indicator Bacteria in Soil and Their Contribution t.o Storm-Water Pollution, 11 Appl. Microbial., 15, 1362-1370 (1967). ~
14. McFeters, G. A., Bissonnette, G. K., Jezeski, J. J., Thompson, C. A., and Stuart, 0. G., 11 Comparati ve Survival of Indicator Bacteria and Enteric Pathogens in Well Water, 11 Appl. Microbial., ?]_, 823-829 ( 1974).
15. Gordon, R. C., "Winter Survival of Fecal Indicator Bacteria in a Subarctic Al ask an River, 11 En vi ronmenta 1 Protection Technology Series No. EPA-R-2-72-013, U. S. Environmental Protection Agency, Washington, 0. C. (1972).
16. ORSANCO Water Users Corrmittee, "Total Coli form: Fecal Coli form Ratio for Evaluation of Raw Water Bacterial Quality, 11 Jour. Water Poll. Control Fed., 43, 630-640 (1971).
17. Andre, 0. A., Weiser, H. H., and Moloney, "Survival of Bacterial Enteric Pathogens in Farm Pond Water, 11 Jour. Amer. Water Works Assn., 59, 503-508 (1967).
18. Scarce, L. E., Rubenstein, S. H., and Megregian, S., 11 Survival of Indicator Bacteria in Receiving Waters Under Various Conditions, 11 Publications of the Great Lakes Research Division, No. ll , ( 1964) .
19. Evans, F. L. III, Geldreich, E. E., Weibel, S. R. and Robeck, G. G., 11Treatment of Urban Storrrwater Runoff, 11 Jour. Water Poll. Control Fed., 40, Rl62-Rl69 (1968).
20. Kittrell, F. W., and Furfari, S. A., 11 0bservations of Coliform Bacteria in Streams, 11 Jour. Water Poll. Control Fed., ~. 1361-1385 (1963).
21. Deaner, O. G., and Kerri, K. 0., 11 Regrowth of Fecal Coliforms, 11
Jour. Am. Water Works Assn., §_J_, 465-468 (1969).
22. Mara, 0. 0., Bacteriolo for Sanitar Engineers, Churchill Livingstone, Edin urgh, England l 74 .
23. Rahn, 0., Physiology of Bacteria, P. Blakiston's Son & Co., Inc., Phil a de l p h i a ( 19 32 ) .
24. Bradford, W. L., 11 Urban Storrrwater Pollutant Loadings: A Statistical Summary Through 1972, 11 Jour. Water Poll. Control Fed., 49, 613-622 (1977).

74
25. Weibel, S. R., Anderson, R. S. and Woodward, R. B., 11 Urban Land Runoff as a Factor in Stream Pollution, 11 Jour. Water Poll. Control Fed., 36, 914 (1964).
26. Whipp le, W. Jr., and Hunter, J. V., 11 Nonpoint Sources and Planning for Water Pollution Control, 11 Jour. Water Poll. Control Fed., 49' 15-23 ( 1977).
27. Geldreich, E. E., 11 0rigins of Microbial Pollution in Streams, 11 in Transmission of Viruses By The Water Route, G. Berg, Ed., John Wiley and Sons, New York, N. Y. (1967).
28. Burm, R. J., and Vaughn, R. D., 11 Bacteriological Comparison Between Combined and Separate Sewage Discharges in Southeastern Michigan, 11 Jour. Water Poll. Control Fed., 38, 400-409 (1966).
29. Whipple, W. Jr., Hunter, J. V., and Yu, S. L., 11 Unrecorded Pollution from Urban Runoff, 11 Jour. Water Poll. Control Fed., 46' 873-885 (1974).
30. Faust, M. A., 11 Coliform Bacteria from Diffuse Sources as a Factor in Estuarine Pollution, 11 Water Research, .!Q_, 619-627 (1976).
31. Evans, M. R. and Owens, J. D., 11 Soi l Bacteria in Land Drainage Water, 11 Water Res.,]_, 1295-1300 (1973).
32. Weibner, R. B., Christenson, A. G., Weibel, S. R. and Roebeck, G. G., "Rural Runoff as a Factor in Stream Pollution, 11 Jour. Water Poll. Control Fed., !!_, 377-384 (1969).
33. Hendricks, C. W. and Morrison, S. M., 11 Multiplication and Growth of Selected Enteric Bacteria in Mountain Stream Water, 11
Water Res., ]_, 567-576 ( 1967).
34. Hendricks, C. W., 11 Enteric Bacterial Metabolism of Stream Sediment Eluates, 11 Can. Jour. Microbiol., .ll., 551-556 (1971).
35. Burgess, J. S., and Olive, L. J., "Bacterial Pollution in Lake Burley Griffin, 11 Jour. Australian Water and Wastewater Assn., ~. 17 -20 ( 19 75) .
36. Geldreich, E. E., 11 Buffalo Lake Recreational Water Quality: A Study in Bacteriological Data lnterpretation, 11 Water Res., §_, 913-924 (1972).
37. Buckingham, R. A. and Betson, R. P., 11 Fecal Coli form Concentrations in Stornwaters, 11 Abstract of Paper Presented at the American Geophys. Union, Fifty-First Annual Meeting ( 19 70).
75
38. Pontius, U. R., Pavia, E. H., and Powell, C. J., "Stormwater Disinfection at New Orleans," Jour. Water Poll. Control Fed., 11_, 591-606 (1969).
39. Delaney, J. E., McCarthy, J. A., and Grasso, H. J., "Measurement of E. coli Type I by the Membrane Filter," Water and Sewage WorkS, 109, 289-294 (1962).
40. Geldreich, E. E., "Applying Bacteriological Parameters to Recreational Water Quality, Jour. American Water Works Assn., .§.g_, 113-120 (1970).
41. Clark, H. F., and Kabler, P. W., "Reevaluation of the Significance of the Coliform Bacteria," Jour~ American Water Works Assn., i§_, 931-936 (1964).
42. Streeter, H. W., and Robertson, D. A. Jr., "Evaluation of Membrane Filter Technique for Appraising Ohio River Water Quality," Jour. American Water Works Assn.,~' 229-241 (1960).
43. Taylor, E. W., Burman, N. P., and Oliver, C. W., "Membrane Filtration Technique Applied to the Routine Bacteriological Examination of Water," Jour. Inst. Water Engrs., 2_, 248 (1955).
44. Hapna, A. A., and Damon, S. R., "Coliform Detection in Water with a Single Step Technique Using the Membrane Filter," Jour. American Water Works Assn., 47, 631 (1955).
45. Kabler, P. W. and Clark, H. F., "The Use of Differential Media with the Membrane Filter," American Jour. of Public Health, 42' 390 ( 1952) .
46. Fifield, C. W. and Schaufus, C. P., "MF-Endo. An Improved Medium for the Detection of the Coli form Group in Water, 11 Jour. American Water Works Assn., 50(2), 193 (1958).
47. Geldreich, E. E., Clark, H. F., Huff, C. B., and Best, L. C., 11 Fe ca 1-Co 1i form-Organism Medi um for the Membrane Filter Technique," Jour. American Water Works Assn., 57, 208-243 (1961). -
48. McCarthy, J. A., Delaney, J.E., and Grasso, R. J., "Measuring Coliforms in Water," Water and Sewage Works, 108, 238-243 (1961).
49. McKee, J.E., Mclaughlin, R. T., and Lesgourgues, P., "Application of Molecular Filter Techniques to the Bacterial Assay of Sewage, III. Effects of Physical and Chemical Disinfection," Sewage Ind. Wastes, 30, 245-252 (1958).

76
50. Lin, S. D., "Membrane Filter Method for Recovery of Fecal Coliforms in Chlorinated Sewage Effluents," A}plied and Environmental Microbiology, 32, 547-552 (1976 .
51. Shipe, E. L., Jr., and Cameron, G. M., "A Comparison of the Membrane Filter with the Most Probable Number Method for Coliform Determinations from Several Waters," Applied Microbiol., ~. 85-88 ( 1954).
52. Lin, S. D., "Evaluation of Coliform Tests for Chlorinated Secondary Effluents, 11 Jour. Water Poll. Control Fed., 45, 498-506 (1973).
53. Dufour, A. P., and Cabelli, V. J., "Membrane Filter Procedure for Enumerating the Component Genera of the Coliform Group in Seawater, 11 Applied Microbiology,~. 826-833 (1975).
54. Taylor, R.H., Bordner, R.H., and Scarpino, P. V., 11 Delayed-Incubation Membrane-Filter Test for Fecal Coliforms, 11 Applied Microbiol ., E2., 363-368 (1973).
55. Sladek, K. J., Suslavich, R. V., Sohn, B. I., and Dawson, F. W., 11 0ptimum Membrane Structures for Growth of Coliform and Fecal Coliform Organisms, 11 Applied Microbiol., 30, 685-691 (1975).
56. Green, B. L., Cl au sen, E., and Lit sky, W., 11 Compari son of the New Millipore HC with Conventional Membrane Filters for the Enumeration of Fecal Coliform Bacteria, 11 Applied Microbiol., 30, 697-699 (1975).
57. Lin, S. D., 11 Evaluation of Millipore HA and HC Membrane Filters for the Enumeration of Indicator Bacteria, 11 Applied and Environ. Microbiol., 1.£, 300-302 (1976).
58. Maeda, K., Imae, Y., Shiol, J., and Oosawa, F., 11 Effect of Temperature on Moticity and Chemotaxis of Escherichia coli, 11
Jour. Bacteriol., 127, 1039-1046 (1976). --
59. Russell, A. D., and Morris, A., in Methods in Microbiology,~' Norris, J. R., and Ribbons, D. W., editors, Academic Press, New York, N. Y., 95-182 (1973).
60. Ray, B., and Speck, M. L., 11 Enumeration of Escherichia coli in Frozen Samples After Recovery from Injury, 11 Appl. MlCrobiol ., 25, 499-503 (1973).
61. Postgate, J. R., and Hunter, J. R., 11 The Survival of Starved Bacteria, 11 Jour. Gen. Microbiol., ~' 233-263 (1962).

77
62. Klein, D. A., and Wu, S., 11 Stress: A Factor to be Considered in Heterotrophic Microorganism Enumeration from Aquatic Environments," Appl. Microbial., 27, 429-431 (1974).
63. Mitra, R. S., Gray, R. H., Chin, B., and Bernstein, I. A., "Molecular Mechanisms2if Accomodation in Escherichia coli to Toxic Levels of Cd , 11 Jour. of Bacterial., 121, 1180-1188 (1975). -
64. Babich, H., and Stotzky, G., 11 Sensitivity of Various Bacteria, Including Actinomycetes and Fungi to Cadmium and the Influence of pH on Sensitivity, 11 Applied and Environ. Microbial.,~' 681-695 (1977).
65. Bissonnette, G. K., Jezeski, J. J., McFeters, G. A., and Stuart, D. G., 11 Influence of Environmental Stress on Enumeration of Indicator Bacteria from Natural Waters, 11 Appl. Microbial., 29, 186-194 (1975).
66. Sartor, J. D., Boyd, G. D., and Agardy, F. J., 11 Water Pollution Aspects of Street Surface Contaminants, 11 Jour. Water Poll. Control Fed., 46, 458-467, (1974).
67. Bellinger, W. Y., 11Characteristics of Street and Parking Lot Runoff in Blacksburg, Virginia, 11 M.S. Thesis, Virginia Polytechnic Institute and State University, Blacksburg, VA (1976).
68. Wanielista, M. P., Yousef, Y. A., and Mclellan, W. M., 11 Nonpoint Source Effects on Water Quality, 11 Jour. Water Poll. Control Fed., 49, 441-451 (1977).
69. John, M. K., 11 Lead Contamination of Some Agricultural Soils in Western Canada, 11 Envt. Sci. and Tech.,~' 1199-1203 (1971).
70. Newton, C. D., Shephard, and Coleman, M. S., 11 Street Runoff as a Source of Lead Pollution, 11 Jour. Water Poll. Control Fed., 46, 999-1000 (1974).
71. Lagerwerff, J. V., and Specth, A. W., 11 Contamination of Roadside Soil and Vegetation with Cadmium, Nickel, Lead, and Zinc, 11
Envt. Sci. and Tech.,!' 583-586 (1970).
72. Wilber, W. G., and Hunter, J. V., 11 Contributions of Metals Resulting from Stormwater Runoff and Precipiation in Lodi, New Jersey, 11 in Urbanization and Water Quality Control, American Water Resources Assn., Proc. No. 20, Minneapolis, Mn. (1975).
78
73. Rose, R. E., Geldreich, E. E., and L itsky, W., "Improved Membrane Filter Method for Fecal Coliform Analysis," Appl. Microbiol ., 29, 532-536 (1975).
74. Rose, R. E., and L itsky, W., "Enrichment Procedure for Use with the Membrane Filter for the Isolation and Enumeration of Fecal Streptococci in Water, 11 Appl. Microbiol., }l, 106-108 (1965).
75. Hartman, P. A., Hartman, P. S., and Lanz, W. W., "Violet Red Bile 2 Agar for Stressed Coli forms, 11 Appl. Microbiol., 29, 537-539 (1975).
76. Speck, M. L., Ray, B., and Read, R. B., Jr., "Repair and Enumeration of Injured Coliforms by a Plating Procedure," Appl. Microbiol., ~. 549-550 (1975}.
77. Bissonnette, G. K., Jezeski, J. J., McFeters, G. A., and Stuart, D. G., "Evaluation of Recovery Methods to Detect Coliforms in Water, 11 Appl. and Envt. Microbiol., ~' 590-595 (1977).
78. Green, B. L., Clausen, E. M., and L itsky, W., "Two-Temperature Membrane Filter Method for Enumerating Fecal Coliform Bacteria from Chlorinated Effluents, 11 Appl. and Envt. Microbiol ., ~. 1259-1264 (1977).
79. United States Environmental Protection Agency, Methods for Chemical Analysis of Water and Wastes, Office of Technology Transfer, EPA 625-16-003, Washington, D. C. (1974).
80. King, W. L., and Hurst, A., 11 A Note on the Survival of Some Bacteria in Different Dilluents, 11 Jour. Appl. Bacteriol., 26, 504-506 (1963).
81. Patterson, J. T., and Cassells, J. A., "An Examination of the Value of Adding Peptone to Diluents Used in the Bacteriological Testing of Bacon Curing Brines, 11 Jour. Appl. Bacteriol ., 26, 493-497 (1963).
82. Straka, R. P., and Stokes, J. L., "Rapid Destruction of Bacteria in Commonly Used Diluents and its Elimination," Appl. Microbiol ., ~. 21-25 (1957).
83. Presswood, W. G., and Strong, D., "Modification of M-FC Medium by Eliminating Rosolic Acid, 11 Paper presented at the annual meeting of the Amer. Soc. Micro., New Orleans, La., June, 1977.
84. Sokal, R. R., and Rohlf, F. J., Biometry, W. H. Freeman and Company, San Francisco, California (1969).

APPENDIX A
FECAL COLIFORM DETERMINATIONS BY VARIOUS TECHNIQUES
79

APPENDIX TABLE A-I
MPN Determinations
Positive Presumetive Tubes (of 5} Positive Confirmed Tubes {of 5} MPN {fc/100 ml} Trial Dilution Dilution Range a Average Number l : l 1 : l 0 l : l 00 l : l 000 l : l 0 '000 l : l l : l 0 l : l 00 l : 1000 l : 10 '000
l NRb NR 5 4 2 NR NR 5 4 2 57,000-700,000 220,000 2 NR NR 5 3 2 NR NR 5 3 l 31 ,000-250,000 110 ,000 3 5 5 5 2 NR NR 5 5 l NR 12,000-100,000 35,000 CX>
0 4 NR 5 3 l NR NR 5 3 l NR 3100- 25,000 11 ,000 5 NR 5 4 2 NR NR 5 4 l NR 4300- 49,000 17,000 6 NR 5 5 l NR NR 5 5 l NR 12,000-100,000 35,000 7 5 5 2 NR NR 5 5 2 NR NR 1800- 14 ,000 54,000 8 NR 5 3 0 0 NR 5 3 NR NR 2500- 19,000 7,900 9 5 5 3 0 NR 5 5 3 NR NR 3000- 32,000 9,200
10 NR 5 5 0 NR NR 5 4 NR NR 3500- 30,000 13,000 11 NR 5 5 0 NR NR 5 5 NR NR 6800- 75,000 24,000 12 5 5 3 2 NR NR 5 2 2 NR 2800- 22,000 9,400
a95% confidence interval.
bNot run.

81
APPENDIX TABLE A-II
Standard MF Plate Counts
Trial Counts in Colonies Per 100 ml Number Dilution Replicate Plates Mean Std. Deviation
1 1 : 10 TNTC* 1: 100 156; 144; 151 ; 162 15,300 763 1: 1000 15; 13; 16; 15
2 1 : 10 TNTC 1 : 100 94; 81 ; 95; 83 8800 727 1: 1000 5; 8; 6; 9
3 1 :10 TNTC 1: 100 38; 35; 40; 42 3900 299 1 : 1000 3; 5; 2; 2
4 1: 100 27; 24; 29; 33 2800 377 1: 1000 4; 1 ; 3; 1 1 : 10 ,000 O; O; O; 1
5 1: 100 66; 89; 53; 78 7200 155 1: 1000 5; 5; 3; 3 1:10,000 l ; O; l ; 0
6 l: 100 74; 61; 44; 63 6000 1240 l: 1000 4; 6; 8; 3 l: 10,000 O; O; O; 0
7 l :10 115; 110; 95; 95 1040 103 l : l 00 7; 14; 11 ; 17 l: 1000 l ; 1 ; O; 0
8 1 : 10 TNTC l: l 00 10; 11; 10 1000 58 l: 1000 l ; O; 0 1 : l 0 ,000 O; O; 0
*Too numerous to count

82
APPENDIX TABLE A-II (con 1 t)
Standard MF Plate Counts
Trial Counts in Colonies Per 100 ml Number Dilution Replicate Plates Mean Std. Deviation
9 l: 10 TNTC 1: 100 25; 31 ; 23 2600 416 1: 1000 1 ; 2; l
10 1 : 10 TNTC 1: 100 35; 26; 30 3000 451 1: 1000 4; 2; 4
11 1: 10 TNTC l: 100 58; 59; 59 5900 58 l: 1000 11 ; 10; 8
12 1: l 0 TNTC l: l 00 15; 19; 14 1600 265 l: l 000 O; O; 1
*Too numerous to count.

83
APPENDIX TABLE A-III
Modified MF (5 Hr 35°c Preincubation) Plate Counts
Trial Counts in Colonies Per 100 ml Number Dilution Replicate Plates Mean Std. Deviation
1 1 : 10 TNTC* 1: l 00 TNTC l: 1000 187; 192; 188; 195 191,000 3697
2 l : l 0 TNTC l: l 00 TNTC l: 1000 82; 87; 79; 83 83,000 3304
3 l : 10 TNTC l: l 00 TNTC l: 1000 23; 30; 30; 35 30,000 4933
4 l : 100 320; 331 ; 350; 344 33,600 1343 1: 1000 3; 7; 8; 10 1:10,000 2; l ; O; 0
5 l: l 00 TNTC l: l 000 TNTC l : 10 ,000 43; 46; 41; 29 298,000 74,554
6 1: l 00 TNTC l :1000 132; 166; 255; 243 199,000 59 ,581 l: 10 ,000 O; l ; 14; 6
7 l: 10 TNTC l: l 00 112; 123; 125; 115 11'900 624 l: 1000 O; 4; 3; 0
8 1 : 10 TNTC l: l 00 71 ; 72; 65 6900 379 l: l 000 2; l ; 2 l : l 0 ,000 O; O; 0
*Too numerous to count.
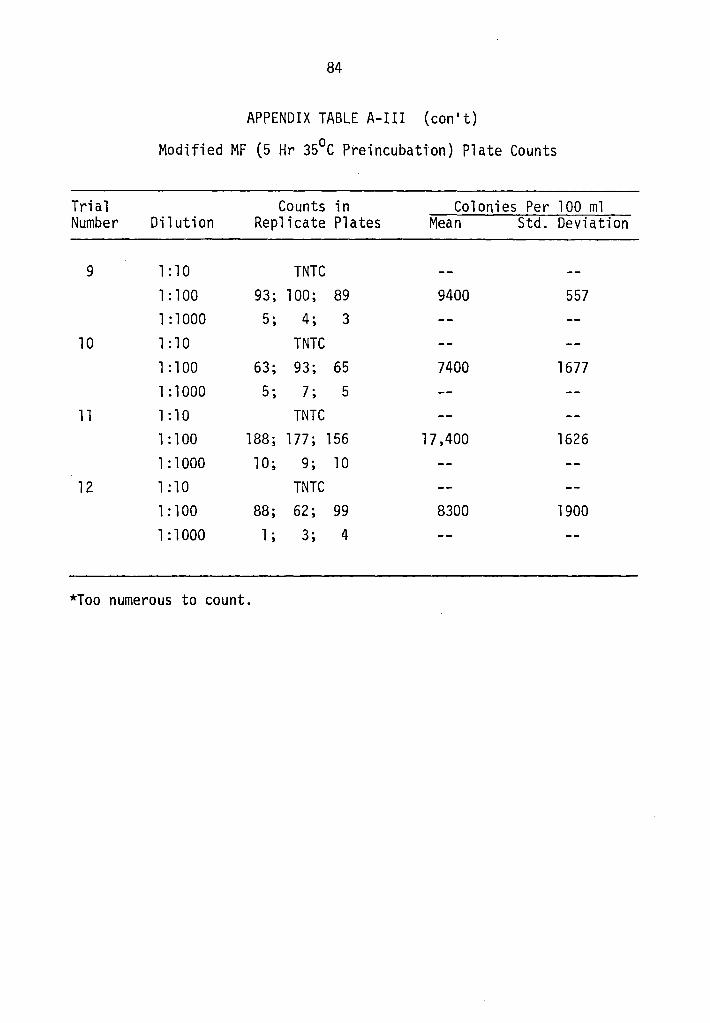
84
APPENDIX TABLE A-III (con 1 t)
Modified MF (5 Hr 35°C Preincubatton) Plate Counts
Tri a 1 Counts in Colonies Per 100 ml Number Dilution Replicate Plates Mean Std. Deviation
9 1: 10 TNTC 1: 100 93; 100; 89 9400 557 1 :1000 5; 4; 3
10 1 : 10 TNTC 1: 100 63; 93; 65 7400 1677 1 : 1000 5; 7; 5
11 1 : 10 TNTC 1: 100 188; 177; 156 17,400 1626 1: 1000 10; 9; 10
12 1: 10 TNTC 1: 100 88; 62; 99 8300 1900 1: 1000 1 ; 3; 4
*Too numerous to count.

85
APPENDIX TABLE A-VI
Modified MF (2 Hr 35°C Preincubation) Plate Counts
Trial Counts in Colonies Per 100 ml Number Dilution Replicate Plates Mean Std. Deviation
8 1 : 10 TNTC*. 1: 100 19; 24; 15 1900 451 1: 1000 O; 2; 1 1 : 10 '000 O; O; 0
9 1: 10 TNTC 1:100 29; 36; 36 3400 404 1 : 1000 1 ; 1 ; 2
10 1 : 10 TNTC 1: 100 46; 49; 54 5000 404 1: 1000 7; 6; 5
11 1 : 10 TNTC 1: 100 82; 87; 94 8800 603 1 : 1000 7; 6; 8
12 1 : 10 TNTC 1: 100 38; 32; 45 3800 651 1: 1000 2; 1 ; 1
*Too numerous to count.

86
APPENDIX TABLE A-V Standard MF Without Rosalie Acid Plate Counts
Trial Counts in Colonies Per 100 ml Number Dilution Replicate Plates Mean Std. Deviation
11 1: 10 TNTC*
1:100 84; 62; 65 7000 3208
1: 1000 12; 11; 11
12 1 :10 TNTC
1: 100 22; 13; 15 1700 404
1: 1000 O; O; 0
*Too numerous to count.

APPENDIX B
STATISTICAL ANALYSIS
87

88
APPENDIX TABLE 8-I
Statistical Comparison of the Standard MF and the Modified M-5hr Techniques
Standard MF Count*
153 88 39 28 72 60 10. 4 10 26 30 59 16
r.Y 591. 4
r.D2 = 22,994,231
MPN Count*
1910 830 300 336
4000 1990
119 69 94 74
174 83
9979
D = r.D/b = 9387.6 I 12 = 782.3
SD~ ED2 b ~E~) 2/b = 22,994,23111
7,343,919 =
. SD s- = - = D b
1193 12
= 345
Difference
1757 742 261 308
3928 1930 108.6
59 68 44
115 67
9387.6
1193
We assume the true differences between the means of the two groups, µl - µ2, equals zero.
t = o - o = 782.3 = 2 27 s s0 345 ·
t.025(11) = 2.201 t.01(11) = 2.718
Means significantly different at 0.025 > P > 0.01
*Mean fecal coliform count per 100 ml reduced by a factor of 100 to simplify calculations (statistics not altered).

89
APPENDIX TABLE B-11 Statistical Comparison of the Standard MF
and the Modified M-2hr Techniques
Standard MF Count*
10 26 30 59 16
L.Y 141
~D2 = 1870
o = 17.6 SD = 8.96
s0 = 4.0
ts = 4.4
t.01(4) = 3.747 t.005(4) = 4.604
M-2hr Count*
19 34 50 88 38
229
Means significantly different at 0.01 > P > 0.005
Difference
9 8
20 29 22
88
*Mean fecal coliform count per 100 ml reduced by a factor of 100.

M-2hr Count*
19 34 50 88 38
L.Y 229
ED2 = 16,097
o = 53 SD = 22.7
s0 = 10. l
ts = 5.25
t.005(4) = 4.604 t.0005(4) = 8.610
90
APPENDIX TABLE B-lll Statistical Comparison of the M-2hr
and M-5hr Techniques
M-5hr Count*
69 94 74
174 83
494
Means significantly different at 0.005 > P > 0.0005
Difference
50 60 24 86 45
265
*Mean fecal coliform count per 100 ml reduced by a factor of 100.

MPN Count*
2200 1100
350 110 170 350
54 79 92
130 240
94
L.Y 4969
L:D2 = 17 ,581,018
o = 417.5 S0 - 1186 .6
s0 = 342 .9
ts= 1.22
t.2(11) = 0.876 t. l( 11 ) = l. 363
91
APPENDIX TABLE B-IV Statistical Comparison of the MPN
. and M-5hr Techniques
M-5hr Count*
1910 830 300 336
4000 1990
119 69 94 74
174 83
9979
Means significantly different at 0.2 > P > 0.1
Difference
-290 -270 -50 226
3830 1640
65 -10
2 -56 -66 -11
5010
*Mean fecal coliform counts per 100 ml reduced by a factor of 100.

M-2hr Count*
19 34 50 88 38
r.Y 229
r.o2 = 39,604
o = 81. 2 SD= 40.7
s0 = 18. 2
ts = 4.46
t.01(4) = 3.747 t.005(4) = 4.604
92
APPENDIX TABLE B-V
Statistical Comparison of the M-2hr and MPN Techniques
MPN Count*
79 92
130 240
94
635
Means significantly different at 0.01 > P > 0.005.
Difference
60 58 80
152 56
406
*Mean fecal coliform counts per 100 ml reduced by a factor of 100.

93
APPENDIX TABLE B-VI
Statistical Comparison of the Standard MF and MPN Techniques
Standard MF Count*
153 88 39 28 72 60 10.4 10 25 30 59 16
r.Y 591.4
rn2 = 5,471,365
o = 364.8 SD = 593.5
s0 = 171 .5
ts = 2. 13
t. 05 ( 11) = l. 796 t.025(11) = 2.201
MPN Count*
2200 1100
350 110 170 350
54 79 92
130 240
94
4969
Means significantly different at 0.05 > P > 0.025
Difference
2047 l 012 311
82 98
290 43.6 69 66
100 181
78
4377.6
*Mean fecal coliform counts per 100 ml reduced by a factor of 100.

The vita has been removed from the scanned document
A STUDY OF A MODIFIED MEMBRANE FILTER
TECHNIQUE FOR THE ENUMERATION OF
STRESSED FECAL COLIFORMS lN
URBAN RUNOFF
by
Edward Ryland Brown, Jr.
(ABSTRACT)
Urban runoff samples collected from a parking lot in Blacksburg,
Virginia were analyzed by several techniques for fecal coliform
recovery. The samples were also analyzed for heavy metal concentrations.
Statistical analyses of data by the paired-t test showed that the
standard membrane filter technique (MF) yielded significantly lower
recoveries (0. 05 level) than the standard MPN procedure. A modified
membrane filter technique employing a two-layer agar and a two hour 35°C
preincubation period (M-2hr) was found to yield recoveries consistently
greater (0.01 level) than the standard MF technique. Increasing the
preincubation period to five hours in this modified method (M-5hr)
resulted in recoveries that were even greater (0.005 level). The
recoveries of the M-5hr method were found to closely approximate the
MPN recoveries in most cases.
It was concluded that a substantial percentage of the fecal
coliform population found in urban runoff may be injured by a host of
environmental factors, though no correlations could be made with metal
concentrations or elapsed time between rainfalls. The M-5hr method was

concluded to be quite useful in the recovery of these stressed organisms.
though growth of non-fecal-coliforms was increased and made enumeration
of the fecal coliforms more difficult.