Embed Size (px)
Citation preview
ORIGINAL ARTICLE
A study of black liquor and pyrolysis oil co-gasificationin pilot scale
Yawer Jafri1 & Erik Furusjö1 & Kawnish Kirtania1 & Rikard Gebart1 &
Fredrik Granberg2
Received: 13 October 2016 /Revised: 27 December 2016 /Accepted: 29 December 2016# The Author(s) 2017. This article is published with open access at Springerlink.com
Abstract The effect of the blend ratio and reactor temperatureon the gasification characteristics of pyrolysis oil (PO) andblack liquor (BL) blends with up to 20 wt% PO was studiedin a pilot-scale entrained-flow gasifier. In addition to unblend-ed BL, three blends with PO/BL ratios of 10/90, 15/85, and20/80 wt%were gasified at a constant load of 2.75MWth. The15/85 PO/BL blend was used to investigate the effect of tem-perature in the range 1000–1100 °C. The decrease in fuelinorganic content with increasing PO fraction resulted in moredilute green liquor (GL), and a greater portion of the feedstockcarbon ended up in syngas as CO. As a consequence, the coldgas efficiency increased by about 5%-units. Carbon conver-sion was in the range 98.8–99.5% and did not vary systemat-ically with either fuel composition or temperature. Althoughthe measured reactor temperatures increased slightly with in-creasing PO fraction, both unblended BL and the 15% POblend exhibited largely similar behavior in response to tem-perature variations. The results from this study show thatblending BL with the more energy-rich PO can increase thecold gas efficiency and improve the process carbon distribu-tion without adversely affecting either carbon conversion orthe general process performance.
Keywords Black liquor . Pyrolysis oil . Gasification .
Pilot-scale . Co-gasification . Thermochemical conversion
1 Introduction
The development and large-scale deployment of cost-effec-tive, liquid biofuels has been identified as a key to successin the de-fossilization of the transport sector. Biomass gasifi-cation is one of the pathways for biofuel production that hasprogressed towards commercialization in the past decade [1,2]. Originally developed by Chemrec AB, the pressurizedentrained-flow (EF) black liquor gasification (BLG) technol-ogy has now been demonstrated for 28,000 h at the 3 MWth
LTU Green Fuels pilot plant in Piteå, Sweden. Since its com-pletion in 2005, the plant has been the site of several investi-gations into the gasification characteristics of black liquor(BL), which is a by-product of the pulping process [3–8].The catalytic effect of BL alkali content ensures the produc-tion of a low-methane, tar- and soot-free syngas at residencetimes in the order of seconds and at temperatures around1000–1050 °C [3]. Meanwhile, the pulping chemicals are re-covered for reuse in a manner similar to that in a pulpmill witha recovery boiler.
The presence of the catalytic effect [9] and the existence ofestablished supply chains in the pulp and paper industry [10]make BL uniquely suited to the production of syngas for sub-sequent biofuel production [11]. However, it is a hard-to-trans-port, energy-poor fuel whose availability is tied to pulp produc-tion at a given location. Blending BL with pyrolysis oil (PO), asimilar yet more energy-rich fuel with none of the aforemen-tioned disadvantages, offers a means of improving operationalflexibility and increasing biofuel yield [12]. A techno-economic evaluation of PO/BL co-gasification showed thatthe use of a 25% PO blend could increase methanol production
Electronic supplementary material The online version of this article(doi:10.1007/s13399-016-0235-5) contains supplementary material,which is available to authorized users.
* Yawer [email protected]
1 Division of Energy Science, Luleå University of Technology, SE-97187 Luleå, Sweden
2 Green Fuels Operation, Luleå University of Technology,Industrigatan 1, 941 38 Piteå, Sweden
Biomass Conv. Bioref.DOI 10.1007/s13399-016-0235-5

by 88% and energy efficiency by 4% compared to unblendedBL [13].
The blending of BL with PO leads to a net decrease in fuelalkali content. It was seen in a study of coal-char gasification[14] that above an alkali/C atomic ratio ≈0.1, the catalyticactivity of alkali reaches a saturation level. A similar effectmay also be expected to exist for biomass. A few studies [15,16] observed a linear increase in the gasification reactivity ofbiomass chars with increasing alkali content (alkali/C ratio<0.1). In another study [9], the opposite approachwas adoptedby reducing BL alkali content through incremental addition ofPO. The char and droplet conversion rates of the resultingblends with up to 30% PO were found to be similar to thoseof unblended BL. Hence, the addition of PO did not affect thegasification reactivity of the BL/PO blends at all, therebysupporting the plateaued catalytic activity. However, none ofthese lab-scale (≤900 °C and atmospheric pressure) studiesaccount for the high (flame) temperature as well as heatingrate, and the resulting significant alkali release that is encoun-tered in actual gasifiers. Moreover, syngas compositions andprocess energy efficiencies at different PO/BL blend ratioshave only been estimated by simulation and, therefore, requirevalidation, further study, and detailed experimental quantifi-cation in a more industrially representative scale.
The main aim of this study was to investigate, quantify, andassess the effect of the PO/BL blend ratio on syngas compo-sition, sulfur distribution, carbon conversion, smelt composi-tion, and cold gas efficiency in pilot scale under steady-stateoperation. A secondary aim was to study and compare theeffect of reactor temperature on the gasification characteristicsof a 15/85 PO/BL blend with those of unblended BL.
2 Material and methods
The BLG process consists of a pressurized, oxygen-blown EFgasifier with a refractory-lined reactor vessel, which convertssulfur- and alkali-rich BL, and blends thereof, into syngas andrecoverable smelt. An overview of the major process compo-nents and media streams is shown in Fig. 1. A detailed sche-matic of all the media streams included in the mass and energybalances is provided in Appendix A1 in the SupplementaryInformation. Before it is sent to the synthesis plant, syngas iscooled to around 30 °C in two stages: initially in a directquench and subsequently indirectly in a vertical gas cooler.In the process, it is stripped of particulates which are eventu-ally recirculated back, together with condensed syngas tars, toa pool of liquid at the bottom of the gasifier that also containsthe dissolved smelt in an aqueous solution named green liquor(GL). Further details can be found in an earlier parametricstudy [5] as well as in a recently published performance as-sessment of black liquor gasification [7].
The BL used in this study was taken from the neighboringSmurfit Kappa Kraftliner Piteå (SKKP) pulp mill, while thePO was produced at the Fortum bio-oil plant in Joensuu,Finland. In order to store and feed PO, a continuously stirred2.2-m3 day tank and two pumps were installed in the vicinityof the gasifier. The risk of lignin precipitation, which mayoccur due to the formation of pH gradients, was minimizedby mounting a pressurized mixer before the gasifier, therebyensuring thorough physical mixing of BL and PO. The co-gasification of the PO/BL blends did not require any modifi-cation of either the design of the burner nozzle or the operationof the existing gasifier feeding system.
2.1 Experimental conditions
During the experimental run, the gasifier was continuouslyoperated on BL and three PO/BL blends at eight differentsettings. One of the BL settings was repeated in triplicate.Fuel feed data for all the unique operating points (OPs) ispresented in Table 1. In total, more than 130 tons of KraftBL and ~5 tons of POwere gasified over 5 days. In the presentstudy, Bstandard operating conditions^ denote a thermal loadof 2.75 MWand a CH4 content of 1.2 mol% in syngas, whichwas obtained by adjusting the oxygen flow to the reactor. Thiscan be compared to a typical operating load of ~3.1 MWth onBL. A slightly reduced thermal load was used to maximizeoperational stability and the potential for quantifying the ef-fects of the investigated parameters.
The effect of the blending ratio was investigated by gasify-ing BL and blends with PO/BL ratios of 10/90, 15/85, and 20/80 on a mass basis at standard operating conditions. The effectof the reactor temperature was studied by operating the gas-ifier on a 15% PO blend at three different temperature settingsdenoted by syngas CH4 fractions of 0.5%, 1.2%, and 2.1%and labeled Bhot,^ Bstandard,^ and Bcold,^ respectively.Although the day-tank capacity placed an upper limit on theduration of co-gasification experiments, all the OPs were inplace for at least 6 h, which is three times the hydraulic resi-dence time of GL. Due to the partial dissociation of organicacids found in PO, a temperature rise of 5–10 °Cwas observedin the mixer. However, the temperature of the fuel feed to thereactor was maintained between 140 and 145 °C by regulatingthe temperature of the BL to the mixer. A detailed breakdownof BL and PO compositions is presented in Table 2. In com-parison with BL, PO contains significantly more carbon, mar-ginally more oxygen, and virtually no ash. Meanwhile, a sub-stantial fraction of the oxygen and carbon in BL is present asinorganic carbonates of sodium and potassium. Accordingly,PO has a considerably higher heating value than BL. Hence, atconstant thermal load, the total fuel feed rate decreased withincreasing PO fraction. The 10%, 15%, and 20% PO blendshad PO/BL ratios of 17/83, 25/75, and 32/68, respectively, onan energy basis.
Biomass Conv. Bioref.

A number of calibrations were performed to improve flowmeasurement accuracy, and they are discussed in more detailin section A1 of the Supplementary Information. Media sam-ples from the study were analyzed at a number of laboratories,which are collated in Tables 2 and 3. Note that the generalprocedure used for the calculation of the energy balances wasdetailed recently [7]. The standard conditions used as the ref-erence points for the calculation of BL standard enthalpy ofcombustion were defined as Tref = 25 °C and Pref = 1 bar, withK2CO3 (s), Na2CO3 (s), CO2 (g), H2O (l), and Na2SO4 (s) asthe stoichiometric combustion products. The total titrable al-kali (TTA) was calculated by summing the sulfide, carbonate,and bicarbonate concentrations.
2.2 Characteristic ratios
Similarly to coal, the difference in heating values betweenbiomasses with low ash content has been correlated to differ-ences in O/C and H/C ratios [17]. Although both of theseratios offer a useful means of fuel classification, they do notexplicitly take into account the effect of variations in inorganiccontent on fuel properties such as heating value. Thus, foralkali-rich fuels like BL, a parameter such as alkali/C ratio,
which decreases with increasing PO fraction, provides a morerepresentative means of characterization. In the present work,the blends are classified in terms of their molar alkali-to-carbon ratio for quantitative comparisons.
The reactor temperature has been shown to be a nearlylinear function of λ in entrained-flow gasification at steady-state conditions [18]. By definition, λ does not explicitly takeinto account variations in fuel oxygen content [19]. This canconceal the role played by the oxygen native to a fuel which,in most instances, is also available to the gasification reactionstaking place in the reactor. In this study, the relative oxygencontent (ROC) is used as a fuel-independent measure of thetotal oxygen available in the reactor. ROC, which has beenused previously in studies on biomass gasification [20], isdefined as follows [19]:
ROC ¼ O2 additional þ O2 fuel
O2 stoichþO2 fuelð1Þ
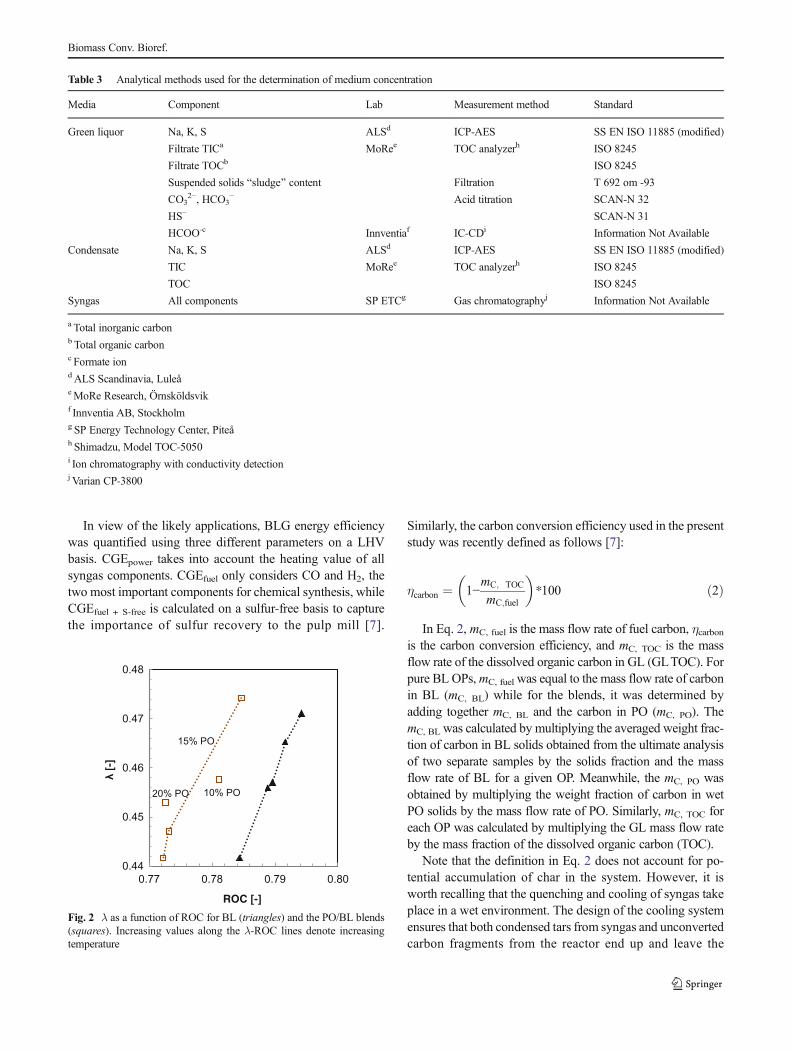
In Eq. 1, O2_additional stands for gaseous oxygen added tothe gasifier, O2_fuel represents the fuel oxygen content, andO2_stoich denotes the gaseous oxygen required for stoichiomet-ric combustion. The λ values of all OPs are plotted as a func-tion of ROC in Fig. 2. ROC and λ have a unique relationship
Fig. 1 The major processcomponents and key mediastreams
Table 1 The values of some keyprocess variables for all theoperating points (OPs)
10% PO 15% PO Std. 20% PO 15% PO hot 15% PO cold
Black liquor (kg/h) 887 812 733 806 805
Pyrolysis oil (kg/h) 100 145 185 145 145
O2/fuel (kg/kg) 0.310 0.313 0.326 0.331 0.307
Pressure (barg) 27.5 27.3 27.3 27.3 27.2
BL-1 Std. BL-2 Std. BL-3 Std. BL hot BL cold
Black liquor (kg/h) 1103 1103 1102 1104 1100
Pyrolysis oil (kg/h) 0 0 0 0 0
O2/fuel (kg/kg) 0.296 0.289 0.289 0.299 0.278
Pressure (barg) 27.9 27.5 27.4 27.7 27.1
Biomass Conv. Bioref.

for each distinct fuel composition, which is determined byboth the oxygen content of a fuel and the amount of addedgaseous oxygen. This is exemplified by the positions of thelines representing pure BL and the 15% PO blend relative toeach other. However, for a given blend ratio, each point alongthe λ-ROC line represents variations in the amount of addedgaseous oxygen alone, which in turn are caused by changes indesired operating temperatures. A comparison of the 10% POOP with one of the pure BL OPs shows that fuels with differ-ent compositions can give rather similar λ values even whentheir gasification is likely to produce syngas with significantlydifferent compositions. However, the differences betweenfuels are more clearly distinguishable in the ROC values,which capture variations in fuel oxygen content explicitly.Hence, compared with the λ value, ROC is believed to bebetter suited for directly comparing and assessing the effect
of fuel composition on certain gasification performance pa-rameters of varied biomass-based feedstocks.
Although Fig. 2 is based on a constant PO and BL solidscomposition (Table 2), it does incorporate the effect of varia-tions in BL solids fraction, which are chiefly responsible forany deviations from the straight line. The solids fraction in BLfrom the SKKPmill has been shown to vary cyclically [7], andit went down by nearly 2% over the course of the presentexperimental run. On Fig. 2, the standard OP lies much closerto the cold OP than to the hot OP for the 15% PO blend. Sinceadditional oxygen requirement is determined by controllingsyngas methane content, the amount needed to reach the setvalue of 1.2% was less than expected. One potential causemay be an uncontrolled variation in BL solids composition,which led to a small decrease in BL carbon content, and thusthe oxygen demand.
Table 2 Elemental analyses ofblack liquor (BL) and pyrolysisoil (PO) (on a wet basis)
Unit Average fraction Lab Measurement technique
Black liquor
C kg/kg BL 0.217a SPg Element analyzer
H kg/kg BL 0.057a SPg Element analyzer
N kg/kg BL 0.001a SPg Element analyzer
Cl kg/kg BL 0.001a SPg Ion chromatograph
Na kg/kg BL 0.139b ALSh ICP-AESc
K kg/kg BL 0.026b ALSh ICP-AESc
S kg/kg BL 0.045b ALSh ICP-AESc
O kg/kg BL 0.514 – By difference
Dry solids kg DS/kg BL 0.732 LTU GFi Drying and weighing
HHV BLa MJ/kg DS 11.75 SPg Bomb calorimetry
LHV BLa MJ/kg BL 7.91 – From HHV BL
Pyrolysis oil
C kg/kg PO 0.376 VTTj CHN analyzerd
H kg/kg PO 0.078 VTTj CHN analyzerd
N kg/kg PO 0.001% VTTj CHN analyzerd
O kg/kg PO 0.545% By difference
Dry solids kg DS/kg PO 0.701 VTTj Karl Fischer titratione
TAN mg KOH/g 64.4 VTTj Potentiometric titrationf
HHV PO MJ/kg DS 16.84 LTU ENk Bomb calorimetry
LHV PO MJ/kg PO 15.12 – From HHV using composition data
a Calculated from two samples taken at the beginning and the end of the experimental runb Calculated from ten samples spread over the experimental runc SS EN ISO 11885 (modified)d ASTM D 5291eASTM E 203f ASTM D 664g SP Research Institute of Sweden (Borås)h ALS Scandinavia, Luleåi LTU Green Fuels Plant (internal)j VTT Technical Research Centre of Finland Ltd.k LTU ENE Lab
Biomass Conv. Bioref.
In view of the likely applications, BLG energy efficiencywas quantified using three different parameters on a LHVbasis. CGEpower takes into account the heating value of allsyngas components. CGEfuel only considers CO and H2, thetwo most important components for chemical synthesis, whileCGEfuel + S-free is calculated on a sulfur-free basis to capturethe importance of sulfur recovery to the pulp mill [7].
Similarly, the carbon conversion efficiency used in the presentstudy was recently defined as follows [7]:
ηcarbon ¼ 1−mC; TOC
mC;fuel
� �*100 ð2Þ
In Eq. 2, mC, fuel is the mass flow rate of fuel carbon, ηcarbonis the carbon conversion efficiency, and mC, TOC is the massflow rate of the dissolved organic carbon in GL (GLTOC). Forpure BL OPs,mC, fuel was equal to the mass flow rate of carbonin BL (mC, BL) while for the blends, it was determined byadding together mC, BL and the carbon in PO (mC, PO). ThemC, BL was calculated by multiplying the averaged weight frac-tion of carbon in BL solids obtained from the ultimate analysisof two separate samples by the solids fraction and the massflow rate of BL for a given OP. Meanwhile, the mC, PO wasobtained by multiplying the weight fraction of carbon in wetPO solids by the mass flow rate of PO. Similarly, mC, TOC foreach OP was calculated by multiplying the GL mass flow rateby the mass fraction of the dissolved organic carbon (TOC).
Note that the definition in Eq. 2 does not account for po-tential accumulation of char in the system. However, it isworth recalling that the quenching and cooling of syngas takeplace in a wet environment. The design of the cooling systemensures that both condensed tars from syngas and unconvertedcarbon fragments from the reactor end up and leave the
Table 3 Analytical methods used for the determination of medium concentration
Media Component Lab Measurement method Standard
Green liquor Na, K, S ALSd ICP-AES SS EN ISO 11885 (modified)
Filtrate TICa MoRee TOC analyzerh ISO 8245
Filtrate TOCb ISO 8245
Suspended solids Bsludge^ content Filtration T 692 om -93
CO32−, HCO3
− Acid titration SCAN-N 32
HS− SCAN-N 31
HCOO-c Innventiaf IC-CDi Information Not Available
Condensate Na, K, S ALSd ICP-AES SS EN ISO 11885 (modified)
TIC MoRee TOC analyzerh ISO 8245
TOC ISO 8245
Syngas All components SP ETCg Gas chromatographyj Information Not Available
a Total inorganic carbonb Total organic carbonc Formate iondALS Scandinavia, LuleåeMoRe Research, Örnsköldsvikf Innventia AB, Stockholmg SP Energy Technology Center, Piteåh Shimadzu, Model TOC-5050i Ion chromatography with conductivity detectionj Varian CP-3800
0.44
0.45
0.46
0.47
0.48
0.77 0.78 0.79 0.80
λ[-
]
ROC [-]
10% PO20% PO
15% PO
Fig. 2 λ as a function of ROC for BL (triangles) and the PO/BL blends(squares). Increasing values along the λ-ROC lines denote increasingtemperature
Biomass Conv. Bioref.
gasifier in the liquid GL. Hence, char build-up is consideredunlikely to occur under steady-state operation, as supported bythe experience gained from continuous plant operation overlong periods [1].
3 Results and discussion
Overall, mass balance closures ranged from 94% to 100% andaveraged 97% for both BL and the blends. The deviationsappeared to be independent of fuel composition. In terms ofindividual elements, the deviations in carbon balance closuresdid not exceed 4% for any of the OPs. In contrast, sulfurbalance closures averaged 104% and returned a standard de-viation of 7.4%, with a maximum deviation of 19%. On theother hand, energy balance closures did not deviate by morethan 5%, which was in agreement with recent observations[7]. See Appendices A1 and B1 in the SupplementaryInformation for an extended discussion and a detailed break-down of the overall mass and energy balances by operationpoint.
3.1 Syngas composition
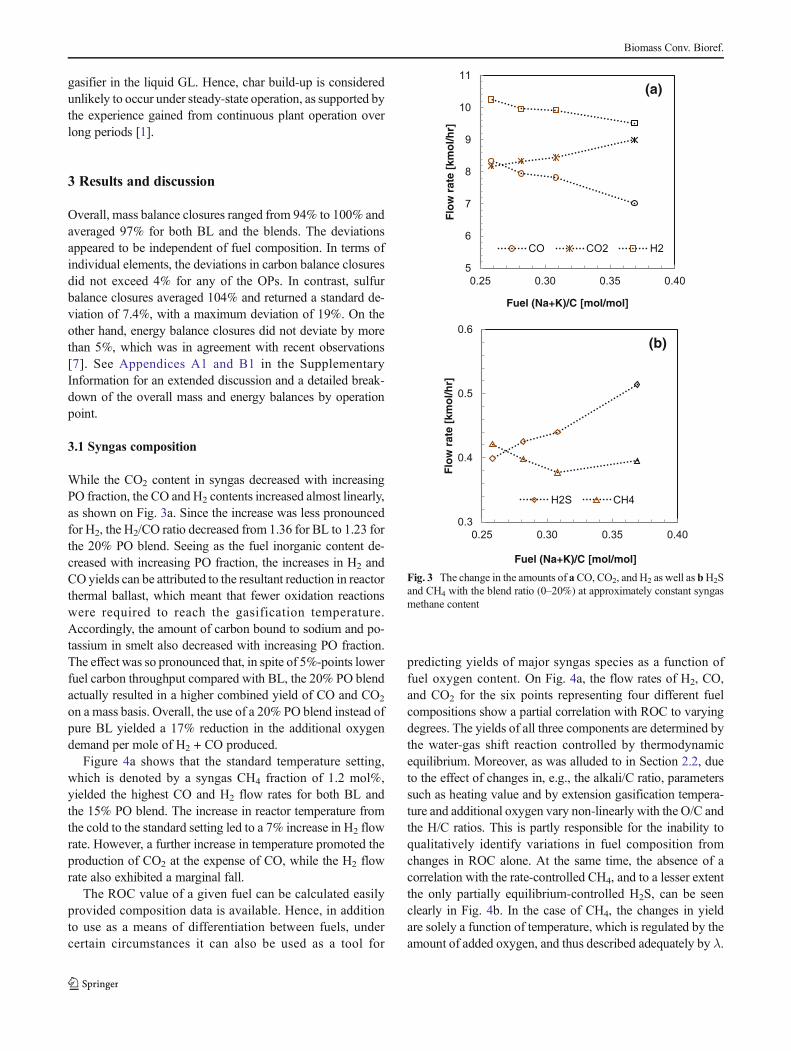
While the CO2 content in syngas decreased with increasingPO fraction, the CO and H2 contents increased almost linearly,as shown on Fig. 3a. Since the increase was less pronouncedfor H2, the H2/CO ratio decreased from 1.36 for BL to 1.23 forthe 20% PO blend. Seeing as the fuel inorganic content de-creased with increasing PO fraction, the increases in H2 andCO yields can be attributed to the resultant reduction in reactorthermal ballast, which meant that fewer oxidation reactionswere required to reach the gasification temperature.Accordingly, the amount of carbon bound to sodium and po-tassium in smelt also decreased with increasing PO fraction.The effect was so pronounced that, in spite of 5%-points lowerfuel carbon throughput compared with BL, the 20% PO blendactually resulted in a higher combined yield of CO and CO2
on a mass basis. Overall, the use of a 20% PO blend instead ofpure BL yielded a 17% reduction in the additional oxygendemand per mole of H2 + CO produced.
Figure 4a shows that the standard temperature setting,which is denoted by a syngas CH4 fraction of 1.2 mol%,yielded the highest CO and H2 flow rates for both BL andthe 15% PO blend. The increase in reactor temperature fromthe cold to the standard setting led to a 7% increase in H2 flowrate. However, a further increase in temperature promoted theproduction of CO2 at the expense of CO, while the H2 flowrate also exhibited a marginal fall.
The ROC value of a given fuel can be calculated easilyprovided composition data is available. Hence, in additionto use as a means of differentiation between fuels, undercertain circumstances it can also be used as a tool for
predicting yields of major syngas species as a function offuel oxygen content. On Fig. 4a, the flow rates of H2, CO,and CO2 for the six points representing four different fuelcompositions show a partial correlation with ROC to varyingdegrees. The yields of all three components are determined bythe water-gas shift reaction controlled by thermodynamicequilibrium. Moreover, as was alluded to in Section 2.2, dueto the effect of changes in, e.g., the alkali/C ratio, parameterssuch as heating value and by extension gasification tempera-ture and additional oxygen vary non-linearly with the O/C andthe H/C ratios. This is partly responsible for the inability toqualitatively identify variations in fuel composition fromchanges in ROC alone. At the same time, the absence of acorrelation with the rate-controlled CH4, and to a lesser extentthe only partially equilibrium-controlled H2S, can be seenclearly in Fig. 4b. In the case of CH4, the changes in yieldare solely a function of temperature, which is regulated by theamount of added oxygen, and thus described adequately by λ.
5
6
7
8
9
10
11
0.25 0.30 0.35 0.40
Flo
w r
ate
[km
ol/h
r]
Fuel (Na+K)/C [mol/mol]
CO CO2 H2
(a)
0.3
0.4
0.5
0.6
0.25 0.30 0.35 0.40
Flo
w r
ate
[km
ol/h
r]
Fuel (Na+K)/C [mol/mol]
H2S CH4
(b)
Fig. 3 The change in the amounts of aCO, CO2, and H2 as well as bH2Sand CH4 with the blend ratio (0–20%) at approximately constant syngasmethane content
Biomass Conv. Bioref.

3.2 Reactor temperature
The temperatures recorded by thermocouples (TCs) atthree different positions along the reactor length are plottedin Fig. 5 for both the PO/BL blends and pure BL as afunction of their CH4 content at the cold, standard, andhot temperature settings. In comparison with BL, the15% PO blend yielded slightly higher temperatures at allthree positions for the same CH4 content. The results inFig. 5 also confirm that the good correlation between themeasured temperatures and syngas CH4 for BL [8] holdstrue for the PO/BL blends as well. For the 15% PO blend,the correlation coefficients between the upper, middle, and
lower temperatures and CH4 were −0.99, −1.00, and −0.74.The thermocouple in the lower part of the reactor returnederratic readings both during and after the run that is circledon Fig. 5. The measured value is likely an underestimateand the erratic behavior may have been caused by a tem-porary build-up of smelt. In general, the correlations areparticularly good for the upper and middle arrays which arelocated closer to the flame than the lone bottom TC, whichis more likely to provide readings representative of thesyngas temperature at the reactor exit. Note that the presentresults are in agreement with observations that were madeduring the gasification of sulfite thick liquor in an earlierstudy. [8]
The temperature readings from the TCs mounted in thereactor wall are susceptible to conductive interference fromthe wall and radiation from the very hot flame in the upperpart of the reactor. However, experience has shown that therecorded readings can consistently reflect and mirror changesin operating conditions over a single experimental run. Thetemperature rises recorded in the present study are believed tobe inconsequential in terms of their impact on the life of therefractory lining.
Syngas from the blends was very clean as, irrespective offuel composition, C6H6 was the only higher hydrocarbonpresent in amounts greater than 20 ppm. Figure 6 shows thatthe flow rate of C6H6 increases with increasing CH4 for bothBL and the 15% PO blend. Interestingly, the blend yieldednoticeably less C6H6 than BL at nearly the same CH4 flowrate and the difference grew larger with decreasing tempera-ture. The phenomenon is currently under investigation.
5
6
7
8
9
10
11
0.77 0.78 0.79 0.80
Flo
w r
ate
[km
ol/h
r]
ROC [-]
CO-BL CO-15%PO
CO2-BL CO2-15%PO
H2-BL H2-15%PO
(a)
0.0
0.1
0.2
0.3
0.4
0.5
0.6
0.77 0.78 0.79 0.80
Flo
w r
ate
[km
ol/h
r]
ROC [-]
CH4-BL CH4-15%PO
H2S-BL H2S-15%PO
(b)
Fig. 4 The changes in a syngas CO, CO2, and H2 as well as b syngasH2S and CH4 contents with temperature for BL and a 15% PO blend.Increasing ROC values denote increasing temperature
940
990
1040
1090
1140
100 200 300 400 500 600
[er
utarep
meT
rotcae
R°C
]
CH4 [mol/hr]
15%PO-Upper BL-Upper
15%PO-Middle BL-Middle
15%PO-Lower BL-Lower
Fig. 5 The correlation between reactor temperature and CH4 for bothpure BL and the 15% PO blend. The upper, middle, and lower arraysrepresent temperature measurements along the length of the reactor
Biomass Conv. Bioref.

3.3 Sulfur release
The fraction of feedstock sulfur released as H2S, which is alsoreferred to as the sulfur split, varied between 31% and 35% forthe PO/BL blends and 28–31% for BL. Figure 3b shows thatthe decrease in fuel sulfur content with increasing PO fractionresulted in a corresponding decrease in the amount of sulfurrelease as H2S. As shown on Fig. 4b, the H2S flow rate de-creased by 6–7% between the hot and the cold temperaturesettings for both BL and the 15% PO blend. The extent of thesulfur released in gaseous form has been shown to reach amaximum at ~500–600 °C [21], and higher temperatures arethought to favor sulfur recapture [22]. The sulfur that is eitherrecaptured by volatilized sodium or retained in smelt reactswith steam and CO2 according to the reaction in Eq. 3.
Na2S lð Þ þ H2O gð Þ þ CO2 gð Þ
¼ Na2CO3 lð Þ þ H2S gð Þ→ΔHr ¼ �169:8 kJ.mol ð3Þ
A thermodynamic equilibrium study of BLG found aroundtwo thirds of the feedstock sulfur in the gas phase as H2S attemperatures above 800 °C and pressures above 20 bar [6].However, the sulfur split for both the blends and BL showsthat this was clearly not the case in the present study.Consequently, the reaction in Eq. 3 is only in partial thermo-dynamic equilibrium, and the final division of fuel sulfur be-tween smelt and syngas at the exit of the reactor is also subjectto kinetic limitations.
According to Le Chatelier’s Principle, an increase in reac-tor temperature would be expected to lead to an increase inNa2S formation at the expense of H2S, as the reaction in Eq. 3shifts to the left. A partial shift did occur, as the fraction of gas-phase sulfur decreased with temperature by up to 4%-pointsfor both BL and the 15% PO blend. On the other hand, the
split was found to increase with PO fraction, by up to 6%-points for the 20% PO blend. In this case, the partial equilib-rium is affected not only by the temperature, which increasesonly slightly with PO fraction, but also by the significantvariations in the concentrations of the gaseous components.
Similar to previous studies [4, 7], a trivial amount of sulfurwas also released in the form of COS at all OPs. The releasewas in the range 83–96 ppm, and it was not possible to iden-tify any correlation with fuel composition due to the hydroly-sis of COS in the quench tube [4]. The molar fraction of N2 insyngas did not exceed 1.6% for any of the OPs. As the tem-perature of the gasification products falls after entering thequench tube, the water-gas shift reaction produces more CO2
and H2. The extent of this shift, which is influenced by theorientation and flow rate of the cooling sprays [4], could notbe quantified, but the spray flow rates were set at 600 kg/h toensure constant cooling rates.
3.4 GL composition
Table 4 shows that aside from HCO3−, which is dependent
upon the magnitude of CO2 absorption, the flow rate of theother elements and ions decreased in proportion, albeit notwholly, with the fuel inorganic fraction. Consequently, withthe exception of the slightly anomalistic 15% PO OP, the GLbecame more dilute with an increasing PO fraction. In princi-ple, the elemental concentrations in GL are a product of fuelinorganic content and the amount of water added to the GLdissolver through the three water streams shown on Fig. A.1 inthe Supplementary Information. Although these streams pro-vide a means of regulating GL concentration, due to the de-sign and present setup of the cooling system, the range ofpossible concentrations is constrained by limits on minimumflows. Hence, in the interest of maximizing operational stabil-ity, the water flows into the GL dissolver were not reduced inproportion to the expected reduction in smelt flow. In theory,the system can be optimized to better regulate inflows andincrease the TTA by rebuilding the lower part of the gasifier.It has previously been shown that some of the syngas CO2 isabsorbed in the GL [4], which results in the destruction ofOH− and the formation of HCO3
− ions. The concentrationsof these ions, which were present in all GL samples, did notappear to vary systematically with fuel composition.
In Kraft pulping, any sulfur present in a form other thanNa2S or K2S does not play an active role in the cooking pro-cess, whichmeans that sulfide reduction efficiency needs to bemaximized. Sulfur reduction efficiency values of 100%withinmeasurement uncertainty limits had previously been reportedin an earlier study on the gasification of spent sulfite liquor [8].Interestingly and somewhat unexpectedly, as seen in Table 4,the HS− concentrations found in the GL were consistentlylower than total S concentrations for both BL and the blends.At the same time, the correlation coefficient between the HS−
0
2
4
6
8
10
12
100 200 300 400 500 600
C6H
6 [
mo
l/hr]
CH4 [mol/hr]
15% PO
Black liquor
Fig. 6 The flow rate of C6H6 as a function of CH4 (and thus temperature)for both BL and the 15% PO blend. Decreasing CH4 and C6H6 contentsdenote increasing temperature
Biomass Conv. Bioref.

and the total S concentrations was 0.90, which supported therelative accuracy of the measurements. The methods used forthe determination of HS− and total S concentrations in GLhave specified relative measurement uncertainties of 15%and 10%, which is of the same order of magnitude as thedifferences between the values (10–30% relative to HS−).Moreover, GL from the BLG pilot plant is extremely sensitiveto oxidation during sample preparation, which makes thequantification of reduced sulfur forms, such as sulfide ions,very difficult. Consequently, a complete characterization ofthe GL sulfur species could not be carried out. Given the highreduction efficiencies seen previously, the differences betweentotal S and HS− concentrations may be due to systematicanalysis-related errors. Nonetheless, in light of the above re-sults and given the significance of sulfur recovery, the possi-bility of the presence of non-reduced forms of sulfur in GLneeds to be considered in future work.
The changes in the total organic carbon, total inorganiccarbon, and sludge content with increasing PO fraction areshown in Fig. 7. GL sludge fractions and TOC concentra-tions in the GL filtrate from both the blends and BL werecomparable and did not vary systematically. In contrast, asexpected, the TIC content decreased linearly since it isdirectly related to fuel inorganic content. Carbon found informate ions constituted 23–41% of the TOC in the GLfiltrate from the PO/BL blends and 24–49% from BL.The rest of the GL TOC is believed to be mainly tars con-densed during quenching and gas cooling as discussed in arecent publication [7]. However, in the absence of a meth-od for detailed TOC characterization, it is not possible togo much beyond reasoned speculation. In the aforemen-tioned study, the carbon present as formate had made up10–28% of GL TOC and measured formate concentrationshad correlated reasonably well with the partial pressure ofthe CO in syngas [7]. However, such a correlation was notfound here for reasons that are not presently clear.
Figure 8 shows that, irrespective of fuel composition, nei-ther GLTIC nor GL sludge showed a meaningful change withtemperature. While GL TOC did vary for both BL and the15% PO blend, the changes did not appear to be systematic.In both Figs. 7 and 8, the error bars on the TOC concentrationsrepresent an estimated measurement uncertainty of 15%. Itcan be seen that although the uncertainties overlap partially,the range of the variations exceeds measurement uncertainty,which was also found to be the case in an earlier study [7].Coupled to the fact that TOC variations did not appear to be afunction of the most probable process parameters such as fuelcomposition, temperature, or load, this points to the presenceof currently unknown, non-controllable factors which influ-ence GL TOC.
3.5 Carbon conversion efficiency
The gasification of the PO/BL blends yielded carbon conver-sion efficiencies of 98.8–99.5%. These values increase to 99.0–
Table 4 The concentrations ofthe most important ions andelements in green liquor from thethree pyrolysis oil/blends
BL onlyb 10% PO 15% PO 20% PO
S (mol/L)a 0.51 0.36 0.39 0.29
Na (mol/L)a 3.20 2.14 2.36 1.84
K (mol/L)a 0.34 0.24 0.26 0.20
HCO3− (mol/L) 0.21 0.18 0.18 0.21
HS− (mol/L) 0.42 0.30 0.30 0.27
CO32− (mol/L) 1.27 0.95 0.92 0.82
HCOO− (mol/L) 0.03 0.02 0.02 0.03
Total titrable alkali (mol/L) 3.54 2.38 2.62 2.04
(S + 2*CO32− + HCO3
−)/(Na + K) (mol/mol) 95% 103% 92% 104%
Sulfidity—S/(Na + K)2 (mol/mol) 28.9% 29.9% 29.8% 28.5%
a S, Na, and K concentrations have a measurement uncertainty of 10%b The concentrations are averages of measurements from BL OPs at the same thermal load as the PO/BL blends
0
3
6
9
12
15
18
0.3
0.6
0.9
1.2
1.5
1.8
0.24 0.29 0.34 0.39
TIC
in G
L [g
/L G
L]
]LG
L/g[L
Gni
egdulsdna
COT
Fuel (Na+K)/C [mol/mol]
Sludge in GL
TOC in GL
TIC in GL
Fig. 7 The effect of the blend ratio (0–20%) on sludge (left vertical axis),TOC (left vertical axis), and TIC (right vertical axis) concentrations in GL
Biomass Conv. Bioref.
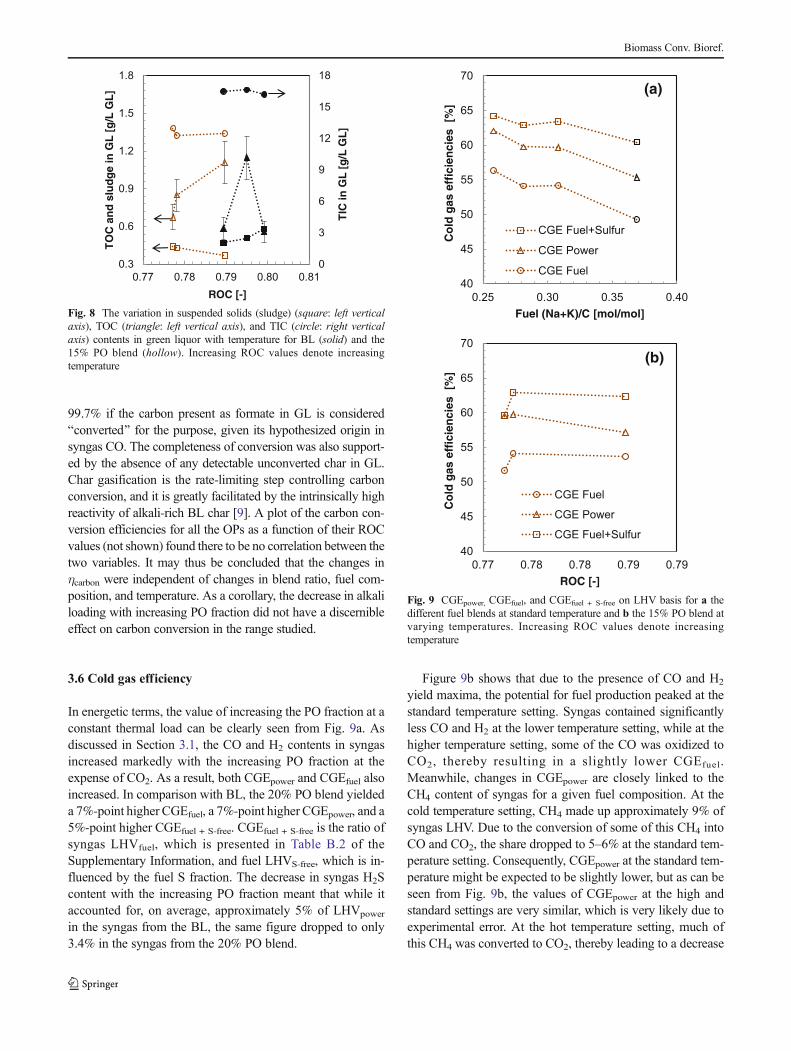
99.7% if the carbon present as formate in GL is consideredBconverted^ for the purpose, given its hypothesized origin insyngas CO. The completeness of conversion was also support-ed by the absence of any detectable unconverted char in GL.Char gasification is the rate-limiting step controlling carbonconversion, and it is greatly facilitated by the intrinsically highreactivity of alkali-rich BL char [9]. A plot of the carbon con-version efficiencies for all the OPs as a function of their ROCvalues (not shown) found there to be no correlation between thetwo variables. It may thus be concluded that the changes inηcarbon were independent of changes in blend ratio, fuel com-position, and temperature. As a corollary, the decrease in alkaliloading with increasing PO fraction did not have a discernibleeffect on carbon conversion in the range studied.
3.6 Cold gas efficiency
In energetic terms, the value of increasing the PO fraction at aconstant thermal load can be clearly seen from Fig. 9a. Asdiscussed in Section 3.1, the CO and H2 contents in syngasincreased markedly with the increasing PO fraction at theexpense of CO2. As a result, both CGEpower and CGEfuel alsoincreased. In comparison with BL, the 20% PO blend yieldeda 7%-point higher CGEfuel, a 7%-point higher CGEpower, and a5%-point higher CGEfuel + S-free. CGEfuel + S-free is the ratio ofsyngas LHVfuel, which is presented in Table B.2 of theSupplementary Information, and fuel LHVS-free, which is in-fluenced by the fuel S fraction. The decrease in syngas H2Scontent with the increasing PO fraction meant that while itaccounted for, on average, approximately 5% of LHVpower
in the syngas from the BL, the same figure dropped to only3.4% in the syngas from the 20% PO blend.
Figure 9b shows that due to the presence of CO and H2
yield maxima, the potential for fuel production peaked at thestandard temperature setting. Syngas contained significantlyless CO and H2 at the lower temperature setting, while at thehigher temperature setting, some of the CO was oxidized toCO2, thereby resulting in a slightly lower CGEfuel.Meanwhile, changes in CGEpower are closely linked to theCH4 content of syngas for a given fuel composition. At thecold temperature setting, CH4 made up approximately 9% ofsyngas LHV. Due to the conversion of some of this CH4 intoCO and CO2, the share dropped to 5–6% at the standard tem-perature setting. Consequently, CGEpower at the standard tem-perature might be expected to be slightly lower, but as can beseen from Fig. 9b, the values of CGEpower at the high andstandard settings are very similar, which is very likely due toexperimental error. At the hot temperature setting, much ofthis CH4 was converted to CO2, thereby leading to a decrease
40
45
50
55
60
65
70
0.25 0.30 0.35 0.40
seicneiciffe
sag
dlo
C[%
]
Fuel (Na+K)/C [mol/mol]
CGE Fuel+Sulfur
CGE Power
CGE Fuel
(a)
40
45
50
55
60
65
70
0.77 0.78 0.78 0.79 0.79
seicneiciffe
sag
dlo
C[%
]
ROC [-]
CGE Fuel
CGE Power
CGE Fuel+Sulfur
(b)
Fig. 9 CGEpower, CGEfuel, and CGEfuel + S-free on LHV basis for a thedifferent fuel blends at standard temperature and b the 15% PO blend atvarying temperatures. Increasing ROC values denote increasingtemperature
0
3
6
9
12
15
18
0.3
0.6
0.9
1.2
1.5
1.8
0.77 0.78 0.79 0.80 0.81
TIC
in G
L [
g/L
GL
]
]L
GL/
g[L
Gni
eg
duls
dna
CO
T
ROC [-]
Fig. 8 The variation in suspended solids (sludge) (square: left verticalaxis), TOC (triangle: left vertical axis), and TIC (circle: right verticalaxis) contents in green liquor with temperature for BL (solid) and the15% PO blend (hollow). Increasing ROC values denote increasingtemperature
Biomass Conv. Bioref.
in the syngas heating value. It is likely that the standard tem-perature setting represents a close-to-optimal point for biofuelproduction within the operating envelope of the gasifier.
4 Concluding remarks
The results of this study demonstrate that a pilot plant de-signed for the gasification of BL needs only minor modifica-tions, such as the addition of a PO/BL mixer, in order tosuccessfully gasify PO/BL blends. In general, the blendingof BL with PO had a notably positive impact on the perfor-mance of the gasification process. Importantly, carbon conver-sion did not vary systematically with fuel composition, whichshows quite clearly that the addition of up to 20% PO on amass basis does not degrade the catalytic activity of BL Na.There were no signs of an increase in either soot or tar forma-tion. The blends yielded cold gas efficiencies that were mark-edly greater in comparison to those of BL at the same thermalload.
The composition of syngas from unblended BL and the15% PO blend exhibited largely similar behavior in responseto changes in temperature; in both cases, the standard temper-ature setting appeared to represent the optimum for biofuelproduction. In comparison with unblended BL, the oxygenconsumption of PO/BL blends was higher per kilogram offeed, but lower per MWof syngas H2 + CO. It is believed thatROC can be useful as a tool for predicting trends in yields ofmajor syngas species from ash-free biomass feedstocks forvarying feedstock composition and gasification temperature.
The fate of sulfur is of significant consequence to the re-covery of pulping chemicals and the integration of BLGwith apulp mill. The fraction of sulfur that ends up in the syngas wassomewhat higher for the PO/BL blends than for BL. Due toanalytical difficulties, the sulfur reduction efficiency was un-certain. Based on the results of this study, the gasification ofblends with even higher PO fractions appears to be practicallyfeasible. The mixing characteristics of the PO/BL blends arecurrently the subject of active research. Future work in thisarea is needed on (i) method development for better charac-terization of GLTOC, (ii) quantification of the effect of long-term variations in fuel composition on process performance,and (iii) the study of the sulfur chemistry in GL and the syngascooling system.
Acknowledgments The operating staff at the LTU Green Fuels pilotplant is acknowledged for their skilled work during the experiments.
Compliance with ethical standards
Source of funding This work was supported by the Swedish EnergyAgency and the industry consortium in the LTU Biosyngas Program. Thefunders were not involved in study design; in the collection, analysis, and
interpretation of data; in the writing of the manuscript; and in the decisionto submit the article for publication.
Open Access This article is distributed under the terms of the CreativeCommons At t r ibut ion 4 .0 In te rna t ional License (h t tp : / /creativecommons.org/licenses/by/4.0/), which permits unrestricted use,distribution, and reproduction in any medium, provided you giveappropriate credit to the original author(s) and the source, provide a linkto the Creative Commons license, and indicate if changes were made.
References
1. Landälv I, Gebart R, Marke B, Granberg F, Furusjö E, Löwnertz Pet al (2014) Two years experience of the BioDME Project—a com-plete wood towheel concept. Environ Prog Sustain Energy 33:744–750
2. Haro P, Johnsson F, Thunman H (2016) Improved syngas process-ing for enhanced Bio-SNG production: a techno-economic assess-ment. Energy 101:380–389. doi:10.1016/j.energy.2016.02.037
3. Öhrman O, Häggström C,Wiinikka H, Hedlund J, Gebart R (2012)Analysis of trace components in synthesis gas generated by blackliquor gasification. Fuel 102:173–179. doi:10.1016/j.fuel.2012.05.052
4. Wiinikka H, Carlsson P, Marklund M, Grönberg C, Pettersson E,Lidman M et al (2012) Experimental investigation of an industrialscale black liquor gasifier. Part 2: influence of quench operation onproduct gas composition. Fuel 93:117–129. doi:10.1016/j.fuel.2011.06.066
5. Carlsson P, Wiinikka H, Marklund M, Grönberg C, Pettersson E,Lidman M et al (2010) Experimental investigation of an industrialscale black liquor gasifier. 1. The effect of reactor operation param-eters on product gas composition. Fuel 89:4025–4034. doi:10.1016/j.fuel.2010.05.003
6. Carlsson P, Marklund M, Furusjö E, Wiinikka H, Gebart R (2010)Experiments and mathematical models of black liquor gasifica-tion—influence of minor gas components on temperature, gas com-position, and fixed carbon conversion. TAPPI J 9:15–24
7. Jafri Y, Furusjö E, Kirtania K, Gebart R (2015) Performance of anentrained-flow black liquor gasifier. Energy Fuel. doi:10.1021/acs.energyfuels.6b00349
8. Furusjö E, Stare R, Landälv I, Löwnertz P (2014) Pilot scale gasi-fication of spent cooking liquor from sodium sulfite baseddelignification. Energy Fuel 28:7517–7526. doi:10.1021/ef501753h
9. Bach-Oller A, Furusjö E, Umeki K (2014) Fuel conversion charac-teristics of black liquor and pyrolysis oil mixtures: efficient gasifi-cation with inherent catalyst. Biomass Bioenergy 79:155–165.doi:10.1016/j.biombioe.2015.04.008
10. Consonni S, Katofsky RE, Larson ED (2009) A gasification-basedbiorefinery for the pulp and paper industry. Chem Eng Res Des 87:1293–1317. doi:10.1016/j.cherd.2009.07.017
11. Edwards R, Hass H, Larivé J-F, Lonza L, Mass H, Rickeard D.(2014) Well-to-wheel analysis of future automotive fuels andpowertrains in the European context, well-to-wheels Appendix 2 -Version 4.a, reference list. doi:10.2790/95533.
12. Andersson J, Furusjö E, Wetterlund E, Lundgren J, Landälv I(2016) Co-gasification of black liquor and pyrolysis oil: evaluationof blend ratios andmethanol production capacities. Energy ConversManag 110:240–248. doi:10.1016/j.enconman.2015.12.027
13. Andersson J, Lundgren J, Furusjö E, Landälv I (2015) Co-gasification of pyrolysis oil and black liquor for methanol produc-tion. Fuel 158:451–459. doi:10.1016/j.fuel.2015.05.044
Biomass Conv. Bioref.

14. Wood BJ, Sancier KM (1984) The mechanism of the catalytic gas-ification of coal char—a critical-review. Catal Rev Eng 26:233–279
15. Struis RPWJ, von Scala C, Stucki S, Prins R et al (2002)Gasification reactivity of charcoal with CO2. Part II: metal catalysisas a function of conversion. Chem Eng Sci 57:3593–3602.doi:10.1016/S0009-2509(02)00255-5
16. Perander M, DeMartini N, Brink A, Kramb J, Karlström O,Hemming J et al (2015) Catalytic effect of Ca and K on CO2gasification of spruce wood char. Fuel 150:464–472. doi:10.1016/j.fuel.2015.02.062
17. Prins MJ, Ptasinski KJ, Janssen FJJG (2007) From coal to biomassgasification: comparison of thermodynamic efficiency. Energy 32:1248–1259. doi:10.1016/j.energy.2006.07.017
18. Weiland F, Wiinikka H, Hedman H, Wennebro J, Pettersson E,Gebart R (2015) Influence of process parameters on the performance
of an oxygen blown entrained flow biomass gasifier. Fuel 153:510–519. doi:10.1016/j.fuel.2015.03.041
19. Stemmler M, Müller M (2010) Theoretical evaluation of feedstockgasification using H2/C ratio and ROC as main input variables. IndEng Chem Res 49:9230–9237. doi:10.1021/ie100726b
20. Weiland F, NordwaegerM, Olofsson I,Wiinikka H, Nordin A (2014)Entrained flow gasification of torrefied wood residues. Fuel ProcessTechnol 125:51–58. doi:10.1016/j.fuproc.2014.03.026
21. Whitty K, Kullberg M, Sorvari V, Backman R, Hupa M (2008)Influence of pressure on pyrolysis of black liquor: 2. Char yieldsand component release. Bioresour Technol 99:671–679.doi:10.1016/j.biortech.2006.11.064
22. Whitty K. (1997) Pyrolysis and gasification behavior of black li-quor under pressurized conditions. Department of ChemicalEngineering, Åbo Akademi University
Biomass Conv. Bioref.