Embed Size (px)
Citation preview

A STUDY OF CHEMICAL PHOSPHORUS REMOVAL
AT FOUR SEWAGE TREATMENT PLANTS
by
MURRAY TOD SCHROEDER
A thesis submitted in partial fulfillment of the
requirements for the degree of
MASTER OF SCIENCE IN
CIVIL ENGINEERING
at the
UNIVERSITY OF WISCONSIN - MADISON

A STUDY OF CHEMICAL PHOSPHORUS REMOVAL
AT FOUR SEWAGE TREATMENT PLANTS
by
MURRAY TOD SCHROEDER
A thesis submitted in partial fulfillment of the
requirements for the degree of
MASTER OF SCIENCE IN
CIVIL ENGINEERING
at the
UNIVERSITY OF WISCONSIN - MADISON
ACKNOWLEDGMENTS
I would l i k e t o thank D r . P.M. Berthouex f o r h i s h e l p , The Soap and
De te rgen t A s s o c i a t i o n f o r funding, D r . Ke i th Booman and Richard
Sedlak f o r t h e i r a d v i c e and p a t i e n c e , and t h e management s t a f f a t t h e
Blue P l a i n s , Piscataway, Jones I s l a n d , and South Shore t r e a t m e n t
p l a n t s p l a n t s f o r t h e i r i n v a l u a b l e , f r e e l y g i v e n i n f o r m a t i o n .
S p e c i a l t h a n k s a r e a l s o ex tended t o my fami ly , my o l d f r i e n d s , my many
new f r i e n d s , and Tammy, my devo ted t y p i s t .

CHAPTER ONE: INTRODUCTION
1 . 1 PROBLEM STATEMENT
1 . 2 OBJECTIVES
1 . 3 SCOPE OF STUDY
1 . 4 METHODS
TABLE OF CONTENTS
CHAPTER TWO: CHEMICAL PHOSPHORUS REMOVAL THEORY
2 . 1 BACKGROUND
2 . 2 PRECIPITATION MODELS
2 . 3 SLUDGE PRODUCTION
2 . 3 . 1 Wastewater Conditions
2 . 3 . 2 Chemical Precipitant
2 . 3 . 3 Point of Chemical Addition
2 . 3 . 4 Estimating Chemical Sludge Production
CHAPTER THREE: BLUE PLAINS W T P
3 . 1 BACKGROUND
3 . 2 PROCESS DESCRIPTION
3 . 3 OPERATIONS DATA
3 . 4 RAW INFLUENT CONDITIONS
3 . 5 PRIMARY PHOSPHORUS REMOVAL
3 . 3 . 1 Recycle Flows
3 . 3 . 2 Soluble Phosphorus Removal
3 . 3 . 3 Alkalinity and pH
3 . 3 . 4 BOD, TSS, and TP
3 . 6 PRIMARY SLUDGE PRODUCTION
3 . 7 SECONDARY PHOSPHORUS REMOVAL
3 . 7 . 1 I n f l u e n t C o n d i t i o n s
3 . 7 . 2 S e c o n d a r y I r o n D o s i n g
3 . 7 . 3 S o l u b l e P h o s p h o r u s R e m o v a l
3 . 7 . 4 pH and A l k a l i n i t y
3 . 7 . 5 BOD, T S S , and TP
3 . 7 . 6 B i o l o g i c a l R e m o v a l
3 . 8 SECONDARY SLUDGE PRODUCTION
CHAPTER FOUR: BLUE PLAINS REGRESSION ANALYSIS
4 . 1 GENERAL INFORMATION
4 . 2 PRIMARY PHOSPHORUS REMOVAL
4 . 2 . 1 E a s t P l a n t
4 . 2 . 2 West P l a n t
4 . 3 EFFECT OF IRON TYPE
4 . 4 PRIMARY SLUDGE PRODUCTION
4 . 5 SECONDARY PHOSPHORUS REMOVAL
4 . 6 SECONDARY SLUDGE PRODUCTION
4 . 6 . 1 E a s t P l a n t
4 . 6 . 2 West P l a n t
4 . 7 SUMMARY
CHAPTER F I V E : PISCATAWAY WWTP
5 . 1 BACKGROUND
5 . 2 PROCESS DESCRIPTION
5 . 3 OPERATIONS DATA
5 . 4 RAW INFLUENT CONDITIONS
5 . 5 RECYCLE FLOWS
5 . 6 SECONDARY PHOSPHORUS REMOVAL
5 . 6 . 1 A l k a l i n i t y and pH
5 . 6 . 2 B i o l o g i c a l R e m o v a l
5 . 6 . 3 BOD, TSS, a n d T P
iii
5 .7 TERTIARY PHOSPHORUS REMOVAL
5 . 7 . 1 Alkalinity and pH
5.7.2 BOD, TSS, and TP
CHAPTER SIX: PISCATAWAY REGRESSION ANALYSIS
6 . 1 STATISTICAL ANALYSIS
6 . 1 . 1 Secondary Treatment Process
6.1.2 Nitrification Process
6.2 SUMMARY
CHAPTER SEVEN: SOUTH SHORE WWTP
7 . 1 BACKGROUND
7 . 2 PROCESS DESCRIPTION
7 . 3 OPERATIONS DATA
7 . 4 RAW INFLUENT CONDITIONS
7 . 5 PRIMARY PHOSPHORUS REMOVAL
7 . 5 . 1 Recycle Flows
7 . 5 . 2 Soluble Phosphorus Removal
7 . 5 . 3 pH
7 . 5 . 4 BOD, TSS, and TP
7 . 6 SECONDARY PHOSPHORUS REMOVAL
7 . 7 PRIMARY SLUDGE PRODUCTION
CHAPTER EIGHT: SOUTH SHORE REGRESSION ANALYSIS
8 . 1 SOLUBLE PHOSPHORUS REMOVAL
8 . 1 . 1 Pre-Oxidized WPL Addition
8.1.2 Oxidized WPL Addition
8 . 2 PRIMARY SLUDGE PRODUCTION
8 . 2 . 1 Pre-Oxidized WPL Addition
8.2.2 Oxidized WPL Addition
8 . 3 SUMMARY
CHAPTER NINE: JONES ISLAND WWTP
9.1 BACKGROUND
9.2 PROCESS DESCRIPTION
9.3 OPERATIONS DATA
9.4 RAW INFLUENT CONDITIONS
9.5 EAST PLANT
9.5.1 Soluble Phosphorus Removal
9.5.2 pH
9.5.3 Biological Removal
9.5.4 BOD, TSS, and TP
9.6 WEST PLANT
9.7 SLUDGE PRODUCTION
9.8 SUMMARY
CHAPTER TEN: CONCLUSIONS AND RECOMMENDATIONS
10.1 CONCLUSIONS
10.1.1 Blue Plains Treatment Plant
10.1.2 Piscataway Treatment Plant
10.1.3 South Shore Treatment Plant
10.1.4 Jones Island Treatment Plant
10.1.5 General Conclusions
10.2 RECOMMENDATIONS
REFERENCES
APPENDIX A: NOTATION
APPENDIX B: SENSITIVITY ANALYSIS
APPENDIX C: REGRESSION OUTPUT

LIST OF FIGURES
F i g u r e 2-1 I r o n Phosphate P r e c i p i t a t i o n Schematic Page
13
F i g u r e 2-2 OSP Removal v s . I r o n Dose, i n A c t i v a t e d Sludge 1 6
F i g u r e 2-3 Fe/Pc Mole ~ a t i o v s . OSP C o n c e n t r a t i o n , i n
A c t i v a t e d Sludge
F i g u r e 2-4 Sludge Genera t ion v s . E f f l u e n t TP, Data from Chesapeake Bay and Grea t Lakes Basin Treatment P l a n t s 20
F i g u r e 2-5 S e n s i t i v i t y of P r e d i c t e d Chemical S ludge Produc t ion t o Changes i n I n f l u e n t and E f f l u e n t C o n c e n t r a t i o n s 2 8
F i g u r e 3-1 Blue P l a i n s P rocess Flow Diagram 3 1
F i g u r e 3-2 Blue P l a i n s E a s t Primary P r o c e s s Data 3 5
F i g u r e 3-3 Blue P l a i n s West Primary P r o c e s s Data 3 6
F i g u r e 3-4 Blue P l a i n s E a s t Secondary Process Data 3 7
F i g u r e 3-5 Blue P l a i n s West Secondary Process Data 3 8
F i g u r e 3-6 Blue P l a i n s Raw I n f l u e n t Flow 4 1
F i g u r e 3-7 Blue P l a i n s Combined Raw I n f l u e n t , BOD C o n c e n t r a t i o n v s . Year, BOD Mass Loading v s . Year, BOD C o n c e n t r a t i o n v s . Mass Loading, and BOD Concen t ra t ion v s . Flow 4 2
F i g u r e 3-8 Blue P l a i n s Combined Raw I n f l u e n t , TSS C o n c e n t r a t i o n v s . Year, TSS Mass Loading v s . Year, TSS C o n c e n t r a t i o n v s . Mass Loading, and TSS Concen t ra t ion v s . Flow 4 3
F igure 3-9 Blue P l a i n s Combined Raw I n f l u e n t , TP C o n c e n t r a t i o n v s . Year, TP Mass Loading v s . Year, TP C o n c e n t r a t i o n v s . Mass Loading, and TP C o n c e n t r a t i o n v s . Flow 4 4
F i g u r e 3-10 Blue P l a i n s Combined Raw I n f l u e n t , SP C o n c e n t r a t i o n v s . Year, SP Mass Loading v s . Year, SP C o n c e n t r a t i o n v s . Mass Loading, and SP Concen t ra t ion v s . Flow 4 5
F igure 3-11 Blue P l a i n s Combined Raw I n f l u e n t , Par t -P Concen t ra t ion v s . Year, Par t -P Mas3 Loading v s . Year, Par t -P C o n c e n t r a t i o n vs.Mass Loading, and Par t -P Concen t ra t ion v s . Flow 4 6

Figure 3-12 Blue P l a i n s F r a c t i o n o f BOD, TSS, and TP i n West Primary I n f l u e n t , O r i g i n a t i n g from GTOR 4 8
F i g u r e 3-13 Blue P l a i n s SP I n f l u e n t and E f f l u e n t v s . Year, and SP Removed and Fe Dose v s . Year 4 9
Figure 3-14 Blue P l a i n s Primary, SP Removed v s . Fe Dose, and E f f l u e n t SP v s . Fe Dose
F igure 3-15 Blue P l a i n s Primary, SP Removed v s . I n f l u e n t SP, and SP E f f l u e n t v s . SP I n f l u e n t
F igure 3-16 Blue P l a i n s Prirnary, I n f l u e n t SP v s . Fe Dose
F igure 3-17 Blue P l a i n s Primary, Fe/Pc Mole R a t i o v s . SP
E f f l u e n t , and Fe/Pc Mole R a t i o v s . Year
F igure 3-18 Blue P l a i n s Prirnary, Secondary I n f l u e n t pH v s . Fe Dose, and Secondary I n f l u e n t A l k a l i n i t y v s . Primary Fe Dose
F igure 3-19 Blue P l a i n s Primary, BOD I n f l u e n t and E f f l u e n t v s . Year, and BOD Removed and Fe Dose v s . Year
F igure 3-20 Blue P l a i n s Primary, BOD Removed v s . Fe Dose, and E f f l u e n t BOD v s . Fe Dose
F igure 3-21 Blue P l a i n s Primary, TSS I n f l u e n t and E f f l u e n t v s . Year, and TSS Removed and Fe Dose v s . Year
F igure 3-22 Blue P l a i n s Prirnary, TSS Removed v s . Fe Dose, and E f f l u e n t TSS v s . Fe Dose
F igure 3-23 Blue P l a i n s Prirnary, BOD Removed v s . TSS Removed
F igure 3-24 Blue P l a i n s Primary, TP I n f l u e n t and E f f l u e n t v s . Year, and TP Removed and Fe Dose vs Year
F igure 3-25 Blue P l a i n s Prirnary, TP Removed v s . Fe Dose, and E f f l u e n t TP v s . Fe Dose
F igure 3-26 Blue P l a i n s Primary, Reported Sludge and I r o n Dose, Reported Sludge, TSS Removed, and P r e d i c t e d Chemical Sludge, and Percen t Chemical Sludge 6 6
F igure 3-27 Blue P l a i n s Primary, Sludge Produc t ion v s . Flow and I r o n Dose 6 8
v i i

Figure 3-28 Blue P l a i n s Primary, Sludge Produc t ion v s . TSS Removed, Fe Dose, P r e d i c t e d Primary Chemical Sludge, and SP Removed
F igure 3-29 Blue P l a i n s Percen tage of BOD, TSS and TP i n E a s t Secondary I n f l u e n t O r i g i n a t i n g from SPBR
F i g u r e 3-30 Blue P l a i n s Percen tage of BOD, TSS and TP i n west Secondary I n f l u e n t O r i g i n a t i n g from SPBR and GTOR
F i g u r e 3-31 Blue P l a i n s SPBR C o n t r i b u t i o n of BOD, TSS and TP t o E a s t Secondary I n f l u e n t
F igure 3-32 Blue P l a i n s SPBR and GTOR C o n t r i b u t i o n of BOD, TSS, and TP t o W e s t Secondary I n f l u e n t
F igure 3-33 Blue P l a i n s Flows of Secondary I n f l u e n t Recycle Streams, SPBR t o Eas t Secondary, GTOR t o W e s t Secondary, and SPBR t o West Secondary
F igure 3-34 Blue P l a i n s Secondary, Percen tage of WPL Fe i n T o t a l Fe Dose
F i g u r e 3-35 Blue P l a i n s Secondary, SP I n f l u e n t and E f f l u e n t v s . Year, and SP Removed and Fe Dose v s . Year
~ i g u r e 3-36 Blue P l a i n s Secondary, SP Removed v s . Fe Dose, and E f f l u e n t SP v s . Fe Dose
F i g u r e 3-37 Blue P l a i n s Secondary, Fe/Pc Mole R a t i o v s . SP
E f f l u e n t , and Fe/Pc Mole R a t i o v s . Year
F i g u r e 3-38 Blue P l a i n s Secondary, SP Removed v s . I n i t i a l SP, and SP E f f l u e n t v s . I n i t i a l SP
F igure 3-39 Blue P l a i n s Secondary, Log 10 ( E f f l u e n t SP, m o l / l )
v s . E f f l u e n t pH
Figure 3-40 Blue P l a i n s Primary and Secondary SP. E f f l u e n t v s . SP I n f l u e n t , and Fe/Pc Mole R a t i o v s . SP
E f f l u e n t
F igure 3-41 B l O e P l a i n s Secondary, pH I n f l u e n t and E f f l u e n t v s . Year, and pH Removed and Fe Dose v s . Year
viii

F i g u r e 3-42 Blue P l a i n s Secondary, pH Change v s . Fe Dose, and E f f l u e n t pH v s . Fe Dose 8 7
F i g u r e 3-43 Blue P l a i n s Secondary, A l k a l i n i t y I n f l u e n t and E f f l u e n t v s . Year, and A l k a l i n i t y Removed and Fe Dose v s . Year 89
F i g u r e 3-44 Blue P l a i n s Secondary, A l k a l i n i t y Removed v s . Fe Dose and E f f l u e n t A l k a l i n i t y v s . Fe Dose 9 0
F i g u r e 3-45 Blue P l a i n s Secondary, pH Change v s . I n f l u e n t A l k a l i n i t y , and pH E f f l u e n t v s . I n f l u e n t A l k a l i n i t y 9 1
F i g u r e 3-46 Blue P l a i n s Secondary, BOD I n f l u e n t and E f f l u e n t v s . Year, and BOD Removed and Fe Dose v s . Year 9 3
F i g u r e 3-47 Blue P l a i n s Secondary, BOD Removed v s . Fe Dose, and E f f l u e n t BOD v s . Fe Dose 9 4
F i g u r e 3-48 Blue P l a i n s Secondary, TSS I n f l u e n t and E f f l u e n t v s . Year, and TSS Removed and Fe Dose v s . Year 9 5
F i g u r e 3-49 Blue P l a i n s Secondary, TSS Removed v s . Fe Dose, and E f f l u e n t TSS v s . Fe Dose 9 6
F i g u r e 3-50 Blue P l a i n s Secondary, TP I n f l u e n t a n d E f f l u e n t v s . Year, and TP Removed and Fe Dose v s . Year 9 7
F i g u r e 3-51 Blue P l a i n s Secondary, TP Removed v s . Fe Dose, and E f f l u e n t TP v s . Fe Dose 9 8
F i g u r e 3-52 Blue P l a i n s Secondary, SP Removed v s . BOD Removed, and TP Removed v s . BOD Removed
F i g u r e 3-53 Blue P l a i n s E a s t Secondary, I r o n Dose, BOD Removal, and SP Removal 1 0 0
F i g u r e 3-54 Blue P l a i n s Secondary, Repor ted Sludge, P r e d i c t e d Chemical Sludge, and I r o n Dose, and P e r c e n t P r e d i c t e d Chemical Sludge
F i g u r e 3-55 Blue P l a i n s Secondary, Sludge P r o d u c t i o n v s . Fe Dose, and Secondary Sludge Produc t ion v s . BOD Removed
F i g u r e 3-56 Blue P l a i n s Secondary, Sludge P r o d u c t i o n v s . TSS Removed, and Secondary Sludge P r o d u c t i o n v s SP Removed

Figure 5-22 Piscataway Secondary, I n f l u e n t and E f f l u e n t A l k a l i n i t y vs . Year, A l k a l i n i t y Removed and A13' v s . Year, A l k a l i n i t y Removed v s . A13' Dose, and E f f l u e n t A l k a l i n i t y vs . ~ 1 ~ ' Dose 158
F igure 5-23 Piscataway N i t r i f i c a t i o n , I n f l u e n t and E f f l u e n t p H v s . Year, p H Removed and ~ 1 ~ ' v s . Year, p H Removed v s . ~ 1 ~ ' Dose, and p H v s . ~ 1 ~ ' Dose 1 6 0
F igure 5-24 Piscataway ~ i t r i f i c a t i o n , Log 10 ( E f f l u e n t OSP, m o l / l )
v s . E f f l u e n t pH, and OSP Removal v s . BOD Removal 1 6 1
F igure 5-25 Piscataway N i t r i f i c a t i o n , I n f l u e n t and E f f l u e n t BOD v s . Year, BOD Removed and A13' v s . Year, BOD Removed vs . ~ 1 ~ ' Dose, and E f f l u e n t BOD v s . ~ 1 ~ ' Dose 162
F igure 5-26 Piscataway N i t r i f i c a t i o n , I n f l u e n t and E f f l u e n t TSS v s . Year, TSS Removed and A13' v s . Year, TSS Removed v s . ~ 1 ~ ' Dose, and E f f l u e n t TSS vs . A13' Dose 163
F i g u r e 5-27 Piscataway N i t r i f i c a t i o n , I n f l u e n t and E f f l u e n t TP v s . Year, TP Removed and A13' v s . Year, TP Removed v s . ~ 1 ~ ' Dose, and E f f l u e n t TP v s . A13' Dose 164
F i g u r e 7-1 South Shore Process Flow Diagram 168
F i g u r e 7-2 South Shore Raw I n f l u e n t Flow 1 7 1
F i g u r e 7-3 South Shore Raw I n f l u e n t BOD Concen t ra t ion v s . Year, Mass Loading vs . Year, Concen t ra t ion v s . Mass Loading, and Concen t ra t ion v s . Flow 172
F i g u r e 7-4 South Shore Raw I n f l u e n t TSS Concen t ra t ion v s . Year, Mass Loading v s . Year, Concen t ra t ion v s . Mass Loading, and Concen t ra t ion v s . Flow 173
F i g u r e 7-5 South Shore Raw I n f l u e n t TP Concen t ra t ion v s . Year, Mass Loading v s . Year, Concen t ra t ion v s . Mass Loading, and Concen t ra t ion v s . Flow 17 4
F i g u r e 7-6 South Shore Raw I n f l u e n t SP Concen t ra t ion v s . Year, Mass Loading v s . Year, Concen t ra t ion v s . Mass Loading, and Concen t ra t ion v s . Flow 175
F i g u r e 7-7 South Shore Raw I n f l u e n t C a l c u l a t e d Par t -P Concen t ra t ion v s . Year, Mass Loading v s . Year, and Mass Loading v s . Suspended S o l i d s Mass Loading 17 6

F i g u r e 9-10 Jones I s l a n d E a s t P l a n t Log 10 ( E f f l u e n t SP, m o l / l )
v s . F i n a l E f f l u e n t pH 22 4
F i g u r e 9-11 Jones I s l a n d E a s t P l a n t R a w I n f l u e n t and F i n a l E f f l u e n t pH v s . Year, Fe Dose and pH Change v s . Year, pH Change v s . Fe Dose, and F i n a l pH v s . Fe Dose 225
F i g u r e 9-12 Jones I s l a n d E a s t P l a n t SP Removed v s . BOD Removal, SP Removed v s . A i r Sewage R a t i o , SP Removed v s . F/M R a t i o , and SP Removed v s . Average Sludge Age 226
F i g u r e 9-13 Jones I s l a n d E a s t P l a n t I n f l u e n t and E f f l u e n t BOD v s . Year, BOD Removed and Fe Dose v s . Year, BOD Removed v s . Fe D o s e , and BOD E f f l u e n t v s . Fe Dose
F i g u r e 9-14 Jones I s l a n d E a s t P l a n t I n f l u e n t and E f f l u e n t TSS v s . Year, TSS Removed and Fe Dose v s . Year, TSS Removed v s . Fe Dose, and TSS E f f l u e n t v s . Fe Dose
F i g u r e 9-15 Jones I s l a n d E a s t P l a n t I n f l u e n t and E f f l u e n t TP v s . Year, TP Removed and Fe Dose v s . Year, TP Removed v s . Fe Dose, and TP E f f l u e n t v s . Fe Dose
F i g u r e 9-16 Jones I s l a n d West P l a n t Sc reened E f f l u e n t and Es t ima ted E f f l u e n t SP, FeC13 C o n d i t i o n i n g and
SP, SP Removed v s . FeC13 U s e , and SP E f f l u e n t
v s . FeC13 U s e
F i g u r e 9-17 Jones I s l a n d West P l a n t FeCl3/PC Rat io ,
FeC13/Pc R a t i o v s . Year
F i g u r e 9-18 Jones I s l a n d West P l a n t E s t i m a t e d SP Removed v s . E s t i m a t e d BOD Removed
F i g u r e 9-19 Jones I s l a n d Waste A c t i v a t e d Sludge P r o d u c t i o n
F i g u r e B - 1 Blue P l a i n s P e r c e n t D e v i a t i o n o f Average SP C o n c e n t r a t i o n as a Func t ion of Assumed SP/TP R a t i o i n GTOR, and TP v s . TSS f o r GTOR, t o West Pr imary I n f l u e n t

F i g u r e B-2 Blue P l a i n s Percen t Devia t ion of Average SP Concen t ra t ion a s a Funct ion of Assumed SP/TP R a t i o i n SPBR, and TP v s . TSS f o r SPBR, t o West Secondary I n f l u e n t 257
F i g u r e B - 3 Blue P l a i n s P e r c e n t Devia t ion of Average SP Concen t ra t ion a s a Funct ion of Assumed SP/TP R a t i o s f o r SPBR t o East Primary I n f l u e n t , and TP v s . TSS f o r SPBR and GTOR Below West Pr imary E f f l u e n t 258
x v i

LIST OF TABLES
Page
Table 2-1
Table 4 - 1
Chemical Equilbrium Model Equat ions
Blue P l a i n s Eas t Primary Regress ion Output f o r Model i n Equation 4-1
Table 4-2 Blue P l a i n s West Primary Regress ion Output f o r Model i n Equation 4-2
Table 4-3 Blue P l a i n s Primary Regress ion Output f o r Model i n Equation 4-3
Table 4-4 Blue P l a i n s Eas t Secondary Regress ion Output f o r Model i n Equation 4-4
Blue P l a i n s West Secondary Regress ion Output f o r Model i n Equat ion 4-5
Table 4-5
Table 8-1 South Shore Pre-Oxidized WPL Addi t ion, Regress ion Output f o r Model i n Equation 8-1
Table 8-2 South Shore Oxidized WPL Addi t ion, Regress ion Output f o r Model i n Equation 8-2
Table 8-3
Table 8-4
Table C - 1
South Shore Pre-Oxidized WPL Addi t ion, Regress ion Output f o r Model i n Equation 8-3
South Shore Oxidized WPL Addi t ion, Regress ion Output f o r Model i n Equation 8-4
Example Sequen t i a l F Table
xvii

CHAPTER ONE: INTRODUCTION
1.1 PROBLEM STATEMENT
Phosphorus removal i s an o b j e c t i v e of advanced wastewater
t r e a t m e n t s i n c e phosphorus i s one of t h e p r imary n u t r i e n t s r e s p o n s i b l e
f o r t h e e u t r o p h i c a t i o n of r e c e i v i n g w a t e r s . A t t r e a t m e n t f a c i l i t i e s
where s t r i c t NPDES l i m i t a t i o n s app ly , phosphorus removal i s t y p i c a l l y
accomplished by suspended s o l i d s removal, b i o l o g i c a l a c t i o n , and
chemical p r e c i p i t a t i o n .
S i n c e t h e e a r l y 19701s , s e v e r a l s t a t e s have l e g i s l a t e d bans on
l a u n d r y d e t e r g e n t s t h a t c o n t a i n phosphorus. Two arguments have been
p r e s e n t e d i n f a v o r of t h e s e a c t i o n s . Reducing t h e phosphorus l o a d i n g
t o wastewater t r e a t m e n t p l a n t s w i l l : (1) improve r e c e i v i n g wa te r
q u a l i t y and ( 2 ) p r o p o r t i o n a l l y reduce t h e c o s t o f phosphorus removal
and s l u d g e p r o d u c t i o n .
Now t h a t phosphate d e t e r g e n t bans have been implemented i n t h e
Grea t Lakes and Chesapeake Bay a r e a s it i s d e s i r a b l e t o a n a l y z e
a v a i l a b l e d a t a t o see whether t h e second argument was c o r r e c t .
1 . 2 OBJECTIVES
The o b j e c t i v e s of t h i s r e s e a r c h a r e t o u s e was tewate r t r e a t m e n t
o p e r a t i o n s r e c o r d s t o :
1) C h a r a c t e r i z e chemical phosphorus removal and chemical s l u d g e
p roduc t ion i n t e rms of c u r r e n t chemical t h e o r y , p i l o t p l a n t r e s u l t s ,
and r e s e a r c h f i n d i n g s p r e s e n t i n t h e l i t e r a t u r e . The e f f e c t s of

impor tan t p r o c e s s pa ramete r s , such a s pH, a l k a l i n i t y , phosphorus
c o n c e n t r a t i o n s , and chemical dose w i l l be examined.
2 ) C h a r a c t e r i z e t h e impact of chemical d o s i n g p r a c t i c e s on BOD
removal, suspended s o l i d s removal, and s l u d g e p r o d u c t i o n .
3 ) TO e v a l u a t e l i n e a r r e g r e s s i o n modeling a s a method f o r
e x t r a c t i n g i n f o r m a t i o n from p l a n t o p e r a t i o n s d a t a .
1 . 3 SCOPE OF STUDY
T h i s r e s e a r c h i n c l u d e s t h e s t u d y of o p e r a t i o n s d a t a f rom t h e Blue
P l a i n s (Washington, D.C.) , P iscataway (Accokeek, MD), J o n e s I s l a n d
(Milwaukee, W I ) , and South Shore (Oak Creek, W I ) wastewater t r e a t m e n t
p l a n t s .
Chap te r s Three, F ive , Seven, and Nine a r e d e s c r i p t i v e c h a p t e r s
t h a t g r a p h i c a l l y p r e s e n t t h e d a t a f o r each p l a n t and p r e s e n t
q u a l i t a t i v e arguments based on v i s u a l t r e n d s , and c o r r e l a t i o n s .
Chap te r s Four, S ix , and E igh t p r e s e n t f i r s t - o r d e r e m p i r i c a l models
of phosphorus removal and s l u d g e p r o d u c t i o n d a t a .
1 . 4 METHODS
L i n e a r c o r r e l a t i o n , l i n e a r r e g r e s s i o n , and g r a p h i c a l p r e s e n t a t i o n
were used t o s t u d y t h e impact of chemical a d d i t i o n on phosphorus
removal and s l u d g e p r o d u c t i o n .
The models t o b e p r e s e n t e d a r e a s u b s e t of a l l p o s s i b l e r e g r e s s i o n
models t h a t can be formed from a g iven set of p r e d i c t o r v a r i a b l e s .
This s u b s e t was o b j e c t i v e l y s e l e c t e d w i t h a s e q u e n t i a l F test ( s e e

Appendix C) and s u b j e c t i v e l y examined w i t h m e c h a n i s t i c i n t e r p r e t a t i o n .
The models a r e used t o i d e n t i f y m u l t i v a r i a b l e r e l a t i o n s h i p s t h a t
may n o t b e e v i d e n t i n t h e s c a t t e r p l o t s . The models a r e n o t i n t e n d e d
t o be used f o r p r e d i c t i v e purposes .
The r e g r e s s i o n models were formed under t h e assumpt ion t h a t t h e
response was l i n e a r l y r e l a t e d t o each of t h e p r e d i c t o r v a r i a b l e s .
P l o t s of t h e d a t a g e n e r a l l y suppor t t h i s approx imat ion .
Box, Hunter , and Hunter (1978) d i s c u s s t h e p o s s i b l e d a n g e r s
a s s o c i a t e d wi th u s i n g m u l t i p l e l i n e a r r e g r e s s i o n t o e x t r a c t
i n f o r m a t i o n from happenstance d a t a . The h a z a r d s i n c l u d e :
(1) I n c o n s i s t e n t d a t a . I n c o n s i s t e n c i e s may a r i s e , f o r example,
from changes i n measurement t e c h n i q u e s o r sampl ing l o c a t i o n .
( 2 ) Limited range of p r e d i c t o r v a r i a b l e s . I n c o n t r o l l e d
p r o c e s s e s , t h e obse rved range of v a l u e s on i m p o r t a n t independent
v a r i a b l e s , e . g . i r o n dose and pH, may b e t o o s m a l l t o r e v e a l
m e c h a n i s t i c a l l y p l a u s i b l e o r t h e o r e t i c a l r e l a t i o n s h i p s wi th t h e
response v a r i a b l e ( e . g . phosphate r emova l ) .
( 3 ) Confounding e f f e c t s . Confounding e f f e c t s a r i s e from
c o l l i n e a r i t y between p r e d i c t o r v a r i a b l e s . For example, suppose t h a t
i r o n d o s e and r e a c t o r e f f l u e n t pH a r e l i n e a r l y c o r r e l a t e d wi th s o l u b l e
phosphorus removal. I f pH is a l s o l i n e a r l y c o r r e l a t e d wi th i r o n dose ,
it may b e i m p o s s i b l e t o s e p a r a t e t h e e f f e c t s of t h e two v a r i a b l e s .
Regress ion e q u a t i o n s developed wi th c o l l i n e a r p r e d i c t o r s can e x h i b i t
u n s t a b l e pa ramete r e s t i m a t e s and l a r g e s t a n d a r d e r r o r s on t h e
e s t i m a t e d pa ramete r s .

( 4 ) Nonsense c o r r e l a t i o n . These a r e c o r r e l a t i o n s t h a t a r e
d e s c r i p t i v e , i n t h e s t a t i s t i c a l s e n s e , bu t do n o t have a s e n s i b l e
c a u s e and e f f e c t r e l a t i o n s h i p . To guard a g a i n s t u s i n g nonsense
c o r r e l a t i o n s one must a s s e s s s t a t i s t i c a l models i n l i g h t of a v a i l a b l e
m e c h a n i s t i c knowledge about t h e p r o c e s s .
These f o u r d i f f i c u l t i e s were encoun te red i n t h i s s t u d y .
Conc lus ions a r e based i n p a r t on t h e r e s u l t s of s t a t i s t i c a l model l ing,
bu t a r e a l s o s t r o n g l y based on m e c h a n i s t i c knowledge.

CHAPTER TWO: CHEMICAL PHOSPHORUS REMOVAL THEORY
2 . 1 BACKGROUND
Chemical phosphorus removal i n municipal wastewater h a s been
e x t e n s i v e l y s t u d i e d f o r t h e l a s t t h i r t y yea r s . I n t h e 1960 ' s and
1970 's numerous l ab , p i l o t , and f u l l s c a l e exper iments w e r e conducted
t o i d e n t i f y t h e p roce s s v a r i a b l e s a f f e c t i n g chemical p r e c i p i t a t i o n and
t o s t udy t h e a f f e c t of p r e c i p i t a t i o n on t h e g e n e r a l o p e r a t i o n of
wastewater t r e a tmen t f a c i l i t i e s (4, 15, 26, 44, 45, 52, 53, 54, 5 5 ) .
These e f f o r t s were prompted by a growing need f o r e f f e c t i v e phosphorus
removal. The in format ion ob t a ined i n t h e s e i n i t i a l exper iments
c o n t r i b u t e d t o a b e t t e r unders tanding of removal p roce s se s and
r e s u l t e d i n t h e widespread use of chemical p r e c i p i t a t i o n methods.
Most of t h e s e s t u d i e s , however, were d i r e c t e d toward ach i ev ing an
e f f l u e n t phosphorus concen t r a t i on of about 1 mg/ l . Today some
t r e a tmen t p l a n t s , i n p a r t i c u l a r t hose i n t h e Chesapeake Bay reg ion ,
a r e r e q u i r e d t o m e e t lower e f f l u e n t l i m i t s on t o t a l phosphorus. For
example, between 1974 and 1986, t h e e f f l u e n t TP l i m i t s a t Blue P l a i n s
have been 5 mg/l, 3 mg/l, 1 . 6 mg/l, 0 . 5 mg/l, and 0.22 mg/l . An even
lower l i m i t may be e s t a b l i s h e d i n t h e f u t u r e . E x t r a p o l a t i n g p a s t
exper ience t o t h e s e new ope ra t i ng c o n d i t i o n s c a r r i e s some r i s k . An
unders tanding of p roce s s chemist ry i s necessa ry .
Many p l a n t s a l s o have low e f f l u e n t suspended s o l i d s l i m i t s .
F i l t r a t i o n processes have been in t roduced a t t h e Chesapeake Basin

t r e a t m e n t f a c i l i t i e s s t u d i e d i n t h i s r e s e a r c h (B lue P l a i n s ,
P i s c a t a w a y ) . Suspended s o l i d s c o n c e n t r a t i o n i s an i m p o r t a n t f a c t o r i n
d e t e r m i n i n g t h e amount o f TP d i s c h a r g e d from a t r e a t m e n t p l a n t (1, 6,
6 5 ) . T o t a l phosphorus measurements r e f l e c t combined p a r t i c u l a t e and
s o l u b l e phosphorus . P a r t i c u l a t e phosphorus removal i s c o n t r o l l e d by
t h e p h y s i c a l p r o c e s s e s of c l a r i f i c a t i o n and f i l t r a t i o n , and removal of
t h e s o l u b l e f r a c t i o n from t h e l i q u i d p r o c e s s i s c o n t r o l l e d by chemica l
p r e c i p i t a t i o n and b i o l o g i c a l a c t i o n . The s e p a r a t i o n of p r e c i p i t a t e s
and b i o l o g i c a l f l o c from t h e l i q u i d s t r e a m a r e a l s o dependent on t h e
p h y s i c a l p r o c e s s e s , s o t h e two p r o c e s s e s a r e n o t independen t .
A t t h e Chesapeake Basin p l a n t s o f t h i s s t u d y , chemica l u s e was low
( o r n i l ) d u r i n g e a r l i e r y e a r s when less s t r i n g e n t TP e f f l u e n t
r e s t r i c t i o n s a p p l i e d . P r e c i p i t a n t u s e h a s i n c r e a s e d a t p l a n t s t o
i n s u r e t h a t d i s c h a r g e l i m i t a t i o n s have been m e t . I n many c a s e s , t h e
r e s i d u a l c o n c e n t r a t i o n s of s o l u b l e phosphorus (SP) a r e a t o r n e a r
t h e o r e t i c a l s o l u b i l i t y l i m i t s f o r o r t h o p h o s p h a t e . S p l i t d o s i n g t h e
p r e c i p i t a n t t o p r imary and secondary t r e a t m e n t h a s a l s o been
i n t r o d u c e d t o p r o v i d e a more e f f i c i e n t t r e a t m e n t p r o c e s s .
For p l a n t s s u c h a s t h e Wisconsin p l a n t s i n t h i s s t u d y , phosphorus
removal p r a c t i c e s have changed r e l a t i v e l y l i t t l e , s i n c e e f f l u e n t
l i m i t a t i o n s have remained c o n s t a n t a t 1 mg/ l TP.
The USEPA h a s adop ted a new emphasis r e g a r d i n g new d e s i g n and
r e t r o f i t t i n g of t r e a t m e n t p l a n t s f o r phosphorus removal . Technology
T r a n s f e r Manuals (65, 67) r e c e n t l y i s s u e d by t h e USEPA emphasize t h e

difference in operational requirements needed to attain increasingly
lower effluent TP concentrations of 2, 1, 0.5, and 0.2 mg/l. These
manuals emphasize the importance of considering site specifics for
design (wastewater characteristics, chemical dose point, etc.) . They
do not rigorously discuss the theory of chemical phosphate
precipitation, but a statement is included to the effect that the
chemical cost and sludge quantities associated with achieving very low
phosphorus concentrations are not directly proportional to the amount
of phosphorus being removed. This statement suggests the importance 4 t
of knowing the process chemistry that "ill exist.
2.2 PRECIPITATION MODELS
Despite the large body of literature on chemical phosphorus
removal, there are few developed and verified mechanistic models of
the process.
Chemical equilibrium and precipitation principals are well
explained in environmental engineering texts (Stumm and Morgan, 1981;
Benefield, Judkins, and Weland, 1982; Snoeyink and Jenkins 1980).
These principles can be used to formulate a predictive model for
orthophosphate precipitation in the presence of metal salts.
Equilibrium models are composed of 1) equations relating the
equilibrium concentrations between soluble species, and between
soluble species and solid phases, 2) mass balance equations on each
system component (i.e. phosphorus, iron), and 3) an electroneutrality

condition. Experimentally determined equilibrium constants are used
to quantify the distributions of component species (i.e. H3PO4,
H2P04-, H P O ~ ~ - , ~0~~') and the conditions under which solid phases are
expected to exist. Many model terms are widely accepted as known,
such as equilibrium constants for the phosphoric acid system. Others,
such as the solubility product for the metal phosphate precipitate,
are not precisely known. The solubility product for metal hydroxide
is also not well defined because of its amorphous structure. Model
parameters that are not well defined require calibration to the
specific aqueous system for which the equilibrium model will be
applied.
Ferguson and ~ i n g (1977) presented the first phosphate
precipitation model based on chemical equilibrium theory. This model
was later shown to have a discontinuity in its ability to predict
phosphate residuals near the solubility limit (31). This
discontinuity was pronounced at combinations of high initial
alkalinity, high pH (7.51, and low initial phosphate concentration;
conditions not too unusual for some operating conditions.
Kavauaugh et al. (1978) presented a model that could be used for
predicting total phosphorus removal in post precipitation with
Fe(II1). The three components of the model were 1) a chemical model
for dissolved phosphorus removal, 2) a flocculation model, and 3) a
model for suspended solids removal in a sludge blanket clarifier. The
precipitation model showed reasonable agreement with pilot scale test

results, but agreement was obtained by adjusting the assumed ratio of
ferric hydroxide precipitate to ferric phosphate precipitate. No
formal method for estimating this model parameter was offered. The
equilibrium model failed to account for important operating variables
such as initial pH or alkalinity.
The foundations of Ferguson and King were used by ~enkins et al.
(31) to develop a computer model for predicting phosphate residuals
resulting from alum or ferric addition. The discontinuity in Ferguson
and King's model was identified during this effort, but it was not
rectified. A need also existed at the time for laboratory model
verification.
A model presented by ~emanowicz (48), at the 1987 National WPCF
Conference, is currently undergoing laboratory calibration to
describe the relationship between the dose of Fe(III1, as ferric
chloride, and the residual concentration of orthophosphate achievable
in activated sludge systems.
An earlier version of the model serves as an appropriate basis for
discussing the fundamental chemical concepts of phosphate
precipitation. The model equations presented by Jenkins et al. (32)
are listed in Table 2-1. The equations describe the equilibrium
distributions of the soluble orthophosphate species, soluble iron
species, and the carbonate system (open or closed to the atmosphere).
Mass balance equations on phosphorus, iron, and carbon, and an
electroneutrality condition complete the model.

Table 2-1 Chemical Equilibrium Model Equations (Jenkins et al. 32).
FeRP04 (OH) 3R-3 (s) = R Fe3+ + ~ 0 ~ ~ - + (3R-3) OH-
H3P04 = H' + H2P04-
H2P04- = H' + H P O ~ ~ -
HC03- = H' + ~ 0 3 ~ -
H20 = Ht + OH-
nce Ea-
3[Fe3+] + [Fe0H2+1 + [ F ~ ( O H ) ~ + ] + ~ [ F ~ H ~ P o ~ ~ + I + [H+] - - [Fe(OH)4-l - [H2P04-I - ~ [ H P O ~ ~ - ] - 3 [ ~ 0 ~ ~ - 1 - - [OH-] - [HC03-I - 2 [ ~ 0 ~ ~ - ] = X cFe - cK, in

I n t h e t h e o r e t i c a l model t h e fo rmat ion of h a s been
hypo thes ized a s t h e dominant i r o n phosphate complex. C a l i b r a t i o n of
t h e model t o l a b o r a t o r y r e s u l t s i n v o l v e s a d j u s t i n g t h e F ~ H ~ P o ~ ~ '
s t a b i l i t y c o e f f i c i e n t , KFp, and t h e s o l u b i l i t y p r o d u c t , KSp , o f t h e
m e t a l phosphate p r e c i p i t a t e . Jenk ins e t a l . i n i t i a l l y e s t i m a t e d t h e s e
two c o n s t a n t s by f i t t i n g t h e model t o t h e t a p w a t e r i r o n phosphate
p r e c i p i t a t i o n d a t a of Recht and Ghassemi ( 1 9 7 0 ) . The t a p w a t e r d a t a
were o b t a i n e d under c o n d i t i o n s of c o n t r o l l e d i n i t i a l phospha te
c o n c e n t r a t i o n , i r o n dose , and f i n a l pH.
Ferguson and King (1977) i d e n t i f i e d seven assumpt ions f o r t h e i r
alum p r e c i p i t a t i o n model t h a t a r e a p p l i c a b l e t o t h e model. These
assumpt ions a r e impor tan t t o c o n s i d e r when d i r e c t compar isons between
t h e o r e t i c a l r e s u l t s and f u l l s c a l e o p e r a t i o n s d a t a a r e b e i n g made.
(1) The model d e s c r i b e s t h e p r e c i p i t a t i o n of o r thophospha te , not
o t h e r forms of s o l u b l e phosphorus. Raw sewage may c o n t a i n s i g n i f i c a n t
q u a n t i t i e s of s o l u b l e non-orthophosphates (condensed and o r g a n i c ) (18,
2 1 ) . Some of t h e s e forms may b e hydrolyzed t o o r t h o p h o s p h a t e .
There fo re , it i s n e c e s s a r y t o c o n s i d e r t h e l o c a t i o n of m e t a l i o n
a d d i t i o n when a t t e m p t i n g t o e x p l a i n o p e r a t i o n s d a t a i n t e r m s of t h e
c u r r e n t model.
( 2 ) Steady s t a t e i s assumed. The k i n e t i c component of t h e model
i s c o n s i d e r e d n e g l i g i b l e . Recht and Ghassemi (1970) have shown t h a t
t h e r e a c t i o n s of F e ( I I 1 ) and A l ( I I 1 ) w i t h o r thophospha te t a k e p l a c e i n

less t h a n a second.
( 3 ) S o l i d s s e p a r a t i o n i s n o t d e s c r i b e d . A t t r e a t m e n t p l a n t s t h i s
mechanism of phosphorus removal w i l l b e c o n t r o l l e d by c l a r i f i e r
o p e r a t i o n and f i l t r a t i o n p r o c e s s e s .
( 4 ) P r e c i p i t a t i o n i s t h e mechanism c a u s i n g phospha te removal, and
n o t a d s o r p t i o n . Ferguson (18) m a i n t a i n s t h a t t h e e v i d e n c e f o r a
p r e c i p i t a t i o n mechanism i s compel l ing, e s p e c i a l l y o v e r t h e range of pH
v a l u e s encoun te red i n wastewater t r e a t m e n t .
( 5 ) The phosphate s o l i d p r e c i p i t a t e s b e f o r e t h e hydrox ide d u r i n g
s t o i c h i o m e t r i c removal ( d e s c r i b e d i n t h e nex t s e c t i o n ) . T h i s i s an
obse rved e x p e r i m e n t a l r e s u l t .
( 6 ) The r a t i o of m e t a l i o n t o phosphate i s c o n s t a n t i n t h e s o l i d
p r e c i p i t a t e . J e n k i n s ( 3 4 ) h a s s u g g e s t e d t h a t t h e s t o i c h i o m e t r i c
c o e f f i c i e n t , R, may be f u n c t i o n a l l y r e l a t e d t o pH.
( 7 ) Chemical e q u i l i b r i u m p r i n c i p l e s a r e a p p l i c a b l e .
A q u a l i t a t i v e d e s c r i p t i o n of t h e model i s u s e f u l f o r u n d e r s t a n d i n g
t h e n a t u r e of t h e p r e c i p i t a t i o n p r o c e s s and t h e r e l a t i v e importance of
o p e r a t i n g v a r i a b l e s . For t h i s r eason , some e a r l y r e s u l t s o f Jenkins
e t a l . (32) w i l l b e p r e s e n t e d a l o n g w i t h a c o n c e p t u a l d e s c r i p t i o n of
t h e model.
The p r e c i p i t a t i o n of o r thophospha te i s assumed t o o c c u r i n t h r e e
d i s t i n c t zones, each of which a r e d e s c r i b e d below, wi th r e f e r e n c e t o
F i g u r e 2-1 , a s o l u b i l i t y d iagram f o r o r t h o p h o s p h a t e p r e c i p i t a t i o n i n
t h e p r e s e n c e of i r o n hydroxide . The c u r v e on t h e f i g u r e was

Figure 2-1 Schematic of Iron Phosphate Precipitation. Solubility Curve Represents Equilibrium Concentration of Soluble Orthophosphate
Species in the Presence of Iron I11 Hydroxide.

c a l c u l a t e d wi th t h e s o l u b i l i t y r e l a t i o n s h i p s p r e s e n t e d i n Tab le 2-1.
The e x a c t l o c a t i o n of t h i s c u r v e is n o t impor tan t i n t h e c o n t e x t of
t h e f o l l o w i n g d i s c u s s i o n , s i n c e t h e l o c a t i o n w i l l v a r y depending upon
t h e s p e c i f i c aqueous sys tem ( i . e . a c t i v a t e d s l u d g e , raw sewage) .
-. I n i t i a l c o n d i t i o n s t h a t g i v e rise t o Zone I p r e c i p i t a t i o n
a r e i d e n t i f i e d by p o i n t s such a s D . A t t h e s e c o n d i t i o n s t h e
s o l u b i l i t y p roduc t of t h e hydroxide i s less t h a n t h a t of t h e hydroxide
o r thophospha te . Added m e t a l i o n s p r e f e r e n t i a l l y b i n d hydroxide i o n s ,
d r i v i n g t h e pH downward u n t i l t h e s o l u b i l i t y l i m i t of t h e phosphate i s
exceeded. The p r e c i p i t a n t r e a c t s o n l y wi th was tewate r a l k a l i n i t y t o
form m e t a l hydroxide . The amount of m e t a l i o n r e q u i r e d t o s h i f t t h e pH
i s dependent upon t h e i n i t i a l a l k a l i n i t y , which is assumed t o be
c o n t r o l l e d by t h e c a r b o n a t e sys tem. The c a r b o n a t e sys tem can be
modeled a s a c l o s e d system, i n which t h e mass of ca rbon i s
c o n s e r v a t i v e , o r it can be modeled a s a n open sys tem. I n an open
sys tem a t a f i x e d C02 p a r t i a l p r e s s u r e (pC02), t h e amount of d i s s o l v e d
C02 w i l l be a f u n c t i o n of pH. Assumptions r e g a r d i n g t h e open o r
c l o s e d n a t u r e of t h e p r o c e s s a r e impor tan t f o r p r o p e r l y mode l l ing
p r e c i p i t a t i o n . The i n i t i a l phosphate c o n c e n t r a t i o n makes up a s m a l l
p o r t i o n of t h e a l k a l i n i t y , b u t it c o n t r i b u t e s n e g l i g i b l y t o t h e
b u f f e r i n g c a p a c i t y of t h e wastewater (31).
u. I n F i g u r e 2-1, Zone I1 removal i s r e p r e s e n t e d by t h e
movement from p o i n t A t o p o i n t B . Zone two p r e c i p i t a t i o n i s

characterized by the proportionate removal of orthophosphate with
increasing cation dose. The stoichiometric coefficient, R, determines
the molar amount of metal ion required to precipitate a mole of
orthophosphate. This stoichiometric removal can proceed until the pH
constraining orthophosphate solubility limit is met. Most wastewaters
fall in the zone 11 precipitation category without the need for pH
adjustment (18) .
o n e . In Figure 2-1, Zone I11 removal is represented by the
movement from point B to point C. Phosphate removal is not directly
proportional to metal salt addition, because some of the metal acts to
reduce the pH.
Figure 2-2 shows orthophosphate removal data from the experimental
work of Jenkins et al. (32) at a fixed pH of 7.2 and an initial
phosphate concentration of 5.5 mg/l. These conditions represent the
average experimental conditions of their continuous flow pilot scale
aeration basin. These data suggest that phosphate removal, at pH =
7.2, is directly proportional to iron dose up to about 12 mg/l Fe,
after which there is no additional phosphate removal.
Figure 2-3 shows the mole ratio of iron to estimated phosphate
removed vs. the effluent orthophosphate concentration for the same
data in Figure 2-2. The denominator of the ratio, phosphate
chemically removed, was calculated by subtracting the effluent
orthophosphate value from the influent value, and adding 27% of the
initial particulate phosphorus concentration. A phosphorus mass

F i g u r e 2-2 Or thophospha te Removal v s . I r o n (111) Dose i n A c t i v a t e d S l u d g e . C o n t r o l l e d pH = 7 . 2 . ( J e n k i n s e t a l . ( 3 2 ) ) .
Orthophomphmta rasoval ma a function of Fm(Il1) d o n

Figure 2-3 Fe/Pc Mole Ratio vs. Effluent Orthophosphate Concentration
in Activated Sludge at pH = 7.2. (Jenkins et al. (32)).
Fe/P molar ratio aa a function of effluent orthophoaphate concantration
a.vv
6.00-
4.00.
2-D0.
0.00
Eff I PO, [mg /~ P I
+
+ .++
+
+
%$ +
Batch
+ Continuous
- Theory
+
+ + + + + +%++ ,if + + + 0 + + n + ++ A. .. - &a + -*.'r';T + 0 - . ++; . *++
+ 0 0 , 0 +
1
0.00 2.00 4.00 6.00 r

balance on t h e p i l o t s c a l e a e r a t i o n bas in p r i o r t o i r o n a d d i t i o n
i nd i ca t ed t h a t 27% of t h e i n f l u e n t p a r t i c u l a t e phosphorus was
hydrolyzed t o orthophosphate over and above t h e b i o l o g i c a l
orthophosphate requirement. Thus, i n s t e a d of a d j u s t i n g f o r background
b i o l o g i c a l a c t i o n by s u b t r a c t i n g a q u a n t i t y ( t y p i c a l l y 1 mg P / 1 0 0 mg
BOD removed) t h e observed orthophosphate removals were ad jus t ed by
adding a percentage of t h e i n f l u e n t p a r t i c u l a t e phosphorus. Figure
2-3 shows t h a t a t low e f f l u e n t concent ra t ions , or thophosphate removal
becomes cons tan t a t a f i x e d pH. The pH dependent s o l u b i l i t y l i m i t
p revents complete orthophosphate removal.
2 .3 SLUDGE PRODUCTION
The purpose of t h i s s e c t i o n i s t o d i s c u s s t h e major f a c t o r s
a f f e c t i n g s ludge product ion a s it r e l a t e s t o chemical add i t i on , and t o
p re sen t t h e s to ich iomet ry f o r e s t ima t ing t h e mass of p r e c i p i t a t e d
chemical s ludge .
The s ludge mass produced by chemical add i t i on f o r phosphorus
removal inc ludes 1) t h e mass of phosphate and hydroxide p r e c i p i t a t e s ,
2 ) t h e mass of a d d i t i o n a l suspended s o l i d s removed due t o chemically
induced f l o c c u l a t i o n , and 3) t h e mass of a d d i t i o n a l d i s so lved s o l i d s
removed ( i . e . , f i l t e r a b l e through a 0 . 4 5 micron membrane f i l t e r ) ( 6 6 ) .
Chemical s ludge ( p r e c i p i t a t e only) mass q u a n t i t i e s a r e determined
by t h e i n i t i a l and f i n a l wastewater c h a r a c t e r i s t i c s (pH, a l k a l i n i t y ,
phosphate concen t r a t i on ) , t h e type of chemical used, and t h e dose

c o n c e n t r a t i o n .
Chemical a d d i t i o n t o p r imary t r e a t m e n t may d e c r e a s e t h e o r g a n i c
l o a d i n g on secondary t r e a t m e n t , t h e r e b y reduc ing a e r a t i o n requ i rements
and b i o l o g i c a l s l u d g e p r o d u c t i o n . F a c t o r s such a s t h i s make it
d i f f i c u l t t o a s s e s s t h e impact of chemical a d d i t i o n on n e t s o l i d s
p r o d u c t i o n , and t h e o v e r a l l c o s t of phosphorus removal.
2 . 3 . 1 Wastewater C o n d i t i o n s .
According t o t h e t h e o r y p r e s e n t e d i n t h e l a s t s e c t i o n , e f f l u e n t
o r thophospha te c o n c e n t r a t i o n s depend on c a t i o n dose , and t h e i n i t i a l
wastewater pH, a l k a l i n i t y , and phosphate c o n c e n t r a t i o n . I f t h e f i n a l
phospha te c o n c e n t r a t i o n i s above t h e s o l u b i l i t y l i m i t t h e n
s t o i c h i o m e t r i c phosphate removal s h o u l d r e s u l t i n a s t o i c h i o m e t r i c
q u a n t i t y of phospha te s l u d g e .
I f t h e m e t a l s a l t i s b e i n g used f o r pH ad jus tment t o o b t a i n v e r y
low phospha te r e s i d u a l s , o r i f t h e i n i t i a l pH and a l k a l i n i t y a r e
r e p r e s e n t a t i v e of Zone I p r e c i p i t a t i o n , m e t a l hydrox ide s l u d g e w i l l be
produced. T h i s produces more chemical s l u d g e p e r u n i t of phosphate
removed, o r a non-s to ich iomet r i c chemical s l u d g e q u a n t i t y .
A r e c e n t USEPA r e p o r t shows s l u d g e g e n e r a t i o n b e i n g i n v e r s e l y
r e l a t e d t o e f f l u e n t TP c o n c e n t r a t i o n s (67). Data from s e v e r a l p l a n t s
i n t h e Chesapeake Bay and Great Lakes b a s i n s a r e p r e s e n t e d i n F i g u r e
2-4. A r a t i o of t o t a l s l u d g e / i n f l u e n t t o t a l suspended s o l i d s (TSS)
g r e a t e r t h a n one i s an i m p l i c i t measure of t h e a d d i t i o n a l s l u d g e

Figure 2-4 Sludge Generation vs. Effluent Total Phosphorus Data from Chesapeake Bay (CBDB) and Great Lakes Basin Treatment Plants (USEPA, 67).

produc t ion r e s u l t i n g from chemical use . Treatment p l a n t s from t h e
Chesapeake Basin have i n c r e a s e d chemical p r e c i p i t a n t dose t o a t t a i n
lower t o t a l phosphorus l i m i t s . The r e s u l t i s t h a t more s l u d g e has
been produced. I f , however, t h e p r e c i p i t a t i o n t h e o r y p r e s e n t e d i n t h e
p rev ious s e c t i o n i s an a c c e p t a b l e p r o c e s s model t h e n t h e chemical ,& s ludge mass a s s o c i a t e d wi th p r e c i p i t a t i o n i s n e a r l y independent of
e f f l u e n t phosphorus (o r thophospha te ) c o n c e n t r a t i o n .
2 . 3 . 2 Chemical P r e c i p i t a n t .
The chemical form of t h e p r e c i p i t a n t has been r e p o r t e d t o a f f e c t
t h e q u a n t i t y of chemical s l u d g e produced. I n a p i l o t s c a l e s t u d y of
s l u d g e dewate r ing a l t e r n a t i v e s , Cambell and L e C l a i r (1979) observed
s ludge p roduc t ion i n c r e a s e s of 38% and 100% (by weight) from t h e
a d d i t i o n of f e r r i c c h l o r i d e and alum, r e s p e c t i v e l y , t o ex tended
a e r a t i o n a c t i v a t e d s l u d g e b a s i n s . The average i n i t i a l t o t a l
phosphorus c o n c e n t r a t i o n was 8 mg/l, and t h e e f f l u e n t s were l e s s t h a n
1 mg/l .
Balmer and F r e d e r i k s e n (1975) s t u d i e d chemical s l u d g e p roduc t ion
i n a p r e - s e t t l e d domest ic wastewater u s i n g alum, f e r r i c c h l o r i d e , and
l ime . The s e t t l e d wastewater was s p l i t i n t o t h r e e e q u a l f lows and t h e
t h r e e p r e c i p i t a n t s were added t o i d e n t i c a l p a r a l l e l f l o c c u l a t i o n and
s e t t l i n g t a n k s . The p r e c i p i t a n t doses were v a r i e d i n terms of t h e
meta l i o n t o i n f l u e n t SP r a t i o (mass b a s i s ) . For roughly t h e same
mole r a t i o s of c a t i o n t o i n i t i a l SP, t h e y observed approx imate ly t h e
same sludge productions ( t o t a l mass) f o r alum and f e r r i c ch lo r ide .
Mole r a t i o s var ied between 4 and 1 4 .
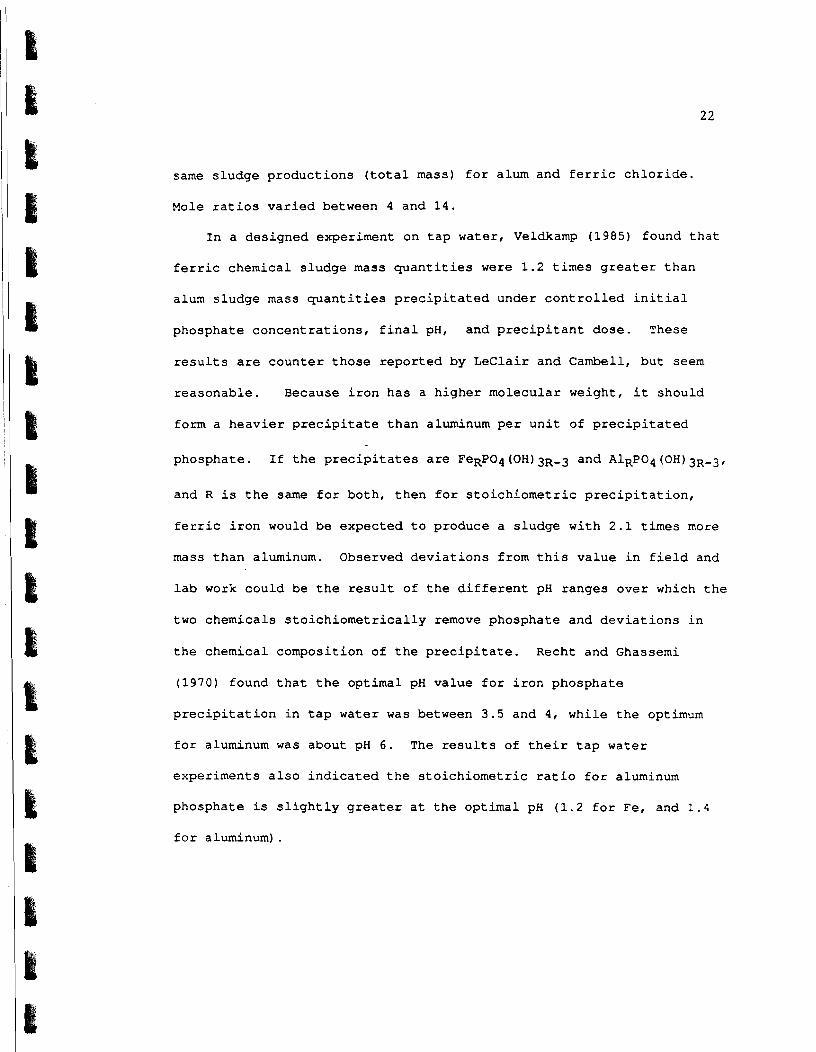
In a designed experiment on t a p water, Veldkamp (1985) found t h a t
f e r r i c chemical sludge mass q u a n t i t i e s were 1 .2 t imes g r e a t e r than
alum sludge mass q u a n t i t i e s p r e c i p i t a t e d under c o n t r o l l e d i n i t i a l
phosphate concentrat ions, f i n a l pH, and p r e c i p i t a n t dose. These
r e s u l t s a r e counter those reported by LeClair and Carnbell, but seem
reasonable. Because i r o n has a higher molecular weight, i t should
form a heavier p r e c i p i t a t e than aluminum per un i t of p r e c i p i t a t e d
phosphate. I f t h e p r e c i p i t a t e s a r e FeRP04(0H)3R-3 and A1RP04(OH)3R-3,
and R is t h e same f o r both, then f o r s to ichiometr ic p r e c i p i t a t i o n ,
f e r r i c i ron would be expected t o produce a sludge with 2 . 1 times more
mass than aluminum. Observed devia t ions from t h i s value i n f i e l d and
l a b work could be t h e r e s u l t of t h e d i f f e r e n t pH ranges over which t h e
two chemicals s to i ch iomet r i ca l ly remove phosphate and dev ia t ions i n
the chemical composition of t h e p r e c i p i t a t e . Recht and Ghassemi
(1970) found t h a t t h e optimal pH value f o r i r o n phosphate
p r e c i p i t a t i o n i n t a p water was between 3 .5 and 4 , while the optimum
f o r aluminum was about pH 6 . The r e s u l t s of t h e i r t a p water
experiments a l s o ind ica t ed t h e s to ichiometr ic r a t i o f o r aluminum
phosphate i s s l i g h t l y g r e a t e r a t t he optimal pH ( 1 . 2 f o r Fe, and 1 . 4
f o r aluminum) .

2.3.3 Point of Chemical Addition.
Additional suspended and dissolved solids removal by chemical
addition is dependent on the dose point. The recent USEPA Phosphorus
Removal Manual (1987) presents potential TSS removal efficiencies for
primary and secondary treatment, with and without metal salt addition.
These data suggest that primary TSS removal is 40% - 70% without
chemical addition and 60% - 75% with chemical addition, and that secondary TSS removal is 80% - 90% without chemical addition and 85% -
*
95% with chemical addition. The USEPA manual also suggests that 30%
of the dissolved solids (i.e. filterable through a 0.45 micron
membrane filter) are removed when chemicals are added to a raw
wastewater, or primary effluent, and that removal of dissolved solids
is negligible when chemical is added to biological oxidative
processes. Sludge mass resulting from dissolved solids removal can be
estimated indirectly with soluble COD, TOC, or BOD data; however,
these data were not studied in this research (65, 66).
In a survey of 185 Canadian wastewater treatment plants that were
retrofitted for chemical phosphorus removal, Schmidke (1985) reported
average sludge mass increases of 42% and 26% at primary and
conventional activated sludge plants, respectively. The percentage
increases may reflect differences in the degree of enhanced suspended,
and dissolved solids removal.
Gleisberg (1985) cites a study of 150 German chemical treatment
plants where the average reported increase in raw sludge production

was 83, relative to conventional primary clarification. This value is
considerably different than the 42% value reported by Schmidke, and
due to site specific wastewater conditions and chemical dose
practices.
Chemical addition is known to increase sludge production.
However, the above information indicates that percentage increases in
sludge production cannot be applied to individual plants because of
unique wastewater compositions and chemical dosing practices.
The most recent USEPA Phosphorus Removal Manual (1987) clearly
states that observed percentage increases, such as those cited above,
are not useful for design purposes. The manual recommends using jar
tests to estimate sludge production.
2.3.4 Estimating Chemical Sludge Production
The principles of chemical stoichiometry can be used to estimate
the mass of chemical sludge produced by metal salt addition to
wastewater (51, 65, 69).
The USEPA Phosphorus Removal Manual (1987) suggests that
stoichiometric chemical sludge estimates should be increased by 35%
for design work. This "safety factor" has not been proven to exist in
controlled experimental work, and is not used in this report.
In the following discussion, the assumptions of the chemical
sludge model are presented.
For stoichiometric precipitation, one mole of metal phosphate

(phosphate s ludge) w i l l form f o r e v e r y R moles of m e t a l i o n consumed,
accord ing t o :
In non-s to ich iomet r ic phosphate removal, t h e e x c e s s m e t a l i o n i s
presumed t o form a n i n s o l u b l e m e t a l hydroxide (hydrox ide s l u d g e )
accord ing t o :
The amount of e x c e s s meta l i o n i n a wastewater w i l l be a f u n c t i o n of
s e v e r a l v a r i a b l e s i n c l u d i n g pH. However, s i n c e a l l o r thophospha te
i n s o l u b i l i z e d i s assumed t o be i n t h e form of MeRP04(0H) ( 3 ~ - 3 ) , t h e n
t h e q u a n t i t y of phosphate s l u d g e can b e c a l c u l a t e d by e s t i m a t i n g t h e
amount of phosphate removed. The s t o i c h i o m e t r i c c o e f f i c i e n t , R = 1 . 5 ,
i s assumed f i x e d f o r a l l wastewater c o n d i t i o n s .
Any e x c e s s i r o n n o t invo lved i n phosphate p r e c i p i t a t i o n i s used t o
c a l c u l a t e t h e q u a n t i t y of hydroxide s l u d g e . The r e s i d u a l c a t i o n
c o n c e n t r a t i o n i s assumed n e g l i g i b l e .
Unoxidized waste p i c k l e l i q u o r t e n d s t o form g e l a t i n o u s f e r r o u s
hydroxide p r e c i p i t a t e s . The mass r a t i o of f e r r i c hydroxide t o f e r r o u s
hydroxide i s 1 . 1 9 . I f a l l t h e f e r r o u s i r o n n o t i n v o l v e d i n phosphate

p r e c i p i t a t i o n i s assumed t o form f e r r i c hydrox ide , t h e n t h e hydroxide
s l u d g e q u a n t i t y c a l c u l a t i o n s w i l l be i n e r r o r by t19%.
The f o l l o w i n g e q u a t i o n s a r e used t o p r e d i c t chemica l s l u d g e
q u a n t i t i e s f o r t h e two p o s s i b l e c a s e s :
CHSL = [ (Me/MWM) - ( R x PC/MWP) ] (MWM + 3MWOH) (8 .34 Q)
Where: CPSL = Chemical Phosphate Sludge, l b / d a y
CHSL = Chemical Hydroxide Sludge, l b / d a y
M e = Metal Ion Dose, mg/ l
PC = Est imated Chemical ly Removed P, mg/l
R = S t o i c h i o m e t r i c C o e f f i c i e n t , = 1 . 5
MWM = Molecular Weight of Metal , m g / m o l
( 55.85 f o r Fe, 26.98 f o r A l )
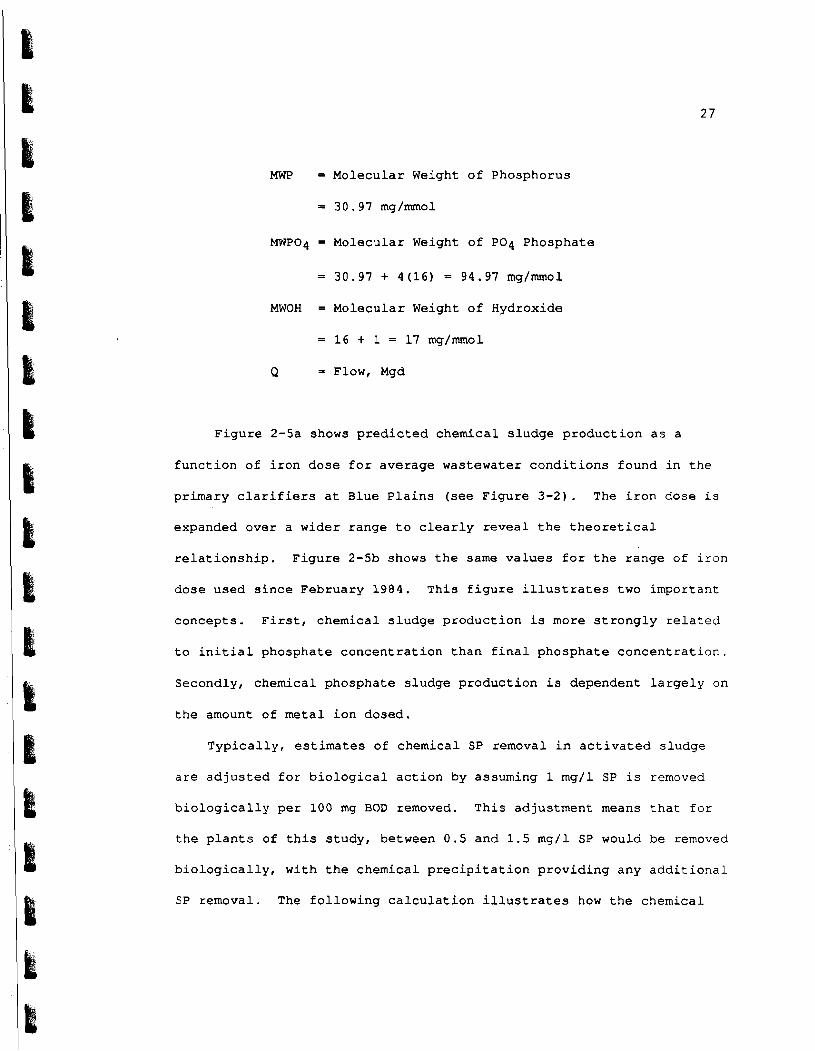
MWP = Molecular Weight o f Phosphorus
= 30.97 mg/mol
MWPO4 = Molecular Weight of PO4 Phosphate
= 30.97 + 4(16) = 94.97 mg/mmol
MWOH = Molecular Weight o f Hydroxide
= 1 6 + 1 = 17 mg/mmol
Q = Flow, Mgd
F i g u r e 2-5a shows p r e d i c t e d chemical s ludge p r o d u c t i o n a s a
f u n c t i o n of i r o n dose f o r average wastewater c o n d i t i o n s found i n t h e
pr imary c l a r i f i e r s a t Blue P l a i n s ( s e e F igure 3 -2) . The i r o n dose i s
expanded over a wider range t o c l e a r l y r e v e a l t h e t h e o r e t i c a l
r e l a t i o n s h i p . F i g u r e 2-5b shows t h e same v a l u e s f o r t h e range of i r o n
dose used s i n c e February 1984. Th is f i g u r e i l l u s t r a t e s two important
concep t s . F i r s t , chemical s l u d g e p roduc t ion i s more s t r o n g l y r e l a t e d
t o i n i t i a l phosphate c o n c e n t r a t i o n t h a n f i n a l phosphate c o n c e n t r a t i o n .
Secondly, chemical phosphate s ludge p roduc t ion i s dependent l a r g e l y on
t h e amount of meta l i o n dosed.
T y p i c a l l y , e s t i m a t e s of chemical SP removal i n a c t i v a t e d s ludge
a r e a d j u s t e d f o r b i o l o g i c a l a c t i o n by assuming 1 mg/l SP i s removed
b i o l o g i c a l l y p e r 100 mg BOD removed. T h i s adjus tment means t h a t f o r
t h e p l a n t s of t h i s s tudy , between 0 .5 and 1 . 5 mg/ l SP would be removed
b i o l o g i c a l l y , wi th t h e chemical p r e c i p i t a t i o n p r o v i d i n g any a d d i t i o n a l
SP removal. The f o l l o w i n g c a l c u l a t i o n i l l u s t r a t e s how t h e chemical

F i g u r e 2-5 S e n s i t i v i t y o f P r e d i c t e d Chemical S l u d g e P r o d u c t i o n t o Changes i n I n f l u e n t and E f f l u e n t P h o s p h a t e C o n c e n t r a t i o n s f o r C o n d i t i o n s R e p r e s e n t a t i v e o f B l u e P l a i n s E a s t Pr imary C l a r i f i e r s , F e b r u a r y 1984 - March 1987 a ) Expanded S c a l e , b ) R e p r e s e n t a t i v e I r o n Dose Range.
Chemical Sludge kiplday
15 Fe Dose, mq/l
SP Effluent = 1.2 mg/l
SP Effluent = 0.2 mg
SP Influent = 1.4 mgA
5 8.5 12 Fe Dose, mgl

s ludge mass c a l c u l a t i o n s a r e r e l a t i v e l y i n s e n s i t i v e t o t h e above
assumption of b i o l o g i c a l removal:
Given: MW Fel.5PO4 (OH) 1.5 = 204 and MW Fe(0H) = 107
Assume: Flow = 300 MGD (Approximate f low a t Blue P l a i n s )
B i o l o g i c a l SP Removal = 1 mg/l
Excess i r o n i s used t o p r e c i p i t a t e bo th s o l i d s , & R = 1 . 5 .
C a l c u l a t i o n s : One mg/l of SP removal forms 1 x (204/30.97) = 6.6 mg/l
phosphate s ludge , by consuming (1/30.97) ( 1 . 5 mol/mol) (55 .85) = 2 . 7
mg/l Fe. If t h e 1 mg/l SP removal i s a s s i g n e d t o b i o l o g i c a l uptake,
i n s t e a d of p r e c i p i t a t i o n , t h e n under t h e assumptions of chemical model
t h e u n r e a c t e d i r o n w i l l form 2 . 7 x (106.85/55.85) = 5 .2 mg/ l hydroxide
s ludge i n s t e a d . The c o n c e n t r a t i o n of t o t a l chemical s ludge i s reduced
by (6 .6 - 5.2) = 1 . 4 mg/ l . T h i s t r a n s l a t e s t o 1 . 4 (8 .34) (300
MGD)/1000 = 3 . 5 k ip /day . Th is i s s m a l l compared t o t h e approximately
200 k ip /day of secondary s l u d g e produced a t Blue P l a i n s , and t h e
average e s t i m a t e d secondary chemical s l u d g e p r o d u c t i o n of about 50
kip/day (See Chapter F o u r ) .

CHAPTER THREE: BLUE PLAINS W T P
3 . 1 BACKGROUND
The Blue P l a i n s wastewater t r e a t m e n t f a c i l i t y i s l o c a t e d i n t h e
s o u t h e r n c o r n e r of Washington D.C. on t h e Potomac R i v e r . I n 1986, Blue
P l a i n s t r e a t e d an average d a i l y f low 287 MGD, o r i g i n a t i n g p r i m a r i l y
from r e s i d e n t i a l a r e a s and o f f i c e complexes. Approximately 94% of
t h i s f low o r i g i n a t e s i n t h e D i s t r i c t of Columbia and Maryland, wi th
t h e b a l a n c e coming from V i r g i n i a . The t o t a l s e r v i c e p o p u l a t i o n i s
approximately 2 m i l l i o n ( 3 6 ) .
I n Maryland, a ban on phosphate d e t e r g e n t s became law on December
1, 1985. A ban i n Washington D.C. was s i g n e d i n January 1986, bu t d i d
n o t become f u l l y e f f e c t i v e u n t i l September 1986. No ban i s p r e s e n t l y
i n e f f e c t i n V i r g i n i a .
3.2 PROCESS DESCRIPTION
L i q u i d t r e a t m e n t a t Blue P l a i n s i n c l u d e s s c r e e n i n g , g r i t removal,
pr imary c l a r i f i c a t i o n , modi f i ed a e r a t i o n a c t i v a t e d s ludge ,
n i t r i f i c a t i o n , dual-media f i l t r a t i o n , c h l o r i n a t i o n , and p o s t a e r a t i o n .
F igure 3-1 is a schemat ic of t h e p r o c e s s a t Blue P l a i n s . The
i n f l u e n t is s p l i t f o r pr imary and secondary t r e a t m e n t i n an e a s t p l a n t
and a w e s t p l a n t . I n 1986 t h e average p r o c e s s f low t o t h e e a s t p l a n t
was 160 MGD, and t h e flow t o t h e west p l a n t was 130 MGD. The
secondary e f f l u e n t s a r e combined f o r n i t r i f i c a t i o n .
G r a v i t y t h i c k e n i n g and d i s s o l v e d a i r f l o t a t i o n a r e used t o t h i c k e n

Waate P i c k l e Waate Llquor, F e r r i c P i c k l e
Liquor F e r r i c
I Chlor ide Lime Polvmer
P U P S t a t i o n s Aerated Dual Ch lor ine
6 e a r G r i t Primary 1 Secondary 1 1 N i t r i f i c a t i 0 ~ Media Contact Screen. Chambers C l a r i f i e r s Aera t ion C l a r i f i e r # Aera t ion C l a r i f i e r s F i l t r a t i o n Chamhr
t o Nitrification
I a a t e S ludge Lime F e r r i c
@-
* F i l t r a t i o n
Legend:
S ludge Flow: F e r r i c Ch lor ide
Llquid Flow:
l a n d f i l l and l a n d A p p l i c a t i o n
Figure 3-1 Blue Plains Process Flow Diagram.
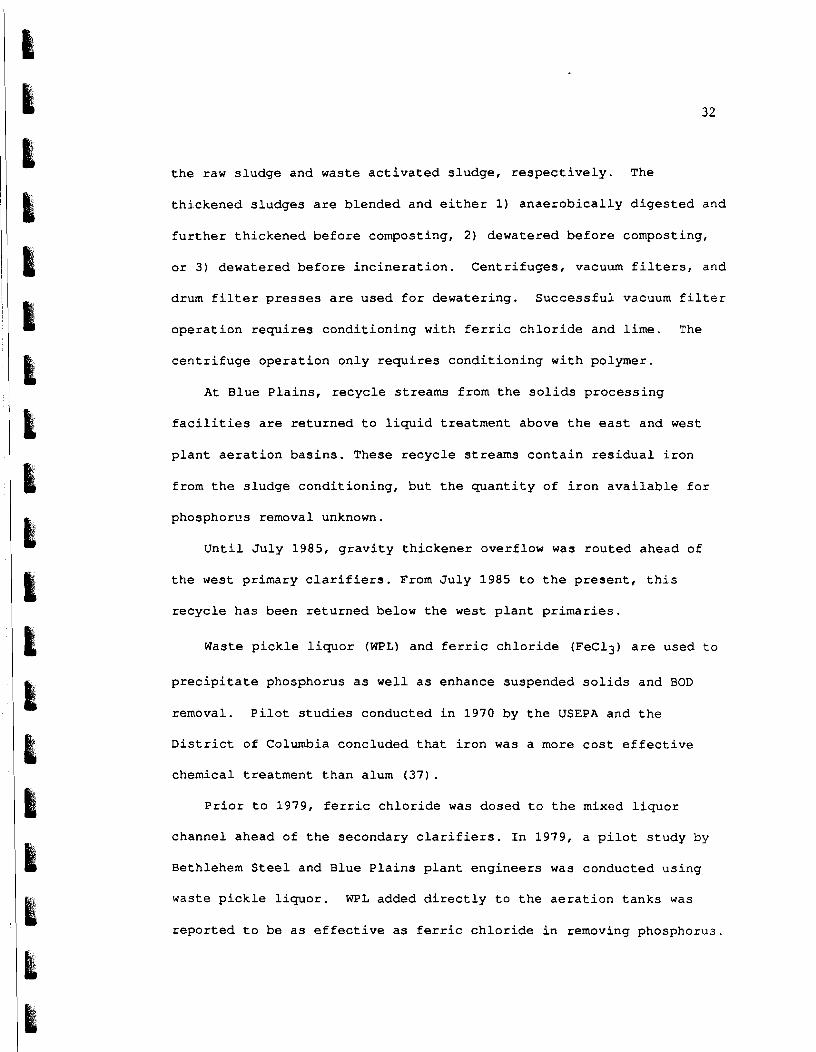
t h e raw s l u d g e and waste a c t i v a t e d s l u d g e , r e s p e c t i v e l y . The
t h i c k e n e d s l u d g e s a r e b lended and e i t h e r 1) a n a e r o b i c a l l y d i g e s t e d and
f u r t h e r t h i c k e n e d b e f o r e composting, 2 ) dewate red b e f o r e composting,
o r 3 ) dewatered b e f o r e i n c i n e r a t i o n . C e n t r i f u g e s , vacuum f i l t e r s , and
drum f i l t e r p r e s s e s a r e used f o r dewate r ing . S u c c e s s f u l vacuum f i l t e r
o p e r a t i o n r e q u i r e s c o n d i t i o n i n g wi th f e r r i c c h l o r i d e and l i m e . The
c e n t r i f u g e o p e r a t i o n o n l y requires c o n d i t i o n i n g w i t h polymer.
A t Blue P l a i n s , r e c y c l e s t r e a m s from t h e s o l i d s p r o c e s s i n g
f a c i l i t i e s a r e r e t u r n e d t o l i q u i d t r e a t m e n t above t h e e a s t and w e s t
p l a n t a e r a t i o n b a s i n s . These r e c y c l e s t r e a m s c o n t a i n r e s i d u a l i r o n
from t h e s l u d g e c o n d i t i o n i n g , b u t t h e q u a n t i t y o f i r o n a v a i l a b l e f o r
phosphorus removal unknown.
U n t i l J u l y 1985, g r a v i t y t h i c k e n e r overf low was r o u t e d ahead of
t h e w e s t p r imary c l a r i f i e r s . From J u l y 1985 t o t h e p r e s e n t , t h i s
r e c y c l e h a s been r e t u r n e d below t h e w e s t p l a n t p r i m a r i e s .
Waste p i c k l e l i q u o r (WPL) and f e r r i c c h l o r i d e (FeC13) a r e used t o
p r e c i p i t a t e phosphorus a s w e l l a s enhance suspended s o l i d s and BOD
removal. P i l o t s t u d i e s conducted i n 1970 by t h e USEPA and t h e
D i s t r i c t o f Columbia concluded t h a t i r o n was a more c o s t e f f e c t i v e
chemical t r e a t m e n t t h a n alum ( 3 7 ) .
P r i o r t o 1979, f e r r i c c h l o r i d e was dosed t o t h e mixed l i q u o r
channe l ahead of t h e secondary c l a r i f i e r s . I n 1979, a p i l o t s t u d y by
Bethlehem S t e e l and Blue P l a i n s p l a n t e n g i n e e r s was conducted u s i n g
waste p i c k l e l i q u o r . WPL added d i r e c t l y t o t h e a e r a t i o n t a n k s was
r e p o r t e d t o be a s e f f e c t i v e a s f e r r i c c h l o r i d e i n removing phosphorus.

This d o s i n g l o c a t i o n promoted t h e o x i d a t i o n o f f e r r o u s i r o n t o f e r r i c
i r o n ( 3 5 ) . The s t u d y a l s o concluded t h a t t h e s u b s t i t u t i o n of WPL f o r
f e r r i c c h l o r i d e d i d n o t s i g n i f i c a n t l y lower t h e pH of t h e f i n a l
e f f l u e n t . The s t u d y was p r i o r t o n i t r i f i c a t i o n s t a r t u p i n 1980.
Waste p i c k l e l i q u o r i s p r e f e r r e d by t h e o p e r a t o r s , because it i s
p rov ided by t h e steel i n d u s t r y a t a lower c o s t t h a n f e r r i c c h l o r i d e .
F e r r i c c h l o r i d e i s used when WPL i s n o t a v a i l a b l e t o m e e t t h e demand.
I n 1981 d u a l media f i l t e r c o n s t r u c t i o n began i n o r d e r t o m e e t t h e
e f f l u e n t suspended s o l i d s l i m i t . C o n s t r u c t i o n was n o t completed u n t i l
A p r i l 1983. Blue P l a i n s was unab le t o m e e t t h e TP l i m i t u n t i l
mid-1983 because of t h e p a r t i c u l a t e phosphorus a s s o c i a t e d wi th t h e
suspended s o l i d s (1). The e f f l u e n t l i m i t a t i o n on TP was 0 . 2 2 mg/ l f o r
t h e p e r i o d of r e c o r d examined i n t h i s s t u d y .
Beginning i n February 1984, f e r r i c c h l o r i d e was added t o t h e
a e r a t e d g r i t chambers, whi le m a i n t a i n i n g bo th f e r r i c c h l o r i d e and WPL
d o s i n g t o a e r a t i o n . Th i s a c t i o n was t a k e n t o reduce secondary s l u d g e
p r o d u c t i o n , because t h e s l u d g e t r e a t m e n t sys tem was over loaded w i t h
b i o l o g i c a l s l u d g e a s a r e s u l t of h igh o r g a n i c l o a d i n g from t h e
p r i m a r i e s .
I n A p r i l 1986, waste p i c k l e l i q u o r began t o r e p l a c e t h e use of
f e r r i c c h l o r i d e i n t h e p r i m a r i e s . I n March 1987, t h e waste p i c k l e
l i q u o r s o l u t i o n s c o n t a i n e d abou t 9 % by weight f r e e s u l f u r i c a c i d .
Before t h e end of 1987, t h e steel i n d u s t r y from which Blue P l a i n s
o b t a i n s i t s p i c k l e l i q u o r is schedu led t o change i t s t r e a t m e n t p r o c e s s
s o t h a t t h e r e s u l t i n g s o l u t i o n s w i l l c o n t a i n approx imate ly 1% by

weight f r e e h y d r o c h l o r i c a c i d (1).
3 . 3 OPERATIONS DATA
A t Blue P l a i n s , computer r e c o r d s a r e c u r r e n t l y m a i n t a i n e d f o r
n e a r l y 600 wastewater t r e a t m e n t pa ramete r s . I n March 1987, d a i l y
v a l u e s of BOD5 (BOD), t o t a l suspended s o l i d s (TSS), t o t a l phosphorus
(TP) , s o l u b l e phosphorus (SP) , waste p i c k l e l i q u o r (WPL) , FeC13, f low
( Q ) , s l u d g e flow, and s l u d g e s o l i d s were o b t a i n e d d i r e c t l y from t h e
computer d a t a b a s e . Data was o b t a i n e d f o r t h e p e r i o d from J a n 1,
1983 t o March 19, 1987.
D a i l y v a l u e s have been reduced t o monthly a v e r a g e s f o r t h e
f o l l o w i n g a n a l y s e s . Most monthly averages a r e compi led from 20 t o 31
d a i l y measurements, wi th t h e e x c e p t i o n of March 1987. A l l monthly
averages r e g a r d l e s s of t h e number of d a i l y o b s e r v a t i o n s , a r e
c o n s i d e r e d r e p r e s e n t a t i v e of o p e r a t i n g c o n d i t i o n s d u r i n g t h e month.
Secondary i n f l u e n t and e f f l u e n t pH and t o t a l a l k a l i n i t y ( a s CaC03)
d a i l y a v e r a g e s w e r e t r a n s c r i b e d from handlogs f o r February 1, 1984 t o
March 17, 1987. The d a i l y average pH v a l u e s r e p r e s e n t t h e s imple
average of t h r e e pH va lues , one from each e i g h t hour work s h i f t . I n
each s h i f t , two pH measurements a r e averaged. I n t h e a n a l y s i s ,
monthly average v a l u e s a r e s imple averages , computed from t h e r e p o r t e d
d a i l y a v e r a g e s .
F i g u r e s 3-2 through 3-5 a r e s i m p l i f i e d p r o c e s s f low diagrams,

F i g u r e 3-2 B l u e P l a i n s E a s t P r i m a r y Process D a t a .
I R O N D O S E (rng/l) I N F L U E N T C O N D I T I O N S
( F E E 1984 - MAR. 1987)
WPL Fe3 T o t a l Q B O D 1 T S S I T P I S P I
AVE. 3.93 7.36 8.60 S . D . 2.08 4.26 3.20 N. 12 3 8 3 8 MAX 6.84 15.11 15.11 M I N 0 0 0.51
d
AVE. 171.8 121.7 133.7 4.39 2.59 S . D . 23.1 19.6 23.0 0.69 0.55 N. 5 1 5 0 51 50 4 3 MAX 235.2 178.6 180.3 6.02 3.86 M I N 138.3 69.1 70.8 3.25 1.41
P R I M A R Y n C L A R I F I E R S
S O L I D S P R O C E S S I N G RECYCLE
Q B O D I TSSI T P I
A V E - 14.0 115.2 322.5 4.8 S . D . 3.26 36.2 113.7 2.2 N. 39 38 39 39 MAX 17.4 213.6 639.8 11.8 M I N 2.1 57.3 165.8 1.6
I,
p H 0 ALKO
AVE. 6.94 133.3 S . D . 0.10 10.7 N. 33 3 3 MAX 7.12 156.4 M I N 6.68 109.4
- CALCULATED E F F L U E N T C O N D I T I O N S
B O D 0 T S S O T P O S P 0
AVE. 70.6 49.8 2.93 0.78 S . D . 10.5 14.7 0.97 0.54 N. 4 9 5 1 5 0 4 0 MAX 89.4 93.4 5.33 2.74 M I N 53 8 1.14 0.16
SECONDARY I N F L U E N T C O N D I T I O N S

F i g u r e 3 -3 B l u e P l a i n s West P r i m a r y P r o c e s s D a t a .
IRON DOSE
(FEB 1984 - MAR. 1987) WP L Fe3 TOTAL
AVE. 4.47 6.43 7.88 S.D. 2.51 3.91 2.92 N. 12 38 3 8 MAX 0 0 0
+ INFLUENT CONDITIONS
I Q BODI TSSI TPI SPI
AVE. 135.2 128.0 139.2 4.31 2.42 S.D. 13.3 18.3 25.6 0.76 0.74 N. 51 5 0 51 50 4 2 MAX 162.2 164.3 191.5 6.20 5.40 MIN 79.6 87.5 73.5 3.00 1.37
GRAVITY THICKENER OVERFLOW
(JAN. 1983 - JUNE 1985) Q BODI TSSI TPI
PRIMARY AVE. 14.7 445 682 15.5 CLARIFIERS S.D. 1.1 391 728 14.7 ( IN. 30 28 30 29
SOLIDS PROCESSING RECYCLE 'Y MAX 16.8 1729 2929 64.7
Q BOD TSS TP MIN 10.3 106 129 3.93
AVE. 10.3 113.3 219 5.11 1 . S.D. 6.6 35.5 115 2.19 N. 5 1 4 9 51 50 MAX 21.0214 637 11.80 MIN 3.2 57.3 159 1.61
L
pH0 ALXO
AVE. 6.87 136.2 S.D. 0.13 24.5 N. 33 33 MAX 7.13 249
CALCULATED EFFLUENT CONDITIONS
BOD0 TSSO TPO SPO
AVE. 92.4 85.7 3.20 0.57 S.D. 14.0 19.7 0.90 0.39 N. 49 51 50 4 0 MAX 118.0 129.0 5.6 1.76 MIN 52 36 1.40 0.17
GRAVITY THICKENER OVERFLOW
(JUNE 1985 - MARCH 1987) Q BOD TSS TP
MIN 6.62 112 I AVE. 12.7 157 223 4.3 S.D. 2.7 83 6 7 1.3
SECONDARY INFLUENT CONDITIONS 2 1 21 21 MAX 15.3 451 379 6.5 MIN 4.9 64 148 2.5 1 "' 22

F i g u r e 3-4 B l u e p l a i n s E a s t S e c o n d a r y P r o c e s s D a t a .
INFLUENT CONDITIONS (mg/l)
Q BOD1 TSSI TPI SPI pH1 ALKI
AVE 179 .4 73 .9 67 .1 2 .94 0 .78 6.94 1 3 3 . 3 S.D. 1 9 . 2 10 .4 13 .4 0 . 9 1 0 .54 0 .10 1 0 . 9 N 5 1 50 5 1 50 40 3 3 3 3 MAX 236.7 97 .7 99 .0 5 . 3 3 2 .74 7 . 1 2 156 .4 MIN 152 .4 56 41 .1 1 . 2 7 0 .16 6 .68 109 .4
IRON (mg / l ) I
TOTAL IRON (mg / l )
AVE 6 . 4 9 S.D. 2 . 7 5 N 5 1 MAX 1 2 . 1 MIN 0
b
IRON (rng/ l)
Fe3
I
AERAT I ON
AVE 3 . 4 9 S.D. 3 . 6 0 N 5 1
AVE 9 .98 S.D. 2 . 4 8 N 5 1 MAX 1 8 . 2 MIN ( CLARIFICATION \
MAX 1 2 . 3 0 MIN 0
Wasted Sludge ( k i p / & y )
AVE 69 .99 S.D. 1 9 . 6 7 N 5 1 MAX 1 1 4 . 9 5
EFFLUENT CONDITIONS (mg / l ) MIN 33.2
BOD0 TSSO TPO SPO pH0 ALKO
AVE 1 3 . 6 1 9 . 7 0 .07 0 .17 6 . 8 9 1 0 4 . 3 S.D. 6 . 9 9 . 9 0 . 4 1 0 .16 0 .15 1 3 . 5 N 5 0 5 1 5 0 44 33 3 3 MAX 30 46 .1 1 . 6 8 1 . 0 7 . 2 3 132 .0 MIN 4 .9 7 . 8 0 . 2 3 0 . 0 5 6 .59 7 7 . 1
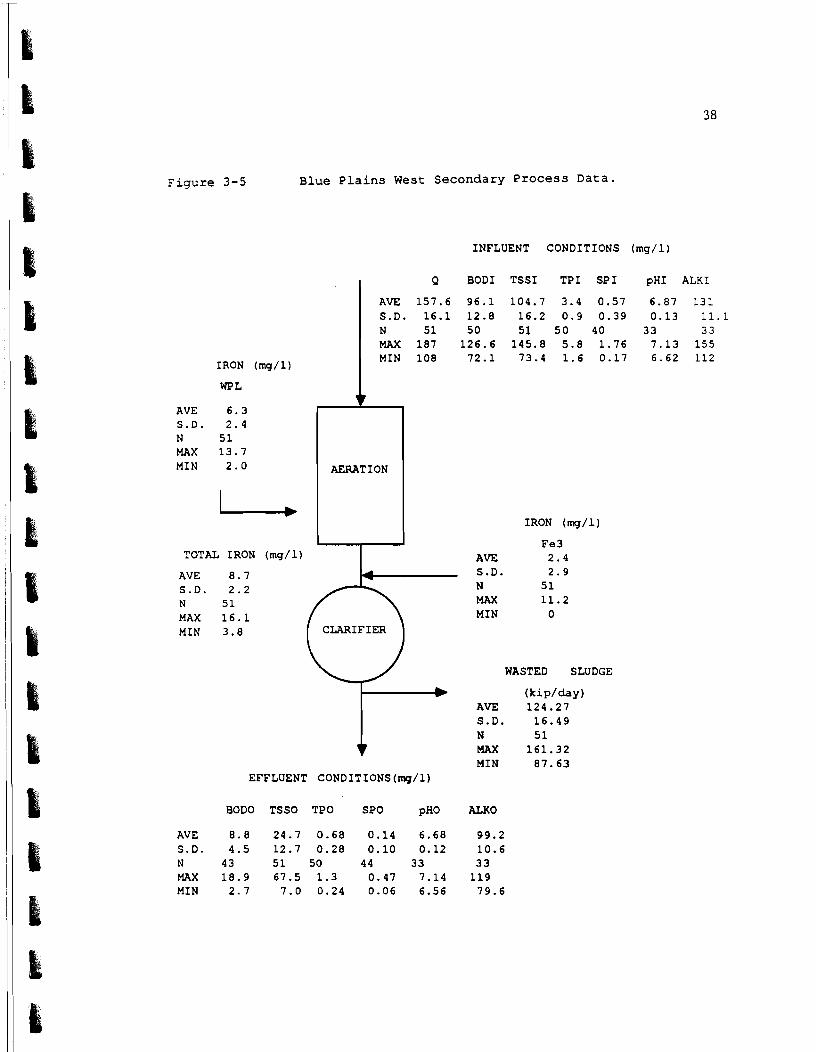
Figure 3-5 Blue Plains West Secondary Process Data.
INFLUENT CONDITIONS (mg/l)
w WASTED SLUDGE
IRON (mg/l)
WPL
r (kiplday) AVE 124.27 S.D. 16.49 N 5 1 MAX 161.32 MIN 87.63
EFFLUENT CONDITIONS (mg/l)
Q BOD1 TSSI TPI SPI pH1 ALKI
AVE 157.6 96.1 104.7 3.4 0.57 6.87 131 S.D. 16.1 12.8 16.2 0.9 0.39 0.13 11.1 N 51 50 51 50 40 3 3 3 3 MAX 187 126.6 145.8 5.8 1.76 7.13 155 MIN 108 72.1 73.4 1.6 0.17 6.62 112
BOD0 TSSO TPO SPO pH0 ALKO
AVE 8.8 24.7 0.68 0.14 6.68 99.2 S.D. 4.5 12.7 0.28 0.10 0.12 10.6 N 4 3 51 50 4 4 3 3 3 3 MAX 18.9 67.5 1.3 0.47 7.14 119 MIN 2.7 7.0 0.24 0.06 6.56 79.6
v
IRON (mg/l)
Fe3
AVE 6.3 S.D. 2.4 N 5 1 MAX 13.7 MIN 2.0
L TOTAL IRON (mg/l) AVE 2.4
AVE 8.7 4 S.D. 2.9 S.D. 2.2 N 5 1
N 5 1 MAX 11.2 MAX 16.1 MIN 0 MIN 3.8 CLARIFIER
AERATION

showing the parameters collected from the plant records and the
locations at which they were measured. The primary effluent pH and
alkalinity are assumed to be the same as the measured secondary
influent values. This assumes that the net impact of recycle streams
is zero.
BOD, TSS, TP, SP, alkalinity, and pH are measured directly above
and below the aeration basis. For primary treatment analyses, the
impact of recycle streams must be considered. Primary influent and
effluent BOD, TSS, and TP values are estimated by mass balance
calculations, taking into account the addition or subtraction of
recycle flows. SP concentrations are not measured in the gravity
thickener overflow recycle (GTOR) or solids processing building
recycle (SPBR) streams.
Assumptions are made regarding locations where the SP
concentration was not measured. The assumptions for estimating
primary influent and effluent SP values are: 1) west primary influent
SP concentration equals the raw influent concentration, 2) west
primary effluent SP concentration equals the west secondary influent
concentration, and 3 ) east primary effluent SP concentration is
equal to the east secondary influent concentration. The east primary
influent receives no recycle.
A discussion of the assumptions and a sensitivity analysis are
provided in Appendix B.

3.4 RAW INFLUENT CHARACTERISTICS
F i g u r e 3-6 shows t h a t t h e t o t a l p r o c e s s f low a t Blue p l a i n s h a s
d e c r e a s e d s i n c e 1983.
F i g u r e s 3-7a,b th rough 3 - l l a , b show t h e combined raw i n f l u e n t
was tewa te r p a r a m e t e r s of BOD, TSS, TP, SP, and p a r t i c u l a t e phosphorus
(TP-SP). The v a l u e o f t h e s e pa ramete r s i n c r e a s e d between mid 1984 and
l a t e 1985, b e f o r e d ropp ing o r l e v e l i n g o f f , T h i s hump i n t h e SP d a t a
i s c l e a r i n F i g u r e s 3-10a and 3-lob. The d e c r e a s e i n l a t e 1985
rough ly c o i n c i d e s w i t h t h e d e t e r g e n t phospha te b a n .
F i g u r e 3 - l l b shows t h a t p a r t i c u l a t e phosphorus mass l o a d i n g
d e c r e a s e d t o i ts lowes t obse rved v a l u e s i n 1986, b e f o r e t r e n d i n g
upward.
F i g u r e s 3-7c t o 3-10c a r e s c a t t e r p l o t s o f c o n c e n t r a t i o n (mg/ l )
v e r s u s mass l o a d i n g ( k i p / d a y ) . The s t r o n g p o s i t i v e c o r r e l a t i o n
between was tewa te r s t r e n g t h and mass l o a d i n g i n d i c a t e s t h a t e i t h e r
c o n c e n t r a t i o h o r l o a d i n g may b e used t o d e v e l o p e m p i r i c a l phosphorus
removal and s l u d g e p r o d u c t i o n r e l a t i o n s h i p s .
F i g u r e s 3-7d th rough 3-10d a r e s c a t t e r p l o t s o f i n f l u e n t pa ramete r
c o n c e n t r a t i o n s v s . f low. Decreases i n i n f l u e n t BOD and TSS a r e
s i g n i f i c a n t l y c o r r e l a t e d wi th i n c r e a s i n g f low, i n d i c a t i n g a d i l u t i o n
e f f e c t .
I n f l u e n t TP and SP c o n c e n t r a t i o n s a r e n o t l i n e a r l y c o r r e l a t e d w i t h
f low. Some d a t a i s m i s s i n g from 1983, when f l o w was h i g h e r , however,
measurements of t h e s e p a r a m e t e r s e x i s t a t t h e maximum f low (380 MGD).
The d i l u t i o n e f f e c t is n o t r evea led , because b o t h i n f l u e n t phosphorus


F i g u r e 3-7
Raw Influent BOD mgJl
Blue P l a i n s Combined Raw I n f l u e n t a ) BOD C o n c e n t r a t i o n v s . Year, b) BOD Mass Loading v s . Year, c) BOD C o n c e n t r a t i o n v s . Mass Loading, d) BOD C o n c e n t r a t i o n v s . Flow.
Raw Influent BOD kiplday
Year
200 - r = -0.63
I n - 50 I r0.99 - 0.33
(a r r a m
8
5 0 , . , . . . . . . . . , . , . +
200 - -
2 d g
200 500 250 400
BOD, kiplday Fbw, Mgd
r -0.87 n -50 r0.99 - 0.33
8
+p
1% 2 8 '
8
5 0 ~ . , , , . . . , , . . . . ,

Figure 3-8 Blue P la ins Combined Raw Inf luent a ) TSS Concentration v s . Year, b) TSS Mass Loading v s . Year, c ) TSS Concentration v s . Mass Loading, dl TSS Concentration v s . Flow.
R a v Influent TSS mgJl
Raw Influent TSS kiplday
200 4.7.-.---~-- 83 84 85 86 87
Year
200
(c) F c/i
(d)
2
50
200 . r - 0.89 8
: n - 5 1 a .
r0.99 = 0.33
500 200 500 200 TSS,ldp/day Flow, Mgd
vi 2
28* :'."a
Yrn I 8 ' ,8'
8 8
5
5 0 4 . . . . . . . . . a . . . . -

Figure 3-9 Blue Plains Combined Raw Influent a) TP Concentration vs. Year, b) TP Mass Loading vs. Year, c) TP Concentration vs. Mass Loading, d) TP Concentration vs Flow.
Raw Influent TP mgll
Raw Influent TP kiplday
5 83 84 85 86 87
Year
(d)
8 8 '
P (C) d E +
2 2 ~ . - ~ . ~ - . , = , . . . , 5 20 250 400
TP, kp'day l=bV9 Mgd
8
m a ' - 0 #
0 , . # am . , 8 , I
I+,,

Figure 3-10 Blue Plains Combined Raw Influent a) SP Concentration vs. Year, b) SP Mass Loading vs. Year, c) SP Concentration vs. Mass Loading, d) SP Concentration vs. Flow.
Raw Influent SP mg/l
Raw Influent
SP kiplday
84 85 86 87 Year
5
tC) d il (a (r)
0
5 - '
P . 0.- (I)
O T .
0 12 250 400 SP, kip/day Fbw, Mgd
r - 0.94 I
n-42 8
'0.99 - 0.36 ' h ?
8p8 :'* 0'.

F i g u r e 3-11
Rav Influent Part-P mg/'
B l u e P l a i n s Combined Raw I n f l u e n t a ) P a r t i c u l a t e Phosphorus C o n c e n t r a t i o n v s . Year, b) P a r t i c u l a t e Phosphorus Mass Loading v s . Year, c) P a r t i c u l a t e Phosphorus Mass Loading v s . TSS Mass Loading, ( P a r t i c u l a t e Phosphorus = TP - SP) .
Raw Influent Part-P
kiplday
0 83 84 85 86 87
Year

c o n c e n t r a t i o n s and f low have d e c r e a s e d with t i m e .
F i g u r e 3 - l l c does no t r e v e a l t h e expec ted r e l a t i o n s h i p between
i n f l u e n t p a r t i c u l a t e mass l o a d i n g and TSS l o a d i n g .
3 .5 PRIMARY PHOSPHORUS REMOVAL
3 . 5 . 1 Recycle Flows
G r a v i t y t h i c k e n e r overf low (GTOR) was r o u t e d ahead of t h e w e s t
pr imary c l a r i f i e r s p r i o r t o J u l y 1985. F igure 3-12 shows t h e
c o n t r i b u t i o n of t h i s r e c y c l e t o i n f l u e n t BOD, TSS, and TP ( k i p / k i p ) .
The impact o f t h e r e c y c l e is c l e a r l y r e v e a l e d i n subsequent p l o t s of
west pr imary i n f l u e n t c o n d i t i o n s .
3 . 5 . 2 So lub le Phosphorus Removal
F i g u r e s 3-13 and 3-14 show t h e pr imary i r o n d o s i n g and SP removal
d a t a . The t i m e s e r i e s p l o t s show t h a t i n f l u e n t phosphorus
c o n c e n t r a t i o n s , i r o n dose, and SP removed i n c r e a s e d from 1984 t o
mid-1985, b e f o r e d e c r e a s i n g a g a i n .
F i g u r e s 3-14a and 3-14c i n d i c a t e no apparen t d i f f e r e n c e between SP
removal for WPL o r f e r r i c c h l o r i d e dos ing . The e f f e c t of d i f f e r e n t
p r e c i p i t a n t s on SP removal is fo rmal ly t e s t e d i n Chap te r Four .
The e f f l u e n t SP c o n c e n t r a t i o n s i n F i g u r e s 3-14b and 3-14d a r e n e a r
t h e s o l u b i l i t y l i m i t f o r or thophosphate . Based on t h e p r e c i p i t a t i o n
model of J e n k i n s et a l . ( 3 2 ) , c a l i b r a t e d t o t h e e x p e r i m e n t a l t a p water
d a t a of Recht and Ghassemi (581, t h e s o l u b i l i t y l i m i t f o r
or thophosphate i n a t pH = 6.94 is approx imate ly 0.17 mg/l
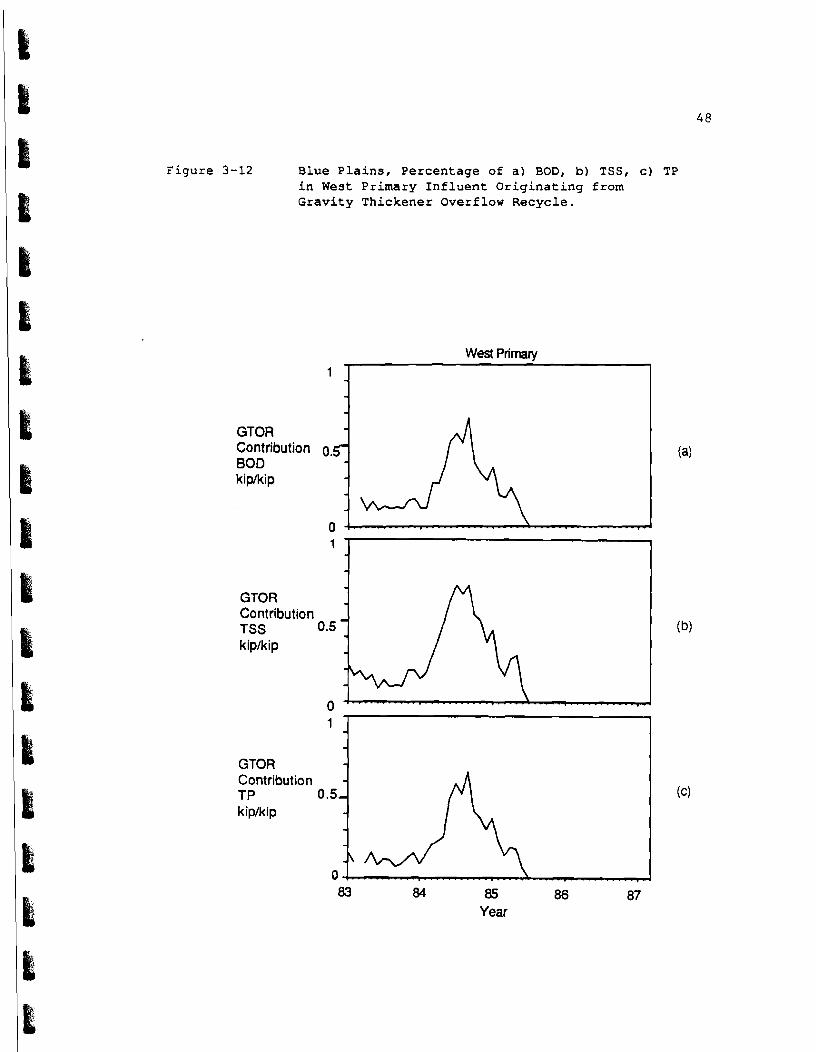
F i g u r e 3-12 B l u e P l a i n s , P e r c e n t a g e o f a ) BOD, b) T S S , c ) T P i n West P r i m a r y I n f l u e n t O r i g i n a t i n g f r o m G r a v i t y T h i c k e n e r O v e r f l o w R e c y c l e .
West Primary
'I
Contribution 0. BOD kipkip
GTOR Contribution TSS 0.5 ' kiplkip
- GTOR - Contribution TP kiplkip - -
83 84 85 86 87 Year


. . P r-
LJJ m 3 - hpl h n = :?
" L A
? i f l a r r n p - a m
3 % G O
ro G II . m 9 =l
a m y 2 6 .
LJJ 0 ro =l
+ m m
Il, rr r. 3 n r r a

and a t pH = 6.87 i s 0.13 mg/ l . These pH va lues r e p r e s e n t average
secondary i n f l u e n t v a l u e s a t Blue P l a i n s f o r t h e e a s t and w e s t p l a n t s ,
r e s p e c t i v e l y . F i g u r e 3-15a,c shows t h e r e l a t i o n s h i p s between SP removed and
i n f l u e n t SP. The amount o f SP removed i s c o n s t r a i n e d by t h e amount
a v a i l a b l e . Th i s p a r t i a l l y e x p l a i n s t h e l i n e a r t r e n d s i n F i g u r e
3-14a,c. The r e l a t i o n s h i p between i n f l u e n t SP, SP removed, i r o n dose
and f low i s f o r m a l l y s t u d i e d i n Chapter Four.
F i g u r e 3-16 i n d i c a t e s t h a t i n f l u e n t SP and i r o n dose a r e mi ld ly
r e l a t e d i n t h e e a s t p l a n t , b u t no t i n t h e west p l a n t .
F i g u r e 3-17a,c shows t h e Fe/Pc mole r a t i o and t h e pr imary e f f l u e n t
SP c o n c e n t r a t i o n . The average Fe/Pc r a t i o s a r e g r e a t e r than t h e
t h e o r e t i c a l s t o i c h i o m e t r i c va lue , which i s approximately 1 . 5 .
D e v i a t i o n s from t h e o r e t i c a l v a l u e s may b e a t t r i b u t e d t o i n e f f i c i e n c i e s
a s s o c i a t e d w i t h mixing, a e r a t i o n , and dose p o i n t , o r t o t h e degree t o
which SP measurements r e f l e c t t r u e or thophosphate c o n c e n t r a t i o n i n
p r imary t r e a t m e n t .
The t i m e s e r i e s p l o t s of Fe/Pc show a g e n e r a l downward t r e n d p r i o r
t o e a r l y 1986.
3 . 5 . 3 A l k a l i n i t y and pH
F i g u r e 3-18 shows t h a t h i g h e r primary i r o n doses a r e g e n e r a l l y
a s s o c i a t e d wi th d e c r e a s e s i n t h e secondary i n f l u e n t pH and a l k a l i n i t y .
Raw wastewater pH and a l k a l i n i t y a r e n o t measured, s o c a u s a l

SP Removed mq/l
SP Effluent W'I
East Primary
'7
0 2 . 5 5 SP Influent, mq/l
SP Removed Wl
SP Effluent Wl
West Primary
4l
0 2.5 5 SP Influent, rngll
Figure 3-15 Blue Plains Primary, SP Removed vs. Influent SP a) East Plant, C) West Plant, SP Effluent vs SP Influent b) East Plant, d) West Plant (0 = FeC13, W = WPL, X = FeC13 + WPL, N = no iron).


3 E a c a
n n I1 P- P-
,525 a n n r % $ 7
=I [P X I D f l V ,
ID II u a o
o r 0 = I u w 3 m ? ~ a
rr w 2 - n w u % - V, + I D H
m o z B " , Z t ' f l a c
w ID a n 3
Z r r < * w
II 3 H W r r 3 3
2 - - I 0 r <
! L C (a P . - I D . n 3 0 L r r V 3 I D k - U W P - *
a w h r r % w w 3 3 " l rr P- 0
r e l a t i o n s h i p s can not be assured. However, t he process chemistry is
cons i s t en t with t h e observed r e l a t ionsh ips .
3.5.4 BOD, TSS, and TP
Figures 3-20a,c and 3-22a,c show BOD and TSS removed vs. i ron
dose. Since enhanced BOD and TSS removal is expected t o occur w i t h
i r o n dosing, t h e fol lowing model was f i t t o test f o r t h e ex is tence of
an e f f e c t due t o i ron dosing:
BOD o r dTSS = bo + bl Z + b2 Z Fe
where Z = 1 i f i ron i s dosed.
= 0 i f otherwise.
&OD = BOD removed , mg/l
dTSS = TSS Removed , mg/l
Fe = Iron dose , mg/l
The dummy va r i ab le c o e f f i c i e n t b l was s i g n i f i c a n t (a= 95%) i n a l l
regress ions except f o r t h e west p lan t TSS da ta . The addi t ion of the
t h i r d model term, b2 Z Fe, d id not s i g n i f i c a n t l y improve any
regress ion . The s i m p l i s t i c i n t e r p r e t a t i o n i s t h a t adding i ron
inc reases t h e removal of BOD and TSS by a constant amount over the
range of i r o n doses used.
There i s a problem with t h i s i n t e r p r e t a t i o n . The pre-iron
add i t ion d a t a i s from a period of higher flow. Lower TSS and BOD


.. . L . a u r u o . CI In

v v a P P P w w C J J I D rr rr - - v
I-' a 2 w - I--
J E E U ID ID UCav f l f l t - i
v v g +'I-' w w w t - i J J y rr c(
w c3 J cn a cn


removal c o u l d occur i f p r imary c l a r i f i e r over f low r a t e s w e r e i n c r e a s e d
t o compensate f o r i n c r e a s e d f low. For t h e w e s t p r i m a r i e s , t h e l i n e a r
c o r r e l a t i o n c o e f f i c i e n t s f o r f l o w and BOD removal, dBOD, were
i n s i g n i f i c a n t ( r = -0.02, n = 49, ~ 0 . 9 9 = 0 . 3 3 ) . The c o r r e l a t i o n f o r
f l o w and TSS removed was a l s o i n s i g n i f i c a n t ( r = 0.15, n = 51, 10.99 =
0 . 3 2 ) . For t h e e a s t p l a n t t h e c o r r e l a t i o n s wi th f low, BOD removal,
and TSS removal were found t o b e s i g n i f i c a n t (BOD-Q: r = -0.62, n =
49, ~ 0 . 9 9 = 0 .33 : TSS-Q: r = -0.59, n = 51, r0 .99 = 0 . 3 2 ) . P l o t s of
t h e s e d a t a a r e n o t inc luded , b u t t h e c o r r e l a t i o n c o e f f i c i e n t s r e f l e c t
t h e o b s e r v e d p a t t e r n s .
The same r e g r e s s i o n model of Equat ion 3-1 was f i t t o BOD and TSS
e f f l u e n t d a t a . The r e s u l t s a r e p r e s e n t e d i n F i g u r e s 3-20b,d and
3-22b,d. The f i t i n d i c a t e d t h a t a s i g n i f i c a n t r e d u c t i o n i n e f f l u e n t
TSS c o n c e n t r a t i o n s f o r t h e e a s t p l a n t o n l y . For t h e e a s t p l a n t ,
e f f l u e n t BOD and e f f l u e n t TSS w e r e n o t found t o be l i n e a r l y c o r r e l a t e d
wi th f low ( a t 95%) .
The d a t a f o r t h e w e s t p l a n t a r e n o t a s conv inc ing , s i n c e t h e
r e s u l t s a r e a f f e c t e d by d a t a co r respond ing t o t h e g r a v i t y t h i c k e n e r
over f low problems i n 1984. For t h e west p l a n t , e f f l u e n t BOD was not
c o r r e l a t e d wi th f low ( a t 9 5 % ) . The c o r r e l a t i o n between e f f l u e n t TSS
and f low was found t o be r - -0.42 (n = 51, ~ 0 . 9 9 = 0 . 3 2 ) .
The r e s u l t s of t h e above a n a l y s e s i n d i c a t e t h a t p r imary i r o n
d o s i n g h a s , i n g e n e r a l , improved t h e e f f l u e n t q u a l i t y of t h e e a s t
p l a n t . The r e s u l t s a l s o sugges t t h a t p r imary s l u d g e p r o d u c t i o n

increases are not only due to chemical precipitates, but enhanced TSS
removal.
Figure 3-23 shows the relationship between primary BOD removal and
TSS removal.
Total phosphorus data is presented in Figures 3-24 and 3-25. The
negative removal value in the east plant was for March 1987. Only a
few daily measurements for primary influent and effluent phosphorus
(SP and TP) were available for March 1987, and the discrepancy is
probably related to the limited daily data.
For the west plant, the negative TP removal values are from
February and April 1983.
Simple single variable linear relationships between TP removal, TP
effluent and iron dose are not offered. TP removal is a function of
SP removal and particulate phosphorus removal. However, the data
clearly indicate that TP removal and effluent TP are related to iron
dosing.
3.6 PRIMARY SLUDGE PRODUCTION
The primary sludge data used are combined east and west plant
sludge productions. Primary sludge solids and flow measurements are
taken prior to gravity thickening.
Figure 3-26a shows the reported primary sludge production between
January 1983 and December 1986, with the amount and type of iron dose.
The hump in mid-1984 corresponds to: (1) the first year of iron
dosing, when chemical sludge became a portion of the measured raw


a a m P P P w w c 3 3 (0
r r w P
a a n l - - la.
5 g z u U U w n n n

P 0 I . . .
01 0
r 0
P 0 0
r o o "-.. Po 00 0
0
0
0

Figure 3-26 Blue P l a i n s Primary Sludge a ) Reported Sludge and Iron Dose, b) Reported Sludge, TSS Removed, and Predicted Chemical Sludge, c ) Estimated Fraction o f Chemical Sludge.
Primary Sludge
Sludge and Fe Dose kiplday O
Primary Solids kiplday
1 primary Sludge - TSS A \ I Removed
Estimated 4 Fract ion of 4 . I
L 0 I . - - . - - I 83 84 85 86 87
Year
Sludge kiplkip
(c)

s ludge , ( 2 ) a peak flow of 380 Mgd i n A p r i l 1984, and ( 3 ) g r a v i t y
t h i c k e n e r problems (see F i g u r e 3-12) . The hump i n mid-1985
cor responds t o a s u b s t a n t i a l i n c r e a s e i n i r o n u s e and t o a n i n c r e a s e
i n wastewater s t r e n g t h . (See 3.4 RAW INFLUENT CHARACTERISTICS)
F i g u r e 3-26b shows r e p o r t e d s ludge , TSS removed, and p r e d i c t e d
chemical s l u d g e ( E q . 2-3, 2-4, 2-5) f o r p r imary t r e a t m e n t . The
average r a t i o of chemical t o t o t a l s l u d g e (shown i n ~ i g u r e 3-26c) i s
0.167 (S.D. - 0.047, n - 35) . F i g u r e 3-27 shows t h e r e p o r t e d s l u d g e p r o d u c t i o n v e r s u s f low. The
d a t a l a b e l s r e p r e s e n t i r o n d o s e i n t o n s . The X d a t a l a b e l s r e p r e s e n t
months where no i r o n was dosed . The d a t a v a l u e s a t t h e ex t reme r i g h t
( l a b e l e d 6 ,12,11,13) co r respond t o t h e f i r s t f o u r months o f i r o n
dos ing , g r a v i t y t h i c k e n e r overf low problems, and h i g h f l o w . The d a t a
i n d i c a t e t h a t s l u d g e p r o d u c t i o n i s dependent on f low and i r o n dose .
The r e l a t i o n s h i p between s l u d g e p roduc t ion , TSS, i r o n dose , and f low
i s f u r t h e r examined i n Chapter Four.
F i g u r e 3-28b shows raw s l u d g e p r o d u c t i o n v s . i r o n d o s e . F igure
3-28c shows t h e r e l a t i o n s h i p between s l u d g e p r o d u c t i o n and t h e o r e t i c a l
chemical s l u d g e p roduc t ion , e s t i m a t e d wi th Equa t ions 2-3 th rough 2-5.
S ince t h e o r e t i c a l chemical s l u d g e p r o d u c t i o n i s a l i n e a r f u n c t i o n of
t h e i r o n dose , t h i s p l o t i s s i m i l a r i n shape t o F i g u r e 3-28b.
However, a s shown i n F igure 3-27, t h e e f f e c t of f low i s p a r t i a l l y
r e s p o n s i b l e f o r t h e s e d i s t o r t e d t r e n d s .
F i g u r e 3-26b shows t h a t pr imary s l u d g e can b e l a r g e l y e x p l a i n e d by
suspended s o l i d s removal, w i t h t h e e x c e p t i o n of d a t a i n 1985 a t peak

F l o w . MGD
F i g u r e 3-27 Blue Pla ins Primary Reported Sludge Production v s . Flow. Data l a b e l s represent iron dose i n tons and X's denote no iron dose Note: some data have been separated by commas t o reveal the l a b e l s .
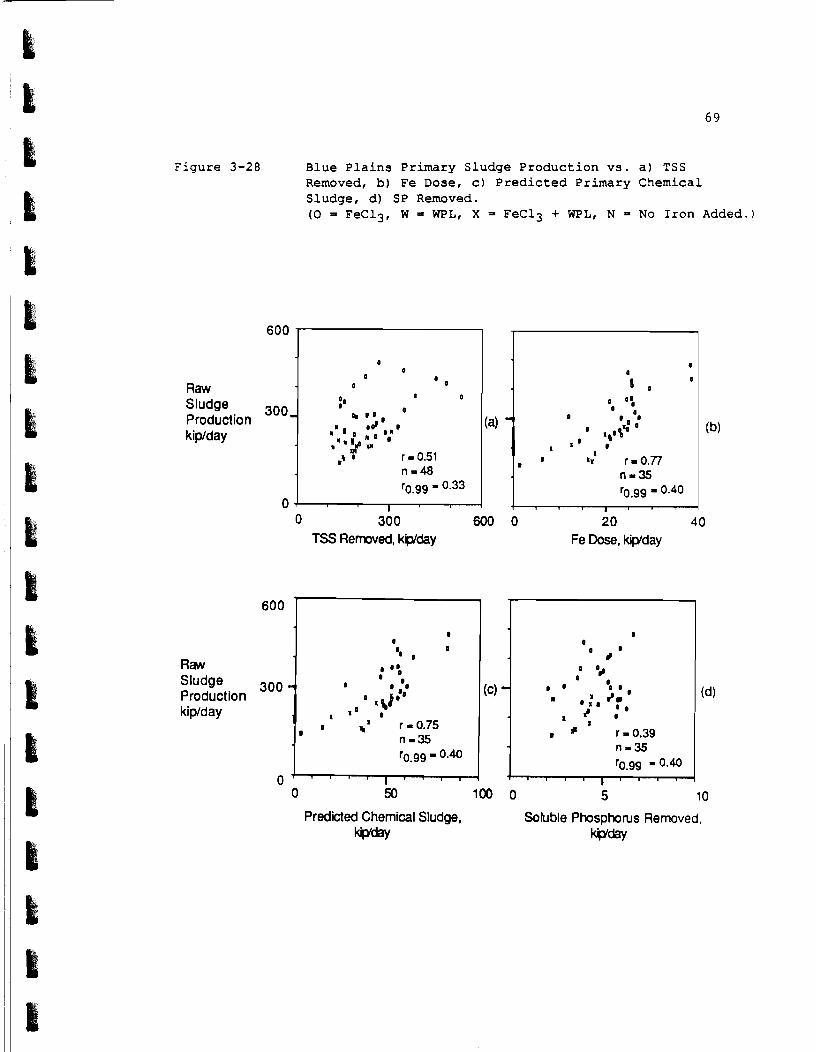
Figure 3-28 Blue Plains Primary Sludge Production vs. a) TSS Removed, b) Fe Dose, c) Predicted Primary Chemical Sludge, d) SP Removed. (0 = FeC13, W = WPL, X = FeC13 + WPL, N = No Iron Added.)
(a) - (b)
600 -
Raw Sludge 300 Production kiplday
0 7
600
Raw Sludge 300 -.( Production kiplday
0 300 600 0 2 0 40 TSS Removed, k i y Fe Dose, kiwday
0
0 0
a 0
0 0 ;I 01 0 0
I o d ' o ' 0 " 0 0 , "
,'n:@ m .* r - 0.51 n = 48 '0.99 = 0.33
I
0 50 100 0 5 10
Predicted Chemical Sludge, Soluble Phosphotus Removed, w a y kp'day
. 0
. '0 0
0 . 0 :
0 O O 0 0
.J:' I .
o r-0.75 r n -35 '0.99 = 0.40
O " ' " I ~ l l n
(C) ' (d)

iron dosing.
3.7 SECONDARY PHOSPHORUS REMOVAL
3.7.1 Influent Conditions
Secondary influent conditions are determined by the operation of
the primary treatment plant, and by the character of the recycle
streams entering below the primaries. Iron dosing to the primaries
began in February 1984. Trends in secondary influent conditions that
begin or end at this time may signal impacts on the secondary units
resulting from the split dosing.
Figures 3-29 and 3-30 show recycle stream percentage contributions
of BOD, TSS, and TP (kip/kip) to the secondary influent. Figures 3-31
and 3-32 show the concentrations of BOD, TSS, and TP in the recycles.
Figure 3-33 shows the recycle flows. SP measurements are not taken in
the recycles.
E,ast P m . Prior to 1984, the west primary effluent received
the solids processing building recycle (SPBR) . In March 1984 the flow
was routed below the east primaries, and has contributed 13% of the
BOD, 39% of the TSS, and 16% of the TP to the east secondary influent
(kip/kip) .
Primary iron dosing has been shown to decrease the loading of BOD,
TSS, and TP on the east secondaries. However, the step impact of
primary iron dosing on secondary influent characteristics is not
apparent (See Figures 3-46 and 3-48) since startup of the SPBR recycle
roughly coincides with the initiation of primary iron dosing.

F i g u r e 3-29 Blue P l a i n s , F r a c t i o n o f a ) BOD, b) TSS, c) TP i n East Secondary I n f l u e n t O r i g i n a t i n g f rom S o l i d s P r o c e s s i n g Recycle Flow.
East Secondary Influent 1 I
Recycle Contribution 0.5 BOD kiplkip 4 I
TSS kiplkip rJ 1. Recycle Contribution
Recycle Contribution TP 0.5 3
83 84 85 86 87 Year

F i g u r e 3-30 Blue P l a i n s , F r a c t i o n of a ) BOD, b) TSS, c ) TP i n West Secondary I n f l u e n t O r i g i n a t i n g f rom S o l i d s P r o c e s s i n g and G r a v i t y Thickener Overflow Recyc les .
West Secondary Influent
Recycle Contribution BOD kipfkip
Recycle Contribution TSS 0.5 - kip/kip
-
Recycle Contribution TP 0.5 1
83 84 85 86 87 Year

Figure 3-31 Blue Plains, Solids Processing Recycle Contribution of a) BOD, b) TSS, c) TP, to East Secondary Influent.
East Secondary Influent
60 0 Recycle Contribution 3 BOD
Recycle Contribution TSS mg/l
Recycle Contribution TP mg/l
83 84 85 86 87 Year

F i g u r e 3-32 Blue P l a i n s , S o l i d s P r o c e s s i n g and G r a v i t y Thickener Overflow C o n t r i b u t i o n of a ) BOD, b) TSS, c ) TP, t o West Secondary I n f l u e n t .
Recycle Contribution BOD mgf'
West Secondary lnf luent
*m
Recycle Contribution TSS 40' ma1
Recycle Contribution TP ma1
83 84 85 86 87 Year

Figure 3-33
East SPBR Flow Mgd
West GTOR Flow Mgd
West SPBR Flow Mgd
Blue Plains, Flows of Secondary Influent Recycle Streams a) Solids Processing to East Secondary b) Gravity Thickener Overflow to West Secondary, c) Solids Processing to West Secondary.
03 84 85 86 87 Year

mt p u . S i n c e March 1984 t h e w e s t s econdary i n f l u e n t h a s
r e c e i v e d 29% of t h e SPBR f low. I n March 1984, 71% of t h e SPBR was
r o u t e d t o t h e e a s t p l a n t t o a l l e v i a t e problems caused by t h e g r a v i t y
t h i c k e n e r overf low r e c y c l e (GTOR), which a t t h e t i m e was r e t u r n e d t o
t h e w e s t p r imary i n f l u e n t . I n June 1985, t h e GTOR was r o u t e d below
t h e w e s t p r i m a r i e s .
S i n c e January 1983, t h e SPBR and GTOR have c o n t r i b u t e d on average
13% of t h e BOD, 26% of t h e TSS, and 15.3% of t h e TP t o t h e w e s t
s econdary i n f l u e n t .
The s t e p impact of p r imary i r o n d o s i n g on w e s t s econdary i n f l u e n t
c h a r a c t e r i s t i c s i s no t obvious (See F i g u r e s 3-46 and 3 -48) .
3 .7 .2 Secondary I r o n Dosing
F i g u r e 3-34 shows t h e r a t i o of WPL i r o n d o s e t o t o t a l i r o n dose .
Th i s r a t i o h a s i n c r e a s e d wi th t i m e . WPL u s e was de te rmined by
a v a i l a b i l i t y . I n A p r i l 1986, d o s i n g of f e r r i c c h l o r i d e p r i o r t o
secondary c l a r i f i c a t i o n was d i s c o n t i n u e d .
3 . 7 . 3 S o l u b l e Phosphorus Removal
F i g u r e s 3-35 and 3-36 show SP and i r o n d o s e d a t a i n t h e
s e c o n d a r i e s . The few d a t a p o i n t s t h a t e x i s t p r i o r t o February 1984
i n d i c a t e t h a t secondary i n f l u e n t SP c o n c e n t r a t i o n s were h i g h e r when no
i r o n was added t o t h e p r i m a r i e s . Th i s i s c o n s i s t e n t wi th t h e
o b s e r v a t i o n s about pr imary SP removal.
I r o n d o s e i n t h e e a s t and w e s t s e c o n d a r i e s h a s t r e n d e d g r a d u a l l y
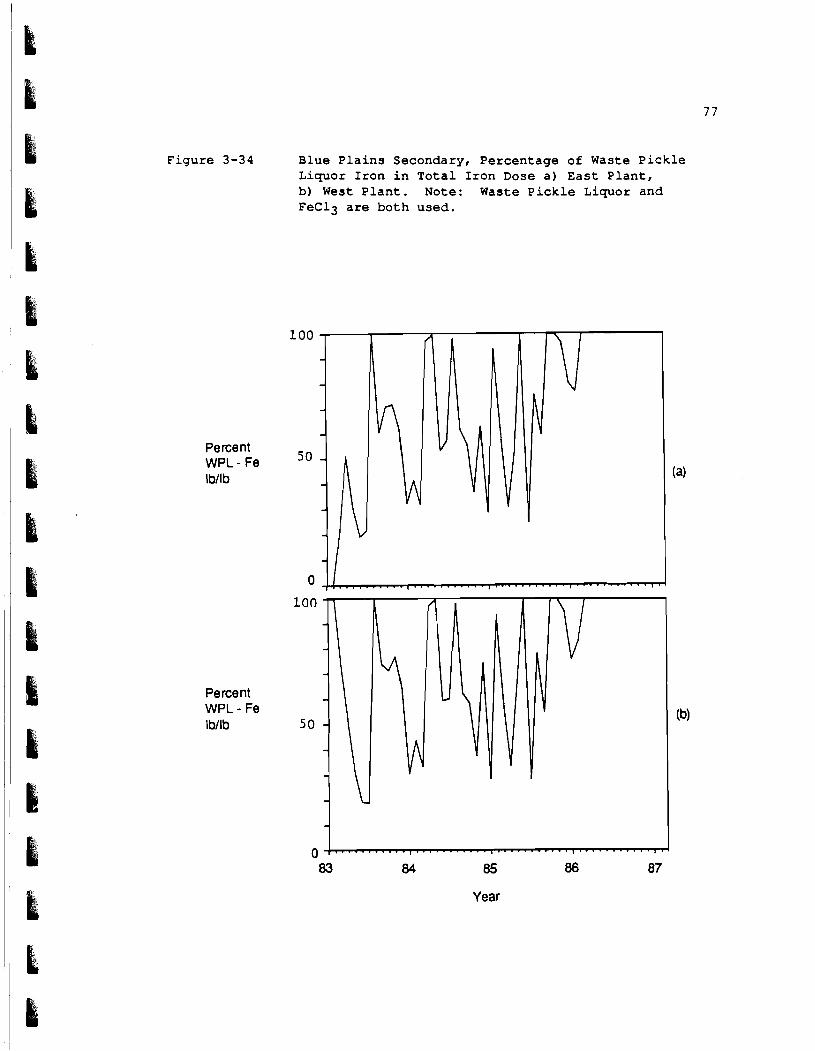
Figure 3-34 Blue Pla ins Secondary, Percentage of Waste P ickle Liquor Iron i n Total Iron Dose a ) East Plant, b ) West Plant . Note: Waste P i ck l e Liquor and FeC13 are both used.
100
Percent
Ibllb
Year

4 u-4 0) u-4 Cr W a a C
c a a a
4J al C > a 0 7 E -l 0) w n: c
nd ro
nd ro a
C - a > r . U 4 J U a C c a a m C 4 - I O & n d o al4J 4J r o n n
0) al 0 7 Z Z C
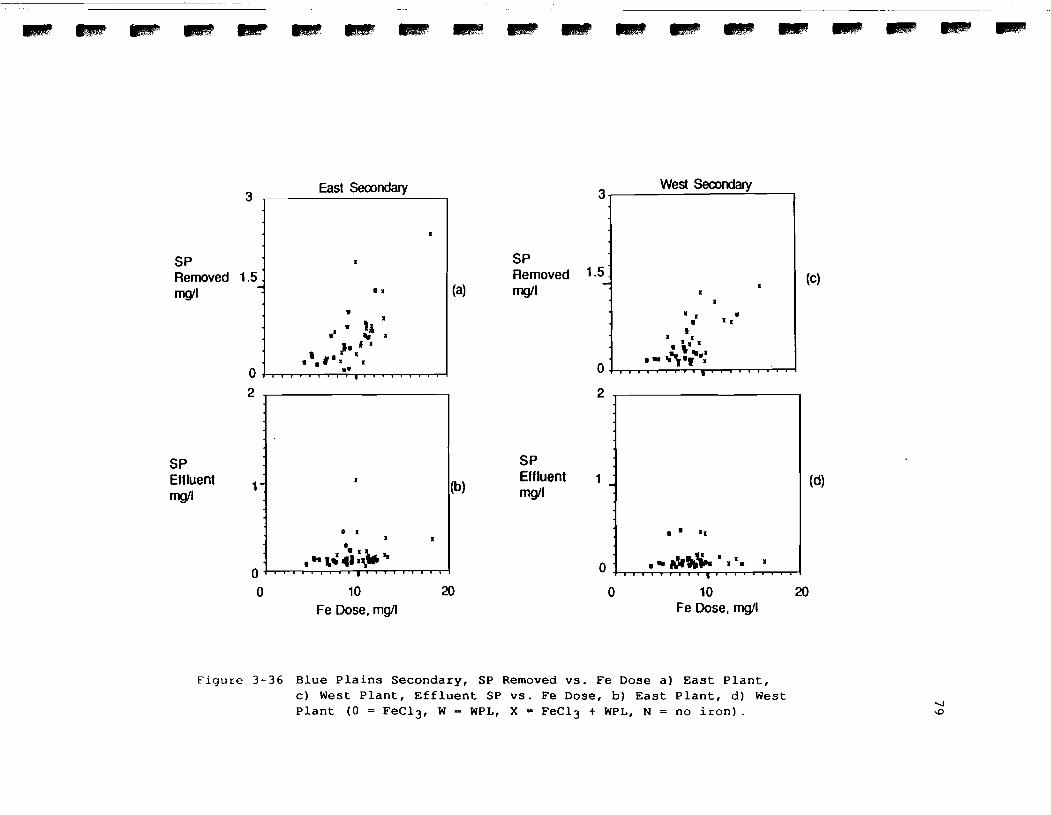
SP Effluent mg/l
East Secondary West Secondary 3 - 3 -
0 10 20 Fe Dose, mg/l
SP Effluent msll
SP Removed 1.5 -
(a) I (c)
Wl I I
SP Removed 1.5. - W l
0 10 20 Fe Dose, mg/l
I
I
. I
F i g u r e 3 - 3 6 B l u e p l a i n s S e c o n d a r y , S P R e m o v e d v s . F e D o s e a ) E a s t P l a n t , C ) West P l a n t , E f f l u e n t S P v s . F e D o s e , b) E a s t P l a n t , d) West P l a n t (0 = F e C 1 3 , W = WPL, X = F e C 1 3 + WPL, N = no i r o n ) .

downward wi th t ime . There is no a p p a r e n t s t e p l i k e ad jus tment i n
secondary i r o n dose cor responding t o t h e i n i t i a t i o n of pr imary i r o n
dos ing i n February 1984.
F i g u r e 3-36a,c show t h a t SP removal i s n o t l i n e a r l y r e l a t e d t o
i r o n dose , and F i g u r e 3-36b,d does no t r e v e a l any r e l a t i o n s h i p between
i r o n dose and e f f l u e n t SP. S ince i n f l u e n t SP c o n c e n t r a t i o n s have
v a r i e d from 0.16 t o 2.74 mg/ l i n t h e e a s t p l a n t and 0.17 t o 1 .76 mg/l
i n t h e west p l a n t , two s e p a r a t e p r e c i p i t a t i o n mechanisms have been
a c t i v e . A t h igh i n f l u e n t c o n c e n t r a t i o n s SP i s removed
s t o i c h i o m e t r i c a l l y , whi le a t low i n f l u e n t c o n c e n t r a t i o n s , t h e removal
i s n o n s t o i c h i o m e t r i c .
Evidence f o r t h e two mechanisms is s e e n i n F i g u r e 3-37a,c. The
e l e v a t e d Fe/Pc r a t i o s a r e much g r e a t e r t h a n t h e t h e o r e t i c a l
s t o i c h i o m e t r i c v a l u e of approximately 1 .5 . The d a t a a t SP e f f l u e n t s
g r e a t e r t h a n approximately 0.2 mg/l a r e h o r i z o n t a l l y d i s t r i b u t e d with
r e s p e c t t o t h e Fe/Pc r a t i o . An approximately c o n s t a n t Fe/Pc r a t i o
c h a r a c t e r i z e s s t o i c h i o m e t r i c phosphate removal.
F i g u r e s 3-37b,d show t h a t Fe/Pc v a l u e s p r i o r t o p r imary i r o n
a d d i t i o n a r e r e l a t i v e l y low. Since secondary i r o n dose a p p e a r s t o
have t r e n d e d g r a d u a l l y downward between 1984 and 1987, t h e e l e v a t e d
Fe/Pc r a t i o s s i n c e 1985 a r e t h e r e s u l t of f l u c t u a t i o n s i n secondary
i n f l u e n t SP. I n t h e e a s t p l a n t , a d e c r e a s e i n secondary e f f l u e n t SP
appears i n mid-1985. This d e c r e a s e cor responds t o t h e i n i t i a l i n c r e a s e
i n t h e Fe/Pc v a r i a b i l i t y .

JJ n m JJ w n
m W m c, E C
$ L- rc m
C 'u u Q ) M 0 W &
--I P1 n v) > 0
C m 0 > --I II
JJ 0 o m h z --I a v) JJ . m a l a a r c n,
O H 3
rc 0 U I m \ rc
U Q ) U U C h l r r C L a l \ h a " Q h I r r C O I I
m 'u . X h . . h J J J J m c c s
' P m m n , c r c r c 3 O L D , U II Q) JJ c, a m 0 3
Q) Q) 0 3 3 c; C
- - I e e 7 ( m v v u rc 0, P1 . . l r r
JJ JJ 0 1 c c a ~ m m ; 2 2 z F m
I C?
al il
3 0 .i L

F i g u r e s 3-38a,c v i s u a l l y i n d i c a t e t h a t SP removal i s de te rmined
l a r g e l y by t h e i n f l u e n t SP v a l u e . The s t r e n g t h of t h i s r e l a t i o n s h i p
s u g g e s t s t h a t v a r i a t i o n s i n i r o n dose do n o t a p p r e c i a b l y a l t e r SP
removal.
F i g u r e 3-38b,d shows t h a t e f f l u e n t SP i s r e l a t e d t o t h e i n i t i a l
c o n c e n t r a t i o n . I f t h e non-s to ich iomet r i c removal mechanism i s a c t i v e ,
t h i s obse rved t r e n d would be c o i n c i d e n t a l .
F i g u r e 3-39 shows t h e l o g a r i t h m of e f f l u e n t SP c o n c e n t r a t i o n s a s a
f u n c t i o n of pH. The u n d e r l y i n g r e l a t i o n s h i p i s n o t e v i d e n t , because
t h e range of pH i s t o o s m a l l . The t h e o r e t i c a l c u r v e was c a l c u l a t e d
wi th t h e s o l u b i l i t y r e l a t i o n s h i p s i n Tab le 2-1.
F i g u r e s 3-40a,c show t h e combined pr imary and secondary SP
e f f l u e n t d a t a v s . t h e combined i n f l u e n t d a t a . F i g u r e 3-40b,d shows
t h e combined p r imary and secondary Fe/Pc and SP e f f l u e n t d a t a . The
Fe/Pc v a l u e s above 2 0 have been o m i t t e d from t h e f i g u r e t o more
c l e a r l y r e v e a l t h e r e l a t i o n s h i p . These two p l o t s i n d i c a t e t h a t
d i f f e r e n t t y p e s of SP removal a r e o c c u r r i n g i n t h e two p a r t s of t h e
p l a n t .
3 .7 .4 pH and A l k a l i n i t y
The n e g a t i v e pH changes shown i n F i g u r e 3-42a,c i n d i c a t e t h a t some
f a c t o r has i n c r e a s e d t h e pH enough t o c o u n t e r b a l a n c e t h e d e c r e a s e t h a t
shou ld r e s u l t from m e t a l s a l t a d d i t i o n . V i s u a l e v i d e n c e f o r
s e a s o n a l l y t r e n d i n g pH change e x i s t s i n F i g u r e s 3-41b,d. The p o s i t i v e

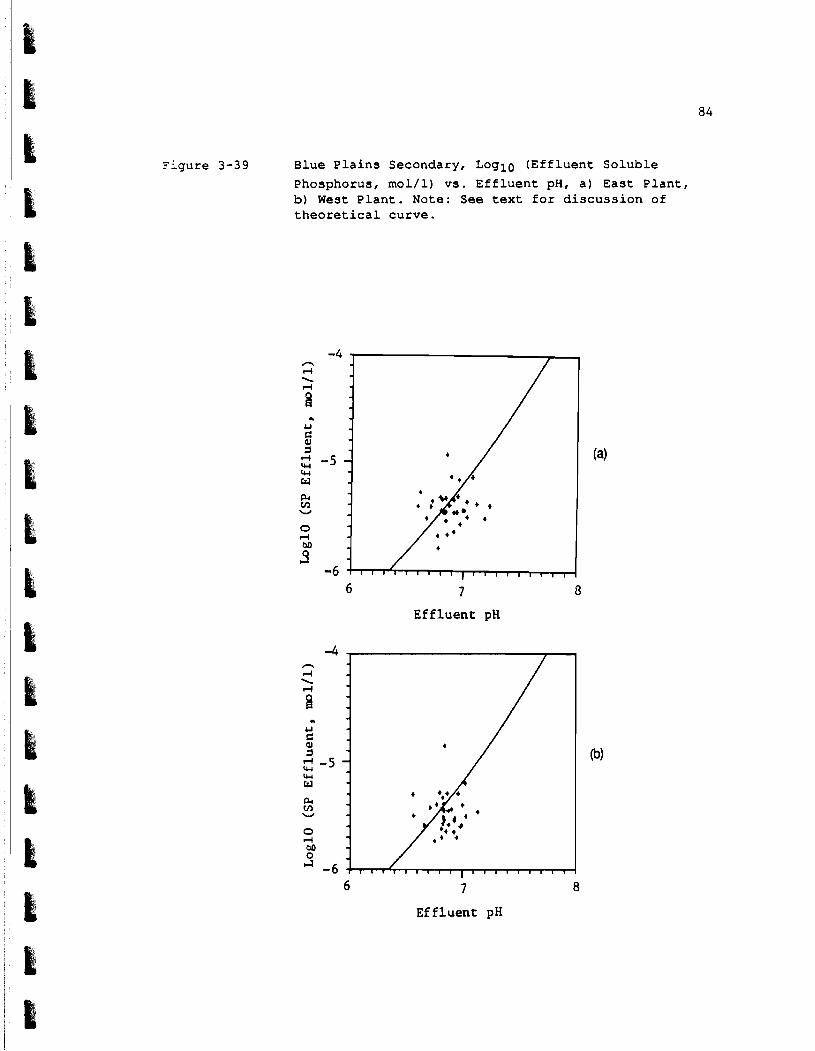
Figure 3-39 Blue Plains Secondary, Log10 (Effluent Soluble
Phosphorus, mol/l) vs. Effluent pH, a) East Plant, b) West Plant. Note: See text for discussion of theoretical curve.
6 7 8
Effluent pH
Effluent pH
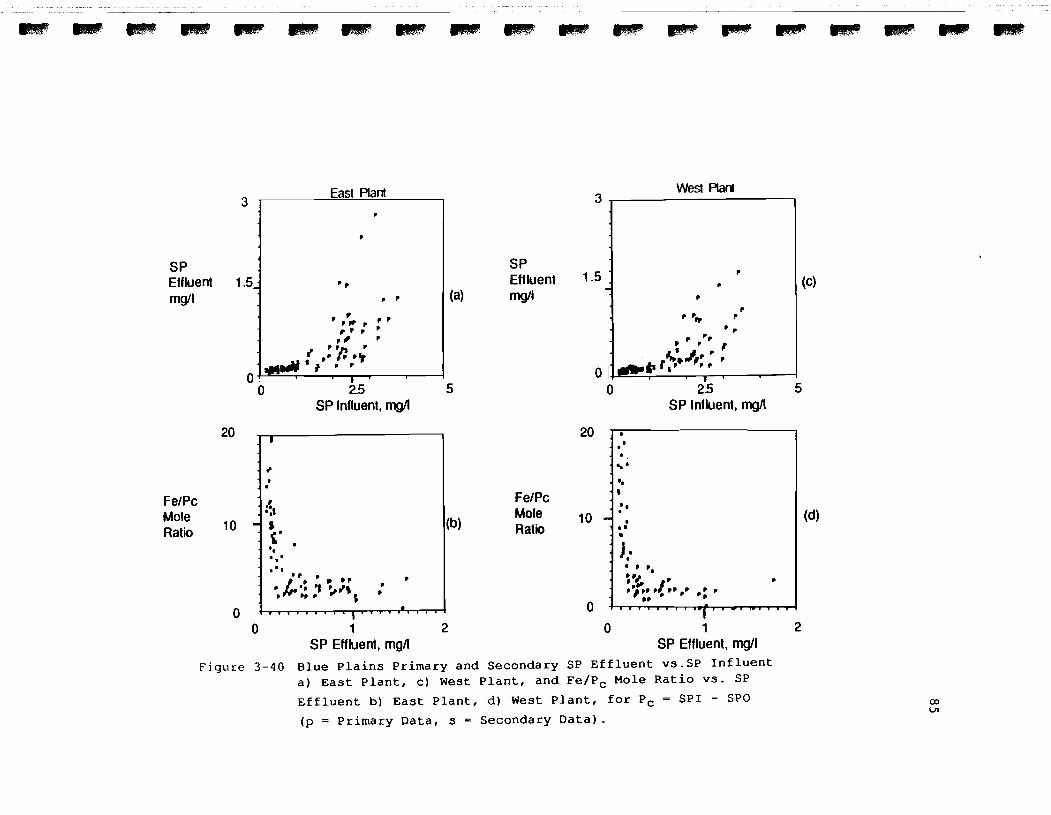
SP Effluent rngll
SP Influent, rngA
SP Effluent mgll
FeIPc Mole Ratio
FeIPc Mole : Ratio 10 y
: . -
1
West Phnl
SP Influent, mg/l
0 ' . m - T r . l r B 1 - - , v m ' - * . v
{I r
, '. *.' .'I
r . * * ;hx7>n t
0 1 2 0 1 2 SP Effluent, rngll SP Effluent, mg4
Figure 3 - 4 0 Blue P l a i n s Primary and Secondary SP E f f l u e n t v s . S P I n f l u e n t
a ) Eas t P l a n t , c ) West P l a n t , and F ~ / P ~ Mole ~ a t i o v s . SP
E f f l u e n t b) Eas t P l a n t , d ) West P l a n t , f o r PC = SPI - SPO
( p = Primary Data, s = Secondary D a t a ) .
(b)

-4 A A
m ~a rl D J . .
c) L, a l C C a m m 4 4 4 m D J [ L


pH changes t e n d t o occur i n w i n t e r months, i n d i c a t i n g r e l a t i v e l y less
i n f l u e n c e from v a r i a b l e s o t h e r t h a n i r o n dose . A e r a t i o n i n t e n s i t y i s
a f a c t o r t h a t may b e impor tan t i n c o n t r o l l i n g t h e pH. T h i s f a c t o r may
c o n t r o l t h e d e g r e e t o which a tmospher ic C02 i s e q u i l i b r a t e d wi th t h e
wastewater , however, t h i s t y p e of d a t a was n o t s t u d i e d .
Simple s i n g l e v a r i a b l e r e l a t i o n s h i p s t h a t e x p l a i n pH changes and
e f f l u e n t v a l u e s i n t e rms of i r o n d o s e a r e n o t a p p r o p r i a t e . Changes i n
pH and e f f l u e n t pH v a l u e s a r e r e l a t e d t o t h e i n i t i a l pH, t h e i n i t i a l
a l k a l i n i t y , and t h e i r o n d o s e . The i n i t i a l c o n d i t i o n s a r e de te rmined
by t h e o p e r a t i o n i n t h e p r i m a r i e s and t h e c o n d i t i o n of t h e r e c y c l e
s t r e a m s .
F i g u r e s 3-43a,b,c,d and 3-44a,b,c,d show t h e secondary a l k a l i n i t y
and i r o n dose d a t a . The e f f e c t of i r o n dose on changes i n a l k a l i n i t y
i s approximated w i t h t h e s i g n i f i c a n t (01 = 0.95) l i n e a r r e g r e s s i o n
e q u a t i o n s . The r e l a t i o n s h i p s f o r e f f l u e n t a l k a l i n i t y a r e less w e l l
d e f i n e d . Excess ive a l k a l i n i t y d e s t r u c t i o n can b e d e t r i m e n t a l t o o t h e r
chemical r equ i rements a t Blue P l a i n s , s i n c e l i m e must be added d u r i n g
n i t r i f i c a t i o n f o r pH c o n t r o l .
F i g u r e 3-45a,c shows t h a t pH changes a r e n o t s i g n i f i c a n t l y
c o r r e l a t e d wi th i n i t i a l a l k a l i n i t y . T h i s i s p o s s i b l e i f i r o n dose
c a u s e s t h e pH t o change, and i r o n dose i s h i g h l y v a r i a b l e .
F i g u r e 3-45b,d shows e f f l u e n t pH t o be p o s i t i v e l y c o r r e l a t e d with
i n f l u e n t a l k a l i n i t y .

East Secondary West Secondary 160
70 60 - 60 -
Alkalinity Removed
Alkalinity Removed -
- Fe Dose
0 . - - - - - - - - - - - -
83 84 05 86 87 83 84 05 86 87 Year Year
Figure 3-43 B lue P l a i n s Secondary, A l k a l i n i t y I n f l u e n t and E f f l u e n t v s . Year a ) Eas t P lant , c ) West P lant and A l k a l i n i t y Removed and Fe Dose v s . Year b) East P l a n t , d ) W e s t P l a n t .

Akalinity 3Q Removed msll
Alkalinity Efl luent msll
East Secondary
0 10 20 Fe Dose, mg/l
West Secondary
"7 .
Alkalinity 30 1 I . :;$II Removed w 5 (c) + a m m
Wl . m dMK- 11.5+249F0
(23) (0.21)
. Alkalinity 100 ,b.~
Effluent mgll .
0 10 20 Fe Dose, W l
F i g u r e 3 - 4 4 B l u e P l a i n s S e c o n d a r y , A l k a l i n i t y R e m o v e d v s . F e D o s e a ) E a s t p l a n t , c ) W e s t P l a n t , E f f l u e n t ~ l k a l i n i t y v s . F e D o s e , b) E a s t P l a n t , d ) W e s t P l a n t (0 = F e C 1 3 , W = WPL, X = F e C 1 3 + WPL,
N = n o i r o n ) .

PH Change @HI -pHO) 0
East Secondary West Secondary 0.4
pH Change
(a) @HI - pHO) 0
100 130 160 Influent Alkalinity, mg/l
. w
pH w
Effluent w . .
I 1 . w 1 1 1
w . I tI1 .[I
6.5
100 130 160 Influent Alkalinity, mg4
pH Effluent 7 ,
(b)
Figure 3 -45 B l u e p l a i n s Secondary, pH Change v s . I n f l u e n t A l k a l i n i t y a ) Eas t p l a n t , c ) West P l a n t , pH E f f l u e n t v s . I n f l u e n t A l k a l i n i t y c ) Eas t P l a n t , d ) West P l a n t (0 = FeC13, W = WPL, X = FeC13 + WPL, N = no i r o n ) .

3 . 7 . 5 BOD, TSS, and TP
F i g u r e s 3-46 th rough 3-51 show BOD, TSS, TP, and i r o n d o s i n g d a t a
f o r t h e s e c o n d a r i e s . There a r e no obvious r e l a t i o n s h i p s between i r o n
dose and t h e s e v a r i a b l e s .
3 . 7 . 6 B i o l o g i c a l Phosphorus Removal
F i g u r e 3-52 shows SP and TP removal v e r s u s BOD removal d a t a . Tp
and BOD removal a r e c o r r e l a t e d i n t h e e a s t p l a n t .
F i g u r e 3-53 shows e a s t p l a n t i r o n dose , BOD removal, and SP
removal d a t a v e r s u s t ime . Many of t h e e l e v a t e d SP removals co r respond
t o peaks i n i r o n d o s e and BOD removal, i n d i c a t i n g t h a t t h e e f f e c t s of
BOD removal and i r o n dose may b e confounded.
3 . 8 SECONDARY SLUDGE PRODUCTION
F i g u r e s 3-54a,b show chemical s l u d g e p r o d u c t i o n , r e p o r t e d s l u d g e
q u a n t i t i e s , and t h e i r o n dose . Chemical s l u d g e p r o d u c t i o n was
e s t i m a t e d w i t h Equa t ions 2-3 through 2-5.
The r a t i o of p r e d i c t e d chemical s l u d g e t o r e p o r t e d s l u d g e i s shown
i n F i g u r e 3-54c.
F i g u r e s 3-55 th rough 3-56 show secondary s l u d g e p r o d u c t i o n p l o t t e d
a g a i n s t t o t a l i r o n dose , BOD removed, TSS removed, and SP removed.
East P-. P r e d i c t e d chemical s l u d g e q u a n t i t i e s i n F i g u r e 3-54a
begin i n December 1983, t h e f i r s t month f o r which SP removal d a t a was
a v a i l a b l e . A t t h i s t i m e and f o r t h e nex t t h r e e months, t o t a l e a s t
p l a n t secondary s l u d g e appears t o have been m o s t l y chemica l . Between

c m m a
4J 0) c > 0) 0 1 E d 0) W LI: C a 0
a m 0 m a
C
5 ; " . u u u m c c m m m C d d O h h 0

0 I " " " ' V)
V) 0 r b

- - ((I P Ll Ll ((I ((I 0) 0) * *
((I a
L) 0) C 3 0) 0 3 E 4 0) '44 a C H V)
V) V) h V) h Q
C - ((I
2 0 ; ((I C C a m m C d c l O h h U 0) L) L) V) o l o l
@ 0) c 3 3 C -4 - - ((I U Q d . . m - -
L) JJ 0 ) C C 3 ((I a r t r l r l m m m

I _ 2
1 " I
I - .:
-11 1 - CI V) 5 f m b m m W **. -
l . l I . " " ' .


L a3 3 75
I-UJE
+ c,
u 0 m vl m r l m w u W al - LU - a m II
al a;x V) 0 0 0 n n 2
nl al a l z s LU LU
II


83 84 85 86 87
Year
F i g u r e 3-53 Blue Plains Secondary, Iron Dose, BOD Removal, and SP Removal.

Figure 3-54 Blue P l a i n s Secondary, Reported Sludge, Pred ic ted Chemical Sludge, and Iron Dose a ) East P lant , b) West Plant , c ) Estimated Fract ion o f Chemical Sludge.
Reported Sludge
Estimated Chemical Sludge / East Secondary g (a) kiplday
0 0.. , . . . . . . . . .~~-
180 Reported Sludge
. "W.
I Secondary 90 ' v ' v Estimated kiplday
Estimated Fract i o n Chemical Sludge kiplkip
East Secondary
0.
83 84 85 86 87 Year

Figure 3-55 Blue P la ins Secondary Sludge Production v s . F e Dose a ) East Plant , c ) West Plant; Secondary Sludge Production v s . BOD Removed b) East P lant , d ) West P l a n t .
0 30 50 200
Fe Dose, Wday BOD Removed, kiplday
I
180 . . .
r = -0.21 n-51 r0.99 = 0.32
(c) - (dl
180 ..
West Secondary . - Sludge kiptday
20 ;
East Secondary . l
Sludge a : l
m kiptday
l "" d' l m m m k
l l l
l maam l l
20 , , , , , , , , , , , , , , ,
0 30 50 200
Fe Dose, kip'day BOD Removed, kiiday
l
l l m
m
a I '. ;?am ! 8 B l
m a l
r = 0.42 n =51 r0.99 = 0.32

F i g u r e 3-56 Blue P l a i n s Secondary Sludge P r o d u c t i o n v s . TSS Removed a ) E a s t P l a n t , c ) West P l a n t ; Secondary Sludge Produc t ion v s . SP Removed b) E a s t P l a n t , d) West P l a n t . (0 - FeC13,W = WPL, X - FeC13 + WPL, N - No I r o n )
East Secondary Sludge kiplday
West Secondary Sludge kiplday
0 180 0 4 TSS Removed, kip/day SP Removed, kiplday
0 180 0 TSS Removed, kip/day
4
SP Removed, kiplday

May and June 1984 predicted chemical sludge began to make up a smaller
percentage (kip/kip) of the reported sludge. The data in ~igures 3-29
and 3-31 show that the solids processing building recycle (SPBR)
contributed large and variable quantities of BOD and solids after
April 1984.
East plant sludge production is related to recycle quality and the
primary effluent quality, which is a function of primary iron dose.
This makes it difficult to estimate changes in east secondary sludge
production caused by secondary phosphorus removal and iron dosing.
Figures 3-55a and 3-56b show no strong correlation between sludge
production and iron dose or SP removal.
WestPlant. Figure 3-54c shows that the estimated fractlon of
chemical sludge in the west plant is about half that of the east
plant.
Figures 3-55b,d and 3-56a,c show that BOD and TSS removal (mass
basis) in the west plant are greater than in the east plant. This is
because recycle streams contribute more TSS and BOD (Figures 3-30 and
3-32), and because west primary effluent TSS and BOD are greater than
the east plant (See Figures 3-20b,d and 3-22b,d).
Figures 3-55c shows a significant correlation between iron dose
and sludge production.
In Chapter Four, sludge production is modeled in terms of iron
dose, influent TSS, BOD removal, and SP removal.

CHAPTER FOUR: BLUE PLAINS REGRESSION ANALYSIS
4 . 1 REGRESSION ANALYSIS - SOME GENERAL INFORMATION
Mul t ip le regress ion was used t o i n v e s t i g a t e many t e n t a t i v e l i n e a r
models. Only a few of t h e models considered w i l l be p re sen t ed s ince ,
t o l a r g e e x t e n t , t h i s work d i d not l e a d t o i n s i g h t s not a l r e a d y noted
i n t h e previous chap te r . Also, many of t h e r eg re s s ion models t h a t had
s t a t i s t i c a l s i g n i f i c a n c e were considered t o have l i t t l e appea l a s
engineer ing p r e d i c t i v e models.
The r eg re s s ion examples given i n t h i s chapter i l l u s t r a t e an
approach based on computing a l l pos s ib l e models t h a t can be formed
from a set of independent va r i ab l e s t h a t a r e under cons ide ra t i on .
This approach was not used throughout t h e research f o r s e v e r a l
reasons. I n genera l , regress ion models taken under cons ide ra t i on
should be cons t ruc t ed r a t i o n a l l y from mechanis t ic knowledge of t h e
system. The " a l l pos s ib l e models" approach gene ra t e s many models
t h a t a r e known a p r i o r i t o ho ld l i t t l e p r a c t i c a l i n t e r e s t . Also, it
i s computat ional ly i n e f f i c i e n t i n comparison t o , say, s t e p r eg re s s ion .
But, it does c l e a r l y demonstrate s e v e r a l d i f f i c u l t i e s t h a t were
commonly encountered, c o l l i n e a r i t y i n p a r t i c u l a r , s o it was considered
worthwhile t o p re sen t t h e comprehensive examples. For t h e o t h e r
t rea tment p l a n t s , fewer s t a t i s t i c a l r e s u l t s w i l l be presen ted .
4 . 2 PRIMARY PHOSPHORUS REMOVAL
A l l pos s ib l e combinations of t h e independent v a r i a b l e s i n t h e

f o l l o w i n g model were f i t t e d t o p r imary i n f l u e n t and e f f l u e n t d a t a .
dSP = bo + bl Fe + b2 SPI + bq Q
where dSP = SPI - SPO, mg/l
Fe = I r o n Dose, mg/l
SPI = Primary I n f l u e n t So lub le Phosphorus, mg/l
SPO = Primary E f f l u e n t S o l u b l e Phosphorus, mg/l
Q = Flow, MGD
Table 4-1 and Tab le 4-2 summarize t h e models f i t t e d f o r t h e e a s t
and w e s t p l a n t s , r e s p e c t i v e l y . Seven a l t e r n a t e models can b e formed
by add ing and d e l e t i n g t e rms from t h e b a s i c model. Each is '
r e p r e s e n t e d i n t h e t a b l e s .
Each row g i v e s t h e pa ramete r e s t i m a t e s f o r t h e t e r m s t h a t a r e i n
t h e p a r t i c u l a r model. For example, Model 1 h a s two pa ramete r s and i s
s imply dSP = bo + b l Fe. Also g iven i n Tab le 4 . 1 a r e t h e number of
o b s e r v a t i o n s used t o f i t t h e model (n = 40 i n t h i s c a s e ) , t h e
c o e f f i c i e n t of d e t e r m i n a t i o n ( R ~ ) , and t h e s t a n d a r d d e v i a t i o n of t h e
model, S.
F i g u r e s 4 - 1 and 4-2 a r e p l o t s of r e s i d u a l sum o f s q u a r e s ( R S S )
a g a i n s t t h e number of t e rms i n t h e c o n s i d e r e d model t e r m s . Also
p r e s e n t e d f o r each model, i n t a b u l a r form, a r e t h e r e s i d u a l sum of
s q u a r e s (RSS), t h e mean s q u a r e e r r o r (MSE = ~ S S / d e g r e e s of f r eedom) ,

107
Table 4-1 Blue P l a i n s Eas t Pr imary Regress ion Output f o r Equat ion 4-1.

Figure 4 - 1 Blue P l a i n s East Primary RSS v s . Number o f Model Terms (exc luding bo) and Sequent ia l F va lues f o r Models i n
Table 4 - 1 . Data l a b e l s represent model number.
MODEL v f l ~ , ~ ~ l c 5 TE M ! f G S S MSE Sequential F Value

T a b l e 4-2 Blue P l a i n s West Pr imary R e g r e s s i o n Output f o r E q u a t i o n 4 - 1 .
M#LI dl? . b O + bl Fe + b2 %I + b3 9

Figure 4-2 Blue P l a i n s West Primary RSS v s . Number o f Model Terms (excluding bg) and Sequential F values f o r Models i n
Table 4 - 2 . Data l a b e l s represent model number.
RSS HSE Sequential F Value

and F s t a t i s t i c s .
The F s t a t i s t i c s a r e used t o test whether added t e rms make a
s t a t i s t i c a l l y s i g n i f i c a n t d i f f e r e n c e i n t h e model. Models w i t h two
pa ramete r s a r e compared w i t h one pa ramete r models; t h r e e pa ramete r
models a r e compared wi th two parameter models, and s o on. The
" s e q u e n t i a l " a s p e c t of t h i s comparison i n v o l v e s comparing Model 4 , a
two pa ramete r model, wi th t h e p reced ing t h r e e one pa ramete r models
(Models 1 , 2 , and 3 ) . A l a r g e F v a l u e i n d i c a t e s t h a t t h e a d d i t i o n a l
pa ramete r h a s s i g n i f i c a n t l y improved t h e model.
Appendix C e x p l a i n s t h e sequence o r d e r of compar ison. I t a l s o
e x p l a i n s t h e r e g r e s s i o n o u t p u t and t h e u s e of t h e s e q u e n t i a l F v a l u e s .
The s t a t i s t i c a l r e s u l t s w i l l be p r e s e n t e d w i t h a minimum of
comment and e x p l a n a t i o n .
4 .2 .1 E a s t P l a n t
Model 1, which h a s o n l y Fe dose a s a p r e d i c t o r v a r i a b l e has an R2
= 0 .60 . Adding e i t h e r SPI o r Q t o t h e model i n c r e a s e s R2 t o 0 .69.
Adding b o t h i n c r e a s e d R~ t o 0 -76 . P u t t i n g a l l t h r e e v a r i a b l e s i n t o
t h e model i s s t a t i s t i c a l l y j u s t i f i e d and t h e most e f f i c i e n t r e g r e s s i o n
model i n Tab le 4 - 1 i s Model 7 :
dSP = 1 .35 + 0 . 1 Fe + 0 .3 SPI - 0.007 Q
I t i n d i c a t e s t h a t i r o n dose , i n i t i a l SP, and f low a r e u s e f u l
p r e d i c t i v e v a r i a b l e s .

The s t r o n g e s t e f f e c t i n Model 7 i s i r o n d o s e . The v a l u e of t h e
e s t i m a t e d c o e f f i c i e n t , bl = 0.10, co r responds t o an Fe/Pc mole r a t i o
of 5 .0 [ I mg Fe/O. l mg SP) (30 .97 /55 .85) = 5 .01 . T h i s i s c o n s i d e r a b l y
h i g h e r t h a n t h e s t o i c h i o m e t r i c r a t i o f o r f e r r i c o r t h o p h o s p h a t e
p r e c i p i t a t i o n .
Adding SPI and Q t o t h e model does n o t change t h e e s t i m a t e d e f f e c t
o f i r o n dose; b l i s always i n t h e range 0 .13 - 0.10.
The n e g a t i v e c o e f f i c i e n t f o r Q s u g g e s t s t h a t SP removal i s lower
a t h i g h e r f lows . T h i s e f f e c t may be r e l a t e d t o h y d r a u l i c r e t e n t i o n
t i m e . SP removal may be low a t h i g h e r f lows because o f a d i l u t i o n
e f f e c t . A dependence o f s o l u b l e phosphorus removal on c l a r i f i e r
overf low r a t e s i s n o t e a s i l y conceived.
4 .2 .2 West P l a n t
Model 4 i s t h e most e f f i c i e n t i n Tab le 4-2. A s f o r t h e E a s t P l a n t
d a t a , i r o n a d d i t i o n i s s i g n i f i c a n t . Alone, however, it does n o t
e x p l a i n much of t h e v a r i a t i o n i n dSp, w i t h R~ b e i n g o n l y 0 . 3 . Adding
SPI improves t h e model s u b s t a n t i a l l y , i n c r e a s i n g R~ t o 0 .78 . Adding Q
t o t h e model is n o t h e l p f u l .
The c o e f f i c i e n t on i r o n dose i n Model 4 co r responds t o an Fe/Pc
r a t i o of 6 . 8 [ ( I mg Fe/ 0 .071 mg dSP) (30.97/55.85) = 6.81.
4 . 3 EFFECT OF IRON TYPE
S i n c e f e r r i c and f e r r o u s i r o n a r e n o t t h e o r e t i c a l l y e q u a l l y
effective in removing phosphorus, the type of iron used is taken into
account by a model designed to test for differences between soluble
phosphorus removal in months when only WPL was used, when only FeC13
was used, and when both WPL and FeC13 were used in combination. Dummy
variables, designated in the model by 2, were used to distinguish
between the three conditions. All possible regressions of the
following model were calculated using primary iron dosing data for
months where iron was dosed:
where dSP = SPI - SPO, mg/l Fe = Iron Dose, mg/l
21 = 1, 22 = 0 if FeC13 only is dosed
Z1 = 0, 22 = 1 if WPL only is dosed
21 = 0, 22 = 0 if Both FeC13 and WPL are dosed
The most efficient model contained only the bo and bl
coefficients. Other terms were not statistically significant,
indicating that it is not possible to separately assess the
effectiveness of the three forms in which iron was added. This
analysis is consistent with what is visually apparent in Figures 3-14a
and 3.14~.
4.4 PRIMARY SLUDGE PRODUCTION
To i d e n t i f y v a r i a b l e s a f f e c t i n g primary s ludge produc t ion , a l l
p o s s i b l e combinations of t h e fo l lowing model were f i t t o t h e pr imary
t r e a tmen t d a t a :
SLUK = bo t bl dTSSK t b2 TSSIK t b3 FeK + b4 dSPK + bg Q 4-3
where SLUK - Reported Primary Sludge Produc t ion
(January 1983 - December 1986) , k ip /day
dTSSK = TSS removed, kip/day
TSSIK = Primary I n f l u e n t TSS, kip/day
FeK = I r on Dose, k ip/day
dSPK = Solub le Phosphorus Removed, k ip /day
Q = Flow, MGD
There a r e 31 p o s s i b l e models. The e s t ima t ed paramete rs f o r t h e s e
a r e p r e sen t ed i n Table 4-3. A p l o t of model r e s i d u a l sum of squares
i s inc luded i n F igure 4-3, a long with t h e s e q u e n t i a l F va lue s .
Of t h e s i n g l e v a r i a b l e models, t h e one u s i n g i r o n d o s e (FeK)
e x p l a i n s t h e most v a r i a t i o n ( R ~ = 0.46) . The amount of suspended
s o l i d s removed (dTTSK) i s a l s o impor tan t . So lub l e phosphorus removal
and flow r a t e have l i t t l e exp lana tory power.
Because dSPK d a t a were miss ing f o r e leven months, t h e models i n
Table 4-3 t h a t con t a in dSPK were f i t t e d u s i n g e l even fewer
obse rva t i ons t han t h e o t h e r models. Therefore , model comparisons
cou ld no t be pu re ly o b j e c t i v e .

Table 4-3 Blue Plains Primary Regression Output for Equation 4-3.
MEEL: SLUK 8 bO + b l dTS8K + b 2 TSSIK + b3 F d + b 4 dSF'K + bS 0

Table 4-3, Cont inued.

Figure 4-3 Blue P l a i n s Pr imary RSS v s . Number of Model T e r m s ( e x c l u d i n g bo) and S e q u e n t i a l F v a l u e s f o r Models i n
Table 4-3. Data l a b e l s r e p r e s e n t model number.
N TERIl R I N8E Srqurntid F Valurs

Model 31, which has the highest R2, contains all of the possible
terms. The model lacks appeal on mechanistic grounds because the
coefficient of dSPK term is negative (removing more SP decreases the
amount of sludge produced). This is not a reasonable physical
relationship between sludge production and SP removal., The
coefficient of dSPK is highly variable from one model to another,
changing, for example, from -29.3 in Model 31 to an insignificant
value of 8.2 in Model 28, when FeK is dropped from the model. This
kind of instability can result from collinearity between predictor
variables, in this case FeK and dSP. A model that exhibits this
behavior must be interpreted with caution and should not be used as a
predictive model.
Model comparisons can be objectively compared with the F values
if the models with dSPK are eliminated. Model 27 contains all terms
except dSPK and has a low standard deviation and large R2, but the
negative coefficient of influent TSS (kip/day) does not make
mechanistic sense.
Models 20 and 25, both three-term models, have roughly the same
predictive power, i.e. similar R2 and S. Both models have iron dose
(FeK) and flow (Q) terms with approximately the same estimated
coefficients. Model 20 contains the TSSIK term and Model 25 has the
dTSSK term. There is a degree of interchangeability between the dTSSK
and TSSIK terms, removal being a to large extent determined by the
influent solids loading.
The estimated effects of iron dose (coefficient bg) in Models 20

and 25 indicate that over the range of observed iron doses, primary
sludge production increases about 5 to 5.5 kips for every kip of iron
dosed. The average iron dose for the period modeled was 15.6 kip/day,
including the first thirteen months of record when no iron was used.
Assuming that the increase in primary sludge mass was due entirely to
formation of chemical precipitate (i.e. assuming no enhanced suspended
solids removal due to iron addition), there was an average of 28.9
percent of the total reported sludge [5(15.6) = 78 kip/day chemical
sludge, or 100(78/270.2) = 28.9%]. This compares poorly with the
theoretical sludge calculation in Chapter Three, which predicted an
average of 16.7 % chemical sludge (percent of total sludge by weight)
for the months when iron was dosed. The discrepancy probably
indicates that the estimated value of b3 reflects some degree of
enhanced TSS removal, a reasonable expectation on mechanistic grounds.
4.5 SECONDARY PHOSPHORUS REMOVAL
Regression analysis verified that essentially complete removal of
SP was achieved regardless of iron dose. This is consistent with
theor:.,. Iron is used in excess, as shown in Chapter 3, and
pr pitati ti on is constrained by the solubility limit and the final pH.
The effect of BOD removal was significant and positive; this is
consistent with the expectation that some phosphorus is removed by
biological uptake. The derived regression model, however, did not
reliably prodict biological uptake. A predictive model of this
mechanism would have to simultaneously account for chemical removal

and b i o l o g i c a l u p t a k e . The c o r r e l a t i o n between independen t v a r i a b l e s
makes it i m p o s s i b l e t o s e p a r a t e t h e two mechanisms u s i n g m u l t i p l e
r e g r e s s i o n methods.
4.6 SECONDARY SLUDGE
A l l p o s s i b l e combina t ions o f t h e f o l l o w i n g model w e r e f i t t e d t o
d a t a from t h e secondary p l a n t d a t a from December 1983 t o March 1987:
SLUK = bo + bl TSSIK + b2 dBODK + b3 FeK + b4 dSPK
where SLUK = Sludge p r o d u c t i o n , k i p / d a y
TSSIK = I n f l u e n t TSS, k i p / d a y
dBODK = BOD Removed, k i p / d a y
FeK = I r o n Dose, k ip /day
dSPK = S o l u b l e Phosphorus Removed, k i p / d a y
R e g r e s s i o n s f o r t h e two p l a n t s a r e summarized i n T a b l e s 4-4 and 4-5.
4 . 6 . 1 E a s t P l a n t
None o f t h e r e g r e s s i o n s p r e s e n t e d i n Tab le 4-4 e x p l a i n E a s t P l a n t
secondary s l u d g e p r o d u c t i o n b e t t e r t h a n t h e a v e r a g e v a l u e of 69.6
k i p / d a y (S.D. = 20.9, n = 4 0 ) . Changes i n s l u d g e p r o d u c t i o n ,
r e s u l t i n g from changes i n i r o n dose o r SP removal, can n o t b e
e s t i m a t e d w i t h t h e s e models. The e f f e c t s a r e masked by t h e h i g h l y
v a r i a b l e s l u d g e v a l u e s .

Table 4-4 Blue P l a i n s E a s t Secondary R e g r e s s i o n Outpu t f o r Equa t ion 4 - 4 .
NODELI SLUK . bO + b l TS8IK + b2 dBODK + b3 FeU + b4 dSPK
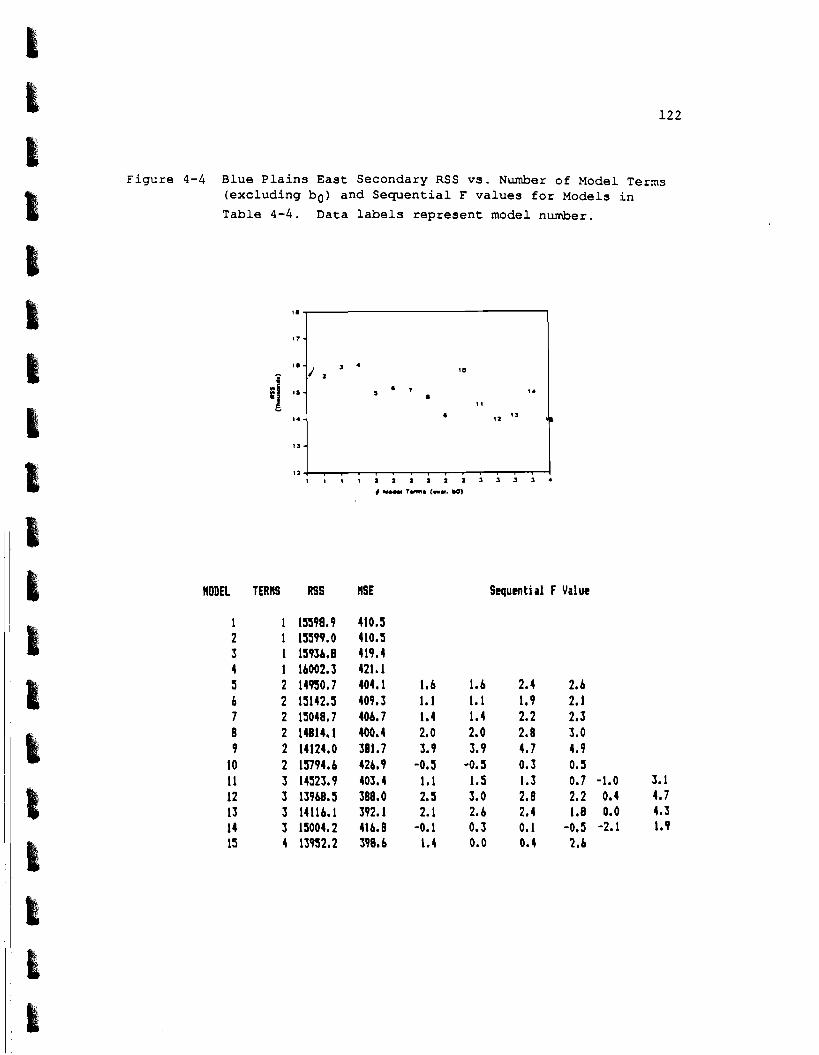
Figure 4-4 Blue Plains East Secondary RSS vs. Number of Model Terms (excluding bo) and Sequential F values for Models in
Table 4-4. Data labels represent model number.
MODEL TERMS RSS Sequent ia l F Value

T a b l e 4-5 B lue P l a i n s West Seconda ry R e g r e s s i o n Ou tpu t for Equation 4 - 4 .

Figure 4 - 5 Blue P l a i n s West Secondary RSS v s . Number of Mcq\el Terms (exc luding b o ) and Sequent ia l F va lues f o r Mode:s i n Table 4-5. Data l a b e l s represent model number.
HODEL TERMS RSS Sequential F Value

4.6 .2 West P l a n t
The most e f f i c i e n t model i n Table 4-5 i s Model 3, a s imple l i n e a r
f u n c t i o n of i r o n dose . The model is weak and i s t h e r e s u l t of t h e
weak c o r r e l a t i o n between s l u d g e p roduc t ion and i r o n dose (see F igure
3 -55c) . The model is not u s e f u l f o r e s t i m a t i n g changes i n s l u d g e
p roduc t ion t h a t have r e s u l t e d from changes i n i r o n dose .
4 . 7 SUMMARY
The fo l lowing c o n c l u s i o n s can be drawn from t h e a n a l y s e s p r e s e n t e d
i n Chap te r s Three and Four:
1) The average Fe/Pc r a t i o does n o t a c c u r a t e l y c h a r a c t e r i z e
pr imary SP removal ( e a s t and w e s t p l a n t s ) because t h e r e seems t o be
p e r i o d s of t ime when SP removal was s t o i c h i o m e t r i c and o t h e r p e r i o d s
when it was non-s to ich iomet r ic .
2 ) Monthly average Fe/Pc r a t i o s show a downward t r e n d between t h e
i n i t i a t i o n of pr imary i r o n d o s i n g and t h e phosphate d e t e r g e n t ban
approximately two y e a r s l a t e r . Therefore , any observed r e d u c t i o n s i n
chemical dose shou ld not be a t t r i b u t e d e n t i r e l y t o t h e phosphate
d e t e r g e n t ban. They r e s u l t e d , a t l e a s t i n p a r t , from improved
p r e c i p i t a t i o n e f f i c i e n c y and p a r t l y t h e ban lower ing phosphorus
l o a d i n g .
3 ) M u l t i p l e l i n e a r r e g r e s s i o n models i n d i c a t e t h a t changes i n
pr imary s ludge p roduc t ion were not r e l a t e d t o changes i n p r imary
i n f l u e n t SP.


4) Iron dose, influent TSS (or TSS removed) and flow should be
used to estimate primary sludge production. The best models indicate
that chemical dosing is responsible, on average, for about 30% of the
sludge production (mass basis). This 30% includes chemical solids
production and enhanced solids removal. Plots and regression analyses
indicate that dosing iron to the primary settling basins enhanced BOD
and TSS removal, but the incremental removal due to this could not be
reliably quantified. Stoichiometric calculations indicate that dosing
iron to the primary settling basins produced primary sludge mass
quantities that contained, on average, 17% chemical precipitate.
5) At Blue Plains the data suggest that iron dosing has caused
significant changes in primary sludge production. Also, the
efficiency of primary soluble phosphorus precipitation has increased
since primary iron dosing was initiated in 1984. Therefore,
reductions in primary sludge production between 1985 and 1986 are due,
in part, to more efficient iron use as well as the decrease in iron
requirement associated with the decreased phosphorus loading.
6) Secondary soluble phosphorus precipitation has been
accomplished most of the time with a non-stoichiometric iron dose.
Any reduction in secondary influent SP will not result in a
proportional reduction in iron dose. SP removal is constrained by the
final pH. Regression models were not helpful in characterizing
secondary soluble phosphorus removal.
7) On average, the estimated (stoichiometric) chemical sludge was
27 percent of the reported secondary sludge. Large variations in the
secondary s l u d g e p r o d u c t i o n obscure t h e e f f e c t s o f i r o n d o s i n g and SP
removal. Regress ion was n o t h e l p f u l i n r e l a t i n g t h e v a r i a b l e s t o
s l u d g e p r o d u c t i o n . Some v a r i a t i o n r e s u l t s from f l u c t u a t i o n s i n pr imary
e f f l u e n t q u a l i t y , which may b e r e l a t e d t o t h e p a t t e r n of i r o n d o s i n g
i n t h e p r imary b a s i n s , and t o t h e magnitude and compos i t ion of s ludge
t r e a t m e n t r e t u r n f l o w s .

CHAPTER FIVE: PISCATAWAY WWTP
5 . 1 BACKGROUND
The Piscataway wastewater t r e a t m e n t p l a n t i n Accokeek, Maryland,
t r e a t s an average f low of 17 MGD, and d i s c h a r g e s i n t o t h e lower r e a c h
of Chesapeake Bay. The p l a n t s e r v i c e s a n e s t i m a t e d 135,250 p e r s o n s .
I n Maryland, a ban on phosphate b a s e d d e t e r g e n t s became law on
December 1, 1985.
5 .2 PROCESS DESCRIPTION
The p l a n t c o n s i s t s of g r i t removal, pr imary c l a r i f i c a t i o n , s t e p
a e r a t i o n a c t i v a t e d s ludge , secondary c l a r i f i c a t i o n , n i t r i f i c a t i o n ,
f i n a l c l a r i f i c a t i o n , mixed media f i l t r a t i o n , c h l o r i n a t i o n , and p o s t
a e r a t i o n . F i g u r e 5-1 shows t h e p r o c e s s t r a i n a t P i sca taway .
Raw s l u d g e and waste a c t i v a t e d s l u d g e a r e g r a v i t y t h i c k e n e d .
Thickened s l u d g e is a n a e r o b i c a l l y d i g e s t e d , s t a b i l i z e d wi th l i m e , o r
p l a c e d i n h o l d i n g b e f o r e vacuum f i l t e r dewate r ing . F e r r i c c h l o r i d e
and polymer a r e used a s dewate r ing c o n d i t i o n e r s . U l t i m a t e d i s p o s a l
c o n s i s t s of l a n d a p p l i c a t i o n , o r composting i n t h e c a s e of
n o n - s t a b i l i z e d s l u d g e s .
S o l i d s p r o c e s s i n g r e c y c l e , f i l t e r backwash, a n d g r a v i t y t h i c k e n e r
over f low a r e r e t u r n e d t o t h e i n f l u e n t pump s t a t i o n . F i l t e r backwash
i s a l s o r e t u r n e d d i r e c t l y t o t h e n i t r i f i c a t i o n r e a c t o r s .
Before March 1987, chemical phosphorus removal was accomplished by


s p l i t d o s i n g wi th l i q u i d alum t o t h e secondary a e r a t i o n b a s i n s and t h e
e f f l u e n t from t h e n i t r i f i c a t i o n r e a c t o r s . Polymer i s added b e f o r e
f i n a l s e t t l i n g f o r improved f l o c fo rmat ion . Lime i s added t o
n i t r i f i c a t i o n f o r pH c o n t r o l , however, t h e q u a n t i t y i s n o t metered.
N i t r i f i c a t i o n e f f l u e n t pH i s metered. Alum d o s i n g t o t h e secondary
a e r a t i o n b a s i n s was d i s c o n t i n u e d i n March 1987, a s p a r t of a s t u d y t o
q u a n t i f y b i o l o g i c a l phosphorus removal.
5 . 3 OPERATIONS DATA
Most d a t a used i n f o l l o w i n g a n a l y s e s were o b t a i n e d from c o p i e s of
monthly summary s h e e t s . Secondary e f f l u e n t and n i t r i f i c a t i o n e f f l u e n t
s o l u b l e o r thophospha te d a t a f o r J u l y 1984 th rough June 1985 were
o b t a i n e d from a r e p o r t by McNamee, P o r t e r , and S e e l e y ( 5 0 ) . Lime u s e
d a t a was p rov ided by p l a n t o p e r a t o r s d u r i n g a p l a n t v i s i t i n March
1987.
S o l u b l e phosphorus i s measured a s o r thophospha te a t Piscataway,
and is deno ted by OSP i n t h i s c h a p t e r . Also, p a r t i c u l a t e phosphorus
i s e s t i m a t e d wi th TP - OSP, and it is d e n o t e d w i t h - OSP.
The impact of t h e phosphate d e t e r g e n t ban w i l l be a s s e s s e d i n
t e rms of o r thophospha te load ing , n o t TP load ing , s i n c e d e t e r g e n t
phospha tes a r e u s u a l l y s o l u b l e o r thophospha tes .
5 . 4 RAW INFLUENT CONDITIONS
F i g u r e 5-2 shows t h e i n f l u e n t wastewater f low f o r J a n u a r y 1980

I l l I , , , , l l l l l l l ; ;

through A p r i l 1987. Low flow f o r t h e d a t a r e c o r d o c c u r r e d i n J u l y
1985, and t h e flow remained low u n t i l mid-1986. T h i s low f low p e r i o d
roughly c o i n c i d e s wi th t h e f i r s t months of t h e phosphate d e t e r g e n t
l e g i s l a t i o n .
F i g u r e s 5-3 th rough 5-7 show t h e i n f l u e n t raw wastewater
c o n d i t i o n s . F igure 5-3d and 5-4d i n d i c a t e t h a t t h e wastewater
s t r e n g t h d e c r e a s e s wi th i n c r e a s i n g f low. Evidence f o r a s to rm water
d i l u t i o n e f f e c t i s p r e s e n t e d i n F igure 5-8a, which shows t h a t f low i s
p o s i t i v e l y c o r r e l a t e d wi th r a i n f a l l .
The d i l u t i o n e f f e c t i s n o t e v i d e n t i n F igure 5-6d, which shows
i n f l u e n t SP v e r s u s f low d a t a . The t i m e t r e n d i n t h e phosphorus d a t a
does n o t r e v e a l t h e d i l u t i o n e f f e c t .
F i g u r e s 5-3b through 5-5b show t h a t t h e mass l o a d i n g of BOD5
( B O D ) , t o t a l suspended s o l i d s (TSS) and t o t a l phosphorus ( T P )
d e c r e a s e d d u r i n g 1985. Although t h e d a t a is incomplete ,
o r thophospha te (OSP) mass l o a d i n g appears t o have d e c r e a s e d s i n c e 1985
(See F i g u r e 5 -6b) . The d e c r e a s e i n or thophosphate shou ld be r e l a t e d
t o t h e ban, whi le t h e d e c r e a s e i n non-orthophosphate l o a d i n g (F igure
5-7b) shou ld be r e l a t e d t o t h e d e c r e a s e i n suspended s o l i d s l o a d i n g
d u r i n g 1985. F igure 5-8c show8 an i n s i g n i f i c a n t c o r r e l a t i o n between
non-orthophosphate and suspended s o l i d s l o a d i n g . I f i n f l u e n t s o l u b l e
phosphorus (no t measured) is p r i m a r i l y i n t h e form o f or thophosphate ,
t h e n Non-OSP shou ld p rov ide an e s t i m a t e o f p a r t i c u l a t e phosphorus.
However, i f t h e i n f l u e n t s o l u b l e phosphorus c o n t a i n s a l a r g e f r a c t i o n

Figure 5 -3 Piscataway, Raw Inf luent BOD5 a ) Concentration vs.
Year, b) Mass Loading v s . Year, c ) Concentration v s . Mass Loading, d ) Concentration v s . Flow.
BOD msll
BOD kiplday
8 80 81 82 83 84 85 86 87
Year
8 BOD kiplday 24 10 Flow, Mgd 25
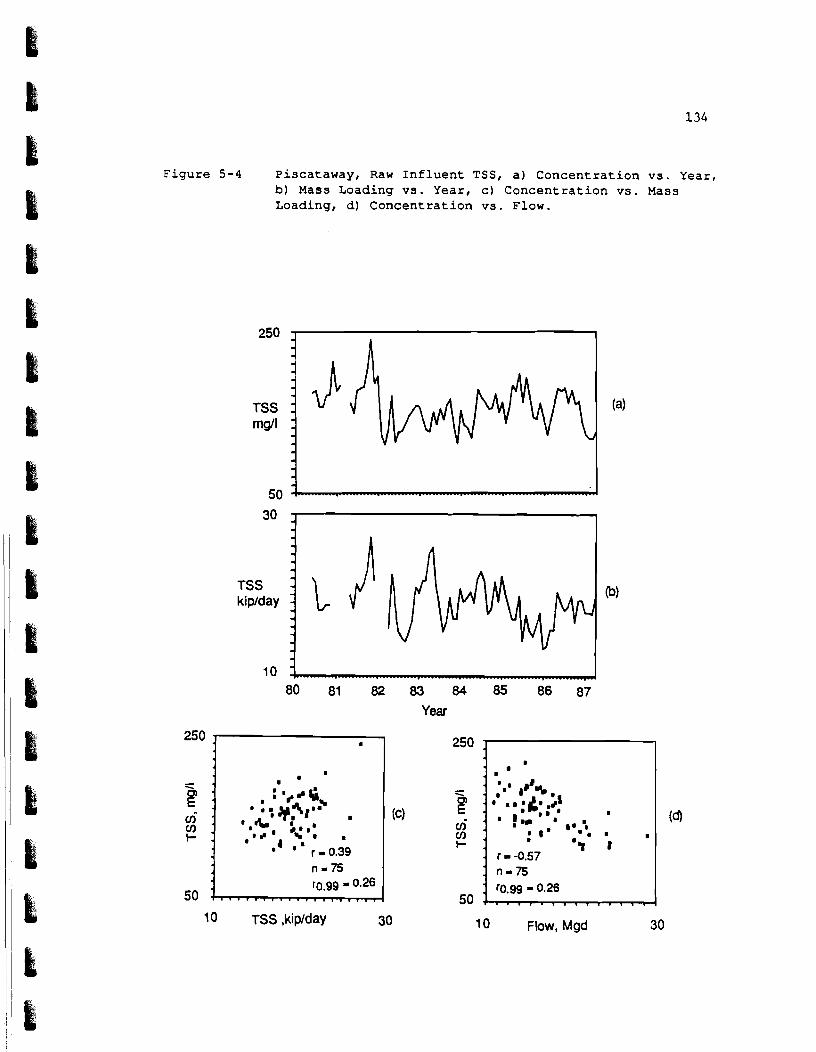
F i g u r e 5-4 Piscataway, Raw I n f l u e n t TSS, a ) C o n c e n t r a t i o n v s . Year, b) Mass Loading vs . Year, c ) C o n c e n t r a t i o n v s . Mass Loading, d ) C o n c e n t r a t i o n v s . Flow.
250
TSS mq/l
50
30
TSS kiplday
10 80 81 82 83 84 85 86 87
Year
250 -
- 2 ui cn
250 : I
'
(c) oi : (a
t-
50
cn I' I- : .
. r - -0.57 ' 3 1
. n-75 : Q.99 - 0.26
50 , . , , . . . . . , , . , , . , 10 TSS ,kip/day 30 10 Flow, Mgd 30

F i g u r e 5-5 Pisca taway, Raw I n f l u e n t TP, a ) C o n c e n t r a t i o n v s . Year, b) Mass Loading v s . Year, c ) C o n c e n t r a t i o n v s . Mass Loading, d ) C o n c e n t r a t i o n v s . Flow.
0.2 80 81 82 83 84 85 86 87
Year
10 10 -
2 g (c) ti ti I- - I-
2 2 7 . . . . . . . . . . , , . . Om2 TP, kipfday 1.2 10 Flow, Mgd 25
I r - -0.37 n-75 . '0.99 - 0.26
I . -: l a . . , "d'...
a m I a. I .Irn'.~ .
I ..a,.
(4
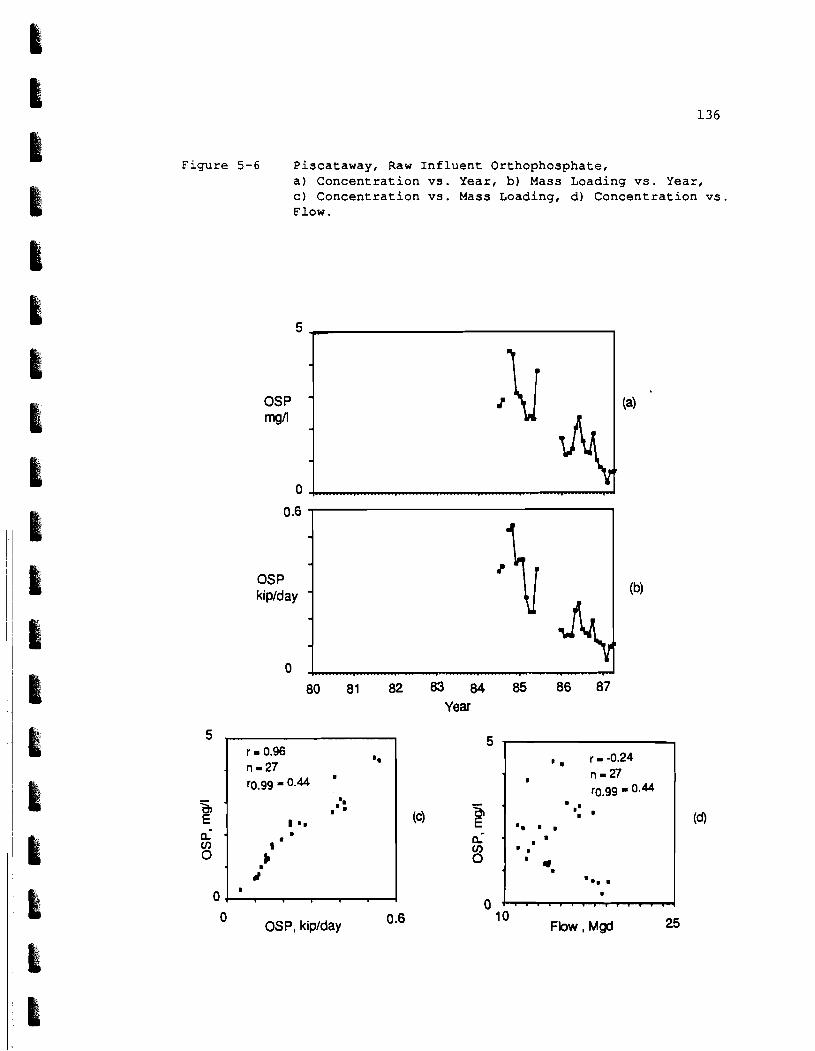
Figure 5-6 Piscataway, Raw I n f l u e n t Orthophosphate , a ) C o n c e n t r a t i o n v s . Year, b) Mass Loading v s . Year, C ) C o n c e n t r a t i o n v s . Mass Loading, d ) C o n c e n t r a t i o n v s . Flow.
OSP rflgll
OSP kiplday
80 81 82 83 84 85 86 87 Year
O OSP, kiplday 0.6 0 d . . . . . . . * . . - . . . j
10 Fbw , Mgd 25

Figure 5-7 Piscataway, Raw Influent Non-Orthophosphate (Non-OSP TP-OSP), a) Concentration vs. Year, b) Mass Loading vs. Year, c) Concentration vs. Mass qoading, d) Concentration vs. Flow.
0
80 81 82 83 84 85 86 87 Year
0
10 Fbw , Mgd 25

Figure 5-8 Piscataway, a) Influent Flow vs. Rainfall, b) Influent Dissolved Oxygen v s . Flow, c) Non-Orthophosphate (TP-OSP) vs. TSS.
0 Rainfall, inches 0.3
l ' I ' I ' , I ' I
I.,. d D I r
3 tm.$s . .:' r = 0.71 n = 71
10 Fbw, Mgd 25
10 TSS ,kipIday 30

of condensed o r o r g a n i c phosphorus t h e n t h e e s t i m a t e of p a r t i c u l a t e P
w i l l be i n e r r o r . The c o r r e l a t i o n i n F i g u r e 5-8c i s i n f l u e n c e d by t h e
lowes t i n f l u e n t non-orthophosphate v a l u e . There i s no r e a s o n t o
b e l i e v e t h a t t h e p o i n t i s a n o u t l i e r . The r e l a t i o n s h i p p r o b a b l y
s u f f e r s from a l a c k of non-orthophosphate (TP-OSP) d a t a c o r r e s p o n d i n g
t o t h e low s o l i d s l o a d i n g d a t a p o i n t s i n l a t e 1985.
5 . 5 RECYCLE FLOWS ,
F i g u r e 5-9 shows raw i n f l u e n t and g r i t chamber e f f l u e n t
c o n c e n t r a t i o n s of BOD, TSS, and TP. G r a v i t y t h i c k e n e r over f low,
s o l i d s p r o c e s s i n g r e c y c l e , and f i l t e r backwash a r e r e c y c l e d t o t h e
i n f l u e n t pump s t a t i o n , and a r e n o t i n c l u d e d i n t h e raw wastewater
samples . They a r e r e f l e c t e d i n t h e g r i t chamber e f f l u e n t d a t a . These
r e c y c l e l o a d s a r e p e r i o d i c and h i g h l y v a r i a b l e .
Lime i s used f o r s l u d g e s t a b i l i z a t i o n and pH c o n t r o l i n
n i t r i f i c a t i o n , s o t h e r e t u r n f low might a f f e c t pH and a l k a l i n i t y .
Lime u s e d a t a r e f l e c t s t h e t o t a l amount r e c e i v e d a t t h e p l a n t d u r i n g a
month ( 2 8 ) . The amount of t h i s q u a n t i t y used f o r s l u d g e c o n d i t i o n i n g
and pH c o n t r o l ( n i t r i f i c a t i o n ) a r e n o t known. The amount o f e x c e s s
l i m e and f e r r i c i r o n (from dewate r ing) i n t h e r e t u r n f lows a r e a l s o
unknown.
F i g u r e 5-10a shows t h e r e p o r t e d l i m e u s e a t t h e p l a n t s i n c e
October 1982. P r i o r t o J u l y 1981, 30% (volume b a s i s ) of t h e s l u d g e
r e q u i r i n g s t a b i l i z a t i o n was p rocessed i n t h e d i g e s t e r s . The remaining

Figure 5-9 Piscataway, Comparison of Raw Influent and Grit Chamber Effluent a) BOD, b) TSS, c) TP.
Grit Chamber Effluent
Grit Chamber Effluent
TSS 2000
- -
20 - Raw Influent
- T
80 81 82 83 84 85 86 87 Year

F i g u r e 5-10 Pisca taway, a ) Repor ted P l a n t Lime U s e , b) G r i t Chamber E f f l u e n t A l k a l i n i t y v s . T o t a l Lime U s e , c ) Secondary E f f l u e n t p H v s . T o t a l Lime Use.
Total Lime
Year
I r - 0.54 I
n - 8 I
Grit r0.99 = 0.79 Chamber Effluent 240
Alkalintiy mq/l CaC03
1 4 0 j , , , , , , , , , , , , , , , . , I 300 400 500
Lime Use , Dry Tons
r - 0.37
'0.99 - 0.34 Secondary
.I. ##
I m . II . j I...
1 1 1
T o t a l Lime U s e , Dry T o n s

was s t a b i l i z e d wi th l i m e . A f t e r J u l y 1981 and u n t i l d i g e s t e r
o p e r a t i o n was d i s c o n t i n u e d i n J u l y 1984, t h e q u a n t i t y of s l u d g e t o t h e
d i g e s t e r s was 11% (volume b a s i s ) . Lime u s e i n c r e a s e d a s d i g e s t e r s
were removed from s e r v i c e .
F i g u r e 5-lob shows t h e r e l a t i o n s h i p between l i m e u s e and g r i t
chamber e f f l u e n t a l k a l i n i t y . The r e p o r t e d c o r r e l a t i o n i s n o t
s i g n i f i c a n t a t t h e 99% o r 95% ( r O - 9 5 = 0.62) c o n f i d e n c e l e v e l s .
Wastewater pH is o n l y measured i n t h e raw i n f l u e n t and secondary,
n i t r i f i c a t i o n , and f i n a l e f f l u e n t s . The impact of l i m e u s e on
wastewater pH i s shown i n F i g u r e 5-10c, which shows a s i g n i f i c a n t
c o r r e l a t i o n between secondary e f f l u e n t pH and t o t a l l i m e u s e .
F i g u r e 5 - l l a shows t h e r e l a t i o n s h i p between a l k a l i n i t y
measurements i n t h e raw i n f l u e n t , g r i t chamber e f f l u e n t , and pr imary
e f f l u e n t . Measurements a t t h e s e t h r e e l o c a t i o n s a r e u s u a l l y t a k e n
once a month. The average raw i n f l u e n t f o r t h e t i m e p e r i o d on t h e
F i g u r e i s 143 mg/l and t h e average pr imary e f f l u e n t ( secondary
i n f l u e n t ) i s 188 mg/l .
F i g u r e 5 - l l b shows t h e r e l a t i o n s h i p between g r i t chamber e f f l u e n t
a l k a l i n i t y ( o n l y measured s i n c e January 1986) and g r i t chamber
e f f l u e n t t o t a l suspended s o l i d s . I f i n c r e a s i n g g r i t chamber e f f l u e n t
TSS i s r e l a t e d t o s o l i d s p r o c e s s i n g wi th l i m e , t h e n an i n c r e a s e i n
a l k a l i n i t y below t h e gr i t chamber i s expec ted .
F i g u r e 5 - l l c shows a s i g n i f i c a n t c o r r e l a t i o n between secondary
e f f l u e n t pH and g r i t chamber e f f l u e n t TSS ( t h e l i n e a r c o r r e l a t i o n

Figure 5-11 Piscataway, a) Raw, Grit Effluent, and Primary Effluent Alkalinity vs. Month, b) Grit Chamber Effluent Alkalinity vs. Grit Chamber Effluent TSS, c) Secondary Effluent pH vs. Grit Chamber Effluent TSS.
, Grii Chamber Effluent
Primary
CaC03 (a)
Raw Influent / so ! . v . . , . . . . . , - I Jan. 86 June 86 Jan. 86
Month
GR
a Alkalinity
180 CaC03
Grit Chamber Effluent TSS, mg/l
8-0 VI Secondary
Effluent m m
PH a
a a
6 -8 0 1000
Grii Chamber Effluent TSS, mg/l I

c o e f f i c i e n t f o r pH on loglo TSS i s s l i g h t l y b e t t e r , r = 0 . 6 7 ) .
The r ecyc l e from s o l i d s process ing appears t o be important with
respec t t o phosphorus p r e c i p i t a t i o n . L i m e i n t h e r ecyc l e has e l eva t ed
t h e wastewater pH and a l k a l i n i t y , both of which can be de t r imen ta l t o
alum phosphate p r e c i p i t a t i o n . Elevated a l k a l i n i t y i nc reases t h e
amount of chemical requi red f o r a d j u s t i n g pH toward t h e opt imal
p r e c i p i t a t i o n value. The optimum pH f o r t o t a l phosphorus removal w i t h
alum was shown by Hais e t a l . (1973) t o be i n t h e range of 6 .3 t o 6 . 6 .
The experiments of Hais were conducted i n a p i l o t s c a l e s t e p feed
a e r a t i o ~ i system. S t ep feed a e r a t i o n i s used a t Piscataway.
Diamadopoulos e t a l . (1984) r epo r t ed t h a t t h e r e is a reg ion around pH
= 8 where n e i t h e r calcium nor aluminum a r e very e f f i c i e n t a t removing
phosphorus i n a c t i v a t e d s ludge, and t h a t phosphate p r e c i p i t a t i o n by
calcium, n a t u r a l l y p re sen t i n t h e wastewater, does no t proceed r e a d i l y
u n t i l t h e pH approaches 10. Balmer e t a l . (1974) r epo r t ed t h a t l i m e
p r e c i p i t a t i o n of phosphorus i n p r e - s e t t l e d domestic wastewater
occurred more favorab ly a t pH va lues above 11.2.
Severa l researchers have noted t h a t b i o l o g i c a l uptake of
phosphorus proceeds more r e a d i l y a s pH inc reases between 5.5 and 8.5
(65) .
5.6 SECONDARY PHOSPHORUS REMOVAL
Figure 5-12 shows a v a i l a b l e orthophosphate removal d a t a and t h e
alum ( ~ 1 ~ + ) dosing d a t a . The r e l a t i o n s h i p between orthophosphate

Figure 5-12 Piscataway Secondary, a) Influent and Effluent Orthophosphate vs. Year, b) Orthophosphate Removed and A13+ vs. Year, c) Orthophosphate Removed vs . A13+ Dose, d) Effluent Orthophosphate vs. A13+ Dose.
1 Influent I
mg/' (b)
2
0 82 83 84 85 86 87
Year

removal and alum d o s e is n o t c l e a r i n F i g u r e 5-12c. Orthophosphate
removal is s t u d i e d i n more d e t a i l i n Chap te r Seven.
F i g u r e 5-12d i n d i c a t e s t h a t e f f l u e n t o r thophospha te c o n c e n t r a t i o n s
a r e p o s i t i v e l y c o r r e l a t e d w i t h alum d o s e . Th i s t r e n d may be e x p l a i n e d
by a t i m e e f f e c t . The d a t a i n F i g u r e 5-12a,b show t h a t b o t h e f f l u e n t
o r thophospha te and alum dose were d e c r e a s i n g between J u l y 1984 and
December 1986.
F i g u r e 5-13 shows t h e A1/Pc molar r a t i o v s . e f f l u e n t
o r thophospha te c o n c e n t r a t i o n . A l l d a t a a r e from 1986, a f t e r t h e
phosphate d e t e r g e n t ban l e g i s l a t i o n .
5 . 6 . 1 A l k a l i n i t y and pH
F i g u r e 5-14c shows t h a t a l k a l i n i t y removal i s no t s i g n i f i c a n t l y
c o r r e l a t e d wi th alum dose . Also, t h e r e i s no obv ious r e l a t i o n s h i p
between t h e e f f l u e n t a l k a l i n i t y and alum dose ( F i g u r e 5 -14c) . Th i s
may b e caused by t h e h i g h l y v a r i a b l e i n f l u e n t a l k a l i n i t y v a l u e s , a
r e s u l t of t h e l i m e r e c y c l e .
F i g u r e s 5-15c and 5-15d show no l i n e a r r e l a t i o n s h i p s f o r pH change
and e f f l u e n t pH v s . alum dose . The pH i n t h e raw i n f l u e n t i s lower
t h a n t h e secondary e f f l u e n t . Th i s s i g n i f i e s t h a t t h e a c i d i c a c t i o n of
alum i s b e i n g p a r t i a l l y o f f s e t by t h e l i m e r e c y c l e t o t h e g r i t
chambers.
F i g u r e 5-16a is a p l o t of e f f l u e n t o r thophospha te ( l o g s c a l e and
m o l / l c o n c e n t r a t i o n ) v s . pH e f f l u e n t . The obse rved pH range i s t o o

Figure 5-13 Piscataway Secondary, a) A1/Pc Mole Ratio vs.
Effluent Orthophosphate, b) A1/Pc Mole Ratio
vs. Year, for PC - OSPI-OSPO.
AVPc Mole' Ratb
AVPc Mole Ratio 5 '
A v ~ = 2.98 S.D. = 1.5 n - 9 Max. 6.24 Min. = 0.79
a (excluding zero value)
I
I I
a a
I
0
I , , , , , 0 0 0.5 1
OSP Effluent, mg/l
Year

Figure 5 -14 Piscataway Secondary, a ) Inf luent and Ef f luent A l k a l i n i t y v s . Year, b) A l k a l i n i t y Removed and ~ 1 ~ + v s . Year, c ) A l k a l i n i t y Removed v s . ~ 1 ~ + Dose, d ) Ef f luent A l k a l i n i t y v s . ~ 1 ~ ' Dose.
Alkalinity mgfl 170 CaC03
Year
- - - - - - - - - - - -
Influent
Effluent - -7th - ~ 1 % dose x 10 -
I I - - -
k
Alkalinity Removed -

Figure 5-15 Piscataway Secondary, a ) Raw Influent and Secondary Eff luent pH v s . Year, b) pH Removed and A13+ v s . Year, C ) pH Removed v s . A13+ Dose, dl pH v s . A13+ Dose.
Standard Units
7.
2 82 83 84 85 86 87
Year
-
- Raw Influent
-
-
\
m
I m m
m m m m ... I # a m .
mm l m
4 I
a
m
m
T
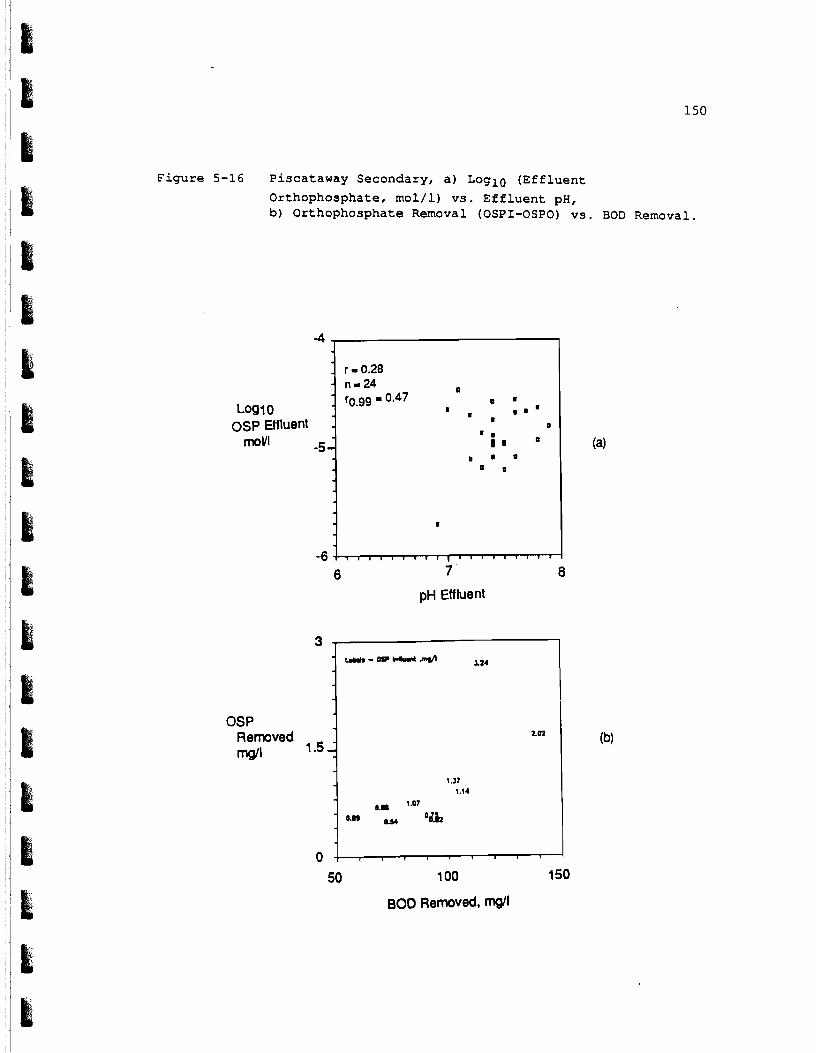
Figure 5-16 Piscataway Secondary, a ) Loglo (E f f luen t
Orthophosphate, mo l / l ) v s . E f f luen t pH, b) Orthophosphate Removal (OSPI-OSPO) vs . BOD Removal.
Log1 0 OSP Effluent
moVl
-4 ,
r - 0.28 - 11-24 P
0 ' I 1 1 '
I I I
' I
-5 - I I O Q P
0 0
I
- 6 - n a a u m a r l r ( l 1 1 1 1 1 1 1 1
6 7 . 8 pH Effluent
I ~ l u l - a o - d &a4
OSP Removed Z O ~
msll 1.5
1.37 1.14
BOD Removed, m4/1

s m a l l , g i v e n t h e v a r i a b i l i t y i n OSP c o n c e n t r a t i o n , t o r e v e a l any
s o l u b i l i t y l i m i t r e l a t i o n s h i p .
5 .6 .2 B i o l o g i c a l Removal
F i g u r e 5-16b i n d i c a t e s t h a t o r thophospha te removal i s caused by
b i o l o g i c a l up take . However, t h e OSP removal r e l a t i o n s h i p i s d i s t o r t e d
by t h e t r e n d o f i n c r e a s i n g secondary i n f l u e n t OSP v a l u e s , which a r e
i d e n t i f i e d wi th d a t a l a b e l s .
5 .6 .3 BOD, TSS, a n d T P
F i g u r e s 5-17 th rough 5-19 show t h a t t h e r e a r e no s t r o n g l i n e a r
r e l a t i o n s h i p s between alum dose and BOD removal, TSS removal, e f f l u e n t
BOD, e f f l u e n t TSS, and e f f l u e n t TP. F i g u r e 5-19c shows a weak
c o r r e l a t i o n between TP removal and alum dose ( r = 0.39, n = 34, ~ 0 . 9 9
= 0.40) .
5.7 TERTIARY PHOSPHORUS REMOVAL
F i g u r e 5-20 shows t h e o r thophospha te and alum d o s e d a t a f o r t h e
t e r t i a r y n i t r i f i c a t i o n p r o c e s s . From J u l y th rough October 1984 and
A p r i l th rough June 1985 t h e e f f l u e n t pump s t a t i o n a t P i sca taway was
o u t of s e r v i c e . During t h e s e months t h e f i n a l e f f l u e n t was r o u t e d
th rough a p o l i s h i n g pond b e f o r e d i s c h a r g e . P l a n t o p e r a t o r s were
concerned t h a t t h e pond s t o r a g e was c o n t r i b u t i n g phosphorus t o t h e
t r e a t e d wastewater , and t h a t t h e d i s c h a r g e p e r m i t of 0.18 mg/ l on TP

Figure 5-17 Piscataway Secondary, a ) Inf luent and Ef f luent BOD v s . Year, b) BOD Removed and A13+ vs . Year, c) BOD Removed v s . A13+ Dose, d) Eff luent BOD v s . A13+ Dose.
BOD mgJl
Influent
80
Effluent
0
82 83 84 85 Year

Figure 5-18 Piscataway Secondary, a ) Inf luent and E f f l u e n t TSS v s . Year, b) TSS Removed and A 1 3 + v s . Year, c) TSS Removed v s . A 1 3 + Dose, d ) E f f l u e n t TSS v s . ~ 1 3 + Dose.
Effluent I
Year
7o 1 TSS erno ow 4 A I ~ dose x 10 .
@I

Figure 5-19 Piscataway Secondary, a) Influent and Effluent Total Phosphorus vs. Year, b ) TP Removed and A13+ vs. Year C) TP Removed vs. A13+ Dose, dl Effluent TP vs. A13+ Dose.
Year

OSP mg/l
Figure 5-20 Piscataway Nitrification, a) Influent and Effluent Orthophosphate vs. Year, b) Orthophosphate Removed and A13+ vs. Year, c) Orthophosphate Removed vs . A13+ Dose, d) Effluent Orthophosphate vs. A13+ Dose. Note: Dots represent operator controlled alum overdoses. See discussion in text.
1.2 - - - - Influent
0.6 -
- Effluent
0 , l2 , a- See note above
0 82 83 84 85 86 87
Year

c o u l d n o t be m e t . A s a p r e c a u t i o n t h e y used e x t r a o r d i n a r i l y h igh alum
doses , t r y i n g t o a t t a i n a t e r t i a r y e f f l u e n t TP t a r g e t v a l u e o f 0.05
mg/l . The normal t a r g e t v a l u e i s 0.15 m g / l TP (30) . F i g u r e 5-20d
shows t h a t e f f l u e n t OSP r a r e l y exceeded 0 . 1 mg/ l . The months wi th
h igh alum doses i n F i g u r e 5-20b a r e i d e n t i f i e d by s o l i d d o t s .
F i g u r e 5-20c shows a l i n e a r r e l a t i o n s h i p between o r thophospha te
removed and alum d o s e . Th i s r e l a t i o n s h i p is d i s t o r t e d by t h e l a c k of
OSP d a t a f o r s e v e r a l months of h igh alum u s e . I t may a l s o b e
d i s t o r t e d by t h e downward t r e n d i n g alum dose and i n f l u e n t OSP
c o n c e n t r a t i o n . The e f f l u e n t c o n c e n t r a t i o n s a r e r o u g h l y c o n s t a n t (Ave.
= 0.058, S.D. = 0.04, n = 24) and small r e l a t i v e t o t h e i n f l u e n t
c o n c e n t r a t i o n s . The amount of OSP removed is e s s e n t i a i l y t h e amount
e n t e r i n g t h e p r o c e s s .
The OSP removal - alum r e l a t i o n s h i p can b e i n t e r p r e t e d u s i n g F igure
5-21a, which shows t h e A1/Pc mole r a t i o v s . e f f l u e n t o r thophospha te ,
wi th t h e same X-axis s c a l i n g a s F i g u r e 5-13. The average A1/Pc mole
r a t i o of 1 4 . 7 (S.D. = 7.4 , n = 24) i s c o n s i d e r a b l y g r e a t e r t h a n t h e
s t o i c h i o m e t r i c r a t i o of approx imate ly 1 . 5 The p r e c i p i t a t i o n is
n o n - s t o i c h i o m e t r i c .
5 . 7 . 1 A l k a l i n i t y and pH
F i g u r e 5-22 shows t h e d a t a f o r a l k a l i n i t y and alum. The
d e s t r u c t i o n of a l k a l i n i t y by n i t r i f i c a t i o n i s p r o b a b l y g r e a t e r t h a n
t h e d e s t r u c t i o n caused by alum a d d i t i o n . L i m e i s added t o t h e
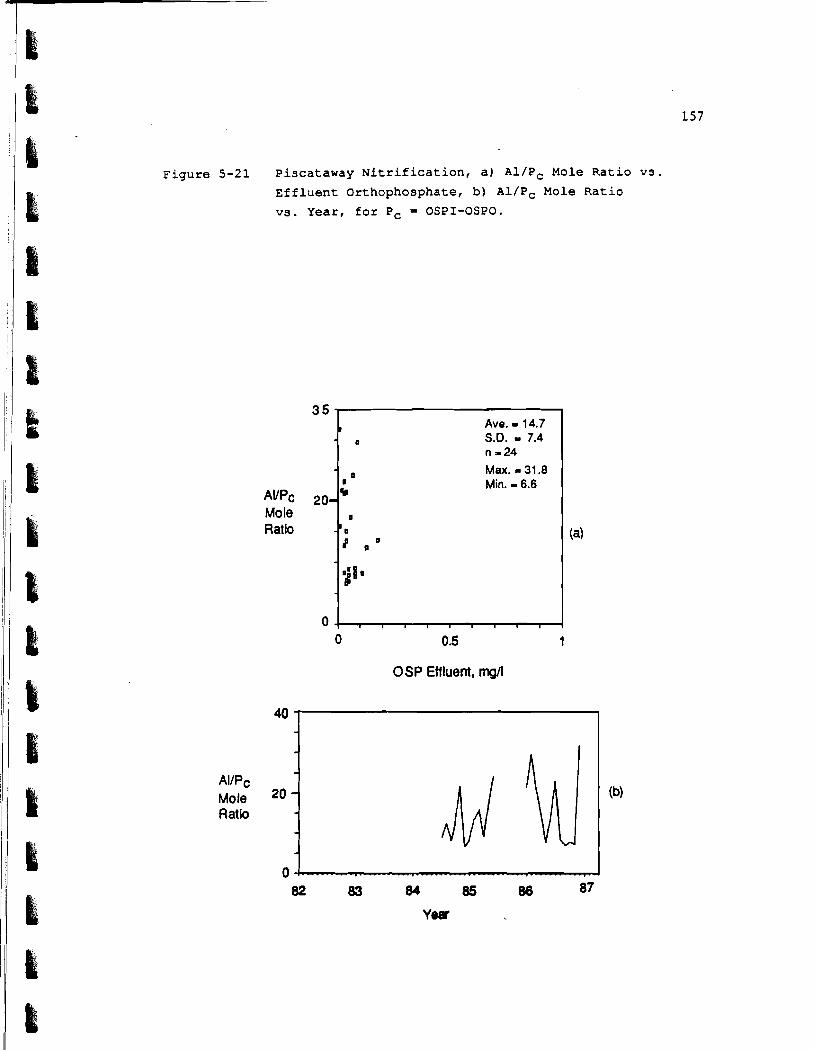
Figure 5-21 Piscataway ~ i t r i f i c a t i o n , a ) A1/Pc Mole Ra t i o v s .
E f f l u e n t Orthophosphate, b) A1/Pc Mole Ra t i o
v3. Year, f o r PC = OSPI-OSPO.
Ave. - 1 4.7 S.D. 1 7.4
AVPc 20 . Ratio
Max. 3 31.8 Min. - 6.6
OSP Effluent, mgA
AI/Pc Mole 20 Ratio
Year

F i g u r e 5-22 P i sca taway N i t r i f i c a t i o n , a ) I n f l u e n t and E f f l u e n t A l k a l i n i t y v s . Year, b) A l k a l i n i t y Removed and ~ 1 ~ ' v s . Year, c) A l k a l i n i t y Removed v s . ~ 1 ~ ' Dose, dl E f f l u e n t A l k a l i n i t y v s . ~ 1 ~ + Dose.
40 0 140 -
- -
70 - - -
0
Alkalinity Removed
-- 82 83 84 85 86 87

n i t r i f i c a t i o n r e a c t o r s i n v a r i a b l e amounts t o main ta in adequate
a l k a l i n i t y .
The f a c t o r s mentioned above a r e a l s o r e l evan t t o changes i n pH and
e f f l u e n t pH (Figures 5-23c and 5-23d) . Figure 5-24 shows t h a t t h e underlying t h e o r e t i c a l r e l a t i o n s h i p
between e f f l u e n t orthophosphate ( l o g s c a l e ) and e f f l u e n t pH, i s not
revea led because both pH and OSP a r e e s s e n t i a l l y f i x e d va lues .
5 .7 .2 BOD, TSS, and TP
F igure 5-25d i n d i c a t e s t h a t n i t r i f i c a t i o n e f f l u e n t BOD i s reduced
a t h igher alum doses . One would expect t o see a s i m i l a r p a t t e r n f o r
e f f l u e n t TSS, and i t is weakly ev ident i n Figure 5-26d. There i s a l s o
a weak c o r r e l a t i o n between e f f l u e n t TP and alum dose (Figure 5-27d3,
because e f f l u e n t OSP is small (ave. = 0.058 mg/l) and p a r t i c u l a t e
phosphorus i s a s soc i a t ed with suspended s o l i d s .

Figure 5-23 Piscataway N i t r i f i c a t i o n , a ) Inf luent and Ef f luent pH VS. Year, b) pH Removed and A13+ v s . Year, c) pH Removed v s . ~ 1 3 + Dose, d) pH v s . A 1 3 + Dose.
Standard (a)
Unls
Year

Figure 5-24 Piscataway Nitrification, a) Loglo (Effluent
Orthophosphate, mol/l) vs. Effluent pH, b) Orthophosphate Removal vs. BOD Removal.
OSP 0.5 Removed mg/l
7 8 pH Effluent
0 15 30 BOD Removed, mq/l

Figure 5-25 Piscataway Nitrification, a) Influent and Effluent BOD vs. Year, b) BOD Removed and A13+ vs. Year, c) BOD Removed vs. A13+ Dose, d) Effluent BOD vs. A13+ Dose.
BOD mg/'
BOD Removd I I - - -/I '5 :
A I ~ + dose
7
Year
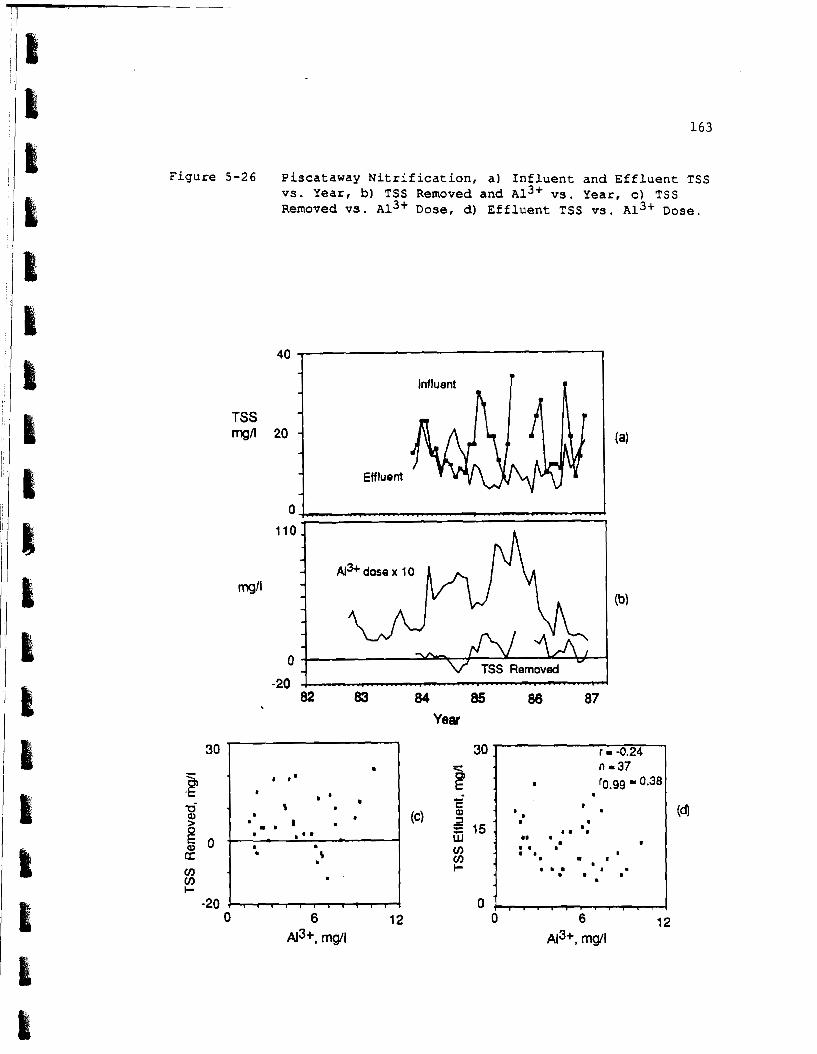
Figure 5 -26 Piscataway N i t r i f i c a t i o n , a ) I n f l u e n t and E f f l u e n t TSS v s . Year, b) TSS Removed and A13+ v s . Year, c ) TSS Removed v s . A13+ Dose, d ) E f f l u e n t TSS v s . A 1 3 + Dose.
TSS - mg/l 20 - (a)
- Effluent - 1
110.
mg" - - - - -
0 -- \/ TSS Removed -20 . - - --
82 83 84 85 88 87
Year

Figure 5-27 Piscataway Nitrification, a) Influent and Effluent Total Phosphorus vs. Year, b) TP Removed and ~13' VS. Year, C) TP Removed vs. ~ 1 3 + Dose, d) Effluent TP vs. ~ 1 3 + Dose.
A I ~ + dose
TP Removed
- AJ"v4
Year

CHAPTER SIX: PISCATAWAY REGRESSION ANALYSIS
6 . 1 STATISTICAL ANALYSIS
6 . 1 . 1 Secondary Treatment P r o c e s s
The phosphorus removal d a t a f o r t h e secondary p r o c e s s c o n s i s t s of
o n l y 12 o b s e r v a t i o n s , from 1986, a f t e r t h e d e t e r g e n t ban l e g i s l a t i o n
was implemented i n Maryland. Th i s i s a ve ry s m a l l d a t a b a s e and
r e g r e s s i o n a n a l y s i s p rov ided no u s e f u l p r e d i c t i v e models. The
r e l a t i o n of dSOP t o aluminum dose , dBOD, P H I , ALKI, and OSPI was
i n v e s t i g a t e d by m u l t i p l e l i n e a r r e g r e s s i o n , a s d i s c u s s e d i n Chapter 4 .
Alum dose and phosphorus c o n c e n t r a t i o n s were a s m g / l .
BOD removal and OSPI were t h e o n l y v a r i a b l e s t h a t were s i g n i f i c a n t
when c o n s i d e r e d a l o n e . The c o r r e l a t i o n of dSOP w i t h OSPI was s t r o n g
because dSOP = OSPI-OSPO= OPSI; OSPO is n e a r l y c o n s t a n t and v e r y
s m a l l . When b o t h dSOP and BOD a r e p u t i n t o t h e model, dBOD becomes
i n s i g n i f i c a n t . Th i s happens because dBOD and OSPI a r e s t r o n g l y
c o r r e l a t e d ( F i g u r e 5-16b) and OSPI dominates t h e r e g r e s s i o n . The
r e s u l t i s t h a t a n independent e s t i m a t e o f b i o l o g i c a l P removal cannot
be made from t h e s e d a t a .
6 .1 .2 N i t r i f i c a t i o n Process
The d a t a from J u l y 1984 - June 1985 and c a l e n d e r y e a r 1986 (n = 24
o b s e r v a t i o n s ) were ana lyzed u s i n g m u l t i p l e l i n e a r r e g r e s s i o n . No
u s e f u l p r e d i c t i v e models were developed.
OSP removal i n t h e n i t r i f i c a t i o n p r o c e s s was c h a r a c t e r i z e d a s

being non-stoichiometric with respect to soluble phosphorus, based on
the A1/Pc ratios (Figure 5-21). The system operates with an excess of
alum and precipitation is non-stoichiometric with respect to soluble
phosphorus. The excess alum is sufficient to buffer changes in
influent quality.
6.2 SUMMARY
The following conclusions are drawn regarding the Piscataway
plant :
1) It is not possible to make a quantitative assessment of the
effect of the phosphate detergent ban on alum requirements for
precipitation in the secondary treatment process. There is
insufficient phosphorus data (nine months with both influent and
effluent soluble phosphorus data) to classify the stoichiometry of
aluminum phosphate precipitation. Alum use in the secondary plant had
been decreased steadily over a period of time. Over the same general
period of time, the use of lime for sludge stabilization was high
enough that sludge return flows raised the secondary process pH from a
typical value of about 7 to about 7.5; alkalinity increased
correspondingly.
2) Alum dosing to the nitrification treatment process has been
consistently non-stoichiometric. Under these conditions, reducing
influent phosphorus concentration would not lead to savings in alum.
3 ) Phosphate removal in the secondary and tertiary treatment
processes cannot be usefully modeled by multiple linear regression.

CHAPTER SEVEN: SOUTH SHORE WWTP
7 . 1 BACKGROUND
The South Shore wastewater t r e a t m e n t f a c i l i t y i s l o c a t e d i n Oak
Creek, Wisconsin. Wastewater o r i g i n a t e s i n t h e s o u t h e r n and western
p o r t i o n s of t h e Milwaukee Met ropo l i t an Sewerage D i s t r i c t ' s 420 square
m i l e s e r v i c e a r e a .
I n J u l y 1979, t h e S t a t e of Wisconsin l e g i s l a t e d a ban on phosphate
based d e t e r g e n t s . Th i s ban was r e p e a l e d i n J u l y 1982. A second ban
became law i n January 1984.
7 .2 PROCESS DESCRIPTION
F i g u r e 7-1 i s a schemat ic of t h e South Shore p l a n t . The o p e r a t i o n
c o n s i s t s of p r e l i m i n a r y t r e a t m e n t ( c o a r s e s c r e e n i n g and g r i t removal) ,
pr imary c l a r i f i c a t i o n , a c t i v a t e d s ludge , f i n a l c l a r i f i c a t i o n , and
c h l o r i n a t i o n .
Primary s ludge i s a n a e r o b i c a l l y d i g e s t e d . Waste a c t i v a t e d s ludge
i s t h i c k e n e d by d i s s o l v e d a i r f l o t a t i o n and s e n t e i t h e r t o d i g e s t e r s
o r t o Jones I s l a n d f o r p r o c e s s i n g i n t o M i l o r g a n i t e . The d i g e s t e d
s o l i d s a r e lagooned, dewatered, and d i s t r i b u t e d a s an a g r i c u l t u r a l
s o i l c o n d i t i o n e r o r some s ludge may be s e n t t o t h e Jones I s l a n d
M i l o r g a n i t e o p e r a t i o n . I n c i n e r a t i o n is used t o t r e a t s o l i d s from t h e
p r e l i m i n a r y p r o c e s s .
Recycle lagoon s u p e r n a t a n t and i n c i n e r a t i o n p r o c e s s wa te r r e t u r n
t o t h e p r o c e s s s t r e a m a t t h e head of t h e p l a n t . The l o c a t i o n of t h e
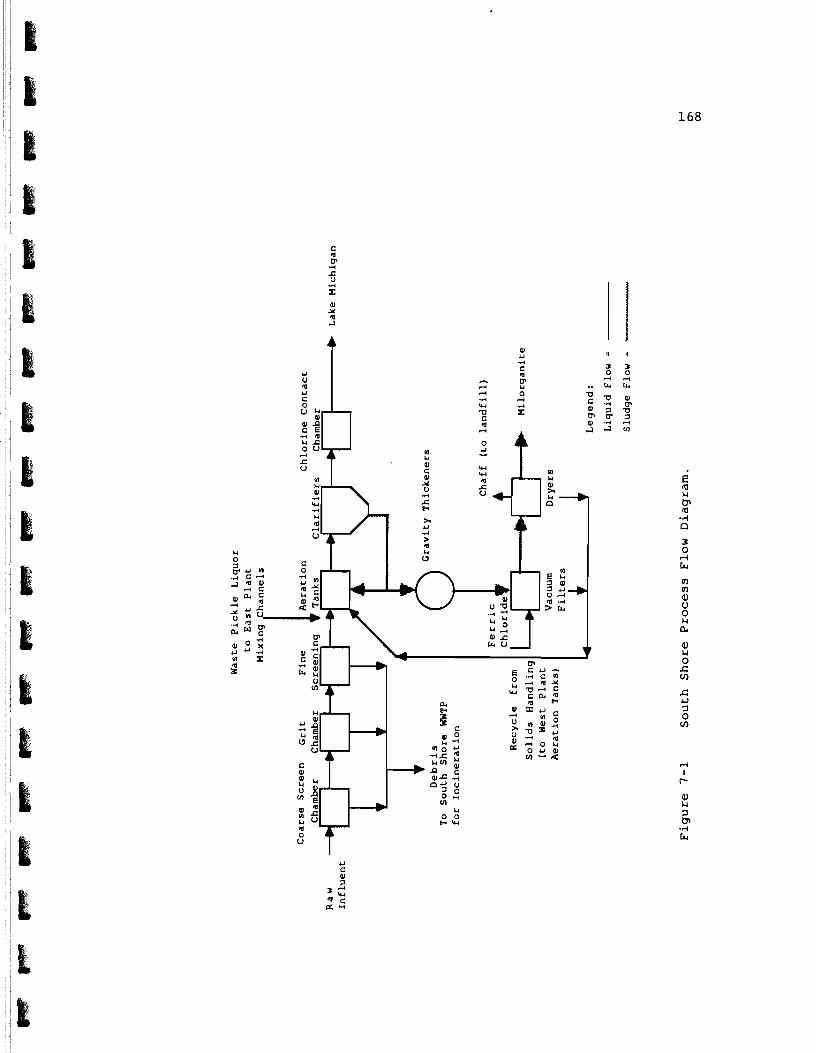
r e c y c l e r e e n t r y h a s changed s e v e r a l t i m e s , due t o c o n s t r u c t i o n and
h y d r a u l i c problems. On s e v e r a l o c c a s i o n s t h e r e c y c l e c h a n n e l h a s been
plugged, c a u s i n g t h e lagoon d e c a n t t o e n t e r above t h e raw i n f l u e n t
sample r . Although t h e s e p e r i o d s of t i m e a r e n o t know p r e c i s e l y , p l a n t
o p e r a t o r s i n d i c a t e d t h a t most o f t h e problems were p r i o r t o 1980 and
more r e c e n t l y i n 1987. P r i o r t o November 1976 a l l i n f l u e n t sampl ing
was t a k e n below t h e lagoon r e c y c l e p o i n t . The l agoon r e c y c l e f lows a r e
n o t known f o r most months of t h e d a t a base , b u t o p e r a t o r s have
i n d i c a t e d t h a t t h i s f low is approx imate ly 0 .75 Mgd, and t h a t it v a r i e s
c o n s i d e r a b l y .
P r e s e n t l y , phosphorus removal is accompl ished b y t h e a d d i t i o n of
c h l o r i n e o x i d i z e d WPL a t t h e i n l e t t o t h e p r imary c l a r i f i e r s . P r i o r
t o October 1989, unox id ized WPL was e i t h e r added t o t h e a e r a t i o n
b a s i n s o r ahead o f t h e p r i m a r i e s . A p l a n t s c a l e s t u d y i n 1980 ( 2 5 )
i n d i c a t e d t h a t t h e o x i d a t i o n o f t h e i r o n would improve phosphorus
removal e f f i c i e n c y and t h a t d o s i n g ahead o f t h e p r i m a r i e s would h e l p
t o improve f l o a t a t i o n t h i c k e n e r o p e r a t i o n by d e c r e a s i n g t h e i n o r g a n i c
f r a c t i o n i n t h e was te a c t i v a t e d s l u d g e .
7 . 3 OPERATIONS DATA
O p e r a t i n g d a t a was o b t a i n e d from a n e x i s t i n g d a t a b a s e a t t h e
U n i v e r s i t y o f Wisconsin-Madison, and from two t r i p s t o t h e f a c i l i t y i n
September 1986 and March 1987.

7.4 RAW INFLUENT CONDITIONS
Figure 7-2 shows t h a t t h e process flow a t South Shore has
increased s i n c e 197 5.
F igures 7-3 and 7-4 show i n f l u e n t BOD and TSS d a t a . Since about
1980, i n f l u e n t BOD and TSS concent ra t ions have decreased s l i g h t l y .
Mass loads of t h e s e parameters appear r e l a t i v e l y cons t an t f o r t h e same
per iod .
F igures 7-3d through 7-6d show a r e l a t i v e l y s t r o n g d i l u t i o n
e f f e c t . Figure 7-5b does not r evea l any l a r g e i nc rease o r decrease i n TP
load ing a t o r near t h e 1982 and 1984 phosphate de t e rgen t l e g i s l a t i v e
a c t i o n s . The s h i f t i n 1979 i s somewhat d i sgu i sed by t h e downward
t r end ing d a t a from 1975 t o 1982.
Figure 7-6b shows t h a t i n f l u e n t SP loading decreased from 1978 t o
sometime i n 1981 be fo re i nc reas ing u n t i l e a r l y 1983. The e f f e c t s of
t h e ban a r e more c l e a r here .
F igure 7-7b i n d i c a t e s t h a t i n f l u e n t p a r t i c u l a t e phosphorus
decreased s t e a d i l y from 1978 t o 1982.
7 .5 PRIMARY PHOSPHORUS REMOVAL
7 .5 .1 Recycle Flows
Wastewater samples a r e taken downstream from t h e lagoon decant
recyc le a t t h e e f f l u e n t end of t h e g r i t channels . These a r e r e f e r r e d
t o i n t h e t e x t a s t h e "flow-plus-recycle" measurements. Figure 7-8
shows t h e d i f f e r e n c e between t h e flow-plus-recycle measurements and


F i g u r e 7-3 South Shore Raw I n f l u e n t a ) BOD C o n c e n t r a t i o n , b) BOD Mass Loading, c ) BOD C o n c e n t r a t i o n v s . Mass Loading, d) BOD C o n c e n t r a t i o n v s . Flow.
Raw Influent 250 BOD rn
- Raw Influent 150' BOO
- -
75 76 77 78 79 80 81 82 83 84 85 86 87 Year
- '
-
0 150 300 0 100 200
BOD, kip'day Fbw, Mgd
r = 0.75 n-146 I r0.99 = 0.19 l r a m '
a ' l l
l&a,a
l a
~ " . . " ' , , " . . "
(dl
so0 '
il (c) 6 250 -
sl
r = -0.59 a n-146
r0.99 = 0.1 9
:k; :ws, a 'm
l a m
o , , . , , , , , , , , , , , , . , , ,

F i g u r e 7-4 South Shore Raw I n f l u e n t a ) TSS C o n c e n t r a t i o n , b) TSS Mass Loading, c) TSS C o n c e n t r a t i o n v s . Mass Loading, d ) TSS C o n c e n t r a t i o n v s . Flow.
Raw Influent 350
TSS mgl
R W Influent TSS 200 (b)
Wday
1 I o ! . . . . . . . . . .I 75 76 77 78 79 80 81 82 83 84 85 86 87
Year
(dl
700 700 '
P 2 3 5 0 d (c) 9 350 . C C
0 0 0 #30 400 0 100 200
TSS, kiplday Fbw, Mgd
r - -0.51
' I n-146
0 r0.99 = 0.1 9 ' I. 00
0 0 - 0 l
4; -q,&@ L ' .I?
r . . . . . . . . . . . . . . . . . . . 7

Figure 7 -5 South Shore Raw I n f l u e n t a ) TP Concentration, b ) TP Mass Loading, c ) TP Concentration v s . Mass Loading, d ) TP Concentration v s . Flow.
Raw lrdluent 11
TP m41
Raw Influent TP m'day
o ! . . . . . . . . . . . . . . i 75 76 77 78 79 80 81 82 83 84 85 86 87
Year

Figure 7-6 South Shore Raw I n f l u e n t a ) SP C o n c e n t r a t i o n , b) SP Mass Loading, c) SP Concen t ra t ion v s . Mass Loading, d) SP C o n c e n t r a t i o n v s . Flow.
Raw Influent SP rn
Raw Infbent SP 2 w d a y
J 75 76 77 78 79 80 81 82 83 84 85 86 87
Year
0
0 2 4 0 100 200
SP, KP'day naw, Mgd
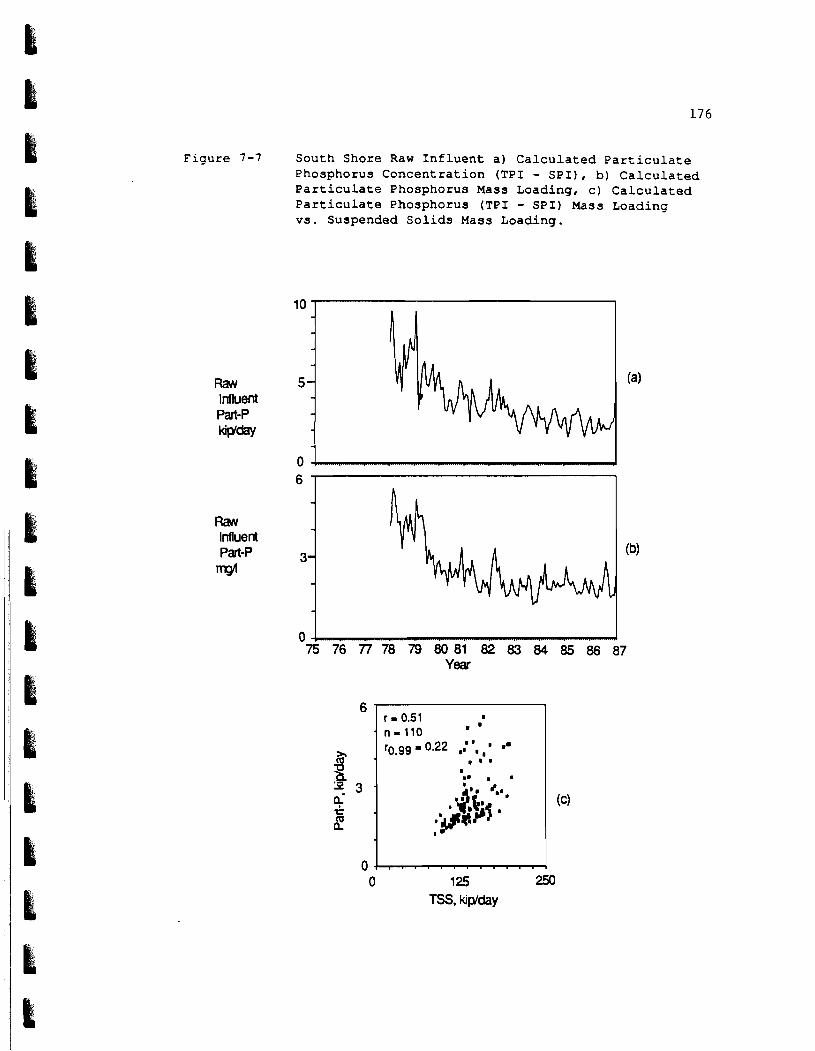
Figure 7-7 South Shore Raw Influent a) Calculated Particulate Phosphorus Concentration (TPI - SPI), b) Calculated Particulate Phosphorus Mass Loading, c) Calculated Particulate Phosphorus (TPI - SPI) Mass Loading vs. Suspended Solids Mass Loading.
Raw Influent Pat-P MP'day
Raw Influent Pat-P rn
75 76 77 78 79 80 81 82 83 84 85 86 87 Year
0 0 1 25 W3
TSS. ki-y

Figure 7-8 South Shore N e t Contr ibut ion of Lagoon Decant t o Raw In f luen t Concentrations of a ) BOD, b ) TSS, C ) TP, d)SP. See d iscuss ion i n t e x t .
Net BOD m
Net TSS
m o
Net TP 0 m
Net 0 -l,, A SP
h - -
m - -
" 79 80 81 82 83 84 85 86 87
Year
the raw influent measurements.
In Figure 7-8d there is a series of large negative differences
between October 1980 and September 1983. During this period of time,
the chlorinated WPL addition point was ahead of the recycle
measurement. Excluding the data from October 1980 through September
1983, the impact of the recycle on primary influent SP concentrations
appears to be small. A maximum net difference of 0.6 mg/l occurred in
February 1980.
The average net contribution of TP due to the recycle is 0.25 mg/l
(S.D.= 0.7, n = 90). Since a TP determination would include iron
phosphate floc, the data from the upstream WPL addition are included
in the average.
The average contribution of suspended solids from the recycle is
30.1 mg/l (S.D. = 32, n = 95). Chemical sludge solids (calculated
with Equations 2-3 through 2-5) are subtracted from the
recycle-plus-flow measurement for October 1980 through September 1983.
This eliminates the contribution of suspended solids caused by the
formation of iron precipitates (assuming that grit chamber removal is
negligible). The average estimated chemical sludge for this time
period is 12.6 mg/l.
The average BOD increase is 25.3 mg/l (S.D. = 22, n = 96). The
assumption is that chemical addition above the recycle did not
significantly alter the flow-plus-recycle measurement from October
1980 through September 1983.

7.5.2 Soluble Phosphorus Removal
To quantify the impact of oxidized waste pickle addition on
phosphorus, TSS, and BOD removal in the primary treatment plant,
primary influent parameters have been estimated as follows:
-. Assume that WPL addition above the
flow-plus-recycle measurement had no impact on BOD. Use
flow-plus-recycle measurements regardless of iron dose points.
v Influent T S . Assume that WPL addition above the
flow-plus-recycle measurement increased suspended solids
concentration by an amount equal to the chemical precipitate
predicted by Equations 2-3 through 2-5. Use flow-plus-recycle
measurements minus the quantity of chemical solids.
v. For October 1980 through September 1983
assume that precipitated phosphorus did not settle before reaching
the primary clarifiers. Use flow-plus-recycle measurements.
v Influent. Use raw influent measurements for October
1980 through September 1983. Use raw influent measurements for
November 1979, December 1979, March 1980 through September 1980,
and all of 1985. Flow-plus-recycle measurements are unavailable
for these time periods. Use flow-plus-recycle measurements for
the remaining dates.
Primary effluent parameter values are available from 1979 to the
present.
Figure 7-9 shows SP and iron data for a period covering WPL and

F i g u r e 7-9 S o u t h S h o r e P r i m a r y a ) I n f l u e n t a n d E f f l u e n t SP v s . Year, b) Fe Dose a n d SP Removed v s . Yea r , C ) SP Removed v s . F e Dose, d) SP E f f l u e n t v s . F e Dose . (0 = o x i d i z e d WPL, 1 = WPL)
4
SP ms/l 2
0
3
ms/l 1.5 (b)
0 79 80 81 82 83 84 85 86 87
Year
(dl
, 0 15 30 0 15 30
Fe, mg/l Fe, mg/l
I
e m I
I m I I I I
I#{ '
2 .
- P .
5 . LI
s 1 :
.c LU : Cc) 2
4 -
2 : 2 2 *
H -
I I
I 1 1 1 , ',C I I
I 1 1
L, ' I
cn . ;?I I. 1 I 111 (
1 I
1 1 1 ( ( 1
0 ; , , * , * , , . . . . , , ,
2 L : cn
0
i , . . . . . . . , . . . - 9 . .

o x i d i z e d WPL a d d i t i o n . SP removal i n F i g u r e 7-9c appears t o be
l i n e a r l y r e l a t e d t o i r o n dose under bo th c o n d i t i o n s (WPL: r = 0.86, n
= 19, r 0 . 9 9 = 0.53 and OX-WPL: r = 0.66, n = 76, ~70.99 = 0 . 2 6 ) . The
i r o n dose i s lower when c h l o r i n e o x i d a t i o n was p r a c t i c e d , and
approximately t h e same range of SP removals were a c h i e v e d . Th is
i n c r e a s e i n SP removal e f f i c i e n c y can be a t t r i b u t e d t o t h e more
e f f i c i e n t ~ e + ~ s o u r c e ( o x i d i z e d WPL) . F i g u r e 7-10 shows i n f l u e n t SP and i r o n dose t o b e l i n e a r l y
c o r r e l a t e d (WPL: r = 0.82, n - 21, '0.99 0.50; and OX-WPL: r = 0.69,
n = 77, r 0 -99 = 0 . 2 6 ) .
The r e l a t i o n s h i p s between SP removed, f low, i r o n dose , and i n i t i a l
SP i s a r e f u r t h e r s t u d i e d i n Chapter E i g h t .
F i g u r e 7-9d shows t h a t e f f l u e n t SP c o n c e n t r a t i o n s were d i f f e r e n t
f o r t h e two p e r i o d s o f d i f f e r e n t i r o n s o u r c e . For unoxid ized WPL
a d d i t i o n , t h e average primary e f f l u e n t SP c o n c e n t r a t i o n was 0.38 mg/l
(S.D. - 0.19, n = 1 9 ) . The average e f f l u e n t SP c o n c e n t r a t i o n f o r
o x i d i z e d WPL a d d i t i o n was 0.80 mg/ l (S.D. = 0.30, n = 85) . The
c o r r e l a t i o n between e f f l u e n t SP and Fe dose i s s i g n i f i c a n t ( r = 0.29,
n = 85, r0 .99 = 0 . 2 5 ) .
Unoxidized WPL was used when t h e f i r s t d e t e r g e n t phosphate ban was
implemented. The removal e f f i c i e n c y of WPL was shown i n a p l a n t s c a l e
s t u d y t o b e less e f f e c t i v e a t removing SP t h a n o x i d i z e d WPL. However,
t h e c o n c e n t r a t i o n s of e f f l u e n t SP w e r e q u i t e d i f f e r e n t f o r t h e two
t y p e s of i r o n a d d i t i o n . D i f f e r e n t chemical mechanisms c o u l d b e i n

Figure 7-10 South Shore Primary Influent SP vs. Iron Dose (0 = oxidized WPL, 1 = WPL) .
0 15 30
Fe Dose, mgll

e f f e c t a t t h e s e two e f f l u e n t SP c o n c e n t r a t i o n s , a s shown i n F i g u r e
7-11, a p l o t of t h e Fe/Pc mole r a t i o a g a i n s t t h e p r imary e f f l u e n t SP
c o n c e n t r a t i o n . The o u t l i e r i n t h i s f i g u r e (Fe/Pc = 9) c o r r e s p o n d s t o
an u n u s u a l l y s m a l l SP removal. The p o s t WPL c h l o r i n a t i o n a v e r a g e
Fe/Pc mole r a t i o was 2.32 (S.D. = 1 .0 , n = 7 5 ) . The p r e - c h l o r i n a t i o n
a v e r a g e Fe/Pc r a t i o was 4.46 (S.D. = 0.78, n = 1 9 ) . The
p r e - c h l o r i n a t i o n r a t i o may b e h i g h e r because of 1) t h e i n e f f i c i e n t u s e
o f u n o x i d i z e d WPL and 2 ) n o n - s t o i c h i o m e t r i c p r e c i p i t a t i o n t o t h e
r e l a t i v e l y low e f f l u e n t c o n c e n t r a t i o n s . The changes i n chemica l
d o s i n g p r a c t i c e , n e a r t h e t i m e of t h e i n i t i a l phospha te d e t e r g e n t ban,
make it d i f f i c u l t t o a s s e s s t h e impact o f chang ing phospha te
c o n c e n t r a t i o n s on chemical r equ i rement s .
Chemical SP removal has been s t o i c h i o m e t r i c s i n c e 1981,
t h e r e f o r e , changes i n i n f l u e n t SP c o n c e n t r a t i o n , c a u s e d by d e t e r g e n t
bans i n 1982 and 1984, s h o u l d r e s u l t i n l i n e a r a d j u s t m e n t s of chemical
r e q u i r e m e n t .
7 . 5 . 3 pH
Raw i n f l u e n t and f i n a l e f f l u e n t pH v a l u e s a r e shown i n F i g u r e
7-12. Wastewater a l k a l i n i t y was n o t measured a t South Shore .
T h e o r e t i c a l l y , t h e obse rved i n c r e a s e i n i n i t i a l was tewa te r pH w i l l
r e s u l t i n a h i g h e r s o l u b i l i t y l i m i t f o r o r t h o p h o s p h a t e .

F i g u r e 7-11 South Shore Pr imary a ) Fe/pc Mole Ra t i o v s . SP E f f l u e n t
b) Fe/Pc Mole Ra t i o v s . Year. ( f o r PC = SPI - SPO) . (0 = o x i d i z e d WPL, 1 = WPL)
Fe/Pc Mole Ratio
SP Effluent, mgl
(b)
Ratio
o ! 79 80 81 82 83 84 85 86 87
Year

185
F i g u r e 7-12 South Shore Raw I n f l u e n t and F i n a l E f f l u e n t p H v s . Year.
R a w I n f l u e n t
PH 7
Standard Units
F i n a l E f f l uen t
55 79 80 81 82 83 84 85 86 87
Year

7 . 5 . 4 BOD, TSS, a n d TP
F i g u r e s 7-13c t h r o u g h 7-15c show t h e r e l a t i o n s h i p s o f WPL d o s e a n d
BOD, TSS, a n d TP r emova l .
F i g u r e s 7-13d a n d 7-15d show t h a t p r i m a r y e f f l u e n t BOD a n d TP
c o n c e n t r a t i o n s i n c r e a s e w i t h i r o n d o s e (WPL:BOD, r - 0 . 7 7 , n = 19 ,
r 0 . 9 9 = 0 .53 ; TP, r - 0.69 , n = 1 9 ) (OX-WPL:BOD, r = 0 .41 , n = 77,
r 0 . 9 9 = 0 .26 ; TP, r = 0.55 , n = 7 7 ) . The t i m e series p l o t s o f
i n f l u e n t a n d e f f l u e n t BOD a n d TP show t h a t i n f l u e n t p e a k s c o r r e s p o n d
t o e f f l u e n t p e a k s .
F i g u r e 7-16 s u g g e s t s t h a t i n f l u e n t TSS a n d i r o n d o s e a r e l i n e a r l y
r e l a t e d (WPL:r - 0 .86 , n = 19, r 0 . 9 9 0 .53 ; OX-WPL: r = 0 .31 , n = 76,
r 0 . 9 9 = 0 . 2 6 ) . The c o r r e l a t i o n o f TSS removed ( m g / l ) a n d i n f l u e n t TSS
is h i g h l y s i g n i f i c a n t ( a l l d a t a , r- 0 .94 , n = 94, ~ 0 . 9 9 = 0 . 2 4 ) . The
c o l l i n e a r i t y be tween i n f l u e n t TSS, i r o n d o s e , a n d TSS removed mean
t h a t e n h a n c e d s o l i d s r emova l n e e d s t o be a s s e s s e d w i t h a d i f f e r e n t
method t h a n s i m p l y c a l c u l a t i n g t h e s l o p e o f t h e d a t a i n ~ i ~ u ; e 7 -14c .
F i g u r e 7-14d shows t h a t e f f l u e n t s u s p e n d e d s o l i d s i s i n d e p e n d e n t
o f o x i d i z e d WPL i r o n d o s e ( r = 0 .21 , n = 77, r 0 . 9 9 = 0 . 2 6 : a v e . =
75.7 , S .D. = 17, n = 7 7 ) . F o r u n o x i d i z e d WPL u s e , t h e i n c r e a s i n g
t r e n d may be r e l a t e d t o p o o r l y s e t t l i n g g e l a t i n o u s f e r r o u s h y d r o x i d e
p r e c i p i t a t e ( r = 0 . 6 6 , n = 19, r 0 - 9 9 = 0 . 5 3 ) . The p l a n t s c a l e s t u d y
( 2 5 ) c o n c l u d e d t h a t t h e s w i t c h t o o x i d i z e d WPL r e s u l t e d i n d e c r e a s e d
i r o n c o n t e n t i n t h e w a s t e a c t i v a t e d s l u d g e .

Figure 7-13 South Shore Primary a) Influent and Effluent BOD vs. Year, b) BOD Removed and Fe Dose vs. Year, C ) BOD Removed vs . Fe Dose, dl BOD Effluent vs . Fe Dose. (0 = oxidized WPL, 1 = WPL)
OW& c 8 7 Year
0- 0 15 30
Fe, mgfl

Figure 7 - 1 4 South Shore Primary a ) Inf luent and Ef f luent TSS v s . Year, b) TSS Removed and Fe Dose v s . Year, C ) TSS Removed v s . Fe Dose, d) TSS Ef f luent v s . Fe Dose. (0 = o x i d i z e d WPL, 1 = WPL)
500
Influent
0' 79 80 81 82 03 84 85 86 87
Year
9- 0 15 30
Fe, mgll

Figure 7 -15 South Shore Primary a ) Inf luent and Ef f luent TP v s . Year, b) TP Removed and F e Dose v s . Year, c) TP Removed v s . F e Dose, d ) TP Ef f luent v s . Fe Dose (0 = oxid ized WPL, 1 = WPL) .
-7
d
- Fe Dose
0 79 80 81 82 83 84 85 86 87
Year
o i s 30 Fe, mgll

Figure 7-16 South Shore Primary Influent TSS vs. Iron Dose (0 = oxidized WPL, 1 = WPL) .
TSS Influent 250 'WJl
0 0 1 5 30
Fe Dose, mgfl

7 . 6 SECONDARY PHOSPHORUS REMOVAL
Figure 7-17 shows secondary SP removal, BOD, and pr imary i r o n dose
d a t a .
F i g u r e 7-18 shows t h a t secondary SP removal is s i g n i f i c a n t l y
c o r r e l a t e d wi th BOD removal ( r = 0.50, n = 95, r o . g g = 0.24) .
F i g u r e 7-18b shows t h a t secondary SP removal i s n o t s t r o n g l y
dependent on pr imary i r o n dose f o r o x i d i z e d WPL a d d i t i o n ( r = 0.29, n
= 76, r 0 . 9 9 = 0 . 2 6 ) . The same f i g u r e s u g g e s t s t h a t secondary SP
removal is r e l a t e d t o unoxidized WPL a d d i t i o n ( r = 0.60 , n = 1 9 ,
r0 .99 = 0 . 5 3 ) . These o b s e r v a t i o n s suppor t t h e o b s e r v a t i o n s of t h e
1980 p l a n t s t u d y which w e r e conducted t o e l i m i n a t e i r o n c a r r y over
i n t o t h e s e c o n d a r i e s . I t shou ld be no ted t h a t t h e i r o n dose ranges
a r e not t h e same f o r bo th t y p e s of i r o n .
7 .7 PRIMARY SLUDGE PRODUCTION
F i g u r e 7-19a shows r e p o r t e d primary s ludge p roduc t ion , TSS removed
( w i t h p r e v i o u s l y s t a t e d assumptions about i n f l u e n t TSS), and p r e d i c t e d
chemical s l u d g e (Equat ions 2-3 through 2-5 ) . The p r e d i c t e d chemical
s ludge averages 19.7% (by weight) of t h e r e p o r t e d s l u d g e t o t a l p r i o r
t o o x i d i z e d WPL use, and 6.7% a f t e r .
F igure 7-19b shows t h e r e l a t i o n s h i p between observed s l u d g e
p roduc t ion and p r e d i c t e d chemical s ludge . These f i g u r e s i n d i c a t e t h a t
changes i n chemical s ludge product ion t h a t have r e s u l t e d from changes

F i g u r e 7-17 South Shore Secondary a ) Pr imary E f f l u e n t and F i n a l E f f l u e n t SP, b) Primary I r o n Dose and Secondary SP Removed, c) Secondary BOD Removed and Secondary SP Removed.
2
SP m41
1 (a)
0 3
Primary Iron Dose x 0.1
79 80 81 82 83 84 85 86 87 Year

F i g u r e 7-18 South Shore ~ e c ' o n d a r y a ) SP Removed v s . BOD Removed, b) Secondary SP Removed v s . Pr imary I r o n Dose. (0 - o x i d i z e d WPL, 1 - WPL)
Secondary ! 8 D
SP Removed 0.6 8 @ 8 8
ms/l 8 8 @ @ 8 8 8 8 8 1
@ 8 b 881,88; 8
@ 8 1 # r, @
8
8 1 @ ' 8 1 8
BOD Removed, mq/l
@)
1.2 -
Secondary SP Removed
mpll 0.6:
-
-0.1, 0 15 30
Fe Dose, mq/l
C 8 8
# @ @ 8
8
m i 8 ' A '@ 1
8 8 1
14' 1 s; 898 I
f , 11, , ' 1 I)
I
, , , , , , ,,, , , , , , , I ) I

F i g u r e 7 - 1 9 South Shore a ) Repor t ed Sludge , TSS Removed, and P r e d i c t e d Chemical S ludge v s . Year, b) R e p o r t e d P r imary Sludge v s . P r e d i c t e d Chemical S l u d g e . (0 = o x i d i z e d WPL, 1 = WPL)
solids- Produdion loo
0 79 ' 80 81 82 83 84 85 86 87
Year
Reported Primary Sludge, kp/day
100
I I , 1 I 1
0 20 40 Predded Chemical
Smle, wday

in chemical dose or phosphate loading, will be undetectable due to the
variation in total sludge production.
The following mass balance model was used to predict raw sludge
production in terms of solids removal and chemical sludge production:
RAW SLUDGE = (TSSIN - TSSOUT) + CHEMICAL SLUDGE (estimated)
Chemical sludge was estimated with Equations 2-3 through 2-5.
Figure 7-20 shows the sludge model residuals for the sludge model
plotted against the.predicted values and year. Clearly, the model is
lacking. The residuals were found to be random when plotted against
influent and effluent TSS, influent and effluent SP, predicted
chemical sludge, iron dose, flow and some limited grit removal data.
A linear trend similar to Figure 7-20a was observed when the residuals
were plotted against TSS removed. No explanation of this inadequacy is
offered.

Figure 7-20 South Shore Primary Sludge Model Residuals vs . a) Predicted Sludge, b) Year. (0 = oxidized WPL, 1 = WPL)
w Model Res'kbals 0
kip1day
-1 00 50 100 150 200
Predicted Sludge, kiplday
SCldge Model Residuals
0
KP'day
-100 79 80 81 82 83 84 85 86 87
Year

CHAPTER EIGHT: SOUTH SHORE REGRESSION ANALYSIS
8.1 SOLUBLE PHOSPHORUS REMOVAL
All possible combinations of the independent variables in the
following model were fitted to data for the periods of pre-oxidized
WPL addition (1/79 - 9/80) and oxidized WPL addition (10/80 - 2/87).
The results are summarized in Tables 8-1 and 8-2, and Figure 8-1 and
8-2.
dSP = bg + bl Fe + b2 SPI + b3 pH1 + bq Q
where dSP = Soluble Phosphorus Removed, mg/l
Fe = Iron Dose, mg/l
SPI = Influent Soluble Phosphorus, mg/l
pH1 = Raw Influent pH
Q = Flow, MGD
8.1.1 Pre-Oxidized WPL Addition
Iron dose (Model 1) explains considerable variation (Table 8-1).
Model 2, which has only SPI as an independent variable, indicates that
essentially 87% of the influent soluble phosphorus is removed.
Putting Fe and SPI into the model, to get Model 5, is not
statistically justified; the iron term dose not significantly improve
Model 2 (a= 95%) .
The estimated parameters of Model 5 are much different than those

Table 8-1 South Shore Pre-Oxidized WPL Addition, Regression Output for Equation 8-1.

Figure 8-1 South Shore Pre-Oxidized WPL Addition, RSS vs. Number of Model Terms (excluding bo) and Sequential F Values
, for Models in Table 8-1. Data labels represent model number.
MODEL TERM RSS ME Squmtirl F Value

T a b l e 8-2 South Shore Oxidized WPL Addition, Regression Output for Equation 8-1.
MDELI dSP a bO + b l h + b2 SPI + b3 pH1 + b4 0

Figure 8-2 South Shore Oxidized WPL Addition, RSS v s . Number o f Model Terms (excluding bo) and Sequential F Values
f o = Models i n Table 8-2. Data l a b e l s represent model number.
RSS HSE
e s t i m a t e d from t h e one v a r i a b l e Models 1 and 2 . I n models t h a t have
o n l y Fe t e rms , t h e v a l u e o f b l i s about 0 .1 . When SPI i s i n t h e model,
bl i s abou t 0 .03. These v a l u e s have no u s e f u l m e c h a n i s t i c
i n t e r p r e t a t i o n .
The i r o n d o s e c o e f f i c i e n t i n Model 1, bl=O.l , c o r r e s p o n d s t o an
Fe/Pc r a t i o of 5 . 5 [ ( I mg F e / 0 . 1 0 ) ( 3 0 . 9 7 / 5 5 . 8 5 ) = 5 .51 . T h i s i s
h i g h e r t h a n t h e s t o i c h i o m e t r i c r a t i o f o r t h e p r e c i p i t a t i o n o f
o r t h o p h o s p h a t e . The r a t i o may be i n f l a t e d because t h e t h e f e r r o u s
i r o n i n t h e WPL i s n o t f u l l y o x i d i z e d . The c o e f f i c i e n t b l = 0.029 of
Model 5 c o r r e s p o n d s t o a n Fe/Pc r a t i o o f 19 .1 , which i s unreasonab ly
h igh .
The e f f e c t s of c o l l i n e a r i t y (see F i g u r e s 7-9 a n d 7-10) make it
i m p o s s i b l e t o s e p a r a t e t h e e f f e c t s o f i r o n d o s e and i n i t i a l SP on
phosphorus removal. These models have no u t i l i t y f o r p r e d i c t i n g
o p e r a t i n g r e s u l t s .
8 .1 .2 Oxid ized WPL Addi t ion
Again c o l l i n e a r i t y between i r o n d o s e and SPI i s e v i d e n t when
Models 1, 2, and 5 a r e compared i n Tab le 8-2. The c o e f f i c i e n t s i n t h e
models have no u s e f u l m e c h a n i s t i c i n t e r p r e t a t i o n . The models
themse lves have no p r e d i c t i v e v a l u e .
8 .2 PRIMARY SLUDGE PRODUCTION
A l l p o s s i b l e combina t ions of t h e independen t v a r i a b l e s i n t h e

f o l l o w i n g model were f i t t e d t o d a t a f o r t h e p e r i o d s of p r e - o x i d i z e d
WPL a d d i t i o n (1/79 - 9/80) and o x i d i z e d WPL a d d i t i o n (10/80 - 2 / 8 7 ) .
SLUK = bo + bl dTSSK + b2 TSSIK + bg FeK + b 4 dSPK + bg Q
where SLUK = Primary Sludge Produc t ion , k i p / d a y
dTSSK = TSS Removed, k i p / d a y
TSSIK = I n f l u e n t TSS, k i p / d a y
FeK = I r o n Dose, k i p / d a y
dSPK = S o l u b l e Phosphorus Removed, k i p / d a y
Q = Flow, MGD
Regress ion o u t p u t f o r t h e two sets of d a t a a r e summarized i n Tab les
8-3 and 8-4.
8 . 2 . 1 Pre-Oxidized WPL Addi t ion
Model 1, which e x p l a i n s o n l y 34% of t h e v a r i a t i o n , h a s TSS removed
a s a u s e f u l p r e d i c t o r . Flow r a t e , Q, i s a l s o s i g n i f i c a n t i n a one
v a r i a b l e model. The n e g a t i v e f low t e r m s u g g e s t s t h a t less s l u d g e i s
produced a t h i g h e r f lows, which may r e f l e c t changes i n h y d r a u l i c
d e t e n t i o n t ime . I r o n dose and SP removal terms a r e i n s i g n i f i c a n t i n a l l models.
Model 9 has two v a r i a b l e s , f low and TSS removed. Again, t h e
c o e f f i c i e n t on f low i s n e g a t i v e . Model 12 i s s l i g h t l y b e t t e r ( h i g h e r
R2 and lower S) and u s e s i n f l u e n t TSS and Q . The r e l a t i v e importance
of Q i s l a r g e r i n Model 12 because t h e f low t e r m now a c c o u n t s f o r

Table 8-3 South Shore Pre-Oxidized WPL Addition, Regression Output for Equation 8-2.
HODEli SLUK * bO + b 1 dTS3K + b 2 TSSIK + b 3 F 1 + b 4 dSPK + b3 0

Table 8 - 3 , Continued.

Figure 8 - 3 South Shore Pre-Oxidized WPL Addition, RSS v s . Number o f Model Terms (excluding bo) and Sequential F Values
f o r Models i n Table 8 - 3 . Data l a b e l s represent model number.

Table 8-4 South Shore Oxidized WPL Addition, Regression Output for Equation 8-2 .
MODEL I SLUK . bO + b l dTfiBK + b2 TSSIK + b3 FcK + b4 dSPK + bS 0

Table 8 - 4 , Cont inued.

F i g u r e 8-4 South Shore Oxidized WPL Addi t ion , RSS v s . Number of Model Terms ( e x c l u d i n g bo) and S e q u e n t i a l F Values
f o r Models i n Tab le 8-4. Data l a b e l s r e p r e s e n t model number.
M TERM RSS HsE Sequrntial F Valuea

differences in solids removal.
8.2.2 Oxidized WPL Addition
Model 1, containing the single dTSSK term, is the best regression
in Table 8-4. It only explains 18% of the variation, but adding more
variables to the model does not significantly improve the prediction.
Iron dose and SP terms are insignificant in all models.
8.3 SUMMARY
The following conclusions are drawn based on the observations and
analyses presented in Chapters Seven and Eight:
1) The average Fe/Pc mole ratio of 2.32, and the relatively high
primary effluent SP values (Ave. = 0.8 mg/l) indicate that SP removal
occurred stoichiometrically during the period of oxidized WPL
addition.
2) NO useful causal relationship between SP removal and iron
dose was developed.
3) The fraction of estimated chemical sludge is small in
comparison to observed primary sludge production (19.7% by weight for
unoxidized WPL, and 6.7% by weight for oxidized WPL).
4) Multiple regression analyses indicated that changes in iron
dose and SP removal did not affect primary sludge production for the
periods of unoxidized and oxidized WPL addition.
CHAPTER NINE: JONES ISLAND WWTP
9.1 BACKGROUND
The Jones Island sewage treatment plant is located on the shore of
Lake Michigan at the harbor entrance to Milwaukee, Wisconsin. The
wastewater originates from industries, offices, and residential areas
in the eastern and northern portions of the Milwaukee Metropolitan
Sewerage District's (MMSD) 420 square mile service area.
In July 1979, the State of Wisconsin legislated a ban on phosphate
based detergents. This ban was repealed in July 1982. A second
detergent phosphate ban became law in January 1984.
9.2 PROCESS DESCRIPTION
The plant consists of a newer west plant, which treats
approximately 40% of the flow, and an original east plant, which
treats the remaining flow. Figure 9-1 is a schematic of the facility
prior to November 1986.
Prior to November 1986, the liquid process operation included
preliminary treatment (coarse screening, grit removal, and fine
screening), activated sludge, secondary clarification, and
chlorination. In November 1986, primary clarifiers replaced the
original pretreatment steps. High Lake Michigan lake levels in late
1986 forced the temporary abandonment of preliminary treatment.
In the original preliminary treatment configuration, debris solids
were landfilled or shipped to South Shore for incineration.

: & Y m
""I
Vacuum f i l t e r s a r e used t o dewater g r a v i t y th ickened waste
a c t i v a t e d s ludge. Heat d ry ing of dewatered s ludge i s t h e f i n a l s t e p i n
t h e product ion of Milorgani te , a revenue gene ra t i ng f e r t i l i z e r .
Chemical phosphorus removal i s accomplished by t h e a d d i t i o n of
i r o n a t two po in t s . I n t h e e a s t p l a n t , waste p i c k l e l i q u o r (WPL) i s
added t o t h e mixing channels ahead of a e r a t i o n . In t h e w e s t p l a n t ,
s ludge dewater ing f i l t r a t e i s recyc led t o t h e a e r a t i o n b a s i n s . F e r r i c
c h l o r i d e i s used f o r s ludge condi t ion ing . Addi t iona l i r o n e n t e r s t h e
w e s t p l a n t with waste a c t i v a t e d s ludge from t h e e a s t p l a n t .
9.3 OPERATIONS DATA
Operations records w e r e ob ta ined from an e x i s t i n g d a t a base a t t h e
Un ive r s i t y of Wisconsin-Madison. The d a t a base was expanded on two
t r i p s t o t h e f a c i l i t y i n September 1986 and March 1987.
9.4 RAW INFLUENT CONDITIONS
Figure 9-2 shows t h a t t h e i n f l u e n t flow t o t h e p l a n t has been
reasonably s t a t i o n a r y . (ave. = 131.1, S .D .= 15.8, n = 142) . Figures 9-3a,b and 9-4a,b show raw i n f l u e n t wastewater BOD and TSS
condi t ions i n terms of both concent ra t ion and mass load ing . Both BOD
and TSS decreased g radua l ly from 1975 t o 1981. S t a r t i n g i n l a t e 1982,
t h e r e was approximately one year of i nc reased va lues . Cor re l a t i on
c o e f f i c i e n t s on F igures 9-3d and 9-4d i n d i c a t e no s i g n i f i c a n t d i l u t i o n
e f f e c t .
Figures 9-5 through 9-7 show i n f l u e n t phosphorus d a t a . Soluble


Figure 9-3 Jones Island Raw Influent a) BOD Concentration, b) BOD Mass Loading, c) BOD Concentration vs. Mass Loading, d) BOD Concentration vs. Flow.
Raw Influent BOD, 300 m9'l
- 600
Raw l nfluent 300 BOD, kiplday
75 76 77 78 79 80 81 82 83 84 85 86 Year
80 140 200 Flow, Mgd
BOD, kiplday
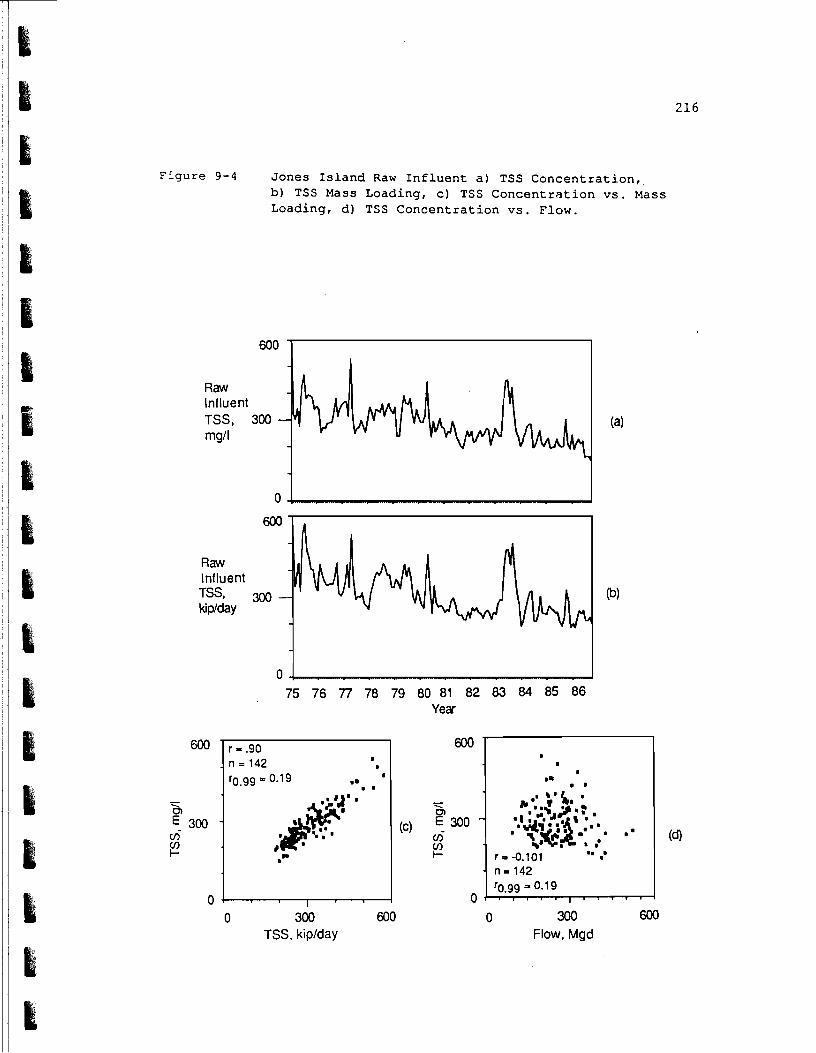
Figure 9-4 Jones I s l a n d Raw I n f l u e n t a) TSS C o n c e n t r a t i o n , , b) TSS Mass Loading, c ) TSS Concen t ra t ion vs. Mass Loading, d ) TSS Concen t ra t ion vs. Flow.
Raw Influent TSS, 300 - mgll
Raw Influent TSS, 300 @) kiptday
I 00 75 76 77 78 79 80 81 82 83 84 85 86
Year
0 300 a 0 0 300 600 TSS, kiplday Flow, Mgd

F i g u r e 9-5 J o n e s I s l a n d Raw I n f l u e n t a ) TP C o n c e n t r a t i o n , b) TP Mass Loading, c ) TP C o n c e n t r a t i o n v s . Mass Loading, d ) TP C o n c e n t r a t i o n v s . Flow.
Raw 1 a,
Year
. 0
r -0.85 10 '
8 ' n = 142 8 8
+ ::: . 8 ' : 8 8 r0.99 = 0.1 9
. a- I- 8% '
4 I- 8 . 8 8
r - -0.33 r n-142 r0.99 - 0.19
0 7 . a m . r - . - - 4 0 1 . . . . . , . . . . . 0 5 10 80 140 200
TP, kiplday Flow, Mgd

Figure 9-6 Jones Island Raw Influent a) SP Concentration, b) SP Mass Loading, c) SP Concentration vs. Mass Loading, d) SP Concentration vs. Flow.
- Screened Influent - s p, mgl
- -
Screened - Infbent -
SP, kP/day
1
75 76 77 78 79 80 81 82 83 84 85 86 Year
0 2 4 80 140 200
SP, kiplday Flow, Mgd

F i g u r e 9-7 Jones I s l a n d Raw I n f l u e n t a ) C a l c u l a t e d P a r t i c u l a t e Phosphorus Concen t ra t ion (TPI - S P I ) , b) C a l c u l a t e d P a r t i c u l a t e Phosphorus Mass Loading, c) C a l c u l a t e d P a r t i c u l a t e Phosphorus (TPI - SPI) Mass Loading v s . Suspended S o l i d s Mass Loading.
Raw Influent Part+, 4 - mg/l
Raw Influent Part-P, 4 . ki p/day
75 76 TI 78 79 80 81 82 83 84 85 86 Year
Raw Influent 4 _ Part-P, kiplday
Raw Influent TSS, kiplday
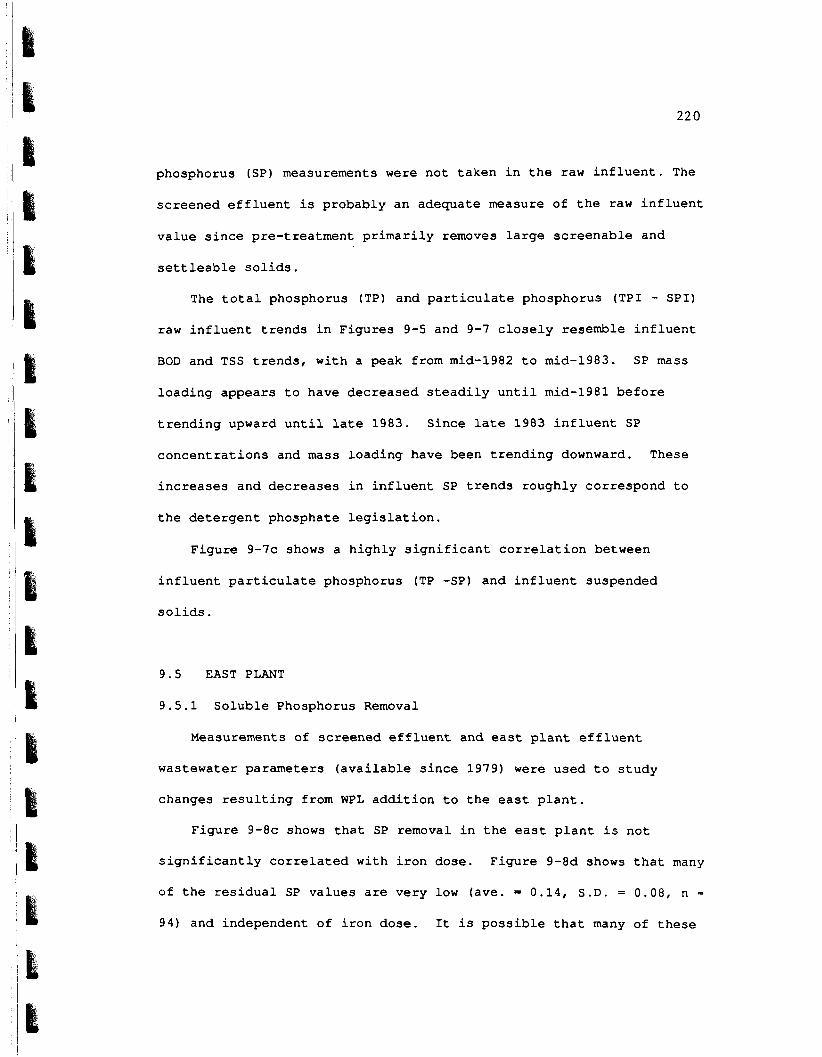
phosphorus (SP) measurements were n o t t a k e n i n t h e raw i n f l u e n t . The
s c r e e n e d e f f l u e n t i s p robab ly a n adequa te measure of t h e raw i n f l u e n t
v a l u e s i n c e p re - t r ea tment p r i m a r i l y removes l a r g e s c r e e n a b l e and
s e t t l e a b l e s o l i d s .
The t o t a l phosphorus (TP) and p a r t i c u l a t e phosphorus (TPI - SPI)
raw i n f l u e n t t r e n d s i n F i g u r e s 9-5 and 9-7 c l o s e l y resemble i n f l u e n t
BOD and TSS t r e n d s , w i t h a peak from mid-1982 t o mid-1983. SP mass
l o a d i n g a p p e a r s t o have d e c r e a s e d s t e a d i l y u n t i l mid-1981 b e f o r e
t r e n d i n g upward u n t i l l a t e 1983. S ince l a t e 1983 i n f l u e n t SP
c o n c e n t r a t i o n s and mass l o a d i n g have been t r e n d i n g downward. These
i n c r e a s e s and d e c r e a s e s i n i n f l u e n t SP t r e n d s rough ly c o r r e s p o n d t o
t h e d e t e r g e n t phosphate l e g i s l a t i o n .
F i g u r e 9-7c shows a h i g h l y s i g n i f i c a n t c o r r e l a t i o n between
i n f l u e n t p a r t i c u l a t e phosphorus (TP -SP) and i n f l u e n t suspended
s o l i d s .
9 .5 EAST PLANT
9 . 5 . 1 S o l u b l e Phosphorus Removal
Measurements of s c r e e n e d e f f l u e n t and e a s t p l a n t e f f l u e n t
wastewater pa ramete r s ( a v a i l a b l e s i n c e 1979) were u s e d t o s t u d y
changes r e s u l t i n g from WPL a d d i t i o n t o t h e e a s t p l a n t .
F i g u r e 9-8c shows t h a t SP removal i n t h e e a s t p l a n t i s n o t
s i g n i f i c a n t l y c o r r e l a t e d wi th i r o n dose . F i g u r e 9-8d shows t h a t many
of t h e r e s i d u a l SP v a l u e s a r e v e r y low ( a v e . = 0.14, S.D. = 0.08, n =
9 4 ) and independent o f i r o n dose . It is p o s s i b l e t h a t many of t h e s e

Figure 9-8 Jones I s land East Plant a ) Inf luent and Ef f luent SP v s . Year, b) Fe Dose and SP Removed (SPI - SPO) v s . Year, c ) SP Removed v s . Fe Dose, d) SP E f f l u e n t v s . Fe Dose.
1 Screened Effluent I
SP m 2
East Plant Effluent
79 80 81 82 83 84 05 86 Year
(a
0 10 20 0 10 20 Fe, ma1 Fe, mgll
4 . r - 0.19 11-94 r 0.99 - 0.24
I
d - 0)
0.45 '
& v,
P
I
, ' ' r-0.11 I n-94
r0.99 - 0.24
'I ' I
o l . - - - - w . . , I . . l - v - - - '
d
5 & V)
I
I!. .
, ,a!wi " I + ,I ' - 0 + . . m r . - . . q I v * q . T 7 * . w

v a l u e s a r e a t o r v e r y n e a r t h e s o l u b i l i t y l i m i t f o r o r thophospha te .
F i g u r e 9-9a shows t h e Fe/Pc mole r a t i o p l o t t e d a g a i n s t e a s t p l a n t
e f f l u e n t SP. SP removal a p p e a r s t o be b o t h s t o i c h i o m e t r i c and
non-s to ich iomet r i c . Th i s p a r t i a l l y e x p l a i n s why t h e r e l a t i o n s h i p i n
F i g u r e 9-8c is n o t l i n e a r . F i g u r e 9-9b i n d i c a t e s t h a t i n t h e e a r l y
1 9 8 0 ' s i r o n was added i n e x c e s s of t h e s t o i c h i o m e t r i c r equ i rement .
F i g u r e 9-10 shows e f f l u e n t SP d a t a p l o t t e d a g a i n s t f i n a l e f f l u e n t
pH. The t h e o r e t i c a l c u r v e was c a l c u l a t e d w i t h t h e model p r e s e n t e d i n
Chapter Two.
9 .5 .2 pH
Screened e f f l u e n t pH d a t a a r e a v a i l a b l e f o r 1983 t o t h e p r e s e n t .
Th i s s c r e e n e d v a l u e i s c o n s i s t e n t l y 0 . 1 pH u n i t h i g h e r t h a n t h e raw
i n f l u e n t pH. To make u s e of more d a t a , F i g u r e 9-11 shows raw i n f l u e n t
and f i n a l e f f l u e n t p H d a t a s i n c e 1979. The pH change i s i n t h e
e x p e c t e d d i r e c t i o n ( F i g u r e 9 - l l c ) .
9 . 5 . 3 B i o l o g i c a l Removal
F i g u r e s 9-12 shows t h a t SP removal is s i g n i f i c a n t l y c o r r e l a t e d
w i t h BOD removal, F/M r a t i o , a i r sewage r a t i o , and s l u d g e a g e .
I n c r e a s e d a e r a t i o n can promote b i o l o g i c a l growth and subsequen t
n u t r i e n t removal. T h i s may p a r t i a l l y e x p l a i n t h e r e l a t i o n s h i p s i n
F i g u r e s 9-12a and 9-12b. I n c r e a s e d s l u d g e a g e s t h e o r e t i c a l l y r e s u l t i n
lower s u b s t r a t e e f f l u e n t s , which may p a r t i a l l y e x p l a i n F i g u r e 9-12d.
BOD removal i s a measure of b i o l o g i c a l a c t i o n and s e t t l e d p a r t i c u l a t e

Figure 9-9 Jones I s land East Plant a ) Fe/Pc Mole Rat io v s .
SP Ef f luent b) Fe/Pc Mole Rat io v s . Year
( f o r P C = SPI - SPO).
FeIPc
Ratio
00 0 0.5 1
SP Effluent, mg/l
10
FeIPc Mole 5 (b) Ratio
0 79 80 81 82 83 84 85 86
Year

Figure 9-10 Jones Island East Plant a) Loglo Effluent Soluble
Phosphorus mol/l vs. Final Effluent pH. Note: See text for discussion on theoretical curve.
6 7 0 U
Effluent pH

F i g u r e 9 -11 Jones I s l a n d E a s t P l a n t a ) Raw I n f l u e n t and F i n a l E f f l u e n t pH v s . Year, b) I r o n Dose and pH Change v s . Year, c) pH Change v s Fe Dose, d ) F i n a l pH v s . Fe Dose.
7.8
Units 7.3
Raw Influent /
pH Standard
79 80 81 82 83 84 85 86 Year
0 10 20 Fe, mg/l
- C a 3 7 5 %
0 10 20 Fe, mgll
m mmmmm mm l m
I m
m I m
m m m

I . . . . . , . L o
0 L
I " ' CU
18 0
. c u * K J V ) 1 3 4

BOD, because pr imary c l a r i f i e r s a r e n o t used .
9 .5 .4 BOD, TSS, and TP
F i g u r e s 9-13 th rough 9-15 do n o t show any s t r o n g r e l a t i o n s h i p s
between i r o n dose and BOD, TSS, and TP removal o r t h e e f f l u e n t v a l u e s
of t h e s e pa ramete r s . F i g u r e s 9-14c and 9-15c i n d i c a t e t h a t TSS and TP
removal i n c r e a s e wi th i n c r e a s i n g i r o n d o s e . However, t h i s t r e n d may
be t h e r e s u l t of a t ime e f f e c t . Screened i n f l u e n t suspended s o l i d s
and TP have d e c r e a s e d o v e r most of t h e t i m e p e r i o d s t u d i e d and t h i s
c o i n c i d e s wi th d e c r e a s i n g i r o n d o s e s (Fe:TSSI, r = 0.29, n = 94, r 0 . 9 9
= 0.24; Fe:TPI, r - 0.38, n - 9 4 ) .
9 . 6 WEST PLANT
The q u a n t i t y of s o l u b l e i r o n i n t h e s l u d g e p r o c e s s i n g r e c y c l e t h a t
goes t o t h e w e s t p l a n t i s n o t measured, and w e s t p l a n t e f f l u e n t
measurements of phosphorus BOD and TSS a r e n o t t a k e n . Also, t h e
p r e c i p i t a t i o n p o t e n t i a l of i r o n i n s l u d g e wasted from t h e e a s t p l a n t
t o t h e w e s t i s unknown. For t h e s e reasons , t h e a n a l y s i s of west p l a n t
phosphorus removal i s based upon t h e f o l l o w i n g assumpt ions :
1) The amount of i r o n a v a i l a b l e f o r p r e c i p i t a t i o n i n t h e
c o n d i t i o n i n g r e c y c l e i s p r o p o r t i o n a l t o c o n d i t i o n i n g f e r r i c
c h l o r i d e use .
2) Mass b a l a n c e c a l c u l a t i o n s on wastewater f lows and pa ramete r
c o n c e n t r a t i o n s can be used t o e s t i m a t e w e s t p l a n t e f f l u e n t
c o n c e n t r a t i o n s of BOD, TSS, TP, and SP. Assume n e g l i g i b l e s l u d g e
Figure 9-13 Jones Island East Plant a) Influent and Effluent BOD vs. Year, b) BOD Removed and Fe Dose vs. Year, C) BOD Removed vs. Fe Dose, dl BOD Effluent vs . Fe Dose.
BOD, mq/l Screened Effluent
(a)
0 10 20 Fe, mgfl
., East Plant Effluent
0 0
79 80 81 82 83 84 85 86 Yea

Figure 9-14 Jones Island East Plant a) Influent and Effluent TSS vs. Year, b) TSS Removed and Fe Dose vs. Year, C ) TSS Removed vs. Fe Dose, d) TSS Effluent vs. Fe Dose.
5001 Screened Effluent
I TSS - mgll 250-u
1 East Plant Effluent I
79 80 81 82 83 84 85 86 Year
0 1 b 20 Fe, mg/l

Figure 9-15 Jones Island East Plant a) Influent and Effluent Total Phosphorus vs. Year, b) TP Removed and FeDose vs. Year, C ) TP Removed vs. Fe Dose, d) TP Effluent vs. Fe Dose.
Year
2 % 8 5 - Q) a a I-
0 10 20 0 Fe, mgfl
10 20 Fe, rngl
I
I s . ' . .. ' @ . I , " *, C . . ..# :; . + a
0 ' r 0.39 n - 94 r0.99 - 0.24
~ . . . . , . . . . , . . . . . . , . ,
- 2 - g 0 s .
(C) - 3 .e
is L I-
0
F-0. 08 . n=94 rO. 99=0.24
I I
# 'I I * '
. s f i : m ' I I - ..C(, * ,:;a b I a;.,~ .-? #
, . . , , , , . , , , , . , , . , , , , . ,
(a

flows.
3) The amount of iron added to the west plant from the east plant
waste sludge flow is either a) small in comparison to the amount
of iron available from conditioning, or b) a constant value, SO
that variation in SP removal will not be affected by this
contribution.
Data for ferric chloride use (FeC13 (lbs.)/dry ton sludge), waste
activated sludge flows, and sludge solids concentrations were used to
calculate FeC13 use in kips/day.
East plant and total process flow; and screened, east plant
effluent, and final effluent measurements of BOD, TSS, TP and SP were
used in a mass balance calculation to estimate weat plant effluent
BOD, TSS, TP, and SP.
Figure 9-16 shows the calculated data. Figure 9-16c reveals no
obvious relationship between conditioning iron use and SP removal in
the west plant. Figure 9-16d indicates that effluent SP concentration
decreases with increasing condition iron use, however the correlation
coefficient is insignificant at 99% confidence. Elimination of the
largest FeC13 value does not make the correlation significant.
Figure 9-17a is a plot of FeCl3/PC (mass/concentration) vs. the
estimated west plant effluent SP. The shape of the relationship is
very similar to Figure 2-3. At the low effluent SP concentrations the
ratio of iron to SP removed is relatively large, suggesting that
.non-stoichiometric precipitation may occasionally occur.

Figure 9-16 Jones I s l a n d West P l a n t a ) Screened E f f l u e n t and Es t imated E f f l u e n t SP, b) F e r r i c C h l o r i d e U s e i n Condi t ion ing and SP Removed, c ) SP Removed v s . FeC13 Use, d ) SP E f f l u e n t v s . FeC13 U s e . See t e x t f o r
d i s c u s s i o n on e s t i m a t e d v a l u e s .
0 79 80 81 82 83 04 85 86
Year
0- 4 . 1 - * . , - r 4
10 30 a 50 10 30 50 Conditioning FeCI3, kip/day Conditioning FeC1 3 , kiplday

Figure 9-17 Jones Island West Plant a) FeC13/Pc ratio for vs.
Effluent SP, b) FeC13/Pc ratio vs. Year.
(PC = SPI - SPO) Note: See text for discussion on
estimated values.
0 -0.1 0 0.5 1
Est. West Plant SP Effluent, mgll
0 79 80 81 82 83 84 85 86
Year


9.8 SUMMARY
The following conclusions can be drawn based from the preceding
analyses :
1) SP removal in the east plant activated sludge has been both
stoichiometric and non-stoichiometric.
2 ) Iron in the sludge dewatering recycle appears to cause both
stoichiometric and non-stoichiometric precipitation in the west plant.
3) No increase in sludge production related to the amount of
soluble phosphorus removed or the amount of iron added for phosphorus
precipitation could be detected.

CHAPTER TEN: CONCLUSIONS AND RECOMMENDATIONS
10.1 CONCLUSIONS
Operating da ta were s tudied t o eva lua te chemical phosphorus
p r e c i p i t a t i o n a t four sewage treatment p l a n t s . Rela t ionships between
wastewater condit ions (e .g. so luble phosphorus concent ra t ions , pH,
e t c . ) , chemical dose, and sludge production were examined graphica l ly ,
and with c o r r e l a t i o n and l i n e a r regress ion .
Conclusions s p e c i f i c t o each p l an t were given a t t h e end of t h e
appropr ia te chapters . For t h e r eade r ' s convenience, t hese a r e
r e i t e r a t e d here.
10.1.1 Blue P la ins Treatment Plant
1) The average Fe/Pc r a t i o does not accu ra t e ly cha rac te r i ze
primary SP removal ( e a s t and west p l a n t s ) because t h e r e seems t o be
per iods of t i m e when SP removal was s to ichiometr ic and o the r per iods
when it was non-stoichiometric.
2 ) Monthly average Fe/Pc r a t i o s show a downward t r e n d between the
i n i t i a t i o n of primary i ron dosing and t h e phosphate de tergent ban
approximately two years l a t e r . Therefore, any observed reduct ions in
chemical dose should not be a t t r i b u t e d e n t i r e l y t o t h e phosphate
de tergent ban. They resu l ted , a t l e a s t i n p a r t , from improved
p r e c i p i t a t i o n e f f i c i e n c y and p a r t l y t h e ban lowering phosphorus
loading.

f i n a l pH. Regress ion models were n o t h e l p f u l i n c h a r a c t e r i z i n g
secondary s o l u b l e phosphorus removal.
7 ) On average, t h e e s t i m a t e d ( s t o i c h i o m e t r i c ) chemica l s l u d g e was
27 p e r c e n t of t h e r e p o r t e d secondary s l u d g e . Large v a r i a t i o n s i n t h e
secondary s l u d g e p roduc t ion obscure t h e e f f e c t s of i r o n d o s i n g and SP
removal. Regress ion was n o t h e l p f u l i n r e l a t i n g t h e v a r i a b l e s t o
s l u d g e p r o d u c t i o n . Some v a r i a t i o n r e s u l t s from f l u c t u a t i o n s i n pr imary
e f f l u e n t q u a l i t y , which may b e r e l a t e d t o t h e p a t t e r n of i r o n d o s i n g
i n t h e p r imary b a s i n s , and t o t h e magnitude and compos i t ion of s l u d g e
t r e a t m e n t r e t u r n f l o w s .
1 0 . 1 . 2 P i sca taway Treatment P l a n t
1) It i s n o t p o s s i b l e t o make a q u a n t i t a t i v e assessment of t h e
e f f e c t of t h e phosphate d e t e r g e n t ban on alum requ i rements f o r
p r e c i p i t a t i o n i n t h e secondary t r e a t m e n t p r o c e s s . There is
i n s u f f i c i e n t phosphorus d a t a ( n i n e months w i t h b o t h i n f l u e n t and
e f f l u e n t s o l u b l e phosphorus d a t a ) t o c l a s s i f y t h e s t o i c h i o m e t r y of
aluminum phosphate p r e c i p i t a t i o n . A l u m u s e i n t h e secondary p l a n t had
been d e c r e a s e d s t e a d i l y o v e r a p e r i o d of t i m e . Over t h e same g e n e r a l
p e r i o d of t i m e , t h e u s e of l i m e f o r s l u d g e s t a b i l i z a t i o n w a s h igh
enough t h a t s l u d g e r e t u r n f lows r a i s e d t h e secondary p r o c e s s pH from a
t y p i c a l v a l u e of about 7 t o abou t 7.5; a l k a l i n i t y i n c r e a s e d
c o r r e s p o n d i n g l y .
2) Alum d o s i n g t o t h e n i t r i f i c a t i o n t r e a t m e n t p r o c e s s h a s been
consistently non-stoichiometric. Under these conditions, reducing
influent phosphorus concentration would not lead to savings in alum.
3) Phosphate removal in the secondary and tertiary treatment
processes cannot be usefully modeled by multiple linear regression.
10.1.3 South Shore Treatment Plant
1) The average Fe/Pc mole ratio of 2.32, and the relatively high
primary effluent SP values (Ave. = 0.8 mg/l) indicate that SP removal
occurred stoichiometrically during the period of oxidized WPL
addit ion.
2) No useful causal relationship between SP removal and iron
dose was developed.
3) The fraction of estimated chemical sludge is small in
comparison to observed primary sludge production (19.7% by weight for
unoxidized WPL, and 6.7% by weight for oxidized WPL) .
4) Multiple regression analyses indicated that changes in iron
dose and SP removal did not affect primary sludge production for the
periods of unoxidized and oxidized WPL addition.
10.1.4 Jones Island Treatment Plant
1) SP removal in the east plant activated sludge has been both
stoichiometric and non-stoichiometric.
2) Iron in the sludge dewatering recycle appears to cause both
stoichiometric and non-stoichiometric precipitation in the west plant.

3 ) No i n c r e a s e i n s l u d g e p r o d u c t i o n r e l a t e d t o t h e amount of
s o l u b l e phosphorus removed o r t h e amount of i r o n added f o r phosphorus
p r e c i p i t a t i o n c o u l d be d e t e c t e d .
1 0 . 1 . 5 Genera l Conclus ions
1) O p e r a t i n g d a t a can be used t o c l a s s i f y chemica l p r e c i p i t a t i o n
i n a p l a n t a s s t o i c h i o m e t r i c o r n o n s t o i c h i o m e t r i c . P l o t s of s o l u b l e
phosphorus removal v s . c a t i o n dose , and c a t i o n / P c mole r a t i o v s .
e f f l u e n t s o l u b l e phosphorus c o n c e n t r a t i o n a r e s i m i l a r t o t h o s e
o b t a i n e d i n c o n t r o l l e d e x p e r i m e n t a l work, though less c l e a r because of
t empora l changes i n i n i t i a l phosphorus c o n c e n t r a t i o n and o t h e r
v a r i a b l e s .
The c l a s s i f i c a t i o n is impor tan t i n terms of chemica l r equ i rement .
P l a n t s t h a t o p e r a t e i n t h e n o n - s t o i c h i o m e t r i c r e g i o n cannot be
e x p e c t e d t o n o t i c e p r o p o r t i o n a l r e d u c t i o n s i n chemica l dose i f
i n f l u e n t s o l u b l e phosphorus c o n c e n t r a t i o n s d e c r e a s e . S t o i c h i o m e t r i c
p r e c i p i t a t i o n p r o c e s s e s shou ld e x p e r i e n c e l i n e a r r e d u c t i o n s i n
chemical d o s e .
2) Q u a n t i t a t i v e r e l a t i o n s h i p s between chemical dose and s o l u b l e
phosphorus removal c o u l d n o t be developed wi th t h e l i n e a r r e g r e s s i o n
methods used, and no e s t i m a t e s of chemical s a v i n g s due t o phosphate
d e t e r g e n t bans a r e o f f e r e d . The f o l l o w i n g problems w e r e exper ienced ,
a ) c o l l i n e a r i t y between i r o n dose and i n f l u e n t s o l u b l e phosphorus
c o n c e n t r a t i o n ( e . g . South S h o r e ) , b ) s m a l l r anges of t h e o r e t i c a l l y

s i g n i f i c a n t p r e d i c t o r v a r i a b l e s ( e . g . e f f l u e n t pH), and c ) mixed
p r e c i p i t a t i o n mechanisms (Blue P l a i n s pr imary, t ime t r e n d from
n o n - s t o i c h i o m e t r i c p r e c i p i t a t i o n t o s t o i c h i o m e t r i c p r e c i p i t a t i o n ) .
3 ) The l i n e a r r e g r e s s i o n methods u s e d show t h a t changes i n
s o l u b l e phosphorus mass l o a d i n g have n o t r e s u l t e d i n d e t e c t a b l e
changes i n s l u d g e p roduc t ion a t South Shore and Blue P l a i n s . Th i s .2?
i n d i c a t e s t h a t phosphate d e t e r g e n t bans , by themse lves , have n o t
s i g n i f i c a n t l y reduced s l u d g e mass q u a n t i t i e s .
4 ) S t o i c h i o m e t r i c c a l c u l a t i o n s i n d i c a t e t h a t chemica l s l u d g e mass
q u a n t i t i e s a r e s m a l l i n comparison t o t h e r e p o r t e d s l u d g e q u a n t i t i e s
a t South Shore and Blue P l a i n s .
5 ) T h i s s t u d y h a s shown t h a t p r o c e s s v a r i a b l e s , such a s pH and
a l k a l i n i t y change, v a r y i n q u a l i t a t i v e p a t t e r n s t h a t a r e c o n s i s t e n t
w i t h t h e o r y .
6) Flow d i l u t i o n can cause s i g n i f i c a n t changes i n i n f l u e n t
wastewater s t r e n g t h a t Blue P l a i n s , South Shore, and P i sca taway .
Regress ion a n a l y s e s on t h e d a t a from Blue P l a i n s and South Shore
i n d i c a t e t h a t i n f l u e n t f low h a s a s i g n i f i c a n t impact on s o l u b l e
phosphorus removal. Flow may a f f e c t SP removal by p a r t i a l l y
d e t e r m i n i n g i n f l u e n t SP c o n c e n t r a t i o n .
10.2 RECOMMENDATIONS
Based on t h e above g e n e r a l c o n c l u s i o n s and a n a l y s e s p r e s e n t e d i n
t h i s r e p o r t , t h e f o l l o w i n g recommendations f o r f u r t h e r work can be
made .
1) Operating data from the Blue Plains secondary treatment
process should be compared with chemical model predictions of Jenkins
et al. (32), and Hermanowicz et al. (48) . 2) Chemical equilibrium models should be formed to account for
the use of waste pickle liquor and aluminum as precipitants. These
models should be verified in lab scale primary and biological
precipitation systems.
3) Full scale phosphorus precipitation should be studied under
experimentally designed conditions. The theoretically important
variables of final pH, initial alkalinity, and initial orthophosphate
concentration should be included in the design.
4) The computer data base at Blue Plains is extensive and the
records are freely available from the plant operators. Further
studies of wastewater treatment operations should use this resource.

13 . Diamadopoulos, Evangelos, and Andrew Benedek, "Aluminum Hydro lys i s E f f e c t s on Phosphorus Removal from Wastewaters ," J o u r n a l WPCF, Vol. 56, No. 11, November 1984, pp. 1165-1172.
1 4 . Diamadopoulos, Evangelos, and Andrew Benedek, "The P r e c i p i t a t i o n of Phosphorus From Wastewater th rough pH V a r i a t i o n i n t h e Presence and Absence of Coagulants ," Water Research (G.B.) , Vol. 18 , No. 9 , 1984, pp. 1175-1179.
1 5 . D i r e c t o , Leon S. , e t . a l . , "Phosphorus Removal by Chemical Addi t ion t o Secondary and T e r t i a r y Treatment Systems," P r o c . of t h e 2 9 t h I n d u s t r i a l Waste Conference, Purdue U n i v e r s i t y , L a f a y e t t e , Ind iana , 1972, pp. 369-387.
1 6 . Draper, N . R . and Smith, H . , #, John Wiley & Sons, N e w York, (1981) .
1 7 . E a r n e s t , Lawrence A. , "Milwaukee M e t r o p o l i t a n D i s t r i c t P l a n t S c a l e Exper ience With Phosphorus Removal 1970 - 1977 - J o n e s I s l a n d P l a n t , " p r e s e n t e d a t The S a n i t a r y Eng ineer ing I n s t i t u t e , Wastewater Treatment and Disposa l , U n i v e r s i t y o f Wisconsin - Extension, Madison, Wisconsin, March 2-3, 1978.
1 8 . Ferguson, John F. and Thomas King, "A ~ o d e l f o r Phosphate ~ r e c i p i t a t i o n , " J o u r n a l WPCF, Vol. 49, No. 4 , ~ p r i l 1977, pp. 646-658.
1 9 . Ferguson, John F . , e t . a l l "Calcium Phosphate P r e c i p i t a t i o n a t S l i g h t l y A l k a l i n e pH Values ," J o u r n a l WPCF, Vol. 45, No. 4 , A p r i l 1973, pp. 620-631.
20. Finch, G . R . , e t . a l . , "Laboratory Methodology f o r Opt imiz ing Phosphorus P r e c i p i t a t i o n , " P roc . of t h e ' I n t e r n a t i o n a l Conference on Management S t r a t e g i e s f o r Phosphorus i n t h e Environment, Lisbon, J u l y 1 - 4 , 1985.
21. F i n s t e i n , M.S., and Joseph V . Hunter, "Hydro lys i s of Condensed Phosphates During Aerobic ~ i o l o g i c a l Sewage Trea tment , " Water Research (G.B.) , Vol. 1, 1967, pp. 247-254.
22. Gannet Fleming Environmental Engineers , I n c . , "The E f f e c t of a Ban on Phosphates i n Household D e t e r g e n t s on t h e Treatment of Municiple Wastewater," Report p r e p a r e d f o r The Soap and De te rgen t A s s o c i a t i o n , February , 1985.
23. Geinopolos, Anthony and Frank I . Vi len , "Process E v a l u a t i o n - Phosphorus Removal, " J o u r n a l WPCF, Vol. 43, No. 10, October 1971, pp . 1979-1990.

24. Gleisberg, D., "Production, Dewaterability and Agricultural Suitability of Sludge Resulting from Chemical Wastewater Treatment," Proc. of the International Conference on Management Strategies for Phosphorus in the Environment, Lisbon, July 1-4, 1985.
25. Grinker, Joseph, "Process Change Results in Savings While Meeting Phosphorus Limits," Presented at The Central States Water Pollution Control Association, Inc., Annual Meeting, Bloomingdale, Illinois, May 20, 1982.
26. Hais, Alan B., et. al., "Alum Addition to Activated Sludge with Tertiary Solids Removal," EPA 670/2-73-037, August 1973.
27. Hartig, John H. and Frank J. Horvath, "A Preliminary Assessment of Michigan's Phosphorus Detergent Ban," Journal WPCF, Vol. 54, No. 2, February 1982, pp. 193-197.
28. Hell.enbrand, Kay A., Plant Engineer, Washington Suburban Sanitary Commission, Accokeek, MD, Personal Communication, November 1987.
29. Jacke, Robert, "Phosphate Ban Lowers Removal Costs," Water and Wastes Engineering, Vol. 16, No. 8, August 1979, pp. 33-35.
30. Jacobs, Donald S,, Senior Plant Superintendent, Washington Suburban Sanitary Commission, Accokeek, MD, Personal Communication, March 1987.
31. Jenkins, David and Associates, and James Engineering Inc., " A
Computer Model for Phosphate Precipitation with Alum and Ferric Chloride," Report submitted to The Soap and Detergent Association, November, 1984.
32. Jenkins, David, et. al., "The Development and Testing of a Model for Iron Phosphate Precipitation in Activated Sludge," Unpublished progress report submitted to The Soap and Detergent Association, September 1986.
33. Jenkins, David ,et. al., "Chemical Processes for Phosphate Removal," Water Research (G.B.), Vol. 5 , 1971, pp. 369-389.
34. Jenkins, David, personal communication, March, 1987.
35. Jones, E.R, "Phosphorus Removal with Iron Salts," presented at USEPA's International Seminar on Control of Nutrients in Municipal Wastewater, San Diego, CA. September 9-11, 1980.

Jones, E.R. et. al., "Phosphorus Removal Experiences at AWT Facilities," presented at the 1984 ASCE Environmental Engineering Conference, Los Angeles, CA. June 25-27, 1984.
Jones, E.R., " Bio-Chemical Phosphorus Removal - The Trials of Determining the Chemical of Choice," presented at the Pollution Control Association of Ontario's technical seminar, "Bridging the Gap between Research and Full Scale Operation in Wastewater Treatment," Canada Centre for Inland Waters, Burlington, Ontario, March 7, 1980.
Jones, E.R., and Susan D. Hubbard, "Maryland's Phosphate Ban - History and Early Results," Journal WPCF, Vol. 58, No. 8, August 1986, pp. 816-822.
Karlsson, Ingemar, "Chemical Phosphorus Removal in Combination with Biological Treatment," Proc. of the International Conference on Management Strategies for Phosphorus in the Environment, Lisbon, July 1-4, 1985.
Kavanaugh, Michael C., et. al., "Phosphorus Removal by Post-Precipitation with Fe(III)," Journal WPCF, Vol. 50, No.2, February 1978, pp. 216-233.
Kerecz, B.J., et. al., "Use of Spent Pickle Liquor to Remove Phosphates in Municipal Sewage Treatment Plants," presented at the 53rd Annual Conference of the Water Pollution Control Federation, Las Vegas, NV., October 1980.
Kirk, P.W.W., et. al., "Phosphorus Removal by Pre-Precipitation of Sewage; Metal Removal, Sludge Characteristics and Treatment Efficiency," Proc. of the International Conference on Management Strategies for Phosphorus Removal in the Environment, Lisbon, July 1-4, 1985.
Lan, J.C., et. al., " Phosphorus Removal in the Activated Sludge Process," Water Research (G.B.), Vol. 17, No. 9, 1983, pp. 1193-1200.
Leary, Ray D., et. al., "Phosphorus Removal using Waste Pickle Liquor," Journal WPCF, Vol. 46, No. 2, February 1974, pp. 284-300.
Levin, G.W., et. al., "Pilot Plant Tests for Phosphate Removal Processes," Discussion, Journal WPCF, Vol. 46, No. 2, February 1974, pp. 404-408.
Lijklema, Lambertus, "Interaction of Orthophosphate with Iron (111) and Aluminum Hydroxides," Environmental Science and Technology, Vol. 14, No. 5, May 1980, pp. 537-541.

Long, D . A . , and J . A . N e s b i t t , "Removal of S o l u b l e Phosphorus i n an A c t i v a t e d Sludge P l a n t , " J o u r n a l WPCF, Vol. 47, No. 1, January 1975, pp. 170-184.
Luedecke, C o r n e l i a , S.W. Hennanowicz, and David J e n k i n s , " F e r r i c Phosphate P r e c i p i t a t i o n i n A c t i v a t e d Sludge: Model V e r i f i c a t i o n , " P r e s e n t e d a t t h e WPCF 60th Annual Conference, P h i l a d e l p h i a , PA, October 5-8, 1987.
Maki, Alan W . , e t . a l . , "The Impact o f De te rgen t Phosphorus Bans on Receiving Water Q u a l i t y , " Water Research (G.B.) , Vol. 18, No. 7, 1984, pp. 893-903.
McNamee, P o r t e r , and Seeley, E n g i n e e r s / A r c h i t e c t s , Ann Arbor, M I , " R e t r o f i t t i n g POTWS f o r Phosphorus Removal i n t h e Chesapeake Bay Drainage Area," Second D r a f t Report , March 1987.
Metcalf & Eddy, I n c . , Hastewater Reuse, McGraw-Hill Book Company, N e w York, ( 1 9 7 9 ) .
Milbury, Will iam F., e t . a l . , "Operation o f Convent ional A c t i v a t e d Sludge f o r Maximum Phosphorus Removal," J o u r n a l WPCF, Vol. 43, No. 9, September 1971, pp. 1890 - 1901.
Minton, Gary R . , and Dale A . Carlson, "Combined Biological -Chemical Phosphorus Removal," J o u r n a l WPCF, Vol. 4 4 , No. 9, September 1972, pp. 1736-1755.
Mulbarger, M.C., "The Three Sludge System f o r Ni t rogen and Phosphorus Removal," EPA Document PB-213-778, A p r i l 1972.
Mulbarger, Michael C . , and Donald G . S h i f f l e t t , "Combined B i o l o g i c a l and Chemical Treatment f o r Phosphorus Removal," Chemical Engineer ing Progress Symposium S e r i e s - Water, Vol. 67, No. 107, 1970, pp. 107-116.
P a l l e s e n , Lars , e t . a l . , "Environmental I n t e r v e n t i o n A n a l y s i s : Wisconsin 's Ban on Phosphate D e t e r g e n t s , " Water Research ( G . B . ) , Vol. 19, No. 3, 1985, pp. 353-362.
P h i l i p , David, "Phosphorus Removal a t t h e Lower Molonglo Water Q u a l i t y Cont ro l Centre , " J o u r n a l WPCF, Vol. 57, No. 8, August 1985, pp. 8 4 1 - 8 4 6 .
Pieczonka, Pau l and N.E. Hopson, "Phosphorus De te rgen t Ban - How E f f e c t i v e ? , " Water and Sewage Works, Vol. 11, No. 7, J u l y 1974, pp. 52-55.

59 . Recht, H . L. , and M . Ghassemi, " K i n e t i c s and Mechanism of P r e c i p i t a t i o n and Nature of t h e P r e c i p i t a t e Obta ined i n Phosphate Removal from Wastewater Using A 1 (111) and Fe (111) S a l t s , l' F e d e r a l Water Q u a l i t y A d m i n i s t r a t i o n Repor t No. 17010 E K I , ( 1 9 7 0 ) .
60. Schmidtke, N.W. , " E s t i m a t i n g Sludge Q u a n t i t i e s a t Wastewater Treatment P l a n t s Using Meta l S a l t s t o P r e c i p i t a t e Phosphorus ," P roceed ings of t h e I n t e r n a t i o n a l Conference on Management S t r a t e g i e s f o r Phosphorus i n t h e Environment, Lisbon, J u l y 1985.
61 . Sonzogni, Wil l iam C., and Thomas M . Heidtke , " E f f e c t of I n f l u e n t Phosphorus Reduc t ions on G r e a t Lakes Sewage Treatment C o s t s , " AWRA Water Resources B u l l e t i n , Vol. 22, N o . 4 , August 1986, 623-627.
62 . Snoeyink, Vernon L. and J e n k i n s , David, W e r John Wiley & Sons, N e w York, (1980) .
63. Sturfm, Werner, and Morgan, James J . , C h e w , John Wiley & Sons, N e w York, (1981) .
64. Ulmgren, Lar s , "Swedish Exper i ences i n Chemical Treatment of Wastewater ," J o u r n a l WPCF, Vol. 47, N o . 4, A p r i l 1975, pp . 696-703.
65. U.S. Environmenta l P r o t e c t i o n Agency, "Phosphorus Removal," EPA/625/1-87/001 U.S. E.P.A. Water E n g i n e e r i n g Research Labora to ry , C i n c i n n a t i , Ohio, (1987) .
66. U.S. Environmenta l P r o t e c t i o n Agency, "Process Design Manual f o r Phosphours Removal," EPA 625/1-76-Oola, O f f i c e of Technology T r a n s f e r , Washington, D .C., A p r i l 1976.
67. U.S. Environmenta l P r o t e c t i o n Agency, " R e t r o f i t t i n g POTWs f o r Phosphorus Removal i n t h e Chesapeake Bay Dra inage B a s i n , " EPA/625/6-87/016, U.S. E.P.A. Water E n g i n e e r i n g Research Labora to ry , C i n c i n n a t i , Ohio, (1987) .
68. Veldkamp, R . G . , "Modeling Phosphate Sludge P r o d u c t i o n , " Water S c i e n c e and Technology, Vol. 17, No. 2&3, 1985, pp.107-119.
69 . V e s i l i n d , P. Aarne, -d D i s w s a l of Wastewater Sl-, Ann Arbor S c i e n c e P u b l i s h e r s , I n c . , Ann Arbor, M I , (1981) .
APPENDICES

APPENDIX A - NOTATION
A. 1 Variables
A systematic shorthand notation is used to identify variables.
Parameters are identified with a base notation. For example, soluble
phosphorus is SP. Appended to this base notation are letters
signifying whether the variable measures an influent (I) to or an
effluent (0) from a process. For example, TPI is influent total
phosphorus. A "K" is appended if the units are in kips/day. No
letters are appended if the units are mg/l concentrations. The prefix
"dm indicates a difference: the influent value minus the effluent.
For example, dTSSK represents the change in total suspended solids in
units of kipsiday.
ALK Total Alkalinity, as CaC03
BOD Five Day Biochemical Oxygen Demand
COD Chemical Oxygen Demand
Fe Iron dose, mg/l as Fe
Fe 3 Ferric Chloride dose, as Fe
GTOR Gravity Thickener Overflow Recycle
OSP Soluble Orthophosphate, as P
OX-WPL Oxidized Waste Pickle Liquor, as Fe
Pc Estimate of Chemically Precipitated Phosphorus
PH loglo (Hydrogen Ion Concentration mol/l)

Q Flow, MGD
TOC Total Organic Carbon
TP Total Phosphorus, as P
TSS Total Suspended Solids
SPBR Solids Processing Building Recycle
SP Soluble Phosphorus, as P
WPL Waste Pickle Liquor, as Fe
A.2 Statistical Terms
~ v e . Simple Average Value
F F Ratio, see Appendix C
Max Maximum Observed Value
Min Minimum Observed Value
N o r n Number of Observations
r Linear Correlation Coefficient
99 Linear Correlation Coefficient at 99% Confidence
95 Linear Correlation Coefficient at 95% Confidence
R~ or R2 Squared Multiple Correlation Coefficient
S Standard Error of Predicted Mean Value
S.D. Standard Deviation
S.E. Standard Error of the Mean Value

APPENDIX B - SENSITIVITY ANALYSIS
The f o l l o w i n g assumpt ions a r e made abou t Blue P l a i n s s o l u b l e
phosphorus c o n c e n t r a t i o n s a t p o i n t s where no d a t a e x i s t .
1) A s s u m e e see- v t o e- co-
Th i s w i l l be t r u e f o r d a t a a f t e r June 1985. S ince J u l y 1985
t h e g r a v i t y t h i c k e n e r over f low h a s been r e r o u t e d below t h e west
pr imary c l a r i f i e r s .
For t h e d a t a between January 1983 and June 1985 i n c l u s i v e ,
t h e s o l u b l e phosphorus c o n c e n t r a t i o n ahead of pr imary
c l a r i f i c a t i o n w i l l be impacted by t h e GTO. To test t h e
assumpt ion, t h e assumed SP v a l u e i s compared t o a c a l c u l a t e d va lue
based on a n e s t i m a t e of t h e SP/TP r a t i o i n t h e r e c y c l e s t r e a m . TP
is measured i n t h e r e c y c l e . The e s t i m a t e o f SP/TP w i l l range from
z e r o t o one. The primary i n f l u e n t i s e s t i m a t e d by performing a
mass ba lance on t h e s o l u b l e phosphorus a t t h e r e c y c l e r e e n t r y
p o i n t .
F i g u r e B-la shows t h e p e r c e n t d e v i a t i o n of t h e c a l c u l a t e d SP
c o n c e n t r a t i o n from t h e assumed v a l u e a s a f u n c t i o n of e s t i m a t e d
SP/TP r a t i o s i n t h e g r a v i t y t h i c k e n e r over f low. The f i g u r e s h o w s
t h a t i f t h e a c t u a l SP/TP r a t i o i n t h e r e c y c l e were between 0 % and
35% t h e n t h e assumed primary i n f l u e n t SP c o n c e n t r a t i o n would be i n
e r r o r a t most p l u s o r minus 10%.
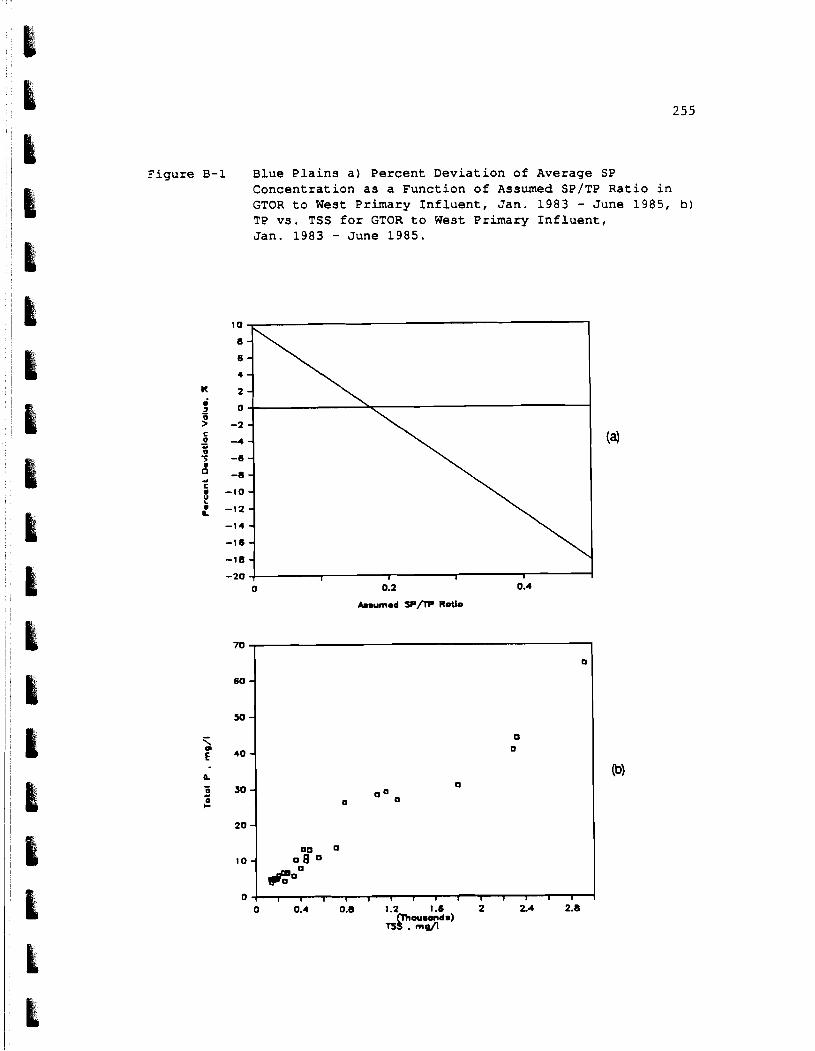
F i g u r e B-1 Blue P l a i n s a ) P e r c e n t D e v i a t i o n of Average SP Concen t ra t ion a s a Func t ion o f Assumed SP/TP R a t i o i n GTOR t o West Pr imary I n f l u e n t , Jan . 1983 - June 1985, b) TP v s . TSS f o r GTOR t o West Primary I n f l u e n t , J a n . 1983 - June 1985.

A p o s s i b l e e s t i m a t e of SP i n t h e GTOR would b e t h e same
c o n c e n t r a t i o n a s t h e secondary i n f l u e n t . T h i s would make t h e
average SP/TP r e c y c l e r a t i o 0 .67/14.7 = 0.045, y i e l d i n g an
u n d e r e s t i m a t e of i n f l u e n t SP of about 7 % . The 14 .7 v a l u e i s t h e
average TP i n t h e GTOR f o r t h e p e r i o d of t i m e when t h e r e c y c l e was
above t h e w e s t p r i m a r i e s .
F i g u r e B-lb shows t h e TP v s . TSS r e l a t i o n s h i p f o r t h e g r a v i t y
t h i c k e n e r overf low. Th i s r e l a t i o n s h i p s h o u l d s t r e n g t h e n a s t h e
r a t i o of SP t o TP d e c r e a s e s .
2) P r v w e s t y s o l u b l e h o s ~ h u
fr-v 1 9 8 3 throw June 1 9 8 5 a r e e a u a l t~
west s e c g
F i g u r e B-2a shows t h e p e r c e n t d e v i a t i o n of t h e c a l c u l a t e d
s o l u b l e c o n c e n t r a t i o n from t h e assumed c o n d i t i o n a s a f u n c t i o n of
assumed SP/TP r a t i o i n t h e s o l i d s p r o c e s s i n g b u i l d i n g r e c y c l e .
F i g u r e B-2b shows t h e TP t o TSS r e l a t i o n s h i p i n t h e SPBR
r e c y c l e .
3 s o l u b l e ~ h o s ~ h u
conce- t o the s e c m d a r y l n f l w t s o l u b l e
Th i s assumpt ion i s a f f e c t e d by t h e SPBR. F i g u r e B-3a shows
t h e s e n s i t i v i t y of t h e assumpt ion a s a f u n c t i o n of assumed SPiTP
r a t i o s i n t h e r e c y c l e .

Figure B-2 Blue Plains a) Percent Deviation of Average SP Concentration as a Function of Assumed SP/TP Ratio in SPBR to West Secondary Influent, Jan. 1983 - June 1985, b) TP vs. TSS for SPBR to West Secondary Influent, Jan 1983 - June 1985.
14
13 - 12 - I 1 - 10 -
5 0 - E a -
7 - 0 - 0 6 - - 2 s -
4 - I - 2 - 1 - 0
0
0
0
0
0
0 0 0''
0 0
0 O O O o 00
0 0
O O0o 0 0
I I I I I
100 300 500 7
TSS . mq/l

Figure B-3 Blue P l a i n s , Percent Deviation of Average SP Concentration a s a Function of Assumed SP/TP Ratios f o r a)SPBR t o East Primary Ef f luent , Jan. 1983 - March 1987, b) SPBR and GTOR Below the West Primary Ef f luent , June 1985 - March 1987.

4 1 ent soluble who-
e west seCgndprv lnfluent
for 1985 throuah March 1987.
In this case the quantity of SP in both the SPBR and GTOR are
unknown. Figure B-3b shows the sensitivity of the assumption as a
function of assumed SP/TP ratios in both recycle streams.

APPENDIX C - REGRESSION OUTPUT AND SEQUENTIAL F TABLE
Certain results from multiple regression analysis are summarized
in tables and figures Chapters Four and Eight. This appendix explains
the statistics that are reported in those tables and figures.
The regression output tables summarizes partial results of the
regression analysis. They contain:
(a) The parameter estimates for each of the possible models that can
be constructed from the specificed independent variables. The
complete model is referenced under the table title.
(b) The Student-t ratio (coefficient/standard deviation of
coefficient) for each estimated parameter is shown under the estimated
parameter value.
(c) The number of observations (n), the squared multiple correlation
coefficient ( R ~ ) , and the standard error of the estimated mean value
(S) are given for each regression.
The figure consists of a plot of the residual sum of squares (RSS)
for all the models plotted against the number of parameters in each
model. A similar plot of mean square error (MSE = RSS/U ) might have
been used. The plot is helpful in identifying model that have few

paramete r s and low RSS.
The f i g u r e a l s o c o n t a i n s a t a b l e of Model number, RSS, MSE, and
1 F V a m . For a d e t a i l e d e x p l a n a t i o n of t h e F v a l u e s t h e
r e a d e r is r e f e r r e d t o Draper and Smith ( 1 6 ) . A b r i e f e x p l a n a t i o n
f o l l o w s .
Given a m u l t i p l e l i n e a r r e g r e s s i o n w i t h k t e r m s , an F v a l u e can be
used t o t e s t t h e f o l l o w i n g h y p o t h e s i s :
Ho : q a d d i t i o n a l terms do n o t s t a t i s t i c a l l y improve a reduced
model of k t e rms .
H I : Otherwise .
The a p p r o p r i a t e F s t a t i s t i c i s computed from
F = [ (SSW - SSE) /q] / MSE
where SSW = RSS from reduced model of k t e rms .
SSE = RSS from f u l l model of k + q t e rms .
MSE = Mean s q u a r e e r r o r (s2) of f u l l model.
Th i s computed F s t a t i s t i c i s compared t h e t a b u l a t e d v a l u e of F f o r q
and n-p d e g r e e s of freedom , where n = number of o b s e r v a t i o n s and p =
number of e s t i m a t e d pa ramete r s i n t h e f u l l model.
The s e q u e n t i a l F v a l u e s p r e s e n t e d i n t h i s r e p o r t compare models
t h a t d i f f e r by t h e a d d i t i o n of o n l y one t e rm. Thus, f o r t h e a d d i t i o n
of a s i n g l e term, ~ 1 .
The t a b l e s of S e q u e n t i a l F v a l u e s i n t h i s r e p o r t a r e i n t e r p r e t e d
a s f o l l o w s . I n t h e example p r e s e n t a t i o n , F i g u r e C-1, t h e u n d e r l i n e d
row l is ts , r e a d i n g from l e f t t o r i g h t , F v a l u e s f o r t e s t i n g Model 4

against Models 1, 2, and 3, respectively. Model 4 has 3 parameters ( 2
"terms" plus the coefficient bo). Models 1, 2, and 3 have two
parametes. The double underlined row in Table C-1 gives the F values
for testing Model 7, a 4 parameter model, against Models 4, 5, and 6,
which have three parameters.
In order to use these F values to test whether adding the
additional parameter has significantly improved the fit of the model
one must know how many observations were used to fit the model. This
information is given in the "Regression Output Table."
Table C-1 Example F Table.