Embed Size (px)
Citation preview

THE UNIVERSITY 0? SYDNEY\
DEPARTMENT OF ARCHITECTURAL SCIENCE
AND
DEPARTMENT OF CIVIL ENGINEERING
"A STUDY OF CRACKING IN REINFORCED CONCRETE PRESSURE VESSELS USING
MICRO-CONCRETE MODELS”//
FOR A
NAS TER OF RUT] DING SCIENCE THESIS
SUBMITTED BY
APOLLO E.V/.K I-USOKE (B.Sc. Eng. (Hons), K.U.K.)
SYDNEY, JULY 1976
University of NAIROBI Library
SYNOPSIS
Reinforced. Concrete Pressure Vessels (and Reactor Vessels) are increasingly being built because of the great advantage provided by their massive walls for shield ng.
Cracking of these vessels may lead to the leakage of their containments - a situation that is very much undesirable, especially for safe environmental requirements.
New methods of analysis and design of these vessels, as well as experimental investigation using 'microconcrete' models, are necessary to prevent any excessive cracking leading to leakage.
This thesis has been prepared for this purpose.
A.E.V.M.

-5 i-
IKTHODU CTION
The 'Study of Cracking in Reinforced Concrete Pressure Vessels (RCFV's) Using Iiicro-Concrete Kodels' presented in this thesis, is largely a review of literature and theories of analysis and design for these vessels, given with practical applications.
In Chapters 1 and 2, problems associated with building 'direct' models with micro-concrete are discussed, and solutions sought - for RCFV's. The importance of a preliminary analytical mathematical model is emphasized, the results of which must be used during testing. Also instrumentation is given thorough investigation during the planning and design of the small scale model
Chapter 3 outlines in detail the stages followed in constructing the micro-concrete model at the Hydraulics Laboratory, Sydney University (1975~ 1976). The prototype reactor vessel on which the model is based is typical of the containment structures constructed for small scale experimental reactor vessels.
I spent some time planning and designing this model, for which 2 construction stages out of 6 were completed by the time of writing.
Chapter 4 discusses methods used to date, of analysing pressure vessels of reactor vessel complexity. The Finite Element method (FEft) analysis has proven most suitable and its application to RCFV's is discussed at some length
jIn Chapter 5» I have presented ideas on how the model should be tested,
and what results to expect based on previous work done in the field. One of the main purposes of the model is to simulate the 'structural integrity' and 'leakage rate' tests, outlined for the prototype in Chapter 6.
(Due to shortage of time and funds, it was not possible to construct completely and test the model for experimental conclusions. This will be done at some future date).
A.E.W.E.

rll.l-
DOTATION
a accelerationSubscript a for accident (as in P « accident pressure)
A areac specific heat
Subscript c(d
for concrete displacement)
D thermal diffusivityDBA Design Basis AccidentE Modulus of Elasticity(f stress)
f', F' compressive strengthh co-efficient of heat transfer
Subscript i for modelled quantityk thermal conductivity1 linear dimension
Subscript m for model .M momentK Kusselt's number
P, P pressurePCPV Prestressed Concrete Pressure VesselPGRV Prestres;ed Concrete Reactor Vessel *(<1 pressure)Q concentrated load
Subscript r for reinforcement/ RCPV Reinforced Concrete Pressure VesselRCRV Reinforced Concrete Reactor Vessel
Subscript s for steel, or shear -SBA Sr.all Break AccidentSSE Safe Shutdown Earthquaket time
Subscript t for concrete coverT temperature
Subscript u for ultimateU bond strength per unit lengthV velocity

-iv- .
w: crack widthW: line load
co-efficient of thermal expansion angular displacement displacement displacementstrain . /.scaling factor for quantity i ; t'|3/ l‘nntemperature dimension; temperature specific mass; (mass density) stress
"9 : -Poisson's Ratio
KEYWORDS
bond, concrete, cracking, creep, direct models, Finite Element Kethod (FEN), leakage, loading, mathematical models, micro-concrete, pressure vessels, similitude, shrinkage, strain-gauges, structural integrity, testing, thin shell, thick shell, thermal effects, thermocouples, through- cracks, yield lines.

CONTENTS FageSYNOPSIS
INTRODUCTION KOTAT1ON
CHAPTER 1 MODELLING WITH 'MICRO-CONCRETE'1.1 The Structural Model and its History------------------ 11.2 Types of Models-------------------------------------- 31.3 Scales of Models------------------------------------- 61. A Micro-Concrete--------------------------------------- 71.5 Reinforcement in Micro-Concrete Models ---------------- 81.6 Similitude Requirements ------------------------------ 91.7 Special Considerations ------------------------------- 1C
CHAPTER 2 MODELS FOR CONCRETE REACTOR VESSELS AND CONTAINMENTS2.1 Introduction (General) ------------------------------- 20
* 2.2 Loading Considerations in Design --------------------- 202.3 Model Design----------------------------------------- 222. C Model Loading Analysis ------------------------------- 2C2.5 Loading Systems-------------------------------------- 282.6 Instrumentation--------------------------------------’ 322.7 The FEM Analysis------------------------------------- 38
CHAPTER 3 CONSTRUCTION OF THE REINFORCED CONCRETE REACTOR VESSELMODEL
3.1 Planning and Design---------------------------------- CO3.2 Construction*and Construction Stages of the Model ---- 51
CHAPTER C THE ANALYSIS OF CONCRETE REACTOR VESSELS (PRESSURE VESSELS)C.1 Introduction------------------------------------------ 69C.2 Two and Three-Dimensional FEM Analyses--------------- 69C.3 The General Analytical Scheme for Cracking-------- -— 76C.C Elastic Analysis of the Entire RC Structure --------- 78C.5 Local Cracked - Concrete Analysis -------------------- 60C.6 The Analysis for a Specific Vessel ------------------- 83C.7 Results of the Three-Dimensional FEM Analysis -------- 91
CHAPTER 5 TESTING OF MODEL, AND EXFECTED RESULTS5.1 Introduction----------------------------------------- 955.2 Internal Pressure Tests----------------------------- 96'5.3 Creating Internal Heat-- ---------------------------- 995.C The Thermal Test------------------------------------- 995.5 A Simultaneous Thermal and Pressure Test------------- 100

5.6 Tciting To Failure-------------------------------- 1025.7 Expected Results of the Internal Pressure Tests---- 1025.0 Expected Results of the Thermal Test-------------- 105
CHAPTER 6 TESTING OF REACTOR VESSELS (PRESSURE VESSELS)6.1 Introduction-------------------------------------- 1116.2 General Preparations for the Tests--------------- 1116.3 The Equipment and Facilities---------------------- 1126. A The Tests----------------------------------------- 1136.5 The Structural Integrity Test--------------------- 1136.6 The Leakage Rate Test----------------------------- 11A
CHAPTER 7 DISCUSSIONS AND CONCLUSIONS7.1 Introduction--- ---------------------------------- 1167.2 Cracking in Reinforced Concrete Pressure Vessels
(RCPV's) - 1177.3 Models---- *-------------------------------------- 1207. A Construction and Testing of Micro-Concrete Models - 122
ACKMO’rfljKDCK'^To--------------------------------------------------------------------- -\25
REFERENCES___________________________________________ 126

CHAPTER 1.
MODELLING WITH 'MICRO-CONCRETE'1.1. The Structural Model and its History
A suggested definition of a structural model is as follows:- (Ref. 1.1)
"A structural model is any structural element or assembly of structural elements built to a reduced scale (compared to the full size structure) which is tested, and for which laws of similitude must be employed to interprete test results."
A structural model can be used as an aid in design, a check on theoretical analysis, a feasibility study tool, or as a guide to the actual behaviour of the structure which is otherwise unpredictable by theory.
As early as the 13th century, Domenico Fontana used lead to model the obelisk outside St. Peter's in Rome. Even before then, ancient Egyptian, Greek, Persian and Roman builders made models to assist themselves in planning structures and cities. Michelangelo, Leonardo da Vinci, and Galileo used models for architectural ideas and structural clarity.
However, it wasn't until the 13th to 19th centuries that structural modelling became an aid to analysis from the structural engineer's viewpoint. At this time, advances were made in the more accurate measurement of deformation.
The Howard Strain gauge of 1888, measuring to an accuracy of 0.0001 inches, was being used. The 'miniature compound- lever tensometer', developed by Huggenberger in the 1920's, was next in expanding the use of small scale models.
"Indirect" model techniques, also used to measure deflection and deformations, were developed by Begg, Goltshalk, Eney

and others using the Muller-Breslau's theorem. These techniques are however restricted to linear elastic problems where the principle of super position is directly applicable.
Three-dimensional model analysis made real progress only after the invention of bonded electric-resistance strain-gauges in the late 1930's. Photo-elastic techniques in modelling (for stress analysis) developed by such men as Mesnager, Coker and Filon, were first applied to 3 dimensional structures between 1938 and 1945 by Drucker, Mindlin, Hetenyi and others.
More recently, electric and mechanical analogues have been introduced in model techniques, the most recent being thecomputer.

1.2 Types of Model
Four broad types of model can be identified. These are:(a) Qualitative Models.(b) Indirect Models.(c) Direct Models.(d) Mathematical Models.
(a) Qualitative Models.These are models with scales usually smaller than 1/10;
normally ranging from scales of 1/20, 1/100 through to 1/500. (Beyond the 1/500 limit, most of the detail of the prototype is lost, hence the model can hardly be representative of the real structure.)
Such models are made normally to give the designer a 'feel'of how the structure is going to behave.
Also they are very useful in modelling multi-storeybuildings of great height - where detail of each storey is not asimportant as the overall behaviour of the large structure.
Small scale models are normally made of plastic materials(e.g. perspex), or thin pieces of steel or aluminium. The invest- , *igation is limited to linear elastic systems.
Sometimes these models are used to give a visual impression of stress distribution of bridges; or give an idea of deformed shapes of complex shells, domes, vaults, etc.; without direct analysis of results.(b) Indirect Models
It
These apply the principle of Muller-Breslau, mentioned in Section 1.1. The principle of super-position is applied to a linear elastic system. This creates an influence line characteristic of the model. The investigation is normally two-dimensional

Often severely distorted models ore used to determine distribution
of moments and forces. The technique is obviously 'indirect'.
Begg's 'deformeter' at Princeton University in 1922 pioneered
the use of these models.
The use of this type of elastic model is being phased out
due to the ease of computer results.
Indirect models tend to be 'qualitative'. They cannot be
used for investigations dealing with 'micro-concrete'.
( c) Direct Models
These models are built with the aim to simulate a complete
structural elastic and post-elastic (inelastic) behaviour through
to failure. In the case of concrete, a 'micro-concrete' that will
reveal information on phenomena like cracking, creep, bond, shrinkage,
thermal capacity and gradient, etc., is. required for such models.
The results are then got directly from measurements on the three-
dimensional scaled-down structure.
In order to get appreciable, quantitative measurements, scales
are seldom less than 1/10 (1/20 is normally the lower limit).
Full scale models are somtimes used.
Direct models used to analyse columns, beams or similar con
crete structural elements, tend to be restricted to a 1/8 scale.
With larger structures like dams, reactor vessels, or large complex
hyperbolic domes or similar shapes, the scale is extended to 1/10
or 1/12. It must be born in mind that cracking similitude is worsened
by use of a smaller model.
Sometimes direct models are used for feasibility studies of
complex structures (cf. Le Corbusier's prestressed concrete Phillip's
Pavillion at Brussels, 1958).
Direct measurements of strain, temperature, force, acceleration,%
Etc., may be made on these models.

These are the models employed in modelling with•micro-concrete'.(d) Mathematical Models
An idealisation of material properties and topology of structure creates a 'deterministic model' of that structure. If that idealisation can be analysed mathematically (e.g. by solution of compatibility or flexibility equations), then a 'mathematical model' of that structure has been identified.
Such an analysis is normally carried out by computer.Computer programs for this purpose have been developed - some general, some specific to particular structures.
The Finite Difference or Finite Element Methods have been developed to analyse structural systems as mathematical models.
Results from the other types of models (previously discussed) are normally compared with those of the mathematical model. This helps to confirm theory^ or otherwise point out weak areas in the theoretical analysis.
Now that the Finite Element Method (FEM) of analysis is very widely used, models are being built in Japan, USA and Europe to determine the adequacy and relative accuracy of this method - amongst other aims.
The future sees the use of 'probablistic' models as an aid ln design. Such models, unlike the 'deterministic' ones, create mathematical idealisation based on probability laws for material properties and topology of structures.

1.3 Scales of Models
Purpose of model dictates choice of its scale. Other factors that are considered with purpose are: cost, space requirements, ease of fabrication, materials available, importance of detail, minimum thicknesses, time of construction, etc. Whenever practicable, the full scale should be considered, since the best scale is the full scale.
In modelling with 'micro-concrete', for instance, direct models of relatively 'larger' scales must be used if phenomena like cracking, shrinkage, creep, bonding, etc. are to be investigated. Furthermore, reinforcing bars of a diameter less than 1 mm are not practical. Scales of 1/10, 1/8, 1/6, 1/2 or full scale, are best suited for this type of modelling. Only in rare circumstances is one forced to limiting scales of 1/12, say (see Chapter 3).
On the other hand, when modelling a 200 m multi-storey building, a scale should be chosen such that the model can be housed in a laboratory for testing and instrumentation. A scale of 1/50 to 1/100 would have to be chosen, for 2 m to 4 m is a suitable height to work on.
//

1.4 Micro-Concrete
Concrete, shows not only non-linear deformation under load, it also has well-known marked differences in tensile and compressive strength. Creep, shrinkage, cracking complicate the picture further. Bonding with steel bars is also essential for. strength. In order to investigate these phenomena, a concrete with aggregate particle size, sand particle size and reinforcing bars size (or area), all scaled down, is required. Such a material is called micro-concrete. The laws of similitude must be followed for meaningful results.
Micro-concrete is sometimes referred to as mortar (since it is normally made of water, sand and cement).
Successful attempts to simulate concrete with high strength gypsum plaster have also been advanced (ref. 1.2 ). In this case the 'micro-concrete' takes such a form.

X.5 ReinforcGment in Micro-Concrete Models
Small size steel wires are used for this purpose. Sometimes, annealed small size threaded steel rods are needed to satisfy special requirements. Stress-strain relationships are shown below for concrete and reinforcing steel.
CONCRETE REINFORCEMENT
(0
p - prototype m - model
F i Q . 1 . 1 Stress-strain relationships for micro-concrete and reinforcerncnt

Fig. 1.1 (a) and (b) show a 'micro-concrete' reinforced
with small size steel wires, with similitude laws strictly observed (i.e. no 'distortion'). This is done by careful mortar design, and choice of suitable steel wires.
The mortars shown in Fig. 1.1 (c) and (e) are made of high strength gypsum plaster and sand mixes, where the requirement is
The corresponding reinforcement modelling, Fig. 1.1 (d) and (f) is achieved by carefully annealing small size threaded steel rods. Fig. 1.1 (a) and (b) are seldom encountered; normally modelling takes the form of Fig. 1.1 (e) and (f).
Bonding and cracking create greater problems. Generally, for underreinforced members, the yield point of steel must be properly modelled whereas the exact modelling of concrete is not necessary. For overreinforced members, however, exact modelling of concrete properties, including its ultimate strength and strain is essential, while similitude requirements for the steel can be relaxed. 'Balanced' structural members require 'balanced' modelling. These problems are discussed in more detail in Section 1.7.
to have the stress and strain scales distorted.
b
f

1.6
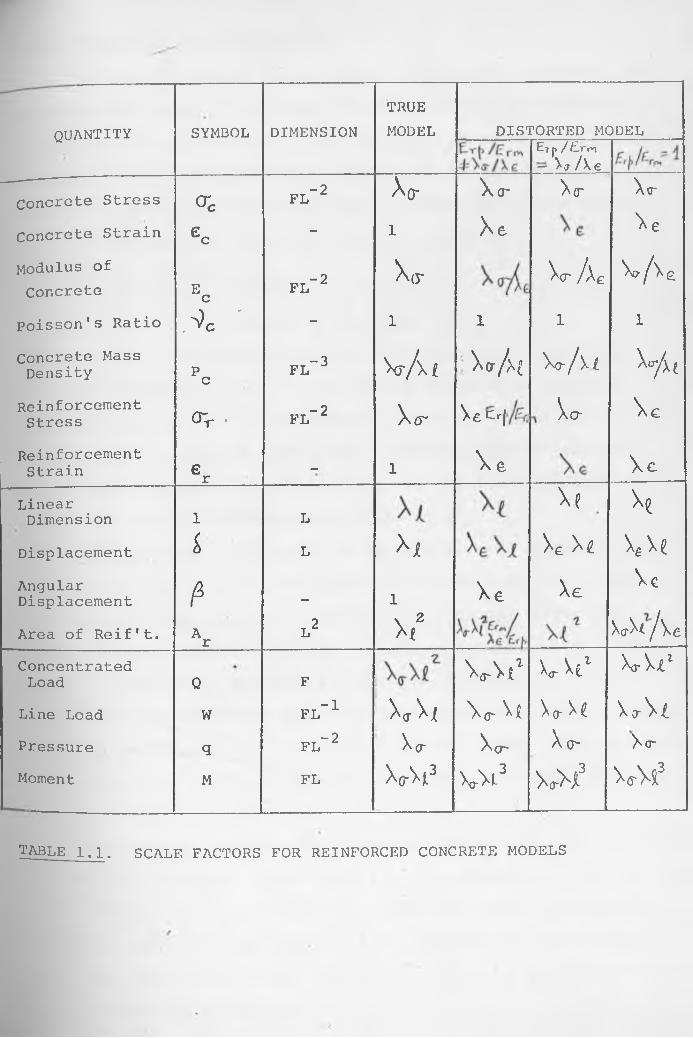
For a model to represent the prototype, similitude 'laws'
or requirements must be applied during model design. These re
quirements are summarised in Table 1.1, below, (for RC models).
The scale factor ' X l ' is defined (in this thesis) as the multiplier
required to convert the model quantity ' {m ' to the corresponding
prototype quantity ' £ j, ' or:-
S imilitude Requirements (for Direct Models)
\
In
quirements
the context of modelling with micro-concrete, these re-
have been restricted to 'direct' models (see Section 1.2 (c).
/i
/
TRUEquantity SYMBOL DIMENSION MODEL DISTORTED MODEL
ET(> /E.r<*\— Xa/X e
Concrete Stress CTc FL-2 Xq- \(T X(T \<rv
Concrete Strain £c - 1 X e Xe
Modulus of Concrete Ec FL-2 X<r Xcr j\c X/ /Xe.
Poisson's Ratio A ' - i 1 1 l
Concrete Mass Density Pc FL-3 \r/\£ Xcr/x£ \o- / \ t tyxi
ReinforcementStress crr . FL-2 X<r Xd trf Vo- X e
Reinforcement V e X cStrain er — l
LinearDimension 1 L
Xe Xe
Displacement i L Xi Xc Xe Xe Xe
AngularDisplacement P — l X e Xe Xc
XtfX* y/XdArea of Reif't. Ar L2 X /ConcentratedLoad Q F wwL V t 1 XrVt1
Line Load W FL"1 X<r X/ \o- Xe Xo- N£ X cr X|
Pressure q FL-2 Xcr X(7~ X O'- Xcr
Moment M FL XcrVjL3 VVt-3 WH3 Va-Vi3
TABLE 1.1. SCALE FACTORS FOR REINFORCED CONCRETE MODELS

In order to model the behaviour of concrete structure, the stress-strain curve of the model material must be geometrically
1 6.1 Materials Similitude
all levels of stress and strain. Fig. l.L(a) - (f) shows such curves for reinforced micro-concrete. In some cases, the moduli of elasticity for the reinforcement are related thus:
In the former, the stress scale for steel must equal the strain scale for concrete ( \(Tr = ^ £ c ), if the model is to properly simulate the prototype yield condition (see Fig. 1.1(c) and (d). In the latter, the steel and concrete stresses must be modelled by different factors— (Fig. 1.1(e) and (f) ) . This of course affects the area of reinforcement in the model.
restrictive. It is fully satisfied only if the model and prototype materials are identical. Fortunately, for one-dimensional analysis where flexural and axial stiffness predominates, this is not so important. However, for two and three-dimensional structural elements, where shear and torsion are important, serious errors may result if this condition is not met. The solution would be to pick out a 'critical' element, and build and test it at-full
Mass density scaling ( ,) is only important if the dead load
similar to that of concrete. X Q- and must be constant for
Erp/Erm = 1: in othersErp/Erm j*
The required A of unity for Poisson's ratio tends to be
scale.
stresses are important. From Table 1.1,
impossible, and if it is; important it is obviated by additional, artificial distributed loads. However, if \^-= X^ by design, then
This is usually practically
c ' 1' solving the problem.

1.6.2 Geometry Similitude
Geometric similarity demands that all linear dimensions of the model be scaled down from the corresponding prototype ones by a constant ratio. Practical limitations exclude certain structural details. Also the scaling down of fine aggregates, cement particles and steel deformation is impossible. Fortunately, such minute details do not cause serious problems provided the material properties similitude is adhered to.
The effect of specimen size on strength is well known. The strength and the mode of failure vary as the size of test specimen varies. However, this factor is of importance with scales much less than 1/10; and thelse are seldom with micro-concrete models.
Displacement and deformation are of linear scaling and are accurately simulated until large deformations that cause change in geometry occur. As seen in the Table 1.1, V^ ; nowX £ is normally unity so that = \ ; but when there is serious change in geometry, is no longer unity. The solution is todesign a distorted model with \,i slightly less than unity.1.6.3 Loading Similitude
To simulate an*applied force satisfactorily, not only the magnitude, but the distribution must be properly scaled. Concentrated loads are easy to apply, but distributed loads may need vacuum or hydrostatic pressure to set up.
From the Table 1.6 we note that loading similitude ( ) is independent o| \ q . Moreover, if > > 1 and 'Xcr >■ 1, the model load would be very much reduced (since This is why small scale models have rather simplified loadingsystems.

1.7.1 BondCertain aspects of behaviour of reinforced concrete is
attributed wholly or very strongly to the bond between reinforcement and concrete.These are :
(i) Complete bond failure due to fatigue loading;(ii) Progressive destruction of bond caused by loading;(iii) Combined failure modes that include bond failure;(iv) Transfer of prestress in pretensioned concrete;(v) Cracking behaviour in size, extent and growth of cracks.
The basic similitude requirement for bond is that bond stresses developed by model reinforcement be identical to those of the prototype reinforcement. Also the ultimate bond strength of model and prototype should be identical; this implies that \(T= 1. Scale of model is important here. For smaller models, one is forced to use rusted, deformed or threaded wires or stranded cables (for prestressed models).
Knowledge of the bond mechanism in concrete is limited.The ACI Code (1970) gives the ultimate bond strength per inch of bar length as :
Uu = 30 2500D (psi units)(standard notation).
This expression is derived from tests on prototype concrete observations. It would be in error if used for modelling. How- ever, the difficulty may be obviated by providing model steel which will duplicate the local bond behaviour of the prototype. Iternatively, if knowledge of model reinforcement bond behaviour s available, then the required bond strength can be modelled by
Proper choice of number and size of bars. This provides the
1.7 Special Considerations

required total bond strength. This alternative should be preferred If the bond behaviour of both prototype and model are available.
'Pull out' experimental tests on reinforced micro-concrete specimens are used to indicate the best type ; of reinforcement to te used.1.7.2 Cracking Similitude
"Modelling of ctacking behaviour is just as difficult as the modelling of bond; the two are intimately related phenomena" (Ref. 1.1). The inelastic load deflection response of an RC structure depends on the degree of cracking. Similitude is insured only if crack width and spacing are scaled linearly by
. This simple requirement is far from easy to achieve. Not only does it require that = 1, it also requires that the modelsteel bond properties are exactly adequate. Higher tensile strength of model concrete initiates cracking at a high load levels, this affecting the deflection response. If bond properties are inadequate, relatively wider cracks, less in number, will result. Furthermore, Broms and Lutz (1965) showed that crack spacing is almost directly proportional to effective side cover of concrete.It hasn't been shown whether this is true in models, with small covers.
The best one can get to modelling cracking adequately is by using as large a model as possible. In 'direct' modelling where this factor is important, cracking similitude may dictate the scale.

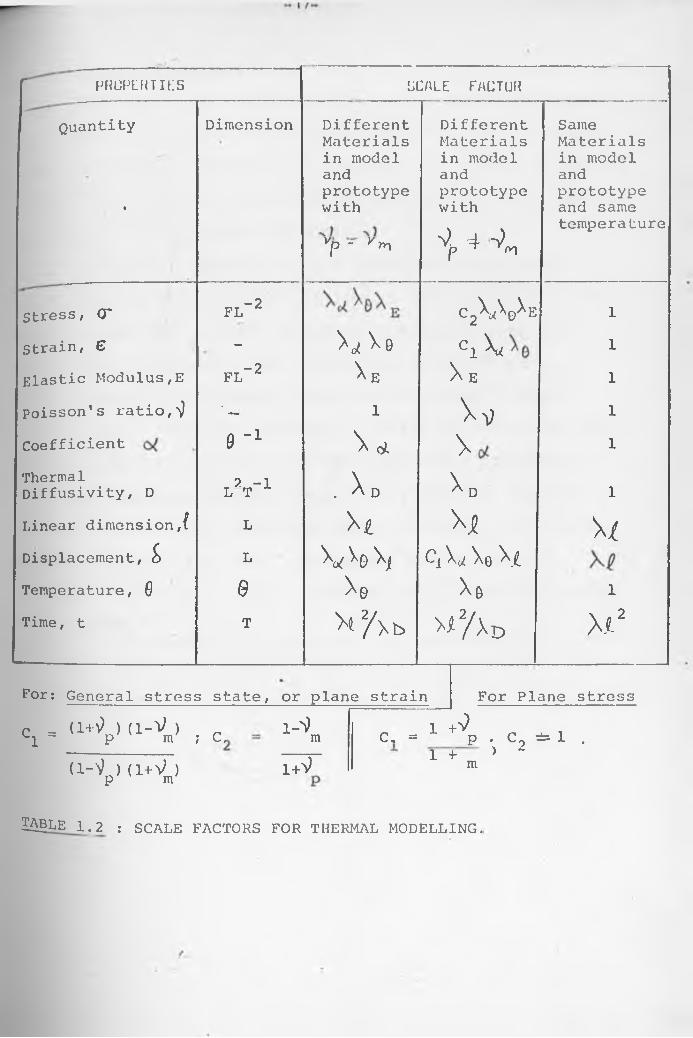
Here, both temperature and thermal properties must be mutually considered. The common thermal properties are coefficient of Thermal Expansion c£ , Specific Heat c, Thermal Conductivity k and Coefficient of heat transfer h. When modelling^these properties are best treated collectively, combining some or all at once. Examples are treating the Thermal Diffusivity,
D = K/cp - mass density) for massive dams; or application of the Nusselt's number for surface heat considerations
N = hl/k (1 - linear length).These quantities should be the same for both model and prototype.
The four principal dimensions involved here are : F, L, T and 9 . Table 1.2 shows the significant quantities required,unique to thermal modelling. A problem that requires more than these four dimensions demands distortion.
When the Poisson's ratio, V , are unequal in model and prototype, special similitude relationships for a general stress state or a state of plane strain; and for a state of plane stress, are used (Hovanesian and Kowalski, 1967). The strain scale, then
* i 2depends on 6 and ; and /\ is proportional to ( ) . Thismeans that long term thermal effects can be modelled for greatly reduced time.
i
In choosing a material for thermal modelling, it is import- • ant to ensure that thermal and elastic properties do not change with temperature. Mortars should therefore have a higher preferrance to plastics and metals, in that regard.
1.7.3 Thermal Modelling
I* P R O P E R T I E S S C A L E F A C T U R
Quantity Dimension Different Different SameMaterials Materials Materialsin model in model in modeland and andprototype prototype prototype
t with with and same
vf> - v ry\ V 4 -0 p + Vltemperature
Stress, (T f l"2 c 2W ^ e 1S t r a i n , E - \ j,\e C1 \i 1E l a s t i c Modulus,E FL-2 X E X E 1Poisson's ratio,^ ' — 1 \ v 1Coefficient 0 - 1 X of X 1Thermal 2 -1 \ x DDiffusivity, D L T 1 . A D 1Linear dimension,( L X * Xji \ {
Displacement, & L V 0 \ Pi X,/ \ q X/Temperature, 0 0 X© X& 1Time, t T x i 2A b >*2A d X.t2
For: General stress state, or plane strainc = (1+9 J (1 -V ) #l P m ; C,
1-S)m(1-V ) (i+V )p m l W
For Plane stress
C, = 1 +^p . C0 ** 1 . 1 + ) '2m
2^§LE1^2 : SCALE FACTORS FOR THERMAL MODELLING.

In this regard, modelling time is an important factor.The common time dependant effects in concrete structures are creep/ shrinkage, relaxation of prestress and vibration loading. However, these are no where near as important as ground motion due to earthquake or dynamic loadings.
Similitude requirements for earthquake response of structures are listed in Table 1.3* F; L and T are the fundamental dimensions. Again, when more than these three are needed for a particular case, distortion is inevitable.
Simulation of random displacements creates a major problem here. Sine wave vibrations and impacts have been used to approximate the effects, but these are still inadequate.
Furthermore, material properties vary under dynamic loading. Strain-rate affects ultimate strength, yield point, modulus of elasticity, etc. Structural damping affects structural behaviour. These phenomena are to date not clearly investigated.
y \ Dynamic Modelling

Quantity Dimension Scale Factor
• (No distortion)
Geometry, l L \()
Spec, mass, p 1
-4 2 FL T YModulus, E
CM.1Cm
Acceleration, a lt“2Velocity, V lt“ 1Force, Q Time, t
FT \ / / v x e "
Stress, CT; pressure, ^ PL"2 ■ X e
Strain, G - 1Displacement, LFrequency, f T~ 1 ((xe/y ')/X^ •Poisson's ratio, 1
TABLE 1.3 : SCALE FACTORS FOR DYNAMIC (EARTHQUAKE) STRUCTURAL RESPONSE
I

-20-
CHAPTER 2
^nPELS FUR CONCRETE REACTOR VESSELS AND CONTAINMENTS
2.1 Introduction (General)
In thia chapter, two main types of reactor vessel models will be
discussed: models for prestressed concrete reactor vessels (PERU) and
those for reinforced concrete reactor vessels (RCRV). In this context
these vessels may be referred to as "pressure" vessels from time to
time. (The abbreviations then become PCPV and RCPV).i
Typical PCRl/'s are prestressed with thousands of hoop, head and
longitudinal post tensioning elements to resist internal pressure. Mild
steel deformed bars are used. Sometimes vessel cavities are lined with
thin, leak tight steel plates. Interior temperatures for a reactor
vessel may reach 95°C under normal operating conditions. A large number
- of penetrations for refuelling ere made through the thick, heavy walls.
(Fig. 2.0 shows such penetrations). The combination of prestressing,
reinforcement and penetration hardware makes some areas of the vessel
very congested; this forces use of concrete with aggregate size no more* *than 25mm, normally.
2.2 Loading Considerations in Des\qn
Loading conditions that are considered in analysis and design
include:-
(a) Dead load; induced strains and stresses during construction
(b) Prestress
(c) Isothermal pressurisation, cycling, creep and shrinkage und
mechanical loading.
(d) Overpressure leading to extensive vessel cracking.
(e) Overpressure leading to ultimate loading.
(f) Combined thermal and pressurising cycling.

Pig 2.0 Layout of a Typical Reactor Vessel

(g) Thermal creep and shrinkage.
(h) Earthquake (Ground motion).
(i) Combinations of above loads.
Basically, a model for any reactor vessel must be representative
0f the principal features of the prototype, and must be as simple as
possible.
An example is a model tested at Dak Ridge National Laboratory in
the United States, later adopted by the PCPV- Research and Development
Group, Kajima Corporation, Japan in March, 1973. The model mas a/hollom cylinder with both ends sealed by slabs and six pilasters located
along the outer surface of the cylinder. 57 tendons prestressed the
model. Here, the bottom slab mas replaced by a thick steel plate mith
the same stiffness as the concrete slab. This replacement enabled
instrumentation on the inner surface of the model, and observation of
cracks became possible. Simple and representative.
I mill now present features peculiar to modelling of a 'typical'
reactor vessel. Apart from the prestressing element, the features are
equally applicable to both PCRV's and RCRV's. It must be born in mind,
homever, that crack midths are better controlled in PCRV's than in
RCRV's. Also the former are more congested during fabrication.
2.3.1 Model Design
Due to the non-linear behaviour of reactor vessels, direct models
utilising materials similar to the prototype ones, must be used. This
facilitates the full investigation of such behaviour.
Model design begins mith choice of the scale factor, . This
is normally done by guidelines laid out in Chapter 1, namely type and
Purpose of model. Since a direct model is used for investigation of
non-elastic phenomena, \ 0 is normally betmeen 10 and 20. This then isa 'large' scale model, mith typical model heights ranging from 2m to 10m,

pioSt of the m°dBl characteristics are assessed here by similitude laws,
once X , i. Established. The scale factor discussed hitherto refers to
linear dimensions of length. However, other quantities must be
cpnsiderod. Cracking and general non-linear response depend highly on
material properties. Hence, every effort should be made to obtain a
model prestressing and reinforcement with Erp/Erm = 1. This model will
of course be distorted. Additional similitude requirements are given
in Table 1.1 (Chapter 1.)
to simplify model construction, the total number of prestressing elements
may be reduced by a factor (of 2 or 3, pay). Similarly, for the same
reason, the reinforcing oars may be changed by use of a uniform diameter
bar throughout construction.
Other features of the vessel such a liners and penetrations are
scaled geometrically. Finally, all linear materials must meet the
2.3.2 Further Design Considerations
(a) Design Procedure
The preliminary stage of design, normally based on the theory
of simple thin shell analysis, determines the proportions of top slab
to mall thickness. Three dimensional finite element analysis is then
applied to model load cases, individually and combined. The results of
this analysis gives the choice of prestressing, and prestressing forces.
Prototype steel areas are reduced by a factor of In order
requirements of i.
(b) Design Pressure
The maximum expected incident pressure (as well as the normal
°peration pressure) are used in this regard.
(c) Prestressinq Forces
These are determined by three criteria:-
(i) Results based on the finite element analysis.

(ii) For internal pressure up to design level, prestress should*
rEirtain on the compression sides at the various parts of the vessel. For
internal pressure up to 1.5 times design level, the stress should be
less than the concrete tensile strength.
(iii) For vertical prestressing, the vessel mall should be securely
fixed to the base plate (say, a steel plate), to prevent slipping under
circumferential prestressing and internal pressurising.
2.*♦ MODEL LOADING ANALYSIS
2.^.1 Construction and Dead Loads ; ,
If 1 , then the required mass density of the model materials
is times that of the prototype materials. This cannot be achieved
normally. The model dead load stresses will then be only 5%-1(D% of
the prototype ones; the distortion so produced must be assessed. As
pointed out in Table 1.1, externally applied prototype line loads,
concentrated loads, and moments mill be scaled by factors \/? , X^\and , respectively.
2.A.2 Pressurlsation and Cycling
When X o - - l , the pressure scale factor is unity. The model
should be designed to respond elastically to the prototype design
maximum operation pressure; this giving very good predictions of the
prototype response. As with the prestress load, stresses and strains
of model should be the expected prototype ones; while the displacements
are scaled by Xj£ .
• 3 Steady State Thermal Gradient and Pressure
This condition necessitates similitude lows shown in Table 1.2.
and are essentially unity for micro-concrete, then all model
Properties correspond to the prototype; except for displacement, and time,
tohich ere scaled by X^ and (>{) respectively. This advantage will yield
^distorted thermal stresses, strains, and displacements which can be

(noaCu re d directly in combination with other stresses, since \ r - \g, * i*
If this is not the case, then once is set to unity, model
temperatures can be adjusted by X q to yield * \ q = 1 . This gives
distorted stresses, strains and displacement. Where this adjustment
impracticable (or impossible), separate results of internal pressuret
and thermal action are taken and superimposed.
Boundary heat transfer is modelled by Nusselt's number,
N ~ hl/k (see sbetion 1.7.3)
2.l* .U Creep and Shrinkage (under normal temperatures)
"Modelling creep and shrinkage places severe demands on model
concrete properties" (Ref. 1.1). It becomes impossible to model for
creep if the aggregate size of the micro-concrete is too small. Again
with a large \ j { , the model thicknesses are too small to model
moisture conditions.
Careful measurements on the model mill give a reasonable indication
of the prototype creep and shrinkage. In most cases this mould be only
qualitative.
2.^.5 Creep and Shrinkage from Temperature Effects
Under operating conditions, creep in a reactor vessel mill be
accelerated by elevated temperatures. The time scale for creep is
given by f\() (for the case =1> Table 1.2). For large values
» this creates creep and thermal strains occuring at an in
compatible time scaling. For any meaning, then, creep and shrinkage
Modelling should be done on the largest possible model ( small);
best being the full scale model ( X ^ =1).
* + * Severe Vessel Cracking from Overpressure
Tensile strength of concrete, and bond betmeen concrete and rein-
wCement are of importance here. The condition X<y =1, necessitates
P . the tensile strengths of model and prototype be identical. For

true cracking similitude, the above condition must be met for all
combined stress states, and for uniaxial stresses.c p
2 , U . 1 Overpressure Leading to Ultimate Load
Similitude requirements beyond the elastic range become operative
at this stage. Obviously, -Jjp (Table 1.2). Bending produces high
compressive stresses, concrete cracks more, the steel yields, and
excessive cracking leads to the gushing out of the pressurising fluid (water or oil) which leads to loss of pressure.
LJith a carefully built model, this behaviour should indicate the
ultimate failure of a reactor vessel; which, one hopes, should never
occur!
2.A.B Dynamic Loading (Earthquakes)
Table 1.3 gives an outline of the similitude laws to be followed.
Earthquake loads are idealised to three components of soil acceleration
(two horizontal, one vertical). An average duration of ground motion
of 3D seconds is normally taken.
Similitude laws are based on D'Alembert’s law of dynamic
equilibrium. This leads to the limiting cases of Cauchy and Froude.
Cauchy: (Inertia Force) (Elastic Force)
Froude: (Innrtia Force) (Gravity Force)
Constant)) For model and ) Prototype
Constant)
Depending on the purpose of test, one of these conditions is
Bdopted.
Load Combination
Work done by R. FIcGeorge and L. F. Gwec Jnr (Ref. A.1), indicates
he most severe load combinations and sequences. These should be
Signed for, and investigated fully. Dead load + shrinkage + operational
en>perature + earthquake + pressure was found most severe, creating 25%

crack penetration on both inside and outside surfaces of v/ossol wall.
The same combination, but with •accident* pressure and maximum operational
temperature added, created 00% horizontal and 00% vertical crack
penetration on the outside surface of model. Other less severe com
binations created 10% crack penetrations, that sealed up with release
Df load.O

-;>o-
2,5 Loading Systems
Systems that create internal pressure, and thermal *.i fe
on models will nouj he discussed. Carefully planned loading sy toms,
coupled with sound instrumentation have heen shown to yield ;:;,ct.llent
results in modelling PCPV's and RCPV's.
2 .5 .1 Internal Pressure
To create this pressure, air, a gas, uater, or nil t u e ■ ■
(a.) Air Pressure
Nitrogen is normally used in this"regard. Since no
7D% in a volume of air is taken up by nitrogen, it is cons
be representative of air. Also it is less inflammable and
than ordinary air - and hence safer.1
The pressure s created by connecting compressed ni rogen
cylinders to the model through a leak-proof tube, fitted u:
valves and pressure gauges. As the compressed nitrogen is e' e .
to the interior of the model, a measurable internal pressu
created, which can be controlled during testing.
The disadvantage of air is its danger at high pressi
leakage crack could create a sudden pressure drop, resulti
explosive action. For this reason, air-pressurising is us
moderation, with pressures seldom exceeding BOKPa. Due to
only the elastic behaviour of the direct model can be inve.>
using air pressure. Early leakage cracks can be detected t . 1
'soap-film-bubble1 method, (Ref 6.2, Section A.5), during
(b) Water Pressure
Water is basically incompressible, and therefore high ;.r can be suddenly released without danger of explosion.
The pressure is 'achieved by filling the central cav: of the
model with water. Referring to Bernoulli's equation:-
h +r
p H 2.1
the pressure is exerted by one or all of the three component 'heads'
0f the total 'head', H. The elevation head 'h' depends on how high
the water level is of the feeding water tank. If this is insufficient,
(p-external pressure), can be added if required.
Water pressure can be used to investigate elastic and post
elastic phenomena of the model, up to severe cracking and probably
failure. The pressure should be applied in quarterly (loading and
unloading) instalments of the design value. At every stage, readings
must be taken and compared to theoretically analysed results, before
proceeding further. At failure, cracks widen, a sudden pressure drop
results, then water gushes out of the model.
If air-pressure is used before water pressure, arrangements
must be made to remove al1 the air from the model cavity, and replace
it with water. In Chapter 5, this aspect is discussed in' more detail.
(c) Oil Pressure
Pressurising oil.(a petroleum based hydraulic fluid) is filled
in the cavities of the model and an external pressure is applied.
The amount of pressure and its rate (e.g. 10Pa/min) should be
carefully controlled. This way the pressure can be increased, decreased
or left constant uniformly throughout the model cavities during the test.
After severe cracking, the pressure drops; any further increase in
External pressure widens cracks and makes the oil to gush out, which
leads to the ultimate failure of the vessel.
2.5.2 Heating Systems (for Thermal Tests)
nthe velbcity head 'UV2g' can be added by controlling the velocity
0f the water entering the model. An additional pressure head
A suggested system is shown in Fig 2.1 . This was used by-the

- ' )0-
Shield
Air-Coditioning System
Fig. 2.1 Froposed Heating System lor the Thermal test

-31-
,/,njim3 Corporation, PCPW Research and Development Group in April, 1973,
(Ref• 2.2).The setup is essentially to control the inner and outer
temperatures of the model. The model is placed in an air-conditioned
chamber. The model cavity is circulated with temperature controlled
water.
The main components of the system are a hot mater tank, a
water saturating pump, air heaters, an air blower and a temperature
control unit. Temperature control for stable conditions is automatically
established by (on-off) thermostats.
A ventilating system maintains a uniform air temperature
around the model. In the model cavity, uniformity of mater temperature
is achieved by pipe assemblies which consist of two spouting nozzles
and four drawing pipes arranged in a way to produce whirlpools in the
cavity. Steady-state temperatures can be maintained for days.
This method is used solely for thermal tests, with no internal
pressure considerations.
In the elastic range, however, separate tests can be carried
out (thermal and internal pressure), and the results superimposed.
For post-elastic testing, a system that combines both aspects
has to be designed, depending on the specific purpose of the model.

y —
2.6 INSTRUMENTATION
A well planned layout of instrumentation, together with a uiell
controlled loading system are essential for useful and meaningful results
in a reactor vessel model. Ulhere plenty of data is expected in the
results, automated data generation should be incorporated in the model.
Internal pressure tests and thermal tests (of RCPV and PCPV's)
each require rather different instruments. Each mill be discussed
separately.
2.6.1 Instrumentation for Internal Pressure Test
Types of Gauges and other Instruments
(i) Resistance strain gauges, bonded on the outer surfaces of
the model.y
(ii) Strain gauges embedded in concrete.
(iii) Resistance strain gauges bonded on prestressing tendons
(for PCPV's).
(iv) Load transducers (or load cells) at the prestressing tendon
anchorage (for PCPV’s).
(v) Crack detection gauges or strips (long single-element banded
strain gauges).
(vi) Concrete embedded gauges for crack detection.
(vii) Deflection gauges (bonded resistance strain gauges on phosphor- bronze strips).
(vlii) Pressure transducers (to record internal pressure).
(ix) Photoelastic coating on concrete to indicate location and

-33-■growth of initial cracking.
( x) Dial gauges far excessive deflections. (Figs. 2.2 arid 2.3
sfiouj a typical layout of instruments in a PCPV, employed by the Kajima
Corporation (Ref. 2.1)).The embedded gauges used in their model'mere "elastic resistance
wire strain gauges sandwiched between two acryl resin plates, waterproof-
coated and covered with silica sands to improve bond strength with
concrete". These were installed on the reinforcement cages prior to
concrete pouring; only about 1% were defective by testing time. This is
satisfactory.
2.6.2 Automated Data Generation
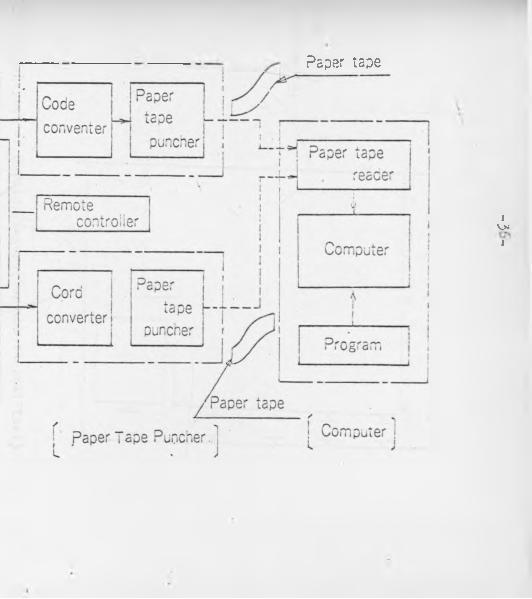
A system, shown schematically in Fig. 2.A, controlled and
processed by computer, generates the required data. The system scans ;-.nd
records data from each of all the gauges automatically, and in seconds.
The data output can be punched on paper tape, or typed out straight by the
computer terminal software.
Such a system takes some time to set up; and requires plenty of
patience, but the final speed of data acquisition makes it all worthwhile.
2.6.3 Instrumentation for Thermal Tests
The purposes of instrumentation in these tests are:
(i) To measure the temperature distribution of the model whenheated.
(ii) To measure the strain distribution and displacements when
heated; and for PCPV's, tD measure the same under prestressing.
As mentioned earlier, measured results should be compared with
analysed results at every stsne of the test.
lilies of Gauges Used (Ref. 2.2)
(i) Carlson Gauge:- Essentially an electric resistance wire
s rain gauge; could be used also to measure temperature variations.

(ii) Vibrating Wire Gauge:- The principal of this gauge is
that the strain is proportional to the natural frequency of the stretched
^tre inside the gauge body. Any thermal expansion of the concrete is
CDncelled by the thermal expansion co-efficient of the gauge.(iii) BS Gauge:- Consists of a metal membrane with an electric
resistance strain gauge glued onto both faces. Co-efficient of expansion
0f metal coincides uith that of concrete. Its fragile, so it should be
embedded in mortar.(iv) Copper - Constantan Thermocouple:- Used to measure
temperature at different points of the model. Can be used inside the
model (containing hot mater, say) at the inner surface of the model,
embedded in concrete, at the outer surface of model, and in air. Such
a thermocouple can be connected to the automatic data generating system.
Layout of Gauges
In such a test, radial stresses are expected to be much smaller
than circumferential or meridional stresses, hence gauges in the radial
directions can be neglected. Also, the circumferential and meridional
stresses are expected to be maximum at both surfaces and be zero near
the centre of the mall thicknesses. This governs further any meaningful layout.
Figs. 2.5 and 2.6 indicate typical layouts of gauges and
■thermocouples.

-35-
Fig. 2.2 Locations of Surface Cages-s
* [ -" Three directional gage
" *r° ur directional gage
Fig. 2-3
It*K
j / \ K K
;i<■!k. k k
!ik
Locations of

□ a
n L
m n
□
an
an
□
i
-i u
AutOfTiSiICSCaPiPii fig box |
strainimeter!
i
i Printer Ii______i
Automatic scanning box
Digital strain!meter i
! Printer i
Digital Strain Meter
Paper tape
IV*I

x Hoop__ Longitudinal
Fig. 2.5 Layout of Strain Gauges,(for the the

A mathematical analysis of the prototype is necessary for
c0(nparing results during the testing of the model. The finite Elements
Method (FEM) of analysis has proved very satisfactory for this purpose.
When the prototype is assumed to be a 'thin* shell, a two-
dimensional analysis is carried out. One of the mails is divided into
a finite number of elements. A count of these elements, together with
a count of the 'nodes' (surrounding the element) is used as part of
the input of existing FEM computer programmes. The boundary conditions
are then established - these take the form of internal pressure, external
pressure, internal and external temperature, etc. These constitute
further input. Also the material properties (e.g. Young's Modulus,
Poisson's ratio, etc.) are required as input. The programme assumes
b 'continuous medium' over all the elements, and is used to compute
deformations, axial loads, moments, stresses, etc. (depending on the
particular programme). The same procedure can be carried out for the .
roof slab, and the floor slab if required. Indeed this analysis is
very useful at regions where severe cracks are expected - where the
values of deflection and bending moment, together with the local axial
force are needed to control testing Df the model.
The results of the FEM analysis must be obtained before testing
of model commences, and should be available at all stages of testing.
Should there be a discrepancy between the model results and the FEM
analysis ones, that anomaly should be checked out and taken into account
before further testing proceeds.
More elaborate programmes assume the reactor vessel to be a
thick' shell. The FEM is then a three-dimensional one. These are more
e*uct. Normally a 'sector' of the vessel is taken (a 30° or A3°
Vtometricai section, i.e.) The elements become hexahedral, with more
Qdes per element. This method is very advantageous because it

t^kes into account the thickness of the walls, which i3 one of the most
important features of the reactor vessel. Furthermore, the behaviour
0f the areas where the roof slab meet the walls can be more fully
analysed and understood.
Most FFM programmes can carry out elastic or elasto-plostic
analyses. The latter are more important in this context, since they
yield information after cracking has occurred.
The FFM type of analysis is discussed more fully in Chapter <4 .
59-
/
/ .

-40-
rHAPTER 3
rniMSTRUCTIOM OF THE REINFORCED CONCRETE REACTOR VESSEL MUPEL
3.1 Planning and Design
3.1.1 Planning
The prototype reactor vessel on which the model is based is
typical of the containment structures constructed for small scale
experimental reactor vessels.
This prototype structure is essentially a 'thick' shell,
occupying a plan area of 2Am by 15m and rising to a height of 15m;
with walls 1.5m thick to provide shielding. These walls enclose B
edge 'hollow cells' (referred to as cavities, too), and a large central
cavity (11m x 6m) where the reactor sits. After consideration of the
size of model, reinforcement, available space and the acceptable limits
of scale in micro-concrete models, a scale factor of 1 in 12 was chosen.
A model, then, occupying a plan area of 2m by 1.25m and a height of
1.2Am, with 118mm thick walls was to be built in the Hydraulics
Laboratory, School of Civil Engineering, University of Sydney. Fig. 3.1
shows its layout.
'Micro-concrete', consisting of TJapean' Sand, cement and water,
was to be used. The reinforcing bars chosen were 2mm diameter round
steel rods, to be used all throughout the model. Using steel bars of
the same diameter throughout saved fabrication time of reinforcement.
Instrumentation was to be considered during each of the different stages
°f construction. A Finite Element Method (FEM) analysis was used on
the vessel to give a guide to the expected strains, stresses, moments,
deflections at different points. This indicated areas prone to
backing and possible leakage zones. During testing, air pressure was
^ be used initially, then water pressure (with a controlled head), till

*1° A ir V en t
-JoT R A N S V E R S E S E C T IO N ( B - B )
S t e e l I H c lc n w o y
H a t c h w o y B o l t s
T T
I j
I11__
__
1
------11111111___
I
111
_____________ , L . .
iiiii
1111
____ J
m
!M,
11l1[________
i i !
I«I'D.-Joi
CO I1
I u l ! iil Jn s ! 3 0 5 I7GI 9 1 4 7 6
11 1 3 0 5 m e1912
J L
T Y P IC A L E L A N t C - C )
E N D E L E V A T IO N ( D - D )
Fig. 3.1 General Layout.of Model
N O T E S
1. A ll D i m e n s io n s in m m
2 . C J * C o n s t r u c t i o n J o in t
3 . F o r D e t a i l s o f S t e e l
H a t c h w a y S e e D r g N P 5
4 . F o r D e t a i l s o f F o r m w o r k
S e e D r g . N P 2 , 3 , _ , _ ,
5 . F o r D e t a i ls o f S t e e l
R e i n f o r c e m e n t S e e D r o . N P 4 . .
D E P A R T M E N T O F C I V I L E N G I N E E R I N G
U N IV E R S IT Y O F S Y D N E Y
P R O J E C T R E A C T O R C E L L M O D E L
T IT L E G E N E R A L L A f O t l f
D R G . NO. 0 1 ! S C A L E 1 ' C
D E S I G N E D A f [ | D R A W N | A M j C A T E j 1 7 - 2 - 7 5

pranking occurred. (The prototype was designed to withstand an internal
explosion pressure approximated to 100KPa).
The experimental results were then to be compared to the FEM
analysis results.
Construction of the model was planned in six (6) stages. These
stages are shown in Drg. No. 3. Each Construction stage is discussed
in detail, in section 3.2.
Model Design
3.1.2 General
Design of the model consists of essentially simulating the
prototype properties as accurately as possible to the 1/12 scale model.
This was controlled by similitude laws. In addition, the model was
estimated to weigh over U tonnes. This necessitated designing the
foundation, since the location of the model in the Hydraulics Laboratory
was on weak concrete slabs covering a water sump. (see Fig. 3.2)
Finally, formwork for easy placing and vibration of concrete,
had to be designed. For each of the 6 stages of construction, therefore,
area of reinforcement and formwork dimensions had to be calculated;
while the micro-concrete mix and the diameter of reinforcing bars
remained the same throughout.
3.1.3 Concrete
Preliminary considerations eliminated the use of such modelling
materials as steel, plastics, plaster, etc. Micro-concrete was con-
sidered the most suitable material, for purposes of crack, creep,
shrinkage and thermal conductivity investigations.
The design strengths of the prototype concrete were 3lMPa in
compression and 3.1 MPa in tension. The micro-concrete mix correspondingf
these strengths‘that was chosen, after several tests, is shown in
^bles 3.1 and 3.2. Essentially, it consists of 'Type A' (Portland)

-43-
cBment, INIapean sand with a maximum particle size of 3.2mm, and a
•water to cement' ratio (U/C) of 0.65. This gave the required work
ability and strength at 28 days. The modulus of elasticity, Ec, of
this micro-concrete approximated to 2.1 x 10A MPa at 28 days. This
material is also referred to merely as 'mortar' in this thesis. During
construction, it was to be placed in smooth finished plywood formwork,
and vibrated using a 10mm diameter, minature poker vibrator.
As a check on strength before casting, a trial mix of the mortar
was made. Cylinders of it, 100mm in diameter and 200mm high (100 x
2 0 0 mm cylinders), were made and tested at 7 days for compression and
tensile strengths. (The Australian Standard procedures of 'concrete
strength determination' - parts 9 and 10 (1972 and 1973) - were used.
This employs the 'Brazil' or splitting indirect test for tensile strength).
Typical test results are shown in Appendix 3A.
3.1. A Reinforcement
As mentioned earlier, 2mm diameter steel rods were used through
out the model as reinforcement. The area of reinforcement was computed
by the equation:
Arp = ^\(Arm(notation as before, Section 1.6, Table 1.1).
This equation satisfies area requirements only. Ms the correct
scale relationship between bar dimensions could not be obtained, bond
similitude is not exact. This can have an effect on crack widths and
distribution. However the number of bars in the model were sometimes
Isss, and sometimes more than the prototype number. It was thought
that this fact would diminish the problem.
In the case of reinforcement fabrics, meshes and cages where
^rP is given in mm'Vm, the equation was modified to:

-AA-
Arp = Aj^Arm ............................. 3.2
for dimensional homogeneity.
After several tests, the average yield stress of the steel
wires was established as <r3 = 39QMPa* (The prototype steel has
a design yield stress of '°3 = 380MPa). The modulus of elasticityL ..E = 3.22 x 10 MPa, was also determined, r
The general layout of the reinforcement was along the prototype
lines, excepting of course, diameter and spading of bars. Joints in
meshes, cages and fabrics were glued or spot-welded. A minimum bar
spacing of 15mm (equivalent to 180mm on the prototype) was imposed to
ease placing of the micro-concrete. But even with this constraint, the
heavily reinforced reactor vessel presented problems in fabrication,
with many, many wires criss-crossing all around the model, (see Plate 1).
During construction some of these problems were overcome by
steel'templates' as guides in spacing; these are discussed in more
detail in Section 3.2.1.
3.1.5 Foundation
The foundation of the model had to be designed to take a loadI . «-in excess of U tonnes, resting over a sump. A set of 5 taper flange
beams (152 x 76) spanning the sump and supported on strong concrete
walls, was used, (see Fig. 3.2). This arrangement took the load off
the slabs covering the sump, raised the base of the model for easier
fabrication, and provided anchorage for formwork during the initial
stages of construction. The beams were placed on steel plates and
positioned with gypsum plaster. Levelling of beams was done by o
spirit level before the plaster set.
This foundation being set, a form-board was bolted on top,
forming the model base, and at the same time simulating a permanent
sandstone foundation of the prototype.

-45-
1.6 Formwork ‘
Ply form boards, 18rnm thick, with a smooth finish^WEre used „ a formwork. For the initial stages of construction, the boards3 5 u
u e r e placed and fixed in position with bolts, pipes and nuts; as shown
in plates 1, 3 and Fig. 3.3. Wooden boxes were made up and placed to
form the vessel cavities, during the placing of the mortar. Fig. 3.*+
shows details of these boxes.
Maximum Aggregate Size 3.2mm
Design Compressive Strength (28 days) 31 MPa
Design Tensile Strength (28 days) 3.1 MPa
Design Elastic Modulus (28 days) 2.1 x 10⁴ MPa
Shrinkage High
Type of Sand Napean
Type of Cement Type A Portland
TABLE 3.1 EICRO-CONCRETE MIX DESIGN AND CHARACTERISTICS
Water to Cement Ratio
Water to Sand Ratio
Ingredients by Weight (kg) per batch
Water Type 'A' Cement
NapeanSand
0.65 0.2 11 16.9 55
l£5LE 3.2 MICRO-CONCRETE MIX PROPORTIONS

g. 3.2 Section through Foundation for Model

125
2
D E T A IL X ( S C A L E 1 3 )
N O T E S
1. A ll F o r m w o r k is 1 8 r r m T trc k
2 . B o a T y p e D t o b e C lo m p e d
o n t o S t e a l T e m p la t e s
3 . F o r D e t a i l s c f B o x T y p e s A ,B .
C a n d D R e f. t o D r g N o. 3
Stage 2 FormworkD E P A R T M E N T O F ‘C IV IL E N G iN E E R 'N G
U N IV E R S IT Y O F S Y D N E Y
P R O J E C T R E A C T O R C E L L M O D E L
T IT L E S T A G E 2 F O R M W O R K A S S E M B L Y
D R G . N O 2 | S C A L E S j 1 - - . 0 . 1 3
D E S I G N E D A f - f j D R A W N j A M | D A T E j 2 6 • 2 - 7 6

- U B -1
24-4-

M r - V e n t
>•. f. ■.*. .• ’4 ■ *s
.*.4 I • ‘ -t • 4
19 12
S T A G E 6 (F IN A L )
C-J
I- t *vo
D a t a i l D r a w i n g s .
3 C. J. = Construction Joint
Fig. 3.5 Construction Stages
D E P A R T M E N T O F c i v i l E N G IN E E R IN G
U N IV E R S IT Y O F S Y D N E Y
P R O J E C T R E A C T O R C E L L M O D E L
T IT L E S T A G E S O F C O N S T R U C T I O N
D R G . NO. 3 | S C A L E | 1 : 1 0
D E S IG N E D D R A W N 1A M j D A T E 9 • 3 * 7 6

3.6 Steel Templates, Steel Hatchway, and Pipes for the Model

12
* 2
03
S«
?O
mm
c^F
2|
j j
n\2
9 2
C3S
- 2
0mm
C/t
F2 -P FABRIC 3
FABRIC F 4 --------- —
,14 t 2 07 - 63,nm cA S F5r ------------------ ------------------
/•
-------K--------------------- ■ V ________________U - 1 — 1—
0 2
0 3
0 4
0 f>O 6O 7
“ B
Z5TZ'■?*3
304
24
376
23
28
1090
910
1230
0001770
1110
9 0 0
f»OC
F 1
F 1 &JLZ.F 2 FTF 4
F 3
F 5
F 5 NOTESof S y rrrrx try .50.n
£kAH - " , L7 0 2 0 8 - 63m m qE S F5
62 0 2 0 2 U 2 0 m m c/c F2 o►----- <0 u
j j j im m C over - A ll Pound
SECTION y ' j
‘T
3
2
1t.70 lr-v ' • • «. - \ . ■F12° J_ < 'l-l o2 04IJ-25rnmc/c L---- r A-J Al3- 0
$ 1 R einforcem ent Fabrics to be Soot
F Welded a t Joints
I 2. Views Of Fabrics F I 0nd F2 n o t* » Shown
3. One O u o rte r ( ^ ) o f the Plan V.ew
n Shovr. (Joe to Sym m etry.
Exis ting 3 m m Slob
0 p 2 04 U - 36m m c /c 5 0 2 04U - 38m m c/zf.A b RlC. 3 ( F 3 ) - 4 OFF ( LOf .'G OCA M l
lZ90 a 2 02-20mm c/t FI (.
. * r
l <* j
' '
i</> 1O<Lrsi
I 0 : F3u— F3
r . i LL a z 1 il ; * •. • • 1—
•^ 1•
_____1
r
1 — V -
■ 1
_ ± (—
r~ 90C nf^ B R lC 3 (F S )-O N F OFF
SECTION G -G
me

•51-
3.2 CUIM5TRUCTI0IM AND CONSTRUCTION STAKES UP THE MODEL
The nix fetage3 of moriRl construction mentioned earlier mill
now be considered in detail. Each stage consists of design of rein
forcement and formwork, preparing working drawings, placing reinforcement
and formwork in place,, and casting with micro-concrete. Before pouring
the mortar, the next stage up is thoroughly investigated. This obviates
problems in continuity and instrumentation. After casting, the mortar
is cured for no less than 5 days, after which it is stripped. All con
struction stages are shown diagramatically in Drawing No. 3, (Fig. 3.5).
By the time of writing this thesis, stage 1 was completed; and
all the required preparations and design for stage 2 were completed -
however, it was still rnder fabrication. Stages 3 to 6 were being
planned. I will presr it these four stages as I think they should be
constructed, attempting solutions to problems that are peculiar to each
stage. • • •
For meaningful results, the instrumentation for each stage must
be given careful consideration. Section 3.2.7 has been ddvoted to
suggestions on this question.
3.2.1 Stage 1 (Fig. 3.7)
A reinforced concrete slab, 38mm thick, was built. The layout of
steel reinforcement is shown in Plate 1. Steel templates shown in Fig.
3.6 and Plates 3 and U, were used. They were mainly used for spacingorequirements. A typical template consisted of two open square hollow
section (13 x 13mm) steel tubes, with spacer bars at the ends and-at
^id-span. Clearnace holes (for 2mm diameter rods) were then laid out
along the tubes at the exact spacing, previously calculated. Through
these holes, the U-shaped reinforcing bars were passed. As shown in
the Fig. 3.6, four (A) of these templates arranged together fixed a
firm frame of reference, around which the different items of the model
ere checked for placement.

-52-
Formwork consisted of edge boards bolted to the foundation steel
beams. LJooden strips, 3Binm high were then bolted to the foundation
board, at the ends of the slab. Strong fixity was important for
thorough vibration of mortar.
During casting, 6 (100 x 200mm) cylinders were made along-side
each batch of mortar, for a check on strength. The results obtained
were in good agreement with required strengths. Appendix 30 shows
the test details and results.
Casting the 1.9m by 1.25m slab with micro-concrete was done in
three continuous sections over a period of 6 hours. A smooth surface
was finished (by trowel), and where walls or beams were to be built for
stage 2, laitance was removed to facilitate good construction joints.
The slab was cured with water for 5 days and was stripped after
7 days.
3.2.2 Stage 2 (Fig. 3.6)
Four inner beams and the vessel walls were tg be built (Dr'g. Wo.
2) to a height of 282mm. Drawing numbers 2 and A show details of form
work, fixations, layout and details of the reinforcement. The vessel
cavities were created by form boxes, which at the same time gave a good
finish to thp beams. The edge and end boards were strongly fixed to
the beams, /he edge and end boards were strongly fixed as in Stage 1.
Steel templates discussed for Stage 1 were used; this time for
clamping formwork in position also. Reinforcement meshes joints were
to be made using a portable spot-welder.
Due to the anticipation of possible leakage in slabs and beams
Linder pressure, 15mm diameter pipes were to be placed in each of the 8
edge cavities of the models, as shown on Drg. Wo. 1.
Also to facilitate a water-pressure test, a central 25mm pipe,
fitted with an outer tap, was to be placed in the central cavity
(where the reactor sits in the prototype). This was to allow the dis
placement of air during filling with water; and also to take a pressureQaunp

CD0 0
- * • ■ * « - . - 2 3 ---------------
1 9 1 2
PLAi l
Fig. 3.7 Construction Stage 1
XIELLE V A T I o n
P l a n
/-a-je n c f J— Formwork
m
f-ig. .3 Construction Stage 2 Micro-Concrete

-5*4-
For Stage *4 , a steel hatchmay for access into the model was
to be built. For this purpose, 8 steel bolts, 200mm in length, were
to be placed in position at this stage for its fixity; the exact
location being guided by another but different steel template shomn
in Fig. 3.6., .
Casting of the mortar mas to be done from the inside to the
outside of the model. Levelling mas to be accomplished by designed
levelling strips. Laitance free surfaces are required for continuing
construction. Curing and stripping should be done mithin the first
meek of casting.
Again, strength control cylinders (preferably 50mm diameter by
100mm length) alongside each batch or mortar, should be made and tested.
Any variation in strength should be taken into account in all future
calculations.
3..2.3 Stage 3 (Fig. 3.9) t
This stage mill consist of building a reinforced concrete slab,
3Bmm thick, covering the 6 edge cavities of the model structure. Pre
cast slabs could have been an pnsmer, but they mere not used in the
prototype, and mould probably destroy continuity. Also, any supports
for formmork during construction in the cavities might add strength
to the structure, absent in the prototype.
Polystyrene Foam filler in all the edge cavities is proposed
to solve the problem. A mater proof plastic membrane mill then be
placed on top of the filler, and mortar cast on top. Wooden strips,
36mm high, mill be fixed on top of Stage 2 formmork, round the periphery
and on the central box (box type 1D1); - see Figs. 3 . * 4 and 3.9.
Proposed reinforcement details are laid out in Fig. 3.10.
?_ As before, a check on strength of each batch of mix mould be
made by at le^st 8 test cylinders of mortar. Stage *4 is considered

-55-
f r c f o r e casting. Steel templates will be used for reinforcement
gpacin g.
This &tage will bring the model to a height of 320mm above the
foundation line.
3 .2 . A Stage A (Fig. 3.11)
The steel hatchway shown in Fig. 3.12, (for access into the
model) will be installed. Also the walls of the model will be raised
by AOSmm; preparations for a 'construction joint1 at this level made.
This joint will be made by 50mm by 5O0mm aluminium plates placed vert
ically at the centre-lines of the walls (see Fig. 3.)1 . These are
to be cast in with the .einforcement, but of course being near thef
neutral axis, should a d no extra strength.
Formwork will consist of ply form boards, 1Bmm thick, A06rnm
high, fixed above the Stage 3 formwork (except for box type ' D' (Fig.
3.A), which should be now removed). The same boards should also be
placed on the inside of the vessel wall and fixed to the steel
templates (screwed, bolted or clamped). Fig. 3.13 indicates the sizes
of the boards to be cut.
The steel hatchway area should be left clear of woode formwork
Steel reinforcement (shown in Fig. 3.1A) will be spot-welded in
position (before fixing the form boards). Rods should protrude above
the formwork level to facilitate a splicing of at least 25mm.
The steel hatchway will be placed in position using bolts that
were installed during Stage 2. This should be done before any casting
°T mortar is done.
The aluminium plates, providing the construction joints, will
then be placed in position. Any embedded instrumentation should also
B Placed in position, at this juncture.

^ <rt % (bo
Fig. 3*10 Layout of Reinforcement for Stage 3

r+* O
57
\
E L E V A r i O N -
PLAKJFig. 3.9 Construction Stage 3
_ .» - l± *' / * * ■ -J-
■¥ v : '1/
CD }.■.0V) *. i 1i /
/• *
■,----- ------- . /■ -r' I '
—.--- ■ j -,-y I- , j , 9—2—7—7 -7~zr 7—r V / / / IZ=Z=£P L A N
Aluminium
Fig. 3.11 Construction Stage U

-5P-
18 i
Mortar should then be cast and vibrated well. Strength-
checking cylinders should be made. The mortar should then be cured,
and stripped at 5 to 7 dBys.
The door of the steel hatchway should be firmly fixed in place.
This Stage will raise the model to a height of 726mm above the
foundation level.
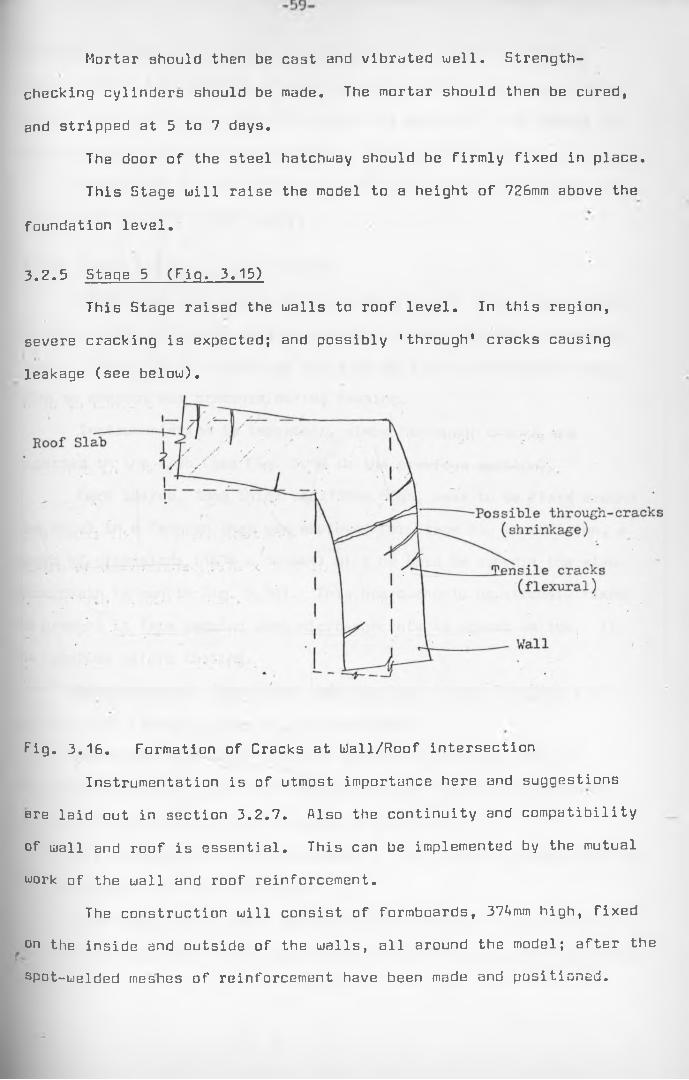
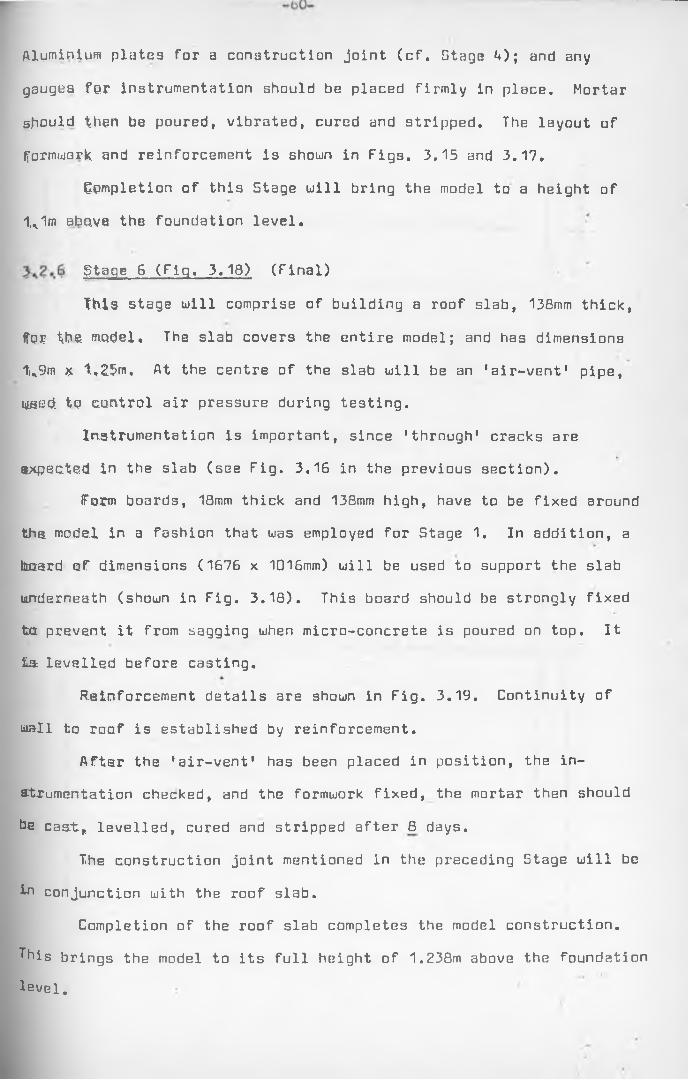
3.2.5 Stage 5 (Fig. 3.15)
This Stage raised the walls to roof level. In this region,
severe cracking is expected; and possibly 'through' cracks causing
leakage (see below).
Fig. 3.16. Formation of Cracks at bJall/Roof intersection
Instrumentation is of utmost importance here and suggestions
are laid out in section 3.2.7. Also the continuity and compatibility
of wall and roof is essential. This can be implemented by the mutual
work of the wall and roof reinforcement.
The construction will consist of formboards, 37Amm high, fixed
on the inside and outside of the walls, all around the model; after the
spot-welded meshes of reinforcement have been made and positioned.
Aluminium plates for a construction joint (cf. Stags A); and any
gauges for instrumentation should be placed firmly in place. Mortar
should then be poured, vibrated, cured and stripped. The layout of
formwork and reinforcement is shown in Figs. 3.15 and 3.17.
Completion of this Stage will bring the model to a height of
1, 1m above the foundation level.
5taqe 6 (Fig, 3.18) (Final)
This stage will comprise of building a roof slab, 136mm thick,
for the model. The slab covers the entire model; and has dimensions
t*9m * 1,25m, At the centre of the slab will be an 'air-vent' pipe,
used to control air pressure during testing.
Instrumentation is important, since 'through' cracks are
expected in the slab (see Fig. 3.16 in the previous section).
Form boards, 18mm thick and 138mm high, have to be fixed around
the model in a fashion that was employed for Stage 1. In addition, a
board of dimensions (1676 x 1016mm) will be used to support the slab
underneath (shown in Fig. 3.18). This board should be strongly fixed
to prevent it from sagging when micro-concrete is poured on top. It
ta levelled before casting.
Reinforcement details are shown in Fig. 3.19. Continuity of
wall to roof is established by reinforcement.
After the 'air-vent' has been placed in position, the in
strumentation checked, and the formwork fixed, the mortar then should
be cast,, levelled, cured and stripped after 8 days.
The construction joint mentioned in the preceding Stage will be
in conjunction with the roof slab.
Completion of the roof slab completes the model construction.
This brings the model to its full height of 1.238m above the foundation level.

-oi-
Fig. 3.14 Layout of Reinforcement for Stage 4
Fig. 3*17 Layout of Reinforcement for Stage 5
12
3B
ELEVATION (A-A)
FLANFig. 3.15 Construction Stags 5 (showing formwork and layout)
£CO
Air-Vent[ _____^
__________ iio 76
— 4r-------------- 4- -- -ELEVATION (B-B)
Stage 4 Level
( 7 2 6 mm)
PLANFiq. 3.10 Co nstruction Stage & (Final) with formwork and layout

-op-
Fig. 3*19 Layout of Reinforcement for Stage 6 ( f i-maX

3.2.7 Proposed Instrumentation
Two types of instrumentation are required: Those for the
internal pressure test, and the ones for the thermal test.
Some instruments have to be installed during construction of
the model. Care must be exercised during the pouring of mortar to
preserve the integrity of these instruments.
(The material following should be read in conjunction with
Section 2.6, where types of gauges and other instruments are explained
more fully).
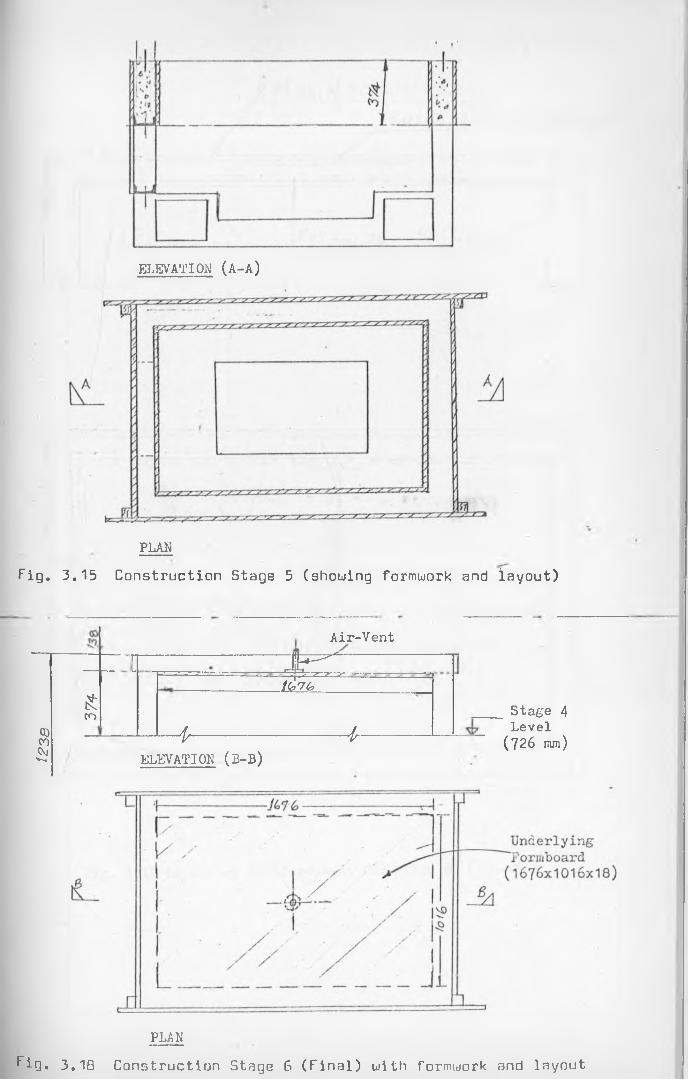
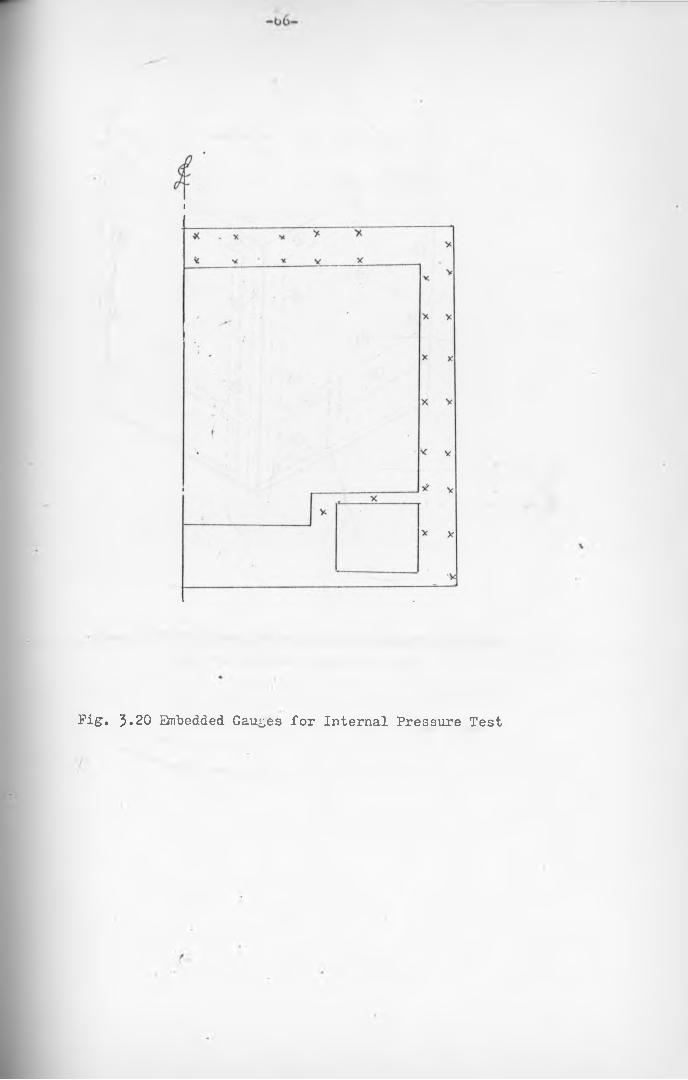
(a) Instruments for the Internal Pressure Test
Resistance strain gauges may be used to measure strains. These
will be placed on the micro-concrete surface, and also embedded into
• the mortar (as explained in Section 2.6.1).
Strips of crack detection gauges are to be installed on the
outside and the inside surfaces, as well as embedded in the concrete.
I propose a layout of the embedded gauges shown in Fig. 3.20.
These should be installed during construction stages 2, U, 5 and 6;
fixed onto reinforcement meshes.
Fig. 3.21 shows a layout of surface strain gauges that will be
mounted after completion of model.
(b) Instruments for the Thermal Test
These gauges and thermocouples will be required mainly to
measure temperature distribution and strains across the walls and roof
slab.
I suggest that Carlson gauges, 'vribrating wire' gauges and
1 copper-constantan' thermocouples (discussed in Section 2.6.3), be used.
A layout of these instruments is shown in Figs. 3.22 and 3.23.
The embedded gauges should be fixed to the aluminium plates used for
the construction joint, as well as the reinforcement cages, during the

-65-
appropriate construction stages.
(c) Data AcquisitionAn 'automatic data generation' 3ystBm shown in Fig. Z.U
(Section 2.6.2) is recommended for record of the numerous measurements
to be encountered during the test.
I
Fig. 3.20 Embedded Gauges for Internal Pressure Test

-67-
Fig. 5.21 Proposed Surface Strain Gauges Location for the Internal Pressure Test
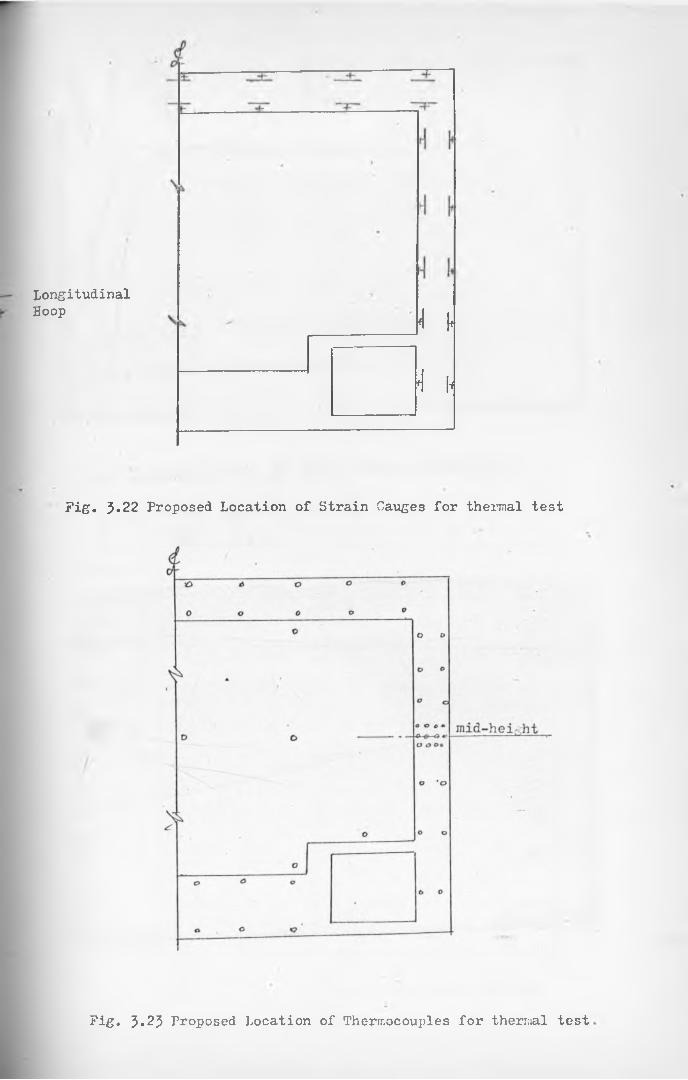
LongitudinalHoop P P
'l |i
Fig. 3.22 Proposed Location of Strain Gauges for thermal test
Fig. 3«23 Proposed Location of Thermocouples for thermal test

PLATE REINFORCEMENT IN BASE - GENERAL_ARRANGEMENT

PLATE 3 WALL REINFORCEMENT ABOVE BASEi
PLATE 4 WALL REINFORCEMENT ABOVE BASE
UL
iU

CHAPTER U
THE ANALYSIS OF CONCRETE REACTOR VESSELS (PRESSURE VESSELS)
U. 1 Introduction
Reactor vessels (pressure vessels) could be loaded by internal
ond external pressure, internal and external temperature, gravity
loading (including dead load), accidental loads, and earthquake loads,
Bcting individually or in combination. In the case of reinforced concrete
vessels, especially where a steel liner or any other leakage membrane
is not provided, excessive cracking of the concrete under these loads
could result. This c^uld lead to the loss of the ’pressure boundary’
integrity of the vesr 2I with subsequent leakage of the contents.
Since the pressure vessel considered in this thesis is a rein
forced concrete one with no steel liners, most of this chapter will
be devoted to the analysis of cracklnq. The Finite Elements Method
(FEM) of analysis is considered to be the most suitable for analysing
a problem of such complexity.
Since cracking is a local phenomenon, a lot of detail must be
included in any analytical model dealing with this question. Such
detail imposes restrictive limitations on the analysis of a structure
the size of a reactor vessel. R. McGeorge and L. F. Swec Jnr (Ref. *+.1)
have developed a two step procedure where successive linear analyses
are performed to obtain the gross response, while non-linear cracking
analyses are performed for selected portions, to evaluate local
cracking in detail.
** .2 Two and Three-Dimensional FEM Analyses
. **♦•2.1 Two-Dimensional FEM Analysis
Thi3 method of analysis assumes that the vessel is a ’thin’ shell.

Each wall or slab is analysed as a two-dimensional 'plate' - with
well refined boundary conditions. A finite number of quadrilateral
elements is arranged on the plate surface, joined by the 'nodes'
(surrounding each element). Compatibility of deformation between
neighbouring elements should be satisfied for a precise 'continuum'
model in the analysis. The modulus of elasticity of concrete, the
compressive and tensile strengths of concrete, Poisson's ratio, the
loadings (pressure, temperature, etc.) and boundary constraints con
stitute the input for a FEf-1 computer programme designed to analyse
pressure vessels. The output of the programme yields longitudinal
and hoop stresses and moments, deformations and deflections; as well
as shears, axial loads, etc. as required.
Typical input elements are shown in Fig. 1».1 and typical results
in Fig. <4 .2 a, A.2b.
This method can be used for elastic as well as elastic-plastic
analysis. The results shown in Fig. U .2 are 'elastic' results obtained
for the reactor vessel considered in this thesis. (192 elements, 217
nodes required solution of 1005 equations.)
A Slab and Wall Elastic Analyses Programme (namely 'SWEAR')
was used here (Ref.* **.5). It utilises quadratic displacement plane
stress and plate bending finite elements in association with compatible
column, beam and line elements. The isoparametric 8 -nade elements
adopted are shown to be accurate for elastic structural analyses.
A similar elasto-plastic analysis was used by the Kajima Corporat
PCPV Research and Development Group in Japan in September, 1973. (Ref. 2
The analysis was utilised for the following purposes:-
(i) To predict the model behaviour under overpressure.
(ii) To fallow the crack propagation sequence in relation to
the pressure.
(iii) To verify that the vessel has a progressive fracture mode.
The particular programme used here performed analysis after

cracking of concrete and yield of ateel. Also non-linear stress-
strain characteristics were assumed and idealised for steel and con
crete. In addition, idealised 'bond-slip' characteristics mere
programmed fur the reinforcement.
. To convert the problem from a three- to a two-dimensional one,
Young's modulus mas corrected by a factor 'a', defined as:
a = ^ 2 ^ • # . * ^ . A. 1
d^: three-dimensional radial displacement
d^t two-dimensional radial displacement with Young's modulus
uncorrected.
With this correction, the radial displacements under the tuo-
and three-dimensional analyses became identical.
It should be noted, however, that the two-dimensional model
takes no account of:
(i) The three-dimensional stresses within the 'plate' thickness
(ii) Cracks due to the anisotropic nature of material, important
for shrinkage, construction joints, etc.
(iii) The 'doming' action which rnay increase slab stiffness.
(iv) The influence of creep.
(v) The dynamic nature of pressures due to abnormal loading.
*♦.2.2 Three-Dimensional FEM Analysis
This method analyses the pressure vessel as a 'thick' shell.
The computer programmes for this method are more elaborate and more
accurate. The elements are hexahedral, and the nodes are more in
number. Instead of a thin plate as in the two-dimensional analysis,
a solid free-body - representative of the entire structure - is
analysed. In the case of a cylindrical vessel, this can be a 30° or/ .<45° or 9C° sector. Fig. A.3 shows a 30° degree sector analysed by
the Kajima Corporation Group (referred to in the last Section A.2.1).

'• JQ


-15-
SecV»on
Section
r\cnicnt-
riE* ^ OWi«on

Ide note that a mEre 12A elements created 920 nodes. Compatibility
of deformation is satisfied between neighbouring curved surfaces, this
representing a precise 'continuum1 model.
The three-dimensional FEM model tends to be restricted to an
elastic analysis, to give the gross response of the entire structure.
When the analysis is carried out as a guide in model design and
testing, it is normally utilised as follows:-
(i) For predictions of stress and strain distributions of
the model.
(ii) For predictions of 'doming' effects, severe crack regions,
and crack characteristics.
(iii) To predict temperature distribution of model under
stable thermal conditions (for thermal tests).
(iv) To predict elastic stress and strain distribution of
model under stable thermal conditions (for thermal tests); and for
prestressed pressure vessels!—
(v) For design of prestress.
(vi) To predict stress and strain distribution under prestress;
and of* most importance,
(vii) For comparison with results during testing.
Three-dimensional programmes investigating post-elastic phenomena
have not been well-developed to date; behaviour beyond elasticity
up to failure is best observed by the built-model itself.
. 3 The General Analytical Scheme for Cracking
As mentioned earlier, cracking of reinforced concrete is a
local, non-linear phenomenon requiring a detailed analytical mathe
matical model. Crack widths, cracking penetrations and distributionf^need to be determined. The computational effort involved for detailed
crack analysis for a large ri actor vessel is clearly prohibitive.

To overcome this size restriction, on iterative analytical
scheme shown in Fig. A.A may be used. This was suggested by f'cGeorge
and Swec (Ref. A.1). Linear analyses of the complete structure are per
formed using equivalent structural properties to obtain the gross struct
ural response. Non-linear cracking analyses are then performed for
selected portions, using appropriate boundary conditions, to evaluate
local cracking. Compatibility of behaviour between the linear and non
linear analyses may be achieved through iteration, allowing an extra
polation of local cracking results to predict cracking over the entire
structure.
A.A The General Analytical Procedure for Cracking (McGeorge and Swec)

The FEM, described previously, can be used both for the
analysis of the complete structure, as well as For the detailed
analysis of local regions or structural components. Indeed all the
analyses indicated in Fig. can be carried out by this method.
,U Elastic Analysis of the Entire Reinforced Concrete Structure
1 Outline
Once the structure dimensions are established, and the material
properties are idealised, an element (or a sector) of the structure
is divided into finite elements to complete the computer programme
input. The mathematical model is then established.
Elastic analyses (gross) are performed in each cycle of iteration
to refine the structural and material properties used, (Fig. L.L),
based on the results obtained from the local cracking analyses.
Iteration is continued until agreement is reached between the properties
used-in the analyses of the entire structure, with the degree of crack
ing determined in the local cracking analyses of critical regions.
With good previous experience and intelligent choice of initial prop
erties, agreement should be reached in two or three iterations.
**.*♦.2 Loadings
During the life of reactor vessel, both normal operational and
accident loadings may be experienced by the structure. Transient and
steady-state loadings may occur. Following are suggested loadings
that must be taken into account for design:-
(i) Drying shrinkage and creep of concrete
(ii) Dead and live loading.
(iii) Structural integrity loading.
(iv) Operating temperature gradients
Small break accident (SOA) pressure and thermal transients(v)

-79-
(vi) Design basis accident (DBA) pressure and thermal
transients.
(vii) The safe shutdown earthquake (S5E) loading.
Drying shrinkage of concrete is a time-dependant aspect
associated with moisture loss from the concrete. It occurs first on
the outside and then on the inside of a concrete section. Creep will
occur simultaneously with shrinkage in concrete walls and slabs, re
sulting in some relief of the stresses induced by shrinkage. This
aspect is of importance only in the early life of the structure, up
to 2 - 3 years.
Pressure and temperature transient loadings of the structure
occur for both 5BA and DBA accident conditions. The pressure loading
associated with the DBA can then be selected from the peak value of
the DBA and SBA time histories. The temperature value for the loading
is selected similarly.
The safe-shutdown-earthquake value depends on the geographic
area of interest. For East Africa, a horizontal ground acceleration
of B.AOg would be selected for the tectonic Liestern and East Rift
l/alleys, and 0.2Gg val ue elsewhere. For the reactor vessel considered
in this thesis, the risk of destructive earthquake was assumed to be
negligible.
*».*♦.3 The Analysis
The box-like structure under static internal pressure (and a
steady-state thermal load), is anticipated to have a structural be
haviour exhibiting three distinct phases:-
(i) The Elastic phase, where the stresses in the reinforcement
are less than the yield stress.
(ii) The Elasto-Plastic one, where yield stresses and extensive

-80-
flexural crackihg develop in regions of maximum bending moment.
(iii) The Plastic phese, where 'yield line' mechanisms
develop, followed by additional load resistance due to membrane action
af reinforcement, caused by excessive deflections.
In the Elastic Phase, the resistance of the uncracked slab
may be greater than that of the cracked one, due to the very small
percentage of tensile reinforcement provided only on the basis of restricting crack widths. This is an undesirable characteristic as
collapse may occur abruptly immediately on cracking. The analytical
results under increasing load, therefore, depend Dn the tensile strength of concrete, and already existing cracks.
A.5 Local Cracked Concrete-Analysis
<4.5.1 Outline
One of the fundamental characteristics of reinforced concrete
is that the full tensile capacity of the material is achieved only
when cracking of the concrete occurs; this resulting in the development
of the necessary strains in the reinforcement. In the analysis, the
non-linear material properties must be considered a3 well as the com-A
plex failure criteria. Discontinuity effects in development and prop
agation of cracks through the material are also present, and need
consideration.
Work published by M. A. Taylor and others, in 1972 (Ref. A.3),
develops a plane-strain finite element, used to investigate the be
haviour of reinforced concrete, subject to arbitrary static loading,
in great detail. The element has the following features:-
(i) L inear strain characteristics.
(ii) Loading and unloading conditions.
(iii) A non-linear, constitutive law fur cuncrete, Chased on
damage theory concepts and biaxial test data).

(iv) A biaxial failure criterion, which predicts the point
and orientation of cracking.
(v) Occurrence of crack propagation along any element
boundary, but continuity of reinforcement across cracks.
(vi) Redistribution of internal stresses after occurrence of
crack propagation.
(vii) Modelling of 'reinforcement to concrete' bond by a con-e
tinuous series of springs, parallel and perpendicular to the reinforcing
bars, allowing for moderate slip according to the piecewise linear law.
U , 5 . 2 Cracked-Concrete Model
This model is comprised of plane-strain finite elements just
described. Typical vertical and horizontal sections of the structure
wall or/and roof slab are chosen. The model consists of a combination
of plane-strain quadrilateral elements of unit thickness representingt :
the concrete, and one-dimensional 'beam' elements representing the
active reinforcement; (see below).
Pig. U . 5 Finite Clement Model for Cracked Concrete

-P2-
Since cracking is only allowed to occur in the plane of tho
model, the three-dimensional cracking behaviour is determined by
performing cracking analyses on both the horizontal and vertical
models for each set of loading conditions.
The three-dimensional stress distributions obtained from each
of the elastic analyses are reviewed and regions of maximum tensile
stress identified for each loading type, and selected loading corn-v
binations. The distributions of normal and shear stress through wall
thickness (and roof slab) are then obtained in these regions at
locations corresponding to the end faces of the cracked concrete model
and are used as direct loadings to the cracking model. Equilibrium of
loading is achieved by applying appropriate body farces over the
surface area, as well as externally applied loads. This procedure
enables accurate duplication of elastic stress distribution for these
regions of interest.
For shrinkage and temperature loadings, crack concrete analyses
can be performed directly with deformation rather than force boundary
conditions. In the region of the structure (wall or slab) where the
essentially uniform temperature distribution vertically results in
'plane cross-sections remaining plane' and parallel to their initial
orientation, is where the deformation boundary conditions should be
selected. This is normally at wall mid-height for a symmetrical
reactor vessel.. With this selection, vertical planes displace only
radially, while horizontal planes deform only vertically.

-03-
<4 ,6 Tho Analysis for this Specific Vessel
The idealised structure shown in Fig. fur the input of
the programme 1SUEAP1 (Section <t.2.1) is a simple, thin shell model,
assuming elastic and isotropic thin plates rigidly connected at the
edges. Due to symmetry, only 1/8 of the structure is input.
Input are an internal pressure P = 690UkPa, Poisson's ratio
= 0.2, and the modulus of elasticity uf concrete, Ec = 20MPa.
The compressive and tensile strengths of the concrete are taken as
32MPa and 3.2KPa respectively.
The 'elastic' analysis of the steel and concrete stresses was
carried out on selected positions of each slab, shown below.
- ■
E1
.
C1 _ _ _ _
E 2 C 2
-
Fig. i*.6 Stress Positions of Slabs
Using the conventional working stress method, with a modular
ratio of 7, the following results are obtained.
For an internal pressure of 83kPa, a maximum value of the
design/yield stress ratio for the tensile reinforcement in one wall
is Q.65. The maximum concrete compressive stress is *«.9NPa. Cross-
sections at locations C1 and C2 are in tension; and 'through' cracks
are expected, especially if precracking has occurred due to shrinkage
effects. Elsewhere, no through cracks are expected.
The maximum 'uncracked' tensile stress of concrete i3 2.6MPaj

a value much les3 than the predicted tensile rupture strength of
about 3.3MPa. It is expected, therefore, that up to this pressure
(G3kPa), most of the structural concrete will remain uncracked.
*4.6.1 Teat Pressures
The A.S.M.E. Code (Kef. A.A) specifies a test pressure ofjmagnitude 1.15 times the 'containment design pressure':-
P„ = " 1.15 Pa ......................... A.2
P and P being the test pressure, and the 'abnormal' or t 3 .'incident maximum' pressure , respectively. A pressure not exceeding
IQOkPa was adopted an these grounds, for the structural integrity
test.
*♦.6.2. Crack Widths Due to Test Pressure
The Australian Code of Practice AS 1*400 (Ref. A. 2 )
crack width formula (ignoring 'tension stiffening' contribution),
is:-
u = 3ct e m
where Id = crack width
Ct = concrete cover
fs/Es
At the test pressure of 100kPa, the maximum values of
probable crack widths are shown in Table A.1 below (for ct = 50mm).
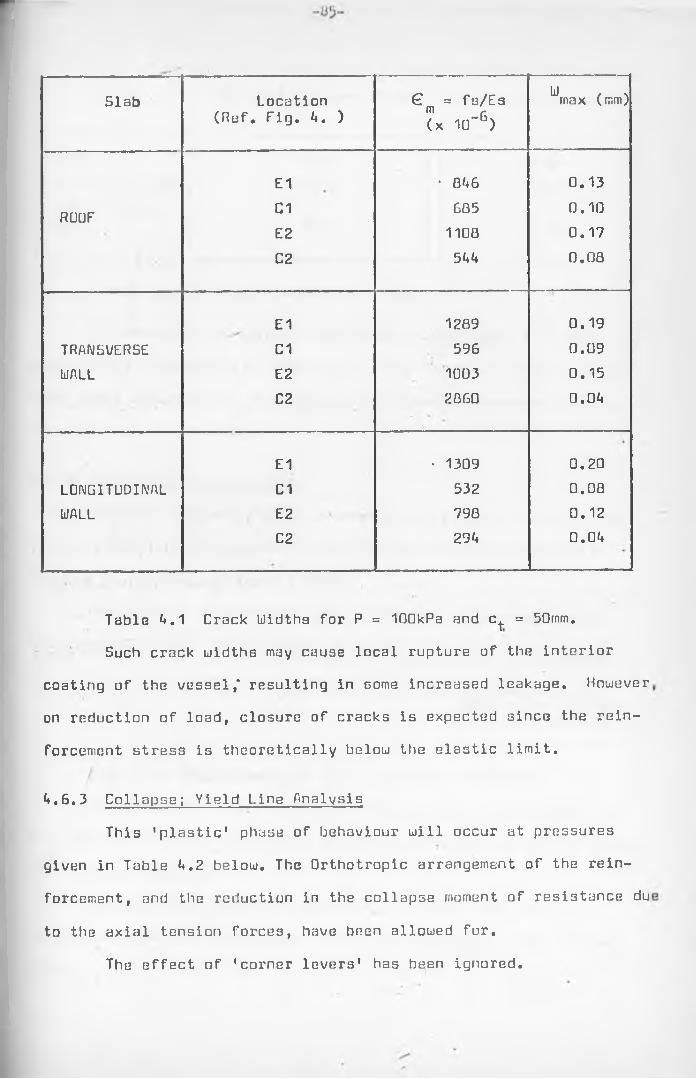
Slab Location (Ref. Fig. A. )
€. = fa/Es m r
(x 10“b)
U , Vrnax (mm;
E1 • 0A6 0.13
ROOF C1 685 0.10E2 1100 0.17C2 5AA 0.08
E1 1289 0.19TRANSVERSE C1 596 0.09WALL E2 1003 0.15
C2 2060 0.0A
E1 • 1309 0.20LONGITUDINAL C1 532 0.08WALL E2 798 0.12
C2 29A 0.0A
Table <*.1 Crack Ulidths for P = 100kPa and c. = 50rnm.
Such crack widths may cause local rupture of the interior
coating of the vessel,* resulting in some increased leakage. However
on reduction of load, closure of cracks is expected since the rein
forcement stress is theoretically below the elastic limit.
<♦.6.3 Collapse; Yield Line Analysis
This 'plastic1 phase of behaviour will occur at pressures
given in Table A.2 below. The Orthotropic arrangement of the rein
forcement, and the reduction in the collapse moment of resistance du
to the axial tension forces, have been allowed for.
The effect of 'corner levers' has been ignored.

-06-
Slabi
i ........ ■■ .................. .. ■1 - -- ■■■■■■■ — —>—Collapse Pressure (kPa) Collapse/Test Pressure
! R O O T 2 7 6 2 . 7 6
| T R A N C V C R S E LiALL 2 5 5 2 . 5 5
i LONGITUDINAL -S WALLL .
2 9 0 2 . 9 0
Table A.2 Yield Line Collapse Pressure
It should be noted that the A.S.M.E. Code (Ref. A.A) does not
ee.HTitemplate development of yield line mechanisms and membrane action
with large deflections, as a design condition for concrete reactor
vessels and containments.
A*fc6.A Shear Strength of Slabs
No shear failure should occur prior to the full development
(iff the yield line mechanisms. The side slabs should therefore be
capable of carrying at least 255kPa.
The maximum permissible shear stress at collapse given by
the Australian Code AS 1A8Q (Ref. A.2) is:
T g = <£(0.33 f F Z ) f-'Pa, in areas with noshear reinforcement (standard notation) ................. <4.A
i.e. the allowed maximum /T = 1.5MPa ( 1505kPa).sThe perimetral shear stresses for the roof and two walls are
535, 580 and A30kPa respectively due to a collapse pressure of 255kPa.
This is satisfactory.
The principal tensile stresses due to shear and membrane
tension are 7BA, 05A and 672kPa* which are satisfactory for two way
slabs.

-07-
l t . 6.5 Results of the T wo-Dimensinnnl FL'M Analysis Using theProqramme *‘3LJEAfJ*
Figs. A.2(a), (b) and A.G(a), (b) show distributions of com
puted values of moments, stresses, axial forces and deflections as
yielded by the ’elastic' programme 'S3UE/\P' . The sectiuns shown are
the three principal cross-section of the structure.
The results of deflections shown in Figs. A.G(a) and A.G(b)
for the internal pressure of 6900kPa (1 kip/in') provide a 'lower
bound' based on the uncracked section with E = 2GMPa. The deflectioncunder the maximum test pressure (100kPa) would then be only:-
A = 1n0/69GQ X 2,536 X 25,f* = °‘9mmf
An 'upper bound' estimate of deflection is marie assuming that
the tensile strength of concrete is negligible throughout. This gives
a A = 7mm at the test pressure (using the bending moment FEM
results). Hence:-
0.9mm A < 7.0mm ............... A. 5
The actual deflection, however, depends very much on other
factors like crack patterns, way of loading, local yielding. The
analysis can therefore only give a probable range of deflections to
be expected for the model test - see Table A.3 below.
Slab Minimum A. (mm) Maximum A (mm)ROOF 0.90 7.0TRANSVERSE UALL 0.15 0.7LONGITUDINAL WALL 0.20 1.2
Table *+.3 Range of Probable Deflections at Test Pressure

-00-
Rotatlons: From the B.M.D. of the FCM results (Fig. , tha
maximum change of slope at the £oint_ofjoontr^ l a approximately
2m from the inside face of the longitudinal wall.The probable range of change of slope, by the area-moment
therein, is found to be:-
53 secs <C. 0 mins. 55 sec3 ......... . 4•

Note : Values given due to anin te rn a l p re ssu re of 10 00 ps i
(a) Side Wall - Mid Section
(b ) End Wall - M id S ection
FIG. A S FINITE E L E M E N T R E S U L T STTo(T] 7
4*42 k ip / in 2
4 -5 2 k / in 2 Tensile S tress
3 -9 6 k ip / in 2
3 -3 6 k / in 2 Tensile S tre ss

-9 0-
FIG. FINITE E L E M E N T R E S U L T S4.6(b)

-91-
A , 7 Results-of the Three-Dimensional f'F.M Annlysij3
(McGenrqe and Sijrc, Ref. A♦ 1)• • - * ' ’ f
<♦.7.1 Introduction
In interpreting the results of this analysis, it was under
stood that the •inelastic' structural response to a load case de
pended on its response to previous load cases. The important factors
were therefore the combination of load cases as well as the sequence
of their application. However, the principles of superposition had
to be used initially to assess the worst load case combination causing
severe cracking.
In determining load combinations and sequences, tbu following
guidelines were followed:-
(i) Gravity, shrinkage and operational temperature loading
were necessarily combined with any other loading.
(ii) The DBA condition may be preceded or followed by SBA
and SSE conditions (see Section A.A.2).
(iii) Both SSE and SBA are infrequent, but may be recurrent
in the life of the vessel.
(iv) Whereas with the DBA pressure transient the effect is
immediate, a similar temperature transient response is very slow due
to the low thermal conductivity of concrete.
(v) The SBA pressure and temperature transients cannot be
uncoupled, although the pressure contribution is relatively insig
nificant.
A.7.2 Loading Combination Results
Using the above 5 criteria, 6 significant load combinations
were identified, and the results are shown below (Table A.A and
Fig. A.7).

CombinationNumber
Description HorizontalCrackPenetration
(%)
VerticalCrackPenetration
(%)
1 D + S + T□ 10 (BF) 10 (BF)
2 D + S + T + P-, o 1 10 (BF) 15 (BF)
3 D + S + T + E1 □ 15 (BF) 10 (BF)
A D + S + T +P. + E1 o 1 25 (BF) 15 (BF)
5 D + S + P^ + f 2 80 (OF) 80 (OF)
6 D + S + P2 + T2 + E1 80 (OF) 80 (OF)
BF
OF
D
S
T□
Both Faces (inner and outer)
Outer Face
Gravity
Shrinkage
Operational Temperature
T1 - DBA Temperature Transient
T^ - SBA Temperature Transient
E^ - Seismic S5E
- DBA Pressure Transient
P2 - SBA Pressure Transient
Table A.** Cracking Results of Load Combinations
- Crack-enetration— 10^ 155k 25,-
5&6
80,:
Fig. A.7 Results of Horizontal Cracking for Various i.oad Combination

Is 3 3 noted that the most severe combination did involve the
SBA transient, resulting in very significant cracking (combinations
5 and 6). From these results, no 'through'-cracks tire observed;
indeed the cracks mould be expected to close after the alleviation
of the SBA conditions. However, any loading subsequent to the SBA
conditions that induces significant tensile loadings could result
in 1 through'-cracks and potential leakage paths.
A.7.3 Load Sequence Results
The worst load combination sequences for through-cracks,
identified in the analyses, are as follows:- (numbers refer to
load combinations a3 in Table A.A)t
Sequence I: 1 - 6 - 1 - A.
Sequence II: 1 - 5 - 1 - 3 - 1 - 6 .
(note that combination 1 refers to normal operation; and 6 to
accident extreme conditions).
However, potential leakage paths are only open for sequence I.
In sequence II, the SBA temperature transient causes closure of inner
cracks under a large* induced compressive loading.
A.7.A Time Dependency of Through-Cracks
/ ■ Maximum crack widths, total leakage areas, and critical load
sequences for cracking can be used to estimate 'effective' widths,1
and time dependency of cracks, and hence leakage.
Time histories of cracking will generally depend on time his
tories of DBA transients. For vertical cracking, the result will de
pend primarily on hoop stresses caused by the DBA pressure transient.
Horizontal cracking, however, is controlled by the vertical tensile
stresses of combined dead load, shrinkage, operational temperature and
the DBA pressure transient.

-94-
Uhon the DQA pressure and the SGE loads occur simultaneously,
they offset the dead load compressive stresses. Hence leakage cracks
only occur when both transient loading are present. The dead load
stresses thus correspond to a 'threshold' stress level, below which
the combined loading will not cause crack opening. Tbi3 stress level' 1
varies with the height of the vessel.The GEE loading, being cyclic, causes cracks on opposite sides
to open and close alternately. So leakage is existent only on one
side of the vessel, at any given instant. Seismic loading that would
cause substantial leakage would be from a rather strong earth-tremor,
lasting over 10 seconds. Below this level, earthquake risk is
assumed negligible.

CHAPTER 5
TESTING OF MODEL, AIMD EXPECTED RESULTS
5.1 Introduction
The model, for which construction is outlined in Chapter 3,
will be required for two basic tests:-
(i) An internal pressure test (including structural integrity
and leakage evaluation).
(ii) A thermal test
Upon completion of this 1.2Am high model, its interior will
be completely sealed from the outside.
The two tests will be carried out separately first, within
elastic limits. The two sets of test results will be then super
imposed. At all load stages (with internal air-pressure), measurement
will be made of leakage rate. Later, an attempt will be made to .
carry out both tests simultaneously, again within the elastic range.
Finally, a large internal water pressure will be used to crack the
model beyond the elastic limit, up to plastic behaviour and final
collapse.
It should be noted that one of the major reasons why the model
was constructed was to try and simulate 'proof pressure' tests that
are performed on prototype reactor and pressure vessels, before they
are put in use, (Ref. Chapter 6). Construction joints, temperature
and shrinkage cracks, are all sources of leakage. How can these as
pects be modelled? This question is a difficult one,. It is hoped
that the test and subsequent results will provide, if not all, at
least part of the answer to the problem.
In this chapter, I will present suggestions on how the model
should be loaded and tested, the procedure for some measurements, and
a projected forecast of test results.

5.2 Internal Pressure Tests
5.2.1 The Air Pressure Test
The prototype structure is expected to resist an 'abnormal'
(DBA) pressure of 100kPa, without yielding. From the similitude
should also be loaded with a pressure of lUOkPa. In Section 2.5.1
I pointed out that air-pressures exceeding BOkPa would be dangerous
to test with. This test will therefore be kept within this range of
pressure, and should give an elastic response. More important is
that this test will simulate the 'structural integrity test' of the
prototype, with emphasis on leakage rate measurements.
The methods ~or these measurements will be similar to those
discussed in Section 6.6. Guidelines of the A.S.M.E. Boiler and
Pressure Vessel Code (Ref. 6.1) and the American National Standards
Institute (A.INI.S.I.) on 'Leakage Rate Testing' (Ref. 6.2) are followed,
where applicable.
Compressed nitrogen cylinders, can be used for pressurising
as discussed prev/iously (Section 2.5.1) both the steel hatchway door
and the simulated blast seal door should have leakage evaluations
made on them. Any excessive leakage in these areas should be sealed
up before further testing.
Pressure gauges on the 'air-vent', the nitrogen inlet tube(s),
the 25mm outlet pipe (and possibly one on the steel hatchway), should
be used to check on the uniformity of the internal pressure. Pressures
up to BDkPa should be made in 3, 20kPa increments, up to GQkPa,
followed by a further 2 instalments of 10kPa. The pressure at any
loading stage should be held for at least thirty minutes before all
readings are recorded. Unloading should be done similarly. About
A - 5 loading-unloading cycles should remove creep effects, to make
results comparable to the FEM analytical results.
requirements for pressure (Table 1.1), since

furm anSince the test should he 'elastic', any craci s
loading should close up upon unloading. I recommend • t ' a, • i j«si.: ,:i«
of leakage through cracks be done, by either the 'w;;t :r- .ubmer: it.ri
local leak test' or the 'vacuum test' utilising soap nibble form; t
in a vacuum glass cover (Ref. 6.2, Sections A.2 and A '), folio ed
by a leakage rate evaluation.
5.2.2 The Water Pressure Test
For reasons of safety, the water pressure test wil; i . a
on after the air-pressure test. This test should ele/a’e tnt . r>
from BOkPa to 100kPa; and the expected response should .till ' r
elastic.
5.2.3 Preparation
Air used in the previous test should be remove
tral cavity is filled with water. The air vent and t
should therefore be left open before testing commence
Accurate methods of determining the magnitude s
head' of pressure should be installed. Control valvt.
gauges should be checked when the model is full of wr
test begins.
5.2.A The Test
,The sequence should take this or'a similar fo: it:-
(i) Elastic tests (to compare with analyser cl. .
(ii) Crack creation tests, to check the ini',
pressure. This should get to the pressure of about
elastic. A thermal test should be then carried out J
(iii) Crack propagation tests to compare wit!
plastic analysis results; (100 - 200kPa).
(iv) Fracture test to obtain the yield a^d
as well as the ultimate failure pressure. (200kPa ).

-98-
Stages (i) and (ii) I suggest be done in 20kPa loading and
unloading instalments, up to 100kPa. This pressure should be ob
tainable from the 'elevation head' of the overhead tank in the
Hydraulics Laboratory.Four or five cycles of loading and unloading should remove
the short-time creep effects from the model concrete.
Stages (iii) and (iv) of the test are discussed briefly in
Section 5.6.
/

-99-
5.3 Creating Internal Heat
I suggest the principles of the heating system described
in Section 2.5.2, (Fig. 2.1), be adopted. The system basically
heats up the interior of the model, and controls the inner and outer
temperatures of it, (since the model is placed in an air-conditioned
chamber with its cavity continually circulated with temperature con
trolled water.)
Since the Hydraulics Laboratory at Sydney University is not
air-conditioned, same shield of low thermal conductivity material
(e.g. glass fibre) could be built around the model. The interior of
this shield would then be kept at constant temperature by an im
provised air-conditioning system.
The circulation required of the hot water in the model central
cavity can be created by the various pipes existing on the modBl.
The target initially should be to maintain a constant internal
temperature for at least 1 hour; and later to establish thermal
stable conditions (inside and outside the model) for at least 1 week.
5 .U The Thermal Test
This test should be carried out in at least two heating cycles.
In the first cycle, a basic outer and inner temperature should
be established, 2D°C say. The water temperature is then raised at a
rate computed using Fourier's Number (for the temperature rise rate)
or Nusselt's Number (for the boundary heat transfer) or the Thermal
Diffusivity, D (see Section 1.7.3). A rate of say <4°C/hour is then
set.
Temperature distribution readings with time are then taken
every 1 or 2 hours, until the required maximum temperature is reached
(about 70°CT in this case).
It should be expected that thermal strain readings may not

-100-
ngree with the mathematically analysed results. This Is 1 c:
of concrete. The creep and thermal strains get mixed up and
hard to separate precisely. This necessitates a secunil haul.'- , i ?
where the creep effect is assumed to be much less.
In the second (and higher) cycles, the rate of -em;
rise can be increased, if required. Otherwise it is car
the first cycle.
Most measurements should be done at midheight of ..el? {. or
reasons discussed in Section A.5). The temperature should not e
raised too high (no higher than 70°C) since the model s! ould
basically elastic after this test; for comparison with 1 . : L' '
results. (In any discrepancy of strain results, another ' 1 .rig
cycle should be carried out.)
Creep strains should be fairly small, so the str i ’
should be comparable to the thermal analysis results.
Cooling should be accomplished at the same ratE and unloading readings taken similarly.
5.5 A Simultaneous Thermal and Pressure Test
In this test use of air pressure is undesirable i
under pressure may create unprecedented explosions. *; h
water is therefore adopted. The water creating the hrz
model cavity must be pressurised to supply a measurable
pressure as well.
The system described in Section 2.5.2 (Fig. 2.1}
with a water circulating pump. This pump should be u i i
a pressure head, P, given by the Bernoulli's equation (
'static' or 'elevation' head made zero), as follows:
P + 1
-101-
—■* v: velocity of water in inlet duct
p: pressure exerted by the pump
Since the velocity of the water must be low and constant for
a uniform inner water temperature, the total pressure head, P, will
only be varied appreciably by varying the pump pressure, p.
Pressures should not exceed 50kPa and temperatures 50°C, for
safety reasons. The test will therefore be 'elastic', and results
obtained should compare well with the previous results obtained^by
performing the two tests separately and superimposing the results.
I suggest that the pressure is elevated in 10kPa increments,
and the temperature ir 1Q°C increments. Readings then be taken afterf
at least one hour har been allowed for conditions to stabilise.
The same instruments and devices used for the separate tests
will be used for this test.
It is assumed that the previous thermal test (performed over
at least two cycles), would have removed creep effects from the micro-
concrete. The strains and stresses of the model walls and slabs will
therefore be due to the internal loading only due to temperature and
pressure.
Unloading should be done using the increments used in loading.
After the last step of unloading, the model should remain untouched
for 2A hours, after which period measurements should be taken in
pursuit of any permanent set that might have occurred.

-102-
5.6 Testing to Failure
After all 'elastic' tests have been carried out, measurements
recorded, and results compared with analytical results uith satis-
facation, the model uill be overloaded uith internal uater pressure
until it fails.
The purpose of this test (as outlined in Section 5.2.A), is
basically to investigate crack propagation, yield and collapse
mechanisms.
The test should see internal uater pressures elevated from
100kPa to about 2A0kPa uhen the first yield lines should form. I
suggest that loading be performed in 20kPa increments from IQQkPa to
200kPa, and thereon folloued by 10kPa increments up to the state of
collapse. At each pressure increment level, at least 20 minutes
should be alloued before all readings (of deformations, rotations,
etc.) are recorded. Widths, patterns, orientation and propagation of
all cracks should be recorded (by photography, say). This fact is
of even greater importance at pressures above 2A0kPa, uhen yield
line mechanisms are expected to start forming.
The results obtained from this test should normally not agree
uith computed ones. They should therefore serve as useful tools in
remedying the theoretical analytical methods uhere they are in error.
/5.7 Expected Results of the Internal Pressure Tests
5.7.1 Air Pressure Results __
The air pressure test is to give an elastic structural response;
up to BOkPa; it also simulates the prototype structural integrity test.
The ualls and roof are expected to 'bulge' out, creating cracks
of penetrations less than 30% of the uall/roof slab thickness. These
should seal up upon unloading.

- UJ3-
Straln measurements expected in the longitudinal, radial
hoop directions are shown in Figs. 5.1 (a), (b) and (c) below,
for selected portions of the model structure.
(a) Longitudinal Strain (b) Radial Strain
(c) Hoop Strain
Fig. 5.1 Expected 'Elastic' Strains Distribution

Expected deflection ret Its are similar to those analysed by
the two-dimensional FEM discussed in Chapter A (see Section A.2,
and Figs. A.2(a) and A.2(b) ). If the deflections actually are as
expected, areas of ’through' cracking mill be established.
5.7.2 Water Pressure Results
This test is in two parts, the 'elastic' one and the 'post
elastic' to failure part. In the elastic test, taking the pressure
to about 100kPa, the air pressure test results discussed in the pre
vious section should be expected. Any early 'through' cracks (not
expected) should be seen by water leakage. These should be sealed up
before testing continues.
In the post-elastic test, crack patterns should be clearlyt
identifiable, and eras., propagation should be noted. Just above the
test pressure of IDOkPa, crack widths of between O.OAmm to 0.20mm on
the walls, and crack widths of up to 0.10mm on the roof, should exist.
At overpressure, excessive vertical cracking begins on the
internal face, growing slowly outwards as the pressure is increased.
Horizontal cracking on the outside should follow, before vertical
cracks appear on the outside also. Before failure, inclined cracks
at 30° to A5° to the vertical appear. All previous cracks then pene
trate the wall thickness as the water is rapidly lost from the model.
This leads to yield lines forming on all slabs as the vessel collapses./
Fig. 5.2 (a) shows the sequence of cracking observed by the
Kajima Group (Japan) in one of their models (Ref. 2.1). Fig. 5.2 (b)
indicates the 'yield lines' to be expected on each slab.
Excessive deflections and strain's occur before failure - these
should not agree with the analysed results. Record of these readings
is therefore essential.

SequenceInternal pressure
at cracking kg/cm 2
© 70 ~ 8 0
. © 8 0 ~ 9 0
© 1 0 0 — 1 10
Fig. 5 *? (a )Schcmatic Drawing of Cracking Sequence

Fig. 5.2(b) Yield Lines at Failure for Vail and Roof Slaos
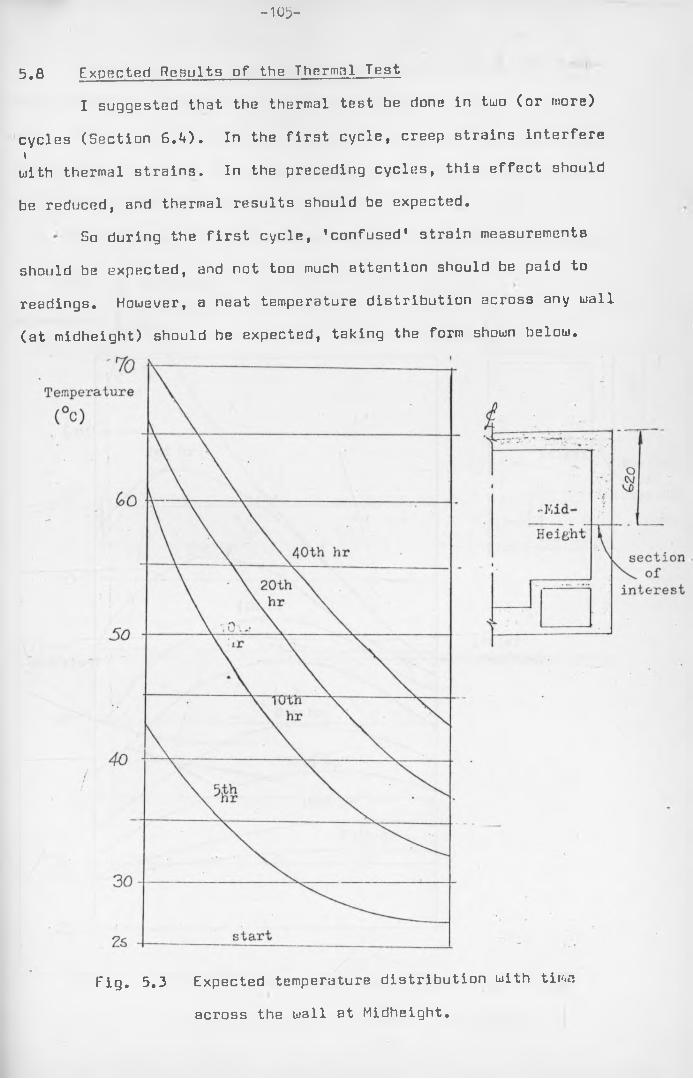
-105-
5.fl Expected Results of the Thermal Test
I suggested that the thermal test be done in two (or more)
cycles (Section G.tO. In the first cycle, creep strains interfereiwith thermal strains. In the preceding cycles, this effect should
be reduced, and thermal results should be expected.
So during the first cycle, 'confused' strain measurements
should be expected, and not too much attention should be paid to
readings. However, a neat temperature distribution across any wall
(at midheight) should be expected, taking the form shown below.
Fig. 5.3 Expected temperature distribution with time
across the wall at Midheight.

-106-
During the second cycle (and any Following ones), the temp-
ature distribution should be basically the same as in the first
cycle. The curves become more and more straight as the temperature
is increased, and also as stable thermal conditions are maintained
for longer periods of time.
On cooling, curves of the nature shown below should be expected.
(outersurface)
Fig. 5 .U Expected Temperature Distribution (with time),
across the wall at Miriheight, on cooling.
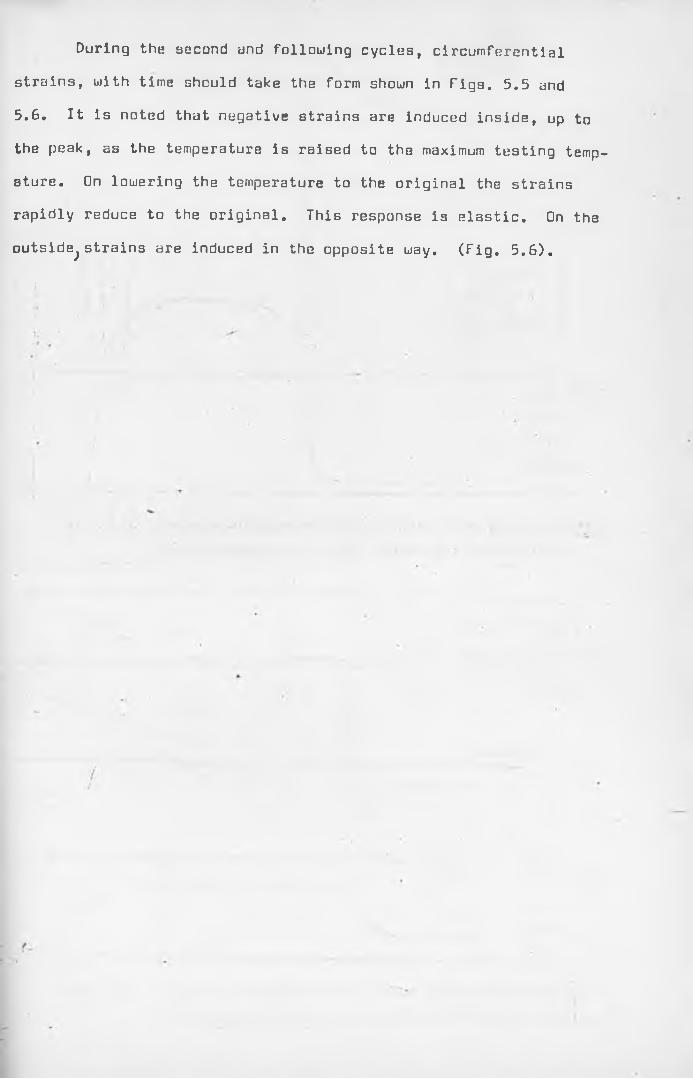
During the second and following cycles, circumferential
strains, with time should take the form shown in Figs. 5.5 and
5.6. It is noted that negative strains are induced inside, up to
the peak, as the temperature is raised to the maximum testing temp-
ature. On lowering the temperature to the original the strains
rapidly reduce to the original. This response is elastic. On the
outside^strains are induced in the opposite way. (Fig. 5.6).
' . i

T-emp.'m
Fig:.. $^5, Sxpsetect Circumferential- Strain Meaof Inner Surface i^tUr temperature during highar hRating cycled.-

At stable thermal conditions, the outside temperature is
elevated to the 1 stable maximum' and the distribution across the
micro-concrete wall should be almost linear. With good instrumentation
this aspect shown in Fig. 5.7, should be established.
Fig. 5.7 Expected Temperature Distribution across the wall at Midheight at Stable Conditions.
Across the roof slab and wall, contours of uniform temperature
distribution should take the form shown below.
Fig. 5.8 Uniform Temperature Distribution Contours.
£2
.0
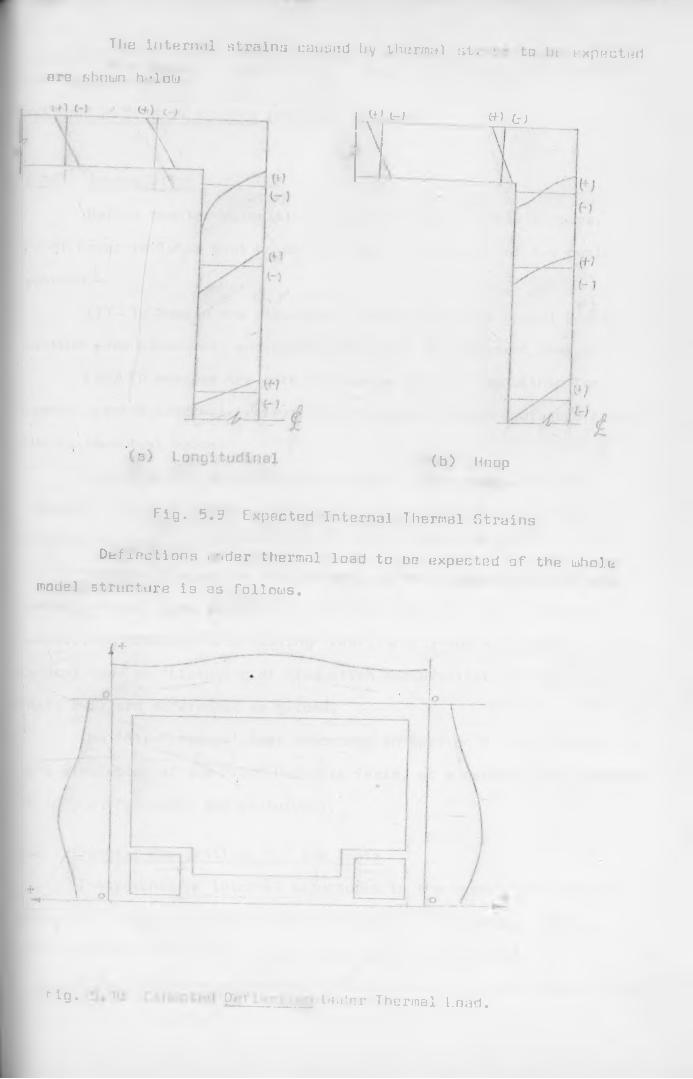
Tl',e intern,)! strains caused by thermal ul, tn ht expectedore shown h-* 1 at-.i
« 1 t-iT\
«•> c-j
(b) Hnop
Fig. 5«? Expected Internal Thermal Strains
Daflocdofis ! r,der thermal load to he expected of the whole rondel structure is as follows.
ri9* £> ; ....._ iu,her Thermal Load.

-111-
TESTING OF REACTOR UEGSELS (PRESSURE VESSELS)
6.1 Introduction
Before reactor vessels can be put to use of their purpose,
Proof Pressure Tests must be carried out. These are for tuo basic
reasons:-
(i) To assess the structural integrity of the vessel under
maximum peak pressures, and detect any areas of permanent damage.
(ii) To measure the rate of leakage of air from uithin the
vessel, as the internal pressure is increased to (and decreased from)
the maximum test value.
Repetition of tests may be necessary after repairs or al
terations are made to the structure, due to faults found during
original tests. ' ’
In this chapter the requirements of the A.S.M.E. Boiler and
Pressure Vessel Code (Section 3, Division 2), (Ref. 6.1 ) and the
A.N.S.I. on 'Leakage Rate Testing' (Ref. 6.2 ) and the U.S.A.
Federal Code on 'Licensing .of Production and Utilization Facilities'
(Ref. 6.3) are referenced as guides.
The 'Air-Pressure' Test described in Section 5.2.1 is aimed to
be a simulation of the Proof Pressure Tests, at a maximum test pressure
of 100kPa (for model and prototype).
6.2 General Preparations for the Tests
Instruments or internal structures in the vessel sensitive to
damage by pressure differential are removed or protected. The air-
conditioning system of the vessel is protected similarly.
Lines and vessels containing fluids that may become pressurised
CHAPTER 6

-112-
arc depressurised to prevent accidental addition of fluids to the
vessel during the testa.
Environmental conditions that play an important part prior
to the tests are:-
(i) Heather
(ii) Air-conditioning
A dry mindless period under stable atmospheric pressure con
ditions is essential for the accurate test pressure control.
A four hour air-conditioning of vessel before the test,
stabilises the temperature and humidity mithin the cell.■ * 1 ' ■i y
6.3 Test Equipment and Facilities
Readings from all deformation measuring instruments are recorded
for 2 days prior to the test to ascertain stability of instruments
and the environment.
During pressurisation, the air compression equipment is re
quired to increase the pressure to the maximum test level rapidly,
mhile maintaining a stable temperature and humidity in the vessel.
For lorn humidity, cool night air is preferable. Indeed, compressors
are normally equipped mith after-coolers and dryers.
Temperature measurements are compared mith a reference thermo
meter of established calibration; corrections are made available
during the test.
The relative humidity mithin the cell is monitored during the
test for vapour-pressure corrections (using remote met and dry bulb
thermometers).
Pressure measuring equipment (e.g. barographs) are calibrated
prior to the test. For a test pressure of P = 100kPa, indicatingr max ’ aPressure gauges mould need to have a range of about 200kPd.
Without special decompression facilities, personnel mould not

be stationed within the pressurised vessel at pressures greater
than 20kPa, for any length of time.
6 . The Tests
'Structural Integrity' and 'Leakage Rate' are tested as de
scribed below to constitute the Proof Pressure Tests for the vessel.
A test pressure of 100kPa is used for the discriptions following
here-under.
6.5 The Structural Integrity Test
6.5.1 Loading
The test pressure (that is not to exceed 10DkPa) is preferably
applied in 6 loading stages: A increments of 20kPa (up to BQkPa),
and 2 of 10kPa up to the total of 100kPa.
At all stages results are compared with the expected ones. In
case of any anomaly, a decision must be made on whether to continue
or abandon the test.
Unloading steps should be the same as the loading ones, with
equal time intervals. Thirty minutes is a suggested time to hold the
pressure constant before recording of deformations are made.
6.5.2 Deformation Measurement
Measurement of deformation and structural performance are in
strains, rotations, deflections and crack widths and crack patterns.
A concentration of strain gauges is required in areas expected to
crack - e.g. construction joints and areas of maximum bending moment.
Strain gauges can then be used to indicate an increase in crack width
or a birth of a new crack. Recommended are vibrating wire type
strain gauges, over 100mm in length, situated within the structure at
critical cracking positions.t . .
Upon removal of the concrete cover, 25mm electric resistance
strain gauges are attached to the reinforcement bars, where such
Measurement is required.

- ' I M "
The minimum accuracy of strain gauge measurements specified
by the A.S.M.E. Code is + 5% of the maximum expected strain. For
this test, + 60 micro strain.
Deflection and Rotation measurements are best carried out by
optical methods. The ’optical plumbing' method using a Uatt’s Auto
plumb, say, equipped with an optical micrometer, is recommended,
(Appendix 2, Ref. 6.A ). Deflections normal to the walls and roof
at the centre should be recorded; also changes in slope at chosen
locations need recording.
Twenty four hours after the final depressurisation, deformations
should be measured to check for any permanent set incurred by the\ \ l ' . jtest.
6.6 The Leakage Rate lest
6.6.1 Stages of Leakage Measurement
Three distinct stages of leakage measurement are required:
(i) The Reduced Pressure Test, carried out at g pressure
not less than 0.5P (P = the ’abnormal’ or 'incident maximum'a apressure), maintained for 2A hours. In this case, a pressure of
55kPa is recommended.
(ii) The peak pressure test, 1D0kPa, also applied for 2A hours.
(iii) Uerification of Leakage Test accuracy, for which a
method described in Appendix C of Ref. 6.2 is suitable. The method
requires use of a calibrated leak through a microadjustable flow
valve installed at a convenient penetration. The leak system is
operated immediately after the 2A hour test period, for a few hours.
6.6.2 Seguence of Tests
The reduced pressure test and the peak pressure test may he
carried out separately, following each with a verification test.

If nut, the ti’uta may be r rried out continuously,, mith
verification after each ?Jt hour period. With t.hig. alternative,, i tn
U day3 (continuous) may be required for the tegtu
6.6.3 Leakage Rate Measurement
The 'Absolute Method' described in Ref* 6..2" Cthe A..N..S..I..1
is recommended. It requires measured values of direct, pressure,,
absolute temperature and humidity, for colcuation; cf sir less: frem
the pressure vessel.
The percent leakage (L90 is then given by.::--
T1 P21% * (1 - ) * 100 ................... ...... *6T2 P1
-subscripts '1' and '2' refer tc ''atari. of test'1 and 'end of test' conditions, respectively.
-T and P are the mean absolute temperature and. the total absolute pressure, respectively%
A correction ig made for the mater-vapour pressure (P^)
variations in the atmosphere, viz:
( • T* (P„ - Pv ) )l x ■ ( 1 - r —n r — > * 1QQ. 6*2
( ' 2 ( 1 " vr )
(A derivation of these equations is given in Appendix 6A)*
Hourly leakage rates should be calculated and plotted conr» tinously during test to reveal any gro33 discrepancies that may be latent
6,6.L Leakage at Penetrations
During the test, it is important that penetrations are located
by the 'soap bubble method', say (Ref. 6.2 ). Leakage should then be
evaluated by the 'Type A' test defined by the U.S.A, Federal Code
(Ref. 6.3 ), on all penetrations. Indeed, it mould be morthmhile to
perform the 'Type O' test (from the same code) on the penetrations
after the 'Type A' tests have been completed.

-116-
DISCUSSIONS AND CUNCL1J5I0N5
7.1 Introduction
In the preceding 6 chapters, I have presented 'A Study of
Cracking in Reinforced Concrete Pressure V/essels Using Micro-Con
crete Models', based on experimental and analytical results obtained
from uork done to date, in this field.
Pressure vessels such as mater tanks, boilers and reactor
vessels, all have containments that must not be allomed to leak out
under any loading, particularly under internal pressure. A pressure
boundary must therefore exist betmeen the inner containments of the
vessel and its environment. This boundary (such as the thick concrete
mall in a reactor vessel) must maintain its integrity for all loadings
normal and accidental. The analysis and subsequent design of pressure
vessels is therefore geared to prevention of excessive cracks that
create leakage paths.
The discussion folloming mill be directed particularly to
Reinforced Concrete Pressure Vessels (RCPV's) - unprestressed - mith
particular reference to the reactor vessel considered in this thesis.
In discussing leakage through concrete, a point should be born
in mind. Concrete is neither homogeneous nor isotropic. Fissures
exist in the material. With shrinkage and high internal pressure,
some cracks could develop around these small holes. The inevitable
leakage resulting may not be dangerous, but should be assessed and
ascertained to be belom the magnitude given in Codes of Practice for
Environmental safety.
CHAPTER 7

7.2 Crocking in Reinforced Concrete Pressure Vessels (RCPV'n)
7.2.1 RCPU1s
The main features of construction and loading for these
vessels have been outlined in Chapters 2 and U.
Loadings are basically dead loads, thermal and pressure
transient loadings, shrinkage, and possibly dynamic loadings. These
may act individually or in combination.
On construction, a significant feature in this particular
vessel is that it is not provided with steel liners or other leakage
membranes. Under a large internal pressure, this may lead to the loss
of the integrity of the pressure boundary, and subsequent leakage of
the containments. This aspect must be investigated in a model of the
RCPV. The mathematical model developed by McGeorge and Swec (Ref. *4.1)
evaluates the percentage crack penetration and subsequent leakage. To
gether with this mathematical analysis, a micro-concrete model is .
necessary to investigate regions of excessive cracking and leakage.
In the event of excessive leakage, alternatives must be sought.
These would include introducing leakage membranes; or using prestressed
concrete to decrease crack width and penetration.
An RCPU may have construction joints in the shielding walls.
These are potential sources of leakage. A solution is to introduce
a barrier in the leakage path, in the form of plates, as shown below.
Construction Joint
Concrete Wall
Fig. 7.1 Construction Joint with a Leakage Barrier.

An f?CPV/ must have penetra Long for filling the interior
with contents (and for refuelling rods in the case of reactor vessels).
These could be pipes, small windows, doors, etc. Due to the strain
and stress concentrations at these points, local cracks may develop.
model test, and also during the structural integrity test of the vessel.
In order to assess the leakage thruugh cracks and penetrations
in the pressure vessel walls and slabs, a Fluid Mechanics model is
required to simulate the air flow under pressure through cracks.
Using such a physics model, derivations of 'leakage evaluation equations'
(outlined in Appendix 6A), are made possible.
7.2.2 Cracking
Two main types of cracks are encountered in RCPV's. These are:-
(i) Flexural Cracks
(ii) Shrinkage Cracks
Flexural cracks are of less importance since they tend the seal up
after removal of load, if they are not excessive.
Shrinkage Cracks
The massive nature of the concrete walls of a reactor vessel
introduces shrinkage cracks formation.
The leakage rate at these points must be determined by a simulated
shrinka,cracks
7
(a)
LEAKAGE
flexuralcracks
fig. 7.2 Shrinkage Cracks

- I I'J-
Under no (or low) Internal load, cracks formed by shrinkage
would remain open (Fig. 7.2 (a). Under load, zones of the slabs in
compression would tend to seal up the cracks, while the zones in
tension would tend to open them up. Where neither exists, i.e. in
zones of contraflexure, leakage paths would be created as 'through'—
cracks - Fig. 7.2 (b). (These zones (points) were indicated in Figs.
U.B (a) and (b).)Other types of cracks may result from thermal effects. Such
effects could be caused by the heat of hydration of cement in the
concrete, especially during (and soon after) construction. Other
thermal effects are the SBA and DBA temperature transient loadings, discussed in Chapter A (Sections and ^.7.2).
Cracks created by temperature differentials across a concrete
wall (except for shrinkage cracks), would be much less serious, with
respect to leakage of containments.

- r / . u -
7.3 Models
The two types of model that are considered for investigating
RCPV's are:-
(i) Mathematical Model using a Finite Elements Method (FEM)
of analysis; and the
(ii) Direct Model constructed with micro-concrete.
7.3.1 The Mathematical Model (FEM Analysis)
In Chapter A, I described at length how the FEM analysis was
developed and used to analysis two RCPV's, one as a 'thin' shell (twor
dimensional), and the other a3 a 'thick' shell (three-dimensional -
McGeorge and Swec).
The 'thin' shell model can be used to predict the 'elastic'
structural behaviour, as well as the 'elasto-plastic' behaviour.
However, because this model-does not take into account the wall thick
ness of the vessel, the results can be incorrect and very misleading,
since the wall thickness is among the most important aspects of an
RCPV.
Also, crack3 due to the anisotropic nature of concrete, the
'doming' action of the vessel under load, creep and shrinkage; are
all unaccounted for in the 'thin' shell model.
The results of the analysis of this model, then should only
be used as a guide:’for preliminary decisions about a micro-concrete
model. They can also be used to roughly predict the behaviour of the
micro-concrete model, for purposes of choice of scale, instrumentation
etc. These results, on their own, are definitely inadequate.
The 'thick' shell model is more representative of the structure.
Results obtained by using this three-dimensional model, both by the
RCPV Research and Development Group, Kajima Corporation, Japan (Refs.
1 and 2.2); and by R. McGeorge and L. F. Gwec Jnr (Ref. <«.1), showed
vBry good comparison with results obtained from micro-concrete models.

-121-
The plane-strain finite element developed by M. A. Taylor
and others, (described in Section A.5.1), takes into account all
the properties of reinforced concrete relevant to cracking analysis.
Using this element in the FEM iterative procedure analysis shown in
Fig. yielded results discussed in Section **.7, that agreed well
with the observed experimental results. This iterative procedure
allows for a consideration of several load types in various combination
and sequences, the identification of critical cases, and also minim
ises the amount of computational effort. With this method, relatively
accurate predictions of cracking can be made with certainty on the
behaviour of an RCPV.
7.3.2 Direct Model (Micro-Concrete)
A direct model of reinforced concrete must be made of micro-
concrete. Such a model allows for measurements of deformations, and
other prototype quantities of interest, directly from the model. The
model scale must therefore be 'large', so that very little 'scaling-
down ' is performed. Furthermore, in the process of achieving this
'direct' aspect, distortion of similitude laws is quite often in
evitable.
In Chapters 1 and 2, I pointed out the difficulties encountered
in modelling characteristics that are peculiar to reinforced concrete,
namely shrinkage, creep, cracking, bond, and reinforcement. Some of
.the solutions discussed called for distortion of some quantities. ForVexample, in similating large deformations , the requirement was
£ . In this case with a serious change in geometry
occuring, a distorted model was required with slightly less than
unity. Other examples demanded that = 1, which necessitates
building a full scale model.
The difficulties encountered in modellino leakaqe rate at

-122-
penetrations and construction joints cannot ho easily overcome. This
aspect is best observed and measured accurately during a model test;
using equation 6.1 and 6.2 for leakage assessment.
Other characteristics that require careful observation during
testing are properties of cracks such as widths, propagation, orient
ations; and also formation of through-cracks resulting in further leakage.
When modelling for thermal effects, the most common quantities
considered are temperature & , time t , coefficient of expansion c t ,
specific heat C , thermal conductivity ^ and the heat transfer
coefficient , h . Temperature and time can he modelled individually.
The other quantities are normally combined together for model assessment,
when similitude laws are applied to quantities like the thermal dif-
fusivity (D = k/cy^O or Nusselt's number (M = hl/k), and others.
These quantites sometimes cause severe distortions on thermal models.
A summary of the distortions and the corresponding corrections (pre
sented by Hovanesian and Kowalski, 1967) are shown in Table 1.2,
Section 1.7.3).
7.A Construction and Testing of Micro-Concrete Models
7.A.1 Construction of Hoctel
The scale chosen for a reinforced micro-concrete model plays
a very important part in its construction. This is of particular/
importance in the size of the reinforcement bars. Steel rods of
diameters less than 1mm are impractical. The choice made in this case
of using 2mm diameter rods throughout, (Chapter 3), for reinforcement
was almost inevitable. This led to changing the spacing and 'number
of bars' used in the prototype, for the model. This in turn led to
rather incorrect modelling of bond and crack widths characteristics.
The inherent distortion ua3 assessed to be in error within 5% - 10%.

-123-
RCRV's are heavily reinforced. During construction this creates
problems in spacing layout and vibration of the mortar (micro-con
crete). The solution that was sought was the use of steel templates
for guidance in spacing, have a spacing restriction of not less than
15mm; and then use a miniature poker vibrator for the mortar, 10mm
in diamter. Equations 3.1 and 3.2 indicating the scaling factors
teat were used to satisfy the reinforcement area similitude only.
The model had its construction planned in 6 stages, as a
construction joint was to be made at each stage. (This procedure is
similar to that followed in the erection of a. typical prototype RCF\/).
Strain and other types of gauges that have to be embedded in
the mortar require very careful placement. These are therefore kept
to a minimum.
7.A.2 Testing of Kodel
Since the model has not been constructed to completion, I
outlined in Chapter 5 how I think testing should be done. This outline
of testing depends on the construction procedure followed, which I
planned out and presented in Chapter 3. However, in the event of any
change in construction and instrumentation, changes in testing pro
cedure may be necessary.
The expected results that I've laid down in Chapter 5 (Section
5.7 and 5.8) have been based on the results obtained from:-
(i) the PCPV Research and Development Group, Kajima Corporation
Japan (Refs. 2.1 and 2.2) experiments
(ii) Results of the computer programme 'SCEAP' (Section A.S.5)
that analysed this RCRV as an 'elastic, thin' shell; and
(iii) the results obtained by KcGeorge and Swec (Ref. A.1) in
the analysis of a mathematical model of a similar structure, as a
'three-dimensional, non-linear, thick shell'.

I h<3v/b nut attempted to predict the amount uf leakage or
leakage rates to be expected. The structural integrity and leakage
rate of the prototype should be simulated directly by the model test
(Chapters 5, 6). Indeed thi3 is one of the main reasons why a
decision was made to construct this model at Sydney University.
During the testing of the model, keen and careful observation
and record should be made of:-
(i) Flexural and shrinkage cracks
(ii) Widths, penetration and propagation of all crack3
(iii) Location of leakage and its evaluation (using equations
6.1 and 6.2 given in Chapter 6)
(iv) The failure mode as a result of the formation of 'yield
line' mechanisms, under excessive pressure.
Conclusions that will be drawn from observations of these
phenomena, will advance the 'Study of Cracking in Reinforced Concrete
Pressure Uessels Using Micro-Concrete Models' , one step forward.

ACKNOWLELGEKIMTS
I wish to thank Dr H.G. Smith (Senior Lecturer, Lepartment of Civil Engineering, University of Sydney) for his guidance and assistance during the preparation of this thesis,
I also acknowledge with gratitude the permission given to me for use of information and diagrams included in 'Investigation Report Ko. S 175' of the School of Civil Engineering (June, 1975)
I also thank the laboratory staff of the concrete laboratory at Sydney University, for their assistance, help and patience during the tests and model fabrication.
Plenty of thanks too, to Miss Jeni Beahan for typing this document with dedication.
i
A . E .// • I‘i •

REFER KT.'CES
Chapter 11.1: American Concrete Institute Publication No. 24:
t
'Models for Concrete Structures' - 1970 1..2: C.M. Sabins, R.N. White: 'A Gypsum Kortar for
Small Scale Models', ACI Journal, Proceedings V64* No. 11 - November, 1967
1.3: H.J. Cowan, J.S. Cero, G.D. ling and R.W. Kuncey:'Models in Architecture'. Elsevier Publication,London - 1968
Chapter 22.1: Kajima Institute of Construction Technology, Japan.
PCPV Research and Levelopment Group, Kajima Corporation 'Concrete Model Tests on Prestressed Concrete Pressure Vessels (Part 2)* - September, 1973
2.2: Kajima Institute of Construction Technology:PCPV Research and levelopment Group, Kajima Corporation 'Concrete IMdel Tests on Prestressed Concrete Pressure Vessels (Fart 3)' - October, 1973
2.3: Kajima Institute of Construction Technology:PC?V Research and levelopment Group, Kajima Corporation 'Concrete Model Tests on Frestressed Concrete Pressure Vessels (Part 1)1 - March, 1973
Chapter 44.1: R. EcCeor0e and I»F. Swec Jnr: 'Refined Cracked Concrete
Analysis of Concrete Containment Structures Subject to Operational and Environmental loadings'. Nuclear Engineering and Iesign 29 (1974) 58-70, North Holland Publishing Company - May, 1974
4.2: The Australian Concrete Structures Code of PracticeAS 1480 - 1972
4.3: K.A. Taylor, K.M. Romstand, n.R. Herrmann and M.R. Ramey:'A Finite Element Computer Programme for the Prediction of the behaviour of Reinforced and Frestressed Concrete Structures Subject to Cracking'. Department of Civil Engineering, University of California - June, 1973
4.4s A.S.M.E. 'Standard Code for Concrete Reactor Vessels and Containments', Section III, Division 2 - 1975

\ ~ V ) -
4.5s A.O. Currie: 'Elastic Analyses of Orthogonal Slab andWall Structures Using 'SWEAP''. Technical Report No. U29 School of Civil Engineering, University of Sydney - January, 1976
4.6: School of Civil Engineering, University of Sydney: 'Investigation Report No. S 175' - June, 1975
4•71 O.C. Zienkiewicz: 'The Finite Element Method in EngineeringScience'. KcGraw-Hill, London - 1971
4.8: P.F. Walsh: 'A Computer Programme for Orthotropic PlaneStress Analysis' - Forest Products Technical Note, No. 12, Division of Building Research, CSIRO - 1975
Chapter 66.1: A.S.M.E. Boiler and Pressure Vessel Code for 'Concrete
Reactor Vessels and Containments'. Section 3t Division 2 -1975
6.2: American National Standards Institute: 'Leakage-RateTesting of Containment Structures for Nuclear Reactors':N45.4 - 1972
6.3: U.S.A Federal Code - Tart 50 - Licensing of Productionand Utilization x'acilities', Appendix J (AEG 1C<J - RF - 10)- 1973.

APPENDIX 3A
Tabulated below are results obtained by testing (100 x 200)n:m cylinders of the mortar that was used in the construction of the micro-concrete model. The cylinders were 7 days old (Cast on 12/1/76 and Tested on 19/1/76).
Park Ko. Type of Test UltimateLoad(kN)
Strength at 7 days (MPa)
Type of Fracture
Strength at 28 days (iPa)
491 COMPRESSION 148 18.25 / 27.4
492 COMPRESSION 142 17.54 26.1
493 COMPRESSION 140 17.27 A 26.0
494 TENSION 66 2.04 <X 3,06:
495 TENSION 61 1.89 (I . 2.84
496 TENSION 65 2.00 G ) 3.00 ’
E Table 3A Results for Test Cylinders
The formula used to convert the strength of the 7 days old sample to that of a 28 days one is empirical:*
^ 2 8 = 1 ' ^ ^rj
The compressive strengths were slightly lower than required; the tensile strengths were as required (31HFa Compression, 3»h'‘Pa Tension).
Overall, the results were satisfactory.

Alongside with each batch of mortar used for casting of construction Stage 1, strength-checking cylinders were (100 x 200)iwn, and 28 days old.(Cast 20/1/76, tested 17/2/76)
MarkNumber
BatchNumber
Type of Test UltimateLoad( k N )
Strength at 28 days (MPa)
Type of Fracture
515 1 C O M PR E SSIO N 230 28.4i l
516 1 T E N S IO N 96 2.96<
517 2 C O M PR ESSIO N 255 31.4 n518 2 CO M PR ESSIO N 247 30.5 / f
519 2 T E N S IO N 99 3.05 -0520 2 T E N S IO N 97 2.99 -^1 6)>
521 3 CO M PRESSIO N 256.5 31.6 X522 3 CO M PR ESSIO N 250.0 30.8 X .
923 3 T E N S IO N 99 3.05 X
524 3 T E N S IO N 101 3.11* 0 X
Table 3B Test Results for 'Sta^e 1' strength check.
The results are in good agreement with the required strengths of the mortar required, i.e. 31kPa in compression and 3.1MPa in tension.

APPKNDIX 6A
The Lcteimiination of Leakage- Hate using the Absolute kethod.
In this method: Nomenclature
P ^ = W1RT1 and PgV = WgRTg
V l v and V *P„ R
Therefore,
W1T1 * W2T2
Whereby,
R
P p = Total absolute pressuresr 2in vessel at the start, and end of testing interval,
T^, T^ = Kean absolute temperature at the start, and end of testing interval.
V VWeight of contained air at the start, and end of testing interval.
W1 =V2T2P1
T1P2
Consequently,
and W, W1T1P2T2P1
Leakage =W - W*1 __2
w"w, ( -S
2P12 l T,P2
- li
2 C T1P2 )
= 1 -
and Percentage Leakage,
1 2
T1P2T2P1
V = Internal volume of vessel, assumed to remain constant during test.
R = Cas constant for a perfect gas.
P P v1 v2Water-vapour pressure at the start, and end of the test interval.
i* = ( 1 - y y - ) * 1 0 0 ( 2P1 )
6.1
Corrections for changes in v/ater-vapour-pressure in the contained atmosphere are made by modify ing the base equation as follov/s:-Percentage Leakage,
T1 (P2 " Pv?)L°/° = 1 - s r - 7 p --------p— y * 100 . . . . 0 . 2
l 2 V 1 v 1 '