Embed Size (px)
Citation preview
CEOSEA '98 Procee{)in.9J, CeoL. Soc. MnLaYJin BuLL. 4J, December 1999; pp. 507-519
Ninth Regional Congress on Geology, Mineral and Energy Resources of So'utheast Asia - GEOSEA '98 17 - 19 August 1998 • Shangri-La Hotel, Kuala Lumpur, Malaysia
A study of fluid inclusions at the Cikotok Gold Mine, West Java, Indonesia
1Geological Research and Development Centre - Jalan Diponegoro No. 57 Bandung 40122, Indonesia
2Curtin University of Technology Australia
GEOSEA '98
Abstract: The Cikotok gold-silver deposits are located about 250 km west of Bandung and 200 km southwest of Jakarta. The rocks hosting the precious metal mineralization are Oligo-Miocene felsic volcanics known locally as the "Old Ande'site Formation". They form part of the Bayah Dome Complex, the uplift of which is believed to have caused the fracturing which allowed infiltration of mineralized quartz veins during the Pliocene. The host rocks are calc-alkaline, island arc volcanics consisting of basalt, basaltic andesite, andesite and dacite. Geochemical data provide evidence of strong crystal fractionation, with most rocks exhibiting a moderate negative europium anomaly. The parental magmas were derived by variable amounts of partial melting of a LREE mantle source.
The Cikotok ore deposit is typified by a high silver content which occurs as fine-grained argentite and possible as electrum.Gold is submicroscopic and was not identified during SEM analysis of the ore assemblage. It is, however, believed to be associated with chalcopyrite, sphalerite and galena which postdate an earlier phase of pyrite mineralization. The ore minerals occur in large sulphide-bearing quartz veins and in hydrothermal breccias.
Doubly-polished thin sections, approximately 50 pm thick, were prepared from vein quartz collected at various levels in the Cikotok mine. Ten doubly-polished thin sections were prepared but only three were suitable for fluid inclusion study; the others lacked large enough inclusions. The three samples contained measurable two phase fluid inclusions and were analysed to determine the homogenization temperature. Samples were collected from Level 200 (YN303), Level 300 (YN294) and Level 400 (YN290). The depth difference between each level is approximately 30 m. Microthermometric studies were performed using a Fluid Inc. adapted USGS gas flow heating/freezing system mounted on a Leitz Laborlux microscope that is fitted with a Sony CCTV system. .
Measurements of primary inclusions in quartz veins from the Cikotok mine suggest that the homogenisation temperature and salinity of the fluid inclusions (1.18 eq wt % NaCl) are in agreement with the temperature of the deposition of gold and metal-bearing fluids.
There are two types of fluid inclusions: 1) H20-rich with vapour (two phases) and 2) single fluid
phase (HP gas and CO2
gas). The freezing point measurements (-O.l°C to -3.7°C) yield salinity estimates of 0.1-3.15 eq wt % NaCl. The fluid inclusions with a salinity < 3.2 wt % NaCl should have a meteoric origin. The homogenisation temperatures for the fluid inclusions lie between 184°C and 306°C, with a mean 245°C. Trapping pressure of 40 bars was obtained from the P-T plot of Shepherd et al ., (1985) by using the homogenisation temperature of 245°C. This is equivalent to a litho static load, and therefore depth, of210 metres . These are typical ofthe low salinity epithermal gold deposits common within active hydrothermal systems and within epithermal gold deposits. These results are similar to those ofSilitoe (1977), who concluded that epithermal deposits which often contain precious metals were deposited from low temperature (200°C-300°C), low salinity « 2 eq wt % NaCl) meteoric water.
INTRODUCTION
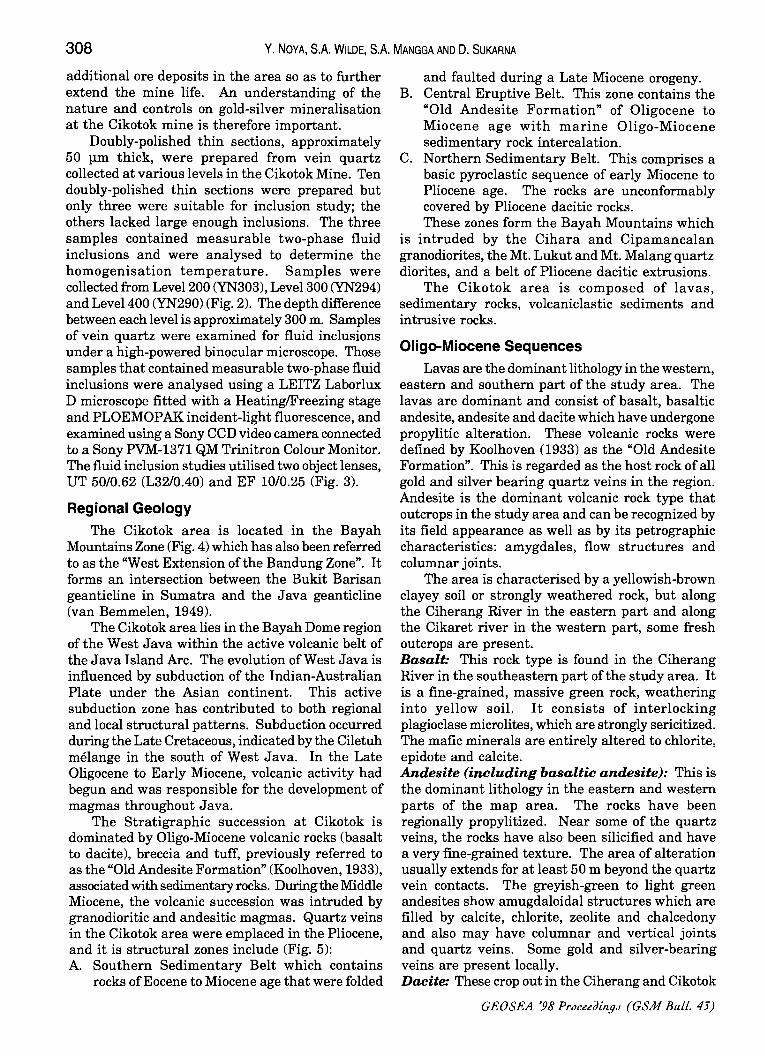
The Cikotok Gold Mine is located in the Bayah area of West Java (Fig. 1) and is one of the major gold and silver deposits in the region (van Bemmelen, 1949). The deposits are associated with
calc-alkali basalt, basaltic andesite, andesite and dacite volcanic rocks. Approximately 6.02% of the total gold mine in production in Java. Ore reserves are being gradually depleted and current estimates are that they will last for another two years (from 1993). It is therefore very important to find
308 Y. NOVA, S.A. WILDE, S.A. MANGGA AND D. SUKARNA
additional ore deposits in the area so as to further extend the mine life. An understanding of the nature and controls on gold-silver mineralisation at the Cikotok mine is therefore important.
Doubly-polished thin sections, approximately 50 pm thick, were prepared from vein quartz collected at various levels in the Cikotok Mine. Ten doubly-polished thin sections were prepared but only three were suitable for inclusion study; the others lacked large enough inclusions. The three samples contained measurable two-phase fluid inclusions and were analysed to determine the homogenisation temperature. Samples were collected from Level 200 (YN303), Level 300 (YN294) and Level 400 (YN290) (Fig. 2). The depth difference between each level is approximately 300 m. Samples of vein quartz were examined for fluid inclusions under a high-powered binocular microscope. Those samples that contained measurable two-phase fluid inclusions were analysed using a LEITZ Laborlux D microscope fitted with a HeatinglFreezing stage and PLOEMOP AK incident-light fluorescence, and examined using a Sony CCD video camera connected to a Sony PVM-1371 QM Trinitron Colour Monitor. The fluid inclusion studies utilised two object lenses, UT 50/0.62 (L3210.40) and EF 10/0.25 (Fig. 3).
Regional Geology The Cikotok area is located in the Bayah
Mountains Zone (Fig. 4) which has also been referred to as the "West Extension of the Bandung Zone". It forms an intersection between the Bukit Barisan geanticline in Sumatra and the Java geanticline (van Bemmelen, 1949).
The Cikotok area lies in the Bayah Dome region of the West Java within the active volcanic belt of the Java Island Arc. The evolution of West Java is influenced by subduction of the Indian-Australian Plate under the Asian continent. This active subduction zone has contributed to both regional and local structural patterns. Subduction occurred during the Late Cretaceous, indicated by the Ciletuh melange in the south of West Java. In the Late Oligocene to Early Miocene, volcanic activity had begun and was responsible for the development of magmas throughout Java.
The Stratigraphic succession at Cikotok is dominated by Oligo-Miocene volcanic rocks (basalt to dacite), breccia and tuff, previously referred to as the "Old Andesite Formation" (Koolhoven, 1933), associated with sedimentary rocks. During the Middle Miocene, the volcanic succession was intruded by granodioritic and andesitic magmas. Quartz veins in the Cikotok area were emplaced in the Pliocene, and it is structural zones include (Fig. 5): A. Southern Sedimentary Belt which contains
rocks of Eocene to Miocene age that were folded
and faulted during a Late Miocene orogeny. B. Central Eruptive Belt. This zone contains the
"Old Andesite Formation" of Oligocene to Miocene age with marine Oligo-Miocene sedimentary rock intercalation.
C. Northern Sedimentary Belt. This comprises a basic pyroclastic sequence of early Miocene to Pliocene age. The rocks are unconformably covered by Pliocene dacitic rocks. These zones form the Bayah Mountains which
is intruded by the Cihara and Cipamancalan granodiorites, the Mt. Lukut and Mt. Malang quartz diorites, and a belt of Pliocene dacitic extrusions.
The Cikotok area is composed of lavas, sedimentary rocks, volcaniclastic sediments and intrusive rocks.
Oligo-Miocene Sequences Lavas are the dominant lithology in the western,
eastern and southern part of the study area. The lavas are dominant and consist of basalt, basaltic andesite, andesite and dacite which have undergone propylitic alteration. These volcanic rocks were defined by Koolhoven (1933) as the "Old Andesite Formation". This is regarded as the host rock of all gold and silver bearing quartz veins in the region. Andesite is the dominant volcanic rock type that outcrops in the study area and can be recognized by its field appearance as well as by its petrographic characteristics: amygdales, flow structures and columnar joints.
The area is characterised by a yellowish-brown clayey soil or strongly weathered rock, but along the Ciherang River in the eastern part and along the Cikaret river in the western part, some fresh outcrops are present. Basalt: This rock type is found in the Ciherang River in the southeastern part of the study area. It is a fine-grained, massive green rock, weathering into yellow soil. It consists of interlocking plagioclase microlites, which are strongly sericitized. The mafic minerals are entirely altered to chlorite, epidote and calcite. Andesite (including basaltic andesite): This is the dominant lithology in the eastern and western parts of the map area. The rocks have been regionally propylitized. Near some of the quartz veins, the rocks have also been silicified and have a very fine-grained texture. The area of alteration usually extends for at least 50 m beyond the quartz vein contacts. The greyish-green to light green andesites show amugdaloidal structures which are filled by calcite, chlorite, zeolite and chalcedony and also may have columnar and vertical joints and quartz veins. Some gold and silver-bearing veins are present locally. Dacite: These crop out in the Ciherang and Cikotok
GEOSEA '98 Proceeding'} (GSM BuLl. 43)
December j 999
A STUDY OF FLUID INCLUSIONS AT THE CIKOTOK GOLD MINE, WEST JAVA, INDONESIA
Figure 1a. Sketch map showing the location of the study area.
®
Mt. Krakatau
Panaitan
50km I
106'E
INDIAN OCEAN
JAVA SEA
~ Studyarea
~ Muinroad
107"E
O' E
PROVINCE
7"5
Figure lb. Location ofthe Cikotok area, West Java.
20 0 20 <4Om ! , , ,
Figure 2. Location map of quartz veins utilized for fluid inclusion analysis in the Cikotok tunnels of Level 300 and Level 400.
309
100 LS
CJ ~ <:::l ~ ~
\:5 Co
~ ~
" " " <:>..,
~ . <:..
~ ~
~ ~ ....... :--
~ ~
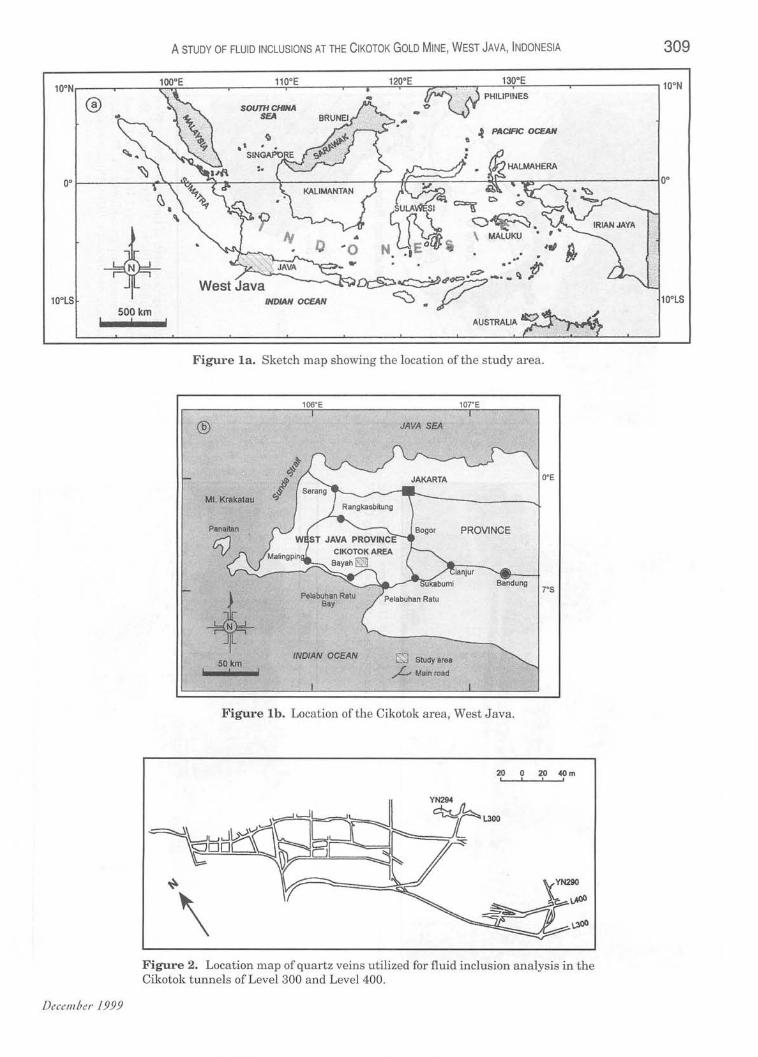
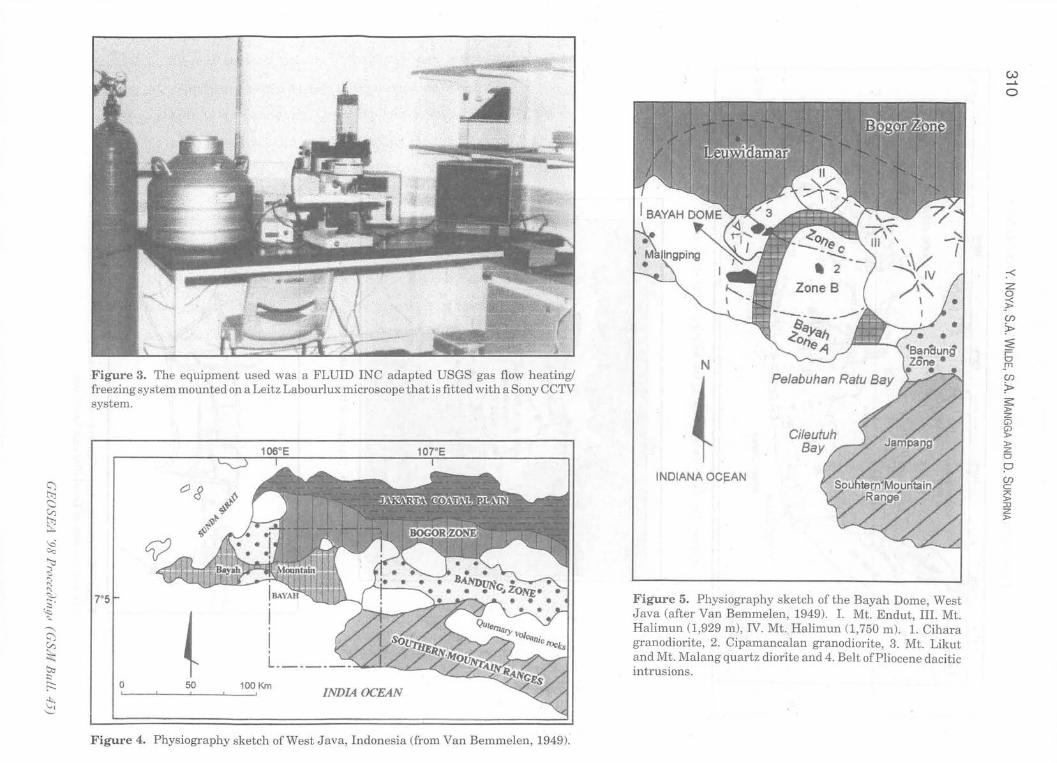
Figure 3. The equipment used was a FLUID INC adapted USGS gas flow heating/ freezing system mounted on a Leitz Labourlux microscope that is fitted with a Sony CCTV system.
7°5
0 50 100Km , INDIA OCEAN
Figure 4. Physiography sketch of West J ava, Indonesia (from Van Bemmelen, 1949).
N
INDIANA OC~AN
Figure 5. Physiography sketch of the Bayah Dome, West Java (after Van Bemmelen, 1949). I. Mt. Endut, III. Mt. Halimun (1,929 m), IV. Mt .. Halimun (1,750 m). 1. Cihara granodiorite, 2. Cipamancalan granodiorite, 3. Mt. Likut and Mt. Malang quartz diorite and 4. Belt of Pliocene dacitic intrusions.
A STUDY OF FLUID INCLUSIONS AT THE CIKOTOK GOLD MINE, WEST JAVA, INDONESIA 311
Rivers and are compositionally banded, massive or vesicular in texture, A banded, grey-white layer is caused by thin « 1 mm) alternating fine-grained and aphanitic quartz-feldspar assemblages. Weakly aligned vesicles are infilled by secondary silica. The rock is typically green.
Breccia
This unit includes a variety of breccias which are interpreted to be the result of the hydraulic fracturing associated with a hydrothermal system. They are fluidization breccias, with a complete gradation from mildly fractured and veined andesite or pyroclastics, through hydraulically fractured and veined rocks, to true breccias (Hedenquist and Henly, 1985). They are fluidization breccias, with a complete gradation from mildly fractured and veined andesite or pyroclastics, The unit overlies the lower part of the volcanic succession and is polymictic with sub angular to subrounded clasts which have undergone considerable movement and abrasion. A matrix of chalcedonic quartz incorporates subangular to subrounded fragments of andesite, tuff, vein quartz and minor sediment (clay and sandstone) which are rich in sulphides. The size of the clasts ranges from 0.5 to 2 cm in diameter.
This unit interfingers with the sandstone units which are exposed in the central part of the map area.
Tuff intercalated with breccia
Tuff: This is brown to brownish yellow, dacitic to andesitic volcanic rock. It is of uniform hardness but light in weight and well-bedded, with layers 5 to 20 cm thick. Lapilli tuff and gravelly tuff contains fragments of pumice. The rock has undergone chloritization as indicated by its green colour. In some places, this rock is extensively weathered. Breccia: This is locally present and the matrix is a grey to dark grey, tuffaceous sandstone with poorly sorted clasts up to 7 m across. There are randomly oriented and angular and consist of andesite and basalt. This breccia differs from the other breccia (Tomb) in having no chalcedonic quartz matrix and only minor sulphides. This unit occurs in the northwestern part of the map area.
Claystone, shale, sandstone and tuff, intercalated with limestone and coal seams
Sedimentary rocks are exposed in the northern part of the mapped area where it interfingers with the lower part of the lava unit and the upper part of this unit also interfingers with breccia, southeast of Cikotok. Claystone: This is a grey to greyish black, well-
December 1999
bedded unit, in layers 5 to 15 cm thick. Parallel laminations are well developed in some areas. It is also intercalated with pyrite-bearing coal seams with a thickness of 20 cm. Shale: This is light grey to bluish grey in colour, well-bedded, with the thickness of beds ranging between 2 to 10 cm. Parallel laminations or convolute layers are present. Sandstone: This is medium to very coarse-grained and contains quartz, feldspar, clay and carbonaceous fragments. The sandstone is 10 to 25 cm thick with a tuffaceous cement. Limestone: This is white to light grey, uniform hardness, well-bedded, with beds 20 to 30 cm thick. It contains fossils of foraminifera, corals, spines of echinoids, gastropods and molluscs. Based on foraminifera, this unit is Oligocene in age (Koolhoven, 1933) and can be correlated with the Cijengkol Formation.
Sandstone: sandstone and conglomerate, intercalated with limestone
This unit is dominated by sandstone and conglomerate with some intercalations oflimestone which have a thickness of 50 cm to 1 m and are fossiliferous. Sandstone: Light grey to dark grey, soft, medium to coarse-grained sandstone made up of debris of volcanic rocks, argillite, plagioclase, pyroxene, quartz, and iron oxide. It has a cement of tuff that is locally carbonaceous. It is mostly well-stratified and generally occurs in beds 5 cm to 25 cm thick, commonly well laminated. Conglomerate: Grey to greyish brown; soft, poorly sorted; clasts include andesite, tuff, claystone, quartz and tuffaceous sandstone, as large as 5 cm across. They are subrounded to rounded in a matrix of tuff.
The grain size is 2 mm to 25 mm. Conglomerate beds range between 25 cm and 1 m thick and dip 45° to the south throughout the area. The Sandstone Unit is non fossiliferous; its determination is based on its interfingering with the Lava Unit (Toml) and with limestone. Limestone: This is light grey to grey, well-bedded unit with a thickness ranging from 20 to 50 cm. Foraminifera and gastropods define an Upper Oligocene to Lower Miocene age.
Middle Miocene Rocks
Porphyritic andesitic dykes
Andesitic (including basaltic andesite) dykes occur in the northern part of the Cikaret River, where they cut the tuff unit. The dykes strike N400W and dip to the south.
312 Y. NOVA, S.A. WILDE, S.A. MANGGA AND D. SUKARNA
Intrusive granodioritic rocks
Granodioritic rocks are exposed as small bodies in the northern part of Cikaret River and in the Ciputer River (SE of the map area). They form massive outcrops of dense, dark-grey, medium to coarse-grained granodiorite with a greasy lustre (due to plagioclase). The bodies intrude the lava unit. They also occur downstream in the Cikaret and Ciputer Rivers, as large boulders.
Pliocene Quartz Veins In the Cikotok area, sulphide-bearing quartz
veins commonly infill structural zones such as faults, shears and joints in the "Old Andesite Formation". Major gold and silver-bearing quartz veins occur as single veins, as parallel vein series, or as a network in the breccia unit (Tomb). These quartz veins are a few centimetres up to several metres in width. They have been radiometrically dated by the KlAr method at approximately 4 Ma.
FLUID INCLUSIONS
Nature of the Samples and Their Inclusions All samples were collected from quartz veins.
The majority consists of massive, fine-grained quartz which, consists of finely-laminated layers. These are often interspersed with sulphide-or clayrich layers. Open vugs, usually with surrounding prismatic quartz crystals, are common. The primary and pseudomorph fluid inclusions are likely to represent the syn-mineralisation fluids. On the basis of their origin, nature and phase ratios, two association of fluid inclusions were identified from inclusions associated with the syn-mineralisation condition.
Most of the primary inclusions were in the size range 7 pm to 16 pm with an average of 8 pm. The are two types found with quartz (Type I and Type II); only Type I inclusions were analysed.
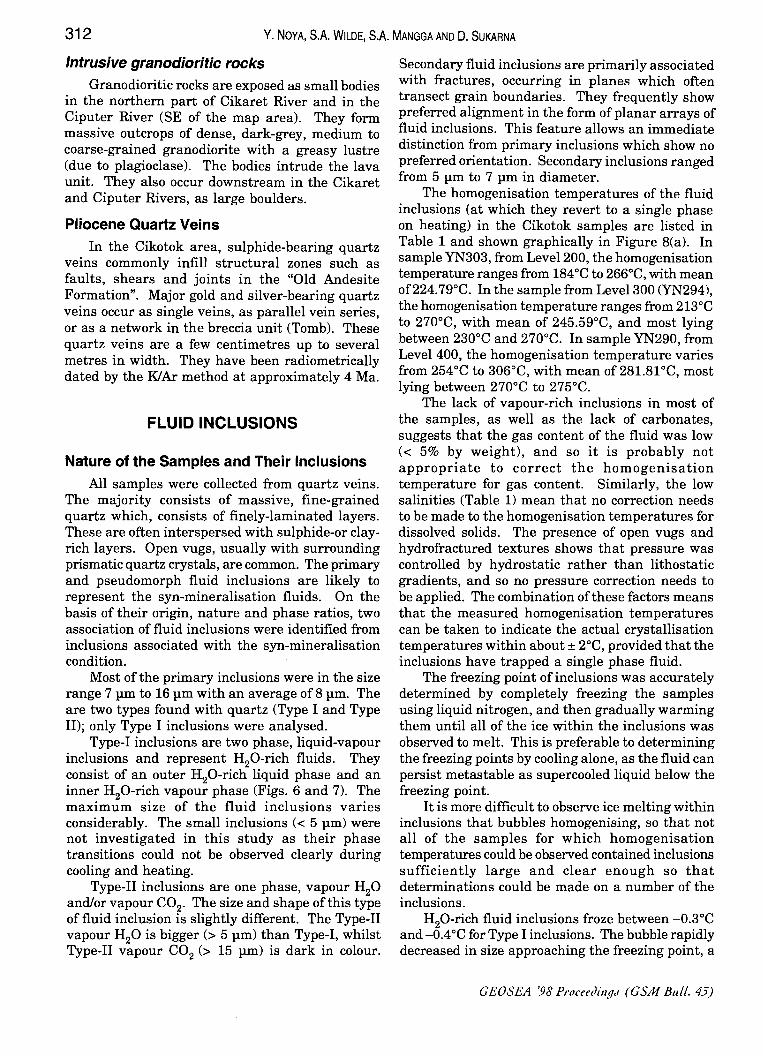
Type-I inclusions are two phase, liquid-vapour inclusions and represent H20-rich fluids. They consist of an outer H20-rich liquid phase and an inner H20-rich vapour phase (Figs. 6 and 7). The maximum size of the fluid inclusions varies considerably. The small inclusions « 5 pm) were not investigated in this study as their phase transitions could not be observed clearly during cooling and heating.
Type-II inclusions are one phase, vapour H20 andlorvapour CO2, The size and shape of this type of fluid inclusion is slightly different. The Type-II vapour H20 is bigger (> 5 pm) than Type-I, whilst Type-II vapour CO2 (> 15 pm) is dark in colour.
Secondary fluid inclusions are primarily associated with fractures, occurring in planes which often transect grain boundaries. They frequently show preferred alignment in the form of planar arrays of fluid inclusions. This feature allows an immediate distinction from primary inclusions which show no preferred orientation. Secondary inclusions ranged from 5 pm to 7 pm in diameter.
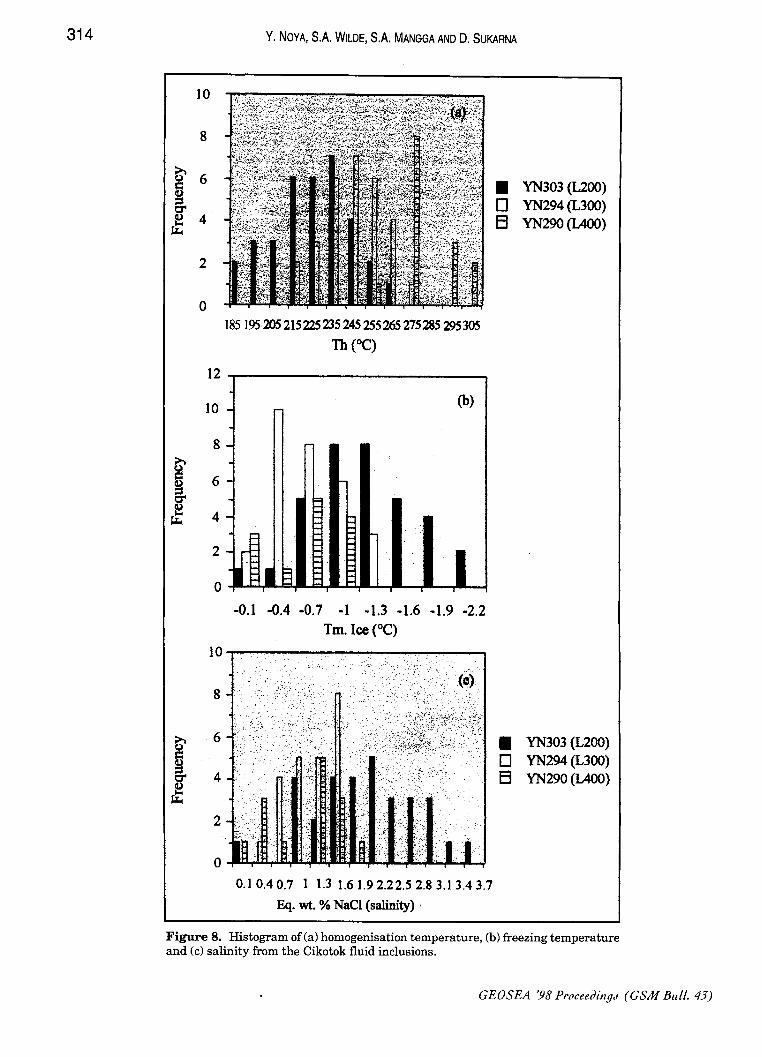
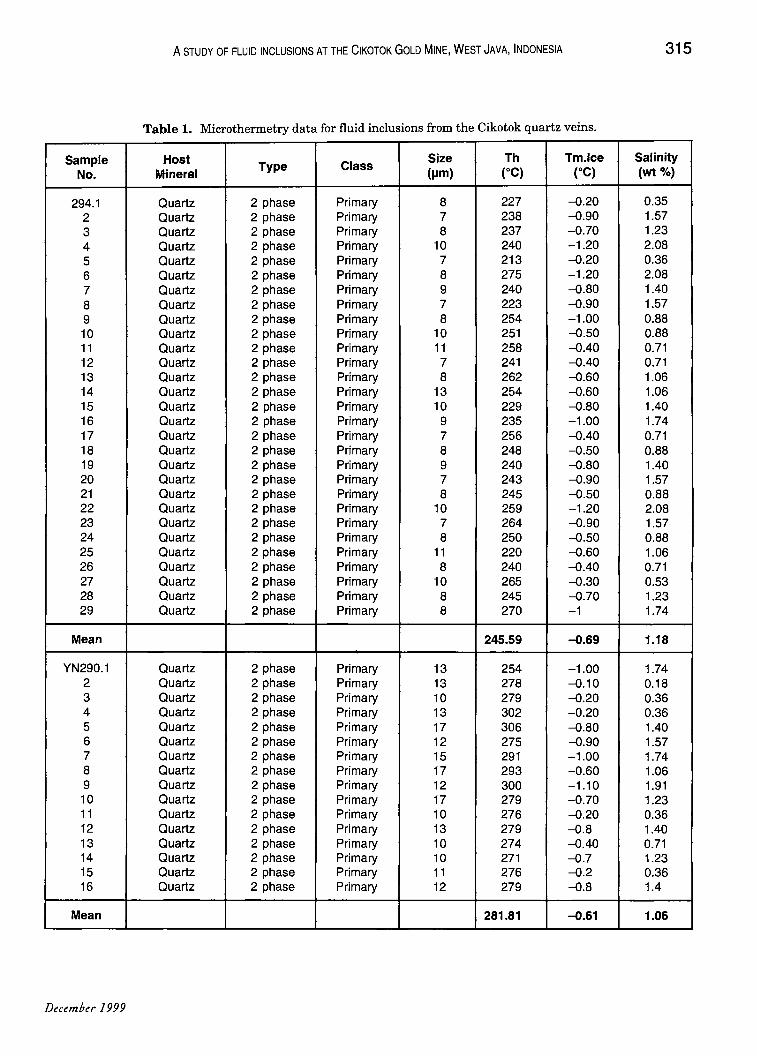
The homogenisation temperatures of the fluid inclusions (at which they revert to a single phase on heating) in the Cikotok samples are listed in Table 1 and shown graphically in Figure 8(a). In sample YN303, from Level 200, the homogenisation temperature ranges from 184°C to 266°C, with mean of224.79°C. In the sample from Level 300 (YN294), the homogenisation temperature ranges from 213°C to 270°C, with mean of 245.59°C, and most lying between 230°C and 270°C. In sample YN290, from Level 400, the homogenisation temperature varies from 254°C to 306°C, with mean of 281.8rC, most lying between 270°C to 275°C.
The lack of vapour-rich inclusions in most of the samples, as well as the lack of carbonates, suggests that the gas content of the fluid was low « 5% by weight), and so it is probably not appropriate to correct the homogenisation temperature for gas content. Similarly, the low salinities (Table 1) mean that no correction needs to be made to the homogenisation temperatures for dissolved solids. The presence of open vugs and hydrofractured textures shows that pressure was controlled by hydrostatic rather than lithostatic gradients, and so no pressure correction needs to be applied. The combination of these factors means that the measured homogenisation temperatures can be taken to indicate the actual crystallisation temperatures within about ± 2°C, provided that the inclusions have trapped a single phase fluid.
The freezing point of inclusions was accurately determined by completely freezing the samples using liquid nitrogen, and then gradually warming them until all of the ice within the inclusions was observed to melt. This is preferable to determining the freezing points by cooling alone, as the fluid can persist metastable as supercooled liquid below the freezing point.
It is more difficult to observe ice melting within inclusions that bubbles homogenising, so that not all of the samples for which homogenisation temperatures could be observed contained inclusions sufficiently large and clear enough so that determinations could be made on a number of the inclusions.
H20-rich fluid inclusions froze between -a.3°C and -0.4 °c for Type I inclusions. The bubble rapidly decreased in size approaching the freezing point, a
GEOSEA '98 Proceedillg.! (GSM Bull. 4.1)
A STUDY OF FLUID INCLUSIONS AT THE CIKOTOK GOLD MINE, WEST JAVA, INDONESIA 313
process with was taken very slowly to allow formation of large crystals, rather that groups of smaller crystals, therefore allowing a more accurate determination of the freezing point (Table 1 and Fig. 8b). The vapour bubble reappeared (Tm-Ice) between -0.1 °C and -2.2°C for sample UN303 (Level 200). The freezing sample YN294 (Level 300) ranged from -0.2°C to -1.2°C, with a mean of -0.69°C. For sample, YN290 (Level 400), the freezing temperature range was from -0.1 °C to -1.1 °C, with a mean of -0.61°C.
' . •
,-,
It should be pointed out that the difficulties of estimating homogenisation temperatures for inclusions which may have trapped a two-phase (boiling) fluid do not apply to nearly such a large extent when determining freezing points. This is because the weight percent of steam which may have been trapped from a boiling fluid is small in comparison to the weight ofthe water, whereas its volume is large.
The determination of salinity of inclusions from the Cikotok mine is based on 100 measurements
• y ,
• ... ..
-Figure 6. A photomicrograph of a quartz crystal showing fluid inclusions of two phases (Type I) (H20-rich and vapour) and one phase (single vapour H
20, right top)
from sample YN290 (Level 400). PPL and field of view 0.57 mm) .
•
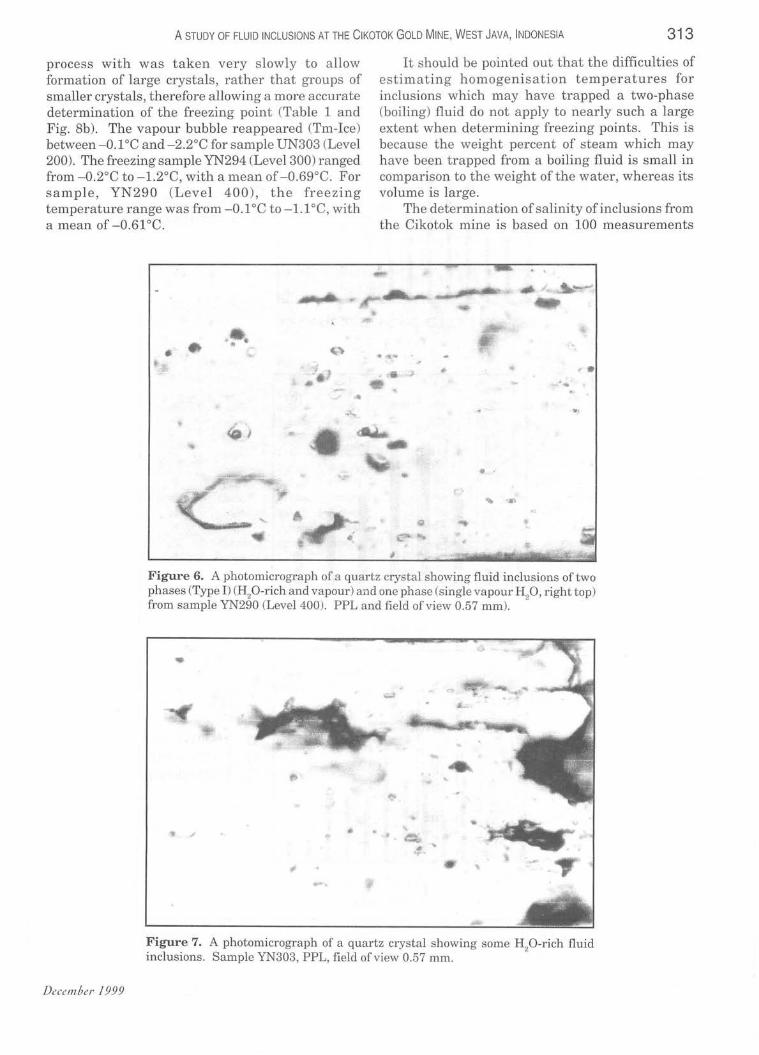
-Figure 7. A photomicrograph of a quartz crystal showing some H O-rich fluid inclusions. Sample YN303, PPL, field of view 0.57 mm. 2
December 1999
314
10
8
2
o
12
10
8
6
4
2
o
Y. NOVA, S.A. WILDE, S.A. MANGGA AND D. SUKARNA
185 195·205 215225 235 245 255265 275285 295305
TheC)
(b) -
-. -
1= -
-~ I EJ I
-0.1 -0.4 -0.7 -1 -1.3 -1.6 -1.9 -2.2 Tm.lceeC)
0.10.4 0.7 1.3 1.61.92.22.52.83.13.43.7
Eq. wt. % NaCI (salinity) ,
• YN303 (L200) o YN294 (L300) B YN290 (lAOO)
• YN303 (L200) o YN294 (L300) B YN290 (L400)
Figure 8. Histogram of (a) homogenisation temperature, (b) freezing temperature and (c) salinity from the Cikotok fluid inclusions.
CEOSEA '98 Proceeding'! (CSM BuLL. 4.J)
A STUDY OF FLUID INCLUSIONS AT THE CIKOTOK GOLD MINE, WEST JAVA, INDONESIA 315
Table 1. Microthermetry data for fluid inclusions from the Cikotok quartz veins.
Sample Host Type Class Size Th Tm.lce Salinity
No. Mineral (JJm) (OC) eC) (wt %)
294.1 Quartz 2 phase Primary 8 227 -0.20 0.35 2 Quartz 2 phase Primary 7 238 -0.90 1.57 3 Quartz 2 phase Primary 8 237 -0.70 1.23 4 Quartz 2 phase Primary 10 240 -1.20 2.08 5 Quartz 2 phase Primary 7 213 -0.20 0.36 6 Quartz 2 phase Primary 8 275 -1.20 2.08 7 Quartz 2 phase Primary 9 240 -0.80 1.40 8 Quartz 2 phase Primary 7 223 -0.90 1.57 9 Quartz 2 phase Primary 8 254 -1.00 0.88 10 Quartz 2 phase Primary 10 251 -0.50 0.88 11 Quartz 2 phase Primary 11 258 -0.40 0.71 12 Quartz 2 phase Primary 7 241 -0.40 0.71 13 Quartz 2 phase Primary 8 262 -0.60 1.06 14 Quartz 2 phase Primary 13 254 -0.60 1.06 15 Quartz 2 phase Primary 10 229 -0.80 1.40 16 Quartz 2 phase Primary 9 235 -1.00 1.74 17 Quartz 2 phase Primary 7 256 -0.40 0.71 18 Quartz 2 phase Primary 8 248 -0.50 0.88 19 Quartz 2 phase Primary 9 240 -0.80 1.40 20 Quartz 2 phase Primary 7 243 -0.90 1.57 21 Quartz 2 phase Primary 8 245 -0.50 0.88 22 Quartz 2 phase Primary 10 259 -1.20 2.08 23 Quartz 2 phase Primary 7 264 -0.90 1.57 24 Quartz 2 phase Primary 8 250 -0.50 0.88 25 Quartz 2 phase Primary 11 220 -0.60 1.06 26 Quartz 2 phase Primary 8 240 -0.40 0.71 27 Quartz 2 phase Primary 10 265 -0.30 0.53 28 Quartz 2 phase Primary 8 245 -0.70 1.23 29 Quartz 2 phase Primary 8 270 -1 1.74
Mean 245.59 -0.69 1.18
YN290.1 Quartz 2 phase Primary 13 254 -1.00 1.74 2 Quartz 2 phase Primary 13 278 -0.10 0.18 3 Quartz 2 phase Primary 10 279 -0.20 0.36 4 Quartz 2 phase Primary 13 302 -0.20 0.36 5 Quartz 2 phase Primary 17 306 -0.80 1.40 6 Quartz 2 phase Primary 12 275 -0.90 1.57 7 Quartz 2 phase Primary 15 291 -1.00 1.74 8 Quartz 2 phase Primary 17 293 -0.60 1.06 9 Quartz 2 phase Primary 12 300 -1.10 1.91 10 Quartz 2 phase Primary 17 279 -0.70 1.23 11 Quartz 2 phase Primary 10 276 -0.20 0.36 12 Quartz 2 phase Primary 13 279 -0.8 1.40 13 Quartz 2 phase Primary 10 274 -0.40 0.71 14 Quartz 2 phase Primary 10 271 -0.7 1.23 15 Quartz 2 phase Primary 11 276 -0.2 0.36 16 Quartz 2 phase Primary 12 279 -0.8 1.4
Mean 281.81 -0.61 1.06
December 1999
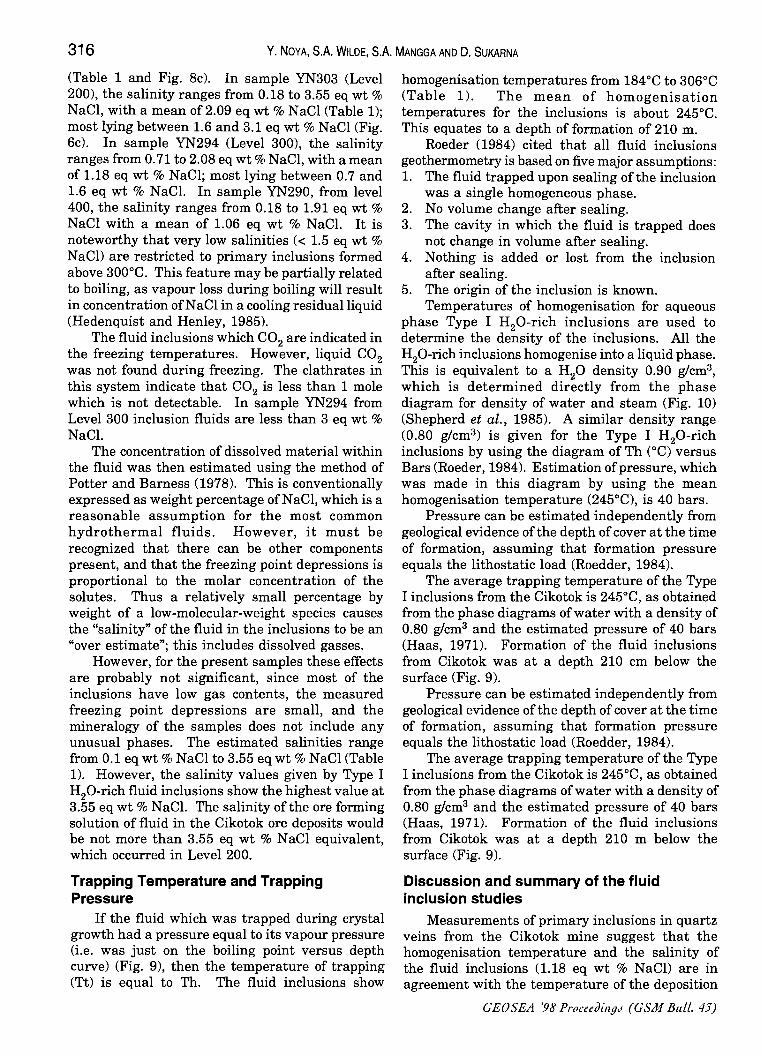
316 Y. NOVA, SA WILDE, SA MANGGA AND D. SUKARNA
(Table 1 and Fig. 8c). In sample YN303 (Level 200), the salinity ranges from 0.18 to 3.55 eq wt % NaCl, with a mean of2.09 eq wt % NaCl (Table 1); most lying between 1.6 and 3.1 eq wt % NaCl (Fig. 6c). In sample YN294 (Level 300), the salinity ranges from 0.71 to 2.08 eq wt % NaCl, with a mean of 1.18 eq wt % NaCl; most lying between 0.7 and 1.6 eq wt % NaCl. In sample YN290, from level 400, the salinity ranges from 0.18 to 1.91 eq wt % NaCl with a mean of 1.06 eq wt % NaCl. It is noteworthy that very low salinities « 1.5 eq wt % NaCl) are restricted to primary inclusions formed above 300°C. This feature may be partially related to boiling, as vapour loss during boiling will result in concentration ofN aCl in a cooling residual liquid (Hedenquist and Henley, 1985).
The fluid inclusions which CO2 are indicated in the freezing temperatures. However, liquid CO2
was not found during freezing. The clathrates in this system indicate that CO2 is less than 1 mole which is not detectable. In sample YN294 from Level 300 inclusion fluids are less than 3 eq wt % NaCl.
The concentration of dissolved material within the fluid was then estimated using the method of Potter and Barness (1978). This is conventionally expressed as weight percentage ofNaCl, which is a reasonable assumption for the most common hydrothermal fluids. However, it must be recognized that there can be other components present, and that the freezing point depressions is proportional to the molar concentration of the solutes. Thus a relatively small percentage by weight of a low-molecular-weight species causes the "salinity" of the fluid in the inclusions to be an "over estimate"; this includes dissolved gasses.
However, for the present samples these effects are probably not significant, since most of the inclusions have low gas contents, the measured freezing point depressions are small, and the mineralogy of the samples does not include any unusual phases. The estimated salinities range from 0.1 eq wt % NaCI to 3.55 eq wt % NaCl (Table 1). However, the salinity values given by Type I H20-rich fluid inclusions show the highest value at 3.55 eq wt % NaCl. The salinity ofthe ore forming solution of fluid in the Cikotok ore deposits would be not more than 3.55 eq wt % NaCl equivalent, which occurred in Level 200.
Trapping Temperature and Trapping Pressure
If the fluid which was trapped during crystal growth had a pressure equal to its vapour pressure (i.e. was just on the boiling point versus depth curve) (Fig. 9), then the temperature of trapping (Tt) is equal to Th. The fluid inclusions show
homogenisation temperatures from 184°C to 306°C (Table 1). The mean of homogenisation temperatures for the inclusions is about 245°C. This equates to a depth of formation of 210 m.
Roeder (1984) cited that all fluid inclusions geothermometry is based on five major assumptions: 1. The fluid trapped upon sealing of the inclusion
was a single homogeneous phase. 2. No volume change after sealing. 3. The cavity in which the fluid is trapped does
not change in volume after sealing. 4. Nothing is added or lost from the inclusion
after sealing. 5. The origin of the inclusion is known.
Temperatures of homogenisation for aqueous phase Type I H20-rich inclusions are used to determine the density of the inclusions. All the H20-rich inclusions homogenise into a liquid phase. This is equivalent to a H20 density 0.90 g/cm3,
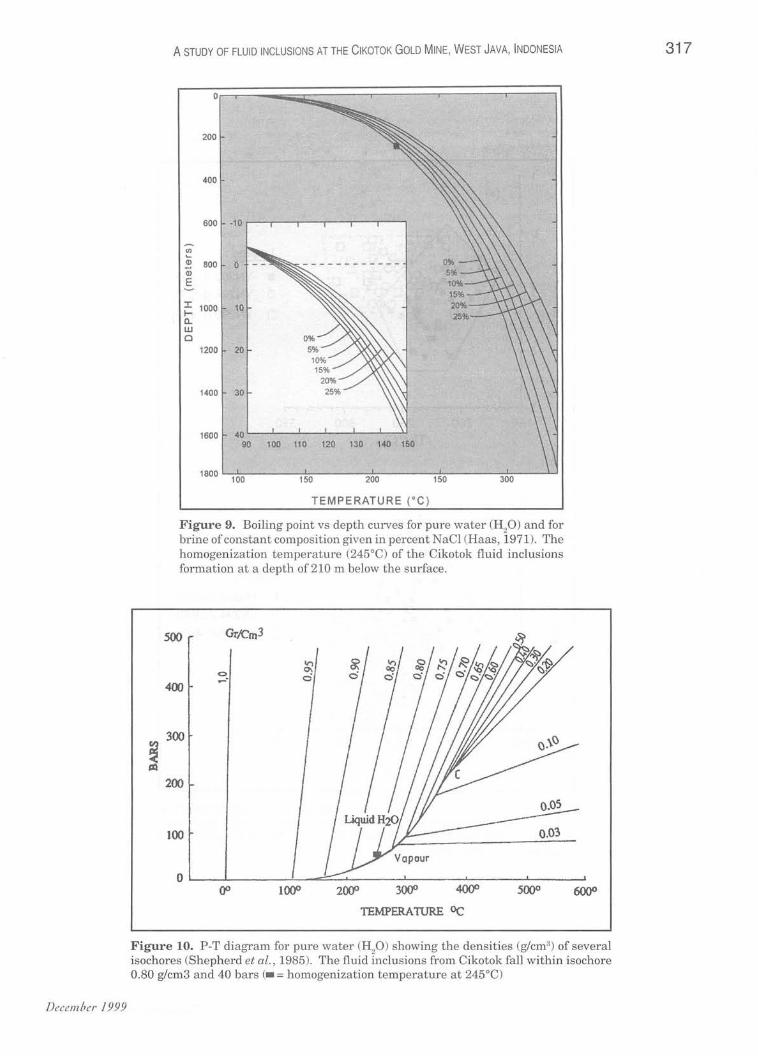
which is determined directly from the phase diagram for density of water and steam (Fig. 10) (Shepherd et al., 1985). A similar density range (0.80 g/cm3 ) is given for the Type I H20-rich inclusions by using the diagram of Th (OC) versus Bars (Roeder, 1984). Estimation of pressure, which was made in this diagram by using the mean homogenisation temperature (245°C), is 40 bars.
Pressure can be estimated independently from geological evidence ofthe depth of cover at the time of formation, assuming that formation pressure equals the litho static load (Roedder, 1984).
The average trapping temperature of the Type I inclusions from the Cikotok is 245°C, as obtained from the phase diagrams of water with a density of 0.80 g/cm3 and the estimated pressure of 40 bars (Haas, 1971). Formation of the fluid inclusions from Cikotok was at a depth 210 cm below the surface (Fig. 9).
Pressure can be estimated independently from geological evidence of the depth of cover at the time of formation, assuming that formation pressure equals the litho static load (Roedder, 1984).
The average trapping temperature of the Type I inclusions from the Cikotok is 245°C, as obtained from the phase diagrams of water with a density of 0.80 g/cm3 and the estimated pressure of 40 bars (Haas, 1971). Formation of the fluid inclusions from Cikotok was at a depth 210 m below the surface (Fig. 9).
Discussion and summary of the fluid inclusion studies
Measurements of primary inclusions in quartz veins from the Cikotok mine suggest that the homogenisation temperature and the salinity of the fluid inclusions (1.18 eq wt % NaCl) are in agreement with the temperature of the deposition
GEOSEA '98 Proceeding" (GSM Bull. 4J)
December 1999
~ a:I
A STUDY OF FLUID INCLUSIONS AT THE CIKOTOK GOLD MINE, WEST JAVA, INDONESIA
0
200
400
600 -10
(/)
'-Q) 800 Q)
E
I 1000 I-a.. w Cl
1200
1400
1600 100 110
1800 100 150
TEMPERATURE (Oe)
Figure 9. Boiling point vs depth curves for pure water (HoO) and for brine of constant composition given in percent NaCl (Haas, i971). The homogenization temperature (245°C) of the Cikotok fluid inclusions formation at a depth of 210 m below the surface.
500 Gr/Cm3
In
~-Q\ 0
400
300
200
100 0.03
o ~--~--------~--~~------~------~--------~----~ 3000 4000 5()()O
TEMPERATURE OC
Figure 10. poT diagram for pure water (HoO) showing the densities (g/cm 3) of several isochores (Shepherd et al., 1985). The fluid Inclusions from Cikotok fall within isochore 0.80 g/cm3 and 40 bars (- = homogenization temperature at 245°C)
317
318 Y. NOVA, SA WILDE, SA MANGGA AND D. SUKARNA
1 (a)
a Legend:
e • YN303 (L.200) ! -1 0 YN294 (L.300)
~ 0 YN290 (L.400)
-2
-3;-~~~~~-r~-r~-r~~~
150 200 300 350
4
3 Legend
• YN303 (L.200) o YN294 (L.300) o YN290 (L.400)
o ! I
O-+-....... -.-.,....,...,....:Io4--! ........ -w-"',........;....,.....~-.-...-.~
-150 200 250 300 350
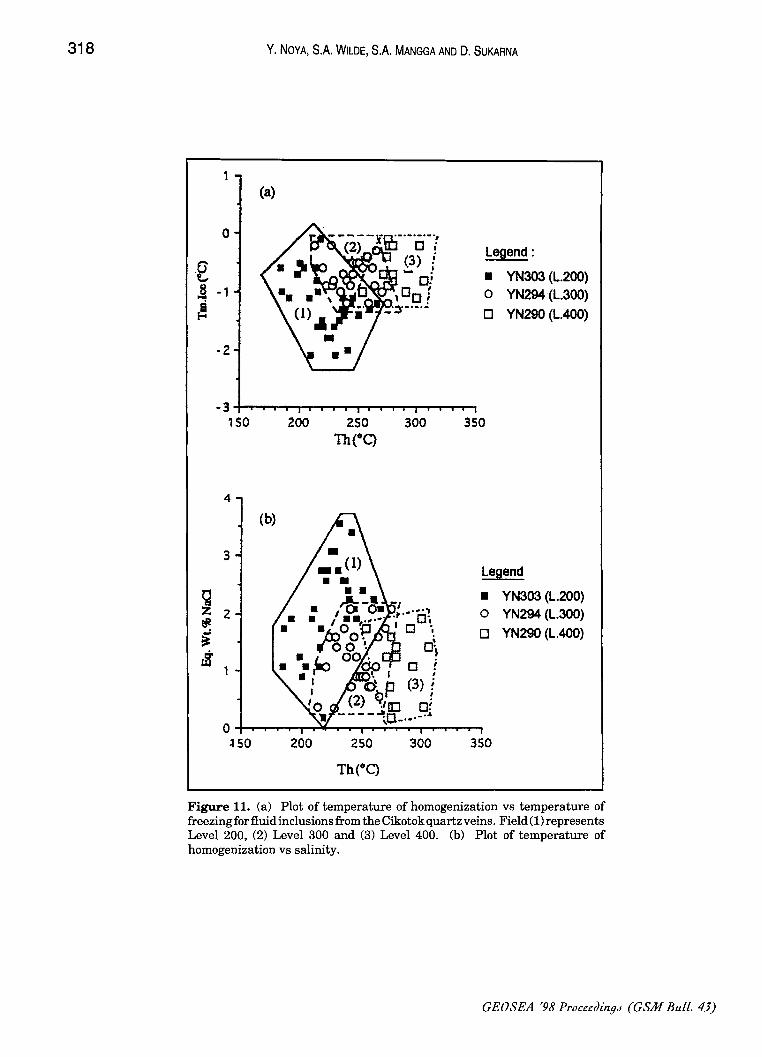
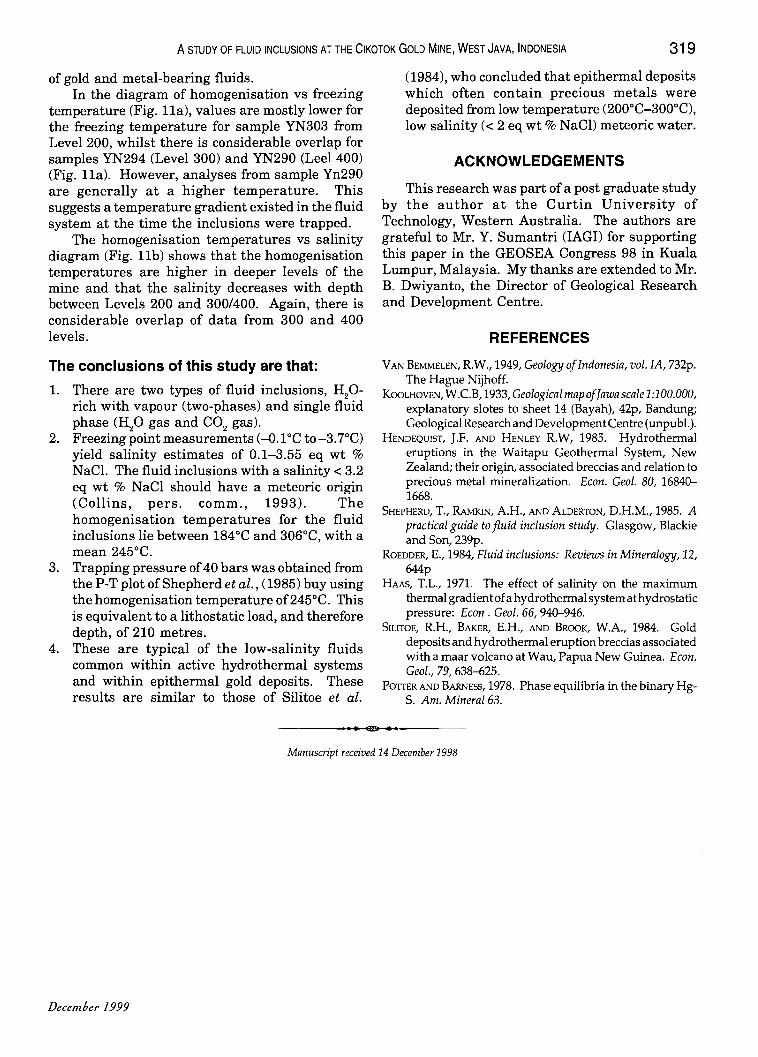
Figure 11. (a) Plot of temperature of homogenization vs temperature of freezing for fluid inclusions from the Cikotok quartz veins. Field (1) represents Level 200, (2) Level 300 and (3) Level 400. (b) Plot of temperature of homogenization vs salinity.
GEOSEA '98 Proceeding.! (GSM Bull. 43)
A STUDY OF FLUID INCLUSIONS AT THE CIKOTOK GOLD MINE, WEST JAVA, INDONESIA 319
of gold and metal-bearing fluids. In the diagram of homogenisation vs freezing
temperature (Fig. lla), values are mostly lower for the freezing temperature for sample YN303 from Level 200, whilst there is considerable overlap for samples YN294 (Level 300) and YN290 (Leel 400) (Fig.lla). However, analyses from sample Yn290 are generally at a higher temperature. This suggests a temperature gradient existed in the fluid system at the time the inclusions were trapped.
The homogenisation temperatures vs salinity diagram (Fig. llb) shows that the homogenisation temperatures are higher in deeper levels of the mine and that the salinity decreases with depth between Levels 200 and 300/400. Again, there is considerable overlap of data from 300 and 400 levels.
The conclusions of this study are that:
1. There are two types of fluid inclusions, Hprich with vapour (two-phases) and single fluid phase (HP gas and CO2 gas).
2. Freezing point measurements (-0. rc to -3. 7°C) yield salinity estimates of 0.1-3.55 eq wt % NaCI. The fluid inclusions with a salinity < 3.2 eq wt % N aCI should have a meteoric origin (Collins, pers. comm., 1993). The homogenisation temperatures for the fluid inclusions lie between 184°C and 306°C, with a mean 245°C.
3. Trapping pressure of 40 bars was obtained from the P-T plot of Shepherd et ai., (1985) buy using the homogenisation temperature of 245°C. This is equivalent to a lithostatic load, and therefore depth, of 210 metres.
4. These are typical of the low-salinity fluids common within active hydrothermal systems and within epithermal gold deposits. These results are similar to those of Silitoe et ai.
(1984), who concluded that epithermal deposits which often contain precious metals were deposited from low temperature (200°C-300°C), low salinity « 2 eq wt % NaCl) meteoric water.
ACKNOWLEDGEMENTS
This research was part of a post graduate study by the author at the Curtin University of Technology, Western Australia. The authors are grateful to Mr. Y. Sumantri (lAG!) for supporting this paper in the GEOSEA Congress 98 in Kuala Lumpur, Malaysia. My thanks are extended to Mr. B. Dwiyanto, the Director of Geological Research and Development Centre.
REFERENCES VAN BEMMELEN, RW., 1949, Geology of Indonesia, vol. lA, 732p.
The Hague Nijhoff. KooLHOVEN, W.C.B, 1933, Geological map of Jaw a scale 1:100.000,
explanatory slotes to sheet 14 (Bayah), 42p, Bandung; Geological Research and Development Centre (unpubl.).
HENDEQulsT, J.F. AND HENLEY RW, 1985. Hydrothermal eruptions in the Waitapu Geothermal System, New Zealand; their origin, associated breccias and relation to precious metal mineralization. Econ. Geol. 80, 16840-1668.
SHEPHERD, T., RAMKIN, A.H., AND ALDERTON, D.H.M., 1985. A practical guide to fluid inclusion study. Glasgow, Blackie and Son, 239p.
ROEDDER, E., 1984, Fluid inclusions: Reviews in Mineralogy, 12, 644p
HAAs, T.L., 1971. The effect of salinity on the maximum thermal gradient of a hydrothermal system at hydrostatic pressure: Econ. Geol. 66, 940-946.
SILITOE, RH., BAKER, E.H., AND BROOK, W.A., 1984. Gold deposits and hydrothermal eruption breccias associated with a maar volcano at Wau, Papua New Guinea. Econ. Geol., 79,638-625.
POTTER AND BARNESS, 1978. Phase equilibria in the binary HgS. Am. Mineral 63 . .. .. ..
Manuscript received 14 December 1998
December 1999