Embed Size (px)
Citation preview
A STUDY OF HOW THE CONTENT OF FACEBOOK
ADVERTISING INFLUENCES CONSUMER SHABU
RESTAURANT’S CHOICES DECISION
BY
MS. SUPAPITCH POOTHONG
AN INDEPENDENT STUDY SUBMITTED IN PARTIAL
FULFILLMENT OF
THE REQUIREMENTS FOR THE DEGREE OF MASTER OF
SCIENCE PROGRAM IN MARKETING
(INTERNATIONAL PROGRAM)
FACUALTY OF COMMERCE AND ACCOUNTANCY
THAMMASAT UNIVERSITY
ACADEMIC YEAR 2018
COPYRIGHT OF THAMMASAT UNIVERSITY
Ref. code: 25616002040704LOV
(1)
Independent Study Title A STUDY OF HOW THE CONTENT OF
FACEBOOK ADVERTISING INFLUENCES
CONSUMER SHABU RESTAURANT’S
CHOICES DECISION
Author Mr. Supapitch Poothong
Degree Master of Science Program in Marketing (International Program)
Major Field/Faculty/University Faculty of Commerce and Accountancy Thammasat University
Thesis Advisor Professor Paul G. Patterson, Ph.D
Academic Year 2018
ABSTRACT
Nowadays, the growth of restaurant industry keeps increasing rapidly as well
as the number of Facebook users. The explosive growth of social media like Facebook
registered by over 46 million Thai users in 2017 in today’s digital world is one of the
main reasons behind the success of many restaurants using this tool as primary
communication channel. In term of market growth, a number of new players have
entered into this industry due to huge market value. On the consumer side, social
media is also one of the important things for Thai people lives’ today, and Facebook
was ranked for the highest number of Thai users registered on this platform compared
to others.
Due to high potential market opportunity, many companies enter into this
industry. However, with the intense competition, many new restaurants also suffered
and fail. In terms of success case, many restaurant marketers highly focus on quality
of content on their Facebook to attract their target customers.
The research objectives are 1.) To understand how the content of Facebook
advertising influences consumer shabu restaurant’s choices decision 2.To recommend
restaurant owner how the best apply to make their Facebook advertising most
effective. The research approach is exploratory research with quantitative method.
Ref. code: 25616002040704LOV
(2)
Data collection methods are in-depth interview and secondary research. The
sampling method is convenience with snowball technique. The target respondents of
25 people are male and female between the age of 20-50 years old and of various
demographic and socioeconomic status. The insights collected will be used to
generate hypotheses to be interpreted in the descriptive research based on content
analysis.
As a result of this study, the major factors influencing the content of Facebook
advertising of shabu restaurants are 1. Visual Attractiveness such as meat color or
food presentation 2. Marketing Messages 3. Credibility of Content
In conclusion, the result of this study will enable readers to understand all
related factors affecting the content of Facebook advertising and, for applying this
knowledge, shabu restaurant owners should focus on important factors and also
understand the insight of their target consumer in order to develop their own business
wisely.
Keywords: Shabu, Facebook Content, Advertising
Ref. code: 25616002040704LOV
(3)
ACKNOWLEDGEMENTS
This study has been completed with support in term of guidance and experience
from many people. First of all, I would like to express my appreciation to my Advisor,
Prof. Dr. Paul G. Patterson, who gives a guideline and technique to accomplish this
entire study professionally.
Furthermore, I would like to thank all respondents who sacrifice their time to
provide very deep information about their experiences which cannot be searched from
any secondary data.
Also, MIM office team and my MIM friends who share their opinions to
enhance the quality of this study. Importantly, they always give an encouragement to
finish this study through tough time.
Finally, I would like to thank my family who are always beside me and give
support without any condition.
Ms. Supapitch Poothong
Ref. code: 25616002040704LOV
(4)
TABLE OF CONTENT
Page
ABSTRACT (1)
ACKNOWLEDGEMENTS (3)
LIST OF TABLES (6)
LIST OF FIGURES (7)
CHAPTER 1 INTRODUCTION 1
1.1 Research background 1
1.2 Research purpose 2
1.3 Research objective 2
CHAPTER 2 REVIEW OF LITERATURE 3
2.1 Background 3
2.1.1 An overview of industry 3
2.2 Analytical Framework 5
CHAPTER 3 RESEARCH METHODOLOGY 8
3.1 Research flow 8
3.2 Research methodology 8
3.2.1 Secondary research 8
3.2.2 Exploratory research 8
Ref. code: 25616002040704LOV
(5)
3.3 Sampling 9
3.4 Data collection 11
3.4 Data analysis 12
CHAPTER 4 RESULTS AND DISCUSSION 13
4.1 Visual Attractiveness 16
4.1.1 Photo 16
4.1.2 Video 17
4.1.3 Meat Color 18
4.1.4 The Marbling of Beef/Pork 19
4.1.5 Food Presentation 20
4.1.6 Type of Facebook Ad 20
4.2 Marketing Message 23
4.2.1 Promotion 23
4.2.2 The Copy of Content 23
4.2.3 The Origin of Meat 24
4.3 Credibility of Content
4.3.1 Publisher 25
4.3.2 Engagement 26
CHAPTER 5 CONCLUSIONS AND RECOMMENDATIONS 28
REFERENCES 31
APENDIX 32
BIOGRAPHY 33
Ref. code: 25616002040704LOV
(6)
LIST OF TABLES
Tables Page
Table 2.1 Percentage of restaurant areas in the shopping malls 4
Table: 3.1 Respondents’ Profile 9
Table: 4.1 Top 3 key driver in choosing shabu restaurants 16
Ref. code: 25616002040704LOV
(7)
LIST OF FIGURES
Figures Page
Figure 2.1 The number of shopping malls and large retail stores nationwide 3
Figure 2.2 Consumer Decision-Making Process 6
Figure: 3.1 Research Flow Chart 8
Figure 4.1 The meat color 18
Figure 4.2 The marbling of beef 19
Figure 4.3 Examples of food presentation 20
Figure 4.4 The types of Facebook ad 20
Figure 4.5 Facebook ad dimension 21
Figure 4.6 Facebook ad in the form of Four Landscape 22
Figure 4.7 The example of Facebook ad content 23
Figure 4.8 The example of Facebook ad which display the origin of meat 24
Figure 4.9 An example of top comment in Facebook ad 27
Figure 5.1 An example of successful Facebook ad 28
Figure 5.2 An example of creative Facebook ad 30
Ref. code: 25616002040704LOV
1
CHAPTER 1
INTRODUCTION
1.1 Research Background
Nowadays, Facebook is highly influencing people around the world in today’s
digital era. Marketers are utilizing this media as marketing tools to drive their business,
and restaurant is one of the industries that are using this tool as primary communication
channel to attract more customers which is one of the main reasons behind the success
of many restaurants including shabu.
Especially, Facebook is a great opportunity for marketer to acquire or reach a
number of target customers. Thailand was ranked in one of the top countries for the
number of Facebook users registered with over 46 million of Thais. There are many
examples of successful local restaurants that have become very popular in short time
such as Shabu Nagnai, Fufu Taiwanese Shabu or Shabu Lab.
However, the significant market value, 411 to 415 billion Thai baht, has
attracted a lot of new player to this industry (bangkokbiznews, 2018) which result in
heated competition among store formats, channels, and other marketing activities.
Hence, this study will present the insight of restaurant’s consumer behavior and
preference towards content of Facebook advertising that will enable restaurants
operator or marketer to apply for their target customers. The explosive growth of social
media like Facebook registered by over 46 million Thai users in 2017 in today’s digital
world is one of the main reasons behind the success of many shabu restaurants using
this tool as primary communication channel. However, restaurant operators are facing
the significant challenge that a number of competitors are aware the potential of
Ref. code: 25616002040704LOV
2
Facebook and keep launching many different marketing activities to fight for target
customers. A number of effective Facebook advertising were developed. According to
this intense competition, a credible market research is needed to obtain insight of
restaurant’s consumer behavior and preference towards content of Facebook
advertising.
1.2 Research purpose
The purpose of the research is to understand all related factors and key success
factors affecting content of Facebook advertising of shabu restaurants and to provide
recommendation of how can they apply the knowledge from research results to develop
their own business.
1.3 Research Objective
Definition
Facebook advertising refers to any form of advertising available on Facebook
posted by Facebook Fan Page
1. To understand how the content of Facebook advertising influences consumer
shabu restaurant’s choices decision
2.To recommend to restaurant owners how the best apply to make their Facebook
advertising most effective
Ref. code: 25616002040704LOV
3
CHAPTER 2
REVIEW OF LITIRATURE
2.1 Background
2.1.1 An overview of industry
Today's restaurants are driven by the anticipation that consumers will
spend confidently on restaurants and café meals throughout 2018 which account for
39 percent of all dining expense per household in Thailand revealed by a recent
survey of Thai Nation Statistic Organization (Food Intelligence Center Thailand,
2017). The market is currently worth 411 to 415 billion Thai baht. Even the economy
slows down, but the industry growth is projected to reach a healthy 4 to 5 percent
(ศูนยว์ิจยักสิกรไทย, 2018) due to their change in spending behavior.
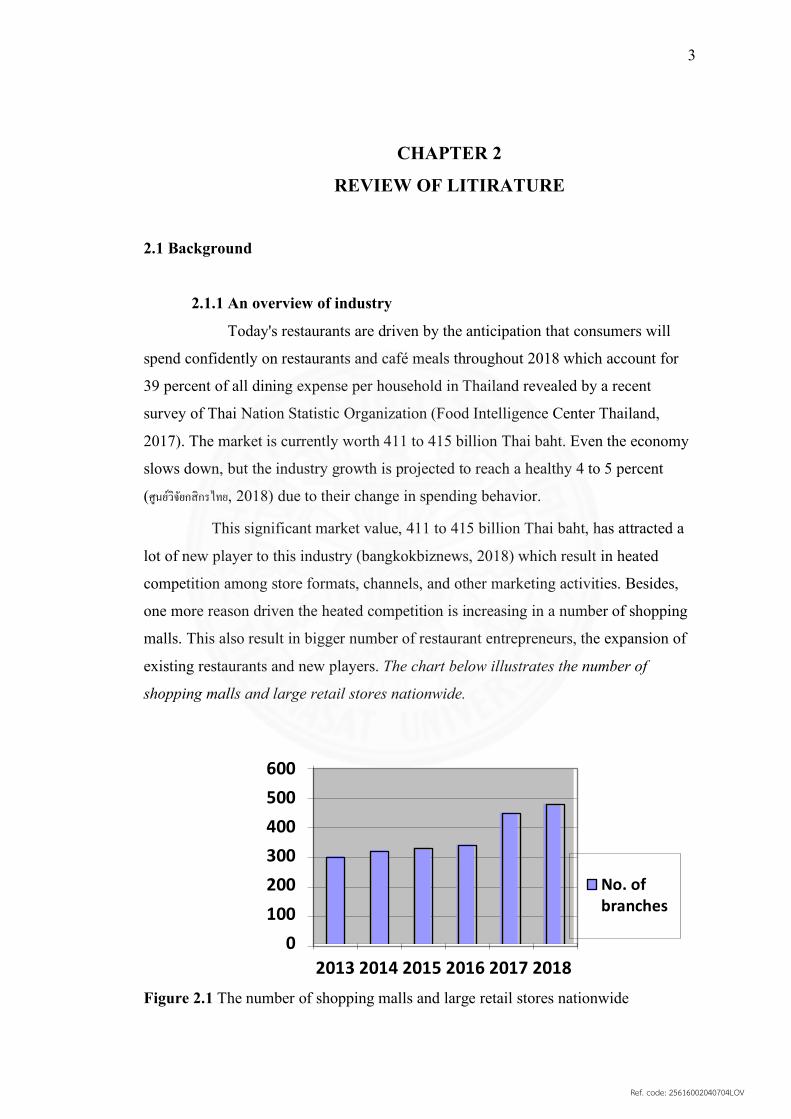
This significant market value, 411 to 415 billion Thai baht, has attracted a
lot of new player to this industry (bangkokbiznews, 2018) which result in heated
competition among store formats, channels, and other marketing activities. Besides,
one more reason driven the heated competition is increasing in a number of shopping
malls. This also result in bigger number of restaurant entrepreneurs, the expansion of
existing restaurants and new players. The chart below illustrates the number of
shopping malls and large retail stores nationwide.
Figure 2.1 The number of shopping malls and large retail stores nationwide
0100200300400500600
2013 2014 2015 2016 2017 2018
No. ofbranches
Ref. code: 25616002040704LOV
4
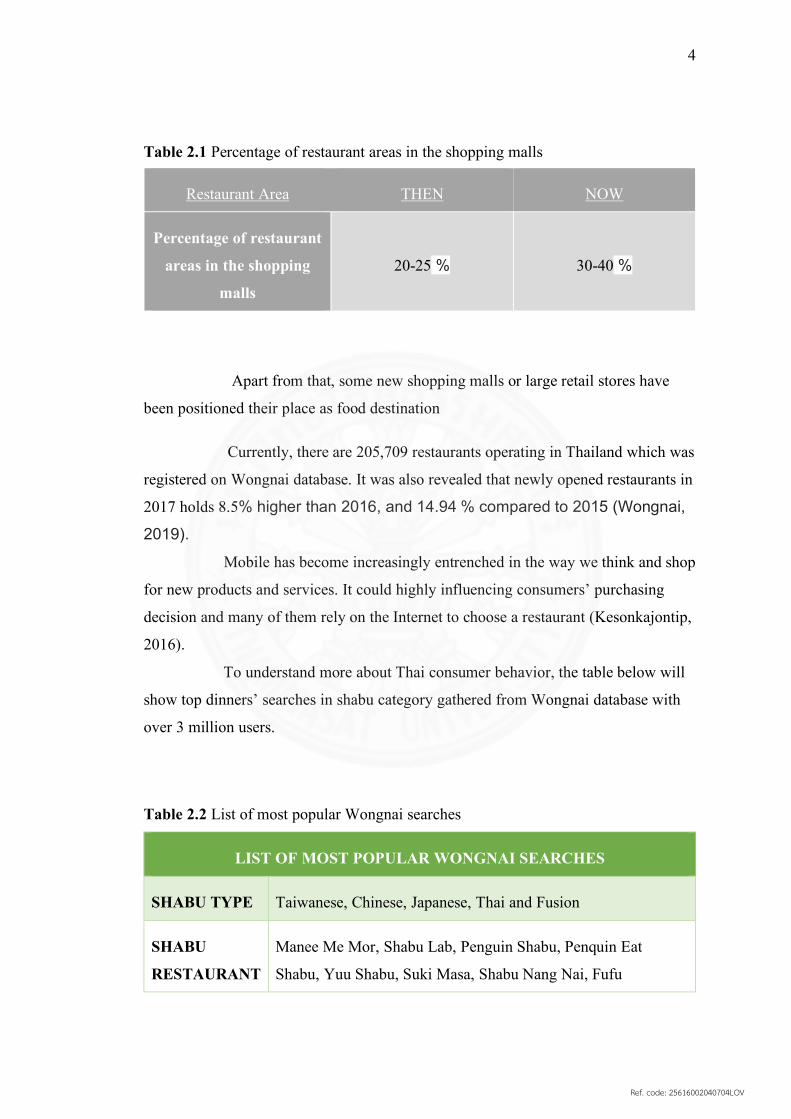
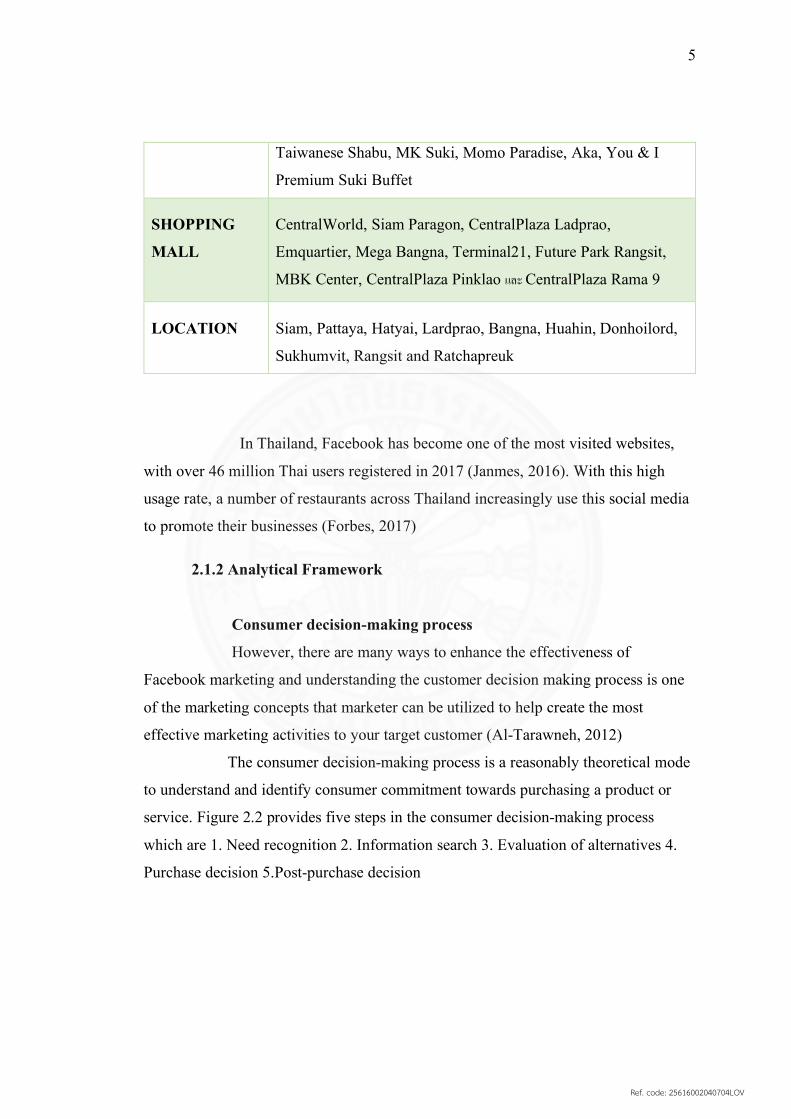
Table 2.1 Percentage of restaurant areas in the shopping malls
Apart from that, some new shopping malls or large retail stores have
been positioned their place as food destination
Currently, there are 205,709 restaurants operating in Thailand which was
registered on Wongnai database. It was also revealed that newly opened restaurants in
2017 holds 8.5% higher than 2016, and 14.94 % compared to 2015 (Wongnai,
2019).
Mobile has become increasingly entrenched in the way we think and shop
for new products and services. It could highly influencing consumers’ purchasing
decision and many of them rely on the Internet to choose a restaurant (Kesonkajontip,
2016).
To understand more about Thai consumer behavior, the table below will
show top dinners’ searches in shabu category gathered from Wongnai database with
over 3 million users.
Table 2.2 List of most popular Wongnai searches
LIST OF MOST POPULAR WONGNAI SEARCHES
SHABU TYPE Taiwanese, Chinese, Japanese, Thai and Fusion
SHABU
RESTAURANT
Manee Me Mor, Shabu Lab, Penguin Shabu, Penquin Eat
Shabu, Yuu Shabu, Suki Masa, Shabu Nang Nai, Fufu
Restaurant Area THEN NOW
Percentage of restaurant
areas in the shopping
malls
20-25 %
30-40 %
Ref. code: 25616002040704LOV
5
Taiwanese Shabu, MK Suki, Momo Paradise, Aka, You & I
Premium Suki Buffet
SHOPPING
MALL
CentralWorld, Siam Paragon, CentralPlaza Ladprao,
Emquartier, Mega Bangna, Terminal21, Future Park Rangsit,
MBK Center, CentralPlaza Pinklao และ CentralPlaza Rama 9
LOCATION Siam, Pattaya, Hatyai, Lardprao, Bangna, Huahin, Donhoilord,
Sukhumvit, Rangsit and Ratchapreuk
In Thailand, Facebook has become one of the most visited websites,
with over 46 million Thai users registered in 2017 (Janmes, 2016). With this high
usage rate, a number of restaurants across Thailand increasingly use this social media
to promote their businesses (Forbes, 2017)
2.1.2 Analytical Framework
Consumer decision-making process
However, there are many ways to enhance the effectiveness of
Facebook marketing and understanding the customer decision making process is one
of the marketing concepts that marketer can be utilized to help create the most
effective marketing activities to your target customer (Al-Tarawneh, 2012)
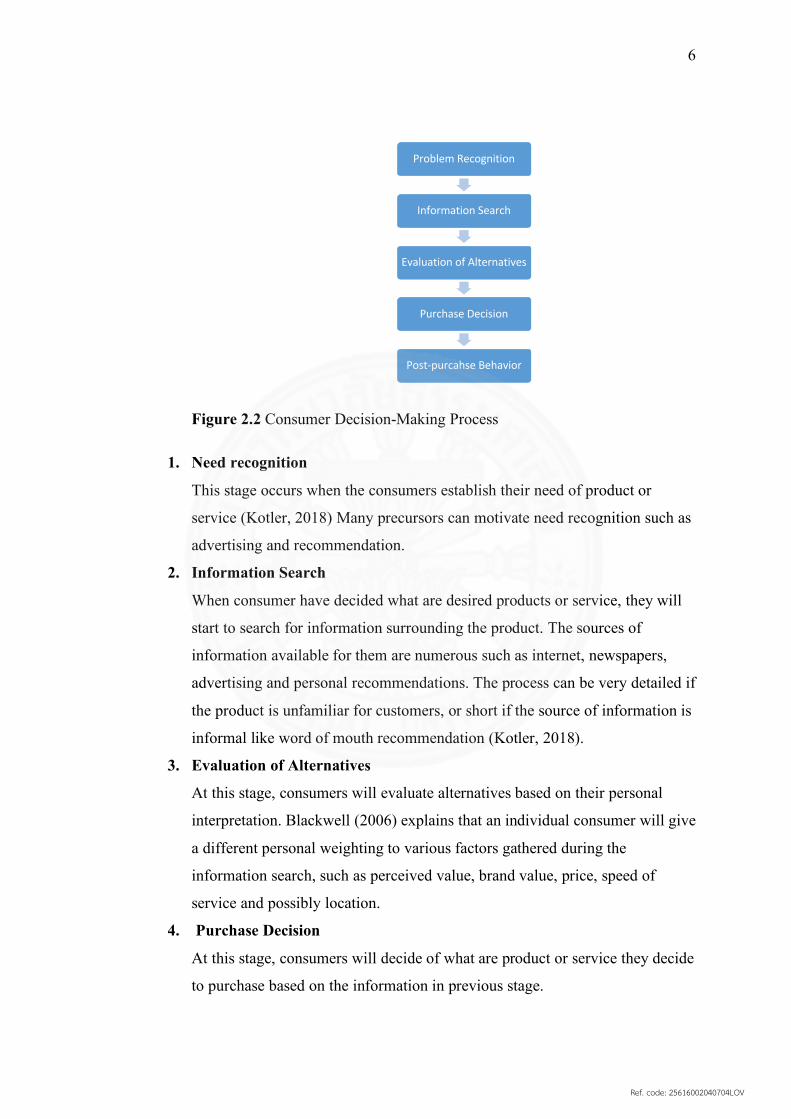
The consumer decision-making process is a reasonably theoretical mode
to understand and identify consumer commitment towards purchasing a product or
service. Figure 2.2 provides five steps in the consumer decision-making process
which are 1. Need recognition 2. Information search 3. Evaluation of alternatives 4.
Purchase decision 5.Post-purchase decision
Ref. code: 25616002040704LOV
6
Figure 2.2 Consumer Decision-Making Process
1. Need recognition
This stage occurs when the consumers establish their need of product or
service (Kotler, 2018) Many precursors can motivate need recognition such as
advertising and recommendation.
2. Information Search
When consumer have decided what are desired products or service, they will
start to search for information surrounding the product. The sources of
information available for them are numerous such as internet, newspapers,
advertising and personal recommendations. The process can be very detailed if
the product is unfamiliar for customers, or short if the source of information is
informal like word of mouth recommendation (Kotler, 2018).
3. Evaluation of Alternatives
At this stage, consumers will evaluate alternatives based on their personal
interpretation. Blackwell (2006) explains that an individual consumer will give
a different personal weighting to various factors gathered during the
information search, such as perceived value, brand value, price, speed of
service and possibly location.
4. Purchase Decision
At this stage, consumers will decide of what are product or service they decide
to purchase based on the information in previous stage.
Problem Recognition
Information Search
Evaluation of Alternatives
Purchase Decision
Post-purcahse Behavior
Ref. code: 25616002040704LOV
7
5. Post-purchase Evaluation
This is the final stage, after the goods has been purchased. Consumers
retrospectively evaluate their purchase decision against their original
assessment and purchase criteria, identifying the extent to which an item has
met, exceeded or even failed to meet expectations (al, 2011). According to
Solomon et al (2011) positive evaluation at this stage will almost inevitably
lead to repeat purchase and future positive word of mouth recommendation.
Content Analysis
In general, the approach of understand and studying media content is content
analysis. This theory will be a quantitative approach in communication research. A
series of specific steps are used for ensuring systematic coding, counting and
sampling of media content. (Rose, 2001)
Content analysis is a research method that has been widely used in analyzing
data. This analytical technique is used to generate findings and put them into context.
The most common notion in qualitative research is that a content analysis simply
means doing a word-frequency count. The assumption is made based on the words
that are mentioned most often. Synonym can also be used to count as the same words
as well.
Content analysis is a research technique used to make replicable and valid
inferences by interpreting and coding textual material. By systematically evaluating
texts (e.g., documents, oral communication, and graphics), qualitative data can be
converted into quantitative data. (Vincent J. Duriau, 2007)
Ref. code: 25616002040704LOV
8
CHAPTER 3
RESEARCH METHODLOGY
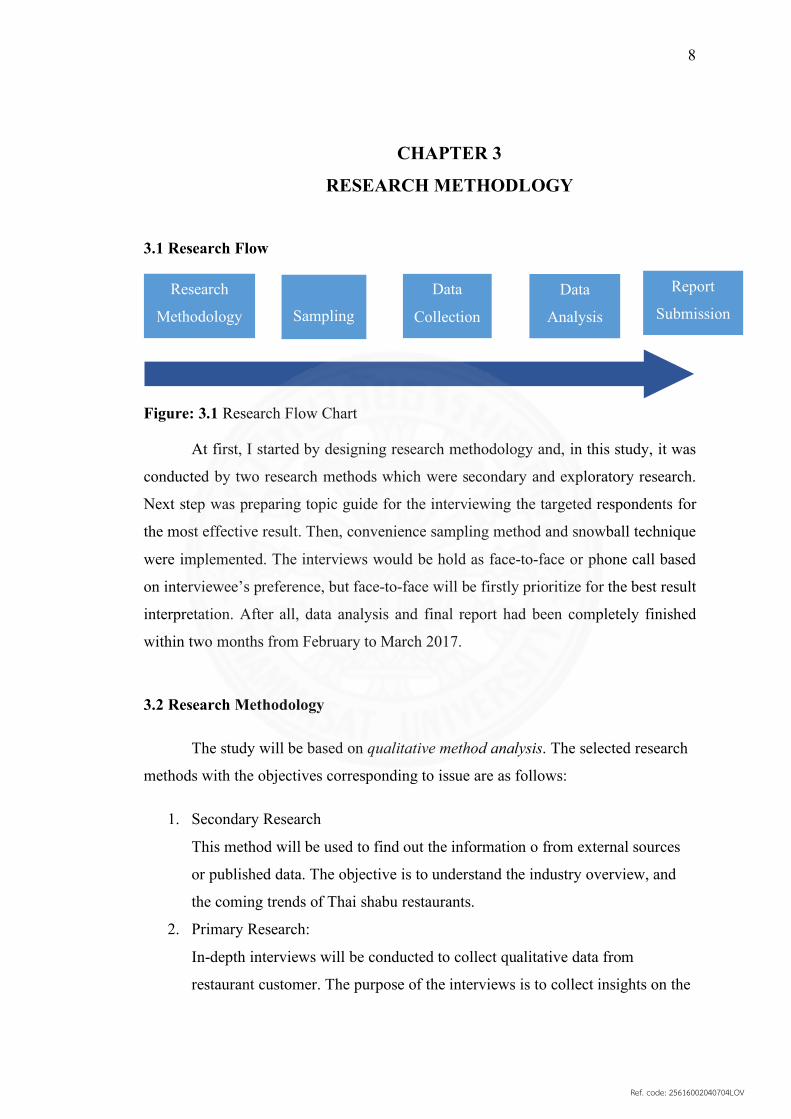
3.1 Research Flow
Figure: 3.1 Research Flow Chart
At first, I started by designing research methodology and, in this study, it was
conducted by two research methods which were secondary and exploratory research.
Next step was preparing topic guide for the interviewing the targeted respondents for
the most effective result. Then, convenience sampling method and snowball technique
were implemented. The interviews would be hold as face-to-face or phone call based
on interviewee’s preference, but face-to-face will be firstly prioritize for the best result
interpretation. After all, data analysis and final report had been completely finished
within two months from February to March 2017.
3.2 Research Methodology
The study will be based on qualitative method analysis. The selected research
methods with the objectives corresponding to issue are as follows:
1. Secondary Research
This method will be used to find out the information o from external sources
or published data. The objective is to understand the industry overview, and
the coming trends of Thai shabu restaurants.
2. Primary Research:
In-depth interviews will be conducted to collect qualitative data from
restaurant customer. The purpose of the interviews is to collect insights on the
Research
Methodology
Data
Collection
Data
Analysis Sampling
Report
Submission
Ref. code: 25616002040704LOV
9
perception of the respondents regarding attributes of content of Facebook
advertising such as their likes and dislikes that affect purchase decision.
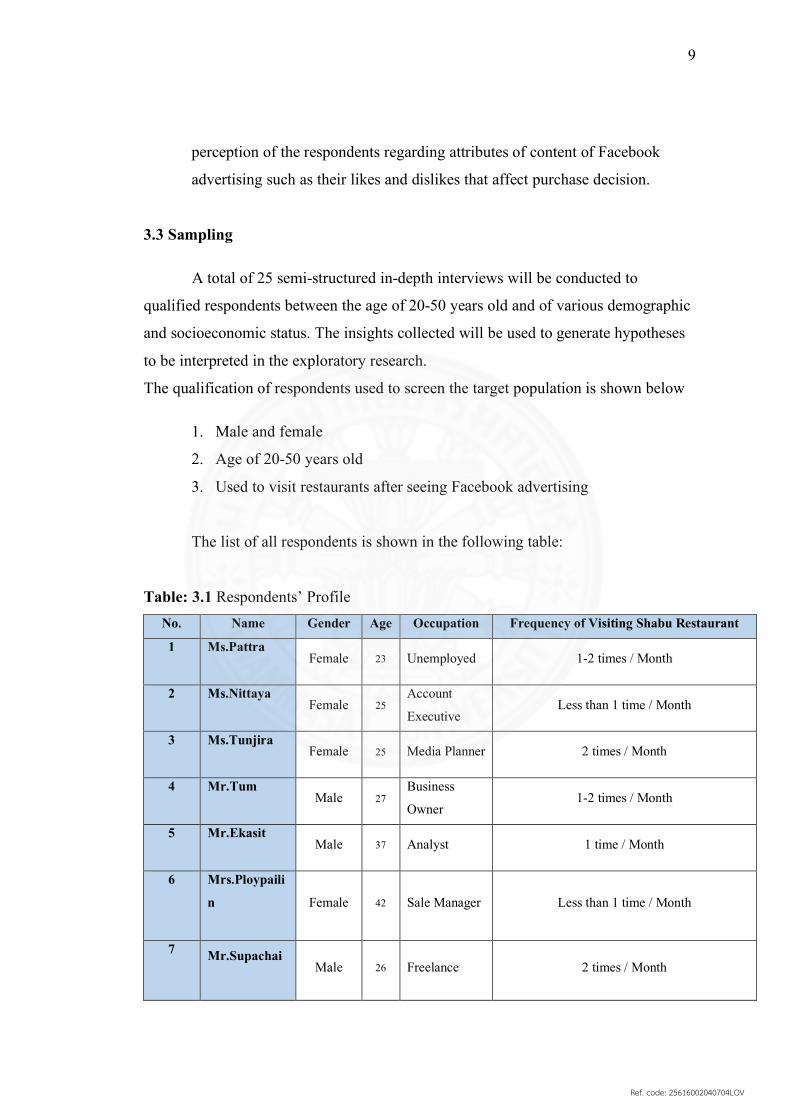
3.3 Sampling
A total of 25 semi-structured in-depth interviews will be conducted to
qualified respondents between the age of 20-50 years old and of various demographic
and socioeconomic status. The insights collected will be used to generate hypotheses
to be interpreted in the exploratory research.
The qualification of respondents used to screen the target population is shown below
1. Male and female
2. Age of 20-50 years old
3. Used to visit restaurants after seeing Facebook advertising
The list of all respondents is shown in the following table:
Table: 3.1 Respondents’ Profile No. Name Gender Age Occupation Frequency of Visiting Shabu Restaurant
1 Ms.Pattra
Female 23 Unemployed 1-2 times / Month
2 Ms.Nittaya
Female 25
Account
Executive Less than 1 time / Month
3 Ms.Tunjira
Female 25 Media Planner 2 times / Month
4 Mr.Tum
Male 27
Business
Owner 1-2 times / Month
5 Mr.Ekasit
Male 37 Analyst 1 time / Month
6 Mrs.Ploypaili
n
Female 42 Sale Manager Less than 1 time / Month
7 Mr.Supachai
Male 26 Freelance 2 times / Month
Ref. code: 25616002040704LOV
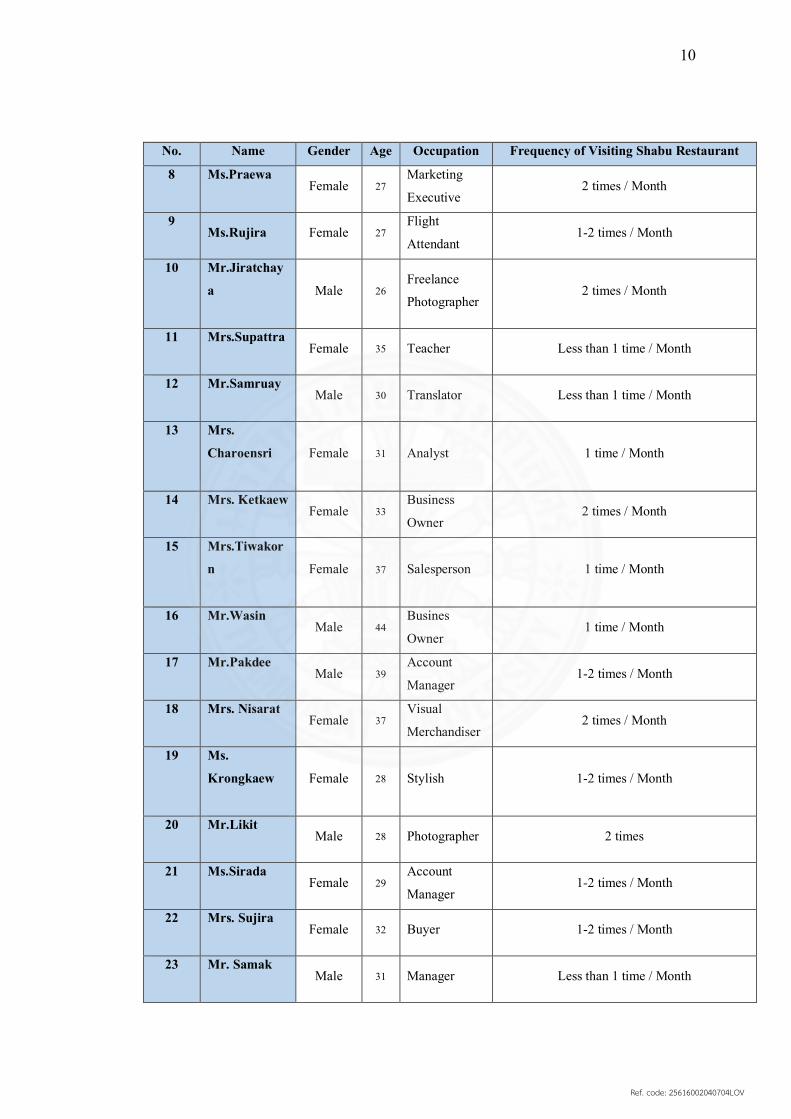
10
No. Name Gender Age Occupation Frequency of Visiting Shabu Restaurant
8 Ms.Praewa
Female 27
Marketing
Executive 2 times / Month
9 Ms.Rujira Female 27
Flight
Attendant 1-2 times / Month
10 Mr.Jiratchay
a
Male 26 Freelance
Photographer 2 times / Month
11 Mrs.Supattra
Female 35 Teacher Less than 1 time / Month
12 Mr.Samruay
Male 30 Translator Less than 1 time / Month
13 Mrs.
Charoensri
Female 31 Analyst 1 time / Month
14 Mrs. Ketkaew
Female 33
Business
Owner 2 times / Month
15 Mrs.Tiwakor
n
Female 37 Salesperson 1 time / Month
16 Mr.Wasin
Male 44
Busines
Owner 1 time / Month
17 Mr.Pakdee
Male 39
Account
Manager 1-2 times / Month
18 Mrs. Nisarat
Female 37
Visual
Merchandiser 2 times / Month
19 Ms.
Krongkaew
Female 28 Stylish 1-2 times / Month
20 Mr.Likit
Male 28 Photographer 2 times
21 Ms.Sirada
Female 29
Account
Manager 1-2 times / Month
22 Mrs. Sujira
Female 32 Buyer 1-2 times / Month
23 Mr. Samak
Male 31 Manager Less than 1 time / Month
Ref. code: 25616002040704LOV
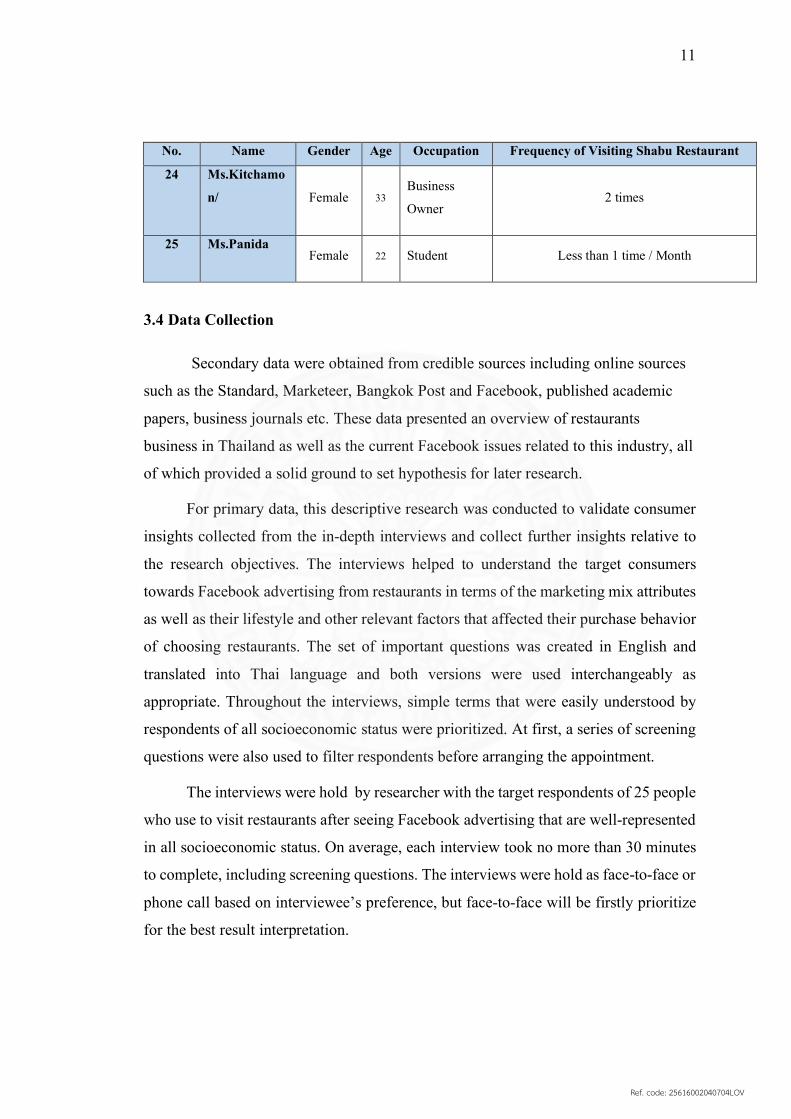
11
No. Name Gender Age Occupation Frequency of Visiting Shabu Restaurant
24 Ms.Kitchamo
n/
Female 33 Business
Owner 2 times
25 Ms.Panida
Female 22 Student Less than 1 time / Month
3.4 Data Collection
Secondary data were obtained from credible sources including online sources
such as the Standard, Marketeer, Bangkok Post and Facebook, published academic
papers, business journals etc. These data presented an overview of restaurants
business in Thailand as well as the current Facebook issues related to this industry, all
of which provided a solid ground to set hypothesis for later research.
For primary data, this descriptive research was conducted to validate consumer
insights collected from the in-depth interviews and collect further insights relative to
the research objectives. The interviews helped to understand the target consumers
towards Facebook advertising from restaurants in terms of the marketing mix attributes
as well as their lifestyle and other relevant factors that affected their purchase behavior
of choosing restaurants. The set of important questions was created in English and
translated into Thai language and both versions were used interchangeably as
appropriate. Throughout the interviews, simple terms that were easily understood by
respondents of all socioeconomic status were prioritized. At first, a series of screening
questions were also used to filter respondents before arranging the appointment.
The interviews were hold by researcher with the target respondents of 25 people
who use to visit restaurants after seeing Facebook advertising that are well-represented
in all socioeconomic status. On average, each interview took no more than 30 minutes
to complete, including screening questions. The interviews were hold as face-to-face or
phone call based on interviewee’s preference, but face-to-face will be firstly prioritize
for the best result interpretation.
Ref. code: 25616002040704LOV
12
3.5 Data Analysis
All interviews were recorded and themes determined using content analysis and
consumer decision-making process.
Ref. code: 25616002040704LOV
13
CHAPTER 4
RESULT AND DISCUSSION
Major criteria in choosing shabu restaurants
Almost all of respondents have similar criteria in choosing shabu restaurant.
The most important criteria that most of respondents have strongly agreed are
1. Price
2. Store location
3. Attractiveness of the restaurant ad
4. Friend
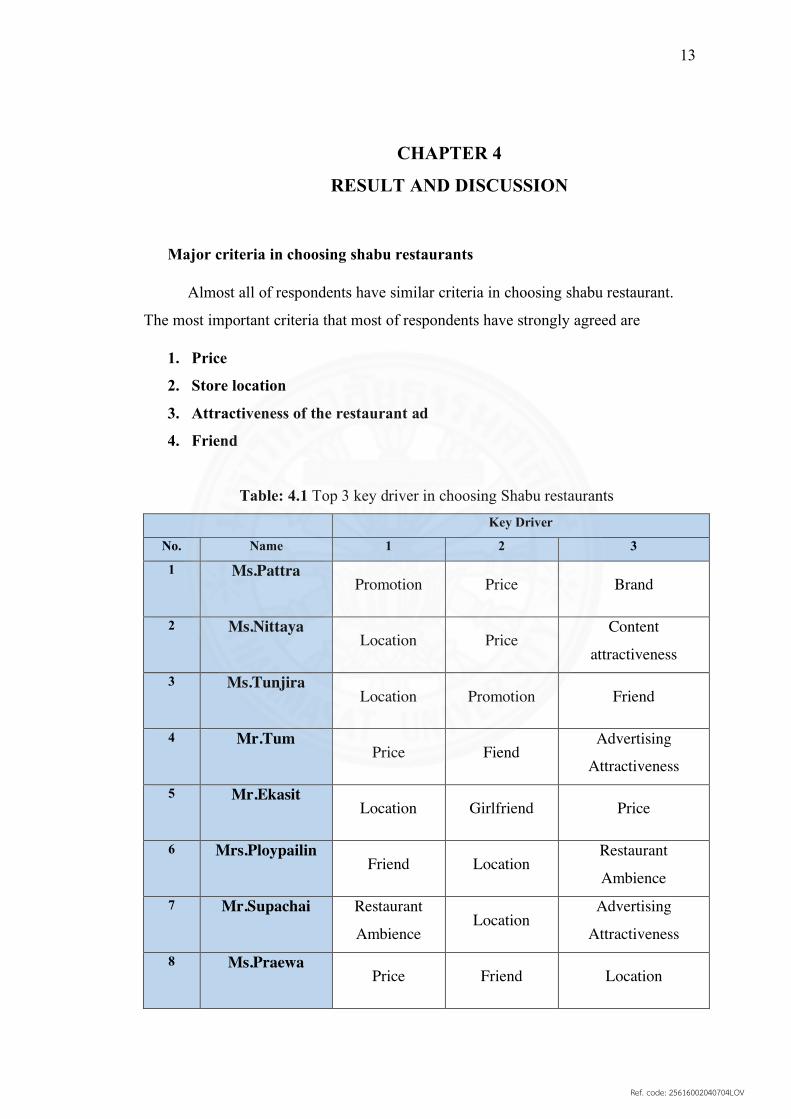
Table: 4.1 Top 3 key driver in choosing Shabu restaurants Key Driver
No. Name 1 2 3
1 Ms.Pattra
Promotion Price Brand
2 Ms.Nittaya
Location Price
Content
attractiveness 3 Ms.Tunjira
Location Promotion Friend
4 Mr.Tum
Price Fiend Advertising
Attractiveness 5 Mr.Ekasit
Location Girlfriend Price
6 Mrs.Ploypailin
Friend Location
Restaurant
Ambience 7 Mr.Supachai
Restaurant
Ambience Location
Advertising
Attractiveness 8 Ms.Praewa
Price Friend Location
Ref. code: 25616002040704LOV
14
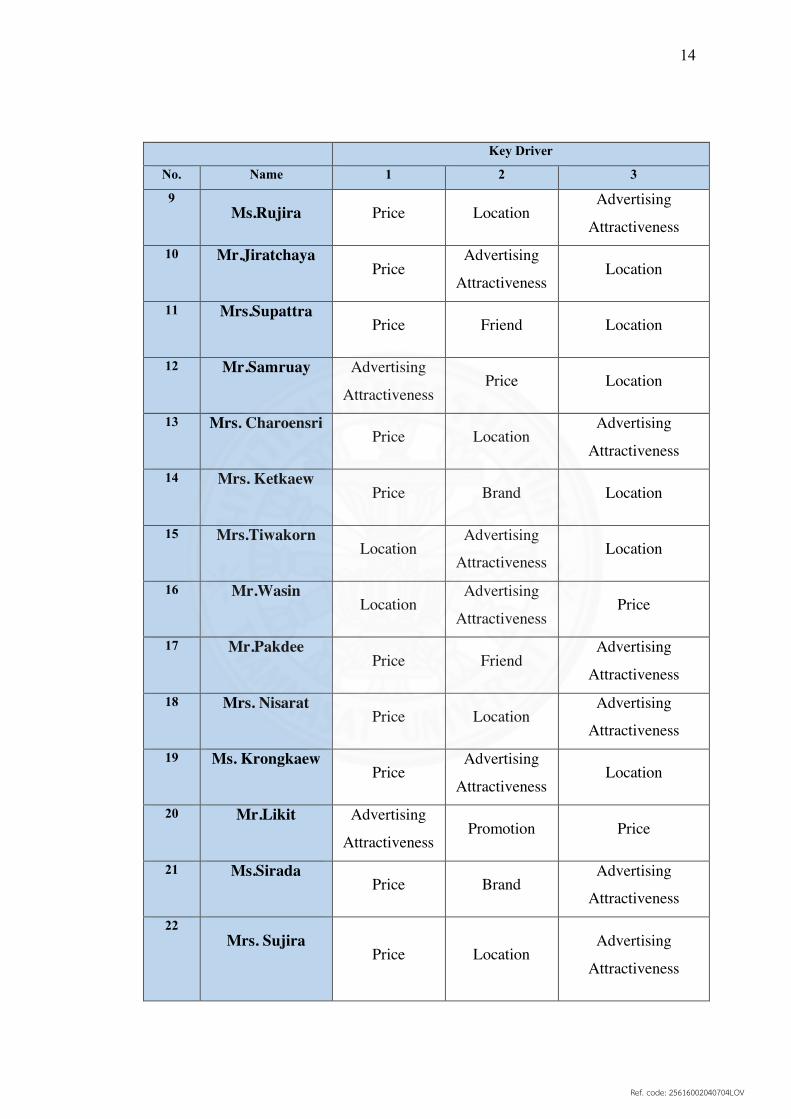
Key Driver
No. Name 1 2 3
9 Ms.Rujira Price Location
Advertising
Attractiveness 10 Mr.Jiratchaya
Price
Advertising
Attractiveness Location
11 Mrs.Supattra
Price Friend Location
12 Mr.Samruay
Advertising
Attractiveness Price Location
13 Mrs. Charoensri
Price Location
Advertising
Attractiveness 14 Mrs. Ketkaew
Price Brand Location
15 Mrs.Tiwakorn
Location Advertising
Attractiveness Location
16 Mr.Wasin
Location
Advertising
Attractiveness Price
17 Mr.Pakdee
Price Friend
Advertising
Attractiveness 18 Mrs. Nisarat
Price Location
Advertising
Attractiveness 19 Ms. Krongkaew
Price
Advertising
Attractiveness Location
20 Mr.Likit
Advertising
Attractiveness Promotion Price
21 Ms.Sirada
Price Brand Advertising
Attractiveness 22
Mrs. Sujira
Price Location
Advertising
Attractiveness
Ref. code: 25616002040704LOV
15
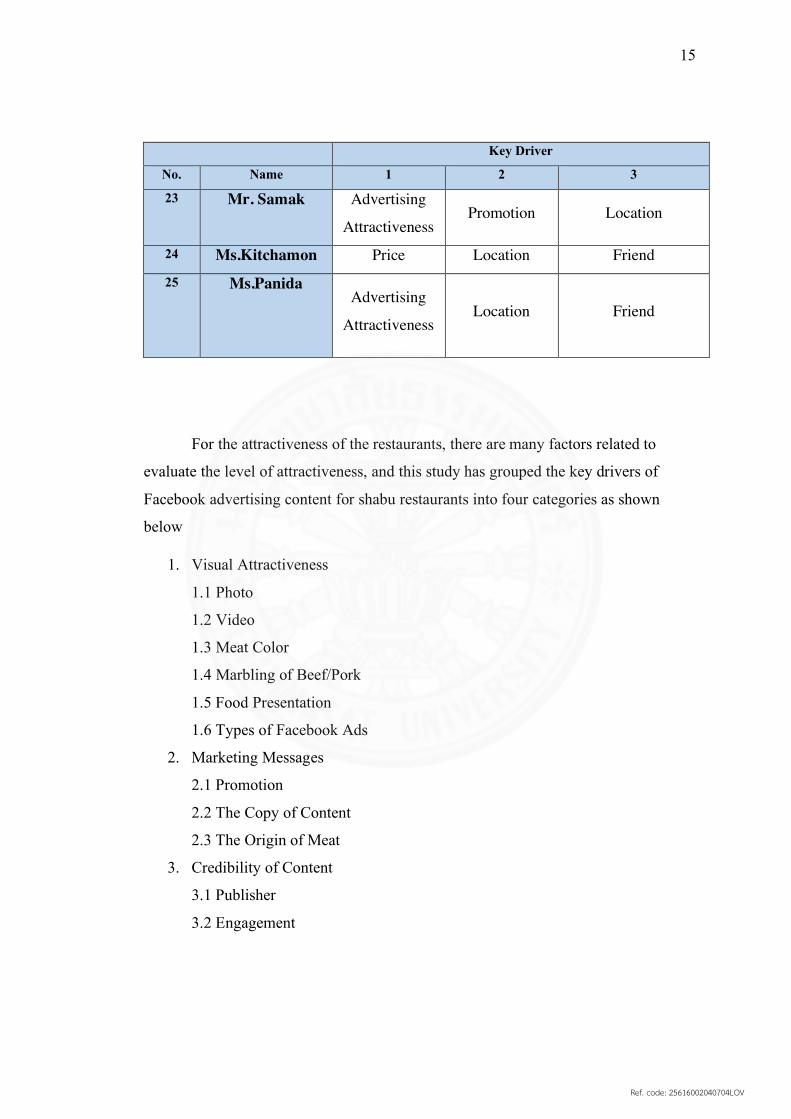
Key Driver
No. Name 1 2 3
23 Mr. Samak
Advertising
Attractiveness Promotion Location
24 Ms.Kitchamon Price Location Friend 25 Ms.Panida
Advertising
Attractiveness Location Friend
For the attractiveness of the restaurants, there are many factors related to
evaluate the level of attractiveness, and this study has grouped the key drivers of
Facebook advertising content for shabu restaurants into four categories as shown
below
1. Visual Attractiveness
1.1 Photo
1.2 Video
1.3 Meat Color
1.4 Marbling of Beef/Pork
1.5 Food Presentation
1.6 Types of Facebook Ads
2. Marketing Messages
2.1 Promotion
2.2 The Copy of Content
2.3 The Origin of Meat
3. Credibility of Content
3.1 Publisher
3.2 Engagement
Ref. code: 25616002040704LOV
16
Key driver for attractiveness of Facebook advertising content
1.Visual Attractiveness
1.1 Photo
Resulting from the interviews, all of respondents mutually agreed that photo
is the most essential key driver of Facebook advertising. To clarify how the good ad
photo should be, basically, the key findings from majorities’ answer are summarized
below
1.1.1 High quality photo
The photo should be clear in high definition. The technique of depth of field,
the focal object is clear with blurred background, is not preferred form majority of
respondents
“The ad photo should be clear which allows me to see the whole elements
of the restaurants such as food and restaurant ambience” (Ketkaew, 33)
“I want to see not only the food but also the utensil provided.” (Samruay,
30)
1.1.2 Good lighting
Twenty-two of the respondents agreed that natural light is important key.
The light should be soft or diffused. It should always bring out the part you
want to emphasize with bright spot. Also, nine of them mentioned that harsh
shadow makes the food unappetizing. Besides, five of them said that they
prefer lighting from side because it allows people to see food texture and
dimension of real dish.
1.1.3 Right composition for displaying the essence of dish
Majority of the respondents said that the ad photo should be visually clear
of what is the selling point, highlight or gimmick of each shabu restaurants.
Fifteen of them agreed that placing the selling point at center is the best
Ref. code: 25616002040704LOV
17
composition, while the six respondents mentioned that the food can be placed
anywhere but size of selling dish should occupy the largest part of the photo.
The rest four interviewee agreed that the dish size or composition does not
matter but leading signal is essential such as ad copy.
“The focal dish is easy to capture if it was placed at the center of the
photo” (Supattra, 35)
“Placing the meat at center is the best composition” (Krongkaeew, 280
“The selling point can be positioned in any part of the photo but it should
have something leading to see it such as arrow pointing to it” (Charoensri,
31)
1.2 Video
Twenty of respondents answered that video key component of attractive ad
photo. Moreover, this study also finds the preferred attributes of video ad as follow.
1.2.1 Subtitle is needed.
Facebook ads in the form of video were set to play automatically on
new feed unless you turn it off. So most of the respondents said that subtitles
can help them understand or able to watch the video content more clearly in
many situations.
“It happens many times that the host in video or narrower voice describe how
much the shabu taste delicious but I could not understand or see it because they don’t
provide subtitles, especially when I am out” (Wasin, 44)
“Even I watch the video but turned the sound off, I can understand it. The
subtitles and the photos are tempting enough to make me add the shabu restaurant to
my dinner list” (Sirada, 29)
1.2.2 Short and concise video
Many of respondents are not willing to take time watching ad video
longer than 2 to 5 minutes.
Ref. code: 25616002040704LOV
18
“The video length should not be longer than 2 minutes. The
introduction must be short and concise” (Tunjira, 26)
“I will not sacrifice time watching ad that long. The maximum time is
5 minutes for me. Less than 2 is perfect” (Nittaya, 25)
1.2.3 Exposing stars or famous food expert on video
Most of respondents agreed that if the video contains famous or well-
known stars or famous food expert, they are more willing to watch the video
ad.
“If I see the actor or actress or famous chef in advertising, I will watch the video
longer” (Tum, 27)
“Food influencer is good ad component that make me feel more
interested and trust more” (Ploypailin, 42)
Key component in shabu ad photo and video is sliced beef or pork as all of
respondents requested to see in ad photo. Almost all of interviewee agreed that
thinly sliced shape is important component, while all of them want to see the
freshness and juiciness of the meat. The clarification of how to make it meets
customer standard is shown below.
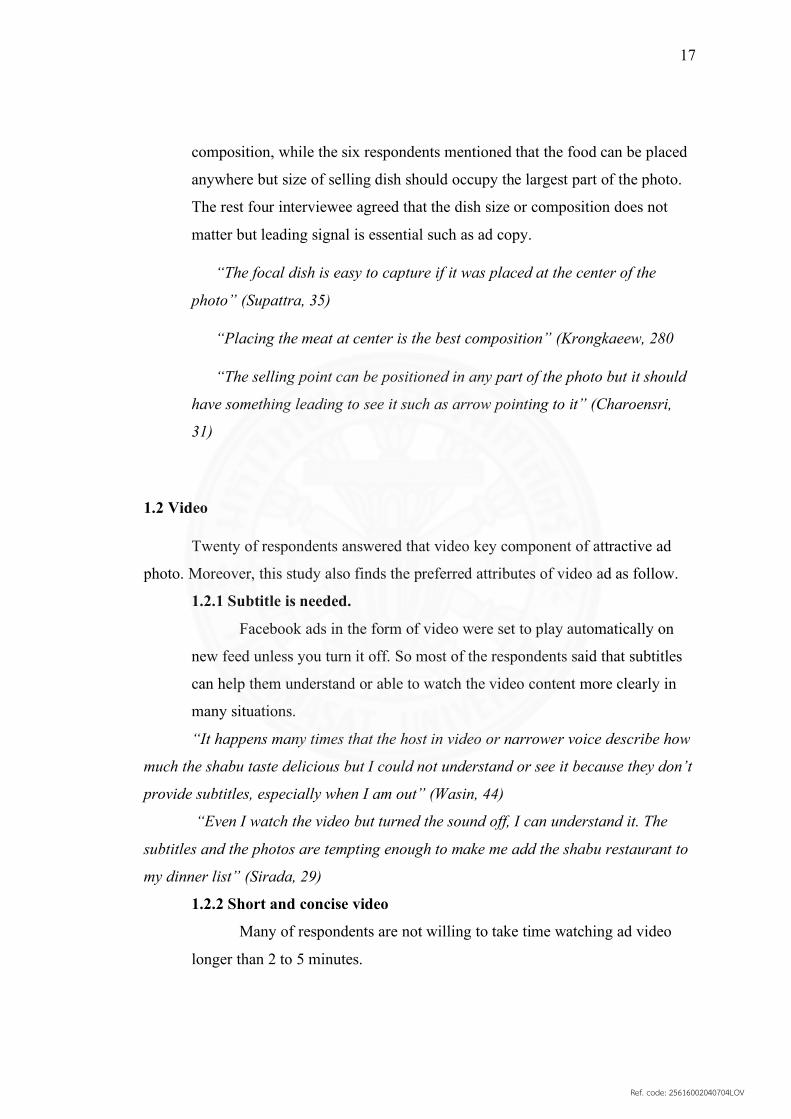
1.3 Meat color
The major visual factor which affects the quality of meat is its raw color. The
intensity of meat color should be freshly red, pink, or dark red. However, the shade
must not be too vivid which can easily see that it was retouched unnaturally. These can
be applied to pork, beef and lamb also.
Ref. code: 25616002040704LOV
19
Figure 4.1 The meat color
“The quality of meat is the most important factor for me that can induce
potentially to visit. Thinly sliced marbled red beef or pork are necessary” (Rujira, 27)
“Color and layer of fat are what I used for identifying the quality of meat. Red
means fresh and tastes delicious. The color should be pink or red” (Jiratchaya, 26)
Besides, we also found that most of respondents are preferred to see the photo
of raw meat rather than cooked because they can guess the taste and quality.
“If the copy did not describe well about the sourcing of meat, I am able to guess
from the color and texture of raw meat. If they have neither, I might not go”
(Charoensri, 31)
“The photo of raw sliced meat is far more attractive than cooked one” (Likit,
28)
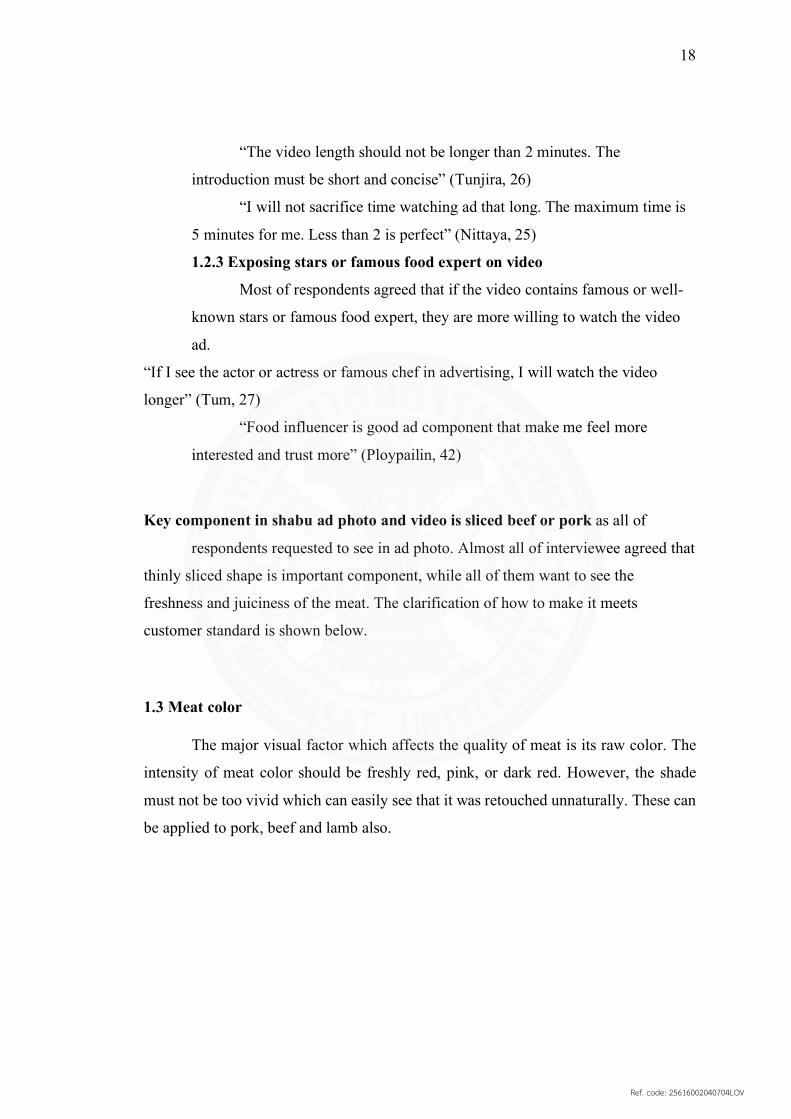
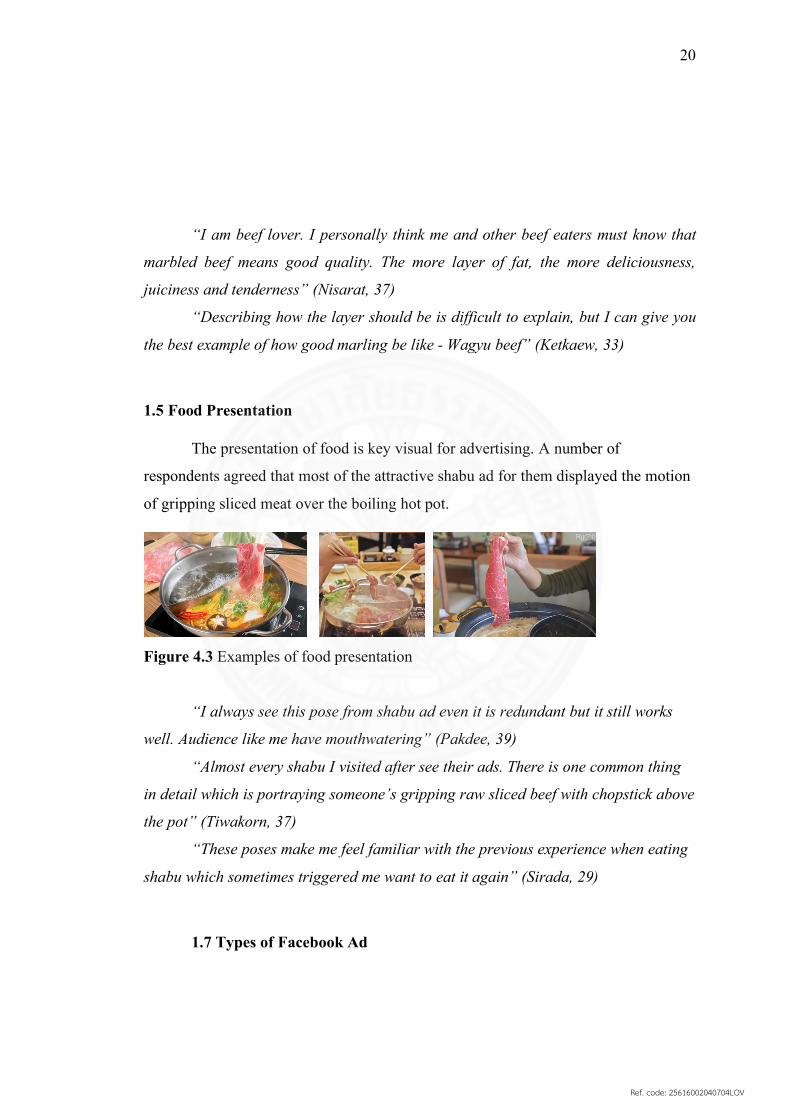
1.4 The Marbling of Beef/Pork
For beef, the presence of marbling, a layer of white color from fat in the form
of marble imbedded within meat, can deliver positively effect to audience in the aspect
of beef quality in terms of flavor, tenderness and also juiciness. For identifying the
perfect level of fat, we can use renowned ‘Wagyu beef’ as benchmark.
Figure 4.2 The marbling of beef
Ref. code: 25616002040704LOV
20
“I am beef lover. I personally think me and other beef eaters must know that
marbled beef means good quality. The more layer of fat, the more deliciousness,
juiciness and tenderness” (Nisarat, 37)
“Describing how the layer should be is difficult to explain, but I can give you
the best example of how good marling be like - Wagyu beef” (Ketkaew, 33)
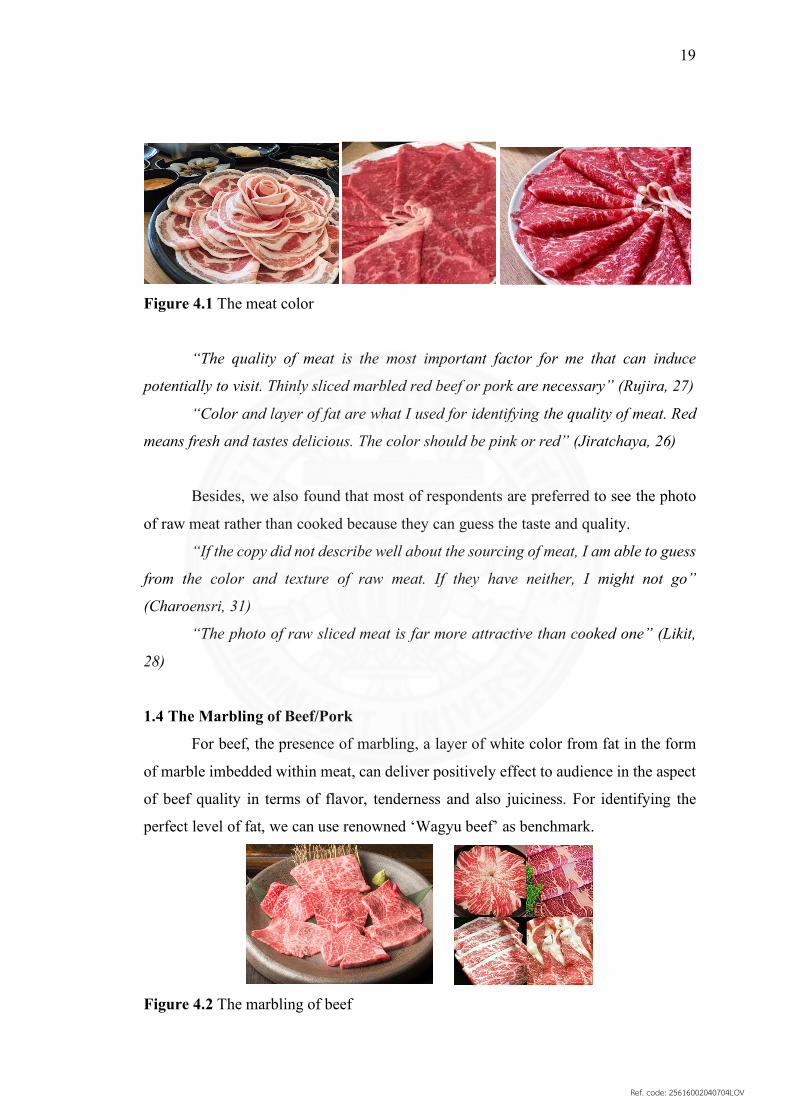
1.5 Food Presentation
The presentation of food is key visual for advertising. A number of
respondents agreed that most of the attractive shabu ad for them displayed the motion
of gripping sliced meat over the boiling hot pot.
Figure 4.3 Examples of food presentation
“I always see this pose from shabu ad even it is redundant but it still works
well. Audience like me have mouthwatering” (Pakdee, 39)
“Almost every shabu I visited after see their ads. There is one common thing
in detail which is portraying someone’s gripping raw sliced beef with chopstick above
the pot” (Tiwakorn, 37)
“These poses make me feel familiar with the previous experience when eating
shabu which sometimes triggered me want to eat it again” (Sirada, 29)
1.7 Types of Facebook Ad
Ref. code: 25616002040704LOV
21
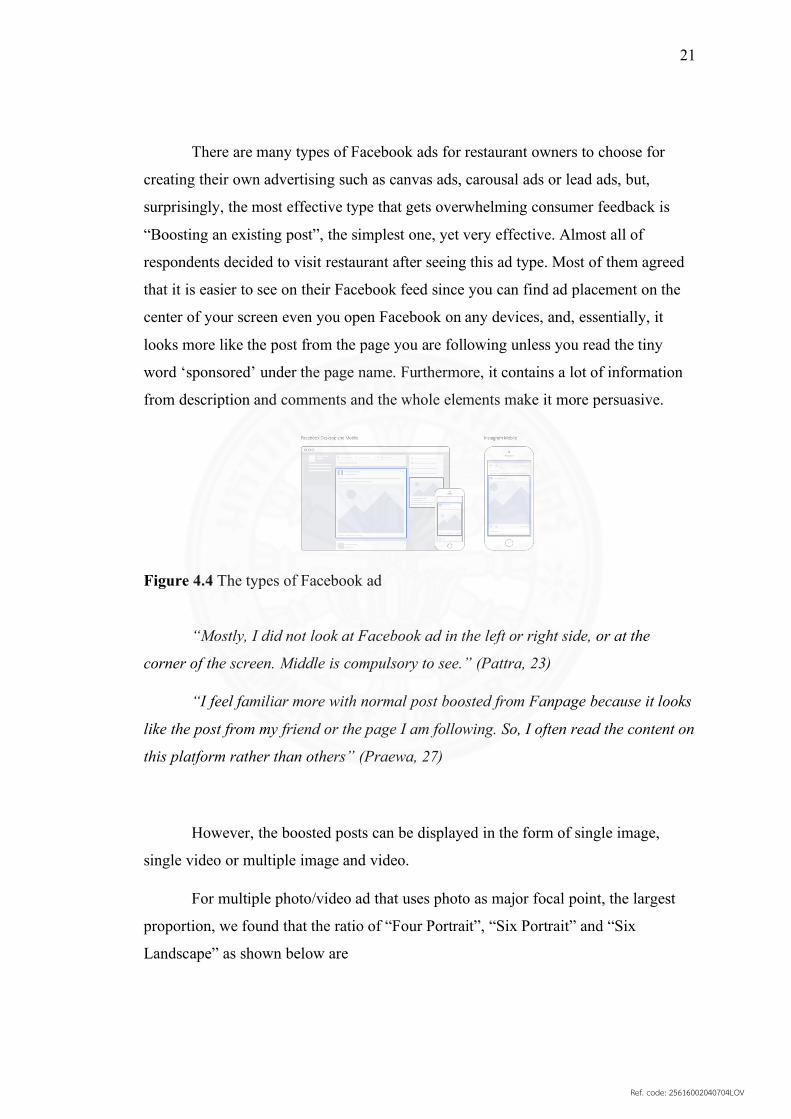
There are many types of Facebook ads for restaurant owners to choose for
creating their own advertising such as canvas ads, carousal ads or lead ads, but,
surprisingly, the most effective type that gets overwhelming consumer feedback is
“Boosting an existing post”, the simplest one, yet very effective. Almost all of
respondents decided to visit restaurant after seeing this ad type. Most of them agreed
that it is easier to see on their Facebook feed since you can find ad placement on the
center of your screen even you open Facebook on any devices, and, essentially, it
looks more like the post from the page you are following unless you read the tiny
word ‘sponsored’ under the page name. Furthermore, it contains a lot of information
from description and comments and the whole elements make it more persuasive.
Figure 4.4 The types of Facebook ad
“Mostly, I did not look at Facebook ad in the left or right side, or at the
corner of the screen. Middle is compulsory to see.” (Pattra, 23)
“I feel familiar more with normal post boosted from Fanpage because it looks
like the post from my friend or the page I am following. So, I often read the content on
this platform rather than others” (Praewa, 27)
However, the boosted posts can be displayed in the form of single image,
single video or multiple image and video.
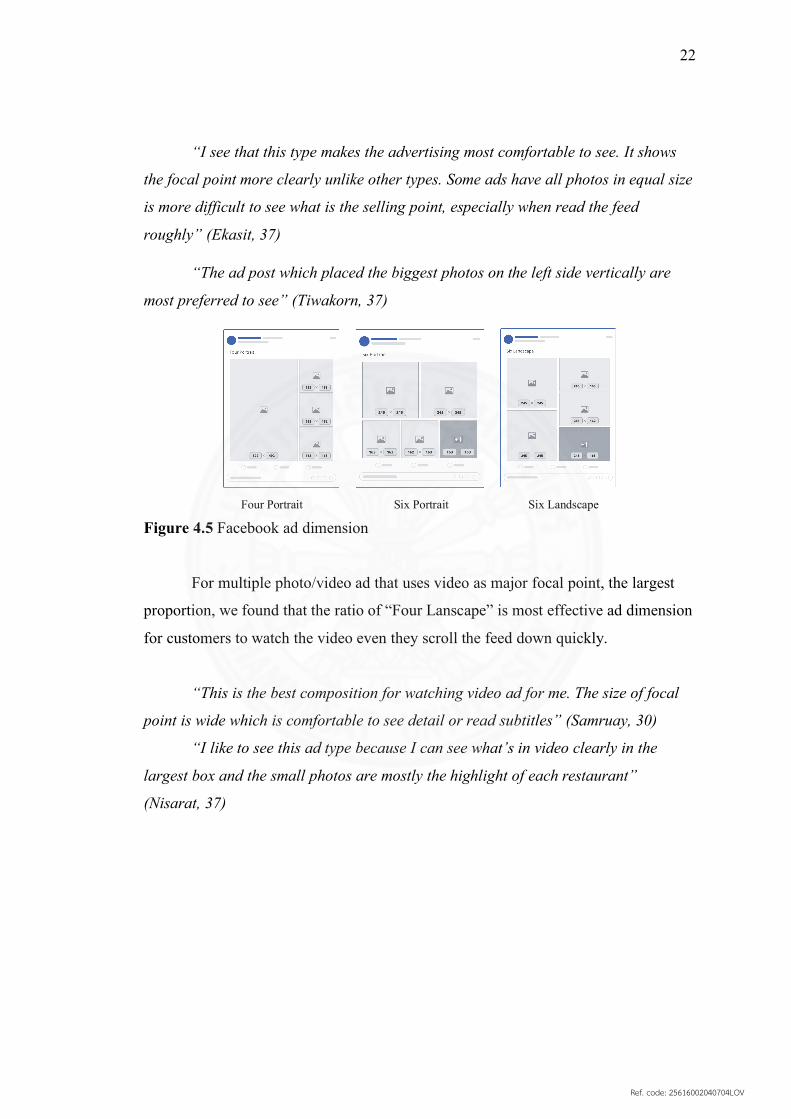
For multiple photo/video ad that uses photo as major focal point, the largest
proportion, we found that the ratio of “Four Portrait”, “Six Portrait” and “Six
Landscape” as shown below are
Ref. code: 25616002040704LOV
22
“I see that this type makes the advertising most comfortable to see. It shows
the focal point more clearly unlike other types. Some ads have all photos in equal size
is more difficult to see what is the selling point, especially when read the feed
roughly” (Ekasit, 37)
“The ad post which placed the biggest photos on the left side vertically are
most preferred to see” (Tiwakorn, 37)
Four Portrait Six Portrait Six Landscape
Figure 4.5 Facebook ad dimension
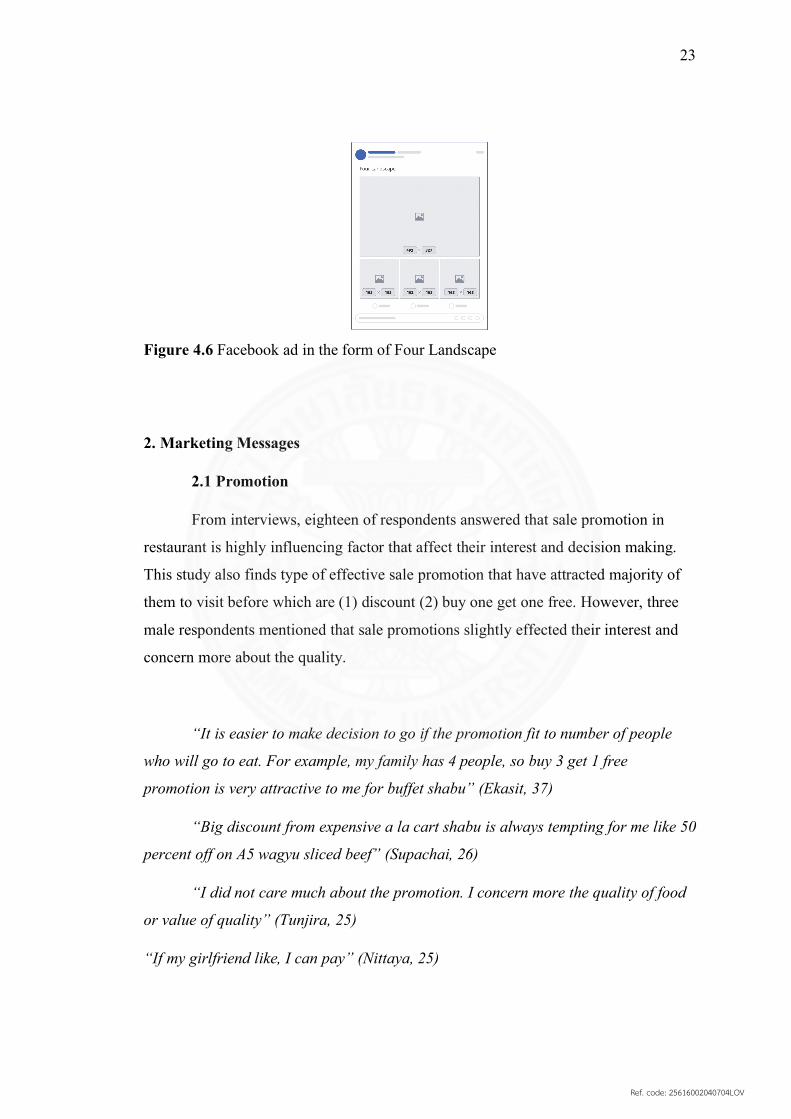
For multiple photo/video ad that uses video as major focal point, the largest
proportion, we found that the ratio of “Four Lanscape” is most effective ad dimension
for customers to watch the video even they scroll the feed down quickly.
“This is the best composition for watching video ad for me. The size of focal
point is wide which is comfortable to see detail or read subtitles” (Samruay, 30)
“I like to see this ad type because I can see what’s in video clearly in the
largest box and the small photos are mostly the highlight of each restaurant”
(Nisarat, 37)
Ref. code: 25616002040704LOV
23
Figure 4.6 Facebook ad in the form of Four Landscape
2. Marketing Messages
2.1 Promotion
From interviews, eighteen of respondents answered that sale promotion in
restaurant is highly influencing factor that affect their interest and decision making.
This study also finds type of effective sale promotion that have attracted majority of
them to visit before which are (1) discount (2) buy one get one free. However, three
male respondents mentioned that sale promotions slightly effected their interest and
concern more about the quality.
“It is easier to make decision to go if the promotion fit to number of people
who will go to eat. For example, my family has 4 people, so buy 3 get 1 free
promotion is very attractive to me for buffet shabu” (Ekasit, 37)
“Big discount from expensive a la cart shabu is always tempting for me like 50
percent off on A5 wagyu sliced beef” (Supachai, 26)
“I did not care much about the promotion. I concern more the quality of food
or value of quality” (Tunjira, 25)
“If my girlfriend like, I can pay” (Nittaya, 25)
Ref. code: 25616002040704LOV
24
Besides, this study also found that limited time offer for special/seasonal
ingredient or dish can highly attracted almost half of the respondents such as imported
beef or fish.
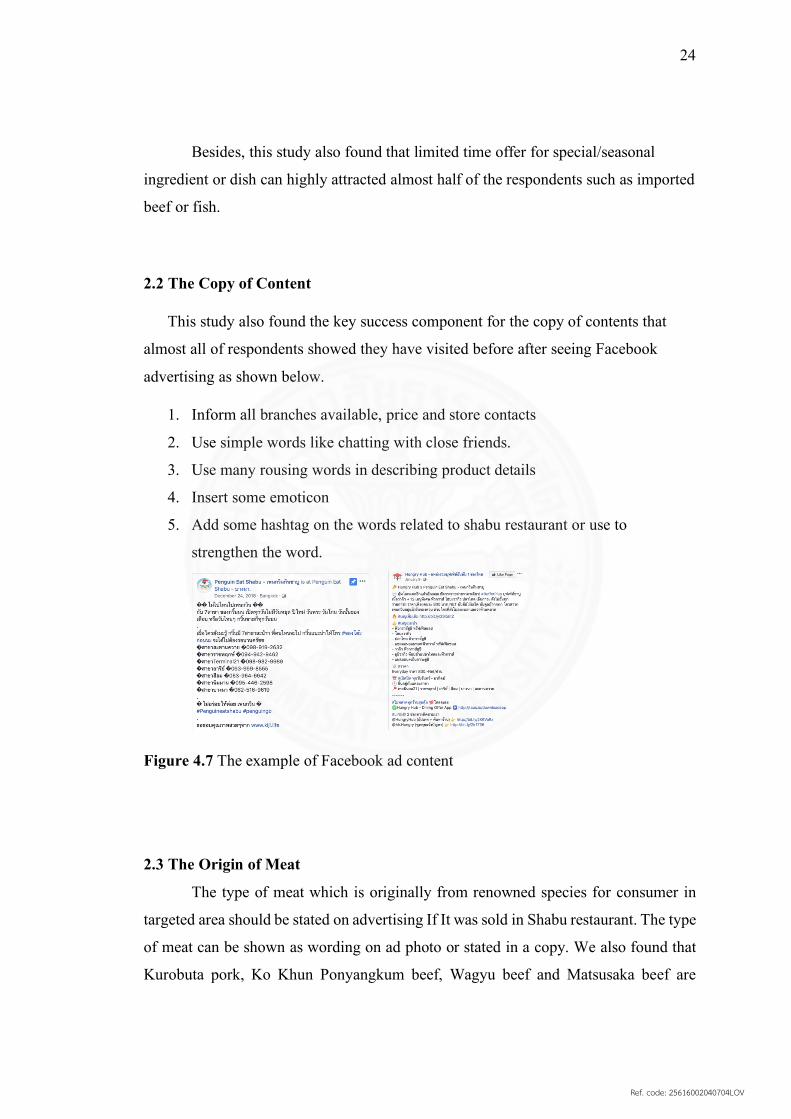
2.2 The Copy of Content
This study also found the key success component for the copy of contents that
almost all of respondents showed they have visited before after seeing Facebook
advertising as shown below.
1. Inform all branches available, price and store contacts
2. Use simple words like chatting with close friends.
3. Use many rousing words in describing product details
4. Insert some emoticon
5. Add some hashtag on the words related to shabu restaurant or use to
strengthen the word.
Figure 4.7 The example of Facebook ad content
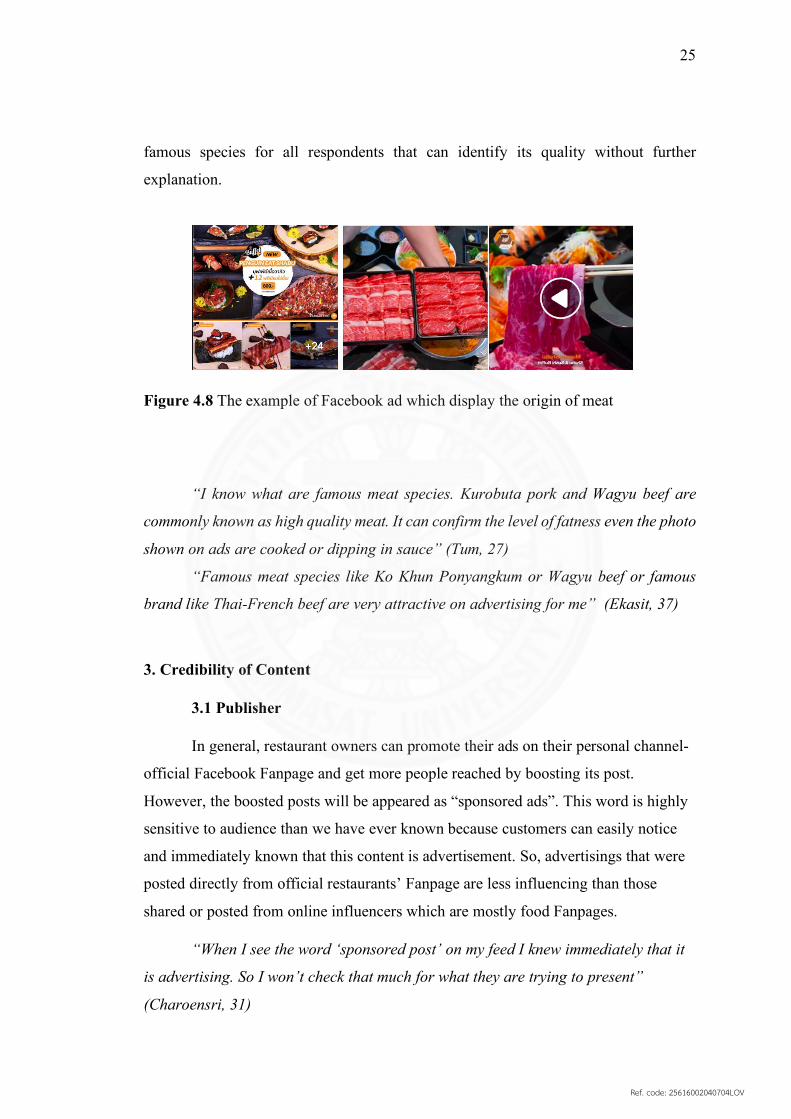
2.3 The Origin of Meat
The type of meat which is originally from renowned species for consumer in
targeted area should be stated on advertising If It was sold in Shabu restaurant. The type
of meat can be shown as wording on ad photo or stated in a copy. We also found that
Kurobuta pork, Ko Khun Ponyangkum beef, Wagyu beef and Matsusaka beef are
Ref. code: 25616002040704LOV
25
famous species for all respondents that can identify its quality without further
explanation.
Figure 4.8 The example of Facebook ad which display the origin of meat
“I know what are famous meat species. Kurobuta pork and Wagyu beef are
commonly known as high quality meat. It can confirm the level of fatness even the photo
shown on ads are cooked or dipping in sauce” (Tum, 27)
“Famous meat species like Ko Khun Ponyangkum or Wagyu beef or famous
brand like Thai-French beef are very attractive on advertising for me” (Ekasit, 37)
3. Credibility of Content
3.1 Publisher
In general, restaurant owners can promote their ads on their personal channel-
official Facebook Fanpage and get more people reached by boosting its post.
However, the boosted posts will be appeared as “sponsored ads”. This word is highly
sensitive to audience than we have ever known because customers can easily notice
and immediately known that this content is advertisement. So, advertisings that were
posted directly from official restaurants’ Fanpage are less influencing than those
shared or posted from online influencers which are mostly food Fanpages.
“When I see the word ‘sponsored post’ on my feed I knew immediately that it
is advertising. So I won’t check that much for what they are trying to present”
(Charoensri, 31)
Ref. code: 25616002040704LOV
26
“I follow many food Fanpages on Facebook and I always read their content
even known some are paid, however, some are real too.” (Wasin, 44)
“It would be more interesting if the content was shared from my friend on
Facebook” (Krongkaew, 28)
3.2 Engagement
Many consumers are actively looking at the level of engagement of a certain
restaurant’s ads as well as the content of Facebook advertising. We found that there
three main factors that they used in evaluation which are
(1) Like
(2) Share
(3) Comment.
For the first two types, people can easily check the number of people liked or
shared, but comments are key factor that can highly impact to ads’ credibility and dig
down for more information
“Sometimes, I did not skip Facebook sponsored ads because there are
hundreds or thousands of people liked, shared or comments. I think these numbers
can represent that there must be something interesting here” (Pakdee, 39)
“I like to see how people react to the ads on Facebook. Comments are fun to
see” (Supattra, 35)
A number of people read the comments under the post apart from the content
selling. They will check the real feedback from end users to evaluate the quality of
that restaurants before deciding to go. There are three types of comments that
typically found on ads which are (1) Positive comments (2) Negative comments and
(3) People tagged their friends. The first two types are perceived as direct experience
from real users which ads’ audience give high value to these categories, while a
number of people tagging each other imply to increasing the level of attractiveness to
Ref. code: 25616002040704LOV
27
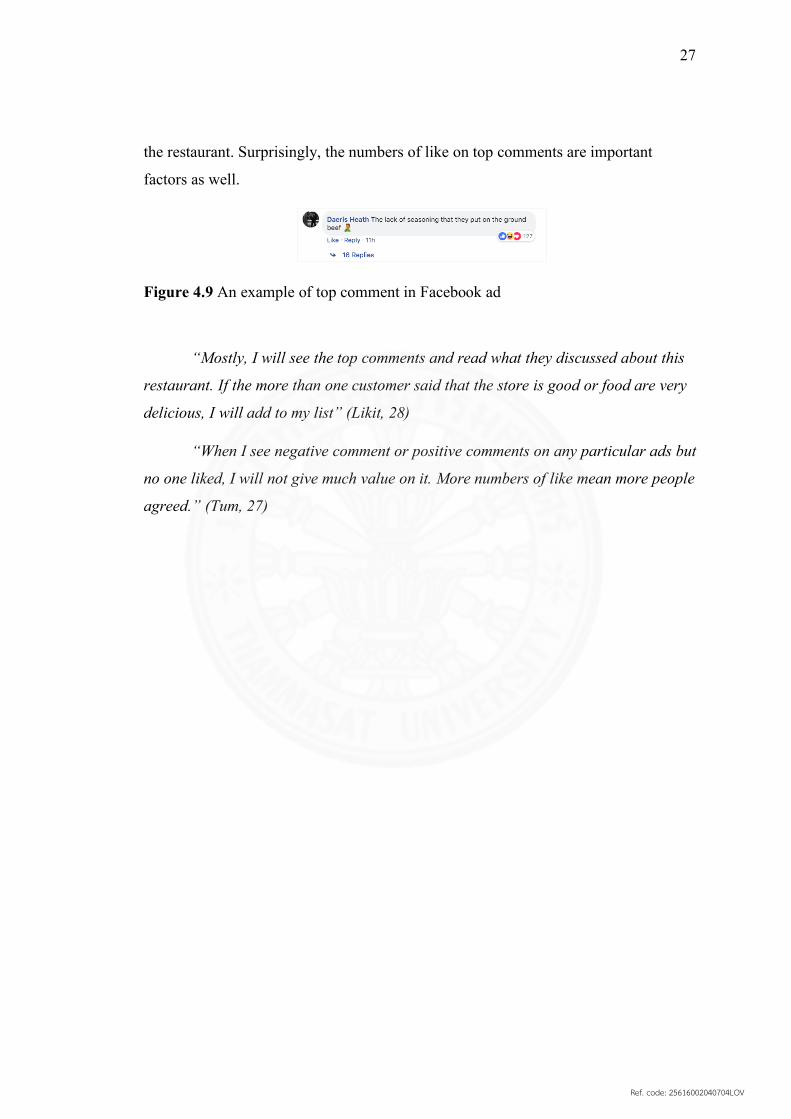
the restaurant. Surprisingly, the numbers of like on top comments are important
factors as well.
Figure 4.9 An example of top comment in Facebook ad
“Mostly, I will see the top comments and read what they discussed about this
restaurant. If the more than one customer said that the store is good or food are very
delicious, I will add to my list” (Likit, 28)
“When I see negative comment or positive comments on any particular ads but
no one liked, I will not give much value on it. More numbers of like mean more people
agreed.” (Tum, 27)
Ref. code: 25616002040704LOV
28
CHAPTER 5
CONCLUSIONS AND RECOMMENDATIONS
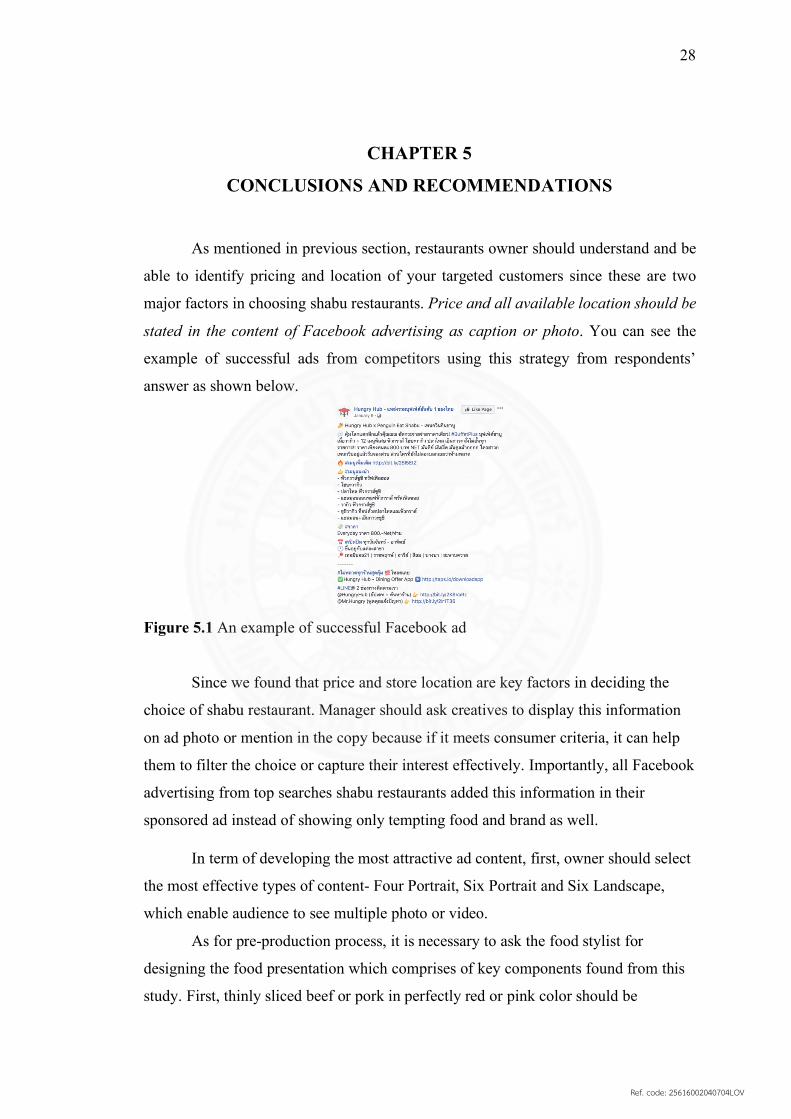
As mentioned in previous section, restaurants owner should understand and be
able to identify pricing and location of your targeted customers since these are two
major factors in choosing shabu restaurants. Price and all available location should be
stated in the content of Facebook advertising as caption or photo. You can see the
example of successful ads from competitors using this strategy from respondents’
answer as shown below.
Figure 5.1 An example of successful Facebook ad
Since we found that price and store location are key factors in deciding the
choice of shabu restaurant. Manager should ask creatives to display this information
on ad photo or mention in the copy because if it meets consumer criteria, it can help
them to filter the choice or capture their interest effectively. Importantly, all Facebook
advertising from top searches shabu restaurants added this information in their
sponsored ad instead of showing only tempting food and brand as well.
In term of developing the most attractive ad content, first, owner should select
the most effective types of content- Four Portrait, Six Portrait and Six Landscape,
which enable audience to see multiple photo or video.
As for pre-production process, it is necessary to ask the food stylist for
designing the food presentation which comprises of key components found from this
study. First, thinly sliced beef or pork in perfectly red or pink color should be
Ref. code: 25616002040704LOV
29
appeared in ads to portray freshness, juiciness and tenderness. Also, it should have
marbling, multiple layers of white fat imbedded meat texture. Importantly, the motion
of gripping sliced meat over the boiling hot pot is a great key visual to recall the
pleasure of previous experience of eating shabu. For briefing photographer, the
quality of photo must be clear in whole picture. The light should be soft and look
natural which allows consumer to see texture of food. Brightness should be spotted on
focal point. For photo composition, marketer should request photographer to have at
least one photo which the selling dish is positioned at the center in order to match
with consumer preference found in this study.
For video production, guidance is the same as photo mentioned in previous
paragraph, but subtitle is needed in this case.
After preparing all photo and video, selection of publisher would be in this
process. As a result of this study, publisher and engagement of advertising are
essential key driver on consumer’s mind. Marketer should spend money for hiring
famous food influencers to post your ads instead of sharing from your own Fanpage to
get better result. Besides, marketer has to be careful in selecting the right publisher.
Effective influencers will encourage a number people to engage in your post without
additional spending. This strategy will support another key driver in consumer mind-
increasing engagement. In general, advertising that is published from famous food
influencer such as Wannee Dak Rai Dee Wa or Dak, is prone to have higher
engagement.
The message of copy which delivers to audience should be (1) fun like
chatting with close friends (2) use many rousing words to persuade readers (3) insert
some emoticon to make the text look less formal to read (4) hashtag on the word you
want to be strengthen
Apart from publisher that impact the credibility of content delivered in ads, the
message of top comments are what most of customers have seen before making
decision. What marketer should do is monitoring the top comments whether it is
positive or negative. If it is negative, it should be removed by Fanpage owner.
However, some food Fanpage owner has regulation that prohibit from deleting
comments. Marketer should cooperate with digital marketing team to write a number
Ref. code: 25616002040704LOV
30
of positive comments and supported those messages with higher number of like.
Digital marketing agency could help you handle in this process.
Friend is also one of the major criteria in customer decision making process. It
seems like this is an uncontrollable factor, but what marketer can do best is attracting
them by launching sale promotion, one of key driver, to match with a number of
people visiting your restaurants per table such as fifty percent off on the second
person for Shabu buffet, or buy 2 get 1 free.
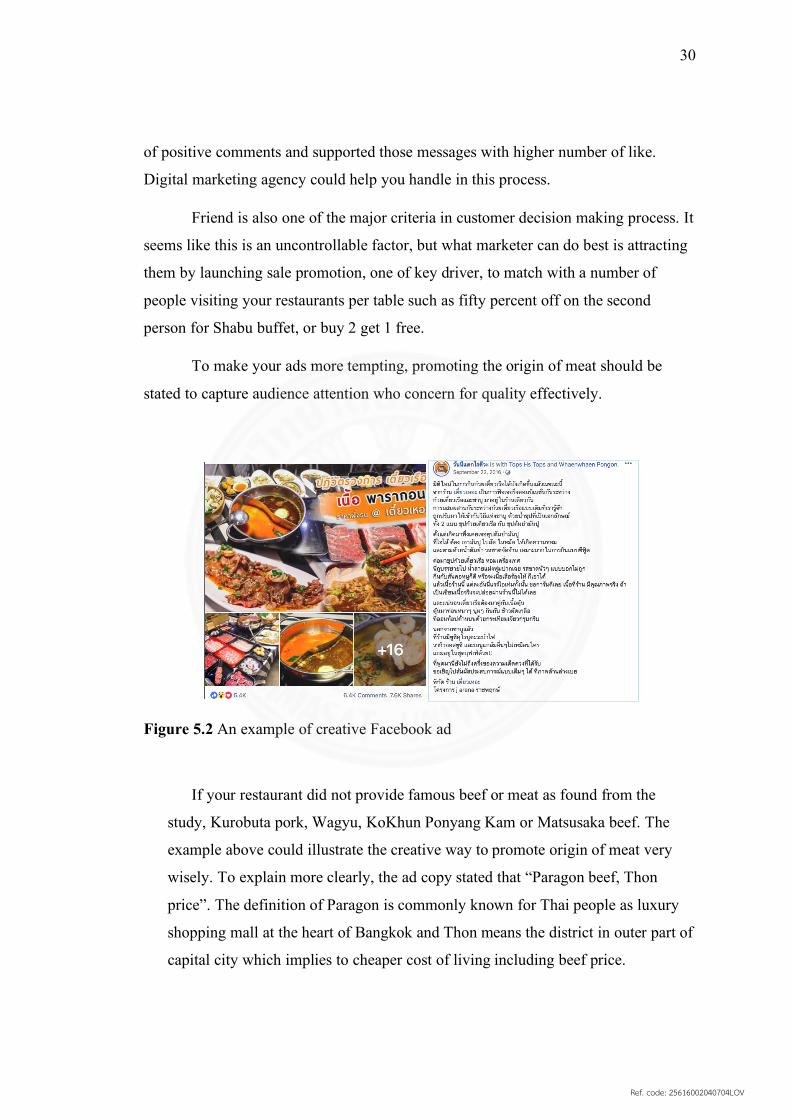
To make your ads more tempting, promoting the origin of meat should be
stated to capture audience attention who concern for quality effectively.
Figure 5.2 An example of creative Facebook ad
If your restaurant did not provide famous beef or meat as found from the
study, Kurobuta pork, Wagyu, KoKhun Ponyang Kam or Matsusaka beef. The
example above could illustrate the creative way to promote origin of meat very
wisely. To explain more clearly, the ad copy stated that “Paragon beef, Thon
price”. The definition of Paragon is commonly known for Thai people as luxury
shopping mall at the heart of Bangkok and Thon means the district in outer part of
capital city which implies to cheaper cost of living including beef price.
Ref. code: 25616002040704LOV
31
REFERENCES
ศูนยว์ิจยักสิกรไทย. (2018, September 9). Thansettakij. Retrieved from
http://www.thansettakij.com/content/266747
(2017, July). Retrieved from Food Intelligence Center Thailand:
http://fic.nfi.or.th/MarketOverviewDomesticDetail.php?id=150
al, L. e. (2011). Retrieved from
https://www.ukessays.com/essays/marketing/consumer-decision-making-
process-marketing-essay.php
Al-Tarawneh, D. H. (2012). The Main Factors beyond Decision Making . Journal of
Management Research .
bangkokbiznews. (2018, March 11). Retrieved from bangkokbiznews:
http://www.bangkokbiznews.com/blog/detail/644162
Forbes. (2017, Sep 14). Retrieved from Forbes:
https://www.forbes.com/sites/forbesagencycouncil/2017/09/14/successful-
digital-marketing-for-restaurants/#59a60b291329
Janmes. (2016, july 2). Marketeer. Retrieved from Marketeers: www.google.com
Kesonkajontip, J. (2016). Impact of Social Media on Buying Decision Making
Process. Bangkok: Krung Thep.
Kotler, P. (2018). Marketing Management, Global Edition. Pearson Education
Limited.
Blackwell, R. D., Miniard, P. W. & Engel, J. F. (2006). Consumer Behavior
Rose. (2001). Retrieved from http://www.yorku.ca/mlc/4318/projects/content.html
Vincent J. Duriau, R. K. (2007). A Content Analysis of the Content Analysis
Literature in Organization Studies: Research Themes, Data Sources, and
Methodological Refinements. Retrieved from
https://journals.sagepub.com/doi/abs/10.1177/1094428106289252?journalCod
e=orma
Wongnai. (2019). Retrieved from https://www.wongnai.com/business-
owners/thailand-restaurant-trend-2018
Ref. code: 25616002040704LOV
32
APPENDIX
TOPIC GUIDE DESIGNED In-depth Interviews
Screening Questions
Have you ever visited restaurants because of Facebook advertising?
How old are you?
Questions
1. What are factors that you have considered before making decision to visit restaurant
or keep it in your choice set based on Facebook advertising?
2. What are Facebook marketing activities that positively effect to your eyes
3. What types of restaurants do you like?
4. What are restaurants that you have visited due to their Facebook advertising?
5. What are factors (trigger point) that make you decide to visit those restaurants?
6. What are the content of Facebook advertising that have attracted you before?
7. What is your acceptable price range?
8. How does location affect to your decision making when deciding to eat out?
Personal Questions
1. Gender
2. Age
3. Education background
4. Marital status
5. Income
6. Occupation
Ref. code: 25616002040704LOV

33
BIOGRAPHY
Name Ms.Supapitch Poothong
Date of Birth November 26, 1992
Educational Attainment
3011: Bachelor of Business Administration
Work Position OWNER
SUGARBIRD GROUP LTD., PART.
Ref. code: 25616002040704LOV