Embed Size (px)
Citation preview

University of Nebraska - Lincoln University of Nebraska - Lincoln
DigitalCommons@University of Nebraska - Lincoln DigitalCommons@University of Nebraska - Lincoln
Student Research, Creative Activity, and Performance - School of Music Music, School of
6-2011
A Study of K-12 Music Educators' Attitudes Toward Technology-A Study of K-12 Music Educators' Attitudes Toward Technology-
assisted Assessment Tools assisted Assessment Tools
Lance D. Nielsen University of Nebraska-Lincoln, [email protected]
Follow this and additional works at: https://digitalcommons.unl.edu/musicstudent
Part of the Educational Assessment, Evaluation, and Research Commons, Music Commons, and the
Teacher Education and Professional Development Commons
Nielsen, Lance D., "A Study of K-12 Music Educators' Attitudes Toward Technology-assisted Assessment Tools" (2011). Student Research, Creative Activity, and Performance - School of Music. 43. https://digitalcommons.unl.edu/musicstudent/43
This Article is brought to you for free and open access by the Music, School of at DigitalCommons@University of Nebraska - Lincoln. It has been accepted for inclusion in Student Research, Creative Activity, and Performance - School of Music by an authorized administrator of DigitalCommons@University of Nebraska - Lincoln.

A STUDY OF K‐12 MUSIC EDUCATORS' ATTITUDES TOWARD
TECHNOLOGY‐ASSISTED ASSESSMENT TOOLS
By
Lance D. Nielsen
A DISSERTATION
Presented to the Faculty of
The Graduate College at the University of Nebraska
In Partial Fulfillment of Requirements
For the Degree of Doctor of Philosophy
Major: Music
Under the Supervision of Professors Brian Moore and Glenn Nierman
Lincoln, Nebraska
June, 2011

A STUDY OF K‐12 MUSIC EDUCATORS' ATTITUDES TOWARD
TECHNOLOGY‐ASSISTED ASSESSMENT TOOLS
Lance D. Nielsen, Ph.D.
University of Nebraska, 2011
Advisers: Brian Moore and Glenn Nierman
The purpose of this study was to examine K‐12 music educators’ attitudes
regarding the use of technology in the assessment of music learning. There is a
considerable range of musical behaviors with different levels of complexity that can
be assessed (Boyle & Radocy, 1987). A variety of software and web‐based
assessment tools are available for music educators. However, it is unclear how many
teachers are taking advantage of incorporating these technological assessment tools
into their instructional practice. This study provided current data about the
demographics of teachers using technology to assess musical growth and the
variables that might motivate a music teacher to use technology‐assisted
assessment tools. A researcher‐designed survey was administered to a stratified,
random sample of K‐12 music educators. A sample of 2,211 music educators,
provided by MENC: The National Association of Music Education, was surveyed. The
survey questions determined the number of teachers using technology‐assisted
assessment tools and the types of assessment tools they use. The mean score from a
series of belief statements suggested teachers' attitudes towards assessment
practices and technology was positive. However, it was discovered that specific
school and teacher factors had a generally small influence on their perceptions of
technology‐assisted assessment tools. It was evident that music teachers are

utilizing technology for daily instruction more often than to assist with assessment
strategies. The factors of time and resources are two important variables that affect
teachers' decisions regarding the use of technology for assessment in music settings,
and future studies are needed to investigate effective professional development
opportunities in training teachers to incorporate technology‐assisted assessment
tools with music instruction.
ACKNOWLEDGEMENTS
I wish to express my sincere gratitude to the following people who have
encouraged, mentored, and assisted me on this professional and academic endeavor.
First of all, I want to thank my family for their years of support in my musical and
teaching career and continuing education. My parents have been the foundation of
my spirit in all that I have accomplished in my life; they taught me the importance of
hard work and commitment.
I want to thank my close friends and colleagues, many of whom, are part of
my extended family. Their heartfelt support and encouragement towards the
completion of this dissertation has been an important part of my success. I
especially want to thank a dear friend and music colleague, Becky Wilhelm, for her
many hours of reading and editing this dissertation.
I want to thank my fellow colleagues in the doctoral program, Phil
Hesterman, Susan Cogdill, Matt Herrick, and Ted Hoffman. Having the opportunity
to collaborate and share ideas and experiences with my fellow doctoral classmates
made this endeavor so much more meaningful.
I also wish to convey my appreciation to all of the professors at the
University of Nebraska–Lincoln who had a great influence on my educational career,
notably the members of my doctoral committee; Dr. David Fowler, Dr. Brian Moore,
Dr. Glenn Nierman, and Dr. Robert Woody. I wish to express a special thanks to Dean
Giocomo (Jack) Oliva, who served on my committee in the early stages of my
doctoral work prior to a career move to New York City. Specifically, I want to
express my sincere appreciation to two wonderful people, Dr. Brian Moore and Dr.
Glenn Nierman. It is because of their thoughtful teaching, motivation, and
inspiration that I have arrived to this apogee of my intellectual journey.
DEDICATION
One member of my doctoral committee, Dr. John Lammel, unfortunately
passed away before the completion of my dissertation. Dr. Lammel, a Senior
Lecturer in Educational Administration, was a model educator and educational
leader in the State of Nebraska. His thoughtful and dedicated leadership style
coupled with his true love for the educational process was an inspiration. I enjoyed
our many one‐on‐one conversations about the present and future trends of public
education. He was extremely interested and hopeful of the ever‐changing role of
instructional technology on student learning.
This dissertation is dedicated to the memory of Dr. John Lammel.

vii
TABLE OF CONTENTS
LIST OF FIGURES xi
LIST OF TABLES xii
CHAPTER 1: INTRODUCTION TO THE STUDY 1
Statement of the Problem 1
Purpose of the Study 8
Research Questions 8
Definitions of Terms 9
Theory 10
School Factors 13
Teacher Factors 14
Basic Assumptions 15
Delimitations of Study 16
Methodology 17
Description of the Population 17
Personnel and Facilities 18
Materials and Equipment 18
Procedures 19
Design of the Study 20
Data Analysis 21
Significance of the Study 23

viii
CHAPTER 2: REVIEW OF THE LITERATURE 25
Overview 25
Assessment Theories and Practice in Arts Education 25
Trends in Music Technology 33
Technology‐assisted Music Assessment 35
Attitude Studies in Music Education 38
Influence of Demographics on Technology Use 41
Teacher Professional Development 42
Summary 45
CHAPTER 3: METHODOLOGY 47
Introduction 47
Subjects 48
Description of the Population 48
Development of the Survey Instrument 50
Stage One: Table of Specifications 51
Stage Two: Instrument Design 51
Stage Three: Instrument Assessment 54
Procedure 55
Data Analysis 56
Part One: Descriptive Data 56
Part Two: Inferential Data 57
Summary 59

ix
CHAPTER 4: PRESENTATION AND ANALYSIS OF THE DATA 60
Introduction 60
Demographic Analysis 61
Data Analysis 63
Research Question 1 63
Research Question 2 67
Research Question 3 73
Research Question 4 79
Additional Analysis 83
Summary 85
CHAPTER 5: SUMMARY, DISCUSSION, AND RECOMMENDATIONS 88
Summary 88
The Purpose 89
Review of the Literature 89
Procedure 94
Design and Results of the Study 96
Discussion 104
Implications for Music Education 109
Suggestions for Future Study 112
REFERENCES 114
APPENDICES 131
Appendix A: I.R.B. Approval Letter 131

x
Appendix B: Panel of Experts Survey Rating Form 132
Appendix C: Cover Letter 133
Appendix D: Follow‐up Email 134
Appendix E: Survey Instrument 135

xi
LIST OF FIGURES
Figure 1: Underlying User Acceptance Model 11
Figure 2: Technology Acceptance Model for Mobile Services 12
Figure 3: Theoretical Model for this Study 13
Figure 4: Mode of Instruction 29
Figure 5: Histogram of Normal Distribution of PMAT 68
Figure 6: Differences of Mean PMAT Score by Gender Compared
to Years of Teaching 82
Figure 7: Theoretical Model for this Study 93

xii
LIST OF TABLES
Table 1: Demographic Characteristics of Participants 61
Table 2: Demographic Classification of Primary Teaching Area 63
Table 3: Distribution of Participants' Use of Technology 64
Table 4: Distribution of Types of Assessment Tools Most Commonly Used by
Music Teachers 66
Table 5: Normal Distribution of PMAT (Perception of Music Assessment
and Technology) 67
Table 6: Descriptive Statistics Comparing Mean PMAT Score to Amount of Use for
Technology of Instruction and Assessment 69
Table 7: ANOVA Results of PMAT Score by Technology Use for Instruction 70
Table 8: ANOVA Results of PMAT Score by Technology Use for Assessment
of Performance Skills 71
Table 9: ANOVA Results of PMAT Score by Technology Use for Assessment of
Music Content Knowledge 72
Table 10: t‐test Comparison of PMAT Scores with Use of Technology
Assessment Tools 72
Table 11: Descriptive Statistics for Technology Professional Development
Participation 74

xiii
Table 12: ANOVA Results of PMAT Compared to School Mandated
Professional Development 75
Table 13: ANOVA Results of PMAT Compared to School Voluntary
Professional Development 76
Table 14: ANOVA Results of PMAT Compared to Personal Voluntary
Professional Development 76
Table 15: ANOVA Results of PMAT Compared to College Pre‐service
Teacher Training 77
Table 16: Factorial ANOVA (3 x 4) Results of School Setting and Grade Level 78
Table 17: Descriptive Statistics of Technology Professional Development
Participation by School Setting 78
Table 18: Frequency, Means, and Standard Deviations of Gender, Highest
Degree Earned, and Years of Teaching Experience Compared to PMAT 80
Table 19: Factorial ANOVA (2 x 3 x 4) Results of Gender, Degree, and
Years of Teaching 81
Table 20: Responses Concerning Time for Professional Development,
Instructional Time, and Resources 84
Table 21: One‐way ANOVA of Urban, Suburban, and Rural Schools to Technology
Resources Available 84

1
CHAPTER 1
INTRODUCTION TO THE STUDY
Statement of the Problem
In the national debate over school reform, the underlying theme has been
accountability for student learning. Therefore, educational leaders have refocused
their efforts in developing and promoting best practices of instructional strategies
and assessment approaches within their schools. Assessment is an indispensable
component of the learning process. The Elementary and Secondary Education Act
(ESEA) reauthorized in 2001 as part of the No Child Left Behind initiative, and the
current ESEA reauthorization proposal, A Blueprint for Reform, emphasize the
importance of holding teachers and schools accountable for student learning. Along
with this renewed emphasis on raising educational standards, the holistic view of
21st century learning skills which promotes critical thinking and problem solving,
communication, collaboration, and creativity and innovation seems to be a driving
force in curricular planning (Partnership for 21st Century Skills, 2009).
Assessment of music learning has been a highly studied topic in music
education. Within the music education literature, numerous articles and research
studies have promoted assessment on music learning in the classroom (Colwell,
2002). In 1994, The National Standards for Music Education, as outlined in The
School Music Program, A New Vision (1994), were adopted. As a result, music
educators were provided a framework in which to develop a comprehensive music
curriculum with elaborate learning concepts that may be assessed (Shuler, 1996).
Since 1971, The National Assessment of Educational Progress (NAEP) has conducted

2
four arts assessments. The NAEP assessments provided data on the progress of
students' knowledge and skill based‐learning in the arts. This has been the only
national test that has tracked the progress of music instruction. Nevertheless, due to
the lack of funding and clarity of a consistent measurement tool, the data gathered
can only simply provide a snapshot of the status of arts education. Therefore,
individual state and local school districts have developed their own arts standards
and benchmark assessment protocols.
In the current educational climate, data‐driven decisions about best practices
in teaching strategies and assessment of learning have become the major focus for
all content areas, including school music programs. Curriculum specialists are
implementing research‐based strategies in order to improve student success in
schools regardless of demographical descriptors of race, gender, or socio‐economic
status. Some scholars argue that this focus on assessment is not because there is a
true interest in the assessment of students, but is caused by the state testing
movement and accountability initiatives (Hoffer, 2008). Assessment outcomes are
not always concerned with individual student growth but are more focused on the
overall effectiveness of a program or school. Asmus (1999) suggested, “While the
ultimate purpose of assessment is ensuring the most effective instruction possible
to enhance student learning in music, assessment can also be used to determine the
effectiveness of the teacher and the instructional program” (p. 22). Other advocates
for music assessment have emphasized that proper assessment may provide
evidence of musical growth, identify talented students, validate music programs and
teacher effectiveness, motivate students to learn, and provide evidence of

3
accountability (Boyle, 1992; Brophy, 2000).
A crucial reason assessment is needed in the learning process of music is that
students need feedback to develop a sense of their own learning (Abels, 2010). Two
methods of assessment, informal and formal, are needed in the overall evaluation of
a student's musical growth. The informal method, referred to as formative
assessment, provides immediate feedback to students and teachers during the
course of instruction. Summative assessments are the formal benchmarks that are
measured at the completion of a period of instruction whether it is the end of a unit
of study or the end of a grading period. Stiggins (2007) described the objective
measure of student achievement as assessments of learning, and the process‐
oriented measurement that promotes student engagement in their own learning and
self‐reflection as assessments for learning. A balance between the two types of
assessments is important, however, assessments for learning tend to be absent in
most curricula.
The use of technology for instruction and assessment has also caused a
debate among educational scholars. In his book Oversold and Underused (2001),
Larry Cuban contends that after all the time and money spent on technological
equipment and software, there has been little evidence of academic achievement
and transformations in teaching and learning techniques. His view, although being
somewhat outdated and cynical of instructional technologies, has spearheaded
important conversations on how to infuse technology into effective instruction.
Becker (2000) argued that when constructivist‐oriented teachers have the
necessary resources and have a reasonable level of experience and skill in using

4
computers, computers have proven to be a valuable and well‐functioning
instructional tool.
Standards and guidelines for the integration of instructional technology into
classroom practice have been created by local school districts, accrediting and
professional organizations such as the National Council of Accreditation of Teacher
Education (NCATE, 2000) and the International Society for Technology in Education
(ISTE, 2008). One of the most widely used research‐based books for school
improvement by public school administrators has been Classroom Instruction That
Works: Researchbased Strategies for Increasing Student Achievement (Marzano,
Pickering, & Pollock, 2001). This staff development approach was based on a meta‐
analysis on effective instructional practices conducted by the Mid‐continent
Research for Education and Learning (McREL). Since that original book, a new
technology resource guide has been published which describes how technology can
support the nine instructional strategies, as defined by Marzano and Kendall (2007).
Within the body of research, it has been determined that the use of technology in the
classroom has a positive influence on student learning when the learning goals are
clearly articulated prior to the use of technology (Ringstaff & Kelly, 2002; Schacter,
1999). Russell and Sorge (1999) cited increased positive student attitude towards
school, enhanced inquiry, and the promotion of problem solving skills as important
outcomes of integrating technology with learning.
Technology can also transform music teaching and learning. Two recent
literature reviews on computer‐based research were conducted in an attempt to
summarize the development of technology in music education (Webster, 2002;

5
Webster, 2007). Recent studies on the use of technology in music teaching have
described trends in music educators' use of technology (Bauer, Reese, & McAllister,
2003; Reese & Rimington, 2000; Taylor & Deal, 2000). Although this research has
been valuable, it is difficult to maintain current research data on technology‐
assisted teaching practices due to the constant changes and updates in technology.
Numerous computer‐aided tools may be used for assessing students’ musical
knowledge and performance skills. Rudolph (2004) divided music computer‐aided
instruction (CAI) into three categories of tool, tutor, and tutee. This framework
provides a foundation of how technology can fit into a typical educational
framework of teacher, learner, and curriculum. The tool software category includes
any program that assists in the creation of music. Notation software such as Finale
and Sibelius are two examples of tools that may assist teachers in the development
of instructional and assessment activities. The tutor category includes CAI software
that assists educators and students in the learning and assessment of music skills
and knowledge. SmartMusic—interactive music software that allows students to
practice and be assessed on music exercises—is an example of a tutor program. This
software not only records a student's performance of a musical selection, but also
provides immediate feedback of their musical progress. This immediate feedback is
essential and has proven to help a music student be more engaged in his or her own
learning (Flanigan, 2008; Glenn, 2000; Lee, 2007). Interactive Pyware Assessment
Software (iPAS) is another assessment instrument that is used most commonly with
music method books such as the Standard of Excellence Enhanced Comprehensive
Band Method. The last category, tutee, refers to computer and web‐based programs
6
that allow individuals to create materials that other people can learn from. There
are a number of online rubrics and music rubric designs that are easy for music
teachers to adapt to their own classroom needs. Music theory and appreciation
websites can also expand the opportunities for authentic assessments. One
commonly used website, musictheory.net, provides online lessons, exercises, and
quizzes on music theory.
Colwell (2002) noted that computer use in assessment holds considerable
potential if the music educator is willing to devote the time and resources in
developing assessment strategies that connect instruction, learning, and testing. The
use of technology can be helpful to the teacher if the assessment tool meets the goal
of authentic assessment. Although, the current research literature does not contain
much data on the use of technology‐assisted tools for the purpose of assessing music
learning. One of the hurdles in the integration of technology with music education is
the need for professional development. Teachers are not always afforded the
professional time to learn new technologies let alone learn how to incorporate them
into already established lesson plans. Two recent studies (Reese & Rimington, 2000;
Taylor & Deal, 2000) found that most music educators are using technology in
school more for administrative tasks rather than classroom instruction. They also
discovered that 94% of music educators studied had a significant desire to learn
more about technology. Contrastingly, only 25% of the teachers indicated that they
were afforded technology training in their college music education program. Only
13% of school districts reported providing more than one technology professional
development opportunity per school year.

7
Attitudes towards assessment and technology have found to be influenced by
a number of teacher demographics. The Fishbein and Ajzen (1975) framework
about attitude and behavior was rooted in the concept that attitudes are based on
established beliefs and that beliefs are formulated by the experiences and
knowledge of the individual. This framework has guided past research on
individuals' reactions, intentions, and actual implementation of a new concept,
whether that be a technology‐based tool, new procedure, or instructional and
assessment strategy.
A teacher's demographics in regard to educational background, work
experience, and technology training will influence assessment integration into
classroom instruction and student learning (McCoy, 1991; Russell & Austin, 2010;
Simanton, 2000). Past research studies regarding gender differences in attitudes
towards music and technology indicated that females have more positive attitudes
towards music and males are more likely to use technology (Comber, Hargreaves, &
Colley, 1993; Folkestad, 2007). Comber, Hargreaves, & Colley (1993) discovered
that through experience of working with computers and music technology, students
of both genders understand the potential of technology in music, therefore,
changing their attitudes towards music technology. Gender differences in the
perceptions of technology have narrowed in recent years (Nicolino, Fitzgerald,
Maser, & Morote, 2006). Nevertheless, Folkestad (2007) stated that even though
very few studies have continued to look at gender issues with regard to music and
technology, it is still an important core variable to consider in future research.

8
Technology is the norm for most students in today’s classrooms. The
students’ methods for learning are different from the methods their teachers may
have used when they were students. Therefore, music educators must learn how to
infuse technology into music instruction and assessment strategies. Educational
leaders of both in‐service and pre‐service professional development courses must
be willing to support this change with the appropriate resources and teacher
training sessions. The goal of this research was to bridge the gap between two
bodies of current research literature: research on attitudes regarding assessment
and research on attitudes concerning music technology.
Purpose of the Study
The purpose of this study was to examine K‐12 music educators’ attitudes
regarding the use of technology in the assessment of music learning.
Research Questions
The following specific questions were addressed in this study:
1. How many music educators are using technology‐assisted assessment tools, and
what types of assessment tools are being utilized?
2. Is the attitude of music educators generally positive or negative toward using
technology in the assessment process?
3. How do school setting factors influence music educator's attitudes regarding the
use of technology in the assessment of music learning? This question was divided
into two parts:
3a. Do certain types of professional development experiences influence
music educators’ attitudes towards using technology‐assisted assessment

9
tools?
3b. Do school setting and primary level of teaching assignment influence
music educators’ attitudes towards using technology‐assisted assessment
tools?
4. To what extent do music educator demographic factors of gender, level of
educational degree, and years of music teaching experience influence music
educators' attitudes about technology‐assisted assessment tools?
Definition of Terms
Assessment: According to Colwell (1992), assessment refers to a considerable
body of data that has the potential to diagnose and provide clues to causes. The
terms measurement and testing can be used interchangeably as the smallest unit in
assessment. Tests are the method of gathering objective data and measurement
involves the quantification of the test data (Boyle & Radocy, 1987). Evaluation is a
broader term defined as judgments based on the data collected from a measurement
or test.
Attitude: An attitude is a hypothetical construct that represents an
individual's degree of like or dislike for an item, idea, or concept. Cutietta (1992)
described attitude as “a firmly held mental network of beliefs, feelings, and values
that is organized through an individual's experiences, and that exerts a directive
and dynamic influence on the individual's perception and response to all objects and
situations with which it is related” (p. 296).
TechnologyAssisted Assessment Tools: For this study, technologyassisted
assessment tools included hardware, software, and web‐based

10
programs/applications that enable a teacher to collect data on students' music
knowledge and musical skill development.
Professional Development: Educators' professional development may take on
various meanings. With regard to technology skills, Grant (1996) provided the
following definition:
Professional development ... goes beyond the term ‘training’ with its
implications of learning skills, and encompasses a definition that includes
formal and informal means of helping teachers not only learn new skills but
also develop new insights into pedagogy and their own practice, and explore
new or advanced understandings of content and resources. [This] definition
of professional development includes support for teachers as they encounter
the challenges that come with putting into practice their evolving
understandings about the use of technology to support inquiry‐based
learning. (p. 72)
Theory
The theoretical model for this study was based on the conceptual framework
regarding attitudes and behavior developed by Fishbein and Ajzen (1975). This
framework was rooted in the concept that attitudes are based on established beliefs
and that beliefs are formulated by the experiences and knowledge of the individual.
The Fishbein and Ajzen model has been utilized in other inquiries in music
education that have focused on attitude as a variable (Hanzlik, 2001; von Kampen,
2003).
11
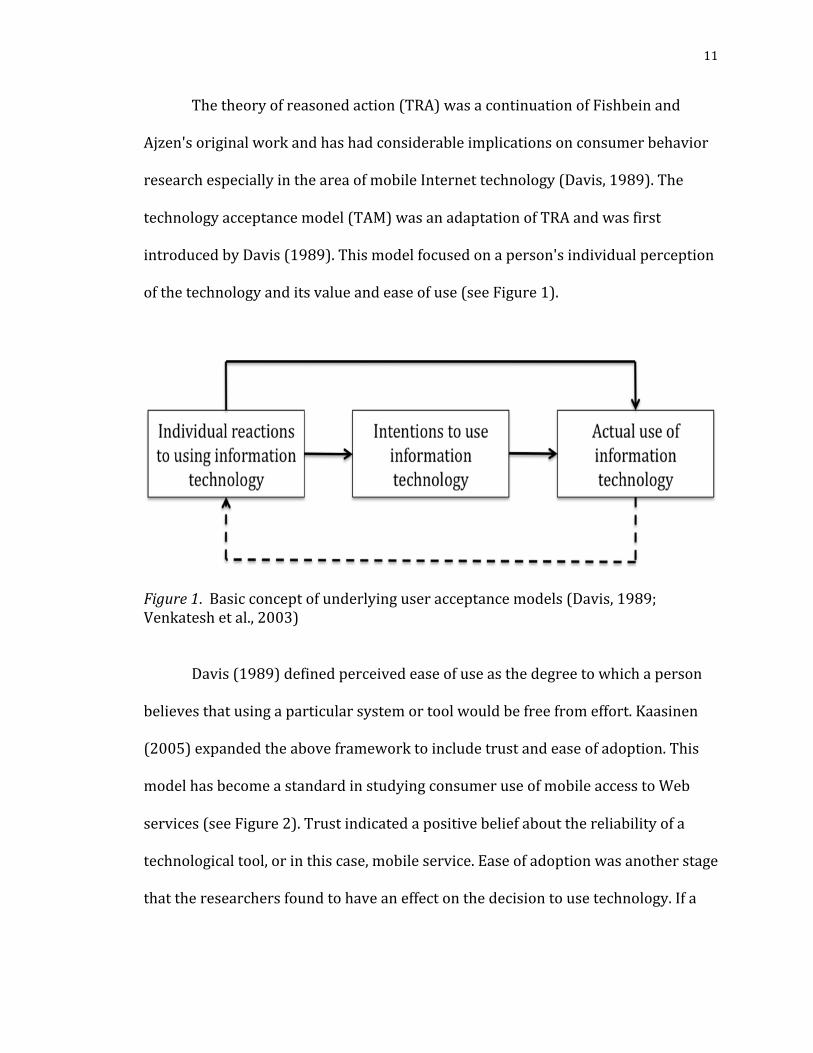
The theory of reasoned action (TRA) was a continuation of Fishbein and
Ajzen's original work and has had considerable implications on consumer behavior
research especially in the area of mobile Internet technology (Davis, 1989). The
technology acceptance model (TAM) was an adaptation of TRA and was first
introduced by Davis (1989). This model focused on a person's individual perception
of the technology and its value and ease of use (see Figure 1).
Figure 1. Basic concept of underlying user acceptance models (Davis, 1989; Venkatesh et al., 2003)
Davis (1989) defined perceived ease of use as the degree to which a person
believes that using a particular system or tool would be free from effort. Kaasinen
(2005) expanded the above framework to include trust and ease of adoption. This
model has become a standard in studying consumer use of mobile access to Web
services (see Figure 2). Trust indicated a positive belief about the reliability of a
technological tool, or in this case, mobile service. Ease of adoption was another stage
that the researchers found to have an effect on the decision to use technology. If a

12
user was unaware of services or unable to anticipate problems with a mobile
service, the motivation to continue was lower.
Figure 2. Technology Acceptance Model for Mobile Services (TAMM) (Kaasinen, 2005)
A parallel statement can be made about the teacher's decision to use
technology‐assisted assessment tools in his or her classroom. A teacher’s perceived
ease of use and perceived value is factored into the decision‐making process when
determining to use an assessment tool. A teacher must also trust that the
assessment tool will do what it is intended to do. By combining the Fishbein and
Ajzen model of attitudes and beliefs to TAM as used in technology consumer
research, a theoretical framework for this study was formulated (see Figure 3).
The factors that may influence teachers' use of technology can be divided
into two categories: (1) school demographic factors, and (2) teacher demographic
factors. The school demographics are comprised of the following variables: (1) time
including both class instructional time and professional development time with

13
regard to learning and developing assessments using technology, (2) technology
resources, (3) school setting including size and location, and (4) professional
development opportunities. Teacher demographics include the following variables:
(1) primary teaching area, (2) gender, (3) years of teaching experience, and (4) level
of education. The comfort level in learning and using technology is resembled in this
model as the perceived ease of use.
Figure 3. Theoretical model: Factors influencing the decision to use Technology‐Assisted Assessment Tools. School Factors
In previous research studies, certain school factors have been identified that
influence the use of assessment strategies and technology. The size of school and
school location has had an impact on the focus on assessment and the types of

14
technology available to teachers (Hanzlik, 2001; McCoy, 1991; Simanton, 2000).
Time has been shown to affect a teacher’s decision to incorporate assessment
strategies into instruction (Kotora, 2005; Nightingale‐Abel, 1994; Tracy, 2002).
Time has also been an issue in learning and integrating technology into already
established teaching and assessment strategies.
There is evidence of a continued need for training and support in the music
profession regarding assessment strategies (Shuler, 1996; Brookhart, 2001;
McMunn, Schenck, & McColskey, 2003; Mertler, 2004). In order to keep current
with the constant evolution of technological tools and practices, professional
development opportunities need to improve and occur more often (Bauer et al.,
2003; Cain, 2004; Cuban, 2001). Assey (1999) asserted that arts educators must
first learn how to use the hardware and software followed by training on how to
develop lesson plans that integrate the new technology. Besides training and
support, the availability of technological resources in schools has had an obvious
impact on teachers' use of technology (Bauer, et al, 2003).
Teacher Factors
Teacher demographics of experience and training are shown to have an
influence on the use of assessment strategies (McCoy, 1991; Simanton, 2000).
Assessment and grading practices are influenced by teaching level and
specialization (McCoy, 1991; Russell & Austin, 2010). According to the Bauer, Reese,
and McCallister (2003) study on technology professional development, the factors
of years of experience, academic degrees, and areas of music teaching were found to
be fairly neutral with some slight differences in the gender variable. The authors

15
explained that the differences in gender might be related to self‐efficacy (Bauer,
2003) and familiarity (Fung, 2003) with technology. The statistical gap of females
and males in the comfort level has narrowed in the last decade (Nicolino, Fitzgerald,
Maser, & Morote, 2006). As conveyed in the statement of the problem, Folkestad
(2007) promoted the inclusion of gender issues with regard to music and
technology in future research for the continuation of tracking any future
fluctuations in this trend.
Teachers' comfort level with using technology has had an impact on whether
they are willing to incorporate it. Comfort levels in conjunction with technology
professional development were found to be a major component of a successful
teacher in‐service (Schrum, 2001). However, in the study conducted by Bauer et al.
(2003), teachers' high comfort level and knowledge after a ten‐month period
following a technology in‐service had no long‐term impact on teacher usage of
technology in the classroom. Due to the contradiction of the effectiveness of
technology professional development opportunities, this researcher included this
aspect as a variable in this study.
Basic Assumptions
In studying how music educators' attitudes and demographics influence their
use of technology‐assisted assessment tools, the following assumptions were made:
1) It was assumed that teacher attitudes might be measured. An attitude is
representative of an individual's degree of like or dislike towards an item or
thought. According to Fishbein and Ajzen (1975), beliefs, attitudes, and

16
intentions can be empirically distinguished and that reliable and valid
techniques for measuring these concepts are available.
2) It was assumed that a teacher's decision to use any type of technology tool,
whether for instructional or assessment purposes, reflects the TAM
consumer framework as designed by Davis (1989) and Kaasinen (2005). As
with consumers of technology, teachers will progress through a series of
stages that reflect their comfort level in learning and using new technology.
3) It was assumed that teachers who do not place a high value on the
assessment process were not interested in learning how to use technology‐
assisted assessment tools. Teachers who do not have a clear understanding
of the reasons for assessment will find little value in learning a variety of
technology‐assisted assessment tools.
Delimitations of Study
The participants selected for this study were members of MENC, the National
Association for Music Education, that teach K‐12 general music, vocal, and
instrumental music. This random sampling provided a representation of current
trends across the country; however, it was unknown to the researcher if every state
was included in the sample.
There are a number of variables that can influence a music teacher's
perceptions and attitudes about using technology‐assisted assessment strategies.
For the purpose of this study, teacher demographic factors were delimited to
gender, years of teaching experience, level of education, and primary grade level the
teacher was teaching. The primary teaching assignment including choir, band,
17
strings, and general music was only reported as a descriptor of the participants due
to the large number of teachers that teach multiple assignments. The school factors
that were considered are school setting, technology resources, and professional
development opportunities. Professional development was divided into two specific
types, pre‐service and in‐service training. Music teachers that indicated on the
survey that they were not current K‐12 music teachers were eliminated from the
study.
Methodology
This section briefly describes the methods and procedures that were used in
the design of the study and are organized as follows: (1) subjects, (2) personnel and
facilities, (3) materials and equipment, (4) procedure, and (5) design of the study.
Description of the Population
The subjects for this study included 2,211 music educators that are MENC
members. MENC: The National Association of Music Education provided the
researcher with a stratified, random sampling of K‐12, elementary, middle level, and
high school teachers that teach general music, vocal music, or instrumental music
classes. The sample was created by selecting random emails from categories of
primary grade level taught and music area of interest as selected by teachers on
their MENC membership application.
Demographic information collected about the teacher participants included a
description of music content areas they taught: elementary general music, choir,
band, and strings. Participants were asked to indicate additional teaching areas such
as guitar and music appreciation classes on a free‐response question. Grade levels

18
were classified into four categories: elementary, middle level, high school, and a
combination for teachers that teach multiple grade levels such as K‐8 or K‐12.
School setting included urban, suburban, and rural. Personal teacher demographical
information included gender, number of years of teaching experience, and highest
professional degree earned.
Personnel and Facilities
Personnel for this study included the MENC staff in formulating the random
sampling and the music teacher participants. Each participating music teacher used
the Internet to complete the online survey on either a school or personal computer.
In the design stages of the survey, the researcher utilized a sampling of music
teachers from one large Midwest school district in order to establish reliability and
validity of the survey instrument. The researcher also enlisted the assistance of the
staff of the Nebraska Evaluation and Research (NEAR) Center at the University of
Nebraska–Lincoln for data analysis.
Materials and Equipment
The researcher purchased a monthly subscription to SurveyMonkey, online
survey software, which was used as the instrument tool for this study. This survey
service provided unlimited questions, a quick and simple data collection, and secure
data storage of the survey responses. The researcher also utilized the Statistical
Package for the Social Sciences (SPSS) Version 18 during the data analysis process.
The researcher designed a survey including questions divided into six categories:
(1) research study consent, (2) use of instructional technology in music, (3) use of
technology‐assisted assessment tools, (4) professional development, (5) teacher

19
perceptions on music assessment and technology (PMAT), and (6) demographics.
The survey questions were formulated based on current research and the
theoretical model for this study.
A table of specifications was created in order to guide the researcher in the
development of the survey instrument. Five constructs (factors) that were used
included: (1) technology ease of use, (2) beliefs about assessment, (3) beliefs about
technology, (4) familiarity, and (5) endorsement by the experts. A pilot survey was
conducted with music teachers from an area school district in order to test the
reliability and face validity of the survey questions. Thirty‐eight music teachers
participated in the initial pilot study. The teachers were asked to provide feedback
at the conclusion of the study about survey content, clarity of instructions, and
survey format to help establish face validity. The comments were positive with a
few suggestions for rewording and restructuring certain questions especially on the
teacher perception section of the survey. The researcher revised the survey based
on the pilot study feedback and submitted the final version to a six‐person panel for
review of content validity. The panel included two university professors, two
doctoral students, and two music education colleagues. A final pilot run of the
survey was conducted to another group of music educators in order to establish an
estimated reliability coefficient of the instrument.
Procedures
The procedures necessary to conduct this investigation began with the
creation of an instrument tool. An online survey was developed and piloted by the
researcher. A survey approach is a frequently used research method designed to use

20
data gathered from a group of people to describe relationships (Abeles & Conway,
2010). The attitude assessment portion of the survey included 22 belief statements
with questions stated in both the negative and positive context. Participants were
asked to indicate their feelings about each belief statement using a 5‐point Likert
scale ranging from Strongly Disagree to Strongly Agree. A mean score on the attitude
assessment section that was recorded higher than 3 was considered a positive
score.
After the researcher obtained campus Institutional Review Board approval
for this survey study, an email contact, which included the description and purpose
of the study as well as an invitation to participate, was initiated with each
participant. A web‐based survey was administered electronically to the participants.
The link to the survey was included in the initial contact. The survey took less than
fifteen minutes to complete. Two follow‐up emails were sent to participants at
seven and ten days after the initial email reminding the music teachers to complete
the survey by the assigned deadline.
Design of the Study
This study was classified as a non‐experimental, quantitative method and
was based on the theoretical model for this study. The study design was intended to
find whether or not select school and teacher factors have an influence on teachers'
attitudes towards the perceived value of new technologies and the intention to use
technology for the assessment of music learning.
The researcher designed the survey instrument, which was administered as a
one‐time test measurement. Two important measures of survey quality are

21
reliability and validity. Although a common method of determining reliability of a
test instrument is the test‐retest format, it is not recommended for attitude
measurement (Adams, 1982). The survey questions were modeled after other
assessment studies found in the literature in order to establish content validity. A
pilot study of the survey tool was conducted with a population of music educators
from a local school district with a response rate of n = 38. The pilot participants
were asked to provide feedback about the survey. This helped establish both the
reliability of the instrument and face validity of the survey instrument. The final
version of the survey was reviewed by a panel of music education experts, as
explained in the materials and equipment section, and a second pilot study was
implemented with a second group of music teachers (n = 21). Two questions were
eventually eliminated from the PMAT portion of the survey, which increased the
coefficient of reliability of the instrument to (α = .76).
Data Analysis
The data analysis for this study described the population of music teachers
that utilize technology‐assisted assessment tools in music instruction. For each of
the research questions, there were different data analysis procedures.
Research question 1: How many music educators are using technology‐
assisted assessment tools and what types of assessment tools are being utilized?
Simple descriptive statistics were used to report the number of music educators
using technology as a part of their assessment strategies, as well as to describe the
types of assessment tools the teachers were actually using in their music classroom.
Research question 2: Is the general attitude of music educators positive or

22
negative toward using technology for assessment? Descriptive statistics, t‐tests, and
a one‐way analysis of variance (ANOVA) were used to answer this baseline question.
Responses on a set of 22 belief statements about assessment and technology were
gathered using a Likert scale. Likert descriptors were assigned a 5‐point numerical
scale. A mean higher than 3.0 was chosen to be an indication of a positive attitude by
a teacher regarding the use of technology‐assisted assessment strategies.
The second section of this study examined inferential data of possible effects
on teachers' attitudes. A factorial design was utilized for data analysis. The
advantages to a factorial design are that multiple experiments can be conducted
simultaneously, extraneous variability can be controlled leading to lower
experimental error and increased power, and any interactions between the
independent variables can be determined.
Research question 3: How do school setting factors influence music
educator's attitudes regarding the use of technology in the assessment of music
learning? This question was divided into two parts:
3a. Do certain types of professional development experiences influence
music educators’ attitudes towards using technology‐assisted assessment
tools?
3b. Do school setting and primary level of teaching assignment influence
music educators’ attitudes towards using technology‐assisted assessment
tools?
Three factors were examined: (1) type of professional development experience, (2)
school setting, and (3) primary level of teaching assignment. The dependent variable

23
was attitude concerning usage of technology‐assisted music assessment tools. The
data was analyzed using descriptive statistics, a one‐way ANOVA for question 3a,
and a 3 x 4 factorial ANOVA for question 3b.
Research question 4: To what extent do music educator demographic
factors of gender, level of educational degree, and years of music teaching
experience influence music educators' attitudes about technology‐assisted
assessment tools? This question had three main subsets; (1) gender, (2) level of
educational degree, and (3) years of music teaching experience. A 2 x 3 x 4 factorial
ANOVA was used to analyze the overall interactions between all teacher and school
factors.
Significance of the Study
Technology is constantly being revised and improved. Educators receive new
and updated software and web resources at a quicker rate than a few years ago.
Furthermore, the emphasis on both formative and summative assessments in all
classes by school leaders has required educators to learn and implement various
assessment strategies. There are a variety of technology‐assisted assessment tools
available that music teachers may implement into their current assessment
practices. However, it is unclear how many teachers are taking advantage of
incorporating these technological assessment tools into their instructional practice.
This study provided insight on which music teachers are using technology
and the reasons teachers have chosen to use or not use technology‐assisted
assessment tools in music. Based on prior research, there are various school and
teacher factors that may influence a music teacher's intended use to the actual use of

24
technology. As the body of research literature on this subject is not of sufficient
breadth to draw definitive conclusions and because the quality and quantity of
technology‐assisted assessment tools is constantly changing, this research would
seem to be important in addressing these needs. This study will aid in the data‐
driven decision‐making required of music education teacher educators and school
administrators in their attempt to provide effective professional development and
training for pre‐service and in‐service music teachers in the use of technology‐
assisted assessments.

25
CHAPTER 2
REVIEW OF THE RELATED LITERATURE
Overview
This survey method study was designed to examine K‐12 music educators'
demographics and their attitudes towards using technology upon their decision to
utilize technology‐assisted assessment tools. In order to establish the parameters
for this study, a general search of the literature was conducted utilizing a variety of
databases, journals, websites, and bibliographic resources from such electronic
search engines as the EBSCO database, ERIC, JSTOR, and Google Scholar. There were
two overarching bodies of research literature that assisted in developing the current
study: assessment and music technology. Coupled with studies about attitude
formation which served as the dependent variable for this study, the literature
review is divided into six sections: (1) assessment theories and practice in
education and arts education, (2) trends in music technology, (3) technology‐
assisted music assessments, (4) attitude studies in music education, (5) influences
of teacher demographics on technology use, and (6) music teacher professional
development.
Assessment Theories and Practice in Education and Arts Education
The rationale for assessment is to determine how well students are learning.
Evidence of student learning will occur if instruction and assessment are integrally
related. There must be a direct connection between the curriculum and what the
student is expected to know (Colwell, 2002). According to Pellegrino, Chudowsky, &
Glaser (2001), there are three foundational elements that comprise the assessment

26
triangle: cognition, observation, and interpretation. In other words, students must
develop knowledge and competence in a subject area, educators must have ample
opportunities to observe students' performances in that area, and a method of
interpretation must exist that draws inferences about the students' performances.
In the current educational climate, data‐driven reflections and decisions about
best practices within all content areas are targeting massive school reform
initiatives both at the local and national levels. The Elementary and Secondary
Education Act of 1965 (Public Law 89‐10) was a pivotal piece of legislation in
reforming American education. The law recognized and supported the importance
of the arts, which received financial support through funds under Title I.
Throughout the years with subsequent reauthorizations of the law; the focus has
shifted to the importance of basic skills of reading and math. Even though the arts
were still included in the language as "academic core” subjects in the No Child Left
Behind Act (NCLB) of 2002, the political ramifications of requiring only reading and
math testing to determine academic success has caused the other subject areas to
take a back seat. If a state does not meet the NCLB requirements in reading and
math, they may lose funding for federal supported education programs.
The recent ESEA reauthorization proposal, The Race to the Top Initiative,
continues to mandate that educational systems show improvement of student
learning and teacher effectiveness in all schools. The ultimate goal is to improve
student learning for all students regardless of socio‐economic background, gender,
and race. These school reform ideas have had a direct impact on how we evaluate
the effectiveness of music education programs. The National Assessment of

27
Educational Progress (NAEP) arts assessment is a national assessment intended to
give a perspective on what students across America know or can do in the arts. Due
to budget concerns and the fact there were large gaps of time in between
assessments, the outcomes of the test have had little impact on arts education. State
standards and large‐scale assessments in the arts have also been developed to
evaluate the status of music at the local level. However, not all states have achieved
this goal. Two distinct trends have appeared for state‐level assessments: states that
have eliminated expensive performance measures for cheaper and easier
administrative formats and a blended effort that includes methods of state, district,
and classroom assessments in which to represent student achievement (Philip,
2001).
Some scholars argue this renewed focus on assessment is not because there is
a true interest in the assessment of students, but because of the state testing
movement and accountability initiatives (Hoffer, 2008). The focus on assessment is
not always centered on individual student growth, but more on the overall
effectiveness of a program or school. According to Asmus (1999), "while the
ultimate purpose of assessment is ensuring the most effective instruction possible
to enhance student learning in music, assessment can also be used to determine the
effectiveness of the teacher and the instructional program" (p. 22). Other music
assessment advocates emphasize that proper assessment may provide evidence of
musical growth, identify talented students, validate music programs and teacher
effectiveness, motivate students to learn, and provide evidence of accountability
(Boyle, 1992; Brophy, 2000). Cronbach, as stated in Colwell (1992), was not in favor

28
of the standards‐based model; he supported the formative approach to evaluation
over the summative approach in program evaluation. Colwell stated, "Cronbach's
stance is that philosophical and conceptual beliefs are more powerful than lists of
significant and non‐significant differences; thus theories can be more successful in
changing behaviors than lists of consequences for failure to change" (p. 1137).
Colwell also concluded that this way of thinking, unfortunately, does not hold any
clout within the political landscape of education. Equality for all participants
regardless of socio‐economic status, gender, and race when determining the
allocation of resources prevails over individual achievement.
The fundamental principal of learning theory is that assessment strategies
must provide students with immediate feedback in order for them to develop their
own sense of learning (Dilger & Roland, 1993; Abeles, 2010). Within the literature,
there are various assessment terms used to describe this process. Evaluation and
assessment are sometimes used interchangeably. According to Colwell (1992),
assessment refers to a considerable body of data that has the potential to diagnose
and provide clues or answers to causes and problems. The terms measurement and
testing are commonly used interchangeably as the smallest unit in assessment.
Nonetheless, there is a clear distinction between the two terms. Tests are simply the
method of gathering objective data and measurement involves the quantification of
the test data (Boyle & Radocy, 1987). Evaluation is a comprehensive term defined as
judgments based on the data collected from a measurement or test. Additional
assessment terms are used based on their purpose. An informal assessment method,
referred to as formative assessment, provides immediate feedback to students and

29
teachers during the course of instruction. Summative assessments are formal
benchmarks measured at the completion of a period of instruction whether it is at
the end of a unit of study or at the end of a grading period. What is sometimes
missing is a balance of assessment approaches that promotes learning during
instruction. Fautley (2007) defines assessment for learning as a way to review a
student's work, which will have a direct benefit on them in the future. Fautley
(2007) stated:
Assessment for learning in music is therefore concerned with improving and
developing the musical work which pupils present, be it composing,
performing, or listening, and arises in a natural way out of the work which is
done on a day‐to‐day basis in the classroom (pg. 1).
Rather than focusing on assessment at the end of the teaching and learning process
as shown at the top of Figure 4, assessment for learning should be woven into the
overall learning process.
Figure 4. Mode of Instruction, Linear Progression compared to Integration Model, Fautley, 2007.

30
Fautley (2007) summarized the 1999 Assessment Reform Group guiding principles
of assessment for learning as follows: (1) embedding a view of teaching and
learning together, (2) sharing learning goals with students, (3) assisting students in
knowing and recognizing the standards they are trying to achieve, (4) providing
opportunities for student self‐assessment, (5) providing feedback that will guide
students in the next steps in the learning process, (6) involving both teachers and
students in the review and analyses of assessment data, and (7) establishing the
concept that all students can improve.
Assessment issues in music are complex, but an essential part of the music
education field (Nierman, 1985; Boyle, 1992). Several of the empirical research
studies conducted on music assessment have utilized the survey approach. Studies
on assessment in elementary music (Barkley, 2006; Carter, 1986; Nightingale‐Abell,
1994; Tally, 2005) and secondary music (Hanzlik, 2001; Hill, 1999; Kancianic, 2006;
Kotora, 2005; McClung, 1996; McCoy, 1988; Russel & Austin, 2010; Sears, 2002;
Sherman, 2006; Simanton, 2000; Tracy, 2002) have characterized the usual trends
of music assessment approaches. Educator demographics of teaching experience
and training have shown to have an influence on the use of different assessment
strategies (McCoy, 1991; Simanton, 2000). Also, assessment and grading practices
are influenced by teaching level and specialization (Russell & Austin, 2010). Trends
indicate that assessment practices tend to focus on informal and subjective grading
standards including participation, effort, attendance, and attitude (Barkley, 2006;
Carter, 1986; McCoy, 1991; Nightingale‐Abell, 1994; Russel & Austin, 2010). Due to
the elective nature of music classes and the fact that music may be considered a co‐

31
curricular content area, music grades tend to be higher and subjective compared to
general education disciplines (Bridgham, 1973; Dietrich, 1973; Johnson, 2008). One
of the challenges facing music educators is the typically large size of classes,
especially in a performance‐based class. It is difficult for music educators to provide
immediate feedback to each student in a class of 25 or more students. Consequently,
performance‐based classes tend to grade on attendance, practice records, and other
non‐achievement standards whereas elementary and middle level teachers tend to
focus on knowledge‐based and achievement practices. On the other hand, the
general literature in music education suggests assessing achievement based on
extra‐musical skills should not be encouraged (Abeles, Hoffer, & Klotman, 1994;
Boyle & Radocy, 1987; Colwell, 2008; Lehman, 1999). The evaluation process
requires a specific decision making process. Boyle and Radocy (1987) explained
that, "evaluation decisions are better when they have a strong information base, that
is, a base including both subjective and objective information...an information base
without appropriate objective information is inadequate for most educational
decision making" (pg. 2).
The argument that the evaluation of visual and performing arts are
subjective in nature has perpetuated further discussions on music assessments.
Assessment in music education cannot rely simply upon the evaluation of
performance or cognitive knowledge of music; the significance of assessment
models in the promotion of aesthetic sensitivity is important as well (Creasy, 1997).
This subjective manner of grading that focuses on aesthetic elements leads to
another challenge for music educators; that of establishing reliability in the inherent
32
subjective nature of performance‐based assessments. Music as an art form requires
a sense of personal feeling and reflection that may be perceived differently from one
person to another. Unless the music teacher carefully incorporates a well‐designed
rubric or a consistent set of standards for each musical task, the reliability of the
testing practice may be vulnerable.
With the renewed focus on assessment and accountability, recent studies
have shown that there has been little progress in assessment strategies in music
(Russell & Austin, 2010; Johnson, 2008). Referring to the fundamental principle of
learning theory, specific and prompt feedback needs to be provided to engage
student motivation and learning. Unfortunately, teachers tend to teach and assess in
the way they were taught. Boyle and Radocy (1987) suggested, "with the increasing
concern for quality education in schools, there has been a growing need to identify
quality teachers" (p. 221). What constitutes a quality teacher is highly debated;
nonetheless, a deep understanding of content‐area knowledge and the willingness
to implement best practices of teaching are considerable characteristics.
Consequently, there is a real need for continued assessment training and support in
the music profession (Assey, 1999; Brookhart, 2001; McMunn, Schenck, &
McColskey, 2003; Mertler, 2004). Assessment training must occur both within the
pre‐service training stage provided by higher institutions of learning as well as in‐
service training by K‐12 school districts. The professional development needs of
new teachers compared to career teachers will be different based on their
experiences. As suggested by Conway (2006), continued research on the importance
of professional development opportunities at various points in their professional

33
“life‐cycle” is needed (pg. 8). Conway's suggestion is timely with regard to
professional training of instructional practices using technology.
Trends in Music Technology
Music educators are experiencing a time of increasing technological
advancements in instructional and assessment methods in music. Technology has
perpetuated new curriculum developments in music education. Over the last fifteen
years, a paradigm shift has occurred from the traditional drill‐and‐practice use of
music technology to a constructivist perspective (Duffy & Johassen, 1992; Jonassen,
Peck, & Wilson, 1999). Within the constructivist view, a student will learn and
understand the structure of music through experimenting and manipulating musical
sounds during the creative process of music. As teachers begin to incorporate new
technologies in music instruction, students will be able to create music, arrange and
edit music, and see the relationships between music and visual images (Cain, 2004).
With further advances in computer hardware and the growth of music software
especially in the field of digital audio arts, the landscape of music instruction will
continue to change (Williams & Webster, 2006). Kratus (2007) asserts that
technology has forever changed the experience of music. Digital mp3 players have
allowed music to be portable, more accessible, individualistic, and musical
communities are now formed by musical interest rather than physical proximity.
The rapid development of portable mobile devices and Smartphone technologies are
currently impacting education at all levels (Johnson, Levine, Smith, & Stone, 2010).
This revolutionary technology is having an impact on the musical experience in how
students can learn, create, and share their knowledge of music with others. There is

34
no doubt that mobile devices will change the landscape of music education,
however, research inquires of this subject is in it's infancy.
A recent trend in music instruction has been the rise of Internet‐based
materials that may be used for music teaching and learning (Bauer, 1999; Bauer &
Daugherty, 2001; & Webster, 2002). As reported in a subsequent literature review
by Webster (2007), two specific research studies examined the practicality of
incorporating Internet resources into music instruction. The first study that was
mentioned was conducted by Barry (2003), which examined graduate music
programs that incorporated supplemental online research resources, web‐based
teaching content, and multi‐media course content. It was reported students'
perceptions about the web‐based resources and instructions were generally
positive. Another study conducted by Ryder (2004) concerning Internet‐based
instruction on vocal anatomy, function, and health reported statistically significant
gains on attitude and achievement scores with 200 high school students.
Webster (2007) also noted the importance of developing research of distance
learning in music education. The Internet has revolutionized distance education
throughout the 1990s to the present. It has provided instant information sharing
and flexibility in instructional delivery methods. Course content could be presented
online either synchronously—the teacher and student are connected virtually at the
same time—or asynchronously—the student and teacher interaction are
independent from each other with regard to space and time. Current research on
learning in K‐12 virtual high schools has focused primarily on academic
achievement. A series of literature reviews and meta‐analysis have been published

35
in recent years in an attempt to provide a comprehensive overview of the research
pertaining to higher education and K‐12 distance education (Barbour & Reeves,
2009; Bernard, Abrami, Lou, Borokhovski, Wade, Wozney, Wallet, Fiset, & Huang,
2004; Cavanaugh, Barbour, & Clark, 2009; Machtmes & Asher, 2000; Patrick &
Powell, 2009; Rice, 2006; Shachar & Neumann, 2003; Ungerleider & Burns, 2003).
While many of the studies reviewed were informative, most comparative data was
found to be inconclusive. A recent summary of K‐12 online learning research (Smith,
Clark, & Blomeyer, 2005) found evidence that online learning can be just as effective
as face‐to‐face learning, however, continued research on the effective use of
technology for instruction and assessment in distance learning is needed especially
in arts education.
Recent studies in the use of technology in music teaching have described
trends in music educators' use of technology (Bauer et al., 2003; Reese & Rimington,
2000; Taylor & Deal, 2000). This research has shown that although there is a desire
by the music teacher to learn and use technology, there is a moderately low score of
teachers that are actually using technology in their classrooms. Two specific studies
(Reese & Rimington, 2000; Taylor & Deal, 2000) found that most music educators
using technology in school (a range between 75% and 92%) are primarily doing so
to complete administrative tasks. Less than 30% of the music teachers indicated
that they were using technology for classroom instruction.
Technologyassisted Music Assessments
Colwell (2002) noted that computer use in assessment holds considerable
potential if the music educator is willing to devote time and resources to developing

36
assessment strategies that connect instruction, learning, and testing. Assey (1999)
addressed the need for teachers to develop meaningful assessments that will
validate the learning objectives. She also described how assessment in the arts is a
terrific opportunity to use technology to record successful learning experiences by
creating a collection or portfolio of best works. Online portfolios can display how a
student has mastered the music objectives as effectively as paper and pencil
assignments. Boyle and Radocy (1987) also supported the potential use of
technology for the use of evaluation; "the computer has great potential for
measurement and evaluation of musical behaviors" (pg. 221). Whether that
technology includes digital sound recordings of performance assessments, online
testing or rubric development, or integrating technology with the music content, it
can enable students to reflect on their own learning. It cannot be stated enough that
a successful technology‐assisted assessment, as well as all assessments, is in the
curriculum design.
Venn (1990) created a computer‐based instrument that used a personal
computer and audio CD‐ROM. The purpose of this instrument was to measure four
musical elements (melody, rhythm, texture, and tonality) in an elementary general
music class. Test‐retest reliability for the 30 students that participated in the study
was .79. Hickey and Webster (1999) designed a computer‐administered test of the
Webster Measure of Creative Thinking in MusicII. This measurement tool used MIDI
instruments such as keyboards and drum pads to capture creative responses of
quasi‐improvisatory tasks by children ages 6 to 10.

37
Flohr (1996) developed a computer‐generated test instrument that was
designed to measure children’s awareness of steady beat. A revision of that test,
Rhythmic Performance TestRevised (RPT‐R), included two parts: tempo
synchronization and rhythm pattern identification (Meeuwsen, Flohr, & Fink, 1998).
The computer‐based test utilized the keyboard to record information. The first part
asked students to tap with a basic pulse using a computer key while listening to five
versions of a folk song recording. The tempos varied from 110 to 150 beats per
minute. Part two included 20 different rhythmic patterns in which the student
listened, remembered, and performed the rhythm by tapping on the space bar of the
computer keyboard. Each rhythmic pattern was one to three measures long
representing different meters, tempos, and duration of notes. The RPT‐R has been
validated as a rhythmic perception diagnostic test among elementary children
(Meeuwsen et al., 1998) and college age students (Flohr & Meeuwsen, 2001). The
test was intended to be used as a screening process, as well as a pre‐test and/or
post‐test for intervention studies. For both age groups, elementary children and
college age students, reliability coefficients indicated the different parts of the RPT‐
R to be internally consistent.
Other studies have explored the effectiveness of software assessment
programs, such as SmartMusic in performance‐based assessments (Flanigan, 2008;
Glenn, 2000; Glenn & Fitzgerald, 2002; Lee, 2007). Glenn and Fitzgerald (2002)
investigated attitude, motivation, and self‐efficacy of applied music students in
college that used SmartMusic. The students revealed that the program served the
purpose of repetitive practice, but no real improvement on musicianship occurred.

38
Flanigan (2008) examined the effectiveness of SmartMusic on intonation and
rhythmic accuracy with twenty college brass players over a four‐week period.
Results indicated no statistically significant difference on intonation accuracy and
rhythmic note errors between groups of students that practiced with SmartMusic
and students that did not practice with SmartMusic. An expert panel of judges that
evaluated the performances between the two groups did find a significant difference
with SmartMusic students displaying a greater pretest to posttest improvement on
intonation, tone quality, and expressive quality. Participants that used the
SmartMusic program indicated a positive reaction to using the software.
One approach to using technological assessment strategies is to have
students' share and critique musical works with others via websites (Savage &
Challis, 2002; Seddon, Joubert, Johnsen, & Tangenes, 2003). The personal reflections
about performances, compositions, and improvisational works are an example of
authentic assessment of students' understanding of the musical process.
Educational portals, blogs, and Wikis are common and viable tools in achieving this
goal.
Attitude Studies in Music Education
It is proven that attitudes have a profound impact on teacher behaviors and
practices. Studies regarding the attitudes of music educators towards the use of
technology and towards the importance of assessment are becoming more
prominent in current literature. It is important to understand what factors motivate
a teacher to incorporate technology not only for assessment, but also in daily
instructional practices so that school administrators may provide adequate

39
professional development and training.
The attitude formation model (Rosenberg and Hovland, 1960) illustrates that
attitudes will reflect a teacher's belief system, which will also influence the
instructional behaviors of the teacher. Therefore, any study about teachers'
decisions and actions in the classroom should involve an investigation into teachers'
beliefs because beliefs profoundly influence teacher perceptions (Pajares, 1992).
There are various studies that support and reject this notion of attitude formation
and various definitions have been formulated to explain the phenomenon of an
attitude (Fischer, 1977). An attitude is a hypothetical construct that represents an
individual's degree of like or dislike for an item, idea, or concept. In music, attitude
has been defined as a "predisposition to evaluate psychological objects in a
favorable or unfavorable manner" (Kuhn, 1980). Cutietta (1992) provided the most
complete description of attitude:
An attitude is a firmly held mental network of beliefs, feelings, and values
that is organized through an individuals experiences, and that exerts a
directive and dynamic influence on the individual's perception and response
to all objects and situations with which it is related. This definition is in the
tradition of L. L. Thurstone, who defined attitude as "the sum of a man's
inclinations and feelings, prejudice or bias, preconceived notions, ideas, fears,
threats, and convictions about any specific topic" (1928). Thus attitudes are
learned networks of complex interactions between facts (as believed),
feelings, and values. These networks are, by necessity, highly individualized
(p. 296).

40
In Ables, Hoffer, and Klotman (1994), a general view of the formation of a person's
attitude is based on three constructs; (1) similarity, what they know and can
understand; (2) conformity, the adoption of an attitude around the association and
reinforcement of others; and (3) advantageous, a person embraces an attitude that
will be beneficial to them.
In a study that measured a teacher's attitudes toward creativity in the
classroom, a negative relationship was found between teacher attitudes and
instructional behaviors (Al‐Agmi, 1995). On the other hand, Kershaw (1994) found
that teachers that displayed positive attitudes towards assessment were not limited
to the types of assessment strategies that they chose. Both of those studies
emphasize that a teacher's familiarity and personal experiences with either
technology or assessment strategies will influence their belief system.
In the final paragraph of this section, a brief overview of attitude concepts of
students toward technology will be mentioned. Although secondary to the
background of this study, it goes without saying that student attitudes towards
technology will have an effect on how well it is perceived and accepted in the music
classroom. For example, Ho (2004) found high levels of confidence between boys
and girls in using music technology and web‐based resources in Hong Kong schools.
Few gender differences in attitude were found, but primary students were more
positive than secondary students in the use of technology. Walls (2002) conducted a
study on the use of a hypermedia program on music composition. Results indicated
generally positive reactions by middle and high school students to the integration
and evaluation of this type of multimedia into a music rehearsal setting.

41
Influences of Demographics on Technology Use
Teacher demographics of experience and training have shown to have an
influence on the use of assessment strategies (McCoy, 1991; Simanton, 2000).
Assessment and grading practices are influenced by teaching level and
specialization (McCoy, 1988, 1991; Russell & Austin, 2010). According to research
by Bauer et al. (2003) on technology professional development, the factors of years
of experience, academic degrees, and areas of music teaching were found to be fairly
neutral with some slight differences in the gender variable. The authors explained
that the differences in gender might be related to self‐efficacy (Bauer, 2003) and
familiarity (Fung, 2003) with technology.
With regard to gender differences in attitudes towards music and technology
in general, it has been found that girls dominate positive attitudes towards music
and boys tend to more positive in using technology. There is a level of comfort that
each person must reach before the use of technology becomes routine (Nicolino,
Fitzgerald, Maser, & Morote, 2006). Comber, Hargreaves, & Colley (1993) found that
through experience of working with computers and music technology, students of
both genders understand the potential of technology in music therefore, changing
their attitudes towards music technology. Results from Folkestad, Comber,
Hargreaves, Colley (1996) confirmed the gender difference in computer use,
however, using computers to be creative in music‐making was regarded more of a
musical activity than a computer activity. Folkestad (2007) continues to support
that "gender issues is one of the core subjects in music education in general and in
computer‐based musical activities in particular" (p. 1330).
42
Teacher Professional Development
Teacher professional development and comfort level of technology will
impact the use of technology in the classroom. Moore (2009) attempted to
synthesize various definitions of professional development from the educational
literature. Referring to statements by Hooky (2002) about professional
development as the change in a teacher's knowledge base and actions, Moore stated,
"professional development framework is redefined as the inclusion of institutional
and personal professional responsibility for the enhancement and growth in the
music teacher’s knowledge base and actions towards professional maturity" (p.
320).
Research findings about integrating technology tools into the general
curriculum have revealed a positive effect on shifting teachers' beliefs and practices
(Matzen & Edmunds, 2007; Sandholtz, Ringstaff, & Dwyer, 1997). Therefore,
professional development in technology must move away from the stand‐alone
model of technology training to a student‐centered pedagogy (Palak & Walls, 2009).
Teachers must not only be trained on how technology may assist in the delivery of
content, but also on how to engage and assess student learning.
Bowles (2003) examined the perceived needs of professional development
by music teachers by administering a survey to a state music education association
in the upper Midwest. The survey yielded a 29.6% (n = 456) return rate out of 1,541
music teachers. The main topics of interest for professional development by music
teachers were (1) technology (66%), (2) assessment (57%), (3) instrumental /
choral literature (53%), (4) standards (45%), (5) creativity (43%), and (6) grant

43
writing (38%). Technology and assessment were also two of the top three topics
concerning the choice of professional development for elementary music educators
in Wisconsin and Minnesota (Tarnowski & Murphy, 2003).
Reese, Repp, Meltzer, and Burrack (2002) described a multimedia website
used for an online professional development program. The website was designed to
provide positive, technological support for teachers. This particular study found that
teachers did not use the site as often as predicted causing data analysis to be
difficult. Teachers tended to like face‐to‐face interaction for technology support over
the online approach. A study by Bryne and MacDonald (2002) investigated the use
of music technology by in‐service teachers in Scotland. Two focus groups provided
the researchers with the following concerns: technology access by students, core
music skills, gender demarcation, parent support, and school support. One
particular professional development program for music educators was designed
based on research (Moore, 2009). The appropriateness of the hands‐on program
provided resources and opportunities that strengthened the musical knowledge,
skills, and technological expertise of music specialists serving K‐12 at‐risk students.
The majority of the teachers who participated in this professional development
program indicated a new sense of confidence in using technology and that what was
personally applied and individually practiced was learned best.
Reese and Rimington (2000) found that a large majority of music teachers
(94%) desired to participate in technology training sessions. However, only 25% of
in‐service teachers indicated that technology training was a part of their
undergraduate teacher education program and that only 13% of school districts

44
were offering more than one technology training session per year. Taylor and Deal
(2000) also found there is a genuine need by music educators to participate in
technology training. Ninety percent of the music teachers in Taylor and Deal study
indicated they would be willing to participate in a technology workshop. However,
Bauer, Reese, & McAllister (2003) discovered teachers' high comfort level and
knowledge after a ten‐month period following a technology in‐service had no long‐
term impact on teacher usage of technology in the classroom. There is a continuous
need in educational research to determine what types of professional development
opportunities will motivate teachers to learn and implement technology into
already established teaching strategies. This is a monumental task due to the rapid
technological advances in both hardware and software packages.
Effective technology workshops must provide more than just how to operate
a piece of software or hardware. Russel and Sorge (1999) discovered that the most
effective technology workshops for teachers are one‐day workshops scattered
throughout the year. They also promoted the following:
The workshops must incorporate all that we know about good instruction.
Teachers learn best when they are actively involved, rather than listening to
lectures or watching demonstrations. They must be challenged to try
technology in their own classroom and be encouraged to share results—
both good and bad—and receive feedback from their peers in a non‐
threatening environment. The local technology coordinator is in an excellent
position to facilitate the continuing education of teachers (p. 9).
Moore (2009) also recommended that the teaching of technology must

45
include structured and active participation that includes teachers’ regular
involvement in hands‐on applications of music technology. Training on how to
implement the new technology for the purposes of enhancing music instruction and
assessment is essential. Assey (1999) articulated it best: "The most successful
application of technology will be combining the best learning theories and
instruction with digital methods. The instructional programs for students and
teachers cannot be overshadowed by the technology" (p. 81).
Summary
In summary, there were two overarching bodies of research literature that
assisted in developing the current study, music assessment and music instructional
technology. Studies about teacher attitudes on assessment practices have shown
that teachers in general understand the importance of assessment for learning.
Studies on teacher's experience and professional training as well as areas of
teaching specification and grade level have shown to have an effect on whether a
teacher is willing to incorporate proper assessment strategies as a part of their
instruction. Due to the subjective nature of music as an art form, much needs to be
done so that students' achievement and knowledge of music become the focus
rather than extra‐musical factors such as participation, attendance, and attitude. A
well‐designed assessment strategy will provide evidence of musical growth of the
student, motivate students to learn, provide validation of music programs and
teacher effectiveness.
Research in music technology over the last twenty years has indicated a
significant growth and impact on music education. Even so, music educators are not

46
keeping pace with the rapid growth of new technologies available to them. This is
partially due to lack of proper training and understanding of instructional
technology for both pre‐service and in‐service teachers. The rate of technology
development and changes are moving at such a rapid rate, it is difficult to establish a
conceptual base of best instructional technology practices.
Between the two bodies of literature, the researcher discovered a gap in
research that specifically focused on technology‐assisted assessment tools. There
are a variety of technology‐assisted assessment tools available for music educators,
but it is unknown how many educators are actually using these tools and whether
they are using these tools in providing authentic assessment of music learning. The
potential of incorporating such tools would benefit both teachers and students.

47
CHAPTER 3
METHODOLOGY
Introduction
This survey method study was designed to examine K‐12 music educators’
attitudes regarding the use of technology in the assessment of music learning. This
chapter provides specific details concerning the methods and procedures that were
used for this study and follows the organizational format of (1) subjects, (2)
development of the survey instrument, (3) procedure, and (4) data analysis.
The most influential survey research on the subjects of assessment and
technology were discussed in the review of the literature. The current study
attempted to combine previous research findings on the use of technology and
beliefs towards assessment in developing a research design that specifically focused
on the use of technology tools for assessment. This goal was accomplished by using
a researcher‐designed survey instrument. The use of survey research is a systematic
and impartial means of gathering accurate information from a large population of
people (Backstrom & Hursh, 1981; Kerlinger, 1979). In addition, Dillman, Smyth,
and Christian (2009) explain that the goal of survey research is "to design
scientifically sound data collection systems that allow us to obtain precise estimates
of the behaviors and attitudes of all people in a population by sampling and
obtaining results from only a fraction of them" (pg. 11). To further validate the use
of surveys, Schuman & Presser (1996) simply stated that surveys are useful for
"charting trends in attitudes over time" (pg. 6).

48
Subjects
The subjects for this study included 2,211 music educators that were MENC
members. MENC: The National Association of Music Education provided the
researcher a stratified, random sampling of MENC members who have an interest in
music education in the K‐12 setting and teach general music, vocal music, or
instrumental music classes. Only school email addresses were provided to the
researcher.
Other personnel that assisted with this study included the MENC staff in
formulating the random sampling, music teachers from a large Midwest school
district that participated in a pilot of the survey instrument, a panel of experts who
reviewed the survey instrument, and the music teacher participants of the actual
research study. There were thirty‐eight music teachers that participated in the
initial pilot study and twenty‐one in a second instrument evaluation. The researcher
also enlisted the assistance of the staff at the Nebraska Evaluation and Research
(NEAR) Center at the University of Nebraska–Lincoln for data analysis.
Description of the Population
An a priori calculation of the required sample size was conducted with an
alpha level of .05 and a confidence level of ± .05. Assuming a normal response rate, it
was determined that a sample size of 327 completed surveys was needed. At the
completion of the survey, 492 responses were recorded, 22% rate of return.
Twenty‐eight respondents did not fully complete the survey, leaving a total of 464
usable survey responses. Further investigation beyond the 492 responses, 57
people were ineligible to participate in the study because they were no longer

49
teaching K‐12 music. Some of the participants emailed the researcher stating they
were no longer teaching at the K‐12 level because of a new teaching position at a
college or university or the teacher was recently retired. Eight participants simply
declined to participate and 152 participant emails were undeliverable. It should be
noted that when using membership lists from associations, the member email
contacts could be as much as a year old depending on the time of the year the
teacher renews their membership.
Teacher demographics included a description of music content areas of
elementary general music (60.3%), choir (44.7%), band (42.7%), and strings
(12.9%). Participants described additional teaching areas such as guitar and music
appreciation classes on a free‐response question. Grade levels that were taught
ranged from elementary (30.3%), middle level (16.7%), high school (29.4%), and a
combination of grade levels (23.2%). School setting included urban (26.6%),
suburban (50.4%), and rural (22.5%). Personal teacher demographical information
included gender, males (43.3%) and females (56.6%); and, the number of years of
teaching experience; 1‐10 years (22.7%), 11‐20 years, (25.1%), 21‐30 years
(31.1%), and 30+ years (20.6%). One final demographical information crucial to this
study included highest professional degree earned which included Bachelors
(22.7%), Masters (63.9%), and Doctorate (12.9%). The participants were fairly
representative of the music education population. It is unknown what different
areas of the country were represented in this sample.

50
Development of the Survey Instrument
The TechnologyAssisted Assessment Tools in Music Education survey
instrument was developed by the researcher for data collection purposes and was
approved by the University of Nebraska Institutional Review Board for the
Protections of Human Rights (see Appendix A). The survey instrument also gathered
demographical information about the teachers and schools where they taught,
technology tools that were being used by the teachers, and professional
development opportunities. The survey was composed of six sections in the
following order: (1) research study consent, (2) use of instructional technology in
music, (3) use of technology‐assisted assessment tools, (4) professional
development, (5) teacher perceptions on music assessment and technology (PMAT),
and (6) demographics. Section two and three asked questions about current and
past experiences of using instructional technology and assessment practices. Section
four asked the teachers about professional development training using technology.
The purpose of section five was to establish an attitude score that served as the
dependent variable for the study. This section was entitled Perceptions on Music
Assessment and Technology (PMAT). The PMAT included twenty‐two belief
statements about the value of assessment and teacher perceptions on using
technology to assist with assessing students. The final section included basic
demographical information including gender, years of teaching, area of
specialization and grade level taught, years of teaching, highest educational degree
earned, and school location and size.

51
Stage One: Table of Specifications
The pillars of specifications for this survey were formulated by the review of
the literature and input from current music educators. Input from music educators
on their current use of technology for assessment was gathered in an initial survey.
Questions were developed to gather descriptive data on whether music teachers are
using technology‐assisted assessment tools and what types of tools are being
utilized most frequently. Further questions on general assessment practices and
professional development experiences were asked in order to establish answers to
the first two research questions. Five constructs (factors) that guided the
construction of this survey were: (1) technology ease of use, (2) beliefs about
assessment, (3) beliefs about technology, (4) familiarity, and (5) endorsement by
the experts.
Stage Two: Instrument Design
In stage two, the survey construction focused on the development of the
PMAT section of the survey instrument. The researcher generated an initial set of
twenty‐four belief statements. The statements were based on the five constructs
described earlier. Under each construct, a set of belief statements were evenly
worded positively or negatively in order to increase the reliability of the survey
instrument. Likert descriptors ranging from Strongly Disagree to Strongly Agree
were used. Numerical values ranging from 1 to 5 were assigned to each Likert
descriptor based on the positive or negative intent of the statement. The five
constructs are described in more detail in the following narrative.

52
Technology ease of use. Referring to the theory section in chapter one, ease
of use was defined by Davis (1989) as the degree in which a person believes that
using a particular system or tool would be free from effort. This is a crucial step for
music teachers in their adoption of new technology into instructional and
assessment practices. Examples of the belief statements developed for this section
were: (1) I become frustrated when learning how to use new technology tools; (2) It
takes too much time to learn how to use technology; and (3) Technology saves me time
in assessing individual student's musical growth.
Beliefs about assessment. The belief statements established for this
construct focused on a music teacher's perceptions about assessment. A general
question that guided this construct was whether the teacher had a positive or
negative belief regarding music assessment. Specific statements created for this
section included: (1) I believe it is important to assess the musical growth of my
students; (2) I do NOT have enough class time to assess my students properly; and (3) I
feel assessment can be helpful in promoting students' musical growth.
Beliefs about technology. In the same nature as the second construct, the
intention of the third factor was to focus on beliefs about the purpose and
usefulness of technology. A teacher's willingness to adopt a technology tool with
already established instructional and assessment practices is based on their level of
"trust" that the tool will do what it is intended to do. This construct was also looking
at positive and negative beliefs about technology.
Examples of technology belief statements were: (1) I feel that many of the
technologyassisted assessment tools that are available for music are too expensive;

53
(2) I would NOT use technology even if I had the resources available; and (3) I am
willing to search for additional funding to purchase music technology for my
classroom.
Familiarity. The construct of familiarity is based on the premise that people
like what they know. They are comfortable using or trying new types of technology
if they have had the proper training and experience in using the technology. The
goal of this construct was to capture the teachers' perceptions of pre‐service and/or
in‐service professional development experiences in regard to both assessment and
technology.
Examples of belief statements for the familiarity construct included: (1) I
would use technologyassisted assessment tools if I had more professional development
time devoted to learning how to use it; (2) I have NOT had any experience in learning
to use music technology assessment tools; and (3) I wish I had more time to learn and
implement technology into my assessment practices.
Endorsement by experts. The belief statements for the final construct were
generated based on the input and influence of experts in the profession. Specifically,
are there other music educators that are using technology for assessment
successfully? Examples of statements in reference to this construct included: (1) My
colleagues are using technology in their music classrooms; (2) There are often
technology sessions at the conferences I attend; and (3) I believe technology is too
unreliable to be used for assessment.

54
Stage 3: Instrument Assessment
An important final step of the development of the PMAT survey instrument
included an examination of validity and reliability. In order to establish content
validity, the opinion statements were reviewed by a panel of experts: two doctoral
students in music education, two University of Nebraska–Lincoln faculty members,
one music supervisor of a large school district and one middle school music teacher.
The panel members were given a copy of the survey and the table of specifications.
The panel also examined items of face validity, which included length of the survey,
simple rewording of certain questions, and formatting concerns. Each panel
member completed a rating form (see Appendix B) and provided specific comments
about the survey. A final version of the survey was constructed based on the input
by the panel of experts. Minor suggestions were provided in clarity of word choice
in the questions and belief statements. With regard to content validity, the panel of
experts was asked to review the 24 belief statements of the PMAT in relation to the
five constructs associated with the table of specifications. All panel members
indicated a closely related comparison with the exception of two statements, which
will be explained further in the next paragraph.
The survey instrument was piloted by asking music teachers in one large
Midwest school district to take the survey. A factor analysis was conducted to
examine the internal consistency reliability of the instrument. The estimate
coefficient of reliability (α = .74) was found to be in the threshold of acceptability.
Due to the fact this was a one time pilot administration of the instrument that
included a small sample of participants, the reliability coefficient was an estimation
55
of its internal consistency. The data did provide the researcher with information
about three statements that had relatively low values. In comparing the three belief
statements to the feedback by the panel of experts, two statements were eliminated
from the survey increasing the estimated coefficient of reliability (α = .76). Based on
further feedback by the panel concerning the third statement, it was determined
that it was an important statement to include within the PMAT section. Therefore,
with some changes in wording, it was included in the survey. The final version of the
PMAT portion of the survey included 22 belief statements. A post hoc factor analysis
on the PMAT reinforced the above findings. The coefficient of reliability (α = .781)
was reported on the perception section after the actual survey was completed (n =
464).
Procedure
The researcher utilized an online survey software and questionnaire tool
called SurveyMonkey. This service provided unlimited questions, a quick and simple
data collection service, and secure data storage of the survey responses. The
researcher also used PASW/SPSS, a statistical analysis computer program during
the data analysis process. Once the survey questions were developed from the table
of specifications, the online version was formulated. The researcher took special
care in designing the survey that was easy to complete and readable by the
participants.
After the researcher obtained campus Institutional Review Board approval
for this survey study, an email contact was initiated with each participant, which
included the description and purpose of the study as well as an invitation to

56
participate (see Appendix C). A web‐based survey was administered electronically
to the participants (see Appendix E). The link to the survey was included in the
initial contact. The survey took less than fifteen minutes to complete. The initial
response rate netted a return rate of approximately 15%.
Two follow‐up emails were sent to participants seven and fourteen days after
the initial email reminding the music teachers to complete the survey by the
assigned deadline (see Appendix D). The follow‐up email contacts resulted in an
additional 7% response rate providing a grand total for the survey administration of
22%. At the completion of the survey, the data was downloaded from SurveyMonkey
into an Excel document for data analysis purposes.
Data Analysis
The data analysis procedure described the population of music teachers that
utilize technology‐assisted assessment tools in music instruction. The research
questions and data can be divided into two parts: descriptive data and inferential
data. For each of the research questions, a different data analysis procedure was
employed in order to provide a generalization of the sample with the dependent
variable of attitude.
Part 1: Descriptive Data
Research question 1: How many music educators are using technology‐
assisted assessment tools and what types of assessment tools are being utilized?
Simple descriptive statistics determined the number of music educators using
technology as a part of their assessment strategies as well as described the types of
assessment tools they are using in their music classroom.
57
Research question 2: Is the general attitude of music educators positive or
negative toward using technology for assessment? This question helped develop the
attitude score, which served as the dependent variable. Likert descriptors ranging
from Strongly Disagree to Strongly Agree were used. Incorporating a five‐point
numerical scale on 22 belief statements, a numerical mean score was computed for
each individual. Any mean score over 3 indicated a positive attitude towards
technology and assessment. One‐way ANOVAs and t‐tests were implemented in
comparing the attitude score to actual use of technology.
Part 2: Inferential Data
The second part of this study examined possible effects on teachers'
attitudes. A one‐way analysis of variance (ANOVA) and a factorial design were
utilized for data analysis. The advantages to a factorial design are that multiple
experiments can be conducted simultaneously, extraneous variability can be
controlled leading to lower experimental error and increased power, and any
interactions between the independent variables can be determined.
Research question 3: How do school setting factors influence music
educator's attitudes regarding the use of technology in the assessment of music
learning?
3a. Do certain types of professional development experiences influence
music educators’ attitudes towards using technology‐assisted assessment
tools?
3b. Do school setting and primary level of teaching assignment influence
music educators’ attitudes towards using technology‐assisted assessment

58
tools?
Three factors were examined: (1) type of professional development
experience (school mandated, school voluntary, personal voluntary, and college pre‐
service), (2) school setting (urban, suburban, rural), and (3) the primary level of
teaching assignment (elementary only, middle school only, high school only, or
combined levels). The dependent variable was attitude regarding using technology
to assess music concepts or skills. Based on the complex layers of the factors under
investigation of this question, the data was analyzed in two parts. First, the
professional development options were analyzed simply by descriptive statistics
and a one‐way ANOVA to determine what are the most common professional
development opportunities that teachers are engaged in to learn technology. The
second part looked at the school setting variables and whether there was any
influence on the dependent variable. This was accomplished by using a 3 x 4
factorial ANOVA.
Research question 4: To what extent do music educator demographic
factors of gender, level of educational degree, and years of music teaching
experience influence music educators' attitudes about technology‐assisted
assessment tools? This question had three main subsets: (1) gender, (2) level of
educational degree, and (3) years of music teaching experience. A 2 x 3 x 4 factorial
ANOVA was used to analyze the overall interactions between all teacher and school
factors.

59
Summary
This chapter presented the details of the methods and procedures utilized in
this study. A description of the participants, explanation of the survey instrument
design, procedures, and data analysis were explained. The trends of music teachers
using technology for music assessment were examined using a researcher‐
developed survey. During the instrument design process, a review of the literature
and a panel of experts including doctoral students, university professors, and public
school music educators helped establish content validity and face validity. A factor
analysis was conducted to examine the internal consistency reliability of the
instrument. A pilot study established a reliability coefficient that was within an
acceptable range.
The survey was emailed to a national list of 2,211 music teachers. Participant
responses on the PMAT helped determine whether music teachers have a positive
or negative feeling towards using technology for assessment, and what specific
teacher and school factors influence their decision to use technology‐assisted
assessment tools. The data analysis for this study used descriptive statistics to
describe the population of music teachers that participated in the study. For
research question two, three, and four, one‐way ANOVAs, t‐tests, and different levels
of a factorial ANOVA were employed to examine the influences of teacher and school
variables on K‐12 music educators’ attitudes.

60
CHAPTER 4
PRESENTATION AND ANALYSIS OF DATA
Introduction
The purpose of this study was to examine K‐12 music educators'
demographics and attitudes towards assessment and technology in their decision to
utilize technology‐assisted assessment tools. In order to achieve the purpose of the
study, four research questions were developed. First, it was determined how many
music educators were using technology‐assisted assessment tools and the types of
assessment tools that were most frequently used in music classrooms. Second, an
examination was conducted on whether the music educator's general attitude in
using technology for assessment was positive or negative. The third research
question regarding school setting variables was divided into two parts; (a) types of
professional development experiences and, (b) school setting and primary level of
teaching assignment. The school setting variables were analyzed for significant
influence on music educators’ attitudes towards using technology‐assisted
assessment tools. Finally, the question concerning the influence of music educator
demographic factors of gender, level of educational degree, and years of music
teaching experience on teachers' attitudes was analyzed. Chapter four begins with a
discussion of the teacher and school demographic factors. The remainder of the
chapter will be devoted to the presentation of the results for each research question.

61
Demographic Analysis
Teacher demographic variables examined in this study included the
following: gender, primary grade level, years of teaching experience, school setting
and education background (see Table 1).
Table 1
Demographic Characteristics of Participants
Characteristic Frequency % of Total Returned
Gender Male Female
202 259
43.3 55.6
Grade Level
Elementary
Middle Level High School
Multi‐Grades
141
78 137
108
30.3
16.7 29.4
23.2
Years of Teaching Experience
1 ‐ 10 years
11 ‐ 20 years
21 ‐ 30 years 31+ years
106
117
145 96
22.7
25.1
31.1 20.6
School Setting
Urban
Suburban Rural
124
235 105
26.6
50.4 22.5
Level of Education
Bachelors Masters
Doctorate
106 298
60
22.7 63.9
12.9
Note. n = 464

62
The stratified, random sample of music educators across the United States
(N = 2211) resulted in 492 responses to the survey (22% return rate). Twenty‐eight
respondents did not fully complete the survey, leaving a total of 464 usable survey
responses. Three participants chose not to answer the gender question, therefore
were eliminated from analysis concerning gender.
Demographics were relatively balanced between gender, years of teaching,
and primary grade level that the teachers were assigned to teach. A fourth category
of multi‐grades was added to cover those teachers that teach more than one grade
level. The number of music teachers that teach multi‐grades (ex. 5‐12 instrumental
music) represented 23.2% of the total. This type of teaching situation is very typical
in smaller urban or rural schools.
The response rate (22%) was lower than expected, although two follow‐up
emails were sent to participants seven and fourteen days after the initial email
reminding the music teachers to complete the survey by the assigned deadline.
However, a priori power analysis with an alpha level of .05 and a confidence level of
± .05 indicated that a sample size of 327 completed surveys was required to detect
significant group differences. Therefore, the decision was made to continue with an
analysis of the final 464 survey responses. Non‐response bias was addressed by
comparing the demographics of participants during each phase of the data
collection: initial contact, second email contact, and third email contact. MENC
member email contacts, depending on the time of the year when the teacher renews
their membership, can be as much as a year old. Therefore, 57 participants were
ineligible to participate in the study because they were not currently teaching K‐12

63
music. Some participants in this category elaborated that they have either recently
retired or have moved to a teaching position in higher education. Eight participants
simply declined to participate in the study.
The primary teaching area of each teacher was classified into four areas:
general music, choir, band, and strings with an additional other to include additional
teaching assignments. The other category included courses such as music theory or
appreciation, music technology, guitar, or mariachi (see Table 2).
Data Analysis
Research Question 1: How many music educators are using technology
assisted assessment tools and what types of assessment tools are being utilized?
The frequency and percentage distribution of how many music educators use
instructional technology tools to enhance their classroom instruction as well as for
assessment of performance skills and music content knowledge is displayed in
Table 3. The teachers were asked to select one of four answers that best described
Table 2 Demographic Classification of Primary Teaching Area
Classification Frequency % of Total Returned
General Music
Choir Band
Strings
Other
277
205 196
59
88
60.3
44.7 42.7
12.9
—
Note. n = 464 Other referred to classes that were usually an additional teaching assignment, therefore no percentages were reported.

64
the amount of technology they use under each caption; regularly (every lesson),
sometimes (3 to 4 times a week, but not for every lesson), occasionally (a
few times a month), and never.
Note: n = 464
Table 3 Distribution of Participants' Use of Technology
Classification Frequency Percent
Technology used for instruction
Regularly 133 28.7
Sometimes 191 41.2
Occasionally 131 28.2
Never 9 1.9
Technology used for performance assessments
Regularly 41 8.8
Sometimes 94 20.3
Occasionally 222 47.8
Never 107 23.1
Technology used for content knowledge assessments
Regularly 36 7.8
Sometimes 90 19.4
Occasionally 202 43.5
Never 136 29.3

65
The data indicated that a larger percentage of music teachers use technology
for instructional purposes in order to enhance their lesson plans than for
conducting authentic assessment of student learning. A slight difference in
technology usage was evident among teachers who use technology‐assisted
assessment tools for performance‐based skills rather than for measuring music
content knowledge.
In order to analyze what specific assessment tools were most frequently used
by music educators, five areas of assessment tools were established: (1) digital
recorders used to record performance tests, (2) music notation software used for
the creation of worksheets or quizzes, (3) web‐based assessment tools to measure
content knowledge (musictheory.net), (4) interactive whiteboards (the most
common are SmartBoard and Promethean), and (5) web‐based portfolio assessment
to measure a student's musical growth over time. The frequencies and percentages
of assessment tools that were most commonly used by teachers are displayed in
Table 4.

66
Table 4 Distribution of Types of Assessment Tools Most Commonly Used by Music Teachers
Classification Frequency Percent
Digital Recordings of Performance Skills
Yes 241 51.9
No 223 48.1 Music Notation Software
Yes 327 70.5 No 137 29.5
Web‐Based Assessments
Yes 159 34.3
No 305 65.7
Interactive Whiteboards Yes 171 36.9
No 293 63.1
Web‐Based Portfolios Yes 51 11.0
No 413 89.0 Note. n = 464
The most commonly used technology‐assisted assessment strategy included
music notation software and digital recording devices. In reviewing the specific
types of technology that were indicated by music teachers, Finale (63%) and Sibelius
(41.2%) were the most widely used software programs in designing music
assessments such as notation quizzes or performance exams. Recording
performance skilled‐based assessments can be accomplished in numerous ways.
Handheld digital recorders such as the Olympus Series and Zoom H‐2/H‐4 models
or software programs such as SmartMusic were the most common assessment tools

67
used by teachers. Handheld recording devices constituted 51.6% of teacher use
whereas software programs had a smaller and more specific teacher use:
SmartMusic (32.1%), GarageBand (39.1%), Audacity (33.5%), and iPas (2.9%).
In answering research question one, it was discovered that a larger
percentage of music teachers use technology for instructional purposes in order to
enhance their lesson plans than they do to conduct authentic assessment of student
learning. The most commonly used technology‐assisted assessment strategy
included music notation software and digital recording devices.
Research question 2: Is the music educator's general attitude in using
technology for assessment positive or negative?
Section 5 of the teacher survey was the Perceptions on Music Assessment and
Technology (PMAT) attitude scale. It is noted that all 22 questions within this
section intended to measure the unidimensional construct of teacher attitudes.
Attitude served as the dependent variable for this study. To test whether the
distribution of the PMAT attitude scale deviated from normal, skewness and
kurtosis values were examined. The data displayed in Table 5 and Figure 5 indicates
a relatively normal distribution.
Table 5 Normal Distribution of PMAT (Perception of Music Assessment and Technology)
N Minimum Maximum Mean Std. Dev. Skewness Kurtosis
Statistic Std. Error Statistic Std.
Error
464 2.59 4.77 3.7890 .38650 ‐.303 .113 .125 .226

68
Figure 5. Histogram of Normal Distribution of PMAT (Perception of Music Assessment and Technology) The questions were based on a five‐point Likert scale with an average above
three indicating a positive attitude. For this data set, M = 3.79 with a SD = .387
indicated that the general attitude of the teachers completing the survey was
positive towards assessment in music and in utilizing technology to conduct
assessments. Differences were examined between the average of responses on the
PMAT scale to how the music teachers answered questions in section 2 concerning
the use of technology for instruction and assessment (see Table 6).

69
Note. n = 464
For the survey question concerning the use of technology to enhance
instruction, a one‐way analysis of variance (ANOVA) was used (see Table 7).
Levene's Test of Homogeneity‐of‐variance assumption was met (F(3, 460) = 1.144, p
= .331) as well as all other ANOVA assumptions of independence, normality, and
randomness. The omnibus F‐test from the ANOVA indicated a statistically significant
difference in responses to the PMAT score based on the 4 response options of the
question, F(3, 460) = 30.920, p = .0001. The partial eta squared effect size for this
analysis, ηp2 = .170 indicated a large effect size (Cohen, 1988).
Table 6 Descriptive Statistics Comparing Mean PMAT Score to Amount of Use for Technology of Instruction and Assessment
Instructional Performance Skill Assessment
Content Knowledge Assessment
Amount of Use n M SD n M SD n M SD
Regularly 133 3.99 .343 41 4.12 .233 36 4.03 .378
Sometimes 191 3.81 .338 94 3.98 .361 90 4.00 .358
Occasionally 131 3.57 .373 222 3.78 .337 202 3.79 .332
Never 9 3.58 .524 107 3.52 .366 136 3.79 .387

70
Note. * p < .05
Significant differences between groups were examined using a post‐hoc test.
Employing a post‐hoc Tukey's HSD (Honestly Significant Differences) test, the
significant differences occurred between the teachers who responded regularly with
all other categories, and those who responded sometimes with those who responded
occasionally.
To continue this investigation, the PMAT scores were also compared to both
assessment questions. All ANOVA assumptions of independence, normality,
randomness, and homogeneity of variances were met for both questions. Levene's
Test of Homogeneity‐of‐variance assumption was met (F(3, 460) = 1.976, p = .117)
for the first assessment question. Based on the four response options for question
2.5 about performance skill assessments compared to the PMAT score, there was a
significant difference, F(3, 460) = 44.236, p = .0001 (see Table 8). The partial eta
squared effect size for this analysis, ηp2 = .224, was larger than Cohen's benchmark
(1988) for a large effect size (.14). Using Tukey's HSD, the significant differences
occurred among teachers who responded regularly and sometimes with occasionally
Table 7 ANOVA Results of PMAT Score by Technology Use for Instruction
Sum of Squares df Mean Square F Sig.
Between Groups Within Groups Total
11.606 57.556 69.162
3 460 463
3.869 .125
30.920
.000*

71
and never and those who responded with occasionally and never were significant
with all three options.
Note. * p < .05
For the survey question concerning technology use for assessment of music
content knowledge, Levene's Test of Homogeneity‐of‐variance assumption was met
(F(3, 460) = .467, p = .706). An omnibus F‐test from the ANOVA indicated a
statistically significant difference in responses to the PMAT based on the four
response options of the question about music content knowledge (F(3, 460)=
31.413, p = .0001) (see Table 9). The partial eta squared effect size for this analysis,
ηp2 = .170, indicated a large effect size. Once again using Tukey's HSD, a post‐hoc
analysis indicated that the differences occurred among teachers who responded
regularly and sometimes with occasionally and never, and those who responded with
occasionally and never were significant with all three options.
Table 8 ANOVA Results of PMAT Score by Technology Use for Assessment of Performance Skills
Sum of Squares df Mean
Square F Sig.
Between Groups Within Groups Total
15.485 53.677 69.162
3 460 463
5.162 .117
44.236
.000*

72
The researcher conducted an additional analysis comparing the PMAT scores
with specific assessment approaches. Independent sample t‐tests were conducted
comparing PMAT scores with each question concerning the use of a specific
technology‐assisted assessment (see Table 10). All t‐tests were significant disclosing
that music teachers' relative positive perception in using technology to assist with
assessment is not being realized in actual day‐to‐day assessment strategies.
Table 10 tTest Comparison of PMAT Score with Use of Technology Assessment Tools
95% CI
Assessment Approach M SD t p LL UL
Handheld Digital Recorders
3.85 .382 3.766 .0001* .06376 .20293
Music Notation Software 3.86 .360 6.400 .0001* .16736 .31568
Web‐based Assessments 3.95 .343 6.812 .0001* .17488 .31667
Interactive Whiteboards 3.89 .386 4.215 .0001* .08219 .22580
Web‐Based Portfolios 3.93 .374 2.827 .0050* .04908 .27285 Note. n = 464. CI = confidence interval; LL = lower limit; UL = upper limit. * p < .05
Table 9 ANOVA Results of PMAT Compared to Technology Use for Assessment of Music Content Knowledge
Sum of Squares df Mean
Square F Sig.
Between Groups Within Groups Total
11.760 57.403 69.162
3 460 463
3.920 .125
31.413
.000*
Note. * p < .05

73
In answering research question 2, it was determined by the data that music
educators have a general positive attitude towards using technology for assessment
(M = 3.79, SD = .387). Additional analysis determined that there is a significant
difference between music teachers' positive perception and the types of technology
that are actually used and how often the technology is implemented.
Research question 3: How do school setting factors influence music
educator's attitudes regarding the use of technology in the assessment of music
learning? This question was divided into two parts:
3a. Do certain types of professional development experiences influence music
educators’ attitudes towards using technologyassisted assessment tools?
3b. Do school setting and primary level of teaching assignment influence
music educators’ attitudes towards using technologyassisted assessment
tools?
This question was split into two parts in order to provide a clear indication of
the impact of professional development opportunities. First, professional
development was categorized into four types of experiences; school mandated,
school voluntary, personal voluntary, and preservice teacher training. The responses
included yes, no, or not sure to participating in professional development on
technology. Descriptive data of the means and standard deviations are displayed in
Table 11.

74
Table 11
Descriptive Statistics for Technology Professional Development Participation
All ANOVA assumptions of independence, normality, randomness, and
homogeneity of variances were met for the following four one‐way ANOVAs.
Levene's Test of Homogeneity‐of‐variance assumption was met (F(2, 461) = .529, p
= .589) for the first statistical test. An omnibus F‐test from the one‐way ANOVA
conducted on the question concerning the school mandatory professional
development and PMAT attitude score was significant, F(2, 463) = 5.653, p = .004
(see Table 12).
Yes No Not Sure
Professional
Development
n M (SD)
n M (SD)
n M (SD)
School Mandated 368 3.82 (.389)
83 3.72 (.355)
13 3.51 (.358)
School Voluntary 370 3.83 (.377)
88 3.63 (.382)
6 3.51 (.279)
Personal Voluntary 367 3.85 (.359)
93 3.56 (.402)
4 3.73 (.518)
College Pre‐service 126 3.85 (.368)
334 3.76 (.393)
4 3.84 (.269)

75
The partial eta squared effect size for this analysis, ηp2 = .024, is a
considerable small effect size based on Cohen's (1988) benchmarks of effect size. A
post hoc test using Tukey's HSD indicated that the significant difference occurred
among teachers who responded Yes with teachers who responded Not Sure.
For the survey question about school voluntary professional development,
Levene's Test of Homogeneity‐of‐variance assumption was met (F(2, 461) = .292, p
= .747). An omnibus F‐test from the one‐way ANOVA indicated a significant
difference between PMAT score and school voluntary professional development
participation, F(2, 463) = 12.310, p = .0001 (see Table 13).
Table 12 ANOVA Results of PMAT Compared to School Mandated Professional Development
Sum of Squares df Mean
Square F Sig.
Between Groups Within Groups Total
1.656 67.507 69.162
2 461 463
.828
.146
5.653
.004*
Note. * p < .05

76
The partial eta squared effect size for this analysis, ηp2 = .051, was a small effect size.
Using Tukey's HSD, the significant differences occurred among teachers who
responded Yes with respondents that indicated No.
For the third one‐way ANOVA, Levene's Test of Homogeneity‐of‐variance
assumption was met (F(2, 461) = .2.517, p = .082). Table 14 displays the omnibus F‐
test data that indicated a statistically significant difference in responses to question
3.4 on personal voluntary professional development to the PMAT score, F(2, 463) =
23.454, p = .0001. The partial eta squared effect size for this analysis, ηp2 = .092,
reflected a medium effect size (Cohen, 1988).
Table 13 ANOVA Results of PMAT Compared to School Voluntary Professional Development
Sum of Squares df Mean
Square F Sig.
Between Groups Within Groups Total
3.506 65.656 69.162
2 461 463
1.753 .142
12.310
.000*
Note. * p < .05
Table 14 ANOVA Results of PMAT Compared to Personal Voluntary Professional Development
Sum of Squares df Mean
Square F Sig.
Between Groups Within Groups Total
6.388 62.775 69.162
2 461 463
3.194 .136
23.454
.000*
Note. * p < .05

77
Using Tukey's HSD, the significant differences occurred once again between
teachers who responded Yes with teachers that indicated No.
The final omnibus F‐test from the one‐way ANOVA conducted on the
question concerning the PMAT score and college pre‐service teacher training was
not significant, F(2, 463) = 2.451, p = .087 (see Table 15).
The second part of research question 3 focused on school setting (urban,
suburban, rural) and primary level of teaching assignment (elementary, middle
school, high school, and mixed grade). A 3 x 4 factorial ANOVA was used to examine
the effects between school setting and primary level of teaching on teachers'
attitude (see Table 16). There was no significant difference observed, F(11, 463) =
1.342, p = .198).
Table 15 ANOVA Results of PMAT Compared to College Preservice Teacher Training
Sum of Squares df Mean
Square F Sig.
Between Groups Within Groups Total
.728 68.435 69.162
2 461 463
.364
.148
2.451
.087
Note. p > .05

78
Note. p > .05
In order to further examine the role of professional development in learning
technology‐assisted assessment tools, simple descriptive statistics were employed.
Table 17 displays a comparison of actual participation in technology professional
development by school setting.
Table 17 Descriptive Statistics of Technology Professional Development Participation by School Setting
Table 16 Factorial ANOVA (3 x 4) Results of School Setting and Grade Level
Sum of Squares df Mean
Square F Sig.
Between Groups Within Groups Total
2.187 1.001 69.162
11 6 463
.199 .167
1.342 1.125
.198
.346
Urban Suburban Rural
Professional
Development
n M (SD)
n M (SD)
n M (SD)
School Mandated 95 3.84 (.385)
214 3.79 (.391)
59 3.85 (.391)
School Voluntary 99 3.88 (.366)
216 3.81 (.379)
55 3.82 (.393)
Personal Voluntary 96 3.89 (.341)
213 3.82 (.368)
58 3.87 (.349)
College Pre‐service 34 3.82 (.394)
71 3.81 (.356)
21 4.04 (.321)

79
It is noted that the number of teachers responding Yes to participating in
school mandated, school voluntary, and personal voluntary professional
development were consistent. However, the number of teachers that indicated they
participated in college pre‐service training on technology and technology‐assisted
assessment tools was significantly lower. Regardless of this disparity, attitude
scores were consistently positive across all four types of professional development
categories regardless of school setting.
In answering question 3, school district professional development options
for in‐service teachers, whether mandatory or voluntary, tend to have a significant
difference on attitude scores. Also, when teachers take the initiative to participate in
workshops and clinics on their own time, there is a significant difference on their
attitude towards using technology‐assisted assessments. The effect sizes were small
to medium on all three tests. There was no significant difference on attitude scores
based on college pre‐service training even with fewer teachers indicating they had
technology training in college. The second part of this question determined that the
factors of school setting and grade level taught had no significant difference on
attitude scores.
Research question 4: To what extent do music educator demographic factors
of gender, level of educational degree, and years of music teaching experience
influence their attitudes about technologyassisted assessment tools?
A 2 x 3 x 4 factorial ANOVA was used to examine the interactions between all
teacher variables of gender (male and female), highest academic degree earned
(bachelors, masters, doctorate), and years of teaching experience (1‐10 years, 11‐20

80
years, 21‐30 years, and more than 30 years) with the PMAT attitude score. Table 18
displays the means for the design cells.
Table 18 Frequency, Means, and Standard Deviations of Gender, Highest Degree Earned, and Years of Teaching Experience Compared to PMAT Score
Gender M SD n
Male Bachelors
Masters
Doctorate
3.92
3.82
3.75
.358
.386
.379
43
125
33
Female
Bachelors Masters
Doctorate
3.77 3.75
3.77
.376
.399
.362
61 170
27
Male
1‐10 years 11‐20 years
21‐30 years 30+ years
3.92 3.81
3.78 3.81
.340
.362
.346
.493
56 56
52 37
Female 1‐10 years
11‐20 years
21‐30 years 30+ years
3.80
3.82
3.80 3.58
.262
.394
.388
.432
50
59
92 57
Note. n = 459

81
Levene's test of equality indicated that homogeneity of variances assumption was
met (F = 1.277, p = .177). A statistically significant interaction was observed for the
full model, F = 1.997, df = 23, p = .004, as shown in Table 19. The partial eta squared
effect size for the interaction effect (η2 = .096) indicated that only 9.6% of the
variability of the responses to the PMAT could be explained by the three
independent variables. Based on Cohen's (1988) benchmark values, this represents
a medium effect size.
Following the significant interaction, simple main effects tests were
conducted to examine the differences among gender and years of teaching, gender
and degree, year and degree. This analysis indicated a statistically significant
difference between gender and year, F(3,458) = 2.919, p = .034, η2 = .020. There
was also a significant difference between year and degree, F(2,458) = 2.579, p =
.018, η2 = .034). However, no significant difference was observed between gender
Table 19 Factorial ANOVA (2 x 3 x 4) Results of Gender, Degree, and Years of Teaching
Sum of Squares df Mean Square F Sig.
Corrected Model Gender‐Year
Gender‐Degree
Year‐Degree Gender‐Degree‐Year
Total
6.541 1.247
.173
2.203 .481
68.477
23 3
2
6 6
458
.284
.416
.086
.367
.080
1.997 2.919
.607
2.579 .533
.004*
.034*
.546
.018* .760
Note. * p < .05, Gender‐Degree interaction was ns and third order interaction of Gender‐Degree‐Year was ns.

82
and degree, F(2, 458) = .607, p = .546 and there were no third order interaction
between gender, degree, and year, F(2,458) = .533, p = .760.
To further examine the differences among the three independent variables,
pair‐wise Tukey's LSD (Least Significant Difference) follow‐up tests were conducted.
This analysis yielded one statistically significant pair‐wise difference (see Figure 6).
For female teachers that have taught for thirty plus years tend to have a lower
perception of using technology for assessment than younger female teachers and
compared to male teachers. There was no significant difference based on years of
teaching for male teachers. The level of educational degree had no impact on the
teachers' attitudes in using technology‐assisted assessment tools.
Figure 6. Differences of Mean PMAT score by gender compared to years of teaching.
83
To answer question 4, the variables of gender, level of degree earned, and
years of teaching did provide a statistically significant interaction; however, the
effect size for the interaction effect (η2 = .096) indicated only a medium effect. A
closer examination determined a significant interaction based on PMAT scores
between gender and years of teaching as well as years of teaching and degree level.
There was no difference between gender and degree.
Additional Analysis
Based on the data analysis of research questions 3 and 4, the impact of
certain teacher and school variables were minimal on the impact of teachers'
attitudes towards technology‐assisted assessment tools. Within the PMAT portion of
the survey, three questions were closely examined to determine two other possible
confounding variables: time and resources. Refer to Table 20 for the descriptive
statistics of the three questions.
Two questions asked teachers about time needed for professional
development to learn technology‐assisted assessment tools and instructional time
in order to implement assessment strategies that use technology. A larger number
of the survey participants indicated that this was a definite need in order for the
teacher to put technology into practice. Professional development workshops
require time not only to learn the technology, but also to learn how to implement
technology into already established curriculum and lesson plans. The third question
addressed the lack of resources and the need for software to implement the
assessment strategies at their school. Teachers indicated this was even more of a
concern than the factor of time.

84
Table 20
Responses Concerning Time for Professional Development, Instructional Time, and Resources
Answer Options Strongly Disagree Disagree
No Opinion Agree
Strongly Agree
Rating Average
I wish I had more professional development time devoted to learning technology‐assisted assessment tools
8 36 117 208 97 3.75
I wish I had more time to learn and implement technology for assessment
4 29 51 237 145 4.05
I would use technology if I had the resources / equipment available
2 3 21 151 289 4.55
Note. n = 464
The researcher was interested if there was any difference of resources
available based on the size of school. When comparing the availability of resources
based on school setting (urban, suburban, rural), there was no significant difference,
F(2, 463) = .768, p = .465 (see Table 21).
Note. p > .05
Table 21 Oneway ANOVA of Urban, Suburban, and Rural to Technology Resources Available
Sum of Squares df Mean
Square F Sig.
Between Groups Within Groups Total
.660 198.200 198.860
2 461 463
.330
.430
.768
.465
85
Summary
The data collected for the four research questions in this study were
analyzed by comparing the dependent variable score of teachers' attitude (PMAT) to
actual technology and assessment practices. In order to describe the demographics
of the teacher participants for this study, descriptive statistics involving central
tendency, frequencies and percentages were utilized. The demographical categories
were gender, grade level, primary teaching assignment, years of teaching
experience, and level of education.
In examining the first research question, descriptive statistics were
employed to investigate which music teachers were using technology to assist with
daily classroom instruction and assessment practices. The data indicated that a
larger percentage of music teachers use technology to enhance instruction than
teachers who use technology to assist with assessment of student learning. Teachers
are also more inclined to use technology for assessment of performance skills than
of music content knowledge. Also, the most commonly used technology‐assisted
assessment strategy included music notation software and digital recording devices.
Research question two determined if music teachers' attitude in using
technology for assessment tends to be positive or negative. In using the PMAT score,
it was discovered that the general perception by music teachers in utilizing
technology to conduct assessments was positive. Using t‐tests, a statisical significant
difference was evident between a positive attitude score on the PMAT to a low
actual use of technology for instruction and assessment tools. There seems to be a
discrepancy between music teachers' positive perception of technology to the actual
86
use of technology in day‐to‐day assessment strategies.
Research question three explored the factors of school setting, primary grade
level of teaching assignment, and professional development opportunities on the
PMAT attitude score. No significant differences were found on a one‐way ANOVA
between school setting and grade level on attitude scores. In analyzing the effect of
professional development on attitude scores, four one‐way ANOVA tests were used.
A significant difference was found that teachers that have participated in mandatory
or voluntary school in‐service training scored higher on the PMAT attitude scale
compared to teachers that have not participated or were not sure if they
participated. The PMAT attitude score was also higher if a teacher voluntarily
participated in technology workshops or sessions or they had an opporunity to
learn how to use technology in their pre‐service training. However, there was a
noticable smaller number of research participants that indicated they learned how
to use technology for instruction and assessment in their pre‐service music
education degree.
For the final research question, a 2 x 3 x 4 factorial ANOVA was used to
examine the effects between gender, highest academic degree earned, and years of
teaching experience. This analysis indicated a statistically significant difference
between gender and year, and year and degree. However, no significant difference
was observed between gender and degree.
Additional descriptive analysis examined time for professional development
on learning technology‐assisted assessment tools, instructional time in order to
implement assessment strategies that use technology, and resources available to

87
music teachers. A larger number of survey participants indicated that more time and
availability of the needed technology resources are needed in order for music
teachers to feel comfortable in implementing technology‐assisted assessment
strategies. When comparing the availability of resources based on school setting
(urban, suburban, rural), there was no significant difference.

88
CHAPTER FIVE
SUMMARY, DISCUSSION, AND RECOMMENDATIONS
Summary
Educational reforms over the last two decades have refocused educators to
use data‐driven decisions in developing best practices in teaching. Assessment is a
key component of the instructional process; however, some educators still struggle
with using reliable and valid methods that provide accurate assessment of student
learning. Assessment data is indispensable to the teacher, student, parents, school,
and community not only in providing an objective measurement of acquired
knowledge and skill, but also in developing future learning experiences to enhance
student learning (Asmus, 1999). Outcomes are not always focused on individual
achievement; it also is a way to evaluate the effectiveness of a music program. Other
advocates for music assessment have emphasized that proper assessment may
provide evidence of musical growth, identify talented students, validate music
programs and teacher effectiveness, motivate students to learn, and provide
evidence of accountability (Boyle, 1992; Brophy, 2000).
The use of technology for teaching and learning has become an inquiry of
increased relevance in educational research. Debates about the effectiveness of
instructional technology on academic achievement and in the transformation of
teaching and learning techniques have spearheaded important discussions on this
subject (Cuban, 2001; Becker, 2000). Becker (2000) argued that when
constructivist‐oriented teachers have the necessary resources and have a

89
reasonable level of experience and skill in using computers, computers have proven
to be a valuable and well‐functioning instructional tool in the classroom.
Colwell (2002) noted that computer use in assessment holds considerable
potential if the music educator is willing to devote the time and resources in
developing assessment strategies that connect instruction, learning, and testing. The
use of technology for assessment can be useful to the teacher if the assessment tool
meets the goal of authentic assessment. However, the current literature does not
contain a body of research on the use of technology‐assisted tools for the purpose of
assessing music learning. Time, technology resources, and professional
development opportunities are just a few of the hurdles facing music educators in
using technology‐assisted assessment tools. The researcher's goal was to bridge the
gap between two bodies of current research concerning attitudes on assessment
and attitudes on music technology, and to investigate the factors that influence
music teachers' use of technology‐assisted assessment tools.
The Purpose
The purpose of this study was to examine K‐12 music educators’ attitudes
regarding the use of technology in the assessment of music learning.
Review of the Literature
The rationale for assessment is to determine how well students are learning.
Evidence of student learning will occur if instruction and assessment are integrally
related. The empirical research studies that have been conducted on music
assessment in elementary music (Barkley, 2006; Carter, 1986; Nightingale‐Abell,
1994; Tally, 2005) and secondary music (Hanzlik, 2001; Hill, 1999; Kancianic, 2006;

90
Kotora, 2005; McClung, 1996; McCoy, 1988; Russel & Austin, 2010; Sears, 2002;
Sherman, 2006; Simanton, 2000; Tracy, 2002) have characterized the usual trends
of music assessment approaches. Teacher demographics of teaching experience and
training have shown to have an influence on the use of different assessment
strategies (McCoy, 1991; Simanton, 2000) as well as teaching level and
specialization (Russell & Austin, 2010).
A common trend in music education indicates that assessment practices tend
to focus on informal and subjective grading standards including participation, effort,
attendance, and attitude (Barkley, 2006; Carter, 1986; McCoy, 1991; Nightingale‐
Abell, 1994; Russel & Austin, 2010). One of the challenges facing music educators is
the large size of classes that are quite typical, especially in a performance‐based
class. Consequently, performance‐based classes tend to grade on attendance,
practice records, and other non‐achievement standards whereas general music
classes in elementary and middle levels tend to focus on knowledge‐based and
achievement practices. However, the general literature in music education suggests
that assessing achievement based on extra‐musical skills should not be encouraged
(Abeles, Hoffer, & Klotman, 1994; Boyle & Radocy, 1987; Colwell, 2008; Hoffer,
1988; Lehman, 1992).
With the renewed focus on assessment and accountability, recent studies
have shown that there has been little progress in assessment strategies in music
(Russell & Austin, 2010; Johnson, 2008). Based on the fundamental principle of
learning theory, specific and prompt feedback needs to be provided to engage
student motivation and learning. The dichotomy between assessments of learning

91
typically used for grading and accountability purposes, and assessments for learning
used to engage and help students learn is at the heart of the issue (Stiggins, 2007). It
is crucial to have a balance of objective measures of student achievement as well as
a process that promotes student engagement in their own learning and self‐
reflection. Unfortunately, teachers tend to teach and assess the way they were
taught. Boyle and Radocy (1989) suggested, "with the increasing concern for quality
education in schools, there has been a growing need to identify quality teachers" (p.
221). Consequently, there is a real need for continued assessment training and
support in the music profession (Assey, 1999; Brookhart, 2001; McMunn, Schenck,
& McColskey, 2003; Mertler, 2004). This kind of training should occur in the pre‐
service teacher's undergraduate education, and it should also be evidenced in the
pre‐service sessions offered educational professionals in K‐12 school districts.
Music educators are experiencing a time of increasing technological
advancements in instructional and assessment methods. Recent studies in the use of
technology in music teaching have described trends in music educators' use of
technology (Bauer et al., 2003; Reese & Rimington, 2000; Taylor & Deal, 2000).
Research has shown that although there is a desire by the music teacher to learn
and use technology, there are a moderately low number of teachers that are actually
using technology in their classrooms. Two specific studies (Reese & Rimington,
2000; Taylor & Deal, 2000) found that most music educators using technology in
school (a range between 75% and 92%) are primarily doing so to complete
administrative tasks. Less than 30% of the music teachers indicated that they were
using technology for classroom instruction.

92
Based on the research by Bauer, Reese, and McCallister (2003) on technology
professional development, the factors of years of experience, academic degrees, and
areas of music teaching were found to be fairly neutral with some slight differences
in the gender variable. The authors explained that the differences in gender might
be related to self‐efficacy (Bauer, 2003) and familiarity (Fung, 2003) with
technology.
Investigations on technology training revealed a large majority of music
teachers (94%) displayed a desire to learn about technology (Reese & Rimington,
2000). However, only 25% of in‐service teachers indicated that technology training
was a part of their university teacher training programs and that only 13% of school
districts were offering more than one technology training session per year. Taylor
and Deal (2000) also found that there is a real need by music educators to
participate in technology training.
The theoretical model for this study was based on the conceptual framework
regarding attitudes and behavior developed by Fishbein and Ajzen (1975). This
framework was rooted in the concept that attitudes are based on established beliefs
and that beliefs are formulated by the experiences and knowledge of the individual.
The theory of reasoned action (TRA) was a continuation of Fishbein and Ajzen's
original work and has had considerable implications on consumer behavior
research especially in the area of information technology (Davis, 1989). This model
focused on a person's individual perception of the technology and its value and ease
of use. Davis (1989) defined perceived ease of use as the degree to which a person
believes that using a particular system or tool would be free from effort. Kaasinen

93
(2005) expanded the above framework to include trust and ease of adoption in the
Technology Acceptance Model for Mobile Services (TAMM). Trust indicated a positive
belief about the reliability of a technological tool. Ease of adoption was another
stage that the researchers found to have an effect on the decision to use technology.
A parallel statement can be made about music teachers' decision to use technology‐
assisted assessment tools in his or her music classroom. The perceived ease of use
and perceived value are two key factors in the decision‐making process of
determining to use an assessment tool. A teacher must also trust that the
assessment tool will do what it is intended to do. All these elements formed the
theoretical model for this study. (see Figure 7).
Figure 7. Theoretical model: Factors influencing the decision to use Technology‐Assisted Assessment Tools.

94
Between the two bodies of literature of assessment and technology, the
researcher discovered a gap in the research that specifically focused on technology‐
assisted assessment tools. There are a variety of technology‐assisted tools available
for music educators, but it is unclear how many educators are actually utilizing
these tools and whether they are incorporating these tools with instruction in order
to provide authentic assessment of music learning.
Procedure
This study was classified as a non‐experimental, quantitative method. An
online survey was developed and piloted by the researcher. A survey approach is a
frequently used research method designed to use data gathered from a group of
people to describe relationships (Abeles & Conway, 2010). The researcher designed
survey included six sections in the following order: (1) research study consent, (2)
use of instructional technology in music, (3) use of technology‐assisted assessment
tools (4) professional development, (5) teacher perceptions on music assessment
and technology (PMAT), and (6) demographics. Section two and three asked
questions about current and past experiences of using instructional technology and
assessment strategies. The attitude assessment portion of the survey was entitled
Perceptions of Music Assessment and Technology (PMAT) and it included 22 belief
statements with questions stated in both the negative and positive context.
Participants were asked to indicate their feelings about each belief statement on a
Likert scale ranging from Strongly Disagree to Strongly Agree. The score of five was
considered a high score for a question. A mean score higher than three was
considered a high score on the PMAT section.

95
The survey questions were modeled after other assessment studies found in
the literature in order to establish content validity. An initial pilot study of the
survey tool was conducted with a population of music educators from a local school
district (n = 38). The pilot participants were asked to provide feedback about the
survey. This helped establish both the reliability of the instrument and face validity
of the survey instrument. A panel of music education experts reviewed the final
version of the survey, and a second pilot study was run with a second group of
music teachers (n = 21). A factor analysis was conducted to examine the internal
consistency reliability of the instrument. The estimated coefficient of reliability (α =
.74) was found to be in the threshold of acceptability. Due to the fact this was a one
time pilot administration of the instrument that included a small sample of
participants, the reliability coefficient is an estimation of its internal consistency.
However, the data did provide the researcher with information about three
statements that had relatively low values. In comparing the three belief statements
to the feedback by the panel of experts, two statements were eliminated from the
survey increasing the estimated coefficient of reliability to (α = .76). Based on
further feedback by the panel concerning the third statement, it was determined
that it was an important statement to include within the PMAT section. Therefore,
with some changes in wording, it was included in the survey creating a final version
of the PMAT portion of the survey that included 22 belief statements.
The subjects for this study included 2,211 music educators that were MENC
members. MENC: The National Association of Music Education provided the
researcher a stratified, random sampling of K‐12, elementary, middle level, and high

96
school teachers that teach general music, vocal music, or instrumental music classes.
An a priori calculation of the required sample size was conducted with an alpha
level of .05 and a confidence level of ± .05. Assuming a normal response rate, it was
determined that a sample size of 327 completed surveys was needed.
After the researcher obtained campus Institutional Review Board approval
for this survey study, an email contact was initiated with each participant, which
included the description and purpose of the study as well as an invitation to
participate. At the completion of the survey, 492 responses were recorded. Twenty‐
eight respondents did not fully complete the survey, leaving a total of 464 usable
survey responses. After further investigation of the non‐response participants, 57
people were ineligible to participate in the study because they were no longer
teaching K‐12 music. Some of the participants emailed the researcher stating they
were no longer teaching at the K‐12 level because of a new teaching position at a
college or university or the teacher had recently retired. Eight participants simply
declined to participate and 152 participant emails were undeliverable.
Design and Results of the Study
In designing the study, the following four research questions were
formulated:
1. How many music educators are using technology‐assisted assessment tools and
what types of assessment tools are being utilized?
2. Is the attitude of music educators generally positive or negative toward using
technology in the assessment process?
3. How do school setting factors influence music educator's attitudes regarding the

97
use of technology in the assessment of music learning? This question was divided
into two parts
3a. Do certain types of professional development experiences influence
music educators’ attitudes towards using technology‐assisted
assessment tools?
3b. Do school setting and primary level of teaching assignment influence
music educators’ attitudes towards using technology‐assisted
assessment tools?
4. To what extent do music educator demographic factors of gender, level of
educational degree, and years of music teaching experience influence their attitudes
about technology‐assisted assessment tools?
A summary of the demographic information described the population of
music teachers that utilize technology‐assisted assessment tools in music
instruction. The description of the music content areas that the participants were
teaching was very typical of a large school district with 60.3% participants teaching
elementary general music, 44.7% teaching choir, 42.7% teaching band, and 12.9%
teaching strings. Participants described additional teaching areas such as guitar and
music appreciation classes on a free‐response question. The grade level
classification was fairly uniform with 30.3% of the participants teaching elementary,
16.7% teaching middle level, 29.4% teaching high school, and 23.2% of the
participants indicated they were teaching multiple grades. School setting included
26.6% teaching in an urban school, 50.4% teaching in a suburban school, and 22.5%
teaching in a rural school. Personal teacher demographical information included

98
gender, 43.3% were males and 55.6% were females; and the number of years of
teaching experience included 22.7% teaching 1‐10 years, 25.1% teaching 11‐20
years, 31.1% teaching 21‐30 years, and 20.6% teaching 30 or more years. The
highest professional degree earned by individual participants was Bachelors at
22.7%, Masters at 63.9%, and Doctorate at 12.9%.
Research Question 1: How many music educators are using technology
assisted assessment tools and what types of assessment tools are being utilized?
Simple descriptive statistics determined the number of music educators using
technology as a part of their assessment strategies as well as described the types of
assessment tools the teachers were actually using in their music classroom. Based
on the data of Table 3 in Chapter 4, it was evident that music teachers tend to feel
more comfortable in using technology for instruction than for assessment strategies.
Only 20.4% of the respondents indicated their school required the use of some type
of technology‐assisted assessment tool. It was unclear based on this question
whether that response indicated only the use of an online grade book or an actual
assessment tool.
In an open‐ended question, the music teachers indicated the types of
technology most commonly used for assessment: (a) digital recordings of
performance skills, 51.9%; (b) music notation software, 70.5%; (c) web‐based
assessments, 34.3%; interactive whiteboards, 36.9%; and (d) web‐based portfolios,
11%. Finale (63%) and Sibelius (41.2%) were the most widely used software
programs in designing music assessments. Recording performance skilled‐based
assessments were achieved by using handheld digital recorders such as the

99
Olympus Series and Zoom H‐2/H‐4 models or software programs such as
SmartMusic. Handheld recording devices constituted 51.6% of teacher use whereas
software programs had a smaller and more specific teacher use: SmartMusic
(32.1%), GarageBand (39.1%), Audacity (33.5%), and iPas (2.9%).
Research question 2: Is the general attitude of music educators positive or
negative toward using technology for assessment? Descriptive and inferential
statistics were used to answer this baseline question. Responses over the set of 22
perception questions on the PMAT provided a cumulative attitude score, which
served as the dependent variable for this study. It is noted that all 22 questions
within this section intended to measure the unidimensional construct of teacher
attitudes. For this data set, the M = 3.79 with a SD = .387 indicated that the general
attitude of the teachers completing the survey was positive towards assessment in
music and in utilizing technology to conduct assessments.
Three questions were asked regarding whether the music teacher uses
technology to enhance instruction, uses technology to assist with performance‐
based skill assessments, and uses technology to assist with the assessment of music
content knowledge. The teachers were asked to select one of four answers that best
described the amount of use of technology under each caption; regularly (every
lesson), sometimes (3 to 4 times a week, but not for every lesson), occasionally (a
few times a month), and never.
For each question, a one‐way analysis of variance (ANOVA) was used. All
ANOVA assumptions of independence, normality, randomness, and homogeneity‐of‐
variance were met. The omnibus F‐test from the ANOVA indicated a statistically

100
significant difference between the PMAT attitude score and technology use to
enhance instruction (F(3, 460) = 30.920, p = .0001). The partial eta squared effect
size for this analysis, ηp2 = .170 indicated a large effect size (Cohen, 1988).
Significant differences between groups were examined using a post‐hoc test.
Employing a post‐hoc Tukey's HSD (Honestly Significant Differences) test, the
significant differences occurred between the teachers who responded regularly with
all other categories, and those who responded sometimes with those who responded
occasionally.
For the question concerning technology use to conduct performance skill
assessments compared to PMAT score, there was a significant difference (F(3, 460) =
44.24, p = .0001). The partial eta squared effect size for this analysis, ηp2 = .224, is
larger than Cohen's benchmark (1988) for a large effect size (.14). Using Tukey's
HSD, the significant differences occurred among teachers who responded regularly
and sometimes with occasionally and never and those who responded with
occasionally and never were significant with all three options.
For the question concerning technology use for assessment of music content
knowledge, an omnibus F‐test from the ANOVA indicated a statistically significant
difference in responses to the PMAT based on the four response options of the
question (F(3, 460)= 31.412, p = .0001). The partial eta squared effect size for this
analysis, ηp2 = .170 indicated a large effect size. Once again using Tukey's HSD, a
post‐hoc analysis indicated that the differences occurred among teachers who
responded regularly and sometimes with occasionally and never, and those who
responded with occasionally and never were significant with all three options.

101
The researcher conducted an additional analysis comparing the PMAT scores
with specific types of technology that teachers indicated on the survey. Independent
sample t‐tests were conducted using the PMAT score with each question in section
three of the survey about the types of assessment tools most commonly used. All t‐
tests were significant disclosing that music teachers' relative positive perception in
using technology to assist with assessment is not being realized in actual day‐to‐day
assessment strategies.
Research question 3: How do school setting factors influence music
educator's attitudes regarding the use of technology in the assessment of music
learning?
3a. Do certain types of professional development experiences influence music
educators’ attitudes towards using technologyassisted assessment tools?
3b. Do school setting and primary level of teaching assignment influence music
educators’ attitudes towards using technologyassisted assessment tools?
This question was divided into two parts: the influence of professional development
on attitude, and the influence of the factors of school setting and primary level of
teaching assignment on attitude. A one‐way ANOVA was conducted for each
question concerning professional development participation. All ANOVA
assumptions of independence, normality, randomness, and homogeneity of
variances were met. An omnibus F‐test determined a statistically significant
difference on three of the four professional development options.
It was determined that teachers who participated in mandatory or voluntary
school in‐service training scored higher on the PMAT attitude scale compared to

102
teachers who have not participated or were not sure if they participated. The PMAT
attitude score was also higher if a teacher voluntarily participated in technology
workshops or sessions or they had an opportunity to learn how to use technology in
their pre‐service training. However, there were a noticeable smaller number of
research participants that indicated they learned how to use technology for
instruction and assessment in their pre‐service music education degree.
The second part of research question three focused on school setting (urban,
suburban, rural) and primary level of teaching assignment (elementary, middle
school, high school, and mixed grade). A 3 x 4 factorial ANOVA was used to examine
the effects between school setting and primary level of teaching on teachers'
attitude. There was no significant difference observed, F(11, 463) = 1.342, p = .198).
Research question 4: To what extent do music educator demographic factors
of gender, level of educational degree, and years of music teaching experience
influence their attitudes about technologyassisted assessment tools? This question
had three main subsets: (a) years of music teaching experience, (b) level of
educational degree, and (c) gender. A 2 x 3 x 4 factorial ANOVA was used to examine
the influences between all teacher variables: gender (male and female), highest
academic degree earned (bachelors, masters, doctorate), and years of teaching
experience (1‐10 years, 11‐20 years, 21‐30 years, and more than 30 years). Levene's
test of equality indicated that homogeneity of variances assumption was met (F =
1.277, p = .177). A statistically significant interaction was observed for the full
model, F = 1.997, df = 23, p = .004.
The partial eta squared effect size for the interaction effect (η2 = .096)

103
indicated that only 9.6% of the variability of the responses to the PMAT could be
explained by the three independent variables. Based on Cohen's (1988) benchmark
values, this represents a medium effect size.
In utilizing a pair‐wise Tukey's LSD follow‐up test, one statistically significant
pair‐wise difference was discovered. Female teachers that have taught for thirty
plus years tend to have a lower perception of using technology for assessment than
younger female teachers. There was no significant difference based on years of
teaching for male teachers. Finally, the level of educational degree had no impact on
the teachers' attitudes in using technology‐assisted assessment tools.
Based on the data analysis of research questions 3 and 4, the impact of
certain teacher and school variables were minimal or non‐existent in the impact of
teachers' attitudes towards technology‐assisted assessment tools. Within section
five, three questions were closely examined to determine two other possible
confounding variables; time and resources.
Two questions asked the teacher about required time for professional
development on learning technology‐assisted assessment tools and instructional
time in order to implement assessment strategies that use technology. A larger
number of survey participants indicated that this was a definite need in order for
the teacher to put technology into practice. The third question addressed the lack of
resources, the need for technology to implement the assessment strategies at their
school. This goes without saying that without the appropriate technological
equipment, teachers will not be able to implement the variety of assessment
strategies that would enhance their curriculum. However, the variable of resources

104
is impacted by various outside factors such as budget constraints or school policies,
which are simply out of the control of a teacher's influence unless the teacher is
willing to spend the time researching alternative funding options.
Discussion
The participant response rate to this survey study was small; therefore,
caution must be exercised in generalizing the results. It is also noted that even
though steps were implemented to reduce survey response bias, it is quite possible
for teachers who feel comfortable using technology in their daily lives to be more
willing to complete a survey about technology. On the other hand, teachers that are
extremely uncomfortable with the use of technology might conclude they would
have nothing to offer, therefore, chose to not participate in the survey. But in context
of the research questions for this study, the researcher is confident that the attitude
scores on the PMAT reflect the participants' perceptions on technology‐assisted
assessment tools.
The music teachers' overall attitude towards assessment and in using
technology tools to assist with assessing students was positive. By comparing what
factors might influence their attitude scores, it was discovered that specific school
and teacher factors had a generally small influence on their perceptions.
Research Question 1
With regard to the findings of research question 1, it was evident that music
teachers are utilizing technology for daily instruction more than for assessment. The
actual use of technology by music teachers is still moderately low; a trend that has
not significantly changed from previous research (Reese & Rimington, 2000; Taylor

105
& Deal, 2000). Unless the music teacher has established the role of formative
assessments as checking for understanding, the number of teachers using technology
for assessment on a regular basis (every lesson) will be low. However, the last two
categories of occasionally (only a few times a month) or never were considerably
higher for assessment than for instruction indicating that very few music teachers
are using technology to help with assessment. The types of assessment tools that are
utilized by music teachers tend to be notation software and digital recording
devices. Teachers described using notation software in making quizzes or tests
based on music knowledge content as well as performance excerpts either for a
face‐to‐face assessment or in conjunction with SmartMusic. Implementation of new
technologies, such as interactive whiteboards or web‐based tools such as rubrics
and e‐portfolios, is still developing within the music education profession.
Research Question 2
The second research question about the perceptions of music teachers
towards assessment and music technology compared to the actual use of technology
indicated positive relationships. As might be expected, music teachers that tend to
use instructional technology and technology‐assisted assessment tools on a regular
basis had a higher score on the PMAT. Even so, teachers that indicated that they
never use technology scored above the attitude mean. In general, music teachers
positively perceive the value of using certain technology‐assisted assessment tools
to assist them in assessing students. However, the actual implementation is not
being realized in the music classroom. The function of assessment is to gather data
about whether students are learning. There are various methods of achieving this

106
purpose, but with the wealth of technology available to teachers, the goal is to use
the technology‐assisted tools that can effectively and efficiently gather student data.
The perceived value of using technology‐assisted assessment tools by teachers is at
odds with the actual implementation. This is a contradiction to earlier research in
which teacher beliefs were stronger predictors of decisions and behavior than skills
and knowledge (Pajares, 1992). A probable cause of this phenomenon is the lack of
resources and training on how to effectively incorporate available technology tools
to enhance instruction and assessment.
Research Question 3
The third research question pertained to the school factors that influence
teacher's attitudes. In‐service teachers who participate in professional development
either within their school or on personal time scored significantly higher than those
teachers that have not participated in technology workshops. When teachers have
the option to select and participate in workshops that they are interested in, their
attitude score tends to be higher. The technology workshops that are the one topic
fits all design, which is the case in most school staff development workshops, usually
will not meet the needs of all teachers. The cafeteria plan in which teachers are able
to voluntarily enroll in workshops that serve their specific needs in learning
technology will more likely have a larger impact on whether or not the specific
technology will be incorporated into daily teaching strategies (Frank, Zhao, &
Borman, 2004; Riel & Becker, 2000). There is also a level of creativity that must
occur on part of the teacher in designing assessments using the resources that are
available to them. Innovative approaches of using technology to fit the specific goals

107
of instruction should be encouraged as well as shared as a best practice strategy
with other educators.
The number of teachers indicating that they participated in a college pre‐
service training on technology was significantly lower than in‐service training. It is
obvious teachers that have taught fifteen or more years would have experienced
different technological trends in college music education courses compared to
present trends. Based on recent graduate responses, there seems to be a lack of
music technology classes that include using technology‐assisted assessment tools in
college music education curricula. This is not to say that a dedicated music
technology course is absent in the requirements for baccalaureate graduation, but
the connection of utilizing technology to enhance music instruction and to assist
with assessment does not appear to receive the emphasis.
The second part of question three focused on the effects of school setting and
grade level in which there was no significant effect. The school setting and primary
grade level of teaching assignment had little impact on a teacher's attitude towards
using technology for assessment, which supports previous research concerning
instructional technology (Bauer et al., 2003).
Research Question 4
The final research question addressed the teacher factors of gender, highest
degree earned, and years of teaching experience on attitude scores. There was a
significant difference between all three factors, however, it is important to note that
the effect size was less than .10, which suggests that only a small portion of the
variability is based on these contextual variables. There was a significant difference

108
between male and female attitude scores. Nonetheless, that trend has continued to
narrow over time between gender, as was stated by Folkestad (2007). A closer look
at the data indicated that the significant difference occurred between female
teachers that have taught the longest with younger female and male teachers. There
were no significant differences in attitude scores for males based on years of
experience. In addition, the influence of the highest educational degree had no
influence on the teachers' attitude scores. This supports previous research by Bauer,
Reese, and McCallister (2003) in which technology professional development, the
factors of years of experience, academic degrees, and areas of music teaching were
found to be fairly neutral with some slight differences in the gender variable. The
absence of these relationships could be considered good news for instructional
leaders in designing technology workshops. Since the findings from this study
confirms that the variables mentioned above have little impact on teachers'
attitudes, future studies should focus more on the development of effective models
and frameworks in the learning of instructional and assessment technologies.
Once the main contextual variables of certain school and teacher factors
were found to have little to no impact on attitude scores, alternative factors of time
and resources were examined. There are two influences of time that seem to impact
a teacher's actual use of technology for assessment; time to learn the technology and
class time to implement the technology. Various methods of professional
development have been researched on general educational topics. Moore (2009)
indicated that teacher participants in a technology workshop reported what was
personally applied and individually practiced was learned best. Furthermore,

109
teachers who have successfully integrated technology in the classroom have
reported experiencing professional development opportunities that provided a
sound pedagogical approach to understanding how to use technologies to connect
curriculum and standards (Penuel, 2006).
Besides instructional technology training and support, the availability of
financial resources in schools has had an obvious impact on teachers' use of
technology (Bauer, et al, 2003). Participants of this study also indicated that this is a
major hurdle in the infusion of technology into music instruction. Teachers that are
utilizing various technologies sometimes find outside financial resources to do so
either by grants from local support groups such as PTO or music booster
organizations, or by competitive state and national grants for innovative teaching
practices. An example of a common financial resource for technology projects is
state lottery funds. In many cases, music teachers are unaware of simple assessment
strategies that may be implemented using free or already existing software
programs. Consequently, professional development training should include not only
best practices of technologies that are free or relatively inexpensive, but also
funding suggestions and grant writing resources.
Implications for Music Education
In order to narrow the gap between the positive perceptions by teachers in
using technology‐assisted assessment tools and the actual day‐to‐day integration of
the technology, continued training and support is required. This need for
professional development on music assessment has been supported by previous
research (Assey, 1999; Brookhart, 2001; McMunn, Schenck, & McColskey, 2003;

110
Mertler, 2004). With the current technological trends, however, professional
training must expand to include useful and available technology that will support
the teachers' efforts in assessment. Best practices of various technology supported
assessment strategies must be researched, modeled, and implemented.
Assey (1999) provided one of the first models of technology training used for
in‐service teachers. He asserted that arts educators must first learn how to use the
hardware and software followed by training on how to enhance lesson plans that
integrate this new technology. This is assuming there is a well‐designed curriculum
established and the goal of the teacher is to discover ways to teach and assess by
incorporating technology. Learning technology tools in music should not be any
different than how a musical instrument is learned. The key component of this
framework is the amount of time provided in between workshop sessions to
practice using the new technologies. Once the teacher has developed a sense of
familiarity with the new software/hardware, the next crucial step is to train
teachers how to use technology to support the goals of the lesson plan and
assessment method. Teachers must work to develop, utilize, and evaluate
technology‐enhanced authentic assessments that are aligned to the learning goals of
the lesson. In order for the actual use of technology to occur, the following must be
present: (1) time to learn, (2) time to practice, (3) time to develop, and (4) time to
evaluate for effectiveness.
Considering the low number of music teachers that indicated they received
training on the use of technology for assessment in their undergraduate pre‐service
training, a reevaluation of how music technology is taught in higher education is

111
warranted. For teacher training programs in higher education, a pedagogical shift
from the stand‐alone technology classes to incorporating technology with the
general methods courses is a possible solution. One particular model provides a
music technology class or instructional technology class as a singleton, a separate
course that focuses solely on learning how to use various technology tools. Another
model incorporates the use of instructional and assessment technology strategies
into the method courses so that teachers learn how particular technology tools may
support the teaching and assessment of music concepts. This will establish a sense
of familiarity with how to use technology in conjunction with teaching and
assessment, not as an additional and separate component. Finally, student teachers
should demonstrate their understanding of assessment practices with support of
technology in their practicum experiences. Future teachers must understand the
potential of various technologies, have opportunities to learn how to use them, and
be given time to experiment enhancing instructional and assessment strategies with
technology prior to entering the profession.
Although younger teachers tend to be more comfortable in the use of a
variety of technologies, it is during their formative years as a new teacher that they
tend to rely on the way they were taught when they were in public school. In light of
the social networking phenomenon of recent years, new teachers must shift their
thinking on how technologies are used from a personal setting to an educational and
professional setting. Therefore, deciding what type of framework in pre‐service
training would provide a long‐lasting commitment and understanding of how to use
technology to enhance instruction and assessment is important. Developing

112
confidence within teachers is an important construct between professional
development and the implementation of various types of technology in assessment
(Russel & Austin, 2010). If the music teaching profession is to evolve
technologically, undergraduate music education programs must also be willing to
evolve to focus on technology‐enhanced instruction. It is essential that higher
education take the lead in modeling technology‐supported music instruction in
preparing future teachers.
Suggestions for Future Study
The ubiquitous nature of technology within music instruction combined
with the necessity to provide authentic assessment of student learning requires that
music educators be engaged in both professional learning and curriculum
development that incorporates technology‐assisted assessment tools into the
curriculum. Suggestions for future study on this topic include the following:
1) Due to the fact that assessment research and the development of new technology
will continue, future research on best practices of technology‐assisted assessment
tools will be warranted.
2) Continued development of the Perception on Music Assessment and Technology
(PMAT) survey instrument used for this study will help establish test‐retest
reliability of the instrument for future studies.
3) Replication of this study with a new sampling of music teachers will be essential
to substantiate the results as well as track trends in teacher training and infusion of
technology‐assisted assessment tools into music instruction.
113
4) Longitudinal study exploring a pre‐service training model that provides a
sustained use of technology in the classroom by in‐service teachers is needed to
develop a theory of sustained technology use.
5) Studies on effective in‐service technology training models is needed to promote
full‐time technology integration and usage by music educators.
Technology can change the way content is delivered in the classroom and
increase teachers' ability to individualize instruction and engage students (Pitler,
Hubbell, Kuhn, and Malenoski, 2007). A consistent effort in developing best
practices in the use of technology‐assisted assessment tools in music is needed to
guide teachers from a positive perceived value and intended use of technology to the
actual use of the technology in classroom instruction. This effort should include the
collection and analysis of data to determine best practice effectiveness. Further, the
effort should be led by innovative teachers and forward‐thinking educational
leaders in both K‐12 schools and in higher education in order to prepare effective
teachers for the ever‐changing challenges of the 21st century.

114
REFERENCES
Abeles, H. F. (2010). Assessing music learning. In H. F. Abeles & L. A. Custodero,
(Eds.), Critical issues in music education (pp. 167‐193). New York, NY: Oxford
University Press.
Abeles, H. F., & Conway, C. (2010). The inquiring music teacher. In H. F. Abeles & L.
A. Custodero, (Eds.), Critical issues in music education (pp. 276‐302). New
York, NY: Oxford University Press.
Abeles, H. F., Hoffer, C. R., & Klotman, R. H. (1994). Foundations of Music Education,
2nd Ed. New York, NY: Schirmer Books.
Adams, G. S. (1982). Attitude measurement. In H. E. Mitzel (Ed.), Encyclopedia of
educational research (5th ed., pp 180‐189). New York: The Free Press.
Al‐Ajmi, M. M. (1995). Teachers' attitudes toward creativity and their instructional
behaviors in the classroom. Abstract from: ProQuest File: Dissertations
Abstracts. (Publication No. AAC 9507355)
Asmus, E. P. (1999). Music assessment concepts. Music Educators Journal, 86(2), 19‐
24.
Assey, J. (1999, December). The future of technology in K12 arts education. Paper
presented at the Forum on Technology in Education: Envisioning the Future.
Proceedings in Washington D.C. (ERIC Document Reproduction Service No.
ED 452 847)
Backstrom, C. H., & Hursh, C. G. (1981). Survey Research (2nd ed.). New York: Wiley.
Barbour, M. K., & Reeves, T. C. (2009). The reality of virtual schools: A review of the
literature. Computers and Education, 52(2), 402‐416.
115
Barkley, M. (2006). Assessment of the national standards for music education: A
study of elementary general music teacher attitudes and practices. M.M.
dissertation, Wayne State University, United States, Michigan. Retrieved from
Dissertations & Theses: A&I. (Publication No. AAT 1439697)
Barry, N. (2003). Integrating web based learning and instruction into a graduate
music education research course: An exploratory study. Journal of
Technology in Music Learning, 2(1), 2‐8.
Bauer, W. I. (1999). Music educators and the Internet. Contributions to Music
Education, 26(2), 51‐63.
Bauer, W. I. (2003). Gender differences and the computer self‐efficacy of pre‐service
music teachers. Journal of Technology in Music Learning, 2(1), 9‐15.
Bauer, W. I., & Daugherty, J. F. (2001). Using the Internet to Enhance Music Teacher
Education. Journal of Music Teacher Education, 11(27), 27‐32.
Bauer, W. I., Reese, S., & McAllister, P. A. (2003). Transforming music teaching via
technology: The role of professional development. Journal of Research in
Music Education, 51(4), 289‐301.
Becker, H. J. (2000). Findings from the Teaching, Learning, and Computing survey: Is
Larry Cuban Right? Retrieved from
http://crito.uci.edu/papersAuthorBecker.asp
Bernard, R. M., Abrami, P. C., Lou, Y., Borokhovski, E., Wade, A., Wozney, L., Wallet,
P. A., Fiset, M., & Huang, B. (2004). How does distance education compare to
classroom instruction? A meta‐analysis of the empirical literature. Review of
Educational Research, 74(3), 379‐439.

116
Bowles, C. (2003). The self‐expressed professional development needs of music
educators. UPDATE: Applications of Research in Music Education, 21(2).
Boyle, J. D. (1992). Evaluation of music ability. In R. Colwell, (Ed.), Handbook of
research on music teaching and learning (pp. 247‐265). New York: Schirmer
Books.
Boyle, J. D., & Radocy, R. E. (1987). Measurement and evaluation of music
experiences. New York: Schirmer Books.
Bridgham, R. G. (1973). Grading and enrollments in the sciences. Science Teacher,
40(6), 41–42.
Brookhart, S. M. (2001, March). The "standards" and classroom assessment research.
Paper presented at the annual meeting of the American Association of
Colleges for Teacher Education, Dallas, TX. (ERIC Document Reproduction
Service No. ED 451189)
Brophy, T. (2000). Assessing the developing child musician. Chicago: GIA Publications,
Inc.
Byrne, C., & MacDonald, R. (2002). The use of information & communication
technology (I &CT) in the Scottish music curriculum: A focus group
investigation of theses and issues. Music Education Research, 4(2), 263‐273.
Cain, T. (2004). Theory, technology, and the music curriculum. British Journal of
Music Education, 21(2), 215‐221. doi:10.1017/S0265051704005650
Carter, K. G. (1986). The status of vocal/general music programs in Oklahoma
elementary schools. Dissertation Abstracts International, 47, 3349A.

117
Cavanaugh, C. S., Barbour, M. K., & Clark, T. (2009). Research and practice in K–12
online learning: A review of open access literature. International Review of
Research in Open and Distance Learning, 10(1).
Cohen, J. (1988). Statistical power for the behavioral sciences (2nd ed.). Hillsdale, NJ:
Erlbaum.
Colwell, R. (Ed.) and Music Educators National Conference (1992). Handbook of
research on music teaching and learning. New York, NY: Schirmer Books.
Colwell, R. (2002). Assessment's potential in music education. In R. Colwell and C.
Richardson, (Eds.), The new handbook of research on music teaching and
learning (pp. 1128‐1158). New York: Oxford University Press, Inc.
Colwell, R. (2008). Music assessment in an increasingly politicized accountability‐
driven educational environment. In T. S. Brophy (Ed.), Assessment in Music
Education: Integrating Curriculum Theory, and Practice. Proceedings of the
2007 Florida Symposium on Assessment in Music Education (pp. 29‐36).
Chicago: GIA.
Comber, C., Hargreaves, D. J., & Colley, A. (1993). Girls, boys and music technology in
music education. British Journal of Music Education, 10, 123‐134.
Conway, C. M. (Spring, 2008). Experienced music teacher perceptions of
professional development throughout their careers. Bulletin of the Council for
Research in Music Education, 176, 7‐18.
Creasy, K. D. (1997). The effects of experiential activities designed to heighten
aesthetic responsiveness on the aesthetic experiences of college choral
ensemble members. (Doctoral dissertation, The University of Nebraska‐

118
Lincoln). Retrieved from
http://digitalcommons.unl.edu/dissertations/AAI9929192
Cuban, L. (2001). Oversold & underused: Computers in the classroom. Cambridge, MA:
Harvard University Press.
Cutietta, R. A. (1992). The measurement of attitudes and preferences in music
education. In R. Colwell, (Ed.), Handbook of research on music teaching and
learning (pp. 295‐309). New York: Schirmer Books.
Davis, F. D. (1989). Perceived usefulness, perceived ease of use, and user acceptance
of information technology. MIS Quarterly, 13(3), 319‐340.
Dietrich, D. (1973). Grading practices of high school physics teachers: A contributing
factor to declining enrollments in physics? Science Education, 57, 25–29.
Dilger, S. C., & Roland, D. C. (1993). Preparing students for the twentyfirst century:
A rationale for integrating new technology into school arts programs.
Retrieved from ERIC database. (ED393729)
Dillman, D. A., Smyth, J. D., & Christian, L. M. (2009). Internet, Mail, and Mixed Mode
Surveys: The Tailored Design Method. Hoboken, New Jersey: John Wiley &
Sons, Inc.
Duffy, T., & Johassen, D. (1992). Constructivism and the technology of instruction: A
conversation. Hillsdale, NJ: Lawerence Erlbaum Associates.
Fishbein, M., & Ajzen, I. (1975). Belief, Attitude, Intention, and Behavior. Ready, MA:
Addison‐Wesley Publishing Company.
Fautley, M. (2007). Assessment for Learning in Music. In J. Evans and C. Philpott.
(Eds.), A practical guide to teaching music in the secondary school (pp. 63‐72).

119
Routledge, New York.
Fischer, R. J. (1977). Toward a more comprehensive measurement of intergroup
attitudes: An interview and rating procedure. Canadian Journal of Behavioral
Science, 9, 283‐294.
Flanigan, G. P. (2008). An investigation of the effects of the use of SmartMusic
software by brass players on intonation and rhythmic accuracy (Doctoral
dissertation). Available from ProQuest Dissertations and Theses database.
(AAT 3401785)
Flohr, J. W., & Meeuwsen, H. J. (2001). Validity of rhythm timing software with college
age adults. Technological Directions in Music Education: Institute for Music
Research, University of Texas at San Antonio, 1‐4.
Folkestad, G. (2007). Technology and Music Education in Sweden. In L. Bresler (Ed.).
International Handbook of Research in Arts Education, (pp. 1329‐1330).
Springer.
Folkestad, G., Comber, C., Hargreaves, D. J., & Colley, A. (1996). Gender, computers,
music technology: Experience and attitudes (NO. 1996:06): Goteborg:
Goteborg University, Department of Education and Educational Research.
Frank, K. A., Zhao, Y., & Borman, K. (2004). Social capital and the diffusion of
innovations within organizations: Application to the implementation of
computer technology in schools. Sociology of Education, 77(2), 148–171.
Fung, C. V. (2003). Gender differences in preservice music educators' familiarity
with technology. Journal of Technology in Music Learning, 2(1), 31‐40.
Glenn, S. (2000). The effects of a situated approach to musical performance

120
education on student achievement: Practicing with an artificially intelligent
computer accompanist. Dissertation Abstracts International, 61(8), 3098.
Glenn, S., & Fitzgerald, M. (2002). Technology and student attitudes, motivation, and
self‐efficacy: A qualitative study. NAXWPI Journal, (Fall), 4‐15.
Grant, C. M. (1996). Professional development in a technological age: New
definitions, old challenges, new resources. In A. Feldman (Ed.), Technology
infusion and school change: Perspectives and practices. Cambridge, MA: TERC
Research Monograph. Retrieved from
http://lscnet.terc.edu/do.cfm/paper/8089/show/use_set‐tech
Hanzlik, T. J. (2001). An examination of Iowa high school instrumental band
directors' assessment practices and attitudes toward assessment (Doctoral
dissertation). Dissertation Abstracts International, 62, 955A.
Hickey, M., & Webster, P. (1999). MIDI‐Based adaptation and continued validation of
the Measures of Creative Thinking in Music. Bulletin of the Council of Research
in Music Education, 142, 93‐94 (Abstracts).
Hill, K. W. (1999). A descriptive study of assessment procedures, assessment
attitudes, and grading policies in selected public high school band
performance classrooms in Mississippi (Doctoral dissertation). Dissertation
Abstracts International, 60, 1954A.
Ho, W. (2004). Attitudes towards information technology in music learning among
Hong Kong Chinese boys and girls. British Journal of Music Education, 21(2),
143‐161.

121
Hoffer, C. R. (2008). Issues in the assessment of K‐12 music instruction. In T. S.
Brophy (Ed.), Assessment in Music Education: Integrating Curriculum Theory,
and Practice. Proceedings of the 2007 Florida Symposium on Assessment in
Music Education (pp. 29‐36). Chicago: GIA.
Hookey, M. (2002). Professional development. In R. Colwell and C. Richardson,
(Eds.), The new handbook of research on music teaching and learning (pp.
887‐902. New York: Oxford University Press.
ISTE. (2008). NETS for teachers. Retrieved October 10, 2010 from
http://www.iste.org/standards/nets‐for‐teachers.aspx
Johnson, R. (2008). Overcoming resistance to achievement‐based unit grading in
secondary physical education. Journal of Physical Education, Recreation &
Dance, 79(4), 46–49.
Johnson, L., Levine, A., Smith, R., & Stone, S. (2010). The 2010 Horizon Report.
Austin, Texas: The New Media Consortium.
Jonassen, D. H., Peck, K. L., & Wilson, B. G. (1999). Learning with technology: A
constructivist perspective. Upper Saddle River, NJ: Prentice Hall.
Kaasinen, E. (2005). User acceptance of mobile services – value, ease of use, trust
and ease of adoption, VTT‐Publications 566Espoo, Finland.
Kancianic, P. M. (2006). Classroom assessment in United States high school band
programs: Methods, purposes, and influences (Doctoral dissertation)
Available from Dissertations & Theses: A&I. (Publication No. AAT 3222315)
Kerlinger, F. N. (1979). Behavioral research: A conceptual approach. New York: Holt,
Rinehart, and Winston.

122
Kershaw, I. (1994). Ohio vocational education teachers' perceived use of student
assessment information in educational decisionmaking. Abstract from
ProQuest File: Dissertations Abstracts Item: AAC9411987
Kotora, E. J. (2005). Assessment practices in the choral music classroom: A survey of
Ohio high school choral music teachers and college choral methods
professors. Contributions to Music Education, 32, 65‐80.
Kratus, J. (2007). Music education at the tipping point. Music Educators Journal,
94(2), 42‐48.
Kuhn, T. L. (1980). Instrumentation for the measurement of music attitudes.
Contributions to Music Education, 8, 2‐38.
Lehman, P. R. (1999). National assessment of arts education: A first look. Music
Educators Journal, 84(4), 34‐37.
Lee, E. (2007). A study of the effect of computer assisted instruction, previous music
experience, and time on the performance ability of beginning instrumental
music students (Doctoral dissertation). Retrieved from
http://digitalcommons.unl.edu/dissertations/
Machtmes, K., & Asher, J. W. (2000). A Meta‐Analysis of the Effectiveness of
Telecourses in Distance Education. American Journal of Distance Education,
14(1), 27‐46.
Marzano, R. J., & Kendall, J. S. (2007). The new taxonomy of educational objectives
(2nd ed.). Thousand Oaks, CA: Corwin.
Marzano, R. J., Pickering, D. J., & Pollock, J. E. (2001). Classroom instruction that
works: Researchbased strategies for increasing student achievement.

123
Alexandria, VA: Association of Supervision and Curriculum Development.
Matzen, J. N., & Edmunds, J. A. (2007). Technology as a catalyst for change:
The role of professional development. Journal of Research on Technology in
Education, 39(4), 417–430.
McClung, A. C. (1996). A descriptive study of learning assessment and grading
practices in the high school choral music performance classroom (Doctoral
dissertation). Dissertation Abstracts International, 57, 3437A.
McCoy, C. W. (1988). Grading students in performing groups: A comparison of
principals' recommendations with directors' practices. Journal of Research in
Music Education, 39, 181‐190.
McCoy, C. W. (1991). Grading students in performing groups: A comparison of
principals' recommendations with directors' practices. Journal of Research in
Music Education, 39, 181‐190.
McMunn, N., Schenck, P., & McCloskey, W. (2003, April). Standardsbased assessment,
grading, and reporting in classrooms: Can district training and support
change teacher practice? Paper presented at the annual meeting of the
American Educational Research Association, Chicago, IL. (ERIC Document
Reproduction Service NO. ED 475763)
Mertler, C. A. (2004). Secondary teachers' assessment literacy: Does classroom
experience make a difference? American Secondary Education, 33, 49‐64.
Meeuwsen, H., Flohr, J. W., and Fink, R. (1998). Computerized assessment of the skills
of synchronization and the imitation and timing of rhythm patterns.
Technological Directions in Music Education: Institute for Music Research,

124
University of Texas at San Antonio, 93‐95.
Moore, J. L. S. (2009). Assessment of a professional development programme for
music educators. Music Education Research, 11(3), 319‐333.
NCATE. (2002). NACTE unit standards. Retrieved from
http://www.ncate.org/public/standards.asp
Nicolino, P., Fitzgerald, B., Maser, K., & Morote, E. S. (2006). Gender differences in
confidence about using technology: An introductory course. In C. Crawford
et al. (Eds.), Proceedings of Society for Information Technology & Teacher
Education International Conference 2006 (pp. 3544‐3549). Chesapeake, VA:
AACE.
Nierman, G. (1985). The development of a test of verbal descriptors in music.
Bulletin of the Council for Research in Music Education, 84, 20‐23.
Nightingale‐Abell, S. E. (1994). Teacher evaluation practices in the elementary
general music classroom: A study of three teachers (Doctoral dissertation).
Dissertation Abstracts International, 55, 900A.
Pajares, M. F. (1992). Teachers’ beliefs and educational research: Cleaning up a
messy construct. Review of Educational Research, 62(3), 307–332.
Palak, D., & Walls, R. T. (2009). Teachers' beliefs and technology practices: A mixed‐
methods approach. Journal of Research on Technology in Education, 41(4),
417‐441.
Partnership for 21st Century Skills (2009). Learning Environments: A 21st Century
Skills Implementation Guide. Retrieved from

125
http://www.p21.org/index.php?option=com_content&task=view&id=504&It
emid=185
Patrick, S., & Powell, A. (2009). A summary of research on the effectiveness of K–12
online learning. International Association for K–12 Online Learning.
Pellegrino, J. W., Chudowsky, N., & Glaser, R. (2001). Knowing what students know:
The science and design of educational assessment. Division of Behavioral and
Social Sciences and Education. Committee on the Foundations of Assessment,
National Research Council (U.S.).
Penuel, W. R. (2006). Implementation and effects of 1:1 computing initiatives: A
research synthesis. Journal of Research on Technology in Education, 38(3),
329‐348.
Philip, F. S. (2001). Arts education assessment: The journey and the destination, in
Spotlight on Assessment in Music Education, (pp. 54‐59). Reston, VA: MENC.
Pitler, H., Hubbell, E., Kuhn, M., & Malenoski, K. (2007). Using technology with
classroom instruction that works. Alexandria, VA: ASCD.
Reese, S., & Rimmington, J. (2000). Music technology in Illinois public schools.
UPDATE: Applications of Research in Music Education, 18(2), 27‐32.
Reese, S., Repp, R., Meltzer, J., & Burrack, F. (2002). The design and evaluation of use
of a multi‐media web site for online professional development. Journal of
Technology in Music Learning, 1(2), 24‐37.
Rice, K. (2006). A comprehensive look at distance education in the K‐12 context.
Journal of Research on Technology in Education, 38(4), 425‐448.

126
Riel, M., & Becker, H. J. (2000, April). The beliefs, practices, and computer use
of teacher leaders. Paper presented at the Annual Meeting of the American
Educational Research Association, New Orleans.
Ringstaff, C., & Kelley, L. (2002). The learning return on our education technology
investment: A review of findings from research. San Francisco: WestEd RTEC.
Rosenberg, M. J., & Hovland, C. I. (1960). Cognitive, affective, and behavioral
components of attitudes. In M. J. Rosenberg, C. I. Hovland. W. J. McGuire, R. P.
Abelson, & J. W. Brehm (Eds.), Attitude organization and change: An analysis
of consistency among attitude components (pp. 1‐14). New Haven, CT: Yale
University Press.
Rudolph, T. E. (2004). Teaching music with technology (2nd Ed.). Chicago, GIA.
Russell, J. A., & Austin, J. R. (2010). Assessment Practices of Secondary Music
Teachers. Journal of Research in Music Education, 58(1), 37‐54.
Russell, J., & Sorge, D. (1999). Training facilitators to enhance technology
integration. Journal of Instruction Delivery Systems, 13(4), 4‐9.
Ryder, C. (2004). The use of Internet‐based teaching strategies in teaching vocal
anatomy, function, and health to high school choral music students, and its
effect on student attitudes and achievement. Dissertation Abstracts
International, 65(6), 2130.
Sandholtz, J. H., Ringstaff, C., & Dwyer, D. C. (1997). Teaching with technology:
Creating studentcentered classrooms. New York: Teachers College Press.
Savage, J., & Challis, M. (2002). A digital arts curriculum? Practical ways forward.
Music Education Research, 4(1), 7‐23.

127
Schacter, J. (1999). The impact of education technology on student achievement:
What the most current research has to say. Santa Monica, CA: Milken
Exchange of Education Technology.
Schrum, L. (2001). Technology professional development for teachers. In D. M.
Moore, B. B. Lockee, & D. R. Moore (Eds.), Technology and learning: Putting
the research to work (pp. 93‐100). Bloomington, IN: Phi Delta Kappa
International.
Schuman, H. & Presser, S. (1996). Questions & answers in attitude surveys. Thousand
Oaks, CA: SAGE Publications, Inc.
Seddon, F. A., Joubert, M. M., Johnsen, G., & Tangenes, Y. (2003). ‘Crosscultural
collaborative computermediated composition in cyberspace’. Proceedings of
the Research Conference on Music Teaching and Learning, International
Centre for Research in Music Education (ICRME), University of Reading.
Sears, M. F. (2002). A survey of middle school instrumental music assessment
methods in southeastern Massachusetts. Dissertation Abstracts International,
40(6), 1353.
Shachar, M., & Neumann, Y. (2003). Differences between traditional and distance
education academic performance: A meta‐analytic approach. International
Review of Research in Open and Distance Learning, 4(3).
Sherman, C. (2006). A study of current strategies and practices in the assessment of
individuals in high school bands. (Doctoral dissertation). Available from
Dissertations & Theses: A&I. (Publication No. AAT 3237098)

128
Shuler, S. C. (1996). The effects of the National Standards on assessment (and vice
versa). Reston, VA: MENC–The National Association for Music Education.
Simanton, E. G. (2000). Assessment and grading practices among high school band
teachers in the United States: A descriptive study (Doctoral dissertation).
Dissertation Abstracts International, 61, 3500A.
Smith, R., Clark, T., & Blomeyer, R. L. (2005). A synthesis of new research on K–12
online learning. Naperville, IL: Learning Point Associates.
Stiggins, R. J. (2002, June). Assessment crisis: The absence of assessment FOR
learning, Phi Delta Kappan, 83(10), 758‐765.
Tally, K. E. (2005). An investigation of the frequency, methods, objectives, and
applications of assessment in Michigan elementary general music
classrooms. M. Mus. dissertation, Michigan State University, United States,
Michigan. Retrieved from Dissertations & Thesis A&I. (Publication No. AAT
1428983)
Tarnowski, S. M., & Murphy, V. B. (2003). Recruitment, retention, retraining, and
revitalization among elementary music teachers in Wisconsin and Minnesota.
UPDATE: Applications of Research in Music Education, 22(1).
Taylor, J., & Deal, J. (2000). Integrating technology into the K‐12 music curriculum: A
national survey of music teachers. Poster session presented at the annual
meeting of the Association for Technology in Music Instruction, Toronto,
Canada.
Tracy, L. H. (2002). Assessing individual students in the high school choral
ensemble: Issues and practices. Dissertation Abstracts International, 63(9),

129
3134.
Ungerleider, C., & Burns, T. (2003). A systematic review of the effectiveness and
efficiency of networked ICT in education: A state of the field report. Council
of Minister Canada and Industry Canada. Ottawa: Industry Canada.
Venkatesh, V., Morris, M. G., Davis, G. B., & Davis, F. D. (2003). User acceptance of
information technology: Toward a unified view. MIS Quarterly, 27(3), 425‐
478.
Venn, M. (1990). An investigation of the applicability of recent advances in
computer technology to the development of a computerbased, random access
audio test of common criterionreferences objectives in elementary music
(Unpublished doctoral dissertation). University of Illinois, Urbana‐
Champaign, IL.
Von Kampen, K. E. (2003). An examination of factors influencing Nebraska high
school choral directors' decisions to use sight‐singing instruction (Doctoral
dissertation). Retrieved from University of Nebraska‐Lincoln.
Walls, K. (2002). Technology for future music educators. Journal of Music Teacher
Education, 9(2), 14‐21.
Webster, P. (2002). Computer‐based technology and music teaching and learning. In
R. Colwell & C. Richardson (Eds.), The new handbook of research on music
teaching and learning (pp. 416‐439). New York: Oxford University Press.
Webster, P. (2007). Computer‐based technology and music teaching and learning:
2000‐2005. In L. Bresler (Ed.), International Handbook of Research in Arts

130
Education, (pp. 1311‐1328). Springer, Netherlands: Springer. DOI
10.1007/978‐1‐4020‐3052‐9_90
Webster, P. (1992). Research on creative thinking in music. In R. Colwell, (Ed.),
Handbook of research on music teaching and learning (pp. 310‐332). New
York: Schirmer Books.
Williams, D., & Webster, P. (2006). Experiencing music technology (3rd. ed.).
Belmont, CA: Thomson/Schirmer.

131
APPENDIX A

132
APPENDIX B
Instrument Assessment Form Perceptions on Music Assessment and Technology (PMAT)
Instructions: Please provide feedback about the survey by checking your answer for the following questions and rating scales: 1. Are the survey directions clear? Yes No 2. Will the participants fail to answer any question? Yes No 3. Are there errors in the words? Yes No If yes, explain where:
4. Does the format of the survey seem logical? Yes No 5. Do the questions serve the appropriate purpose? Yes No Section 5 (Questions 124, Refer to the Table of Specifications) 6. Are the twenty‐four belief statements related to the five constructs associated with music educators' perceptions about music technology and assessment? Not Related
Moderately Related
Closely Related
7. If you feel there is a statement that is NOT placed under the correct construct, please list the statement number below by the construct you feel better represents that statement. Five constructs
1) Technology 'Ease of Use'
2) Beliefs about Assessment
3) Familiarity of Assessment and Technology Strategies
4) Beliefs about Technology
5) Endorsement by the Experts
8. Please share any other comments you have about the survey:

133
APPENDIX C
Email Script Dear Music Educator - My name is Lance Nielsen, a PhD student at the University of Nebraska-Lincoln. I would like your assistance in conducting a research project. The purpose of this study is to describe current trends of practicing K-12 music educators in the use of technology-based assessment of music learning, to determine music educators' attitudes in using technology, and to determine to what extent do certain demographic factors influence a teacher's decision to use technology. The title of the project will be A Study of K-12 Music Educators’ Attitudes Toward Technology-Assisted Assessment Tools Your identity throughout this process will be kept strictly confidential. Participation in this study will require that you complete an online survey that will take you approximately 15 minutes to complete. There are no known risks to participating in this study. To participate in this study, simply proceed to the following weblink. <INSERT WEB LINK> The first question will ask for your consent to participate. Then, simply answer the rest of the questions and click on submit when completed. Deadline to complete to the survey will be <INSERT DATE>. A reminder email to complete the survey will be sent in two weeks. If you have any questions about the research project, please contact Lance Nielsen at [email protected]. If you have any questions about your rights as a research participant or to report any concerns, please contact the UNL Institutional Review Board at 402-472-6965 or [email protected]. (IRB# 20101111276). The results will be shared with all participants at the conclusion of the study. Thank you for your consideration in participating in this research study. Sincerely, Lance D. Nielsen Dr. Brian Moore Doctoral Student Associate Professor of Music Education University of Nebraska–Lincoln University of Nebraska–Lincoln 220 Cottonwood Dr. 358 Westbrook Music Building Lincoln, NE 68510 Lincoln, NE 68588–0100 [email protected] Email: [email protected] Telephone: (402) 472–2537

134
APPENDIX D
Follow-Up Email Contact Dear Music Educator, One week ago, I sent you an email asking for your participation in a research study entitled A Study of K-12 Music Educators’ Attitudes Toward Technology-Assisted Assessment Tools. If you have completed the survey, I want to thank you for your participation and time. If you have not completed the survey, I ask that you please reconsider your participation in the survey on technology-based assessment tools by <DATE>. Click on the link below to access the survey. The survey will take approximately 15 minutes to complete. Thank you for your assistance and participation in this study. Sincerely, Lance D. Nielsen Doctoral Student University of Nebraska-Lincoln [email protected] 402-817-8217 Dr. Brian Moore Associate Professor of Music Education University of Nebraska – Lincoln 358 Westbrook Music Building Lincoln, NE 68588–0100 Telephone: (402) 472–2537 Email: [email protected]

135
APPENDIX E

136

137

138

139

140

141
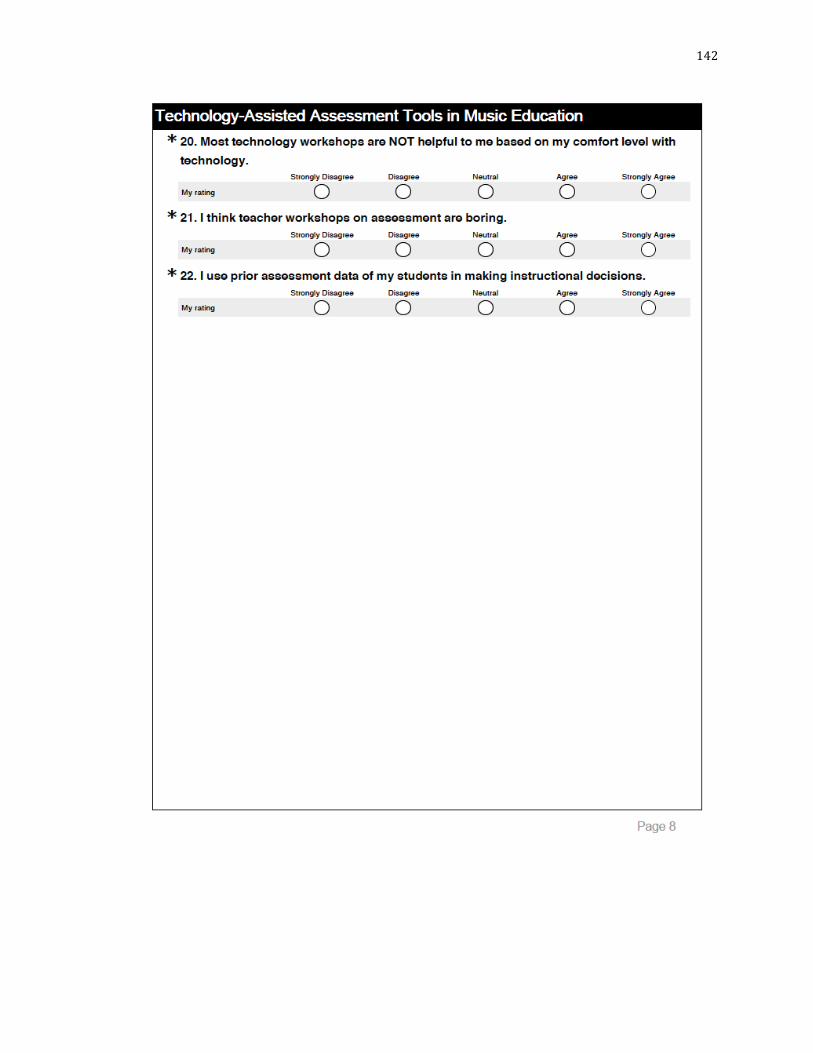
142

143

144

145