Embed Size (px)
Citation preview

A Study of Knickpoint Formation: Geomorphic Analysis of San Simeon Creek
A Senior Project
Presented to
The Faculty of the
Natural Resources Management and Environmental Sciences Department
California Polytechnic State University, San Luis Obispo
In Partial Fulfillment
Of the Requirements for the Degree
Earth Science; Bachelor of Science
By
Keith Moffatt
June, 2013
© June, 2013 Keith Moffatt
2
APPROVAL PAGE
Title: A Study of Knickpoint Formation: Geomorphic Analysis of San Simeon
Creek
Author: Keith Moffatt
Date Submitted: June, 2013
Natural Resources Management and Environmental Sciences Department
Dr. Antonio Garcia Senior Project Advisor
Dr. Antonio Garcia
Dr. Douglas Piirto Department Head
Dr. Douglas Piirto

3
Abstract
The highest point of orogeny in the Santa Lucia range occurs 50-60km from the nearest
active faulting. This orogeny is believed to have occurred hear due to relatively weak Franciscan
Mélange versus the granitic material at the fault boundary. This paper studies the development of
a knickpoint in San Simeon creek to identify the role of relatively recent (graded time) tectonic
activity in orogeny of the Santa Lucia range.
The 2003 earth quake is evidence of recent base level change with the occurrence of
orogeny supporting the theory of continuous orogeny in recent and graded time scale. Although
the knickpoint occurs in a resistant portion of the Franciscan Mélange, overall it is a relatively
soft substrate suggests that Garcia and Mahan’s theory of Quaternary orogeny.
4
Table of Contents
Approval Page……………………………………………………………………………..2
Abstract……………………………………………………………………………………3
Table of Contents………………………………………………………………………….4
Literature Review………………………………………………………………………….5
San Simeon Creek Study
Introduction………………………………………………………………………..9
Methods and Materials…………………………………………………………...11
Results……………………………………………………………………………14
Discussion/Conclusion.........……………………………………………………..16
References………………………………………………………………………………..18
Acknowledgements………………………………………………………………………19
5
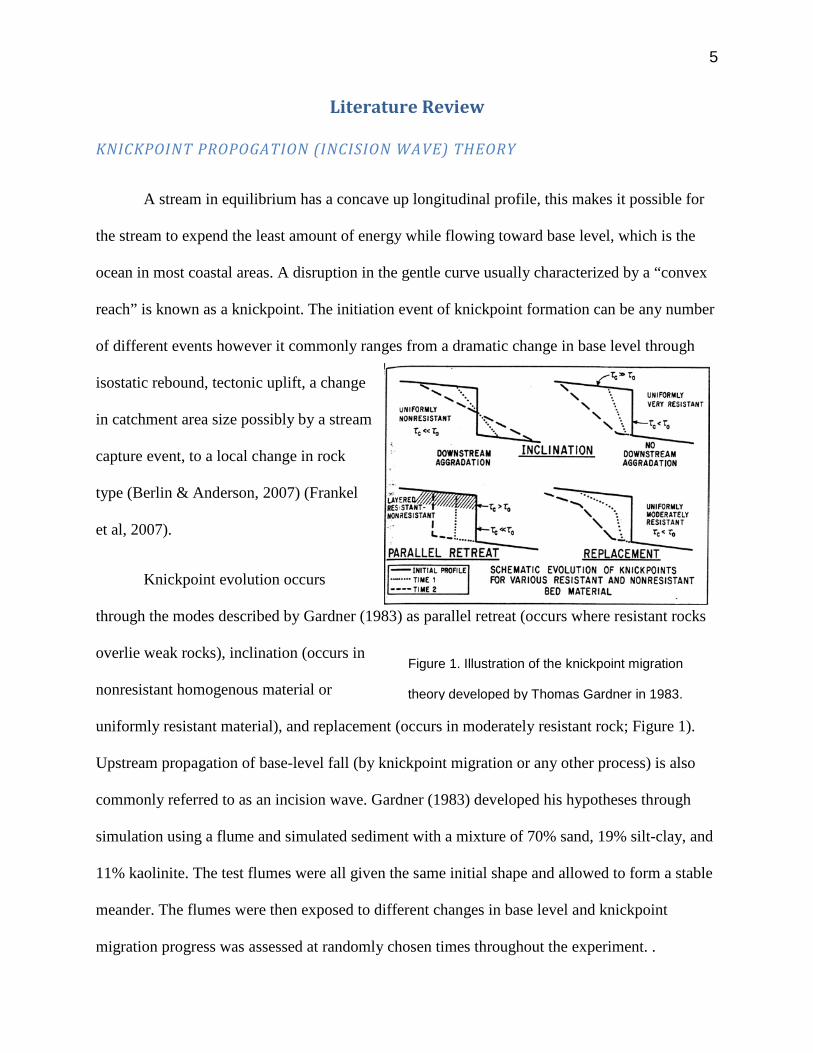
Figure 1. Illustration of the knickpoint migration
theory developed by Thomas Gardner in 1983.
Literature Review
KNICKPOINT PROPOGATION (INCISION WAVE) THEORY
A stream in equilibrium has a concave up longitudinal profile, this makes it possible for
the stream to expend the least amount of energy while flowing toward base level, which is the
ocean in most coastal areas. A disruption in the gentle curve usually characterized by a “convex
reach” is known as a knickpoint. The initiation event of knickpoint formation can be any number
of different events however it commonly ranges from a dramatic change in base level through
isostatic rebound, tectonic uplift, a change
in catchment area size possibly by a stream
capture event, to a local change in rock
type (Berlin & Anderson, 2007) (Frankel
et al, 2007).
Knickpoint evolution occurs
through the modes described by Gardner (1983) as parallel retreat (occurs where resistant rocks
overlie weak rocks), inclination (occurs in
nonresistant homogenous material or
uniformly resistant material), and replacement (occurs in moderately resistant rock; Figure 1).
Upstream propagation of base-level fall (by knickpoint migration or any other process) is also
commonly referred to as an incision wave. Gardner (1983) developed his hypotheses through
simulation using a flume and simulated sediment with a mixture of 70% sand, 19% silt-clay, and
11% kaolinite. The test flumes were all given the same initial shape and allowed to form a stable
meander. The flumes were then exposed to different changes in base level and knickpoint
migration progress was assessed at randomly chosen times throughout the experiment. .

6
BASE LEVEL CHANGE PHENOMENA AND KNICKPOINT DEVELOPMENT
Base level change can be resultant of isostatic rebound, tectonic uplift, change in sea
level, or any combination of these. The change in base level causes the formation of a
knickpoint, and available stream power increase at and slightly upstream of the knickpoint. This
knickpoint in simplest terms is simply evidence of the
stream adjusting its flow toward equilibrium and the
path of least energy expenditure (Crosby & Whipple,
2006). Headward incision caused by base level change is
in some instances evident as a knickpoint. Gardner’s
(1983) work on base level change identified the modes
of knickpoint evolution; however it was further
experimentation and observation that assessed the effect
of base level change on stream power, channel
equilibrium, and knickpoint migration. By applying the
observed information into the “Celerity model” (Equation 1), Berlin and Anderson (2007) were
able to accurately predict the location of the knickpoints already in place. This experiment tested
the accuracy of the Celerity model and made significant progress towards understanding the
evolution of knickpoints caused by base-level fall (Berlin & Anderson, 2007).
Large-scale incision waves caused by base level fall, sometimes manifest as upstream-
migrating knickpoints, have been documented in southern Spain, Using fluvial stratigraphy in
combination longitudinal profile analysis evidence of knickpoint propagation was shown on
large scales such as the 20km migration of the knickpoint zone on the Aguas/Feos river complex
(Harvey and Wells, 1987), . This event was determined to be caused by tectonic stream capture,
E =KAmSn
K: Dimensional resistance to erosion
A: Drainage area
S: Channel slope
m & n: Process dependent constant
based off channel incision process
Equation 1. Stream Power Law
(Celerity Model) (Berlin &
Anderson, 2007)

7
causing an increase in catchment area, thus triggering the incision wave (Harvey and Wells,
1987). Loget and Van Den Driessche (2009) evaluated knickpoint formation from the Messinian
event base level fall of 1500m at the end of the Miocene era and compared it to current drainage
configuration. The evaluation yielded results suggesting deep canyons formed by headward
erosion due to the extreme event and is observable in the major valleys around the
Mediterranean, despite the aggradation caused by an 80m sea level rise since the event (Loget &
Van Den Driessche, 2009).
ROCK TYPE AND KNICKPOINT DEVELOPMENT
Resistance to erosion can also be the cause of a knickpoint formation and many studies
have been conducted under that premise. Gardner (1983) established that hard, resistant material
overlying nonresistant material also causes over steepening. It is the underlying material that
fails as the stream abrades the bed and eventually the hard overlying surface loses its support and
collapses; this is more specifically known as parallel retreat (Gardner, 1983). Knickpoints readily
form in vertically bedded substrate of contrasting resistance to erosion (Frankel et al, 2007).
Frankel et al (2007) studied two knickpoints in the Appalachian range demonstrating vertically
bedded resistant material on Moores Creek and the Susquehanna River using a flume to simulate
the conditions for observation. The heterogeneous substrate conditions were simulated by
alternating clay and silt material. Upon applying a gently slope and allowing the stream to
equalize, a sudden base level change was applied to simulate an event. Knickpoint formation
occurred most prominently at the more resistant clay material forming a system of step pools.
The mock stream demonstrated parallel retreat reaffirming Gardner’s (1983) knickpoint
migration theory (Frankelet al, 2007). This is significant because rock type change intrusions can
be found in many forms in addition to vertical beds (e.g. dike or sill intrusion).

8
Weissel and Seidl (1997) demonstrated rock type controlled knickpoint propagation rate
in conjunction with fluvial processes by analyzing the Macleay River system. Strike and dip
measurements were taken and compared to field photography to identify bedrock joint and
fracture patterns. It was found the sub vertical jointing caused block and columnar toppling,
signifying that the streambed material and structure plays a critical role in knickpoint migration
and propagation (Weissel and Seidl, 1997).
CATCHMENT AREA AND KNICKPOINT FORMATION AND PROPAGATION RATE
The analysis and comparison of the Mediterranean area by Loget and Van Den
Driessche (2009) mentioned previously yielded not only significant evidence of Messinian event
base level fall but also highlighted a correlation between catchment basin area and knickpoint
propagation rate. As catchment area increased, propagation rate increased accordingly in like
material (Loget and Van Den Driessche, 2009). In addition to these results supporting a
correlation between catchment area, Crosby & Whipple (2006) used a combination of aerial
photography analysis and digital elevation model (DEM) to identify knickpoint location based on
catchment basin size. The streams in the area were all believed to have been affected by the same
base level change. Out of a total sample size of 235 streams, 75% of knickpoints were discovered
at drainage basins between 1×10⁵m2 and 1×10⁶m2 (Crosby & Whipple, 2006). The increase in
catchment basin area suggests a correlation between knickpoint propagation rates over time,
which supports the Celerity Model developed by Berlin and Anderson (2007).

9
San Simeon Creek Study
1. Introduction
California has a complex network of faults ranging from micro faults to plate
dividing faults such as the San Andreas Fault. As result, the complexity of the faulting has
created a diverse landscape that is interesting for geomorphologists to study. Streams are an
active element in a changing landscape and can often be used to understand the development of
the landscape over graded and geologic timescales.
1.1 Tectonic and Geologic Setting
The central Coast Ranges are especially complex. For example, the highest point of the
central Coast Range orogenic belt is 50-65 km from the major zone of active plate-boundary
faulting at the San Andreas fault zone (McLaren et al, 2008). The range is located between the
Oceanic fault and Nacimiento fault zone. Garcia and Mahan (2012) explain the phenomena
through difference in geology between the plate boundary and the area of highest orogeny. The
deformed zone is composed of Franciscan Mélange which relatively weak and is composed of an
unconsolidated mixture of different rock types ranging in scale from cm to km in a mud matrix
(Garcia and Mahan, 2011). Closer to the plate boundary, between the inactive Nacimiento Fault
zone and the San Andreas fault zone, the Salinian terrane is composed of granitic material, as
well as gneiss and schist (Page et al, 1998). The Franciscan Mélange complex is more
susceptible to deformation and orogeny than the rocks of the Salinian terrane due to the vast
difference in hardness.

10
Orogenesis of the Santa Lucia Range is believed to have occurred started around 6-8 Ma,
according to a study based on thermocronometry data from rock samples in the northwestern
portion of the range (Ducea et al, 2003). However, alternative studies in stratigraphic data
indicate orogenesis occurring 3.5 Ma. Continuous versus episodic orogeny has yet to be
determined with any certainty in the area. Page et al (1998) propose two main episodes of
orogenesis separated by a period of tectonic acquiescence, the first starting at around 3.5 Ma, and
the second ~400 ka. Page et al (1998) and argue that steady uplift as well as formation of the
highest topography in the range has occurred since the most recent episode.
1.2 Recent Tectonic Movement
The 2003 San Simeon earthquake was caused by complex faulting and led to recent
orogeny within the Santa Lucia Range. Recent InSAR imagery data shows the
Oceanic/Nacimiento fault zone as the epicenter of the Mw 6.5 earthquake epicenter. McLaren et
al. (2008) describe the earthquake as caused by a thrusting block in a reverse fault system in the
Oceanic/Nacimiento fault zone. McLaren et al. (2008) measured the upward thrust during the
event to have been ~72mm and describe the Santa Lucia Range as a “popup block”. The lifting
of the Santa Lucia Range is result of convergence across the boundary between the Pacific Plate
and the Sierran Microplate (McLaren et al, 2008; Garcia and Mahan, 2011). The convergence is
accommodated by a network of and reverse faults (Page et al, 1998). The recent uplift event from
the 2003 earthquake is a recent event of base level change caused by orogeny.
1.3 Analysis of Base Level Change Chronology
A knickpoint is an indicator of the stream correcting its flow to the path of least energy
expenditure or equilibrium, which manifests as a visible break between two different base levels
11
(Crosby & Whipple, 2006). These features can be used as a tool for identifying significant
landscape change events. The change in base level can be the result of many causes including
tectonic uplift (orogeny), isostatic rebound, change in sea level, and stream capture events.
Several forms of knickpoint formation can occur, each resulting due to differing conditions.
Gardner (1983) coined the phrases inclination, parallel retreat, and replacement. Inclination
occurs in two different forms, rotation and relaxation. Rotation refers to a stream equalizing in a
universally nonresistant material by “rotating” along a central axis by depositing it’s upstream
material downstream. Relaxation knickpoint formation occurs in homogeneous, extremely
resistant material. A relaxing knickpoint gradually lays back over time becoming less steep.
Parallel retreat occurs in extremely resistant material overlying non-homogenous, non-resistant
material. The knickpoint “retreats” upstream by eroding the weak underlying layer, thus causing
the overlying resistant material to collapse. Estimating knickpoint progression of any of the
different types of knickpoints can be difficult due to intrusions of rock with a different hardness
than the existing rock. Beds of resistant rock can cause knickpoint progression to slow over
geologic time as opposed to the usually much shorter graded time and must be accounted for
when being used for studying base level change.
2. Methods
2.1 Area of Study
San Simeon Creek, the primary study site, is a perennial stream located in San Luis
Obispo County, a few kilometers north of the town of Cambria. San Simeon Creek is within the

12
Pebblestone Shut-In and Cambria Quadrangle U.S. Geological Survey 1:24,000 scale
topographic map quadrangles.
Analysis of the study site was done by creating a stream profile to illustrate changes in
elevation over distance. Due to the small size of the stream and the accuracy variation of LIDAR
data and physical maps, field surveying was decided to be the most accurate technique. A
preliminary survey of the study site was performed to identify starting and stopping points for
the surveying.
2.2 Field Methods
A Garmin Montana 650 Global Positioning System was used to make field notes and
identify shooting points and fore shots made along the stream. Using an Abney level, level rod,
and cloth tape, slope measurements in degrees (referred to below as (“shots”) were made at 50
meter intervals. Where 50 meter intervals were not possible, the distance between the rod and the
level were recorded with accuracy down to 1 meter. The level rod was marked at eye level of the
shooter with yellow tape to provide maximum angle accuracy possible. All measurements were
taken from the center of the stream to preserve accuracy and consistency of the measurements.
The starting point was decided to be close at the relatively stable, alluviated lower portion
of the stream. The endpoint was decided to be 300-500 meters upstream from the focus point
(knickpoint). At each grade measurement point, a picture was taken for reference in the case that
in the future results need to be verified. In addition to the site photos, each point was logged with
its GPS coordinates, site notes, direction of shot, distance of shot, and angle of shot both in a
field journal and on the Garmin unit itself. The survey took three total days in the field to log,
therefore each endpoint was marked on the GPS to generate seamless data.

13
2.3 Analytical Methods
The field results were input into a digital spreadsheet for analysis and calculations. Each
angle measured was plugged into the formula Δ Elevation calculated = Δ Distance measured * sin
(Angle measured). The change in elevation was then added to the base elevation which was digitally
identified using GIS software. A stream profile was then created (Figure 3.1) through a point line
graph with change in elevation as the y-axis and the change in distance in the x-axis.
GIS software was used to create an accurate digital reference to the points in relation to
existing georeferenced data provided by USGS and San Luis Obispo County public records. The
geographic points were converted into a shape file from the GPS unit and overlain on a hillshade,
a USGS geologic map shapefile, a USGS digitized fault line shapefile, and a digitized map of the
stream network in the county for accurate analysis and visualization of the data (Figure 3.2).
3. Results

14
0
10
20
30
40
50
60
70
80
90
0 500 1000 1500 2000 2500
Elev
atio
n (m
)
Distance (m)
San Simeon Stream Profile
Figure-3.1, Profile exhibits change in elevation versus distance from ~30 meters elevation. A exists between 2,200 meters and 2,300 meters, and it reflects an abrupt change of elevation of the stream bed over a relatively short distance.

15
Figure 3.2 The study area and surrounding the geologic structure provided by the USGS.
Local geology consists of a range of rock types in a mud matrix forming Franciscan
Mélange (Page et al, 1998).
16
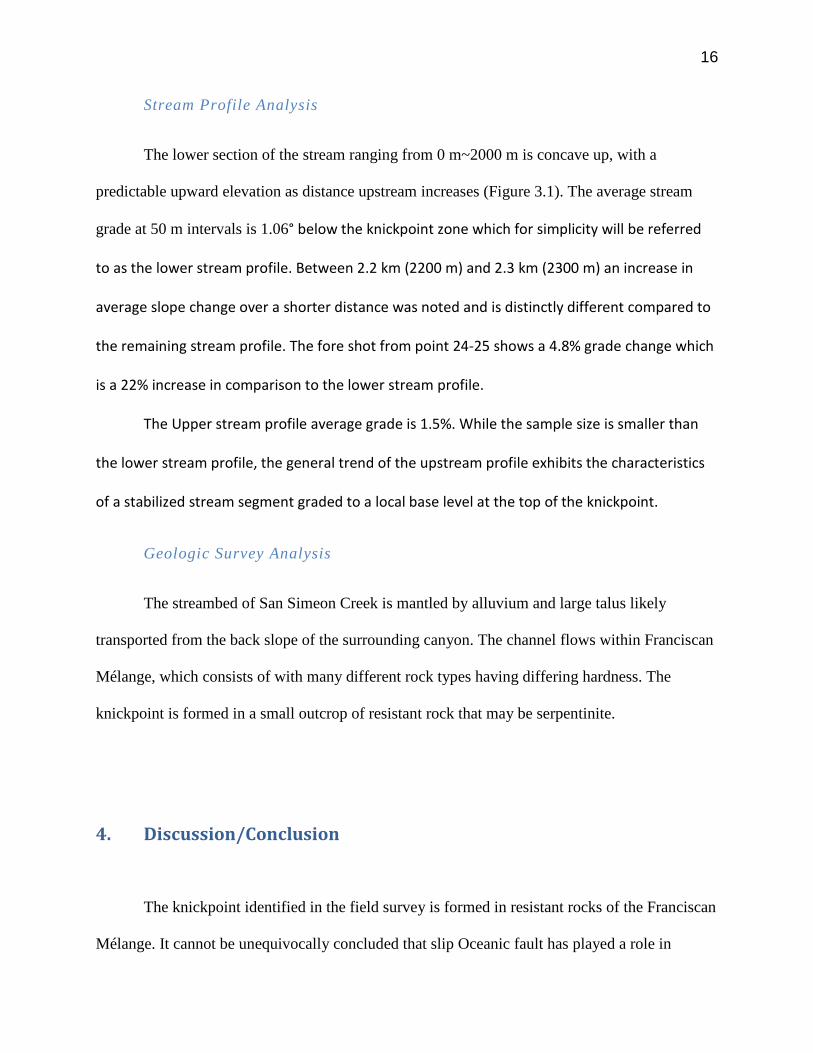
Stream Profile Analysis
The lower section of the stream ranging from 0 m~2000 m is concave up, with a
predictable upward elevation as distance upstream increases (Figure 3.1). The average stream
grade at 50 m intervals is 1.06° below the knickpoint zone which for simplicity will be referred
to as the lower stream profile. Between 2.2 km (2200 m) and 2.3 km (2300 m) an increase in
average slope change over a shorter distance was noted and is distinctly different compared to
the remaining stream profile. The fore shot from point 24-25 shows a 4.8% grade change which
is a 22% increase in comparison to the lower stream profile.
The Upper stream profile average grade is 1.5%. While the sample size is smaller than
the lower stream profile, the general trend of the upstream profile exhibits the characteristics
of a stabilized stream segment graded to a local base level at the top of the knickpoint.
Geologic Survey Analysis
The streambed of San Simeon Creek is mantled by alluvium and large talus likely
transported from the back slope of the surrounding canyon. The channel flows within Franciscan
Mélange, which consists of with many different rock types having differing hardness. The
knickpoint is formed in a small outcrop of resistant rock that may be serpentinite.
4. Discussion/Conclusion
The knickpoint identified in the field survey is formed in resistant rocks of the Franciscan
Mélange. It cannot be unequivocally concluded that slip Oceanic fault has played a role in

17
knickpoint formation. However, the relatively unconsolidated mud matrix is an ideal substrate
for relatively fast knickpoint propagation caused by tectonically driven base-level fall.
Knickpoint formation along San Simeon creek suggests that base level change caused by
tectonic activity has occurred in the Santa Lucia Range, which in turn suggests that Quaternary-
time orogeny is occurring in the range. These findings support the model of Garcia and Mahan
(2011), which proposes deformation in the nonresistant Franciscan Mélange due to the
transference of strain by the much more resistant granitic material at the active plate boundary.
The scope of this study is not large enough to eliminate other possibilities to explain
recent deformation of the Santa Lucia range. To solidify the theory, further study would be
required. A stream longitudinal profile extending further upstream would be helpful in
identifying any other possible knickpoints to gain a better perspective of deformation in the area.
Studying several other streams in the range would be prudent for isolating the continuous recent
uplift as the cause for knickpoint formation in the area. This study increases understanding of the
recent uplift events of the Santa Lucia Range, and coupled with other studies, it can identify a
more complete geologic history of the range.

18
REFERENCES
Berlin, M. M., & Anderson, R. S. (2007). Modeling of knickpoint retreat on the Roan Plateau, western Colorado. JOURNAL OF GEOPHYSICAL RESEARCH , F03S06.
Crosby, B. T., & Whipple, K. X. (2006). Knickpoint initiation and distribution within fluvial networks:. Geomorphology , 16-38.
Dietrich, W. E., & Sklar, L. S. (2001). Sediment and rock strength controls on river incision into bedrock. GEOLOGY , 1087-1090.
Ducea, M., House, M.A., Kidder, S., 2003. Late Cenozoic denudation and uplift rates in the Santa Lucia Mountains, California. Geology 31, 139–142.
Frankel, K. L., Pazzaglia, F. J., & Vaughn, J. D. (2007). Knickpoint evolution in a vertically bedded substrate, upstream-dipping terraces, and Atlantic slope bedrock channels. Geological Society of America Bulletin , 476-486.
Harvey, A M., and Wells, S. G., 1987. Response of Quaternary fluvial systems to differential epeirogenic uplift: Aguas and Feos river systems, southeast Spain. Geological Society of America Bulletin, volume 16, p. 689-693.
Garcia, A.F., Mahan, S.A. (2011). The influence of upper-crust lithology on topographic development in the central Coast Ranges of California, Geomorphology, doi:10.1016/j.geomorph.2011.09.09.
Gardner, T. W. (1983). Experimental study of knickpoint and longitudinal profile evolution in cohesive, homogeneous material. Geological Society of America Bulletin , 664-672.
Loget, N., & Van Den Driessche, J. (2009). Wave train model for knickpoint migration. Geomorphology , 376-382.
McLaren, M.K., Hardebeck, J.L., van der Elst, N., Unruh, J.R., Bawden, G.W., Blair, J.L., (2008). Complex faulting associated with the 22 December 2003 MW 6.5 San Simeon, California, earthquake, aftershocks, and post seismic surface deformation. Bulletin of the Seismological Society of America 98, 1659–1680.
Miller, J. R. (1991). The Influence of Bedrock Geology on Knickpoint Development and Channel-Bed Degradationalong Downcutting Streams in South-Central Indiana. The Journal of Geology , 591-605.
Page, B.M., Thompson, G.A., Coleman, R.G., 1998. Late Cenozoic tectonics of the central and southern Coast Ranges. Geological Society of America Bulletin 110, 846–876.
Stock, J. D., & Montgomery, D. R. (1999). Geologic constraints on bedrock river incision using the stream power law. Journal of Geophysical Research , 4983-4993.
Weissel, J. K., & Seidl, M. A. (1997). Influence of rock strength properties on escarpment retreat across passive continental margins. Geology , 631-634.

19
Acknowledgments
A Special thanks to all who participated directly and indirectly to the successful
completion of this study including Michael Moffatt, Michael Murphy, Stephan
Valdeolivar, and Antonio Garcia.