Embed Size (px)
Citation preview
SC .P . N o . 13 74' /0
F/
U iPROCUREMENT EXECUTIVE, MINISTRY OF DEFENCE
AERONAUTICAL RESEARCH COUNCIL
CURRENT PAPERS
A Study. of Local Stress Histories inLoaded and Unloaded Holes and theirImplications to Fatigue Life Estimation
ty
J.E. Moon•E)
B. H. E. Perrett
P.R. Edwards
Structures Dept., R.A.E., Farnborough Hants
LONDON: HER MAJESTY'S STATIONERY OFFICE
C 1977
ape tier
UDC 539.4.013.3 : 539.431 669.715
*CP No.1374
p July I075
S A STUDY OF )LOCAL 5TRESS HISTORIES IN LOADED AND.UNLOADED HOLES AND
V THEIR IMPLICATIONS TO FATIGUE LIFE ESTIMATION,
by
J. E./Monr
B. H. E./Perrett
I P. R./Edwards
SUMMARY
This 4eport presents local stress measurements in aluminium alloy specimens
at open holes and pin-loaded holes of the same elastic stress concentrationfactor, under variable amplitude loading. The Companion Specimen Method wasused and the results are interpreted with particular reference to fatigue lifeestimation. In addition the Neuber Test and Linear Strain Methods were used tomake estimates of the local stress history for the case of the open hole.
Companion Specimen Tests with an ascending-descending zero to peak stresssequence showed that there was no significant difference in local stress rangesor residual stresses between an open hole and a pin-loaded hole of the samestress concentration. A comparable Neuber Test produced errors in both maxLmumlocal strains and residual stresses and ways of improving this method are dis-cussed. The Linear Strain Method in the form currently suggested by ESDU madepoor estimates of residual stresses.
The substance of this paper was presented under the title "A Study ofLocal Stress Histories in Structural Elements and their Implications to FatigueLife Estimates", at the SEE Fatigue Group international conference on FatigueTesting and Design held at City University, London in April 1976.
* Replaces RAE Technical Report 76090 - ARC 37040

2
CONTENTSPage
1 INTRODUCTION 3
2 DETERMINATION OF THE LOCAL STRESS HISTORIES AT AN OPEN HOLE AND APIN-LOADED HOLE OF THE SAME ELASTIC STRESS CONCENTRATION FACTOR 3
2.1 Method of measurement 4
2.2 Specimens and material 4
2.3 Summary of tests 4
2.4 Results and discussion 4
3 EVALUATION OF A NEUBER TEST PREDICTION OF LOCAL STRESS HISTORYAT THE OPEN HOLE 6
3.1 Specimens and material 6
3.2 Summary of tests 6
3.3 Results and discussion 7
4 LINEAR STRAIN METHOD PREDICTIONS OF LOCAL STRESS HISTORY AT THEOPEN HOLE 9
4.1 Predictions 9
4.2 Results and discussion 10
5 CONCLUSIONS 10
Appendix A Neuber's Rule ani its application to a Neuber Test 13
Appendix B An example of how errors can arise when Neuber's Rule isapplied to a sequence of loads 15
Appendix C The Linear Strain Method of predicting values ofresidual stresses formed by peak loads 17
Symbols 18
References '8
Illustrations Figures 1-15
S..... ,.--...
/4 '
3
I INTRODUCTION
Although Miner's kule is used extensively in the aircrpft and other
industries for fatigue life prediction it is well known that it can lead to
ertors . In many cases these errors can be reduced by considering the actual
state of stress at the point of fatigue initiation, rather than average net
section stresses. An example of this is the case where the extreme loads in a
speftrum cause local yielding at a point of stress concentration. Depending on
whether the yielding is tensile or compressive, the residual stresses Produced
will be compressive or tensile respectively. These alter the mean stress at the
point of maximum stress and this in turn affects the fatigue performance of the
component And hence th'. accuracy of Miner's Rule used with nominal stress
histories. In order to improve methods of life prediction, local stress
histories at simple stress concentrations are commonly studied by the Companion
Specimen and Neuber Test Methods.
2Section 2 describes Companion Specimen Tests of an open hole and a pin-
loaded hole of the same elastic stress concentration factor to investigate any
differences in local stress history which might affect the fai.igue performance.
3Section 3 describes the next stage of the work where a Neuber Test was
carried out on a plain specimen to reproduce the conditions at the open hole
studied in section 2. Attempts were made to trace the source of inaccuracy in
the Neuber Tests and modifications to the basic concept were examined.
The Linear Strain Method is commonly used in the aircraft industry during
life prediction when making estimates of residual streosses formed in components
during spectrum loading. Section 4 presents estimates for the open hole and
compares them with the Companion Specimen measurements of section 2.
2 DETERMINATION OF LOCAL STRESS HISTORIES AT AN OPEN HOLE AND A PIN-LOADEDHOLE OF THE SAME ELASTIC STRESS CONCENTRATION FACTOR
In recent years a large body of data has been collected on stress histories
at open holes, commonly called notches, but very little work has been carried out
for the case of the pin-loaded hole. In this investigation the Companion
Specimen Method was used to determine the local stress histories in a notch and
a pin-loaded hole having the same nominal elastic stress concentration factor,
and subjected to the same net stress sequence. The aim of this work was to
investigate any differences which might affect the fatigue performance and, in
particular, which would be significant when applying a residual-stress correc-4
tion to life prediction, such as the ESDU rule
S~4
2.1 Method of measurement
Briefly, the Companion Specimen Method2 consists of reproducing on a plain
specimen the stress and strain history at a point of stress concentration. A
strain gauge is attached at the point of interest in a structural feature, gener-
ally where the fatigue crack is likely to start, and the strain history is
recorded whilst the specimen is subjected to the desired load sequence. The
recorded strain sequence is then applied to a plain specimen, of the same
material Rs the component and, by measuring the loads applied, the corresponding
stress history in the component is determined. This method relies on the
assumption that there is a uniaxial state of stress at the point of measurement,
which is reasonable for an open hole in a relatively thin specimen.
2.2 Specimens and material
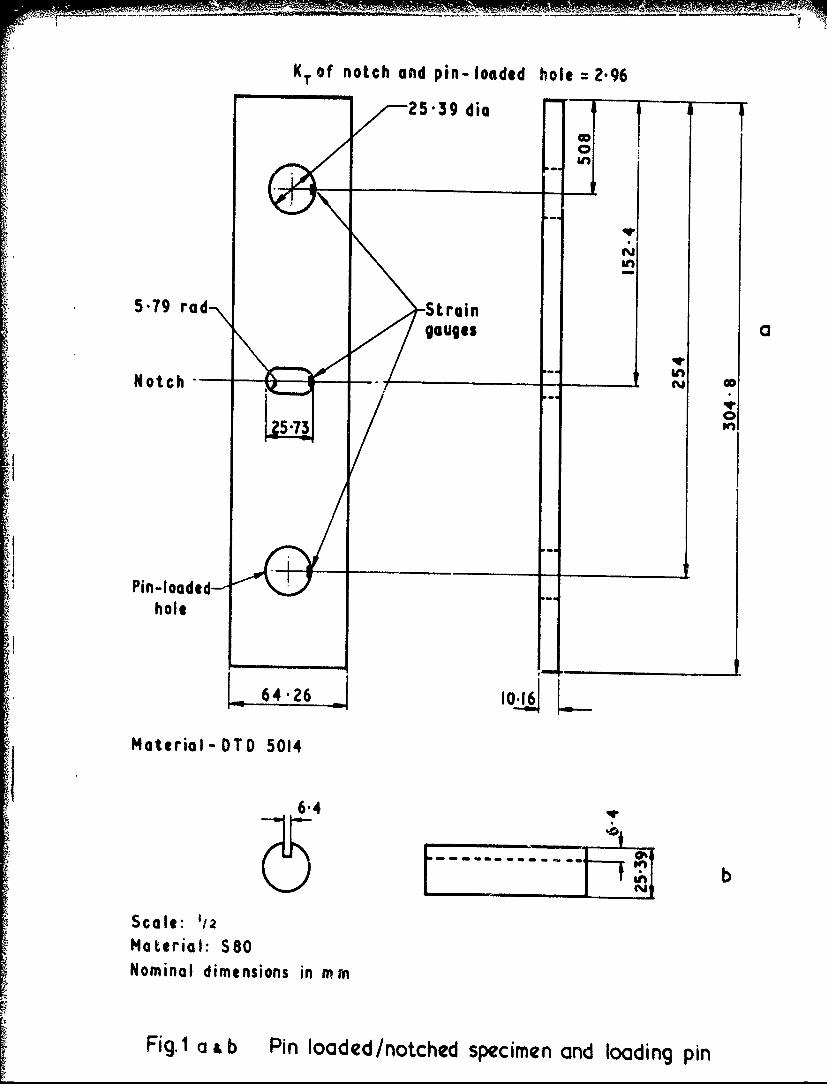
All specimens were cut from a single bar of DTD 5014 aluminium alloy
material. The specimen on which the measurements were carried out is shown in
Fig.l. The central open hole and the pin-loaded holes at each end were designed
using data sheets5,6 to have the same elastic stress concentration factor
(•, - 2.96) and net section area. Thus both features experienced the same net
.i stress and, in the elastic regime at least, the local stress histories were
theoretically identical. The steel loading pins hae slots milled along their
length to accommodate the strain gauge and associated eads. The companion
plain specimen is shown in Fig.2.
2.3 Summary of tests
The theoretical value of stress concentration was checked experimentally
for both the notch and pin-loaded hole. For the pin-loaded hole the effect on
stress concentration factor of pin clearance in the range 0.0001 to 0.0007 of
diameter was investigated.
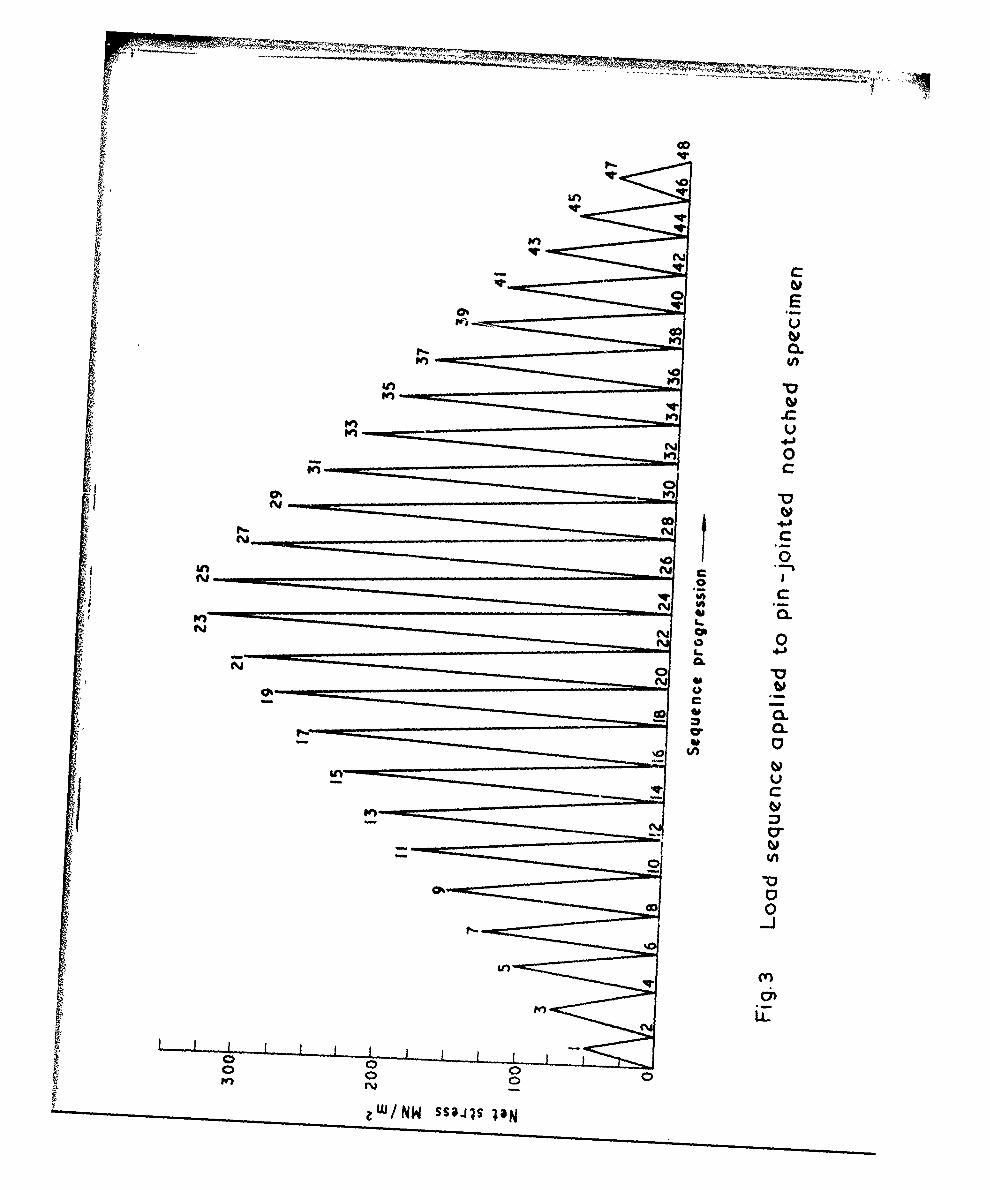
The load sequence applied in the main part of the investigation is shown
in Fig.3. It included peaks high enough to cause appreciable local plastic
flow. The main criteria used for judging differences in behaviour were the
local stress range and the residual stress induced in each cycle. For the
purposes of this Report residual stress is defined as that axial stress which
would be lefc at the root of the notch if the external load was removed,
provided that the specimen behaved elastically during unloading.
2.4 Results and discussion
For the notch the experimentally determined value of Kt was found to be
about 2% lower than in theory. The pin-loaded hole, however, exhibited a
5
slight nonlinearity of K in the 'elastic' regime, and compared with the notch
the elastic stress concentration factor was between 0 and 10% lower, depending
on stres, range. This fact will be taken into consideration when interpreting
4 later results.
The investigation into the effect of pin clearance showed that, in the
range 0.0001 tc 0.0007 of diameter there was no perceptible difference in elastic
stress concentration factor. In subsequent testing a pin clearance of between
0.0001 and 0.0003 of diameter was used.
Results were obtained from three notches and four pin-loaded holes, and
the results presented are based on the average of these.
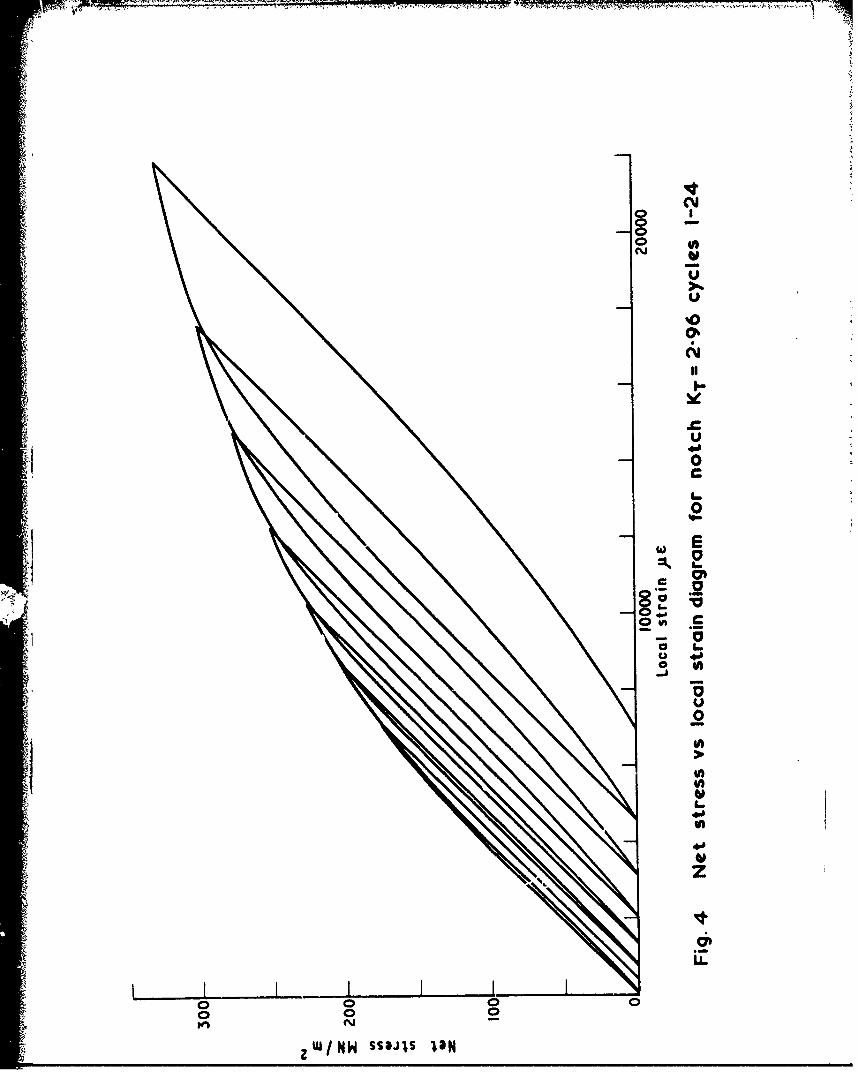
Fig.4 is a typical example of a graph for a notched specimen, of net
stress versus local strain; this particular plot is for a virgin specimen loaded
in the ascending part of the sequence, i.e. load changes I to 24. The corres-
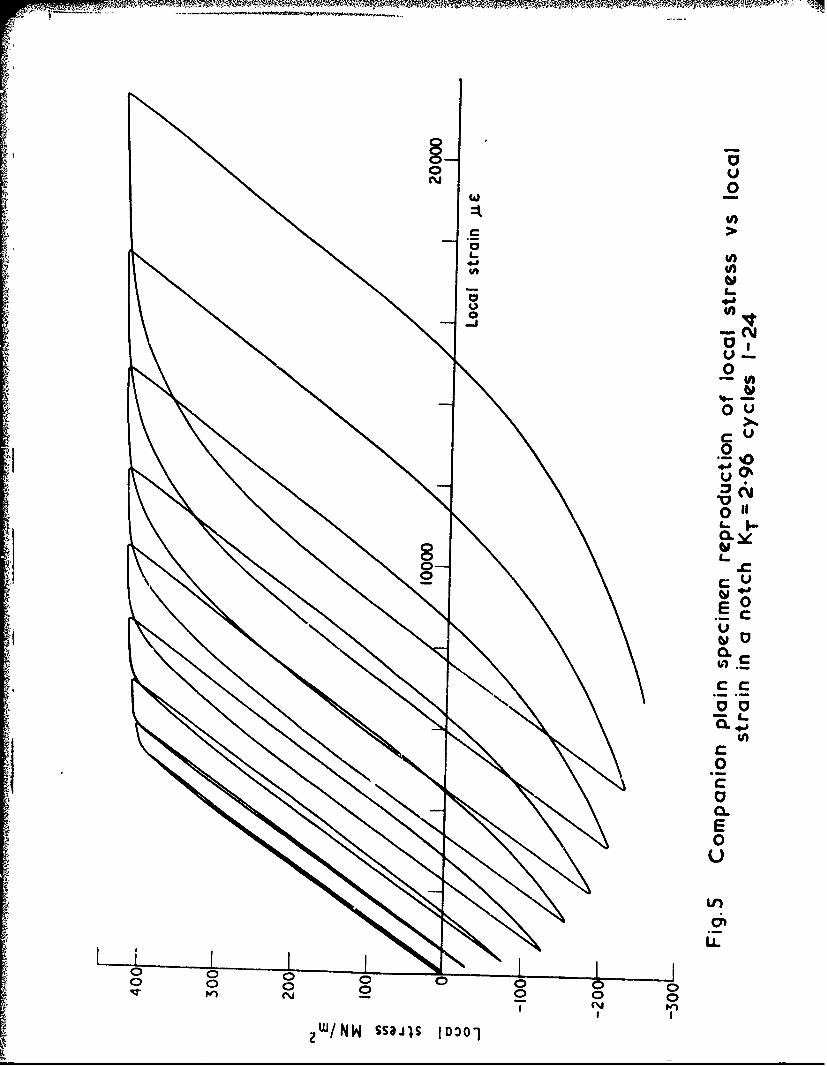
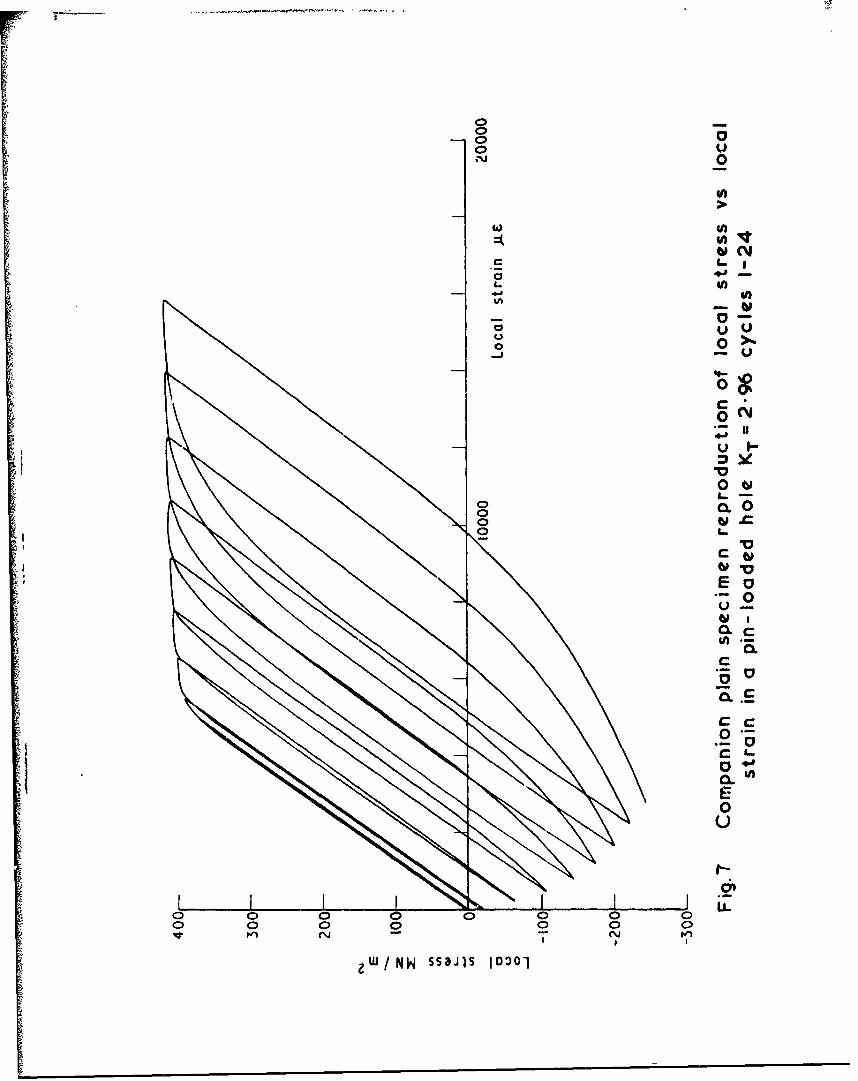
ponding local stress versus local strain diagram obtained from a plain specimen
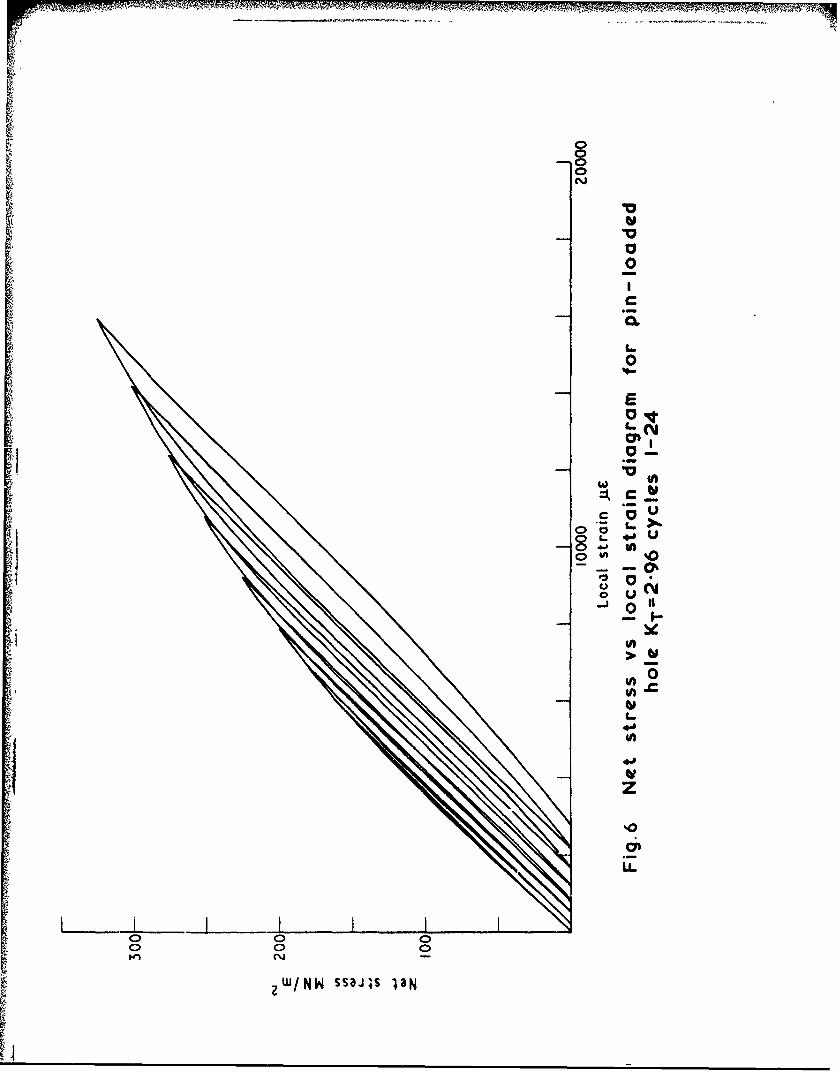
is shown in Fig.'. For comparison Fig.6 shows a net stress versus local strain
diagram obtained from a pin-loaded hole under the same conditions, and Fig.7 is
the corresponding local sti-ess versus local strain diagram.
Examination of these and other grephs revealed the following trends:
The maximum strains reached at each peak were groater for the notch than
for the pin-loaded hole, being about 26% greater at the maximum peak in
the first ascending sequence. This is only partly explained by the
observed difference ýn elastic stress concentration factor.
The hysteresis loops in the net stress versus local strain diagrams were
much wider for the notch than for the pip-loaded hole. It is not known
what, if any, effect this difference would have on fatigue performance.
The residuai stresses following each peak load were approximately the
same for both structural features, the difference beiv., generally about
2%. However, this could be expected as the post-yield -tress-strain
curve of the material used in this investigation was almost horizontal.
Had the stress-strain curve been less flat in the plastic region, the
difference in strains at each peak noted earlier would be expected to
result in a greater difference in residual stresses.
It has already been noted that in the elastic region the stress ranges in
the pin-loaded hole were from 0 to 10% lower than in the notch. Following
first y. 1 it was observed teat differences in stress range were generally
reduced.
6
In summary it may be stated that, for the case considered, there seems to
be no significant difference it: local stress ranges, from a fatigue damage point
of view, between a notch and pin-loaded hole of the same nominal stress concen-
tration factor. Furthermore, again for the case considered, a pin-loaded hole
can be treated as an open hole of the same Kt when applying a residual stress
correction to life prediction, such as that suggested by ESDU. However, it was
found that the maximum strains formed at each load peak were up to 26% less in
the pin-loaded hole than the notch. This effect would be expected to result in
a greater difference in residual stresses in the two components if th•e material
concerned had a post-yield stress strain curve which was not so flat.
3 EVALUATION OF A NEUBER TEST PREDICTION OF LOCAL STRESS HISTORY AT THEOPEN HOLE
Neuber Testing allows direct simulation on a plain specimen of the local
stress history at the root of a notch in a structural component without measure-
ments on the actual specimen. The aim of this programme was to assess hiw
accurately a Neuber Test could reproduce the Companion Specimen local stress
measurements determined on the notched component described In zhe pre_>us
section. A secondary objective was to consider what improvements could be made
to the Neuber Test used in this work, should errors prove to be unacceptable.
3.1 Specimens and material
The plain specimens used in thii work are as shown in Fig.2. They were
cut from the same bar of DTD 5014 aluminium alloy as th• specimens used in the
companion specimen work described in the previous secc*o • thus allowing a
direct comparison.
3.2 Summary of tests
Neuber's Rule ani the basis of the Neuber Test are described in Appendix A.
Briefly, this method relies on an equation which relates the local stress and
strain ranges to the net stress range by the stress concentration factor and
Young's modulus:
K 22= Aeto . (1)
Neuber Tests were carried out on plain specimens using the sequence of
net stresses shown in Fig.3 which was used in the Companioi, Specimen 'rests of
section 2. In order to investigate some of the differences obtained, tests were
carried out using a single load up to a large peak value and some simple two
step tests were also conducted.
7
3.3 Results and discussion
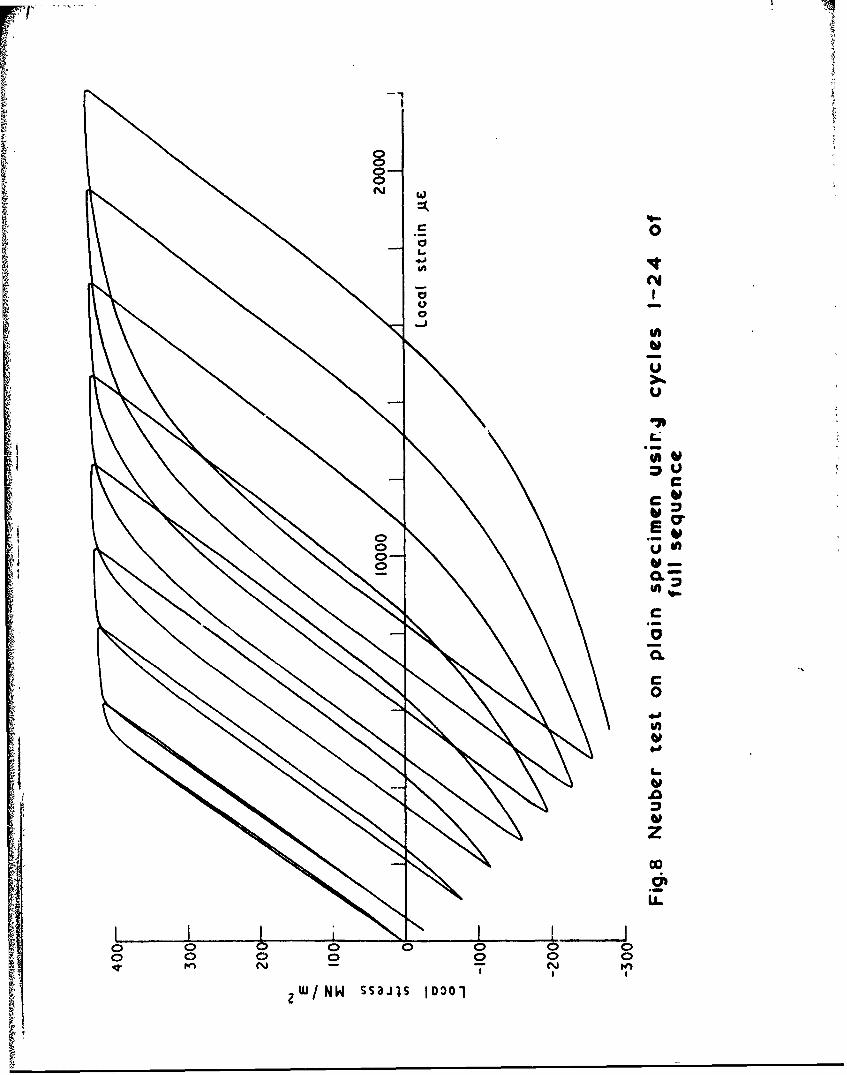
Fig.8 shows a typical graph of local stress versus local strain produced
by a Neuber Test for the first ascending sequence, i.e. load stages 1-24 of
Fig.3. This should be compared with Fig.5 which is the corresponding local
stress versus local strain diagram obtained from Companion Specimen Testing, the
method widely believed to reproduce accurately the local stress-strain history
in a notch. It was found that in the Neuber Test the accuracy of simulation
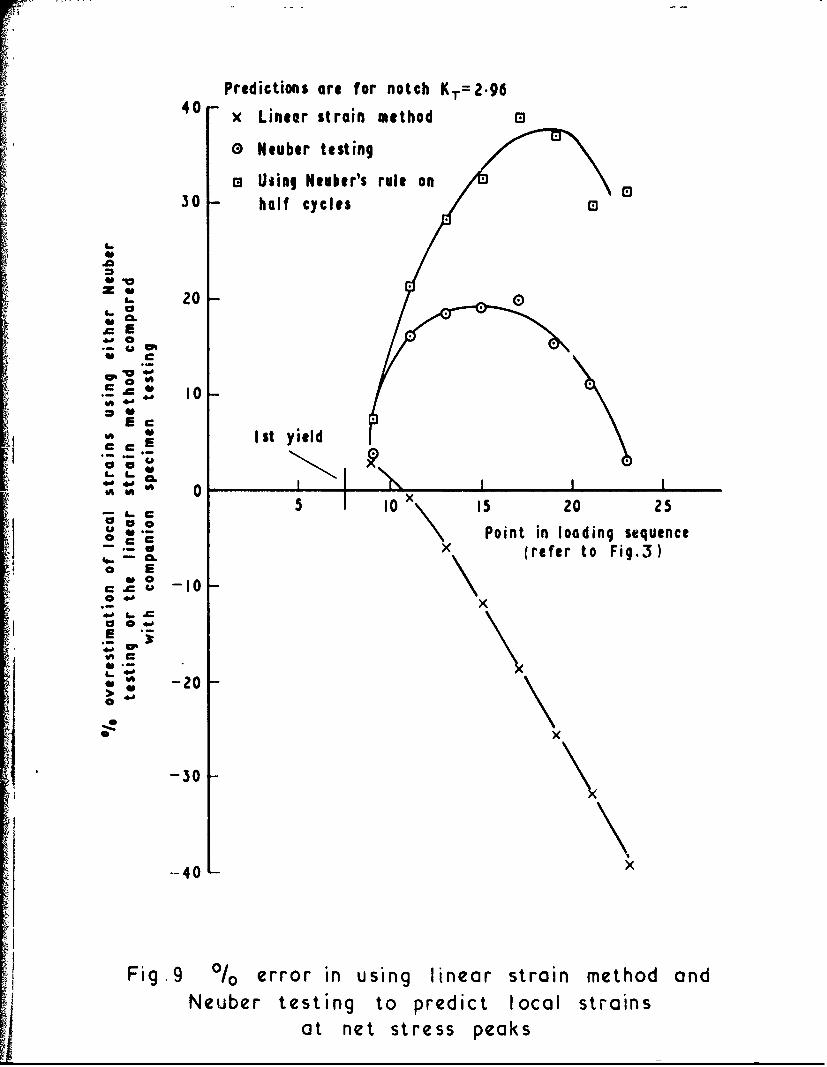
varied from cycle to cycle. Fig.9 shows that the maximum strain attained at
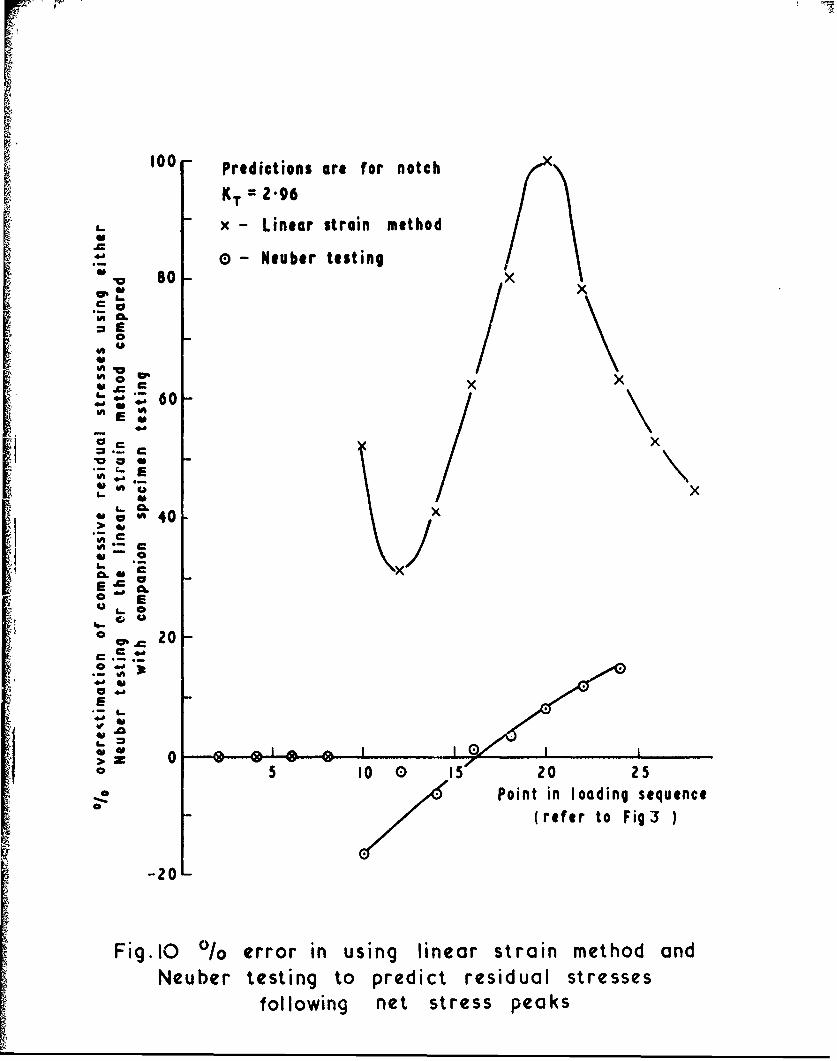
each load peak was over-estimated by between 3% and 20% whilst Fig. 10 shows that
the compressive rcsiduai stresses following each load peak varied from under-
estimation by 17% to over-estimation by 15%.
However it was considered that these errors might be specific to the way
in which Neuber's Rule worKs when applied to this type of load sequence.
Accordingly an investigation was made '.f the values obtained by the Companion
Specimen and Neuber Methods for a single application of load up to a peak net
stress instead of for an ascending sequence up to the saiwe peak. Tests were
carried out using first a stress change 0-300MN/m2 and secondly the sequence of
Fig.3 up to the net stress change 0-300MN/m 2 . Whereas the Companion Specimen
Method produced local strains after the two loadings which were within 5.4% of
each other, the Neuber 'lasting predicted that the fin..i local strains after the
two loadings would differ by 17%.
Appendix B describeb the way in which Neuber's Rule can lead to differences
in local stress-strain history simulation, when applied to the type of sequence
employed in this Report. It shows that Neuber's Rule applied to an idealised
stress-strain curve will predict a different value of local stress and strain
after a net stress change of 0-325MI/m2 from those obtained after the sequence20-200-0-325MN/m . However, the Companion Specimen Method showed that after the
two loadings the local strains were within 2.9% and the local stresses within
0.3%.
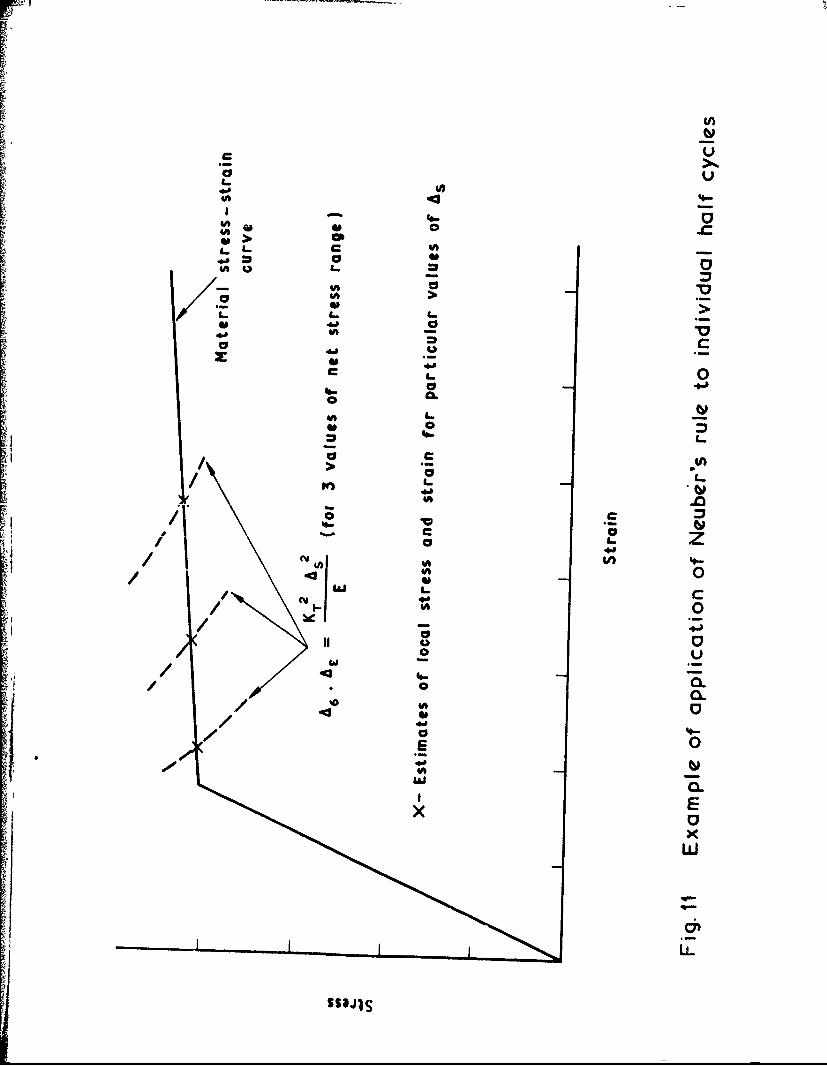
3.3.1 Seluence broken down into individual half cycles
To further investigate the performance of Neuber's Rule, theoretical
estimates were made of local stress and strain for each zero to peak half cycle
in Fig.3, as if each one started with a virgin specimen.
Using equation (1) the Neuber constant was calculated for each zero to
peak Yalf cycle. This aliowed the hyperbola for each Qtress range to be plotted
8
on the matericl stress-strain diagram as in Fig.1I. 'ihe point where each
hyperbola intersected the actual stress-strain curve gave an e.'imate of the
local stress and strain after each halt cycle. The value of Kt used vas 2.96,
the ei=atic stress concertration factor.
The estimates of local strai.- after each half cycle were compared with
those obtained in the Companion Specimen Testing, and the results are plotted in
Fig.9. In all cases the maximum locIl strain at each net stress peak wa; over-
estimated, the greatest error being .17%. It can be seen that these estimates
were more inaccurate than those obtained using the Neuber Test on the full
sequence.
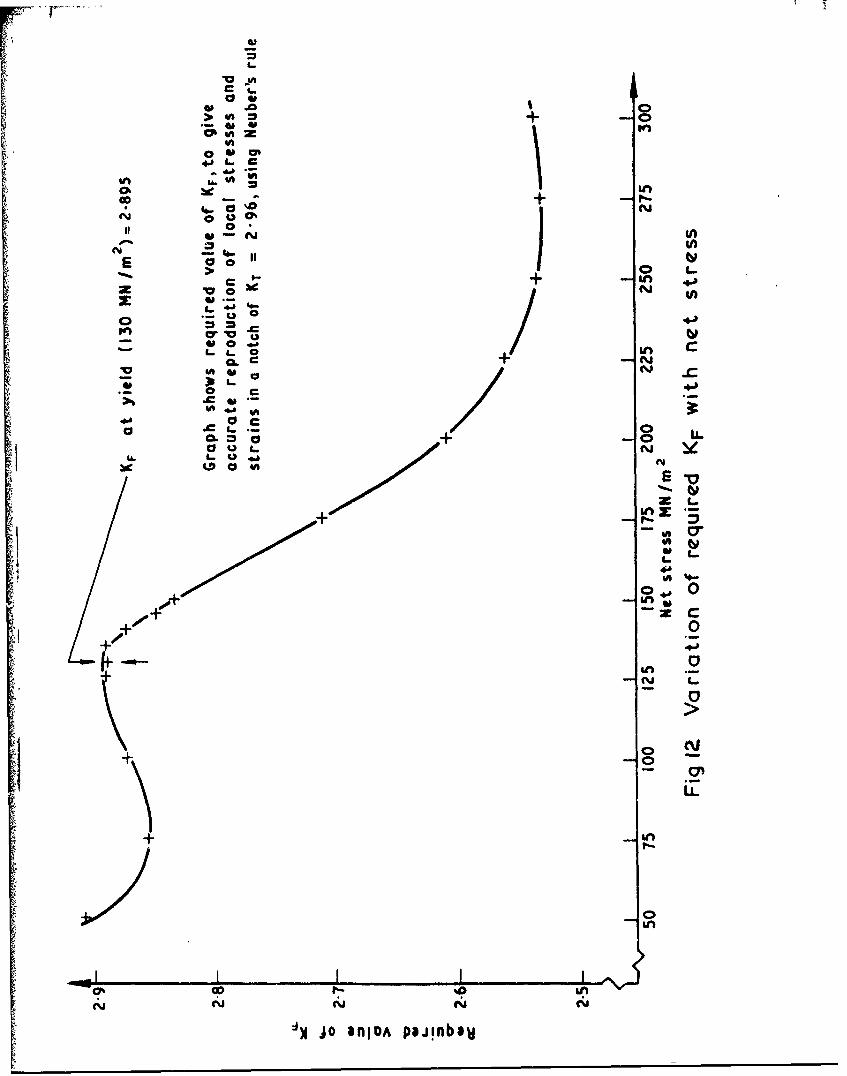
3.3.2 Determination of required Kf to give accurate simulation of
local stresses and strains
The over-estimation of local strains discussed above is well known and the
Inctor K is often replaced by the so.-called fatigue notch factor Kf , in
order to improve the simulation of luea- -tress-strain haistory Kf generally
has a lower value than Kt aad several methods have been pr.c~sed for calculat-
ing a value of Kf . For example one method 7 yields a value of Kf a 2.516 for
the particular notch used in this Report, whereas another methcd produces a
value of 2.747.
Instead of repeating Neuber Tests using revised values of Kf , it was
decided to calculate the required value of Kf to give accurate simulation of
each individual zero to peak half cycle in the Companion Specimen Results,
assuming each half cycle started with a virgin specimen.
Rearranging equation (1), and replacing Kt by Kf
2 AoAcEKf A s2
Kf was calculated for each zero to peak net stress half cycle. The value of
local stress and strain, Ac and Ao , were those obtained in the Companion
Specimen Testing on the notch of Kt 2.96 .t
The results are plotted in Fig.12, which shows the variation required in
Kf versus net stress, in order that Neuber's Rule would accurately reproduce the
local stresses and strains at each net stress peak in the sequence. This shows
9
Kf varying from 2.9 to 2.52, i.e. no consiotent value st K_ was found. A
similar variation has been found by other workers
It was then decided to apply the same technique to obtain the value of Kf
needed to eliminate the errors in Neuber Testing when applied to the full
sequence. The requireA value of Kf was calculated for each balf cycle
assuming that a full Neuber Test was carried out on one plain specimen, i.e. that
it was cycled through the full sequence of Fig.3. Thus the start of each half
cycle was the end of the last half cycle, not the origin of the stre~ss-strain
diagram as in the previous calculations. In this case it was found that Kf
for all cycles was 2.75 ± 3% compared with values varying from 2.9 to 2.52 for
the single cycle case. It is thought probable that the constancy of Kf for the
full sequence was due to the fact that in this sequence the net stress range was
increased by equal amounts in successive cycles.
A method has been proposed10 which seeks to allow for previous loading
history by considering what is referred to as 'material memory'. This is done
by shifting the origin coordinate pcints for each cycle as soon as the stress-
strain condition returns to thi previously interrupted path. In the case of the
ascending sequence employed in this Report, w'hen the stress-strain path rejoins
the original curve on a zero to peak stress change, the coordinates of the start
of the cycle would be shifted back tu the .rigin of the stress strain curve.
Thus each zero to peak stress change would be assumed to have started with a
virgin specimen. If, however, a peak to zeco stress change were interrupted
w'th a small cycle then, on continuing with the main peak to zero cyi1e, the
coordinates of the origin would need to be shifted back to the original peak.
This resetting of the origin and necessary storage of previous lodjin8 history
add a further complication to the Neuber Control computer program. Theoccurrence of appreciable strain hardening or softening would introduce further
difficulties with this method.
4 LINEAR STRAIN METHOD PREDICTIONS OF LOCAL STRESS HISTORY AT THE OPEN HOLE
The Linear Strain Method is commoniy used in the aircraft industry during
life prediction when estimating residual stresses formed in components during
spectrum loading. The method is briefly described in Appendix C.
4.1 Predictions
The method was used to make estimates of:
10 ,
(a) local streso and "-.in at each net stress peak in thb sequence
shown in Fig.3, assutaing each one started with a virgin specimen;
(b) residual stresses at zero l,)ad following each net stress peak,
under the same conditions as in (a).
4.2 Results and discussion
The accuracy of prediction was determined by comparison with the Companion
Specimen data, and the results of this exercise are plotted in Figs.9 and 10,
together with the results of the Neuber Testing.
In tne case of the Linear Strain Method it can be seen in Fig.9 that the
maximum strain attained at each peak was very much under-estimated; the
predictions were up to 40% less than the actual readings. This, and the fact
that no allowance was made for the Bauschinger Effect led to the result shown
in Fig.10 that the compressive residual stresses at zero load following each
load peak were greatly over-estimated. (The Bauschinger Effect is the reduction
in compressive yield stress foll3wing tensile yield.) Thus the Linear Strain
Method in this form as recommended by ESDU 4, compares poorly with Companion
Specimen Testing.
5 CONCJ.USIONS
Measurements and pre2ictions have been made by different miethods of the
local stress histories under variable amplitude loading at open holes andr, in-
ioaded holes with particular reference to fatigue life estimation.
(a) Comparison of an open hole and a pin-loaded hole of the same stress
concentration by the Companion Specimen "'ethod for an ascending sequence of zero
to peak stress ranges showed no significant difference in local stress ranges
or iesidual stresses. However, the maximum strains were considerably greater
at the open hole and differences in residual stress could be expected for a
material with a less shallow post-yield stress-strain curve.
(b) A comparable Neuber Test was found to over-estimate maximum strains and
g:-" a range of error in residual stresses. It was concluded that for a Yeuber
Test to 6:ve an accurate reproduction of the local stress-strain behaviour ixý h
notch, the factor Kt should be replaced by a variable factor Kf , and that it
may be necessary to allow for previous loading history.
(c) Estimates of residual stresses by the Linear Strain Method in the form
currently suggested by ESDU for life prediction were very inaccurate, mainly
I7
because no allowance was made for the Bauschinger Effect. In addition, if the
method were applied to a material with a post-yield stress-strain curve which
is far from horizontal, then the over-estimation of compressive residual stresses
would be even greater due to the under-estimation of the local stress and strain
at the peak load.
13
Appendix A
"NEUBER'S RULE AND ITS APPLICATI )N TO A NEUBER TEST
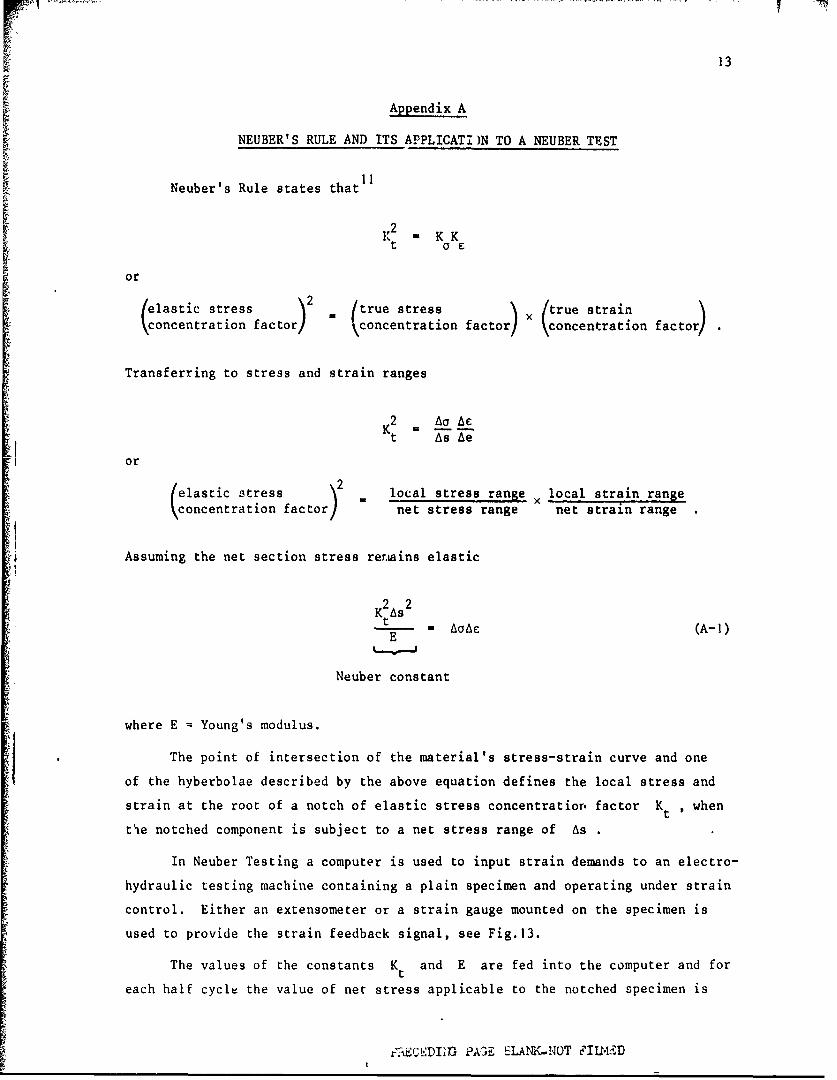
Neuber's Rule states that 11
2K - K K
or
( elastic stress )2 = true stress )(true stra in fatrconcentration factor \concentration factor concentration factor)
Transferring to stress and strain ranges
S2 _o At As Ae
or
elastic stress 2 local stress range local strain range
(concentration factor) net stress range net strain range
Assuming the net section stress rem.ains elastic
K2s2K 2As2t t - . AC (A-I)
Neuber constant
where E = Young's modulus.
The point of intersection of the material's stress-strain curve and one
of the hyberbolae described by the above equation defines the local stress and
strain at the root of a notch of elastic stress concentratiorn factor K , whent
the notched component is subject to a net stress range of As
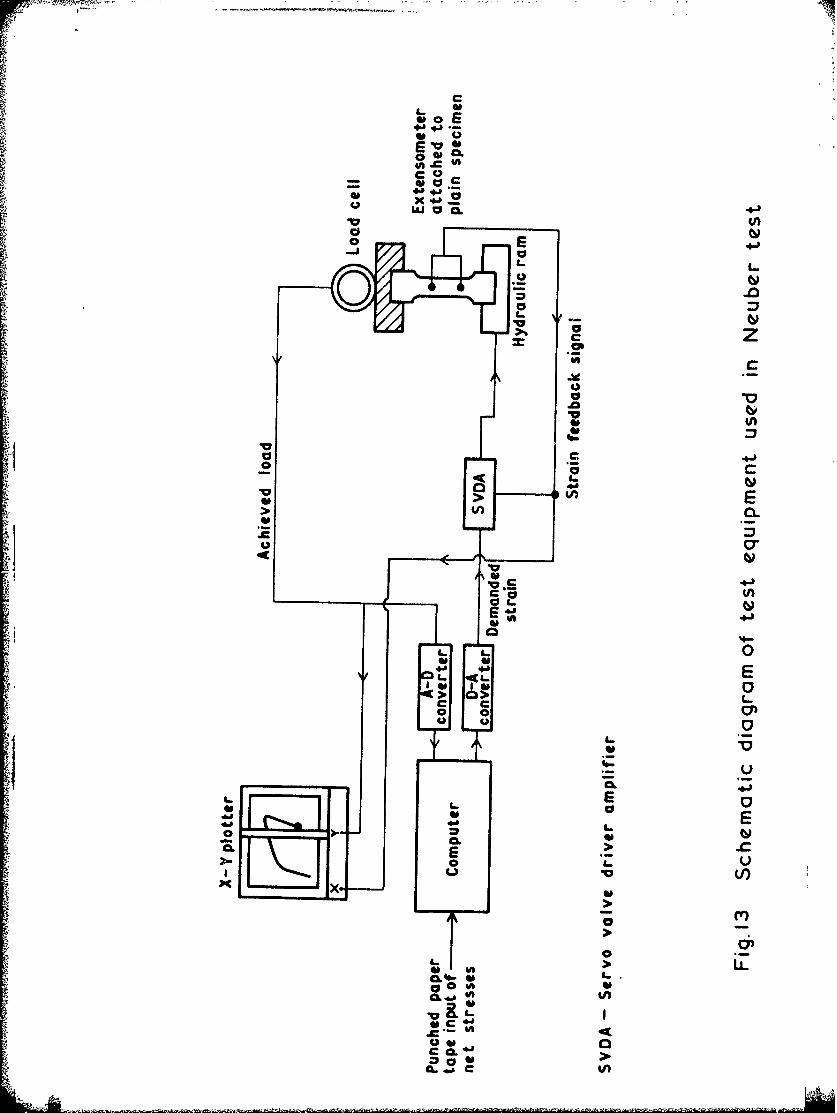
In Neuber Testing a computer is used to input strain demands to an electro-
hydraulic testing machine containing a plain specimen and operating under strain
control. Either an extensometer or a strain gauge mounted on the specimen is
used to provide the strain feedback signal, see Fig.13.
The values of the constants Kt and E are fed into the computer and for
each half cycle the value of net stress applicable to the notched specimen is
i*.ThECODIJ PAGE ELAK-NOT MI*M¶D
14 Appendix A
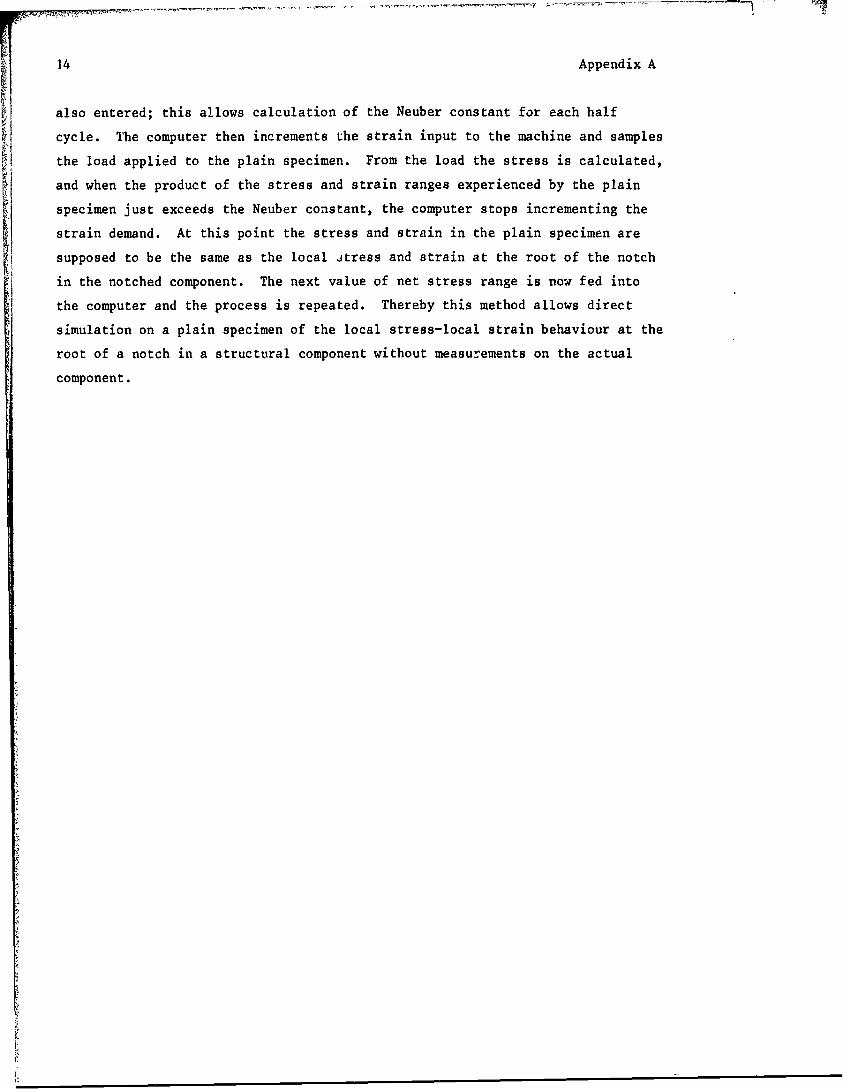
also entered; this allows calculation of the Neuber constant for each half
cycle. The computer then increments the strain input to the machine and samples
the load applied to the plain specimen. From the load the stress is calculated,
and when the product of the stress and strain ranges experienced by the plain
specimen just exceeds the Neuber constant, the computer stops incrementing the
strain demand. At this point the stress and strain in the plain specimen are
supposed to be the same as the local itress and strain at the root of the notch
in the notched component. The next value of net stress range is now fed into
the computer and the process is repeated. Thereby this method allows direct
simulation on a plain specimen of the local stress-local strain behaviour at the
root of a notch in a structural component without measurements on the actual
component.
15
Apendix B
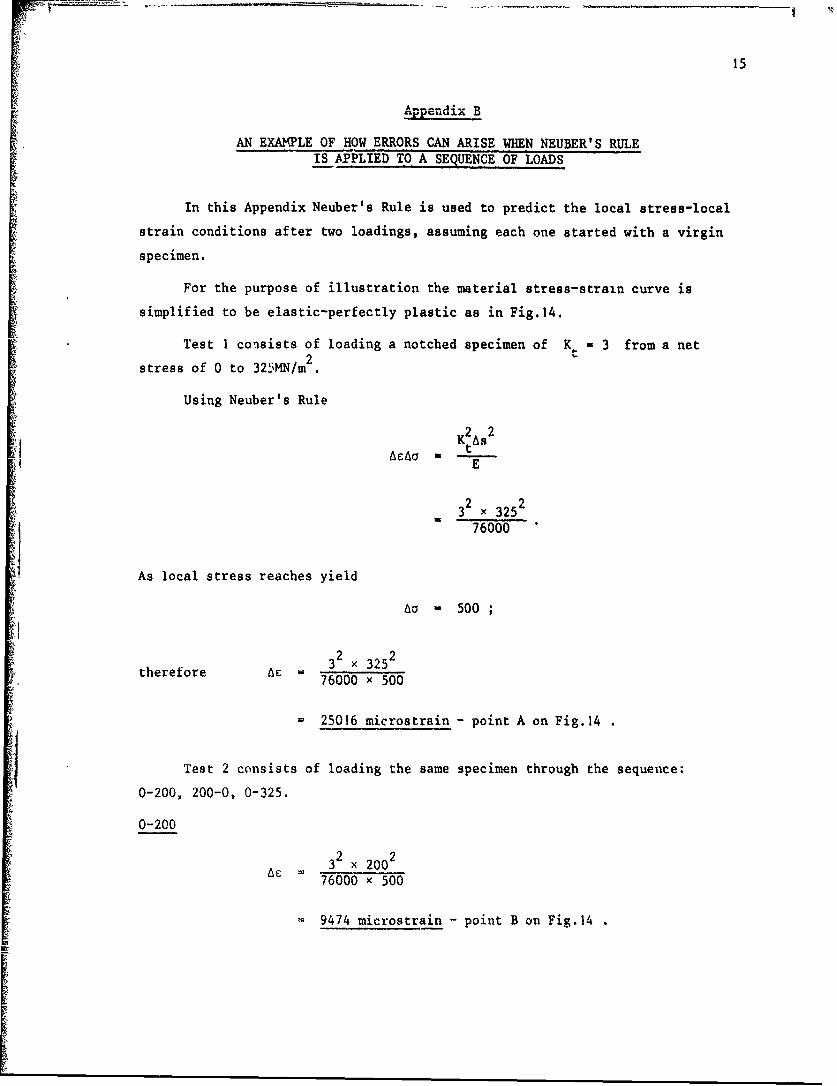
AN EXAMPLE OF HOW ERRORS CAN ARISE WHEN NEUBER'S RULEIS APPLIED TO A SEQUENCE OF LOADS
In this Appendix Neuber's Rule is used to predict the local stress-local
strain conditions after two loadings, assuming each one started with a virgin
specimen.
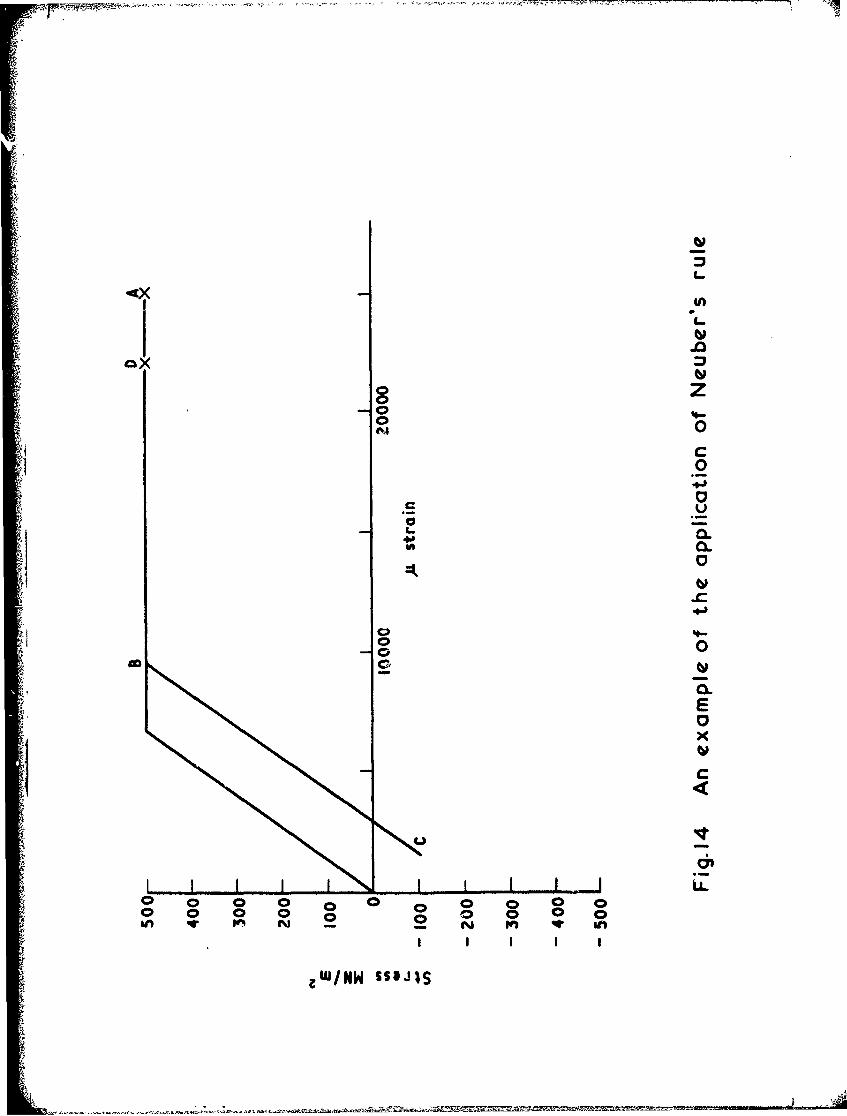
For the purpose of illustration the material stress-strain curve is
simplified to be elastic-perfectly plastic as in Fig. 14.
Test I consists of loading a notched specimen of K. - 3 from a net2
stress of 0 to 325MN/m
Using Neuber's Rule
K 2As 2
AcA•E
32 x 3252
76000
As local stress reaches yield
Ao 500;
32 x 3252therefore Ac - 2
76000 x 500
= 25016 microstrain - point A on Fig. 14
Test 2 consists of loading the same specimen through the sequence:
0-200, 200-0, 0-325.
0-200
32 x 2002
76000 x 500
9474 microstrain - point B on Fig.14
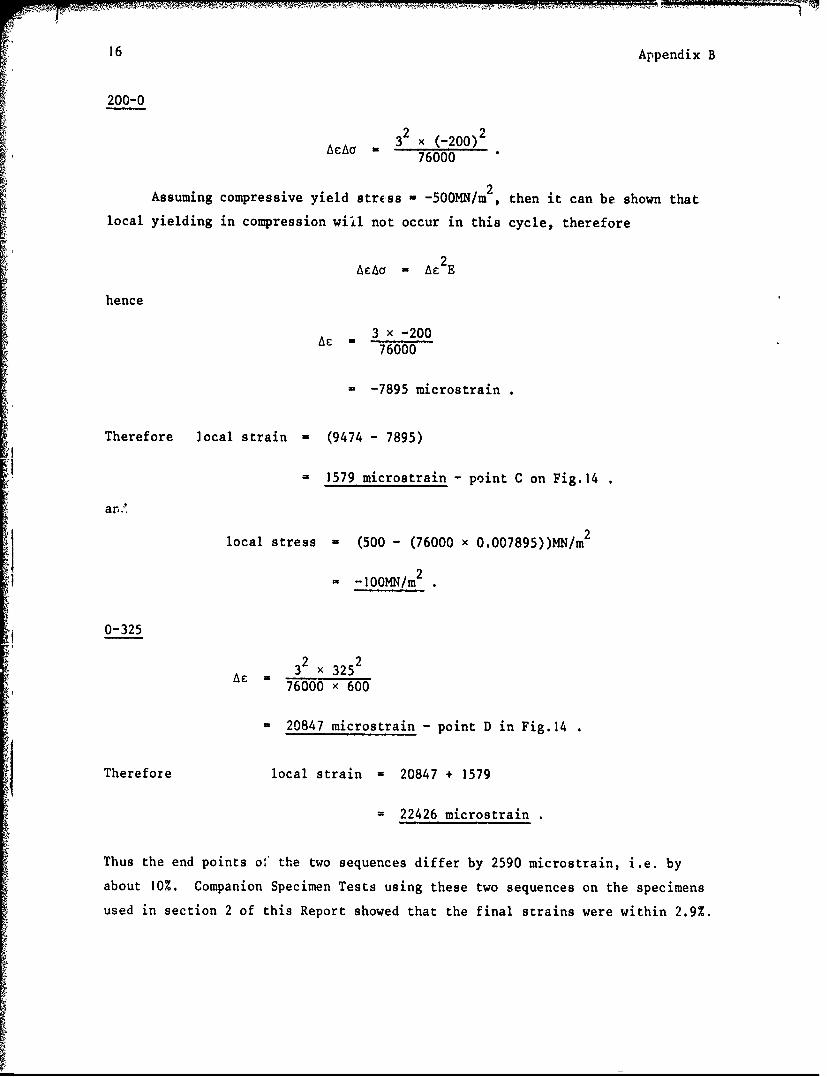
16 Appendix B
200-0
2 23 x (-200)
76000
2Assuming compressive yield stress - -500MN/m2, then it can be shown that
local yielding in compression wiIl not occur in this cycle, therefore
2AE•a = A2E
hence
3 x -20076000
= -7895 microstrain
Therefore local strain - (9474 - 7895)
1579 microstrain - point C on Fig. 14
arc.
local stress - (500 - (76000 x 0.007895))MN/m 2
2M -IOOMN/m
0-325
32 x 3252AE 76000 x 600
= 20847 microstrain - point D in Fig.14
Therefore local strain = 20847 + 1579
= 22426 microstrain
Thus the end points of the two sequences differ by 2590 microstrain, i.e. by
about 10%. Companion Specimen Tests using these two sequences on the specimens
used in section 2 of this Report showed that the final strains were within 2.9%.
17
Appendix C
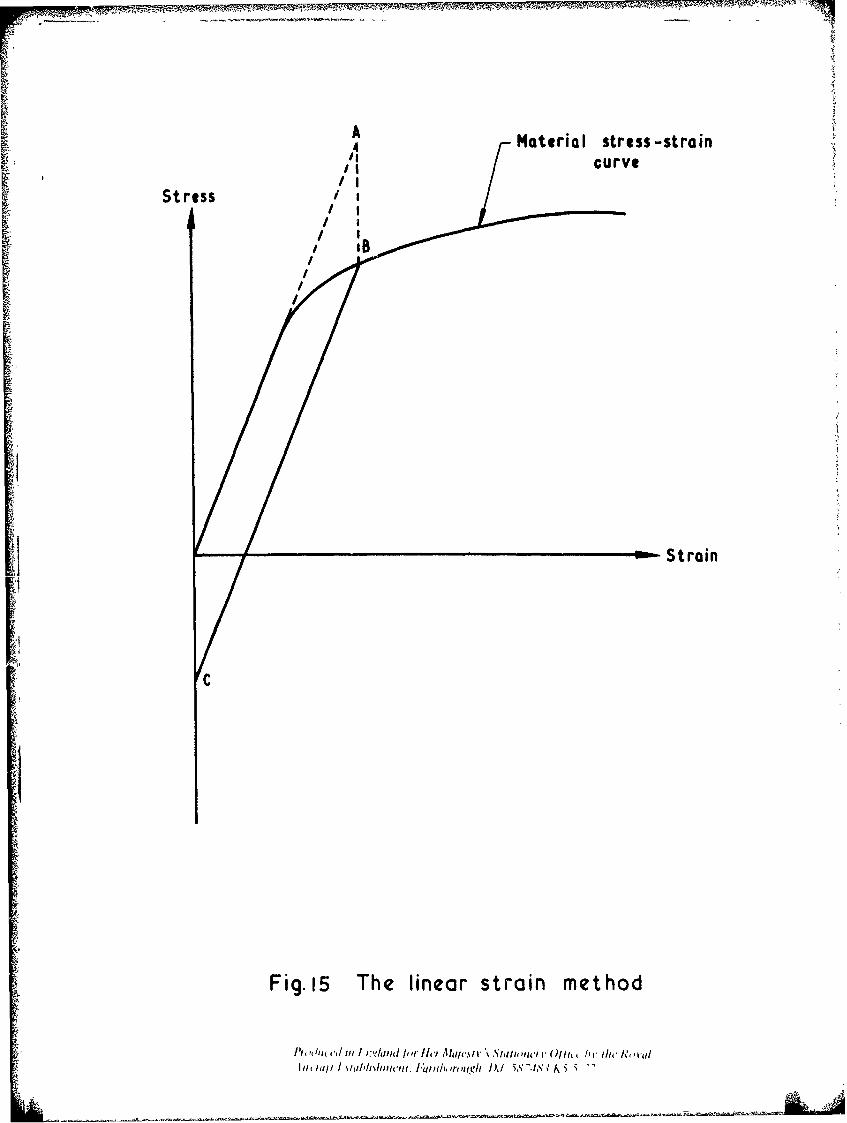
THE LINEAR STRAIN METHOD OF PREDICTING VALUES OFRESIDUAL STRESSES FORMED BY PEAK LOADS
This method is demonstrated in Fig.15. For a particular peak the local
stress and strain is calculated assuming purely elastic behaviour:
local stress - (nominal stress) x Kt
local strain = local stress
Young's modulus
These give point A on the diagram. A vertical line is drawn from this point to
meet the material stress-strain curve at point B. A line is then drawn through
B parallel to the initial elastic loading line such that the stress range
satisfies equation (C-i), giving point C; should compressive yielding occur this
point is usually assumed to be equal and opposite to the tensile yield. Thus if
point C lies beyond this point the residual stress is taken to be the compressive
yield stress. This method can be further modified to take account of the
Bauschinger Effect.

18
SYMBOLS
Kt theoretical elastic stress concentration factor
Kf fatigue strength reduction factor or notch factor
K actual stress concentration factor
K actual strain concentration factor
As net stress range
Ae net strain range
tAC local stress range
AC local strain range
E Toung's Modulus of elasticity
I,

19
REFERENCES
No. Author Title, etc.
I P.R. Edwards Cumulative damage in fatigue with particular reference
to the effects of residual stresses.
ARC Current Paper 1185 (1971)
2 J.H. Crews Jr. A study of cyclic plastic stresses .t a notch root.
H.F. Hardrath Exp. Mechanics 23, pp. 3 13- 32 0 (1966)
3 S.J. Stadnick Techniques for smooth specimen simulation of the fatigue
Jo Dean Morrow behaviour of notched members.
Testing for prediction of material performance in
structures and composites.
ASTM STP 515, pp.229-252 (1972)
4 Cumulative fatigue damage calculations (effect of
correcting mean stress at stress concentrations).
Data sheets on fatigie No.71028, Engineering Science Data
Unit, Royal Aeronautical Society (1971)
5 Elastic stress concentration factors. Geometric
discontinuities in flat bars or strips of isotropic
materials.
Data sheets on stress concentrations No.69020. Engineer-
ing Science Data Unit, Royal Aeronautical Society (1969)
6 Stress concentration data.
Data sheets on stress concentrations No.65004. Engineer-
ing Science Data Unit, Royal Aeronautical Society (1965)
P. Kuhn Notch effects oit fatigue and static strength.Symposium on aeronautical fatigue sponsored by ICAF andStructures and Materials Panel of AGARD, Rome, April 1963
8 T.H. Topper Neuber's Rule applied to fatigue of notched specimens.
Jo Dean Morrow US Naval and Engineering Centre, Aeronautical Structures
R.M. Wetzel Laboratory, Report NAEL-ASL-114, June 1907
9 A. Conle A numerical method for fatigue life prediction.
U. Schulz Proceedings of Conference on dimensioning and strength
H. Nowack calculations and Congress on material testing, Budapest
28 October 1974 to 1 November 1974
20
REFERENCES (concluded)
No. Au.thor Title, etc.
10 D. Hanschmann Fatigue behaviour of notched components as evaluated by
K.H. Trautmann the Companion Specimen Method and the Neuber Control
H. Nowack concept.
International Conference 'Fatigue testing and design',
SEE Fatigue Group, City University, London, England,
April. 1976
11 H. Neuber Theory of stress concentration for shear strained
prismatical bodies with arbitrary nonlinear stress-
strain law.
Trans. ASME, J. of Appl. Mech., pp.544-550 (1961)
K'
'4
K'
K of notch and pin- loaded hole 2.96
25.39 dia 11
4"o
(O
N
d-• • gougesa
NotchN
Pin-loadedhole
64"26 IO.-..
Material-DTD 5014
6.4
b
Scale: "12Material: SOONominal dimensions in mm
Fig. I a a b Pin loaded/notched specimen and loading pin
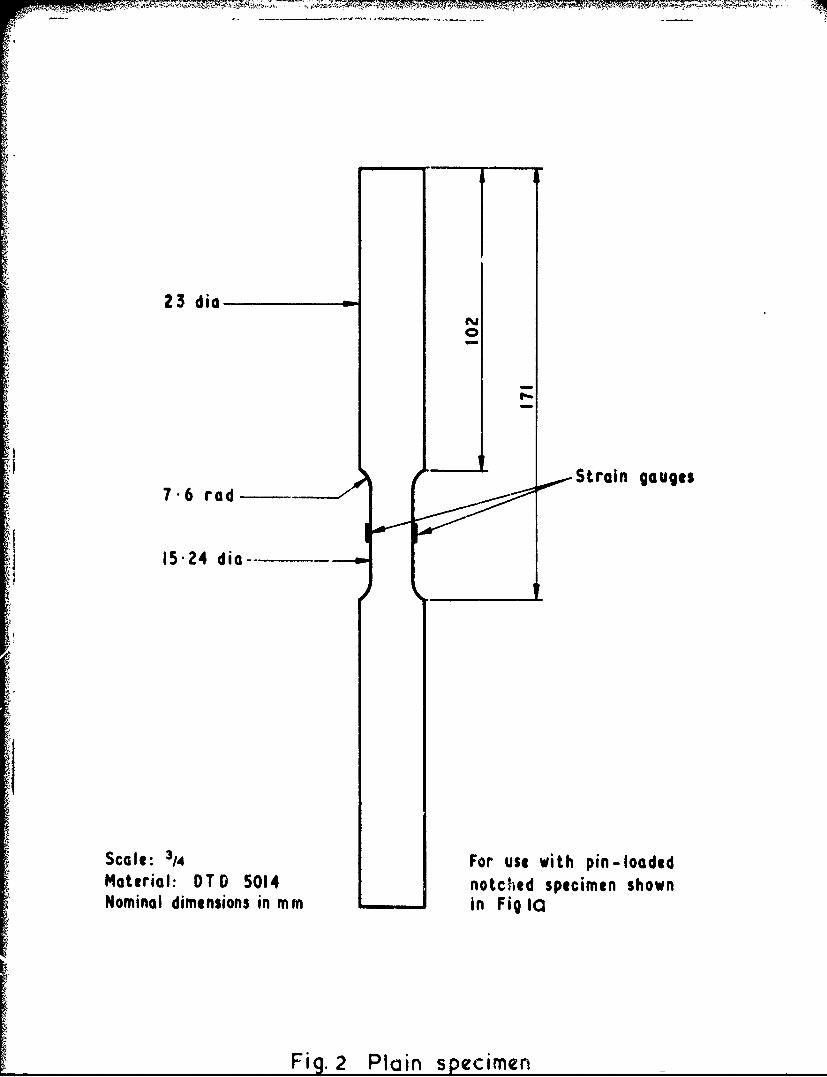
23 dia
~tt.
_4 Strain gauges7.6 rad
15"24 dia-
Scale: 3/4 For use with pin-loadedMaterial: DTD 5014 notched specimen shownNominal dimensions in mm in Fig la
Fig. 2 Plain specimen
40
IM.
L..06)
0.
c
fV
co 0
L4-
.......... ......... .....
rvo
?w/NWSs3JS IO
KU � .wna.at.wa.wwj -'
(Vo Io -0oN
U�tt
U
'00'Cs'III-
rU4'
j 0C
I-0
a'1 a,
S� .5- VC Lo *ao y�-J
.5U.2IA'p
toInI4'tlz
it'
It
&I:
I I I I Io 0 0 0o 0 0
N
wz /NN SISJIS 1�N
i g~i
00 -
U)
0 -
0~
06
c c
0U
0U
0
Ln
ii(7U
*1 eD0
r4.
zuj/ N ssais DC0
w
%00
C>C
C) 0
,w/NWss3J's 13
La) V)
44
4-. (0
u ý
0 w-
C.
o(9
00
0 41.
In-NW ssaJs ID3.
CUU
I-
00
C~j W NW S3JjS ID3'
Predictions are for notch KT=2.9640- x Linear strain method a
0 Ntuber testing
1 Using Neuber's rule on30 half cycles
4Z
L/
2" 0 0
.0- 20
1 -
C
Ist yield4 'UCAL
- 0 0
6- 4 C 0x1 02
CS ° Point in loading sequenceN* teX (refer to Fig.3p
a.E*0
0
*x
--40
Fig .9 0/0 error in using linear strain method andNeuber testing to predict local strains
at net stress peaks
100- Predictions are for notch
KT 2"96.- x - Linear strain method
- Neuber testing
LO £
E0
0 x x
60 60V~mI
x~.-: C
Sx
""�40 ×
E CL'0 E
O F. 20-
C EC.- .--.-. •i• •
5 00 IS 20 25Point in loading sequence
(refer to Fig3 3r•
-20
Fig.10 0/o error in using linear strain method and
Neuber testing to predict residual stresses
following net stress peaks
C C(IU)
An 0
ta
""# V41 >
U I.
a 06
* 0
LLL
I E0 Z
/ CP
m ls 0
o U
w -
8s~ 0.
S~aJ10
41
L: #
* .0 0~
00
0 Z
LL, N
Zi ZaP.-00 / 4/'- *0..o
LL. 0+ Ina. C N
0
*C* - 0 c
*C1
+1 M JOIii a.no
C&
.J 0 06
0 4. 4
40w0
CO
= SCLSE
0 "
r--
}V
LL
>z
a'* " L..
i•~~C 0 %A" -• 1
L, -
!6= a
*0 0In I
+4.. a _ +4.+++• .++++ i. ........ . ...... .. ....... . ... ............... . .. .. . .......... ..+ .. .... _.......... ....... ... . .. .............o ... .. .............., ........
75
S z00
o 0
c
CL
41b
0
-c
0 00 0Ln r - m on i
awNWSS0I
A Material stress-strain
c'Iurv
Stress
II
I/
FTrnStrain
Fig. 15 The linear strain method
hodmi-d m / i:I,',l d /l'r IAo ANalcm,%saim r XIjUO ,I //I(, Rol ' I /lik t
%1(1,11ýmcw Ninonw, A/ss'.s if i
0r
E I
z j4. -z E6~~- - W)cs. 0 :0ýc
0 C:
.- = 0
E 0 E8-
<Z E
,14 0 IE -gU
I- ýn
0e t: 'e' I.
-) -.- e
WU ý E 42C,- . -0 U-- 0 20O Z 6W :ý- U, ý.! 2 I0. r; .. s
-~~~~~A3 OC)'C0.-.~'051 R' .
S0 0 V
IL .~ . .I.= 1.
C.P. No, 1374
1977
Published byHER MAJESTY'S STATIONERY OFFICE
Goverment Rookdsops49 Hith Holborn, London WCIV 6HB13a Catle Street, Edinburgh EH2 3A1
41 The Hayes, Cardiff CFI IJWBrazennose Street, Manchester M60 8AS
Southey House, Wine Street, Bristol BSI 2DQ258 Broad Street, Birmingham BI 2HE80 Chichester Street, Belfast BTI 4JYGovernment Publktons a alo am ailble
throuh booksellers
C.P. No. 1374ISBN 011 471120 8