Embed Size (px)
Citation preview
A study of mechanisms of genotoxicity in
mammalian cells by retrovirus vectors
intended for gene therapy
A thesis submitted for the degree of
Doctor of Philosophy
By
Safia Reja
Biosciences, School of Health Sciences and Social Care
Brunel University
September 2013
Abstract
i
Abstract
Retrovirus gene therapy vectors can deliver therapeutic genes to mammalian cells in a
permanent manner by integrating their genome into host chromosomes and therefore
provide the potential for long term therapeutic gene expression. Retrovirus integration,
however, can be oncogenic. Apart from insertional mutagenesis (IM) genotoxicity may
be caused by other factors including DNA damage following infection and integration
and epigenetic effects related to incoming viral particles. Thus, using retrovirus and
lentivirus infected murine tumour tissue and infected cell lines in vitro this thesis was
directed at investigating whether virus infection and integration could cause
genotoxicity by alternative route(s) other than IM.
Using clonally derived liver tumours that developed in mice, and normal liver and
kidney tissues, following EIAV and HIV delivery in utero, comparative genome
hybridisation methodology was used to examine for copy number variation. This
showed amplification and deletions only in EIAV derived tumours. Real time Q-PCR
analysis was then used to measure gene expression changes relating to genes contained
within or near to amplifications observed in two tumours of individual mice. The
STRING database was then used to find networks linking genes with differential
expression profiles and genes in one of these tumours identified with provirus insertions
that were also differentially expressed. These data provided preliminary data
implicating a role for LV in Hepatocellular carcinoma (HCC).
DNA damage is known to cause chromosomal instability that can lead to tumour
development. The relationship between double strand breaks (DSB) and virus infection
was also investigated in-vitro to find alternative routes to genotoxicity other than IM.
Cell viability analysis demonstrated cells with a defective DNA damage response
(DDR) have decreased cell viability compared with cells with intact DDR when
infected with RV or LV vectors. DSB assays showed RV and LV infection to generate
foci over a 6 hour period followed by DDR. Where no viral integrase is present, no
DDR appears, however, where the vector is used with or without a genome to infect
cells, DDR occurs as shown by the presence of 53BP1 foci indicative of DNA damage.
The relationship between DNA damage and methylation was also investigated. Global
methylation was found elevated in the genomic DNA of LV and RV infected cells and
not in control uninfected cells. In contrast, methylation changes were not found in
Abstract
ii
infected cells lacking the NHEJ repair pathway. These data suggest the DNA damage
response is linked to genome methylation. The E2F transcription factor plays a key role
in regulating expression of genes known to control oncogenesis and cancer, and E2F is
regulated by methylation of its related target gene promoters. Taking into account all
genes in the human genome the number of genes that bind E2F is 32.77%. However,
using microarray to represent genes differentially expressed after infection, 59% of
these were E2F targets.
Overall, taking the data obtained in this thesis into account it may be suggested that RV
and LV infection causes a number of potentially related changes to cells that include
DNA damage and repair and methylation changes that could influence E2F that is an
important factor involved in oncogenesis. Combining this with IM, attenuated RV and
LV currently in use for gene therapy may cause genotoxicity to infected cells and
increase the risk of oncogenesis especially where DNA damage is not correctly
repaired. Further work is required to show in greater detail the extent of this
genotoxicity, possible by whole genome sequencing of treated host genomes or cell
transformation assays linked to the genotoxicity assays presented here.
Collectively these data show that alternative factors to IM might exist that could act
independently or synergistically to IM.

Declaration
iii
Declaration
I hereby declare that all the work presented in this thesis has been performed by me
unless otherwise stated.
Safia Reja

Acknowledgements
iv
Acknowledgements
I would like to first of all thank my supervisor, Dr Michael Themis for his guidance,
support, strength, and encouragement throughout my PhD. The pure passion and
enthusiasm he conveys has been the keystone for my morale and has kept me going for
the last 4 years. I am highly grateful for this special experience that I will always
treasure and thank him for giving me this opportunity.
I would like to express my sincere thanks to Dr Matthew Themis and Dr Christopher
Parris for the trainings, support, and advice they have always given me since the
beginning of my PhD.
I would like to acknowledge the generosity of several collaborators; in particular our
collaborators from the Wellcome Trust, Dr Ruby Banerjee and Dr Nathalie Conte for
their help in mFISH and CGH. I am also grateful to Dr Martin Spitaler from Imperial
college, London. I would also like to thank Professor Penny Jeggo from the University
of Sussex, UK for supplying the 53BP1 -/- cell line. I specially would like to thank Dr
Annette Payne for her contribution to Microarray analysis.
I would also very much like to thank Dr Viacheslav Bolshakov for his guidance,
assistance, training, and use of equipment when carrying out Microarray.
I would like to express my gratitude to my fellow group member Hassan Khonsari for
his advice and assistance pertaining to PCR and cell culture.
I reserve a special thank you to the members of the Centre for cell and chromosome
biology, the cancer institute and the PhD office for their helpful advice and support but
most of all for their friendship and making my PhD an enjoyable experience. I would
particularly like to acknowledge Dr Emma Osejindu for her help with many things
including Q-PCR training. Thank you for your friendship and support.
Thank you to my friends outside of the PhD bubble who despite my absence still
encouraged me to stay focus.
Also a big thank you, to my best friend and PhD “sister” Halime Arican, for always
being there for me and knowing all the right things to say. I am grateful I got to

Acknowledgements
v
experience this with you and will treasure our time together not only in the lab but also
in your aptly named car, the dirty princess.
I would like to say a huge thank you to my beautiful parents for their infinite love and
support. Mom and Dad you have been my constant support system throughout my
studies without you both I would have lost my mind. Last but not least I would like to
thank my lovely husband Musawir for not least his words of support and
encouragement but his ability to make me laugh when things got tough. Thank you all
for believing in me and keeping me as sane as possible. I love you all!!
To my parents, my greatest inspiration of all, who have always shown me the light, I
dedicate this thesis to you.

Abbreviations
vi
Abbreviations
ADA adenosine deaminase
AIDS acquired immune deficiency syndrome
ALV avian leucosis virus
ASLV avian sarcoma leucosis virus
ATM ataxia-telangiectasia
-gal beta- galactosidase
-ME beta-mercaptoethanol
BSA bovine serum albumin
CA capsid protein
CAEV caprine arthritis-encephalomyelitis
CAT cationic amino acid transporter-1
CCR5 C-C chemokine receptor type 5
CD34+ haematopoietic progenitor cells
cDNA complementary deoxyribonucleic acid
CGD chronic granulomatous disease
CIN chromosome instability
CIS common insertion sites
CMV cytomegalovirus
CpG cytomegalovirus
cPPT central polypurine tract
CT cycle threshold
CXCR4 C-X-C chemokine receptor type 4
DDR DNA damage response
dH2O distilled water
DMEM Dulbecco’s modified eagle’s medium
DMSO dimethyl sulfoxide
DNA deoxyribonucleic acid
DNMT DNA methyl transferase
dNTPs deoxynucleotide triphosphates
DSB double strand break
dsDNA double stranded DNA
DTT dithiothreitol
Abbreviations
vii
DU/dUTPase deoxnucleotide triphosphates
EB elution buffer
EDTA ethylene diamine tetraacetic acid
EIA equine infectious anaemia
EIAV equine infectious anaemia virus
Env viral envelope
EVI1 ecotropic viral integration site
FDA US food and drug administration
FIV feline immunodeficiency virus
FIX clotting factor IX
GAPDH glyceraldehyde-3-phosphate dehydrogenase
GFP/eGFP green florescent protein
Go gene ontology
GP glycoprotein
gp120 envelope glycoprotein
hrs Hours
HBV hepatitis B virus
HCC hepatocellular carcinoma
HepG2 hepatocellular carcinoma cell line
hFIX human clotting factor
HIV human immunodeficiency virus
HLA human leukocyte antigen
HPRT hypoxanthine-guanine phosphoribsyltransferase
HR homologous recombination
HR’SIN-CPPT-S-FX-W HIV vector construct containing SFFV promoter
HSC haematopoietic stem cell
HSV herpes simplex virus
IDDb insertional dominance database
IL2 interleukin 2
IL2RG interleukin 2 receptor, gamma
IM insertional mutagenesis
IN integrase
IS insertion site
Abbreviations
viii
Kb kilobase pairs
LacZ -galactosidase gene
LAM-PCR linear amplification mediated polymerase chain reaction
LB Luria-Bertani
LCMV lymphocytic choriomengitis virus
LEDGF lens epithelium- derived growth factor
LTR long terminal repeat
LV lentivirus
MA matrix protein
MDR1 multiresistance gene 1
MgCl2 magnesium chloride
MIN mutational instability
MLV murine leukaemia virus
MOI multiplicity of infection
Mo-MLV Moloney murine leukaemia virus
mRNA messenger ribonucleic acid
NC Nucleoplasmid
NHEJ non homologous end joining
NK natural killer cell
P1 re-suspension buffer
P2 lysis buffer
P3 neutralising buffer
PB binding buffer
PBL peripheral blood lymphocytes
PBS phosphate buffer solution
PCR polymerase chain reaction
PE wash buffer
PEG polyethylene glycol-conjugates bovine
PIC preintegration complex
pLIONhAATGFP FIV construct containing eGFP reporyter gene
POL polymerase
PPT polypurine tract
PR protease
Abbreviations
ix
PSI/ packaging signal
QPCR quantitative real time polymerase chain reaction
R repeat region
RB retinoblastoma
RCL replication competent lentivirus
RCR replication competent retrovirus
RCV replication competent virus
RDV replication defective retrovirus
RefSeq reference sequence
REV regulatory of viron
RIS retroviral insertion site
RNA ribonucleic acid
rpm rotations per minute
RQ relative quantification level
RRE rev response element
rRNA ribosomal ribonucleic acid
RT reverse transcriptase
RTCGD retroviral tagged cancer gene database
RT-PCR reverse transcription polymerase chain reaction
RV retrovirus
SAHA suberoylanilide hydroxamic acid
SCID severe combined immunodeficiency
SD splice donor
SEM standard error of the mean
SFFV spleen focus forming virus
SIN self-inactivating
SIV simian immunodeficiency virus
SMART2Z EIAV vector construct containing lacZ transgene
ssRNA single strand RNA
STRING search tool for interacting genes/proteins
SU surface unit
TAR transactivator responsive element
TAT transcriptional activator

Abbreviations
x
TBE tris borate acid
TE tris-EDTA
TM transmembrane subunit
tRNA transfer ribonucleic acid
U3 unique 3'
U5 unique 5'
VSG-G vesicular stomatitis virus G glycoprotein
WHO world health organization
WPRE woodchuck hepatitis virus posttranscriptional regulatory
X-gal 5-bromo-4-chloro-3-indolyl-β-D-galactopyranoside
X-SCID x-linked severe combined immunodeficiency
6TG 6-thiguanine
18SRNA 18S ribosomal RNA

List of Contents
xi
Table of Contents
Abstract ......................................................................................................................... i-ii
Declaration .................................................................................................................... iii
Acknowledgements...................................................................................................... iv-v
Abbreviations .............................................................................................................. vi-x
Table of contents ....................................................................................................... xi-xv
List of figures .......................................................................................................xvi-xviii
List of tables ........................................................................................................... xix-xx
Chapter 1: Introduction 1-49
1.1: Gene therapy……………………………………………………………...1
1.2: Retroviruses…………………………………………………………….2-5
1.2.1: Life cycle of the RV………………………………………......6-11
1.3: Lentivirus………………………………..…………………………...12-14
1.3.1: HIV…………………………………………………………......14
1.4: Optimizing vectors and vector packaging……..……...……………...14-17
1.5: Gene therapy success.……………………………………………………18
1.6: Gene therapy trials involving retrovirus vectors…………….……….19-20
1.7: Safety of gene therapy vectors………………………………….………..21
1.8: Genotoxicity…………………...………………………………………….21
1.8.1: Insertion site (IS) selection………………….……………….22-23
1.8.2: Insertional mutagenesis (IM)…………………….……………...24
1.9: Identification of IM during gene therapy of X-SCID…….….……….24-26
1.10: Chronic granulomatous (CGD) trial…………………….……………26-27
1.11: Models of genotoxicity………………………………….……………….28
1.11.1: In Vitro models of genotoxicity………………….………….28-30
1.11.2: In Vivo models of genotoxicity…………………….………..30-31
1.12: Alternative routes to genotoxicity not involving IM……………………..32
1.12.1: DNA damage………………………………………………..32-33

List of Contents
xii
1.12.2: DNA DSB repair………………………………………………..34
1.12.2.1: DNA repair by Homologous recombination (HR)..34-35
1.12.2.2: DNA repair by non-homologous recombination
(NHEJ)……………………………………………35-36
1.12.3: Genome instability due to DSB……………………………..36-38
1.12.4: Proteins used to determine the presence of DSBs…………..38-39
1.12.5: Methods for determining DNA DSBs……………………….…40
1.12.6: Retrovirus integration mediated DSBs……………………...41-42
1.13: Epigenetic modifications leading to genotoxicity……………………43-45
1.14: Viral integration and methylation…………………………………....45-46
1.15: Methylation and DNA damage………………………………………….47
1.16: E2F and DNA damage……….……………………………………....48-49
1.17: Hypothesis……………………………………...……………………......49
1.17.1: Aims and objectives……………………………………………49
Chapter 2: Materials and Methods 50-80
2.1: Materials…………………………………………………………….. 50-60
2.1.1: General chemicals and reagents………………….......................50
2.1.2: Tissue culture reagents…………………………………………..51
2.1.3: X-gal reagents…………………………………………………...51
2.1.4: Cell viability reagents…………………………………………...51
2.1.5: Immunofluorescence reagents…………………………………..52
2.1.6: DNA extraction reagents………………………………………..52
2.1.7: Reagents for global methylation assay using Imprint® methylated
DNA quantification kit………………………………………….52
2.1.8: Pre designed and custom made TaqMan probes for gene
expression analysis……………………………………………...53
2.1.9: RNA extraction reagents………………………………………..53
2.1.10: cDNA synthesis for real time quantitative (Q)-PCR reagents...54
2.1.11: Q-PCR reagents for gene expression analysis………………...54
2.1.12: mFISH reagents……………………………………………54-55
2.1.13: Microarray reagents…………………………………………..55
2.1.14: Compositions of buffers and solutions…………………….56-58

List of Contents
xiii
2.1.15: Cell lines…………………………………………………….....60
2.1.16: Viral vectors……………………………………………………60
2.2: Methods……………………………………………………………... 61-80
2.2.1: Mammalian cell culture methods………………….....................61
2.2.1.1: Growth and maintenance……………………………....61
2.2.1.2: Long term storage of cells in liquid nitrogen………….62
2.2.1.3: Seeding cells into cell culture dishes…………………..62
2.2.1.4: Infection of cells with viral vectors……………………62
2.2.2: X-gal staining- Percentage of infectibility…………………...62-63
2.2.2.1: Image capture and processing…………………………63
2.2.3: Cell viability assay………………………………………………63
2.2.4: Immunofluorescence……………………………………………64
2.2.4.1: Immunofluorescence image analysis………………….64
2.2.5: DNA extraction from cultured cells…………………………64-65
2.2.6: Quantification of nucleic acids………………………………….65
2.2.7: Agarose gel electrophoresis……………………………………..66
2.2.8: Global methylation assay using Imprint® methylated DNA
quantification kit……………………………………………..66-67
2.2.9: RNA extraction from cultured cells………………………….67-68
2.2.9.1: DNase I treatment………………………………….68-69
2.2.10: cDNA synthesis for Q-PCR………………………………...69-70
2.2.10.1: Q-PCR for gene expression analysis……………..70-71
2.2.11: Microarray……………………………………………………..72
2.2.11.1: cDNA synthesis from RNA………………………72-73
2.2.11.2: Degradation of the RNA……………………………..73
2.2.11.3: Pre-slide scanning and wash…………………………74
2.2.11.4: Pre-hybridisation of slides…………………………...74
2.2.11.5: Preparation of Slidebooster………………………….75
2.2.11.6: cDNA hybridisation……………………………...75-76
2.2.11.7: Post cDNA hybridisation wash………………………76
2.2.11.8: Hybridisation of the fluorescently labelled 3DNA to the
microarray slide…………………………………..76-77
2.2.11.9: Post 3DNA hybridisation wash……………………...77
List of Contents
xiv
2.2.11.10: Microarray image acquisition………………………78
2.2.11.11: Microarray image analysis………………………….78
2.2.11.12: Microarray data analysis……………………………78
2.2.12: mFISH………………………………………………………….78
2.2.12.1: Slide preparation and metaphase spreads…………….79
2.2.13.2: Slide pre-treatment prior to hybridisation…………...79
2.2.13.3: Hybridisation………………………………………...79
2.2.12.4: Post-hybridisation wash and detection…………...79-80
2.2.12.5: mFISH imaging……………………………………...80
Chapter 3: Results 81-95
3.1: Background……………………………………………………….......81-82
3.2: Investigation of mouse tumour DNA compared to non-tumour liver using
CGH…………………………………………………………………..82-95
Chapter 4: Results 96-149
4.1: Investigation of vector associated genotoxicity in cells following in vitro
delivery of RV and LV.………………………………….………...........96
4.1.1: Cell Infectibility…………………………………………….96-104
4.1.2: Survival of cells following infection……………………...104-112
4.1.3: The effect of infection by RV and LV on DNA DSB…….113-142
4.2: An investigation of chromosome integrity using multicolour florescent in
situ hybridisation (mFISH) and G-banding following infection…..143-149
Chapter 5: Results 150-172
5.1: Epigenetic modification and E2F regulation of host genes following RV
and LV vector delivery………….……….............................................150
5.1.1: The effects of RV and LV infection on host epigenetics via
Methylation……………………………………………….150-166
5.2: Microarray analysis of cells infected with RV and LV vectors…..167-170
5.2.1: Analysis of differential expression of target genes associated with
the E2F transcription factor………………………………..170-172

List of Contents
xv
Chapter 6: Discussion 173-187
6.1: Conclusion….…………………………………………………............187
References ................................................................................................................... 188
Appendix 1 .................................................................................................................. 213

List of Figures
xvi
List of Figures
Figure 1. Schematic representation of a retroviruses particle ....................... 4
Figure 2. A schematic overview of the retrovirus genome ........................... 5
Figure 3. Schematic illustration of the general stages of the RV lifecycle ... 6
Figure 4. Retrovirus replication .................................................................... 8
Figure 5. Integration of retroviral DNA into the host cell genome ............ 10
Figure 6. Schematic representation of the HIV genome ............................. 13
Figure 7. CGH ideograms representing pooled CNV of tumours ......... 83-86
Figure 8. CGH ideograms representing CNV in EIAV tumour 2 .......... 87-89
Figure 9. CGH ideogram representing amplification of part of chromosome 2
in EIAV derived tumour 1 ........................................................... 90
Figure 10. Ideogram comparing tumours 1 and 2 CNV in chromosome 2 ... 91
Figure 11. RT-PCR of Hnf4α, Hnf1α and Foxa2 genes in tumours one and
tumour two ................................................................................... 93
Figure 12. Analysis of the relationship between genes found by CGH and IM
of tumour 2 .................................................................................. 94
Figure 13. Mcf10a cells infected with RV and LV vectors .......................... 97
Figure 14. Mrc5 cells infected with RV and LV vectors .............................. 98
Figure 15. At5biva cells infected with RV and LV vectors .......................... 99
Figure 16. Xp14br cells infected with RV and LV vectors ........................ 100
Figure 17. Mcf10a, Mrc5, At5biva and Xp14br cells infected with an HIV
deprived integrase negative (IN-ve) vector at high and low MOI ...
............................................................................................ 101-102
Figure 18. Mcf10a and Mrc5 percentage cell survival following infection with
RV and LV at high MOI ............................................................ 105
Figure 19. At5biva and Xp14br percentage cell survival on infection with RV
and LV at high MOI .................................................................. 106
Figure 20. Mcf10a and Mrc5 percentage cell survival following infection with
RV and LV at low MOI ............................................................. 107
Figure 21. At5biva and Xp14br percentage cell survival on infection with RV
and LV at low MOI ................................................................... 108
Figure 22a & b. Photomicrographs of immunofluorescence of 53BP1 in Mcf10a
cells infected by RV and LV at high and low MOI ............ 114-116

List of Figures
xvii
Figure 23a & b. Histograms of the mean number of 53BP1 foci in Mcf10a cells
infected at high and low MOI ............................................. 117-118
Figure 24a & b. Histograms of the mean number of 53BP1 foci in Mrc5 cells
infected at high and low MOI ............................................. 121-122
Figure 25a & b. Histograms of the mean number of 53BP1 foci in At5biva cells
infected at high and low MOI ............................................. 125-126
Figure 26a & b. Histograms of the mean number of 53BP1 foci in Xp14br cells
infected at high and low MOI ............................................. 129-130
Figure 27. Pie charts representing frequency of 53Bp1 foci in Mcf10a nuclei
at 6 hours post treatment with IR, MLV, HIV, EIAV, FIV, IN- and
MLV without genome ........................................................ 134-135
Figure 28. Pie charts representing frequency of 53Bp1 foci in Mrc5 nuclei at 6
hours post treatment with IR, MLV, HIV, EIAV, FIV, IN- and
MLV without genome ........................................................ 136-137
Figure 29. Pie charts representing frequency of 53Bp1 foci in At5biva nuclei
at 6 hours post treatment with IR, MLV, HIV, EIAV, FIV, IN- and
MLV without genome ........................................................ 138-139
Figure 30. Pie charts representing frequency of 53Bp1 foci in Xp14br nuclei at
6 hours post treatment with IR, MLV, HIV, EIAV, FIV, IN- and
MLV without genome ........................................................ 140-141
Figure 31. mFISH and pseudo G-banding of un-infected Mcf10a ...... 144-145
Figure 32. mFISH and pseudo G-banding of EIAV, HIV and MLV infected
Mcf10a cells ....................................................................... 146-149
Figure 33. Global methylation levels in RV and LV infected Mcf10a cells ....
................................................................................................... 152
Figure 34. Global methylation levels in RV and LV infected HepG2 cells .....
................................................................................................... 154
Figure 35. Global methylation levels in RV and LV infected 53BP1-/- cells ..
................................................................................................... 156
Figure 36. Dnmt1, 3a and 3b expression in Mcf10a cells following RV and
LV infection ........................................................................ 159-160
Figure 37. Dnmt1, 3a and 3b expression in HepG2 cells following RV and LV
infection .............................................................................. 162-163

List of Figures
xviii
Figure 38. Dnmt1 and 3a expression in 53BP1 -/- cells following RV and LV
infection .............................................................................. 165-166
List of Table
xix
List of Tables
Table 1. Classification of retrovirus ...................................................................... 3
Table 2. Basic components of the retrovirus genome ........................................... 5
Table 3. General chemicals and reagents ............................................................ 50
Table 4. General reagents used for tissue culture ................................................ 51
Table 5. General chemical and reagents used in x-gal procedure ....................... 51
Table 6. General chemical and reagents used in cell viability assays ................. 51
Table 7. Reagents used in immunofluorescence ................................................. 52
Table 8. Reagents used for DNA extraction of cells ........................................... 52
Table 9. General reagents used for global methylation assays ............................ 52
Table 10. TaqMan gene expression assays used to quantify DNA
methyltransferase activity ..................................................................... 53
Table 11. Reagents used for isolation of total RNA from cell lines, Dnase1
treatments and RNA purification .......................................................... 53
Table 12. General chemicals and regents used for cDNA synthesis of total RNA
for Q-PCR ............................................................................................. 54
Table 13. General chemicals and reagents for TaqMan PCR reactions ................ 54
Table 14. General chemicals and reagents for mFISH ..................................... 54-55
Table 15. General chemicals and reagents used for Microarray ........................... 55
Table 16. Preparation of one reaction mixture for DNase I treatment .................. 68
Table 17. General reagents used for cDNA synthesis of total RNA for Q-PCR .. 69
Table 18. PCR parameters used for cDNA synthesis using the MultiScibe
reaction kit ............................................................................................. 70
Table 19. Reagents used for preparation of TaqMan PCR mastermix for
amplifications ........................................................................................ 70
Table 20. PCR parameters required for Q-PCR .................................................... 71
Table 21. Samples used for the reaction master mix for cDNA synthesis ............ 72
Table 22. Reagents used for the reaction master mix of cDNA synthesis. ........... 73
Table 23. Reagents used to make pre-hybridisation solution for Microarray ....... 74
Table 24. Reagents used for cDNA hybridisation for Microarray. ....................... 75
Table 25. Reagents used for 3DNA hybridisation mix for one slide for
Microarray ............................................................................................. 77

List of Table
xx
Table 26. Real time PCR relative change in gene expression of Hnf4α, Hnf1α and
Foxa2 in tumour 1 and 2 ....................................................................... 92
Table 27. Percentage level of infection in Mcf10a, Mrc5, At5biva and Xp14br
cells ...................................................................................................... 103
Table 28. Percentage of viable cells on infection with high MOI RV and LV ....... ..
.....................................................................................................109-110
Table 29. Percentage of viable cells on infection with low MOI RV and LV .... 111
Table 30a. Mean number of foci in Mcf10a nuclei at high MOI .......................... 119
Table 30b. Mean number of foci in Mcf10a nuclei at low MOI ........................... 120
Table 31a. Mean number of foci in Mrc5 nuclei at high MOI .............................. 123
Table 30b. Mean number of foci in Mrc5 nuclei at low MOI ............................... 124
Table 32a. Mean number of foci in At5biva nuclei at high MOI ......................... 127
Table 30b. Mean number of foci in At5biva nuclei at high MOI ......................... 128
Table 33a. Mean number of foci in Xp14br nuclei at low MOI ........................... 131
Table 33b Mean number of foci in Xp14br nuclei at high MOI .......................... 132
Table 34. Measurement of global methylation in Mcf10a cells infected with RV
and LV vectors .................................................................................... 151
Table 35. Measurement of global methylation in HepG2 cells infected with RV
and LV vectors .................................................................................... 153
Table 36. Measurement of global methylation in 53BP1-/- cells infected with RV
and LV vectors .................................................................................... 155
Table 37. DNA methyltransferase gene expression in Mcf10a cells following RV
and LV infection .................................................................................. 158
Table 38. DNA methyltransferase gene expression in HepG2 cells following RV
and LV infection .................................................................................. 161
Table 39. DNA methyltransferase gene expression in 53BP1 -/- cells following
RV and LV infection ........................................................................... 164
Table 40. Genes up-regulated by 1.2 following infection of Mcf10a cells by
MLV, EIAV and MLV without viral genome vectors ........................ 168
Table 41. Genes down-regulated by 1.2 following infection of Mcf10a cells by
MLV, EIAV and MLV without viral genome vectors ................. 169-170
Table 42. Genes associated with E2F binding from virus treated Mcf10a cell..........
.................................................................................................. ....171-172
INTRODUCTION Chapter 1
1
1.1 Gene therapy
Gene therapy refers to the transfer of genetic material to cells to modify specific gene
expression to treat or correct the progression of a genetic disease. Whilst traditional
pharmacological therapies aim to cure the symptoms of a disease, gene therapy aims to
treat or remove the cause of disease by correcting the defective genetic information
contained within the cells of the patient. For some diseases stem cell therapy is possible,
however, the complications associated with HLA-mismatched bone marrow
transplantation have meant that the use of stem cells in an autologous manner is of
importance. Thus, gene therapy should be used somatically or on patient stem cells in
an ex-vivo manner.
Gene therapy is applicable to the “classic” diseases such as the inherited monogenic
disorders that result from the absence or dysfunction of a specific gene product. It is
also applicable to the treatment of rheumatoid arthritis, infection of pathogens,
atherosclerosis and cancer.
Studies in the 1960’s by Borenfreund and Bendich first demonstrated gene transfer of
exogenous DNA and found that incorporation of genetic material into the nucleus of the
mammalian cell occurred 6-24 hours post treatment (Borenfreund and Bendich, 1961).
Interest in gene therapy increased when between 1961 and 1966 it was made possible to
characterize and deliver therapeutic genes (Rieke1962; Borenfreund and Bendich, 1961;
Bendich, 1961).
Gene therapy has been improved by the use of viruses as vectors to carry therapeutic
genes into host cells defective of a genetic function as they have evolved intricate
mechanisms for overcoming the defensive barriers of their target cells. One such virus
is the retrovirus (RV) and our understanding of RV biology has helped us use these
viruses to deliver genes in an efficient manner.
INTRODUCTION Chapter 1
2
1.2 Retroviruses
The term RV is used to describe a large and diverse family of RNA viruses (Figure 1
and 2). RV were discovered more than 20 years ago. They have a small and simple
genome that can provide stable co linear integration into host genome whilst also
accommodating about 10kb of foreign DNA for high transfer efficiency (Bouard,
Alazard-Dany and Cosset, 2009).
Retrovirus particles are typically 80-100nm in size and consist of enveloped
glycoprotein particles and a lipid envelope (Coffin, Huges and Varmus, 1997). The
retrovirus genome consists of two copies of single stranded linear RNA genome of
positive polarity that are able to create double stranded complementary DNA (cDNA)
copies of their RNA genomes in the nucleus of the host cell using reverse transcriptase.
The DNA is then incorporated into the host’s genome via a virally encoded protein
called integrase. It is this process of alternating genetic material between RNA in the
virion and DNA in infected cells which is the vital feature of the life cycle (Somia and
Verma, 2000; Zhang and Temin, 1993). Also due to their ability to integrate into the
host genome they can provide permanent gene transfer to the host cells (Bushman,
2007).
Retroviruses are broadly divided into simple and complex classes based on their
genome organisation and can be further subdivided into seven groups (Table 1). Simple
retroviruses encode only the basic viral functions such as the structural, enzymatic and
envelope proteins. The complex retroviruses, code for additional regulatory proteins
that help to accurately control the level and timing of expression of the viral genes
(Brenner and Malech, 2003; Coffin, 1992).

INTRODUCTION Chapter 1
3
Genome Sub-Division Genus Example
Simple
1 Avian sarcoma and
leukosis viral group Rous sarcoma virus
2 Mammalian B-type viral
group Mouse mammary tumour virus
3 Murine leukemia-related
viral group
Moloney murine leukaemia
virus (Mo-MLV)
4 D-type viral group Mason-Pfizer monkey virus
Complex
5
Human T-cell leukemia–
bovine leukemia viral
group
Human T-cell leukemia virus
6 Spumaviruses Human foamy virus
7 Lentiviruses (LV)
Equine Infectious Anaemia
virus or Human
Immunodeficiency Virus
Table 1. Classification of RV’s. Seven genesis of RV’s are listed along with examples
from each group. Note, five of these groups display oncogenic potential (1-5) and are
known as oncoretroviruses.
The genome common to all RVs consists of three coding genes called gag, pol and env
which are required in supplying multiple components of the virus structure, enzymes
and envelope proteins respectively, in both simple and complex retroviruses (Figure 1,
Table 2) (Vogt, 1997; Coffin, 1996).
The Gag gene encodes and directs the synthesis of internal virion proteins that form the
matrix, capsid and nucleocapsid proteins that make up virions. Pol encodes the viral
protease, reverse transcriptase, RNase H and integrase responsible for transcribing viral
RNA into double stranded DNA and for integration, respectively. The env gene encodes
the proteins needed for receptor recognition and envelope anchoring. The viral envelope
is formed by a cell derived lipid bilayer where proteins encoded by the env region of the
viral genome are inserted. These consist of the transmembrane and the surface
components linked together by disulphide bonds (Cardone et al., 2009; Benit,
Dessen and Heidmann, 2001; Erlwein, Bieniasz and McClure, 1998).
Duplicated regions in the 5’ and 3’ ends known as Long Terminal Repeats (LTR) flank
the gag, pol and env genes. The LTR consists of the U3 (unique 3), R (repeat) and U5
INTRODUCTION Chapter 1
4
(unique 5) sequences and acts as the control centre for gene expression (Wilk et al.,
2001; Zhang and Temin, 1993).
(Rodrigues, M. and Coroadinh, Chapter 2, 2011)
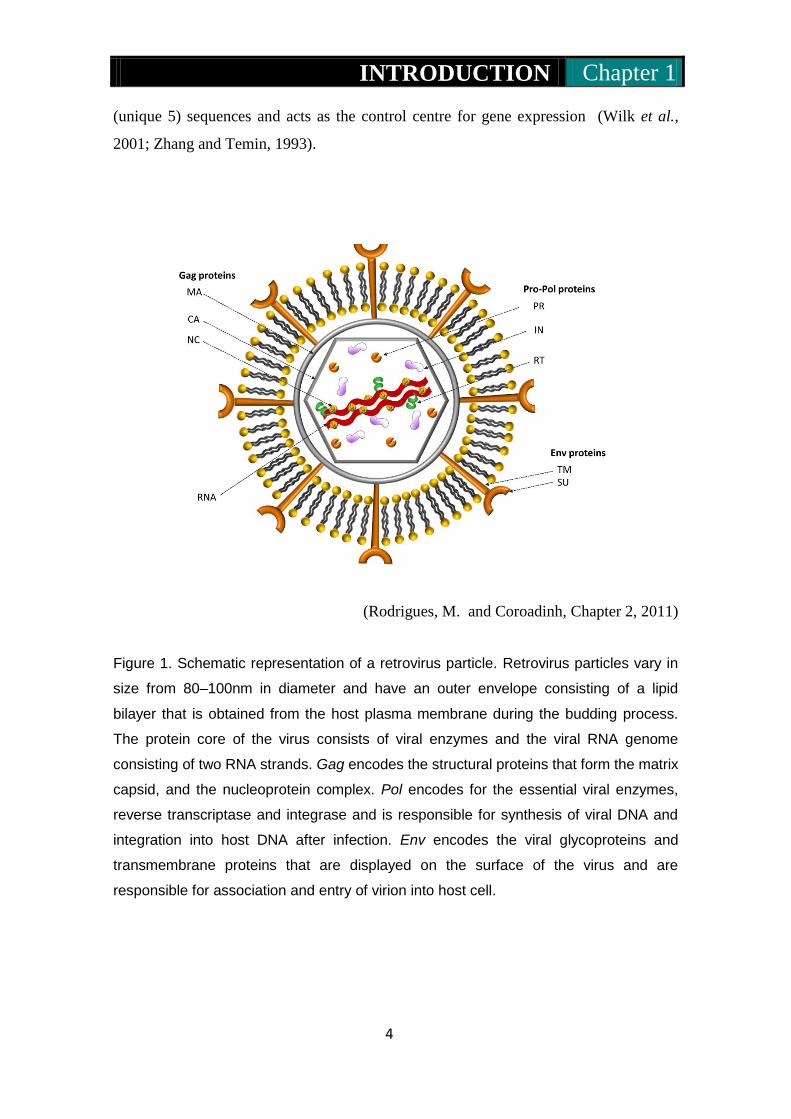
Figure 1. Schematic representation of a retrovirus particle. Retrovirus particles vary in
size from 80–100nm in diameter and have an outer envelope consisting of a lipid
bilayer that is obtained from the host plasma membrane during the budding process.
The protein core of the virus consists of viral enzymes and the viral RNA genome
consisting of two RNA strands. Gag encodes the structural proteins that form the matrix
capsid, and the nucleoprotein complex. Pol encodes for the essential viral enzymes,
reverse transcriptase and integrase and is responsible for synthesis of viral DNA and
integration into host DNA after infection. Env encodes the viral glycoproteins and
transmembrane proteins that are displayed on the surface of the virus and are
responsible for association and entry of virion into host cell.

INTRODUCTION Chapter 1
5
(Fouty and Solodushko, Chapter 4, 2011)
Figure 2. A schematic overview of the retrovirus genome. The virion RNA is typically 7-
12kb in size and consists of the gag, pol and env genes. The LTR regions flank the
genome. The gag gene encodes the Matrix protein (MA), capsid protein (CA) and
nucleoplasmid (NC). The pol gene encodes reverse transcriptase (RT), protease (PR),
integrase (IN) and deoxyuridine triphosphatases (duTPases). The env gene encodes
the surface subunit (SU) and transmembrane subunit (TM).
Gene Function
Gag Directs the synthesis of internal virion proteins that form the matrix,
the capsid, and the nucleoprotein structures.
Pol Contains the information for the reverse transcriptase and integrase
enzymes.
Env Provides surface and transmembrane components of the viral
envelope protein.
LTR Regulate viral gene expression and therefore replication and
pathogenesis.
Repeat -R Essential for reverse transcription and replication.
Unique 3 - U3 Comprises of transcriptional enhancer and promoter sequences.
Unique 5 – U5 Contains sequences involved in initiation of reverse transcription.
Table 2.Basic components of the RV genome.

INTRODUCTION Chapter 1
6
1.2.1 Life cycle of the RV
(Ganser-Pornillos, Yeager and Sundquist, 2008)
Figure 3. Schematic illustration of the general stages of a RV life cycle. Cell entry is
facilitated by fusion of the virus with host cell membrane. The virus particle uncoats and
releases its proteins. Reverse transcription and integration of viral cDNA take place.
Virus proteins are assembled and viral particles are released from the host cell.

INTRODUCTION Chapter 1
7
Cell binding and entry
The lifecycle of a generic retrovirus is shown in Figure 3 and begins with its attachment
to a suitable host cell membrane via virally encoded glycoproteins and specific cell
surface molecules. These viral glycoproteins, that are embedded in the surface unit lipid
envelope, recognize receptors displayed on the target cell plasma membrane such as,
CD4, CD8 and CAT-1, and then mediate viral attachment (Suzuki and Craigie, 2007;
Ugolini, Mondor and Sattentau, 1999).
Membrane fusion is carried out by the viral env protein. The env protein is an oligomer
composed of three surface unit (SU)-transmembrane (TM) subunit complexes (Sharma,
Miyanohara and Friedmann, 2000). TM is integrated into the cellular membrane. SU is
located extracellularly and linked to TM by non-covalent interaction. Consequently, SU
mediates receptor binding and TM mediates membrane fusion. The SU highly specific
receptor mediated interaction is thought to activate a conformational change of the SU
proteins leading to the fusion or endocytosis of the viral and cell lipid bilayers. This
process is dependent on the virus envelope ligand and cell receptor used for entry
(Damico and Bates, 2000; Sharma, Miyanohara and Friedmann, 2000).
Viral particles have two mechanisms of cell entry; membrane fusion or receptor-
mediated endocytosis. This is supported by recent compelling research by Miyauchi et
al in 2011 who used a pH sensitive green fluorescent protein (GFP) tag to successfully
visualize the preferential uptake of HIV into acidic endosomes upon entry. This, along
with other evidence confirms HIV and other retroviruses do not only rely on lipid
membrane fusion, but also receptor-mediated endocytosis followed by pH mediated
endosomal fusion for viral entry (Miyauchi, Marin and Melikyan, 2011). In contrast in
ASLV-A, Tva serves as the cellular receptor and interacts with the ASLV-A specific
protein EnvA and requires low pH conditions to carry out receptor-mediated endocytosis
(Katen et al., 2001; Wang et al., 1999). Binding of the HIV envelope glycoprotein
gp120, which is found on the surface of the viral particle, to the primary receptor CD4
in the host cells leads to conformational changes in both CD4 and gp120. This results in
exposure of co-receptors belonging to the chemokine receptor family, mainly CXCR4
and CCR5, which allow viral entry (Zhang et al., 1999). Entry of virions into the cell
results in the release of the retroviral core into the cytoplasm of the host cell.
INTRODUCTION Chapter 1
8
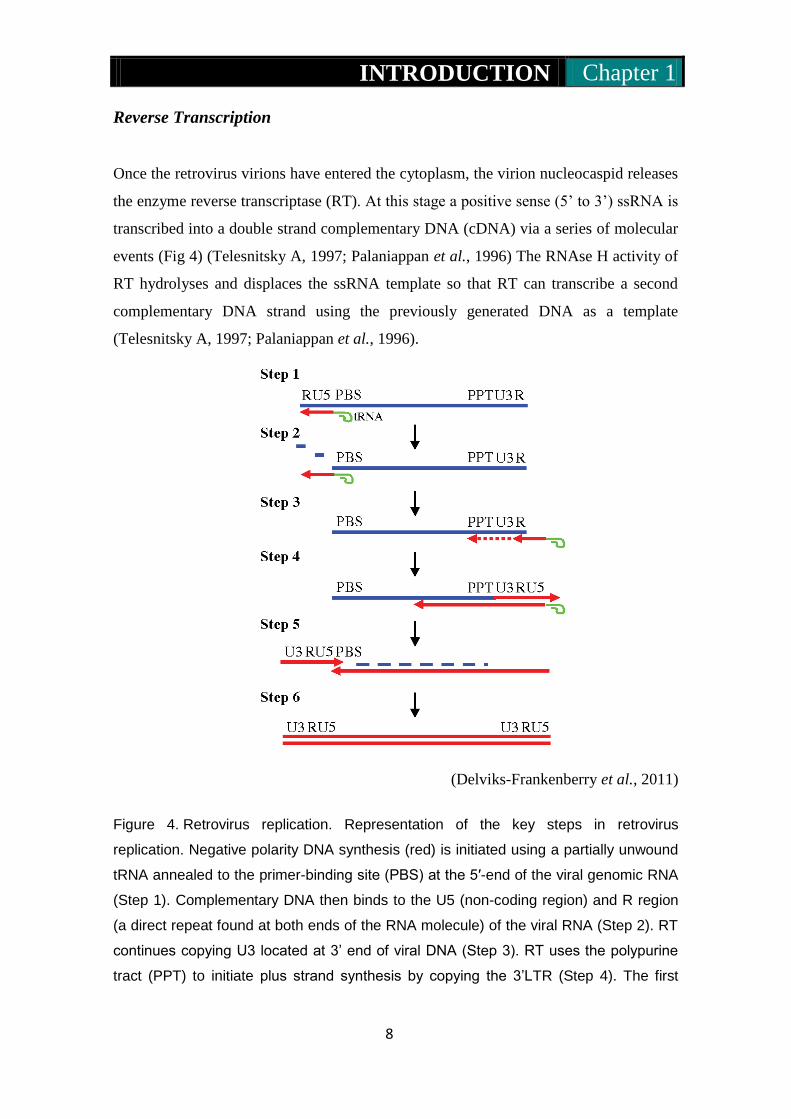
Reverse Transcription
Once the retrovirus virions have entered the cytoplasm, the virion nucleocaspid releases
the enzyme reverse transcriptase (RT). At this stage a positive sense (5’ to 3’) ssRNA is
transcribed into a double strand complementary DNA (cDNA) via a series of molecular
events (Fig 4) (Telesnitsky A, 1997; Palaniappan et al., 1996) The RNAse H activity of
RT hydrolyses and displaces the ssRNA template so that RT can transcribe a second
complementary DNA strand using the previously generated DNA as a template
(Telesnitsky A, 1997; Palaniappan et al., 1996).
(Delviks-Frankenberry et al., 2011)
Figure 4. Retrovirus replication. Representation of the key steps in retrovirus
replication. Negative polarity DNA synthesis (red) is initiated using a partially unwound
tRNA annealed to the primer-binding site (PBS) at the 5′-end of the viral genomic RNA
(Step 1). Complementary DNA then binds to the U5 (non-coding region) and R region
(a direct repeat found at both ends of the RNA molecule) of the viral RNA (Step 2). RT
continues copying U3 located at 3’ end of viral DNA (Step 3). RT uses the polypurine
tract (PPT) to initiate plus strand synthesis by copying the 3’LTR (Step 4). The first

INTRODUCTION Chapter 1
9
strand of complementary DNA (cDNA) is extended (Step 5). Provirus used for
integration into the host genome of the target cells (Step 6).
Nuclear Entry
The double stranded DNA (dsDNA) is now shuttled into the nucleus remaining
associated with some of the viral structural proteins in a pre-integration complex (PIC).
It has been demonstrated that PIC interacts with the cellular microtubule network to
transport itself through the cytoskeleton towards the nucleus. Simple retroviruses cannot
gain access to the cellular genome until the disassembly of the nuclear envelope during
mitosis. Once this occurs, transportation of PIC’s to the cytoplasm can take place
(Nisole, Stoye and Saib, 2005; Roe et al., 1993). Consequently, retroviruses such as
MLV are dependent on the cell cycle and cannot replicate in non-dividing cells. In
comparison, the PIC’s of lentiviral complexes, such as HIV-1 are able to productively
infect non-dividing cells. Here, the import of the viral genome and its associated
proteins is mediated by the interaction of the nuclear pore complex with the protein
components of the lentiviral PIC’s (Fouchier and Malim, 1999; Miller, Farnet and
Bushman, 1997).
INTRODUCTION Chapter 1
10
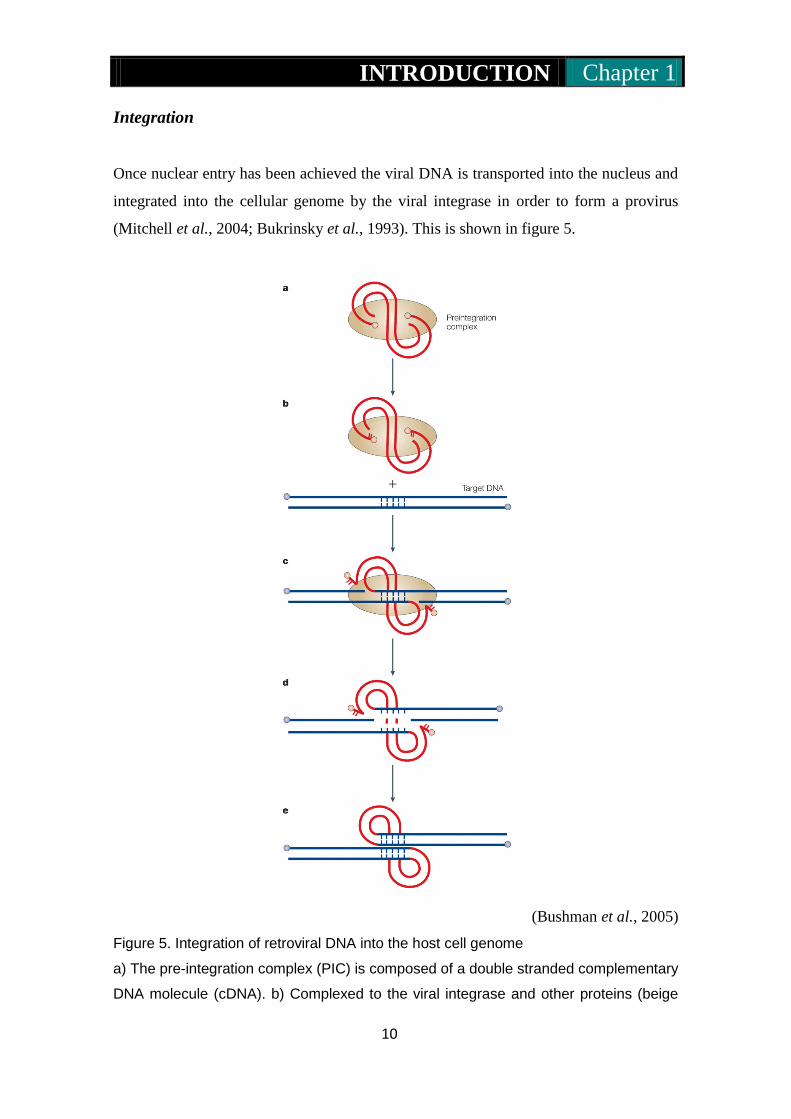
Integration
Once nuclear entry has been achieved the viral DNA is transported into the nucleus and
integrated into the cellular genome by the viral integrase in order to form a provirus
(Mitchell et al., 2004; Bukrinsky et al., 1993). This is shown in figure 5.
(Bushman et al., 2005)
Figure 5. Integration of retroviral DNA into the host cell genome
a) The pre-integration complex (PIC) is composed of a double stranded complementary
DNA molecule (cDNA). b) Complexed to the viral integrase and other proteins (beige

INTRODUCTION Chapter 1
11
oval) integrase cleaves 2 nucleotides from the 3’ end of each strand exposing recessed
3’ –OH groups. c) The recessed 3’ hydroxyl groups are joined with the 5’ ends of the
target DNA. This reaction is mediated by a transesterification reaction. d) Gaps at host-
virus DNA junctions are caused due to unpairing of the integration intermediate
reaction. e) Once the gap is repaired this accomplishes the formation of the integrated
proviral DNA.
Viral gene expression, particle assembly and budding
Once integrated the viral DNA can produce full length RNA and spliced RNA using the
cellular transcription machinery. Using RNA sequence known as packaging signal ()
part of the full length viral transcripts are packaged into new virions to become the next
generation of viruses (McBride, Schwartz and Panganiban, 1997; McBride and
Panganiban, 1997). The remainder of the full-length transcripts are used as templates
for the translation of the viral proteins. Progeny virions are then packaged using these
proteins and become ready to leave the host by one of two mechanisms. These are;
budding from the surface membrane thereby preserving the host cell, or the more
destructive lytic pathway often destroying the host cell. Following release, some
retroviruses undergo a post-release maturation phase. This coincides with
morphological changes of the viral core, ultimately culminating in mature progeny
virion capable of infecting new target host cells.
INTRODUCTION Chapter 1
12
1.3 Lentivirus
Lentiviruses are a sub group of the retroviridae family. They are among the most
intensely studied group of viruses. Lentivirus vectors based on HIV-1 can transduce a
broad spectrum of non-dividing cells in vivo, such as retinal cells, muscle cells, neurons
and hepatocytes (Bouard, Alazard-Dany and Cosset, 2009). Their ability to efficiently
deliver large and complex transgenes (up to 10kb) to target cells and tissues is the main
reason lentiviruses are used for gene therapy (Verma and Weitzman, 2005). The
lentiviral genome (Fig 6) also carries the three main genes coding for the viral proteins
(gag, pol and env) however the lentiviral genome is more complex than simple
retroviruses in that is has additional genes that include regulatory genes (tat and rev)
and auxiliary genes (vpr, nef, vpu and vif). These genes produce products involved in
regulation of synthesis and processing viral RNA and also enable efficient viral
replication (Pfeifer and Verma, 2001; Coffin, 1996).
Lentiviruses have been found capable of infecting several cell types (Tang, Kuhen and
Wong-Staal, 1999; Narayan and Clements, 1989). There are five serotypes of
lentiviruses such as primate (Human immunodeficiency virus, HIV), sheep and goats,
(caprine arthritis-encephalomyelitis, CAEV) horses (equine infectious anemia virus,
EIAV), cats (Feline Immunodeficiency Virus, FIV) and cattle (Bovine
Immunodeficiency Virus, BIV).
Due to the long incubation periods of lentiviral vectors they take a toll on the immune
system resulting in a slowly developing multi-system diseases (Tang, Kuhen and
Wong-Staal, 1999). The disease associated with lentiviral infections range from benign
and subclinical to severely debilitating and lethal. A common feature of lentiviruses is
their tropism for cells of the monocyte or macrophage lineages. Infection of
macrophages provide a hiding place for the virus from the infected host immune system
(Trono, 2000).

INTRODUCTION Chapter 1
13
(Chang, Liu and He, 2005)
Figure 6. Schematic representation of the HIV genome. HIV has several major genes
coding for structural proteins that are found in all retroviruses (gag, pol, env) and
several nonstructural/ accessory genes that are unique to HIV genome.
An important genetic difference between simple retroviruses and lentiviruses are
regulatory (tat and rev) and auxiliary genes (vpr, vif, vpu and nef) that have important
functions during the viral life cycle and viral pathogenesis (Brügger et al., 2007).
The tat (transactivator of transcription) gene binds to the TAR region of viral RNA and
to host proteins and acts as an activating element by binding to cellular factors and
mediating their phosphorylation thereby resulting in an increased transcription of all
HIV genes. Tat is also involved in LTR activation and therefore important in the
production of viral genomes and for gene expression (Kim and Sharp, 2001).
The rev (regulator of expression of virion proteins) gene allows fragments of HIV
mRNA containing a Rev Response element (RRE) to be exported from the nucleus to
the cytoplasm so that structural proteins and RNA genome can be produced. This
mechanism provides time-dependent regulation of replication (Strebel, 2003).
The vpr gene plays an important role in regulation of nuclear import of the HIV-1 pre-
integration complex and is required for viral replication in non-dividing cells
(Muthumani et al., 2006).
The vif gene, which overlaps the 3’ end of the pol gene, affects the assembly of the
virions and infectivity in certain cell types, while also stabilizing the pre-integration
complex.
The vpu gene is involved in viral budding following infection and is necessary for down
regulation in CDF molecules. In addition vpu stimulates viral release (Lindwasser,
Chaudhuri and Bonifacino, 2007).
The nef gene is expressed by primate lentiviruses, HIV. It is known as a virulence factor
as it manipulates the host’s cellular machinery to aid infection, survival and viral

INTRODUCTION Chapter 1
14
replication. Nef also promotes the survival of infected cells by down modulating the
expression of several surface molecules important in host immune function such as the
CD4 receptor (Das and Jameel, 2005).
1.3.1 HIV
The first lentiviral vectors developed were derived from HIV-1, the most extensively
studied lentivirus (Naldini et al., 1996). Two variants of HIV have been described;
HIV-1 presents more pathogenic properties with greater virulence and infectivity than
HIV-2 (Gilbert et al., 2003). HIV causes acquired immunodeficiency syndrome
(AIDS) a condition that resulted in the deaths of 1.9 million people in 2009
http://www.who.int/hiv/data/2009_global_summary.png. This is a condition whereby
the immune system is compromised allowing cancers and opportunistic infections to
thrive. This is achieved by the presence of HIV within infected immune cells or as free
virus particles. The HIV genome is approximately 10kb in size and primarily infects
macrophages and CD4+ T cells and dendritic cells (Delassus, Cheynier and Wain-
Hobson, 1991).
In contrast to the epidemic nature of HIV-1, HIV-2 has diminished transmission
efficiency due to its lower viral loads. HIV-2 is also less pathogenic and therefore has a
reduced progression rate to AIDS (Gilbert et al., 2003).
1.4 Optimizing vectors and vector packaging
Retroviruses have been shown to be the second mostly used viral vectors for gene
therapy (Edelstein, Abedi and Wixon, 2007). In order to use these viruses as vectors
safety considerations must be met so they can enter the host without causing adverse
effects. To do this, vectors need to be structurally and genetically stable, have no ability
to recombine, and not cause insertional mutagenesis (Goverdhana et al., 2005).
To prevent pathogenicity, replication incompetence has been engineered into vectors so
that only defective particles deliver therapeutic genes without spread (Buchschacher and
Wong-Staal, 2000). To do this, the gag, pol and env genes that provide viral proteins
needed to package, reverse transcribe and integrate the vector genome, and target the
INTRODUCTION Chapter 1
15
virus to the cell’s receptors have been removed from the vector and placed on plasmids.
Hence, packaging proteins are then provided in trans in packaging cells. Homology
between packaging constructs has also been kept to a minimum to reduce the chance of
creating replication competent viruses (RCV) through recombination in the packaging
cells.
The remaining sequences on the retroviral genome are called ‘cis’ elements and
composed of the LTRs, part of gag needed for genome packaging, the primer-binding
site (PBS) that is recognized by reverse transcriptase and the genome packaging
sequence required for efficient packaging of the genome into the viral core. During
vector production, the genome carrying the cis sequences that also include an internal
promoter to drive transgene expression, are packaged leaving behind in the packaging
cells the plasmids carrying the trans sequences that do not have packaging sequences
(Otto et al., 1994). To generate viral particles that can transfer their RNA genomes, the
cis and trans components are transfected as plasmids into packaging cells. However,
there is still the problem that a single recombination event between these two packaging
constructs can occur to generate replication competent virus particles. To avoid this
trans-acting viral genes have been further split and placed on separate plasmids (Miller
and Buttimore, 1986). These two packaging constructs contain the gag and pol on one
plasmid and the env gene on the other. This also enables switching of the env genes
called pseudotyping. (Danos and Mulligan, 1988).
This exchange generates new viral vectors with altered tropism to the host cells.
Examples of this are: The ecotropic envelope (limited to one species), xenotropic
envelope (infecting most mammalian cells except rodent cells), amphotropic enveope
(infecting all mammalian cells) and the pantropic envelope (infecting various species)
(Gaspar et al., 2004; Danos and Mulligan, 1988). The envelope from the vesicular
stomatis virus (VSV) is now often used because the G protein of the VSV substitutes
for the viral env protein to enable efficient cell entry (Chen et al., 1996). It does this by
mediating virus attachment to the cell surface that results in endocytosis of the virus.
VSV-G also mediates fusion of the viral envelope with the endosomal membrane
(Barraza and Poeschla, 2008; Douar, Themis and Coutelle, 1996). Previously a major
limitation to the production of high titre retrovirus was believed to be due to the labile
nature of the virus envelope that prevented increasing its titre using centrifugation. The
VSV-G envelope not only enables broad-range host infection but also provides stability
INTRODUCTION Chapter 1
16
to the virus thus allowing concentration by ultracentrifugation. This leads to an
increased viral titre of up to two orders of magnitude, reaching 109 particles per ml,
suitable for in-vivo gene transfer (Chen et al., 1996) Examples of alternative
pseudotypes used successfully with lentiviral vectors include the influenza
haemagglutinin, the Ross River Virus glycoprotein (offers enhanced liver transduction),
lymphocytic choriomeningitis virus envelope and a rabies-G envelope (that successfully
achieves gene delivery to the central nervous system) (Cronin, Zhang and Reiser,
2005).
Retroviruses do however have several other disadvantages when being considered for
gene therapy. They require cell division for infection since they are unable to reach the
nucleus without nuclear breakdown that occurs during mitosis. Hence, tissues such as
brain, lungs, eyes and pancreas may not be efficiently infected using these vectors (del
Pozo-Rodriguez et al., 2008). Also, retroviral insertion into the host genome is non-
random and this can cause problems of genotoxicity by insertional mutagenesis (Baum
et al., 2006). This is because the LTRs act as promoters and enhancers and can activate
genes close to or far away from where they insert. If the gene close to insertion is an
oncogene this ‘promoter’ insertion’ can lead to oncogenesis. LTRs have also been
shown to be involved in splicing with cellular genes and can be subjected to promoter
shut down by host methylation.
To circumvent some of these disadvantages and with the emergence of new knowledge
on the HIV virus, lentiviruses based on HIV-1 have been optimized for gene transfer
(del Pozo-Rodriguez et al., 2008; Nisole and Saib, 2004) To overcome the problem of
‘promoter’ or ‘enhancer’ insertion self-inactivating (SIN) vectors were developed
(Miyoshi et al., 1998). SIN is achieved by deleting the promoter/enhancer sequences in
the U3 region of the 3’ LTR of the viral vector. This mutation is carried over to the 5’
LTR during reverse transcription. (Baum et al., 2003; Zufferey et al., 1998; Miyoshi et
al., 1998; Yu et al., 1986). This design is a significant development for gene therapy
because it reduces or prevents endogenous oncogene activation following integration.
In addition, replacement of the 5’ LTR (U3 region) with the human cytomegalovirus
(CMV) promoter results in a CMV driven packaging system which is compatible with
the CMV/LTR hybrid vectors and high titre virus preparation. The cells used to
generate these vectors are again human embryonic kidney (HEK) 293 cells (Dull et al.,
1998; Finer et al., 1994).

INTRODUCTION Chapter 1
17
Additional elements used to improve lentiviral design are repositioning of the central
polypurine tract (cPPT). This cPPT improves entrance of the vector into the nucleus
(Barraza and Poeschla, 2008). The inclusion of a cPPT element has also shown
significant improvement in transduction efficiency in vitro and in vivo. HIV and SIV
based vectors that contain a cPPT also show a two to threefold enhancement in
transduction efficacy (Follenzi et al., 2000).
The woodchuck post-transcriptional regulatory element (WPRE) further improves
transduction and translational efficiency of lentiviral vectors via increasing virus titre by
improving RNA stability and export of virus genomes from the nucleus. Incorporating
the WPRE in the HIV-derived vector increases reporter gene expression up to 5-8 fold
higher after transduction of both dividing and arrested 293T cells (Zufferey et al.,
1999).
Following these modifications the vector packaging cell along with the transgene
cassette is introduced into the packaging cell line. The transient infection method is
rapid and flexible due to the virus particles being harvested a few days after infection of
293T cells. The vector will then undergo a series of analytical tests for infection and
titre before being either used for further research or delivered therapeutically to a patient
(Coffin et al, 1997).

INTRODUCTION Chapter 1
18
1.5 Gene therapy success
The idea of delivering genes to human cells for beneficial therapeutic effect has been in
the mind of scientists since the landmark paper by Friedman and Roblin in 1972
(Friedmann and Roblin, 1972). However there was skepticism because of lack of
information on gene regulation, lack of knowledge of the gene causing the disease, the
potential side effects and the safety of this approach. However, due to advances in gene
therapy technologies as well as in molecular therapy and the discovery of new genes by
the human genome project in 2003, gene therapy has become closer to reality to treat
many diseases.
Efficient delivery of genes is an enormous hurdle for gene therapy. Synthetic expression
vectors such as liposomes have been used to transfer genes into the host cell however,
this has proved to be inefficient, produced low level and short lived expression.
Entering the hydrophobic membrane of the host cell may still be problematic even if
these issues are overcome and gene transfer occurs there is still the problem of low level
gene transfer dosage (Conese, 2004).
Gene therapy of hematopoietic stem cells (HSC) has received much attention. It is
relevant to a broad range of human diseases, ranging from cancer to haematological
disorders. It also allows the use of ex vivo transduction protocols that minimize the
exposure of the entire patient to viral particles. However, the use of retroviral vectors in
this setting is still hampered by the low frequency of gene delivery, as transduction by
retrovirus vectors occurs only in cells that are replicating at the time of infection (Miller
and Buttimore, 1986). A promising approach is the finding that a number of growth
factor combinations can be used to pre-stimulate hematopoietic stem/progenitor cells to
increase transduction efficacy (Pfeifer and Verma, 2001; Nolta, Smogorzewska and
Kohn, 1995)

INTRODUCTION Chapter 1
19
1.6 Gene therapy trials involving retrovirus vectors
Worldwide, over 400 gene therapy clinical trials have been carried out or are underway.
70% are cancer related and mainly used on terminally ill patients. The most common
used vectors are the retroviral-based vectors (Blaese et al., 1995).
Blaese and Anderson, from the National Institute of Health, performed the first human
gene therapy trial in 1990. The therapy treated two children for the primary
immunodeficiency disorder, adenosine deaminase (ADA) deficiency. ADA is a rare
genetic disease in which children are born with severe immunodeficiency and are prone
to repeated serious infections (Aiuti et al., 2002). ADA is an enzyme needed to convert
nucleoside inosine and it is this deficiency that prevents the body from producing
enough lymphocytes (B-cells and T-cells) that are required to fight off infections
(Joachims et al., 2008). Mutations in ADA in mice have shown the progression of
severe combined immunodeficiency disease (SCID) due to the severely low levels of B,
T and natural killer (NK) cells (Blackburn et al., 1996). Before gene therapy the only
way to treat ADA deficiency was regular injection with the ADA enzyme and bone
marrow transplant from a compatible donor. If neither of these treatments were possible
then the child would have to be isolated in a germ free environment in order to survive.
Hence the term “bubble babies”. Blaise and Anderson drew blood from the girls and
induced the T cells from the blood to replicate in culture. Then retroviral mediated
transfer of ADA gene into the cultured T cells took place allowing enough time for the
vector to integrate into the patient genome and transfer the gene. Blasie and Anderson
then injected the enhanced T cells back into the patients via the bone marrow. This
restored ADA gene expression and subsequently a viable T cell population. Within the
first 6 months one of the patients T-cell count rose and she had developed a steady
increase of ADA while the other patient also showed a rapid rise in T cells and showed
improvements in immune function tests (Muul et al., 2003; Blaese et al., 1995; Culver
et al., 1991; Kohn et al., 1989).
The year 2000 saw Alan Fischer and Marina Cavazzana-Calvo successfully treat 3
young children suffering from the fatal X-Linked Severe Combined Immuno-
Deficiency (X-SCID) disorder. This was achieved by the reinfusion of hematopoietic
INTRODUCTION Chapter 1
20
stem cells that were transduced ex vivo with an MLV vector (Cavazzana-Calvo, M. and
Hacein-Bey-Abina, S., 2001; Cavazzana-Calvo et al., 2000). Other successful
developments in gene therapy include treatments for cancer, chronic granulomatous
disorder (CGD) (Seger, 2008; Ott et al., 2006), viral infections (von Laer, Baum and
Protzer, 2009) and ADA SCID (Aiuti et al., 2002). However gene therapy again saw a
setback when 2-6 years after the treatment of X-SCID 4 patients in the French trial and
one patient in the English trial developed clonal T-cell proliferation (Dave et al., 2009;
Hacein-Bey-Abina et al., 2003). The main concern here was that there was no control of
where the gene was inserted in the genome carried by the retroviral vector. As a
consequence, the retroviral vector was later found to be in the LMO-2 gene resulting in
its dysregulation and leukaemogenesis. This was soon proven as insertional
mutagenesis.

INTRODUCTION Chapter 1
21
1.7 Safety of gene therapy vectors
The introduction of genetic material into the host where integration takes place may
result in disruption of host gene causing insertional mutagenesis and may lead to
oncogenesis. This problem has hampered many clinical trials and requires a clear
understanding of the mechanisms that contribute to oncogenesis in order that safety
gene therapy vectors can be designed.
1.8 Genotoxicity
Genotoxicity can be defined as a process that has a particular effect on the genome of
any individual that can result in a phenotypic change due to mutation (Ramezani,
Hawley and Hawley, 2008). The potential for insertional mutagenesis during
permanent gene transfer offered by retrovirus vectors present a genotoxic risk to the
host.
One of the defining features of retroviral life cycle is the covalent integration of the
double stranded viral DNA into the host chromosomal DNA. Retroviral integration is
semi-random occurring in genes with open chromatin configuration that are being
actively transcribed (Albanese et al., 2008; Baum et al., 2004; Mitchell et al., 2004;
Wu et al., 2003; Schroder et al., 2002). This can disrupt host genomic sequences and
lead to genotoxicity as a result of gene activation or inactivation (Nienhuis,
Dunbar and Sorrentino, 2006). Insertional mutagenesis mediated by wild type viruses
has been known for some time and was found to cause tumor development in several
animal species as a result of proviruses either carrying a truncated oncogene that
becomes expressed uncontrollably or by altering the expression of oncogenes found
near to the virus integration site. Indeed, retrovirus mediated mutagenesis can be
valuable to study a range of mechanisms associated with deviations from normal
cellular function since the gene involved in causing a phenotypic change can be found
(Varmus, 1982; King et al., 1985). However, very few studies have reported using
attenuated vectors as tools to discover new genes involved in cellular processes since
the likelihood of insertional mutagenesis by these viruses was considered to be remote,
with estimations of the frequency of mutations to be in the region of 10‾7 for a haploid
locus (Stocking et al., 1993).
INTRODUCTION Chapter 1
22
1.8.1 Insertion site (IS) selection
Most DNA sequences can act as sites for retrovirus integration acceptor sites, however
primary sequences may influence integration. It has been shown that if DNA is placed
into nucleosomes in vitro it will not reduce integration but instead this creates new “hot
spots” for integration. This is thought to be due the IS that are distorted due to wrapping
of the DNA around nucleosomes making the DNA accessible in places to viral
integration (Pruss, Bushman and Wolffe, 1994). Hence, viral integration appears to be
influenced by target site selection and this may influence the likelihood of insertional
mutagenesis.
In order to analyze IS, infected cells can be subjected to molecular techniques that
retrieve the DNA where integration occurred. This allows sequences of several
thousand integration sites to be analyzed (Mitchell et al., 2004; Schmidt et al., 2002;
Schroder et al., 2002).
Early studies on MLV indicated preference for integrating in open chromatin as a
positive correlation was detected between DNase I-hypersensitive sites and integration
frequency (Rohdewohld et al., 1987; Vijaya, Steffen and Robinson, 1986). More
recently, due to the sequencing of the human genome, it has been found that roughly
25% of integration events are near transcription start sites and are associated with CpG
islands (Bushman et al., 2005b; Wu et al., 2003; Scherdin, Rhodes and Breindl, 1990).
Wu et al in 2003, looked at 903 MLV insertion sites and found that 80% of integration
sites were distributed in the genome in a random fashion but that 20% of these were
within the 5’ end of a transcriptional unit (Wu et al., 2003). These insertion profiles
have been supported by studies of IS in hematopoietic cells of rhesus macaques by
Hematti et al in 2004, (Bushman et al., 2005b; Hematti et al., 2004). Hematti et al
showed the same integration site preferences from both human cells and rhesus
macaques indicating that integration patterns are similar a (Hematti et al., 2004).
Vectors based on lentiviruses are considered to be less genotoxic than gamma
retroviruses as lentiviruses such as HIV-1 and EIAV prefer insertion within the gene
transcription units whereas retroviruses such as MLV show an obvious bias for
promoters and selected gene classes involved in growth control and cancer which may

INTRODUCTION Chapter 1
23
increase probability of oncogene activation and consequently cancer development
(Montini et al., 2009; Cherepanov, 2007; Bushman et al., 2005b; Schroder et al., 2002).
Montini et al proved that using lentiviral vectors reduces the risk of cell transformation
by a factor of 10 as compared with gamma retroviruses due to IS selection (Modlich and
Baum, 2009; Montini et al., 2009) (Modlich and Baum, 2009; Montini et al., 2009)
A study by Lewinski et al in 2006, used HIV chimeras with MLV gag and pol genes
substituted for their HIV counterparts and found this to cause the hybrid vectors to
shown MLV integration profile (Lewinski et al., 2006). Overall, this study showed how
viral sequences such as gag and integrase have a direct role in target site selection.
Tethering interactions between cellular proteins and retroviral proteins may also effect
integration targeting. HIV integrase binds lens epithelium-derived growth factor
(LEDGF)/p75, a nuclear chromatin which is believed to be a cellular component that
influences IS preference. Cells lacking LEDGF/75 show reduced frequency of insertion
in transcription units demonstrating that LEDGF/p75 may play a role in integration
targeting in HIV (Engelman and Cherepanov, 2008; Lewinski et al., 2006; Kang et al.,
2006).
Analysis of the clonal dynamics of genetically modified lymphocytes in vivo is of
crucial importance to understand the potential genotoxic risk of using retroviral vectors
for gene therapy of haematological disorders. Molecular techniques such as linear
amplification-mediated PCR and pyrosequencing have provided a genome-wide, high-
definition map of retroviral IS in the genome of peripheral blood T cells from several
donors treated this way. This, in parallel to gene expression profiling and bioinformatics
has enabled a comparison to be drawn with matched random controls and with
integrations obtained from CD34+ hematopoietic stem/progenitor cells. Analysis of
integration sites in T cells obtained ex vivo two months after infusion showed no
evidence of integration-related clonal expansion or dominance, but rather loss of cells
harboring integration events interfering with RNA post-transcriptional processing
(Cattoglio et al., 2010). The study shows that high-definition maps of retroviral
integration sites are a powerful tool to analyze the fate of genetically modified T cells in
patients and the biological consequences of retroviral transduction.

INTRODUCTION Chapter 1
24
1.8.2 Insertional mutagenesis (IM)
As previously mentioned retroviral mediated insertional mutagenesis can lead to
malignancy via altering the expression of host genes in the vicinity of the IS. Virus
insertion can also alter gene products following aberrant splicing between virus and host
genes. If the affected gene is cancer related such as a tumor suppressor gene or proto-
oncogene, inactivation and activation respectively, can cause uncontrolled cell division
and promote tumor development (Modlich and Baum, 2009; Uren et al., 2005; Baum et
al., 2004). Various bodies of research have demonstrated vector integration affecting
flanking genes as far as 10kb away, leading to production of aberrant transcripts and
ultimately clonal proliferation.
1.9 Identification of IM during gene therapy of X-SCID
X-SCID is an X-linked monogenic disorder characterized by disruption of T and natural
killer cells signaling and activation due to mutations in the cytokine IL2 receptor -
chain (IL2RG) (Howe et al., 2008; Thomas, Ehrhardt and Kay, 2003; Cavazzana-
Calvo et al., 2000). IL2RG encodes a subunit of a cell surface receptor that allows
developing immune cells to respond to growth signals called cytokines. Without this
subunit children fail to develop the mature T lymphocytes so B-lymphocytes fail to
make antibodies to fight infection. (Hacein-Bey-Abina et al., 2008; Thrasher et al.,
2006). A mutation in the IL2RG receptor subunit can lead to lower rates of T and B
lymphocytes and natural killer cells which can in turn lead to lack of signalling required
for growth and survival of progenitor cells. Young patients with X-SCID are
particularly vulnerable to recurrent infections, as reduced lymphocyte function cannot
compensate for the already low immunoglobulin levels during early infancy. Hence,
SCID is often fatal within the first year (Thrasher et al., 2006).
Bone marrow transplant from HLA matched donors is the most common way to treat X-
SCID, however, it is often difficult to find matched cells to circumvent immune
rejection. Thus, in order to compensate this problem gene therapy has been used in an
autologous manner on patient haematopoietic stem cells. Gene therapy for X-SCID was
initiated around the year 2000, following promising in vitro results and a trial by Lo et

INTRODUCTION Chapter 1
25
al in 1999 whereby T, B and NK cells were restored in C deficient mice via a retroviral
vector containing the C gene (Lo et al., 1999). However, the main concern was that
there was no control over where retroviral vector integration occurred and the
ramifications of this. Hence, the risk of cancer development by IM was always under
consideration (Check, 2002).
Following on from the initial preclinical trial in vivo clinical trials took place in Paris
and (Cavazzana-Calvo et al, 2000; Hacein-Bey-Abina et al, 2002) and London (Gaspar
et al, 2004) for the treatment of X-SCID. Haematopoietic stem cells (CD34+) isolated
from children suffering from X-SCID were transduced ex vivo with an MLV gamma
retroviral vector carrying the C receptor gene before reinfusion back into the patients.
Several months after returning the treated cells cellular and humoral immunity was
restored and it was noted that T and NK cell counts and function were at near normal
levels to those found in normal children of the same age. Unfortunately, in 5 patients
clonally dominant cells emerged leading to leukaemnia 3-5 years after treatment
(Hacein-Bey-Abina et al., 2010; Qasim, Gaspar and Thrasher, 2009). This resulted in
premature cessation of the trials and investigations into the cause(s) of the leukaemias.
To investigate for suspected IM, patient cells were isolated and genomic DNA
examined for virus IS. Lam-PCR using specifically designed primers recognizing
retroviral sequences and linkers to capture genomic DNA containing the inserted vector
enabled IS detection. In 4 out of 5 patients that developed leukaemia, 3 from the Paris
trial and 1 from the London trial showed integrative events occurred in or near to the
proto-oncogene LIM domain only 2 (LMO2) gene. It was subsequently shown that this
led to elevated LMO-2 expression and uncontrolled proliferation of mature T cells
(Hacein-Bey-Abina et al., 2010; Qasim, Gaspar and Thrasher, 2009; Nam and Rabbitts,
2006; Hacein-Bey-Abina et al., 2003). What remains vague is why the viral vector
inserted itself near the LMO2 promoter locus in 4 of the 11 children treated with the
same protocol. One suggestion is that it was due to gene expression promoting IS
selection (Kaiser, 2003; Coutelle et al., 2003).
A number of studies were performed following the X-SCID trials. One study by Li et
al, (2002) echoed the findings of the original French trial by showing that the
transplantation and expansion of clones from retroviral transduced bone-marrow cells
also induced leukaemia in mice (Li et al., 2002). The transgene used in this study was

INTRODUCTION Chapter 1
26
thought to have had growth promoting activities however, the authors also suggested
that the cancer may have developed due to the consequence of co-operation between the
transgene product and the MLV retroviral integration event that disrupted and up-
regulated the proto-oncogene (Baum et al., 2003).
A later study by Modlich et al in 2005 also showed the development of leukemia in
mice that were treated by infection of bone marrow derived stem cells at high retroviral
MOI. In this case the retroviral vectors were carrying the multi resistance gene 1
(MDR1). Even though several other studies reported no complications of using MDR1
in the transduction of bone marrow cells Modlich found multiple insertions in proto-
oncogenes (Modlich et al., 2005) in clonally derived cells.
1.10 Chronic granulomatous (CGD) trial
X-Linked chronic granulomatous disease is an inherited disorder caused by abnormal
p22phox (CYBA), P67phox (NCF2) and gp91phox (CYBB) genes. Two thirds of CGD’s
are however caused mostly by mutations in the gp91phox genes. This group of genes
work together to create the NADPH oxidase enzyme which catalases the production of
superoxide from oxygen and NADPH (Kang and Malech, 2009; Seger, 2008). Thus,
CGD occurs via the absence of NADPH oxidase activity that results in neutrophils,
monocytes and other phagocytes being incapable of producing the reactive oxygen
species to destroy bacteria. Thus failure of the production of dp91phox causes frequent
life threatening infections (Stein et al., 2010; Malech et al., 1997; Bjorgvinsdottir et al.,
1997). CGD is usually treated with bone marrow transplantation, however, as the gene
responsible for CGD is known, it has therefore been possible to apply gene therapy to
attempt CGD correction.
A study by Dinauer et al in 2001 showed successful retroviral transduction of rats that
had a mutation in the gp91phox gene. This resulted in the phagocytes of these rats being
able to return to producing reactive oxygen radicals (Dinauer et al., 2001). Lee et al in
2008 transduced murine bone marrow stem cells with the MT-gp91phox gene and
evaluated the possibility for toxicity to occur in the treated mice. Although white blood
cell counts increased no toxicity was found (Lee et al., 2008). Hence, in comparison to
the X-SCID trial, the gamma retroviruses used in these studies did not create any clonal
imbalance.

INTRODUCTION Chapter 1
27
In 2004, two adolescent X-CGD patients were infused with CD34+
blood stem cells
containing the gp91phox gene after retroviral mediated gene transfer and initially clear
benefits were found. In the follow up of patients from this trial, hematopoietic clones
carrying insertions in certain gene loci became dominant (Gaspar et al., 2004).
Research into gene insertions and their differential expression suggested that this clonal
dominance was due to growth and or survival advantage conferred by gene-activating or
suppressing effects of the integrated retroviral vector. Clonal dominance had already
been thought to be a natural property of hematopoiesis (Fehse and Roeder, 2008; Ott et
al., 2006; 2006). As a result of this work and that of others it is generally accepted that
having a low copy number of vector integrants per cell is clearly favorable to reduce the
likelihood of oncogenesis (Ramezani, Hawley and Hawley, 2008). In addition to this,
the vector configuration, the transgene carried by the vector, the proliferation status of
the host cells during infection and most recently synergy between the transcription
status and the mutational potential of the vector are considered as factors associated
with clonal dominance (Nowrouzi et al., 2012; Baum et al., 2006). These findings
clearly highlight the need to understand more about the association between vector
insertion and genotoxicity in the host to develop safer integrating vectors for gene
therapy.
INTRODUCTION Chapter 1
28
1.11 Models for genotoxicity
The study of retrovirus mediated genotoxicity may still be considered in its infancy and
so it is important that we attempt to understand vector associated adverse effects on the
host in greater detail. To do this, in vitro and in vivo models need to be established that
either expose the causes of genotoxicity by retrovirus vectors and/or predict their
genotoxic risk.
1.11.1 In Vitro models of genotoxicity
One in vitro assay designed to measure the risk of vector-related genotoxicity is an
adaptation of the hrpt in vitro assay in V79 Chinese hamster male cells. This assay has
previously been used to test for carcinogenicity and genotoxicity caused by radiation
and UV light. The hprt gene encodes the hypoxanthine-guanine
phosphoribosyltransferase (HPRT) and catalyzes purines to monophosphates that are
toxic to cells. V79 cells are used as they are male in origin and carry a single copy of
the hprt gene that is present in the X-chromosome (Zhang et al., 1994). The advantages
of using this gene is that existing hprt‾ mutants can be purged from culture populations
using HAT treatment so that any new mutants are likely caused as a result of virus
associated induction to hprt‾ via mutagenesis. Mutants can be isolated following
selection using 6-thioguanine (6TG)
Themis et al (2003) adapted this model to determine whether retroviral insertional
mutagenesis could mediate loss of hprt activity by gene inactivation following selection
for hprt‾ mutants in a similar manner to that carried out previously in mouse ES cells
(Themis et al., 2003; King et al., 1985).
Goff predicted the frequency of mutagenesis by a single provirus insertion in the
mammalian genome at a haploid locus such as hprt to be about one inactivating
mutation in 106
virally exposed cells (Goff, 1987) however, King et al (1985)
established that only one in 108
provirus insertions can cause hprt mutagenesis (King et
al., 1985). The work by Themis et al, in 2003, however, showed hprt mutagenesis by
attenuated retroviruses occurs at a similar frequency using replication competent vectors
at 3.6x10⁶ and only if high MOI is used. This group also showed that a 2.3 fold increase
in the risk of mutagenesis only occurred where the infection resulted in multiple
provirus insertions per host genome (Themis et al., 2003).
INTRODUCTION Chapter 1
29
Kustikova et al (2003) also investigated the relationship between vector copy numbers
and gene transfer efficiency using K562 leukemia cells and primary CD34+ cells. This
group also found insertional mutagenesis closely linked with vector copy number..
From their study, they also found an increase in copy number is accompanied by high
gene transfer rates. A single transduced cell with one vector insertion occurs when a
gene transfer of less than 30% is reached. The use of insertion of 3 vectors/cell (MOI of
3) increased the transduction efficacy to 60% and an MOI of 9 increased gene transfer
efficacy to 90% (Kustikova et al., 2003).
Kustikova et al in 2007 studied the cause of clonal dominance leading to malignancy by
cultivating bone marrow stem cells ex vivo and transporting them to primary then
secondary mice. They then produced a database showing which retroviral IS are related
to malignancy. This insertional dominance database (IDDb) showed retroviral insertions
into genes with ontologies associated with apoptosis, cell cycle control, proliferation
and transcription (Kustikova et al., 2007). In 2009 this group then showed the
influence of purifying haemopoietic stem cells and cell sorting on insertional
mutagenesis. They found that when stem cells were purified this did not necessarily
reduce the genotoxic effect of -retroviral transduction. However, reducing the number
of transduced haemopoietic stem cells did reduce the genotoxic risk. They also found
that the risk of clonal imbalance (Kustikova, Modlich and Fehse, 2009)caused by
provirus insertion into proto-oncogenes could be reduced by using lentiviruses instead
of -retroviral vectors to transduce purified haemopoietic stem cells (Kustikova,
Modlich and Fehse, 2009).
The effect of vector dosage on retroviral transduction was studied further by Modlich et
al in 2005 where it was found that increasing vector dose contributes to increasing
insertional mutagenesis. This was demonstrated by transducing bone marrow cells ex
vivo with the RV vectors containing the MDR1 gene. The cells were then returned to
the C57BL/6J mice. Development of leukemia was shown to be associated with clones
that gave high retroviral expression of MDR1 as a result of high vector copy numbers
achieved by high MOI infection. These clones were also over-represented with multiple
RV insertion into proto-oncogenes and other signaling genes (Modlich et al., 2005). In
INTRODUCTION Chapter 1
30
2006 Modlich et al also developed a cell culture model assay to test genotoxicity by RV
or LV mediated gene up regulation in haematopoietic cells (Modlich et al., 2006).
Interestingly, results suggested the idea that genotoxicity could be due to the
architecture of the vector used, and by re-locating the strong enhancer regions from the
LTR region this could significantly decrease genotoxic outcome (Josephson and
Abshire, 2006; Modlich et al., 2006; Wang et al., 1999). Importantly there was a
correlation between insertion into the Evil gene and the MOI used (Modlich et al.,
2006). The same principle could therefore be applied to other viral vectors to deduce if
these same changes to the architecture of the vector could lower genotoxicity levels,
thus improving the safety of viral gene therapy.
1.11.2 In Vivo models of genotoxicity
In genotoxic research studies the mouse is the most used mammalian model as it is
small, reproduces quickly and has many genetic, biological and behavior characteristics
that closely resemble those of humans. Larger models of gene therapy include sheep,
pigs (Amsterdam et al., 1999), rhesus monkeys (Tarantal et al., 2001) and dogs.
One particular mouse model for genotoxicity has been developed in our laboratory. This
model was originally based on gene therapy before birth. Numerous genetic disorders
may manifest in the fetus before birth and hence in utero gene therapy has been
researched to treat individuals at this early time point in development. In utero gene
therapy therefore aims at early intervention for prevention of fatal genetic diseases by
targeting stem cells, gene delivery circumventing immune rejection to the vector and
transgene product, tolerance to the vector and permanent correction (Coutelle et al.,
2005). In 2004 Waddington et al corrected human factor IX (hFIX) deficiency using
HIV-1 lentiviral vector in hFIX knock out mice. Plasma FIX antigen levels increased
and delivery of hFIX did not cause an immune response (Waddington et al., 2004).
In utero studies have been shown in both small and large animal models (Tarantal et
al., 2005; Themis et al., 2005; Walsh, 1999). However, since virus IS are believed to
target genes that are actively dividing as in the case of rapidly replicating fetal cells this
could increase the risk of insertional mutagenesis. The potential for IM in the mouse
fetus was hypothesized by Dr Themis. Using the fetal mouse model this group
published the observation of liver cancers in mice treated in utero with lentivirus
INTRODUCTION Chapter 1
31
vectors. Hence, the in utero mouse genotoxicity model was developed (Themis et al
2005;2012). The original study to establish this model involved the use of both primate
HIV (HR’SIN-cPPT-S-FIX-W) and non-primate EIAV (SMART2) viral vectors each
driving hFIX gene expression. Although both vectors resulted in correction of the KO
mouse for haemophilia B, in the EIAV treated mice hepatocellular carcinoma (HCC)
developed (n=8/10) (Themis et al., 2005). These tumours were easily predicted by high
level HFIX expression in mouse blood. Isolation of DNA from these tumours followed
by Southern analysis showed each to be of clonal origin with 1 to 10 integrated
proviruses per genome. Next LAM PCR allowed mapping of EIAV IS relative to genes
in the mouse genome. Fifty-six percent of these were found to be oncogenes or genes
associated with oncogenes. Ninety-nine of these were then found reduced in expression
indicative of IM. Furthermore, 11 of were listed in the mouse retroviral tagged cancer
gene database (RTCGD) that carries already known genes found involved in
tumorigenesis in mice that developed tumours following retroviral infection (Themis et
al., 2005; Akagi et al., 2004). Interestingly, the primate HIV vector was not associated
with tumour development that indicates this vector could be suitable for prenatal and
post natal gene therapy (Waddington et al., 2004).
This in vivo model is a valuable tool to enable the evaluation of lentiviral genotoxicity
and most importantly for the discovery of genes involved in liver tumour development
using the HCC phenotype. The model circumvents the need for cell engraftment and
proliferation such is the case for ex-vivo models of genotoxicity and is useful to identify
molecular pathways for immortalisation and malignant progression that differ from
those specific to leukaemia. Most recently, this group used the fetal model to show IS
preference to actively transcribing genes and the different IS profiles between the
primate HIV and non-primate EIAV vectors (Nowrouzi et al., 2012).
INTRODUCTION Chapter 1
32
1.12 Alternative routes to genotoxicity not involving IM
1.12.1 DNA Damage
A DNA double strand break (DSB) is a severe form of DNA lesion. Our genomes
experience thousands of DNA lesions per cell each day. Some of these lesions are quite
benign while others can be genotoxic. DNA DSBs are regarded as one of the most
dangerous, toxic and mutagenic forms of DNA damage. A single DSB may lead to the
loss of 100 million base pairs of genetic information. The breaks in the covalent bond of
both the phosphate backbone of the DNA molecule leads to DNA DSB in eukaryotic
cells. After dissociation of the two ends of DNA double stands, repairing becomes
difficult and may lead to inappropriate recombination with other broken sites. If DSB's
are misrepaired it can cause chromosomal translocations, which is an early step to
developing carcinogenesis, and if left unrepaired it can cause cell death (Helleday et
al., 2007; Bassing and Alt, 2004).
DSB can form in response to exogenously or endogenously produced DNA damaging
agents. Endogenous sources such as reactive oxygen species and free radicals are
generated from cellular metabolic reactions, class switch recombination, and replication
fork collapse during DNA replication and physical stress during meiosis can cause DSB
(van Gent, Hoeijmakers and Kanaar, 2001).
Interestingly despite the danger of DSB, mammals have found ways of using this
process for their own benefit in controlling biological processes. Programmed DSB
occur in the steps involved in maturation of immunoglobulin genes by initiating
rearrangements. V (D) J recombination is involved in the early development of B and
T-lymphocytes and is important in generating diverse groups of antigens receptors
occurring in lymphocytes. The rearrangement of exons that encode immunoglobulin and
T cell receptors occur during B or T lymphocyte development by variable (V), diversity
(D) and joining (J) gene segments. These programmed temporary DNA DSB are
induced in the cell nucleus by proteins such as RAG1 and RAG2 (Bassing, Swat and
Alt, 2002). DSB are also essential for the maintenance of DNA synthesis. DSB occur
behind the replication fork by enzyme topoisomerase, which relieves the tension of
unwinding (Shin et al., 2004a; Jackson, 2002). The enhanced levels of endogenous
chromosome breakage or chromosomal rearrangement, which have been seen in cells

INTRODUCTION Chapter 1
33
that do not repair DSBs, show that they represent frequent encounters of endogenous
lesions (van Gent, Hoeijmakers and Kanaar, 2001).
Exogenous factors that cause DSB include ionizing radiation, chemicals and
chemotherapy agents. Cellular responses to these exogenous factors are variable
depending on cell type, dose and exposure length.
The early work on DNA damage and repair in the 1930’s was stimulated by a prominent
group of physicists (Friedberg, 2002). It was the work of geneticist Hermann Muller
who while working on the Drosophilla fruitfly first demonstrated mutations occurring
when external agents such as ionizing radiation were involved (Muller, 1927). Ionizing
radiation is energy that is carried by electromagnetic rays or by particles emitted from
radioactive materials, nuclear reactions and medical X-ray equipment. Living organisms
experience ionizing radiation from natural sources at low doses and at high doses via x-
rays and radiation therapy. Understanding how cells respond to radiation exposure is
therefore critical. DNA damage is caused directly by energy transfer of the DNA
molecule or indirectly by the production of hydroxyl radicals from the ionization of
water molecules that subsequently attack DNA. Exposure to ionizing radiation activates
the signaling pathway of DNA damage in the nucleus and the result could be
therapeutic depending on exposure conditions such as cell cycle, cell cycle stage an
dose of radiation (Kastan and Bartek, 2004; Qvarnstrom et al., 2004).
DNA stressing agents induce DNA DSBs that initiate complex set of responses in the
cell. First, DNA damage sensing and signaling mechanisms will alert the cell of DNA
DSB taking place. Then mediators and transducers will transmit the damage signals to
effector molecules that arrest cell cycle if necessary until the DSB is repaired. DNA
damage signals can induce apoptosis when the cell suffers from high levels of genomic
instability (Mills, Ferguson and Alt, 2003; Paull et al., 2000).
INTRODUCTION Chapter 1
34
1.12.2 DNA DSB repair
All eukaryotic cells have evolved mechanisms to deal with DSBs. The two main
mechanisms of DDR repair are homologous recombination (HR) and non-homologous
end joining (NHEJ). HR uses replication to generate an identical copy of the cellular
DNA and the undamaged copy can be used as a template for repair and resynthesize of
a DSB. This pathway exploits a sister chromatid which is present following replication,
consequently HR is restricted to the S phase of the cell cycle. When a replication fork
stalls due to its production of unfavorable DNA structures the HR pathway restarts the
replication machinery. This pathway is deemed a very accurate method of repair. In
contrast, NHEJ is less reliable but more robust as the broken ends of a DSB are fused
together. This may result in the removal or addition of a few nucleotides at the repair
site and may be error prone. The NHEJ repair mechanism is preferred at the G1 phase
of the cell cycle where (Shrivastav, De Haro and Nickoloff, 2008; Jeggo and Lobrich,
2007; Essers et al., 2000).
1.12.2.1 DNA repair by Homologous recombination (HR)
HR is meditated though a set of proteins including RAD50, RAD51, RAD52, RAD54,
RAD55, RAD57, RAD59, MRE11 and XRS2 which are all essential in repairing DSB
(Thompson and Schild, 1999; Kanaar, Hoeijmakers and van Gent, 1998). The first step
in the HR pathway is the resectioning of the broken DNA ends beginning with the 5’ to
3’ end processing by the MRN complex consisting of Mre11p, Rad51p and NBS1
(Shin et al., 2004). Next the replication protein A (RPA) binds the 3’ single stranded
DNA (ssDNA) ends. RPA is phosphorylated and replaced with Rad52 to allow Rad51
binding. A homologous sequence that is complementary to broken DNA sequence is
found and invaded by Rad51 that binds to the ssDNA end forming a nucleoprotein.
Rad51 is the dissociated from the ssDNA to allow normal base pairing by DNA
polymerase and extend the ssDNA strand according to the host complementary DNA
sequence. This process termed synthesis-dependent strand annealing can occur by
annealing extended ssDNA strand with non-invading DNA strand on opposite side of
DSB or HR can produce a double holiday junction by invading both strands which are
then resolved by crossover or by non-crossover recombinants. Finally, DNA
INTRODUCTION Chapter 1
35
polymerase and DNA ligase resolve the nicks and gaps by ligation of two DNA ends
(Shrivastav, De Haro and Nickoloff, 2008; Shin et al., 2004; van Gent,
Hoeijmakers and Kanaar, 2001).
1.12.2.2 DNA repair by non-homologous end joining (NHEJ)
NHEJ require the concerted action of a series of proteins. Such as Ku heterodimer
(Ku70 and Ku80), DNA-PKcs, Artemis, XRCC4, DNA ligase IV and XLF (known as
Cernunnos). Firstly, the overhanging ends are detected by Ku protein that consists of
two subunits Ku70 and Ku80. The broken ends of the DNA are attached with Ku dimer
proteins to protect the DNA ends from further collapse and provide access to other
repair proteins such as DNA-dependent kinase (DNA-PKcs) (DS, 2005). The second
step of NHEJ pathway is the processing of the DNA ends to remove non-ligatable end
groups. Different enzymes may be used depending on the nature of the breaks. Artemis,
DNA polymerases, MRN complex, RPA and WRN are candidate-processing enzymes.
Lastly, XLF stimulate the XRCC4/DNA ligase IV to ligate the DNA ends (Summers et
al., 2011; Shrivastav, De Haro and Nickoloff, 2008; Barnes, 2001).
NHEJ is not precise due to synapsis occurring between two broken DNA ends and the
trimming that occurs at each end. If two breaks occur at the same time the ends may get
mixed up when DNA repair is taking place and genes may be translocated from one
place to another. These errors can be deleterious in some cases leading to cancer such as
Burkett’s lymphoma which moves an inactive c-myc genes into a very active area
thereby causing uncontrolled growth in the cell by an over expression of the gene
(Rowh et al., 2011).
In the late 1960s James Cleaver reported individuals with xeroderma pigmentosum (XP)
to be prone to skin cancers. Cleaver then went on to look for a mammalian cell line
deficient in excision repair and found that XP individuals who were genetically
defective in excision repair were sunlight sensitive and more prone to cancer. This
defect in nucleotide excision repair represented a triumph in the field of genetics as it
provided insight into defining DNA repair and hereditary human diseases (Cleaver,
1968).
INTRODUCTION Chapter 1
36
The first known DSB repair defective mouse mutant was the SCID mouse. These mice
carried a mutation which prevented the production of mature B and T cells, due to a
defect in V (D) J recombination. These mice were also found to be sensitive to ionizing
radiation, which is caused by a mutation in the PRKDC gene resulting in the deletion of
parts of the DNA-PKcs (Smith and Jackson, 1999).
Deficiencies in NHEJ leads to increased risk of cancer with chromosomal instability
partially in cells consisting of a mutation in the tumor suppressor gene p53. This could
be possibly due to the decrease in the cell undergoing apoptosis (Helleday et al., 2007;
van Gent, Hoeijmakers and Kanaar, 2001). Patients with mutations in the Artemis gene
have been found to develop thymic lymphomas. This shows that a decrease in NHEJ
end capacity may increase the incidence of cancer (Moshous et al., 2003).
1.12.3 Genome instability due to DSB
Elevated levels of spontaneous genomic instability, increased sensitivity to ionizing
radiation and other factors, which contribute to DSBs, are some of the phenotypes that
are associated with mutation or inactivation of either the NHEJ or HR pathway
(Jackson, 2002).
Incorrect repair of DSB can cause genome instability in the form of chromosomal loss,
rearrangements, or amplifications that could potentially lead to cancer (Shrivastav, De
Haro and Nickoloff, 2008). Mutations which alter the function of a specific gene i.e.
oncogenes and tumor suppressor genes, which are essential for cell division give rise to
neoplasmic transformations. This is known as the somatic mutation hypothesis that
shows correlation between chromosomal abnormalities and cancer. This was first
observed by Theodore Boveri, who reported abnormal number of chromosomes in
cancerous cells (Boveri, 2008).
There are two main forms of genomic instability that are linked to tumours. One is
mutational instability (MIN) phenotype that is connected to mismatch repair defects and
is portrayed by small deletions or point mutations. The other genomic instability is the
chromosomal instability (CIN) phenotype, which is characterized by rearrangements of
chromosomes. Unrepaired DNA DSB can lead the cellular genome towards gene
deletion, chromosome aberrations including chromosome segment amplification and the
loss or gain of whole chromosome (Ricke, van Ree and van Deursen, 2008).
INTRODUCTION Chapter 1
37
Amplification of a chromosome region may initiate tumorigenesis by the activation of
proto-oncogenes whereas inactivation of tumor suppressor genes can be activated by the
loss of large regions of a chromosome. Studies involving ionizing radiation of mammals
or cells involving DSB have been shown to be involved in chromosome aberrations
(van Gent, Hoeijmakers and Kanaar, 2001).
Chromosome instability stems from the inability to correct sister chromatids during
mitosis. Failure of this mitotic checkpoint has been shown to be involved in
chromosome instability. If the mitosis is prolonged it results in mitotic checkpoint over
activation and is a frequent observation in tumours (Schvartzman, Sotillo and Benezra,
2010). Most of the main regulators of the mitotic checkpoints are downstream targets of
the retinoblastoma (Rb) tumor suppressor pathway which is up regulated in most human
tumors (Iovino et al., 2006; Zheng et al., 2002; Lentini, Pipitone and Di Leonardo,
2002). Mitotic checkpoint genes are essential in each mammalian cell division,
however, unlike DNA damage checkpoint their loss is unlikely to cause a buildup of
genomic damage in tumors (Schvartzman, Sotillo and Benezra, 2010).
Several genes are involved in the mitotic checkpoint and mitosis. These genes are under
the control of the E2F family of transcription factors and are partially dependable on the
on the level of inhibition of the Rb pathway (Lentini, Pipitone and Di Leonardo,
2002). Several cancers result from the mutations in genes that are essential for DNA
damage checkpoint and DNA repair pathways such as hereditary non-polyposis
colorectal cancer caused by the MLH1 and MSH2 gene, xeroderma pigementosum (Xp
family) and ataxia-telangiectasia (ATM mutated) (O'Driscoll and Jeggo, 2006). In most
cases genes that are essential for mitotic checkpoint are up regulated, this may be due to
the absence of the Rb pathway. This overexpression of key genes and an inhibition of
the Rb pathway can lead to tumor formation. Interestingly gene expressions from
human tumors have shown that genes, which are involved in DNA damage repair
pathways, are overexpressed in DNA damage pathways (Swanton et al., 2009).
If a DSB is repaired incorrectly by non-homologous end joined (NHEJ) pathway this
can result in mutation or oncogenic rearrangement. V (D) J recombination can lead to
rearrangements of oncogene chromosome resulting in lymphoid cancers such as
Burkitt’s lymphoma and B-cell malignancy which are caused partially due to
rearrangements of the c-MYC gene (Jackson, 2002). In conclusion, agents that cause
DSB should be considered as potential mutagens. Indeed, integration by retroviruses
INTRODUCTION Chapter 1
38
also cause DSB due to the viral integrase cutting and ligating the virus genome with that
of the infected host (Sakurai et al., 2009).
1.12.4 Proteins used to determine the presence of DSBs
It is vital to spread the alert signal efficiently to the cell when a DSB occurs. Checkpoint
mediators or adaptors and transducer kinases CHK1 and CHK2 are linked to proximal
checkpoint kinases such as ATM and ATR to organize the global cellular response to
DSBs. These transducers (CHK1 and CHK2) regulate the phosphorylation of the
downstream checkpoint targets such as effector proteins that play a vital role in cell
cycle controls, DNA repair and apoptosis (Jeggo and Lobrich, 2007).
In addition to ATM and MRN other key effectors of the DSB response include histone
H2AX and 53BP1. These proteins respond to the site of DSB and initiate in the ATM
dependent signaling cascade that leads to DNA repair, or apoptosis.
The proteins function as key regulators in the DNA damage response as an inactivation
of any will render the cell sensitive to DSB (van Attikum and Gasser, 2009).
H2AX
H2AX is found exclusively at sites of DNA DSBs and is a key component of chromatin
(McKinnon and Caldecott, 2007; Rogakou et al., 1998). H2AX is at the heart of
ionizing radiation induced foci and contains a serine residue that is rapidly
phosphorylated by protein kinase family ATM in response to DNA damage. This
modified form is then referred to as H2AX (Bassing et al., 2003; Rogakou et al.,
1998). It is readily phosphorylated on chromatin surrounding DNA DSBs. It does not
diffuse freely in the cell this may explain why their phosphorylation appears to be
important for DNA repair and is not required in cell cycle arrest (Zgheib et al., 2005).
H2AX regulates the recruitment and accumulation of a multitude of DNA damage
repair factors (DDR) and is critical for repair of DNA lesions. One study using mice
found H2AX deficiency results in genome instability and is associated with cancer
predisposition (Celeste et al., 2002).
INTRODUCTION Chapter 1
39
53BP1
53BP1 is a DDR protein phosphorylated by ATM as an early signal of DNA DSBs.
53BP1 is a nuclear protein which rapidly localizes to discrete foci followed by lesions
in the cell. The evidence of involvement of 53BP1 in DNA DSBs is the localization of
53BP1 to the sites of DSB after exposure to Ionizing radiation. Its recruitment to sites of
DSBs is facilitated by histone H2AX phosphorylation and ubiquitination indirectly
(Fernandez-Capetillo et al., 2002). 53BP1 is involved in ATM activation since
suppression of 53BP1 leads to a reduction in ATM phosphorylation (Wu et al., 2009).
The interaction of 53BP1 with histone H3 methylated on Lys79 also mediates the
recruitment of 53BP1 to sites of DNA DSBs (Zgheib et al., 2005; Huyen et al., 2004).
Importantly, 53Bp1 undergoes nuclear relocalization to focal structures following
irradiation. This molecule facilitates both checkpoint and repair functions. Relocation of
53BP1 to the DNA damage sites is also dependent on its tudor domain that recognizes
methylated histones (Kim et al., 2006). Knockdown of 53BP1 results in instability
represented by increased levels of chromatid gaps and aneuploidy indicating that 53BP1
is involved and much needed in DNA repair (FitzGerald, Grenon and Lowndes, 2009;
Ward et al., 2003).
Since ATM assists in H2AX spreading and in turn is required for the accumulation of
additional DDR factors such as 53BP1, together these events trigger and amplify the
DDR signal (Zgheib et al., 2005; Lukas, Lukas and Bartek, 2004). Translocation of
these proteins to DNA DSBs facilitates DNA damage checkpoint activation and
enhances efficiency of the DNA damage repair.

INTRODUCTION Chapter 1
40
1.12.5 Methods for determining DNA DSBs
There are a number of methods to measure DNA DSBs such as sucrose density
gradients, neutral elution, pulse field gel electrophoresis (PFGE) and nuclear foci
analysis. PGFE and nuclear foci analysis are the most common methods of detecting
DSBs. In PGFE DNA DSBs is quantified according to the fraction size of DNA
released. Because H2AX and 53BP1 are involved in signaling pathways of DNA
damage and repair and accumulate in large nuclear domains after DNA damage, their
recruitment to DSBs can be exploited to enable in situ visualization of DSBs. To do
this, H2AX and 53BP1 proteins are stained with specific antibodies then subjected to
immunofluorescence. This allows quantification of foci representative of DSB in the
cell nucleus after DNA damage (Qvarnstrom et al., 2004; Paull et al., 2000).
Quantification can be done either manually or via an automated computational
analyzing system (Bourton et al., 2012).

INTRODUCTION Chapter 1
41
1.12.6 Retrovirus integration mediated DSB
As previously described, retroviral integration into the host genome is critical for
retroviral replication using the virus integrase enzyme. The integrase removes two
nucleotides from the 3’ ends of the viral DNA in the cytoplasm. It then catalyzes the
joining of these ends to staggered phosphorous atoms in the backbone of the
complementary strands of the host DNA (Skalka and Katz, 2005). Single strand gaps
are produced between the viral DNA and the target DNA (Miller, Wang and Bushman,
1995). During this process the host cell DNA suffers a DSB. Insertion of 3-10kb of
newly synthesized DNA is likely to be sensed as a major assault on genomic integrity
that leads to a DDR. Additionally, unintegrated viral DNA can be is circularized by
ligation of LTR sequences to form a 2LTR circle. One LTR circles can also be
generated (Goff, 2001; Li et al., 2001). Presumably, this limits recognition of free
DSB to reduce a DDR. Completion of the integration is highly important to virus
survival as DSB can lead to apoptosis
Indeed, retroviral transduction into cells which lack the DNA-PK or ligase IV repair
enzymes undergo apoptosis. This suggests the requirement of NHEJ to complete
retroviral integration (Daniel, Katz and Skalka, 1999). Lau et al showed that ATM
dependent DNA damage response is stimulated by the HIV-1 integrase and that
deficiency of the ATM also triggers apoptosis.
Sakurai et al in 2009 found that ATM, Artemis and the MRN complex play vital roles
in protecting the ends of viral DNA before strand transfer and the 3’ processing activity
of the integrase as in the cells deficient in ATM, Artemis and the MRN complex could
not completely process terminal dinuclotides (Sakurai et al., 2009). Sakuirai et al also
found in the same study that their sequence analysis indicated lack of DSB repair
enzymes influenced HIV-1 integration site selection. They used the data of Holman et
al (2005) to show that HIV-1 integration preference is slightly influenced by ATM as
cells deficient in ATM have different IS profiles to cells that have normal ATM levels
(Sakurai et al., 2009; Holman and Coffin, 2005).
Daniel et al in 1999 first suggested the role of the NHEJ pathway in post integration
repair by showing DNA-PK to be involved in the RV DNA integration process. When

INTRODUCTION Chapter 1
42
DNA-PK deficient murine SCID cells were infected with 3 different RV, integration is
reduced and death via apoptosis occurred. Furthermore, SCID cells infected with the
avian retrovirus have reduced viability by 40-50% compared to control cells and this
appeared dependent on the virus MOI. In the same study, they observed death of SCID
cells after infection with integration competent virus but not with integration defective
viruses (Daniel, Katz and Skalka, 1999). A study (Weller, Joy and Temin, 1980)
showed that RV infection induced apoptosis in 80-90% of NHEJ deficient cells. They
also found the NHEJ system to be responsible for the circulization of some of the viral
cDNA to produce 2LTR circles. This is also in agreement with studies by Howard
Temin et al (1980) who also observed a correlation between the degree of cytopathic
effect after infection and the number of integrated RV. Overall, these data suggest that
RV integrations cause DNA damaging events and that a failure of post integration repair
to these can lead to apoptosis (Skalka and Katz, 2005; Daniel, Katz and Skalka, 1999;
Weller, Joy and Temin, 1980).
Daniel et al in 2004 established that RV infection induces the formation of H2AX foci
and that H2AX phosphorylation occurred at sites of RV DNA integration. They also
established that cells respond to DNA integration in a similar manner to DSBs.
This group also found that efficient transduction of MEF’s by HIV- 1 requires DNA-
PKcs and that XRCC4 deficient CHO cells infected with HIV-1 have a transduction
efficiency 5-10 fold lower than control cells. Furthermore, they found a sharp decrease
in viability of cells infected with integration competent virus compared with integration
defective vectors (Daniel et al., 2004).

INTRODUCTION Chapter 1
43
1.13 Epigenetic modifications leading to genotoxicity
Epigenetic modifications determine where and how genetic information is used by the
cell to maintain homeostasis (Waddington, 2012). It is important in the normal
development of a cell, cell proliferation, gene expression and aetiology of disease
(Matouk and Marsden, 2008; Devaskar, S.U. & Raychaudhuri, S., 2007). Making sure
genes are active or inactivated at the correct time is essential to prevent abnormal gene
expression that could potentially lead to disease and cancer (Sarkies and Sale, 2012;
Klose and Bird, 2006; Robertson and Wolffe, 2000).
Epigenetic changes can influence chromatin structure and regulate transcription. Such
changes regulate chromatin remodeling and mediate histone modification and DNA
methylation (Dolinoy, Weidman and Jirtle, 2007).
DNA methylation is a post replication modification involving the covalent addition of a
methyl group to the 5 position of cytosine (Robertson, 2001). DNA methylation itself
can result in transcriptional repression, chromatin modulation, genomic imprinting, X
chromosomal inactivation and governs genomic integrity. Research has revealed its
importance in many processes such as DNA repair, genome stability as well as
chromatin architecture (Robertson and Wolffe, 2000; Baylin and Herman, 2000; Jones
and Laird, 1999). Globally, DNA methylation patterns in mammals are established by at
least three independent DNA methyltransferases: DNMT1, DNMT3A and DNMT3B
(Klose and Bird, 2006; Robertson, 2001).
DNMT1
DNMT1 was the first methyltransferase to be discovered and is the most abundant in
somatic cells (Bestor et al., 1988). It is primarily the enzyme responsible for copying
pre-existing methylation patterns onto new DNA strand during DNA replication (Klose
and Bird, 2006). However, under carcinogenic conditions DNMT1 has been found to
perform de novo methylation (Vertino et al., 1996).
DNMT1 identifies methylated and non-methylated DNA in its regulatory region and
carboxy-terminal domain (Fang et al., 2001). DNMT1 is associated with the tumour
suppressor Rb that interacts with the N-terminal region of DNMT1 (Robertson and
INTRODUCTION Chapter 1
44
Wolffe, 2000). DNMT1 also interacts with the Rb associated DNA binding protein and
transcriptional activator E2F1. DNMT1 homozygous knockout of embryonic stem cells
lead to only 30% of normal methylation levels and have a tenfold increase in the rate of
mutations and gene rearrangements compared with the wild type strain of this mouse.
Embryonic stem cells deficient in DNMT1 also have high levels of transcription that
may be influential to increased genome instability (Chen et al., 1998). Several cancers
are associated with disruption of DNMT1, E2f1 and Rb DNA binding activity
(Robertson and Wolffe, 2000). Methylation defects observed in tumour cells are
believed to be associated with loss of function of Rb either via direct loss of the Rb gene
or genes associated with Rb which can include improper nuclear localization of Rb with
DNMT1 (Robertson, 2001). Studies have shown that loss of pRb results in increased
DNMT1 expression (McCabe, Davis and Day, 2005). The interaction between Rb,
E2F and DNMT1 is facilitated by the existence of E2F binding sites in the DNMT1
promoter. During cell division Rb is phosphorylated and no longer binds E2F1. This
releases DNMT1 to perform its functions. It has been postulated that loss of Rb may
grant DNMT1 free access to the genome that could potentially lead to de novo
methylation (Robertson, 2001). DNMT1 is required for embryonic development,
imprinting and X-activation and is involved in several biological processes that include
cell cycle control, chromosomal instability and DNA damage and repair (Tan and
Porter, 2009; Brown and Robertson, 2007).
DNMT3A and DNMT3B
DNMT3a and DNMT3b are responsible for de novo methylation and are mainly
responsible for introducing cytosine methylation at previously unmethylated sites.
These enzymes are also required following de novo methylation following embryo
implantation for the de novo methylation of integrated retroviral sequences in mouse
embryonic stem cells (Robertson and Wolffe, 2000; Okano et al., 1999). Increased
levels of DNMT3a has been shown to promote polyposis and may be involved in
several cancers such as HCC. DNMT3a knockout mice survive to birth but die soon
after at about 4 weeks of age (Okano et al., 1999). Zhao et al in 2010 found in
DNMT3a depleted cells suppression of cell proliferation (Zhao et al., 2010). In HCC
INTRODUCTION Chapter 1
45
cell lines with low DNMT3a cellular proliferation is also suppressed (Shafiei et al.,
2008).
DNMT3b knockout mice are not viable and mutant embryos have multiple organ
failure, growth impairment and developmental defects (Li, Bestor and Jaenisch, 1992).
In patients with ICF syndrome mutations in the catalytic domain of DNMT3b results in
immunodeficiency, centromere instability and facial anomalies (Okano et al., 1999;
Gartler et al., 1999). Studies have shown the interaction of dnmt1 with dnmt3b to
inactive gene expression (Robertson and Wolffe, 2000b).
1.14 Viral integration and methylation
DNA methylation is widely seen to function as a host defense mechanism against the
uptake, integration or expression of foreign DNA into chromosomes, to prevent foreign
agents from influencing the transcription of cellular genes (Tao and Robertson, 2003).
This includes incoming virus elements in infected cells. Methylation of the viral
genome usually takes place in LTR to reduce or prevent viral replication. Hence,
methylation can act as a mechanism of suppression of viral expression where the LTR
drives gene expression. It also affects virus latency (Fang et al., 2001; Mikovits et al.,
1990).
Harbers et al in 1981 first showed a relationship between retroviral replication and
DNA methylation of the MLV virus. In this study, viral expression was silenced by the
hypermethylation of sequences in the MLV LTR. Suppression of expression and latency
of HIV-1 and HTLV-1 has also been shown following methylation of virus genomes
(Harbers et al., 1981).
As RV integration is known to favour promoter regions that are composed of CpG
regions and these regions are used for methylation, MLV insertion is often accompanied
by methylation of the virus and shut-down of virus expression. LV appears to favour the
transcription unit rather than the promoter region and is less susceptible to inactivation
of gene expression. (Hacker et al., 2006).
There have been a number of studies that have highlighted the role of viral infection on
stimulating the cellular methylation machinery. Leonard et al (2011) showed an up
regulation of DNMT3a and a down regulation of DNMT3b and DNMT1 following
EBV infection of B cells (Leonard et al., 2011)

INTRODUCTION Chapter 1
46
Fang et al (2001) investigated the relationship of HIV-1 infection and methylation
levels in lymphoid cells. An increase in DNMT1 levels was reported when lymphoid
cells were infected with either HIV-1 wild type or an integrase (IN) mutant (replication
defective) 3 to 5 days post infection. This was accompanied by an overall increase in
genome methylation and de novo methylation of a CpG dinucleotides in gene promoters
resulted in promoter shutdown. Importantly, this was reported following infection by a
defective HIV vector where increased methylation of CpG nucleotides in the promoter
of the p16INK4A
gene occurred. The p16INK4A
is frequently methylated in non-Hodgkin’s
leukaemia (Fang et al., 2001) and this finding suggests that changes in methylation
patterns following HIV infection could lead to disease. Lee et al (2003) also reported
similar methylation patterns in non integrating viruses such as HCV and integration
HBV virus (Lee et al., 2003).
Yamagata et al (2012) investigated the epigenetic effects of transduction of CD34+ cells
by a defective lentiviral vector. This group was the first to show that gene transfer into
somatic and progenitor cells could influence the methylation state of the genome in
vitro by gene therapy vectors. The study cultured CD34+ cells in the presence of
cytokines for 24hours followed by 2 consecutive incubations with LV. The study found
that on exposure to cytokines CD34+ cells had genome wide DNA methylation changes
accompanied by an increase in DNMT1 expression only 24 hours after infection. The
study then went on to show up to 900 host genes to be differentially expressed
following infection compared to just 200 genes in cells cultured in presence of
cytokines only (Yamagata et al., 2012).
Surprisingly, little is still known about the overall effects on the host following
methylation changes influenced by infection by defective LV. It is of paramount
importance, therefore to understand the association between virus integration and host
DNA methylation and to what extent gene expression in the host is altered to avoid
complications when applying these vectors to patients in the clinic.
INTRODUCTION Chapter 1
47
1.15 Methylation and DNA damage
A study by Cuozzo et al (2007) demonstrated DNA methylation to mark homologous
repair (HR) segments and protects cells against DNA damaged up-regulated gene
expression. They found this by inducing a single break in the genome of mouse or
human cells. This was repaired via HR. DSB repair by HR and gene alteration is linked
to methylation changes in the area that DSB occurs and this requires the activity of
DNMT1 (Cuozzo et al., 2007).
Armstrong et al (2012) showed an inverse correlation between hypomethylation and
radiation induced genomic instability. This group found DNMT1 deficient mESCs to
have a 10 fold increase in de novo mutation of the hprt locus (Armstrong et al., 2012).
Thereby, suggesting a role in DNMT1 in hindering efficient function of DNA repair
resulting in this increase rate of mutation.
Several studies have showed a connection between DNA methylation, genomic
instability and DSB and DNA repair. It has also been suggested that DNMT1 is
important in sensing or repairing DNA damage (Palii et al., 2008; Guo, Wang and
Bradley, 2004).
Chen et al (1998), showed DNMT1 deficiency to result in a mutator phenotype by
showing DNMT1 deficient ES mice have a ~10 fold increase in mutation frequency
(Chen et al., 1998). Okano et al (1999) also showed mice lacking in DNMT1 to be
genetically unstable (Okano et al., 1999). Guo et al (2004) used a genetic screen to find
genes involved in mismatch repair (MMR) and found DNMT1 to be one of these genes.
They then found that murine ES cells deficient in DNMT1 exhibited a 4-fold increase in
microsatellite instability (Guo, Wang and Bradley, 2004). Mortusewicz et al (2005)
also found DNMT1 plays a role in regulating genome integrity by inducing DNA
damage using ultraviolet light showing DNMT1 and proliferating cell nuclear antigen
PCNA accumulates at sites of DNA damage (Palii et al., 2008; Mortusewicz et al.,
2005). Palii et al (2008) then confirmed this using immunofluorescence to demonstrate
DNMT1 to be present at H2AX positive foci in cells treated with the DNA methylation
inhibitor, 5-aza-2’-deoxycytidine. They also showed in DNMT1 deficient cells severe
defects in the activation of key DSB responses such as lack of γ-H2AX induction and
reduced phosphorylation of p53 and CHK1 (Palii et al., 2008). Taken together these
studies show a role for DNMT1 in the DNA DSB response pathway.
INTRODUCTION Chapter 1
48
1.16 E2F and DNA damage
E2F is a group of proteins (E2F 1-8). They are transcription factors which have a
heterodimeric complex which contains an E2F component and a DP1/2 subunit, with
the exception of E2F7 and 8. Three of E2Fs act as activators and 6 others as suppressors
of gene expression by acting on specific promoter TTTCCCGC sequences. It is this
dual activity that allows both oncogenic and tumour suppressor activity (Polager et al.,
2002; Dyson, 1998). E2F target genes are involved in cell cycle regulation, cellular
differentiation, DNA synthesis, and DNA damage and repair mechanisms (Frame et al.,
2006; Polager et al., 2002).
E2Fs are specifically regulated by the Rb tumour suppressor protein (pRb). pRb belongs
to the pocket protein family that consist of p107 and p130 (Lee et al., 2002). They
inhibit cell cycle progression by regulating the G1 to S phase of the cell cycle, until the
cell is ready to divide thereby preventing excessive cell growth (DeGregori et al.,
1997). In G0 and early G1, E2F is transcriptionally repressed by complexing with pRb.
Transcription of E2F target genes takes place when pRb is phosphoralated causing the
E2f-Rb complex to disassociate and release E2F (Lee et al., 2002). Chellapan et al in
1991 found that the disassociation of the E2f-Rb complex correlated with an increase in
adenovirus infection, as pRb is targeted by the adenovirus E1A (early region 1 A)
oncoprotein (Chellappan et al., 1991).
Polagar et al (2002) studied the expression of genes involved in DNA replication, repair
and mitosis. They found that E2F1 and E2F3 activity up-regulates the expression of
genes involved in all 3 groups. Their findings also indicate that E2F gene activation
may contribute to the cell response to DNA damage as they found PCNA and BRCA-1
to be controlled by E2F (Polager et al., 2002).
Frame et al (2006) established that the deregulation of Rb/E2F pathways in human
fibroblast cells caused E2F1 mediated apoptosis and that the MRN complex, 53BP1 and
H2AX relocalize into discrete foci following deregulation of E2F1. E2F has also been
shown to play a vital role in maintaining cell cycle and apoptotic cell death in response
to oncogene activation and DNA damage (Frame et al., 2006). DeGregori et al (1997)
found E2F genes rapidly induce apoptosis when E2F is highly expressed (DeGregori et
INTRODUCTION Chapter 1
49
al., 1997). In agreement with this Tsai et al (1998) showed that mutations in E2F caused
suppression in apoptosis (Tsai et al., 1998).
Hence E2F appeares closely linked to DNA damage, is controlled by methylation and
has an important role in cancer development. It may, therefore be suggested that RV
infection that causes DSBs may also be involved in mediating E2F activity. DSB,
methylation and E2F activity may all be considered as contributors of genotoxicity if
stimulated by RV infection and this may occur independent of IM and be synergistic to
IM in early on in oncogenesis.
1.17 Hypothesis
Genotoxicity by RV and LV may be caused by several factors. Apart from IM these
factors also include DNA damage following infection and integration, and epigenetic
effects related to incoming virus particles. These effects may ultimately influence the
control of E2F on its target genes. The hypothesis of this work is that DNA damage
mediated by RV may lead to epigenetic changes in the form of methylation of genes in
the host and changes in E2F target gene expression.
1.17.1 Aims and Objectives
Mouse tumours will be examined for genetic changes in the form of gene
amplifications and deletions
An in vitro model cell line will be used to investigate the DDR to infection by
retrovirus and lentivirus vectors
Epigenetic changes will be measured in vitro following infection
The relationship between DDR and methylation will be investigated using cells
mutated at 53BP1, a gene important to the DDR pathway
Gene expression pathways will be investigated for DNA damage and repair
pathways and genes known to be controlled by the E2F transcription factors
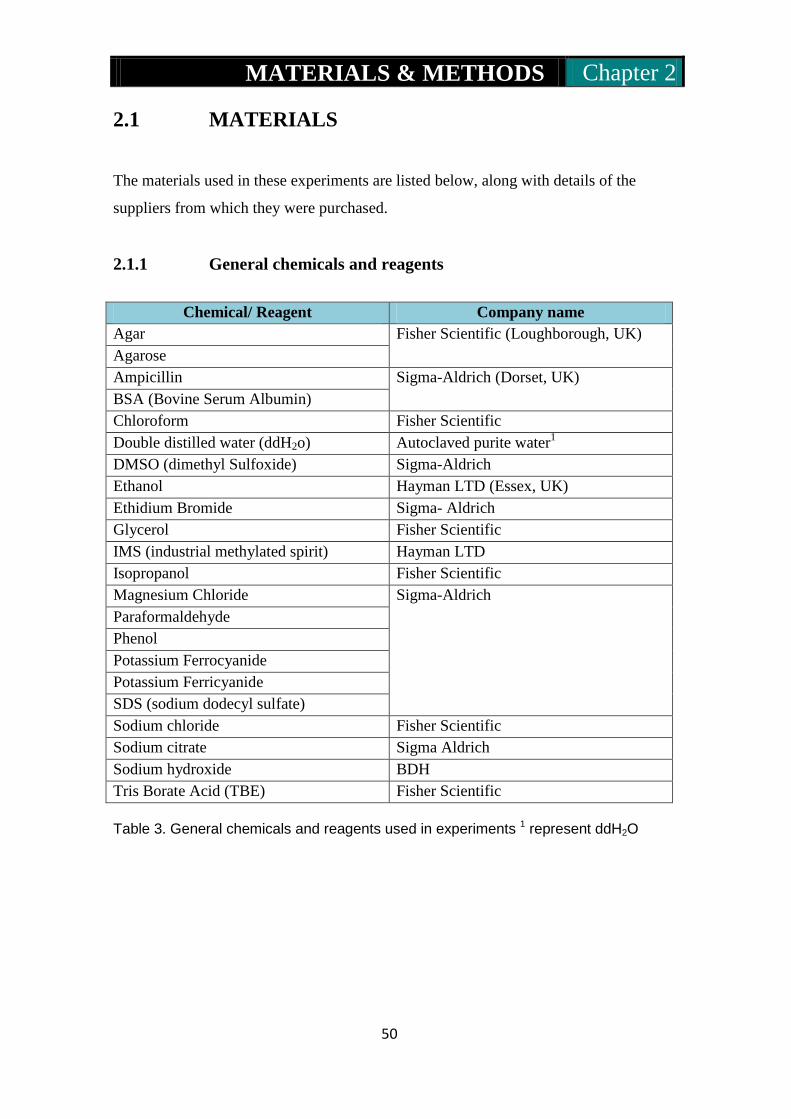
MATERIALS & METHODS Chapter 2
50
2.1 MATERIALS
The materials used in these experiments are listed below, along with details of the
suppliers from which they were purchased.
2.1.1 General chemicals and reagents
Chemical/ Reagent Company name
Agar Fisher Scientific (Loughborough, UK)
Agarose
Ampicillin Sigma-Aldrich (Dorset, UK)
BSA (Bovine Serum Albumin)
Chloroform Fisher Scientific
Double distilled water (ddH2o) Autoclaved purite water1
DMSO (dimethyl Sulfoxide) Sigma-Aldrich
Ethanol Hayman LTD (Essex, UK)
Ethidium Bromide Sigma- Aldrich
Glycerol Fisher Scientific
IMS (industrial methylated spirit) Hayman LTD
Isopropanol Fisher Scientific
Magnesium Chloride Sigma-Aldrich
Paraformaldehyde
Phenol
Potassium Ferrocyanide
Potassium Ferricyanide
SDS (sodium dodecyl sulfate)
Sodium chloride Fisher Scientific
Sodium citrate Sigma Aldrich
Sodium hydroxide BDH
Tris Borate Acid (TBE) Fisher Scientific
Table 3. General chemicals and reagents used in experiments 1 represent ddH2O

MATERIALS & METHODS Chapter 2
51
2.1.2 Tissue culture reagents
Chemical/ Reagent Company name
DMEM (Dulbecco’s modified Eagle’s
medium) containing GlutaMax,
1000mg/L and sodium pyruvate
Fisher Scientific
Pen/Strep (penicillin/streptomycin)
Fetal Bovine Serum
DMEM-F12
Hydrocortisone
Insulin
Penicillin/streptomycin/glutamine
Epidermal growth factor Sigma- Aldrich
10X Trypsin-EDTA (containing 0.5%
trypsin in 5.3mM EDTA)
Fisher Scientific
DMSO (dimethyl sulfoxide) Sigma-Aldrich
1X PBS (Phosphate Buffered Saline)
Trypan Blue Invitrogen
Virkon disinfectant Fisher Scientific
Table 4. General reagents used for tissue culture
2.1.3 X-gal reagents
Chemical/ Reagent Company name
1X PBS Sigma- Aldrich
4% Paraformaldehyde
Potassium Ferrocyanide
Potassium Ferricyanide
Magnesium Chloride
X-gal (5-bromo-4-chloro-3-indoyl b-d-galactopyranoside) Fisher Scientific
Table 5. General chemicals and reagents used in x-gal staining procedure
2.1.4 Cell viability reagents
Chemical/ Reagent Company name
Countess® Cell Counting Chamber Slides Invitrogen
Trypan blue stain (0.4%)
1X PBS (Phosphate Buffered Saline) Sigma-Aldrich
Table 6. General chemicals and reagents used in cell viability assays
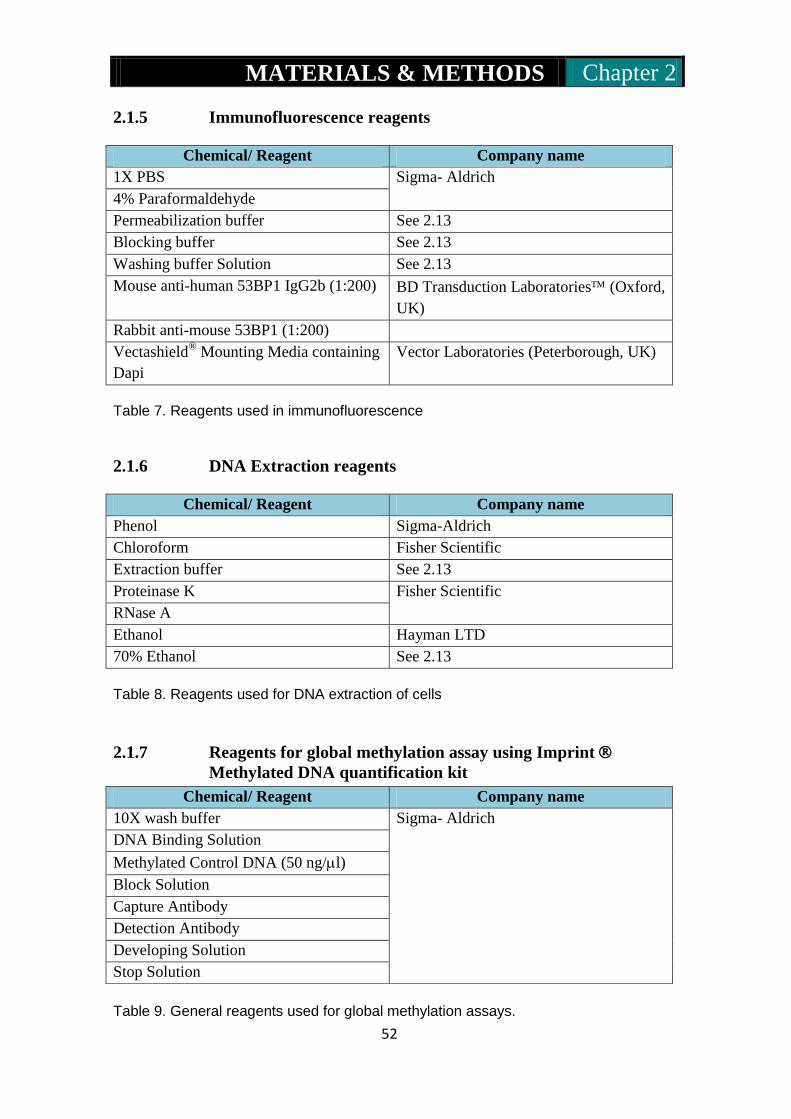
MATERIALS & METHODS Chapter 2
52
2.1.5 Immunofluorescence reagents
Chemical/ Reagent Company name
1X PBS Sigma- Aldrich
4% Paraformaldehyde
Permeabilization buffer See 2.13
Blocking buffer See 2.13
Washing buffer Solution See 2.13
Mouse anti-human 53BP1 IgG2b (1:200) BD Transduction Laboratories (Oxford,
UK)
Rabbit anti-mouse 53BP1 (1:200)
Vectashield® Mounting Media containing
Dapi
Vector Laboratories (Peterborough, UK)
Table 7. Reagents used in immunofluorescence
2.1.6 DNA Extraction reagents
Chemical/ Reagent Company name
Phenol Sigma-Aldrich
Chloroform Fisher Scientific
Extraction buffer See 2.13
Proteinase K Fisher Scientific
RNase A
Ethanol Hayman LTD
70% Ethanol See 2.13
Table 8. Reagents used for DNA extraction of cells
2.1.7 Reagents for global methylation assay using Imprint
Methylated DNA quantification kit
Table 9. General reagents used for global methylation assays.
Chemical/ Reagent Company name
10X wash buffer Sigma- Aldrich
DNA Binding Solution
Methylated Control DNA (50 ng/l)
Block Solution
Capture Antibody
Detection Antibody
Developing Solution
Stop Solution

MATERIALS & METHODS Chapter 2
53
2.1.8 Pre designed and custom made TaqMan probes for gene
expression analysis- Applied Biosystems
Gene Name Assay ID Exons amplified Amplificon
product size
18sRNA 4310893E n/a 187
Dnmt1 Mm00599763_m1 1-2 68
Dnmt3a Mm00432870_m1 6-7 75
Dnmt3b Mm00599800_m1 1-2 61
Table 10. TaqMan gene expression assays used to quantify DNA methyltransferase activity
2.1.9 RNA extraction reagents
Chemical/ Reagent Company name
RNA extraction
TRIzol reagent Invitrogen
Chloroform Fisher Scientific
2-propan-1-ol (isopropanol) Sigma-Aldrich
75% ice cold ethanol See 2.13
Nuclease free ddH2O Qiagen (West Sussex, UK)
DNase I Treatment
10X reaction buffer Sigma- Aldrich
Amplification Grade DNase I (1,0000
units)
Stop solution
RNA purification
-ME (2-Mercaptoethanol) Agilent technologies, Stratagene
Lysis solution
1 x low salt wash solution
Elution buffer
Table 11. Reagents used for isolation of total RNA from cell lines, DNase I treatments and RNA purification
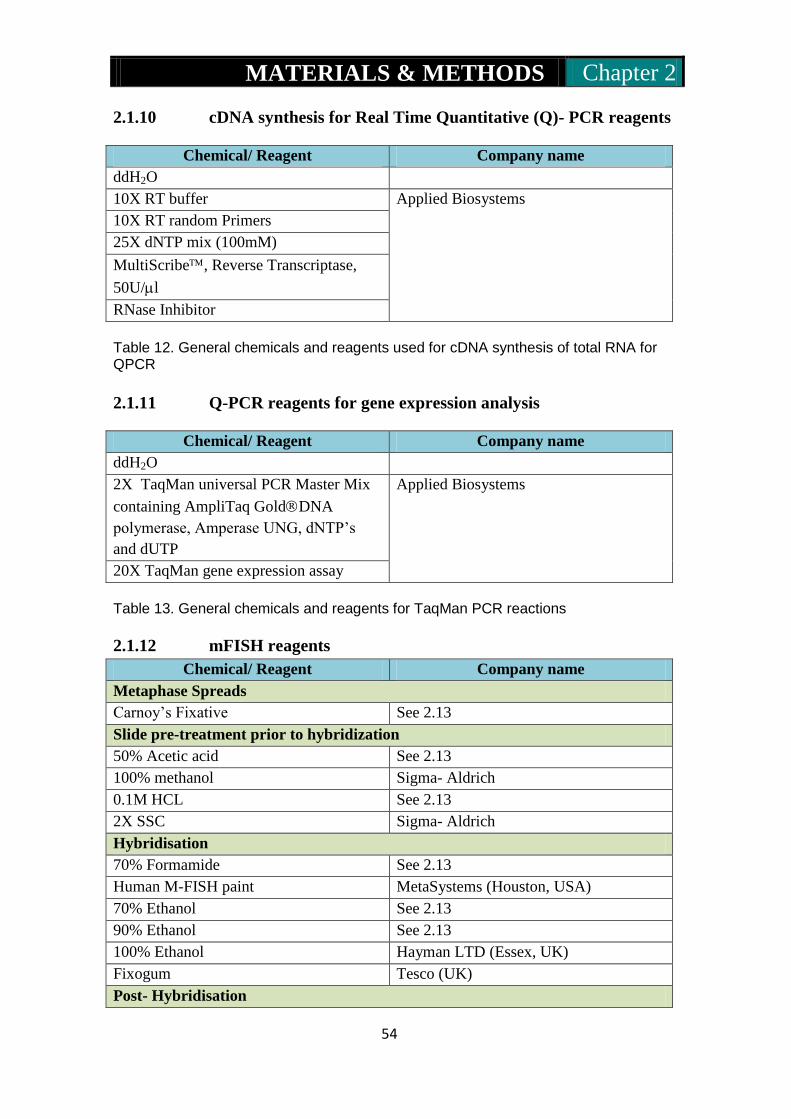
MATERIALS & METHODS Chapter 2
54
2.1.10 cDNA synthesis for Real Time Quantitative (Q)- PCR reagents
Chemical/ Reagent Company name
ddH2O
10X RT buffer Applied Biosystems
10X RT random Primers
25X dNTP mix (100mM)
MultiScribe, Reverse Transcriptase,
50U/l
RNase Inhibitor
Table 12. General chemicals and reagents used for cDNA synthesis of total RNA for QPCR
2.1.11 Q-PCR reagents for gene expression analysis
Chemical/ Reagent Company name
ddH2O
2X TaqMan universal PCR Master Mix
containing AmpliTaq GoldDNA
polymerase, Amperase UNG, dNTP’s
and dUTP
Applied Biosystems
20X TaqMan gene expression assay
Table 13. General chemicals and reagents for TaqMan PCR reactions
2.1.12 mFISH reagents
Chemical/ Reagent Company name
Metaphase Spreads
Carnoy’s Fixative See 2.13
Slide pre-treatment prior to hybridization
50% Acetic acid See 2.13
100% methanol Sigma- Aldrich
0.1M HCL See 2.13
2X SSC Sigma- Aldrich
Hybridisation
70% Formamide See 2.13
Human M-FISH paint MetaSystems (Houston, USA)
70% Ethanol See 2.13
90% Ethanol See 2.13
100% Ethanol Hayman LTD (Essex, UK)
Fixogum Tesco (UK)
Post- Hybridisation
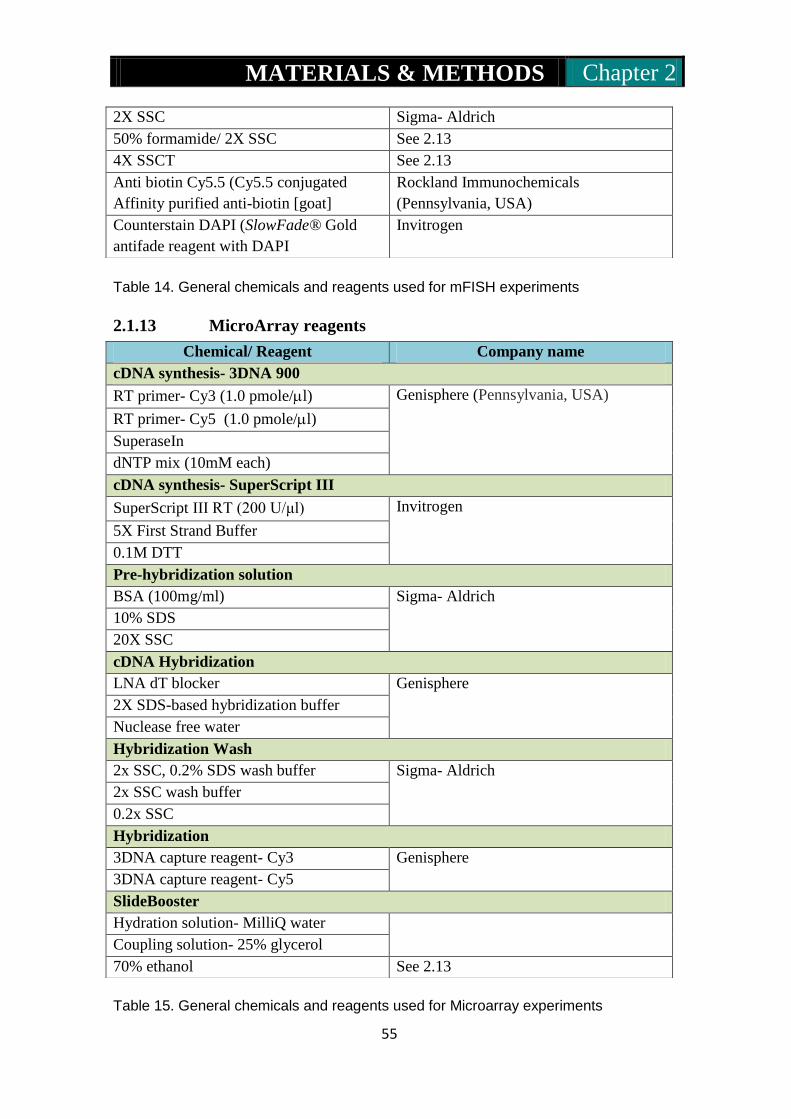
MATERIALS & METHODS Chapter 2
55
Table 14. General chemicals and reagents used for mFISH experiments
2.1.13 MicroArray reagents
Table 15. General chemicals and reagents used for Microarray experiments
2X SSC Sigma- Aldrich
50% formamide/ 2X SSC See 2.13
4X SSCT See 2.13
Anti biotin Cy5.5 (Cy5.5 conjugated
Affinity purified anti-biotin [goat]
Rockland Immunochemicals
(Pennsylvania, USA)
Counterstain DAPI (SlowFade® Gold
antifade reagent with DAPI
Invitrogen
Chemical/ Reagent Company name
cDNA synthesis- 3DNA 900
RT primer- Cy3 (1.0 pmole/l) Genisphere (Pennsylvania, USA)
RT primer- Cy5 (1.0 pmole/l)
SuperaseIn
dNTP mix (10mM each)
cDNA synthesis- SuperScript III
SuperScript III RT (200 U/μl) Invitrogen
5X First Strand Buffer
0.1M DTT
Pre-hybridization solution
BSA (100mg/ml) Sigma- Aldrich
10% SDS
20X SSC
cDNA Hybridization
LNA dT blocker Genisphere
2X SDS-based hybridization buffer
Nuclease free water
Hybridization Wash
2x SSC, 0.2% SDS wash buffer Sigma- Aldrich
2x SSC wash buffer
0.2x SSC
Hybridization
3DNA capture reagent- Cy3 Genisphere
3DNA capture reagent- Cy5
SlideBooster
Hydration solution- MilliQ water
Coupling solution- 25% glycerol
70% ethanol See 2.13
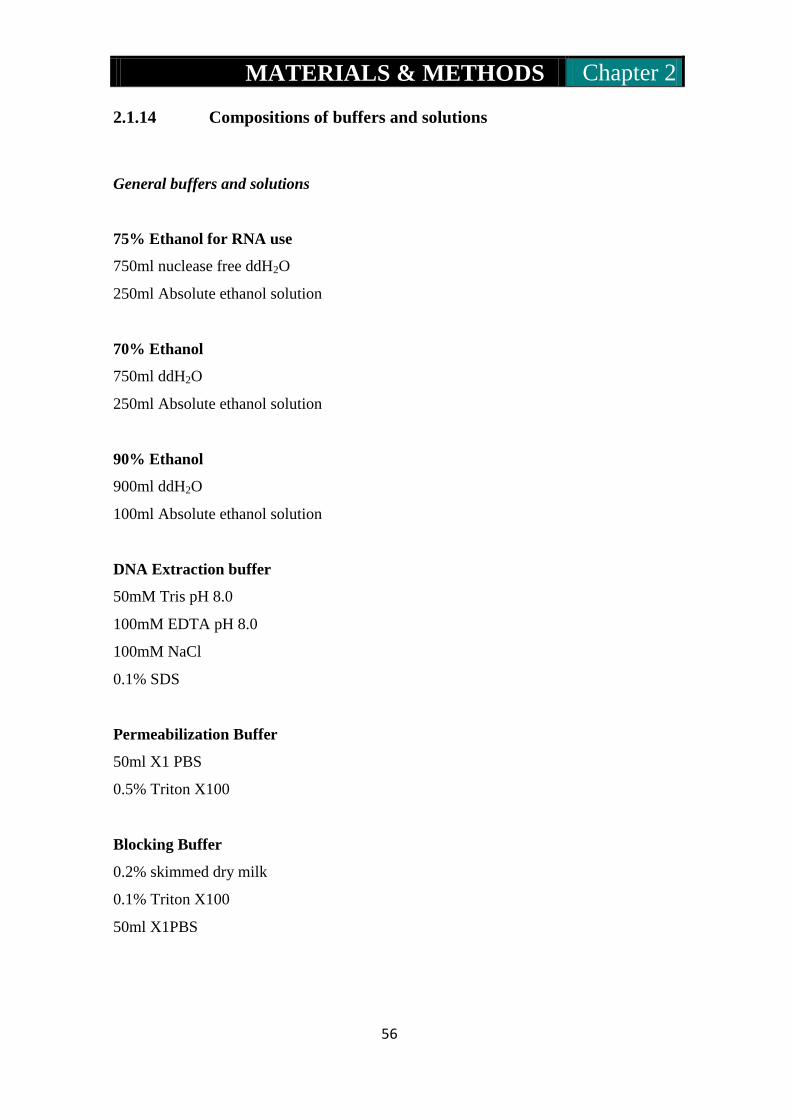
MATERIALS & METHODS Chapter 2
56
2.1.14 Compositions of buffers and solutions
General buffers and solutions
75% Ethanol for RNA use
750ml nuclease free ddH2O
250ml Absolute ethanol solution
70% Ethanol
750ml ddH2O
250ml Absolute ethanol solution
90% Ethanol
900ml ddH2O
100ml Absolute ethanol solution
DNA Extraction buffer
50mM Tris pH 8.0
100mM EDTA pH 8.0
100mM NaCl
0.1% SDS
Permeabilization Buffer
50ml X1 PBS
0.5% Triton X100
Blocking Buffer
0.2% skimmed dry milk
0.1% Triton X100
50ml X1PBS

MATERIALS & METHODS Chapter 2
57
Washing Buffer Solution
0.1% Triton X100
50ml X1 PBS
5X TBE (tris-borate EDTA) buffer
500ml ddH2O
27g Tris base
137.5g boric acid
10ml 0.5M EDTA pH 8.0
1X TBE
700ml ddH2O
300ml of 5X TBS solution
X-Gal staining solution
PBS containing :
4mM K3FE (CN) 6
4mM K4FE (CN) 6
0.1mM MgCl2
0.4mg/ml X-Gal (from 40mg/ml stock dissolved in DMSO) Make up fresh immediately
before use, protect from light before and during staining. If solution is to be used to
stain cells in tissue culture plates it should be filtered through a 0.22m pore size filter
unit before use to eliminate any un dissolved crystals that would hamper subsequent
microscopic inspection.
Paraformaldehyde Solution
4% (w/v) paraformaldehyde in PBS.
Stir under gentle heat to dissolve, store frozen in 20ml aliquots.
Carnoy’s Fixative
3:1methanol/ glacial acetic acid
50% Acetic acid
50ml acetic acid in 50ml ddH2O
MATERIALS & METHODS Chapter 2
58
4X SSCT
80µl Tween 20 in 400ml of 4XSSC
0.01 HCL
50µl 38% HCL, concentrated grade
50ml HPLC water containing 500µl of 1% pepsin.
70% Formamide
30% 2X SSC
2.1.15 Cell Lines
The cell lines utilized in these experiments are listed below.
HepG2
HepG2 cells are a human hepatocellular carcinoma cell line used for mammalian tissue
culture. These cells were kindly provided by Dr Amanda Harvey (Brunel University,
Uxbridge, UK)
HepG2 cells have been isolated from human liver cancer patients. These cells are
frequently used in genotoxicity studies and identification of reactive components.
(Knasmuller et al, 2004)
Mcf10a
Mcf10a cells are an immortalized non transformed human mammary epithelial cell line.
These cells were kindly provided by Dr Amanda Harvey (Brunel University, Uxbridge,
UK)
Mcf10a cells were derived from the breast tissue of a 36 year old patient with
fibrocystic changes. It exhibits numerous features of normal breast epithelium,
including lack of tumorigenicity in nude mice, lack of anchorage-independent growth
and is dependable on growth factors and hormones for proliferation and growth. It is
also one step away from being metastic (Yang et al., 2006).
MATERIALS & METHODS Chapter 2
59
MRC5-SV1
Is a SV40 immortalized lung fibroblast which when undergone DNA damage, repairs
normally (Arlett et al., 1988).
These cells were kindly provided by Dr Christopher Parris (Brunel University,
Uxbridge, UK)
AT5BIVA
AT5BIVA is an SV40 immortalized classic ataxia telangiectasia fibroblast cell line and
are derived from an ataxia telangiectasia patient. It is DNA DSB repair deficient and is
deficient in the ATM gene at the cell cycle check point (Murnane et al., 1985).
These cells were kindly provided by Dr Christopher Parris (Brunel University,
Uxbridge, UK)
XP14BRneo17
Is an SV40 immortalized fibroblast cell line, derived from a human subject defect in the
NHEJ pathway particularly deficient in DNA PKcs (Abbaszadeh et al., 2010).
These cells were kindly provided by Dr Christopher Parris (Brunel University,
Uxbridge, UK)
53BP1 -/-
Is a 53BP1 deficient mouse embryonic fibroblast (MEF) cell line (Shibata et al, 2010).
These cells were kindly provided by Professor Penny Jeggo (University of Sussex,
Brighton, UK)
TELCeB/ AF-7
TELCeB/ AF-7 cells contain pCeB (gag/pol), pAF7 (amphotropic envelope) and the
pMfGns Laz-Z backbone (Cossett et al., 1995). For the purpose of this study this virus
producing cell line was called MLV.
PA317
Pa317 cells were derived from NIH 3T3 TK- cells by co-transfection of the defective
viral DNA. DNA construct consist of the promoter, gag, pol and env sequences of a
helper virus useful for making retrovirus packaging cell line that do not transfer the
MATERIALS & METHODS Chapter 2
60
packaging function (Miller and Rosman, 1989). For the purpose of this study these cells
were called, Empty vector.
These cells were kindly provided by Dr Michael Themis (Brunel University, Uxbridge,
UK)
2.1.16 Viral vectors
The Smart2Z (EIAV), HR’SIN-CPPT-S-FX-W (HIV), HR’SIN-CPPT-S-FX-W (HIV
containing defective integrase) and pLIONhAAThFIX FIV (FIV) vectors used in this
study were originally provided by Dr Themis. These vectors were used to infect cell
lines.
MATERIALS & METHODS Chapter 2
61
2.2 METHODS
2.2.1 Mammalian cell culture methods
All cell culture protocols were performed under a laminar class II cell culture hood
(Heraeus).
HepG2, TELCeB/ AF-7, PA317, MRC-5 SV1, AT5BIVA, XP14BRneo17 and 53BP -/-
cells were maintained in the same growth medium: DMEM containing 15% FBS,
supplemented with 1% penicillin/streptomycin.
Mcf01a cells were cultured in DMEM-F12 containing 10% FBS, 1%
penicillin/streptomycin/ glutamine, 0.5µg/ml hydrocortisone, 20ng/ml epidermal growth
factor and 5µg/ml insulin.
2.2.1.1 Growth and Maintenance
Cells were grown as a monolayer in sterile tissue culture flasks or cell culture dishes in
a CO2 incubator (Sanyo) maintained at 37ºC, in a humidified, 5% CO2 atmosphere.
Once the cells had reached 70% confluence, growth medium was aspirated and the
monolayer washed once with 1 x PBS warmed to 37 ºC. Cells were detached from the
culture dish using 1 x Trypsin- EDTA. The cell culture dishes were then incubated at
37ºC for no more than 5 minutes. Trypsin activity was neutralized by the addition of
>5 volumes of growth medium, and the cells were gently mixed by pipetting up and
down. The neutralised cell suspension was centrifuged at 1000rpm for 5 minutes. The
clear supernatant formed was discarded. The pellet was re-suspended in 1ml of fresh
growth medium and mixed by pipetting up and down until a homogenous single cell
suspension was achieved. An aliquot of this was transferred to a cell culture dish
containing fresh growth medium and cell culture dishes were placed in the incubator
Cells were passaged 2 or 3 times per week at a ratio of 1:3 – 1:8 depending on the
growth characteristics of each individual cell line.

MATERIALS & METHODS Chapter 2
62
2.2.1.2 Long term storage of cells in liquid nitrogen
Cells were frozen in liquid nitrogen (-196ºC) for long term storage. Cell pellet achieved
from centrifugation after passaging were re-suspended in freezing medium containing
DMEM including 20% FBS and 10% DMSO. 1ml aliquots were transferred to labelled
cryotubes, packed in insulated boxes then frozen slowly at -80ºC for 24 hours. After this
time the vials were transferred to a liquid nitrogen dewar.
2.2.1.3 Seeding cells into cell culture dishes
Cells were trypsinised and re suspended in a small volume of growth medium as
described for passaging, then counted using a haemocytometer to determine the cell
density. The suspension was adjusted to 1.5 x 10⁵
cells/ml before being added to cell
culture dishes at a total volume of 10ml/ dish (i.e. 2ml /well for a 6 well plate, 1ml/ well
for a 12 well plate, etc.). Dishes were then replaced at 37ºC until the cells had re-
adhered. At this seeding density the cells could be infected the next day.
2.2.1.4 Infection of cells with viral vectors
Cells were plated as described above and left at 37ºC to reattach. Growth medium was
aspirated from the cells and replaced with the medium containing the diluted virus. Un-
concentrated vector preparations were often applied to the cells without dilution. Plates
were replaced at 37ºC for infection to proceed, and in most cases were analysed for
gene expression after 6, 24 and 72 hours.
2.2.2 X-Gal Staining - Percentage of infectibility
Cell lines to be stained with x-gal solution were washed with X1 PBS three times, fixed
in 4% paraformaldehyde for 8 minutes at room temperature, then washed in x1 PBS
three times to remove all traces of paraformaldehyde. Fresh X-gal staining solution was
prepared and enough was added to each sample to completely cover the cell monolayer.
The samples were wrapped in aluminium foil to exclude light, then left to stain at room
temperature for up to 24 hours. The x-gal compound is a chromogenic substrate of -
MATERIALS & METHODS Chapter 2
63
galactosidase, and hydrolysis of the 1-4 bond between galactose and the 5-bromo-4-
chloro-3-indolyl parts of the molecule results in the production of an insoluble blue
precipitate. The distribution of any - galactosidase enzyme within the sample is
therefore revealed by the appearance of blue pigment. After staining samples were
washed with X1 PBS and stored in X1 PBS.
In samples with high levels of -gal expression, blue colorations could be seen with the
naked eye after as little as 30 minutes in staining solution. For the majority of samples,
however, inspection under magnification was required. Stained samples were viewed
under the Olympus inverted light microscope.
2.2.2.1 Image capture and processing
Samples of interest were photographed using a canon digital camera attached to the
Olympus microscope. The numbers of blue cells in each well counted were recorded
using a tally counter and all wells from each infection were averaged.
2.2.3 Cell viability asssay
The dye exclusion test is used to determine the number of viable cells present in a cell
suspension.
An aliquot of cell suspension being tested for viability was centrifuged for 5 minutes at
1000rpm and its supernatant discarded. The pellet was then re-suspended in 50l- 1ml
of PBS. 10l of this cell suspension was added into a sterile epindorph tube with 10l
of 0.4% trypan blue. This mixture was allowed to incubate for 5 minutes at room
temperature. 20l of this mixture was then pipetted into one of the chambers of the
Countess slides. The slide was then inserted into the Countess Automated cell
counter and focused. Unstained (viable) and stained (nonviable) cells were counted
separately in the Countess Automated cell counter and a percentage of viable cells
were produced.
Cell Viability assays were carried out 24 hours after infection and every day for the next
5 days.

MATERIALS & METHODS Chapter 2
64
2.2.4 Immunofluorescence
Cell monolayers were grown on 15mm coverslips in 35mm culture dishes. At 70-75%
confluency cell monolayers were washed with cold PBS twice. Cells were fixed with
4% paraformaldehyde for 8 minutes at room temperature in order to retain the shape
and location of all cellular proteins. After the cell monolayer was washed in 1x PBS
three times, 2ml permeabilization buffer was added to each dish to permeabilize the
cells and incubated for 5 minutes at room temperature.2 ml of blocking buffer was then
added to each dish and left to incubate for 1 hour at room temperature. After this time
the coverslips were transferred from the dishes to humidity chamber via sterile tweezers
and placed on damp sterile tissue paper. A dilution of primary antibody in blocking
buffer was added to the coverslips. The primary antibody was a mouse anti-human
53BP1 IgG2b and was used at a 1/200 dilution. Coverslips were incubated at room
temperature for 1 hour. The secondary antibody was a preparation of rabbit anti-mouse
53BP1, diluted 1/200 in blocking buffer. Coverslips were incubated at room
temperature for 1 hour in the dark. All steps after this were done in the dark. The
secondary antibody was washed off to remove unbound reagents and background. This
was done by dipping the coverslips in 3 beakers containing washing buffer solution.
Vector shied containing dapi was placed on sterile slides. Each coverslip was then
mounted on the slide and sealed with clear nail polish. Slides were then inspected using
a Zeiss microscope and photographed using the Metapher softwares: Msearch and
AutoCapt.
2.2.4.1 Immunofluorescence image analysis
Nuclei images were imported into and analysed by the Definiens software in
collaboration with Dr Martin Spitaler of Imperial College, London.
2.2.5 DNA extraction from cultured cells
All surfaces and equipment were wiped down with 2% trigene and 70% ethanol. From a
cell culture dish, standard trypsinization protocol was performed and the cells were
pelleted by centrifugation in a 15ml tube. The supernatant was decanted and the pellet

MATERIALS & METHODS Chapter 2
65
resuspended in 0.5-1 ml of extraction buffer until a thick gloopy solution was generated.
The reaction mixture was transferred into a sterile epindorph tube using a pipette,
20g/ml RNAase was added and the reaction mixture was incubated at 37C for an
hour. Proteinase K at a concentration of 100g/ml was added to the reaction tubes and
incubated at 55C for two hours. An equal amount of (0.5-1 ml) of phenol was then
added to the reaction mixture and mixed gently by inverting the tube sideways until a
white solution was formed. The reaction mixture was spun in a centrifuge at 13,000 g
for 20 minutes at 4C. The reaction mixture yielded 2 phases separating DNA between
the phenol- protein solution. The top layer was DNA in aqueous solution. The aqueous
DNA solution was transferred to a sterile centrifuge tube and an equal volume of
chloroform was added. The solution was the mixed carefully by inversion. The reaction
mixture was spun down at 13,000 g for 20 minutes at 4C. The supernatant was
removed and transferred to a sterile centrifuge tube. 1.5 ml of ice cold 100% ethanol
was added to wash the reaction mixture and the tube gently mixed by tilting until a clear
solution with DNA precipitate was formed. The solution containing DNA precipitate
was spun down to form a pellet. The ethanol solution was poured off by tilting the tube
in the opposite direction of the DNA pellet. The DNA pellets were washed in 70%
ethanol twice to remove excess salt. The tubes were air dried in a sterile hood and the
pellets re-suspended in 300l of double distilled water. The reactions mixtures were left
to dissolve at 4°C overnight.
2.2.6 Quantification of nucleic acids
Nucleic acids (dsDNA, cDNA and RNA) were quantified and absorbance values
measured at several wavelengths (260, 280 and 260:280) using the Nanodrop
spectrophotometer. The 260 absorbance reading was used to determine the
concentration of nucleic acids present in uninfected, normal and infected cell line
samples. The 280 absorbance reading was used to detect protein contamination in the
samples. ddH20/TE nucleic acids buffer was used as a reference sample. 1.5μl of this
reference sample was applied to the Nanadrop using a sterile pipette and this was used
to read a zero absorbance for the ‘blank’. 1.5μl of DNA, plasmid DNA, cDNA and
RNA samples were then measured using the Nanadrop. For pure DNA and RNA
samples the 260/280 ratio given were approximately 1.8 and 2.0 respectively.
MATERIALS & METHODS Chapter 2
66
2.2.7 Agarose gel electrophoresis
Electrophoresis allows the detection and separation of macromolecules (DNA and
RNA) based on their size. This was performed through 1 or 2% agarose gels
supplemented with 0.5g/ml ethidium bromide using a casting tray with well-forming
combs depending on sample number. Each sample DNA was mixed with 6 x Loading
buffer and run alongside a 1Kb DNA ladder containing marker fragments of known
size. A constant voltage of 50V was applied to move the DNA or RNA fragment
through the gel. The electric field causes the negatively charge DNA or RNA molecules
to migrate from negative to positive poles, whilst the ethidium bromide intercalates
within DNA or RNA molecules allowing the visualization of the restriction digest
sample. DNA or RNA fragments were visualized using ultraviolet illumination of the
gel. Gel images were captured using the BIO RAD Chemi Doc TM
XRS.
2.2.8 Global methylation assay using Imprint Methylated DNA
Quantification Kit
DNA samples which were extracted from lentiviral and retroviral infected cells were
quantified using the Nanodrop spectrophotometer. DNA samples were then diluted
using DNA binding solution to achieve a concentration of 50ng in 30μl. Standard
control samples consisted of a negative blank and a positive DNA sample (uninfected
and standard methylated DNA samples). The negative controls and methylated DNA
were also diluted in DNA binding solution. All dilutions were mixed by brief
centrifugation at 12,000 x g and 30μl of each sample was added to an ELISA plate. To
ensure that each well was coated the plate was gently tilted from side to side. The plate
was covered with optical adhesive film and incubated at 37°C for 1hr. 10x wash buffer
was thawed on ice. Following incubation 150μl of blocking buffer solution was added
directly to each well to coat samples and reduce non-specific DNA binding. The plate
wells were covered and incubated at 37°C for 30 minutes. The reaction mixtures were
removed from each well by inverting plate. Each well was washed by adding 150μl of
1x wash buffer followed by inversion of the plate to remove the contents. This step was
repeated 3 times. Methylated DNA capture involved the use of a capture antibody
specific to methylated CpG dinucleotides. A 1X wash buffer was prepared in a sterile

MATERIALS & METHODS Chapter 2
67
bottle using 11ml of 10x wash buffer and 99ml of ddH2O. Capture antibody was diluted
in a 1:1000 ratio using 1x wash buffer. 50μL of diluted Capture antibody was then
added to each well. The plate was then covered and incubated at room temperature for
1hr. The capture antibody was removed from each well by inverting the plate. Each well
was washed 4 times with 150μl of 1x wash buffer. The detection antibody was diluted
to a 1 in 1000 ratio using 1x wash buffer. 50μl of diluted detection antibody was added
to each well. The plate was covered and incubated at room temperature for 30 minutes.
The detection antibody was removed from each well and the reaction wells were
washed 5 times with 150μl of 1x wash buffer. For the detection of methylated DNA
100μl of developing solution was added to each well. The plate was covered and
incubated at room temperature away from light for 1-10 minutes. The reaction mixtures
were monitored for colour change to ensure the formation of a blue solution. 50μl of
stop solution was added to each well which yielded a yellow solution. The absorbance
values correspond to the level of CpG methylation. Absorbance (Abs) values were
measured at 450nm on a plate reader (Biotex Instruments). To calculate the relative
methylation levels for each DNA sample. Firstly replicate absorbance values for all
DNA and blank samples were averaged. The average blank value was then subtracted
from the average absorbance values for each DNA sample to give value A. Next the
average blank value was subtracted from the average absorbance value taken from the
positive control sample to give value B. Value A was divided by value B and multiplied
by 100. This calculated percentage value represents a global methylation level that is a
percentage of the positive control DNA sample.
Calculation for global methylation: (Abs 450 sample - Abs 450 Blank) x100
(Abs 450 Methylation Control DNA - Abs 450 Blank)
2.2.9 RNA extraction from cultured cells
Cell monolayers at 90-95% confluency were washed with 10ml PBS twice. 2-3ml trizol
reagent was added and left for 2 minutes at room temperature. Lysate was retropipetted
and placed in a sterile 15ml tube. The homogenized sample was then incubated at room
temperature for 5 minutes. 200l of chloroform per 1ml trizol reagent was added and
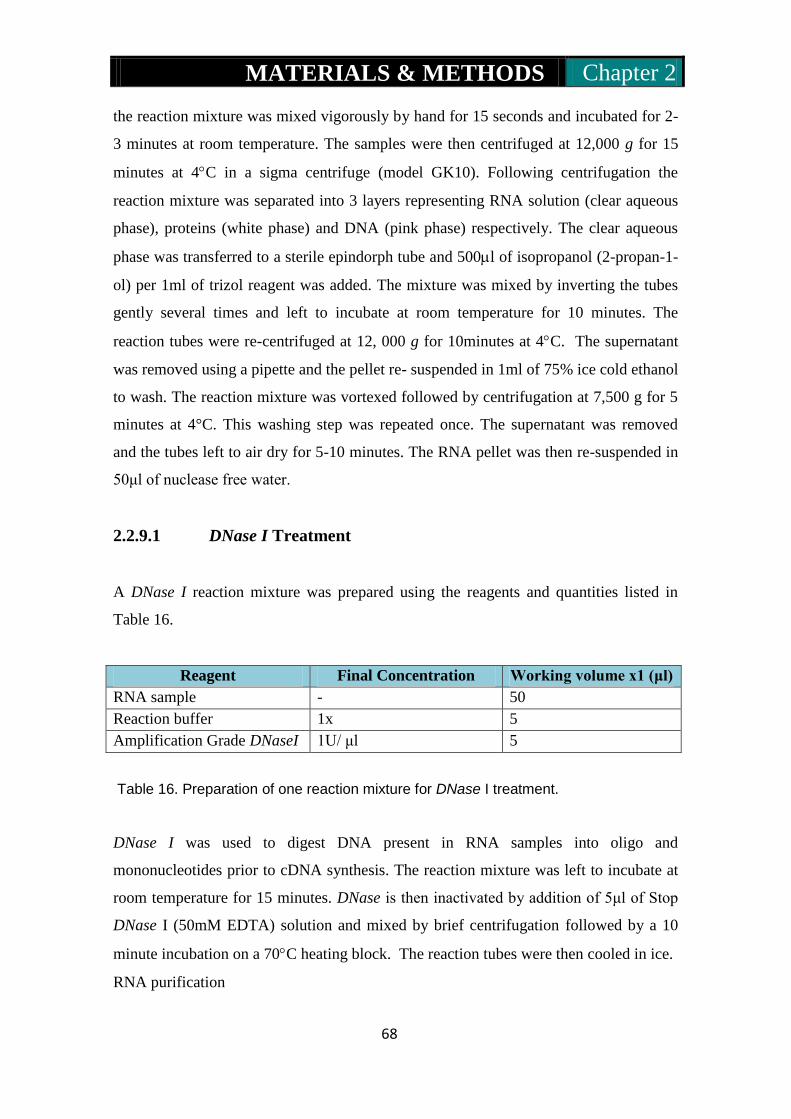
MATERIALS & METHODS Chapter 2
68
the reaction mixture was mixed vigorously by hand for 15 seconds and incubated for 2-
3 minutes at room temperature. The samples were then centrifuged at 12,000 g for 15
minutes at 4C in a sigma centrifuge (model GK10). Following centrifugation the
reaction mixture was separated into 3 layers representing RNA solution (clear aqueous
phase), proteins (white phase) and DNA (pink phase) respectively. The clear aqueous
phase was transferred to a sterile epindorph tube and 500l of isopropanol (2-propan-1-
ol) per 1ml of trizol reagent was added. The mixture was mixed by inverting the tubes
gently several times and left to incubate at room temperature for 10 minutes. The
reaction tubes were re-centrifuged at 12, 000 g for 10minutes at 4C. The supernatant
was removed using a pipette and the pellet re- suspended in 1ml of 75% ice cold ethanol
to wash. The reaction mixture was vortexed followed by centrifugation at 7,500 g for 5
minutes at 4°C. This washing step was repeated once. The supernatant was removed
and the tubes left to air dry for 5-10 minutes. The RNA pellet was then re-suspended in
50μl of nuclease free water.
2.2.9.1 DNase I Treatment
A DNase I reaction mixture was prepared using the reagents and quantities listed in
Table 16.
Reagent Final Concentration Working volume x1 (μl)
RNA sample - 50
Reaction buffer 1x 5
Amplification Grade DNaseI 1U/ μl 5
Table 16. Preparation of one reaction mixture for DNase I treatment.
DNase I was used to digest DNA present in RNA samples into oligo and
mononucleotides prior to cDNA synthesis. The reaction mixture was left to incubate at
room temperature for 15 minutes. DNase is then inactivated by addition of 5μl of Stop
DNase I (50mM EDTA) solution and mixed by brief centrifugation followed by a 10
minute incubation on a 70C heating block. The reaction tubes were then cooled in ice.
RNA purification

MATERIALS & METHODS Chapter 2
69
Total RNA samples were extracted and RNA was purified using the Absolute Total
RNA & mRNA Purification Kit (Agilent technologies, Stratagene Cat # 400806).
1.75μl of β-ME was added to total RNA samples. 250μl of lysis buffer and 250μl of
70% ethanol was added to each reaction mixture and mixed by centrifugation 12,000 x
g. The reaction mixture was transferred to an RNA binding spin cup and seated in a 2ml
receptacle tube. The reaction mixture was mixed by centrifugation for 1 min. The flow
through was discarded and 500μl of 1x low salt wash buffer added to the spin cup. The
tube was re-centrifuged for 1 min and the flow through discarded. The addition of wash
buffer followed by centrifugation and removal of flow through was repeated once with
500μl and again 300μl of wash buffer. The reaction mixture was re-centrifuged for 2
minutes. The spin cup was transferred to a sterile 1.5ml micro-centrifuge tube and 50μl
of elution buffer added. The reaction mixture was incubated at room temperature for 2
min then re- centrifuged. The elution, incubation and centrifugation step was repeated
once. Purified RNA samples were placed in ice and prepared for immediate cDNA
synthesis.
2.2.10 cDNA synthesis for Q-PCR
cDNA was prepared from purified total RNA samples isolated from virus infected
HepG2, Mcf10a and 53BP1-/- cell lines.
Quantification of RNA samples were carried out using the Nanodrop
spectrophotometer. The conditions for the PCR were amplified prior to the experiment
taking place. The optimised input of RNA template was 125ng in 10μl of RNA. All
reverse transcription reactions were performed on ice each RNA sample using the
reagents and quantities listed in Table 17.
Reagents 1 X Working volume (l)
ddH2O 3.2
10X RT buffer 2
10X RT Random Primers 2
25X dNTP mix (100mM) 0.8
MultiScribeTM
, Reverse Transcriptase, 50 U/l 1
RNase inhibitor 1
Table 17. General reagents used for cDNA synthesis of total RNA for QPCR reactions.
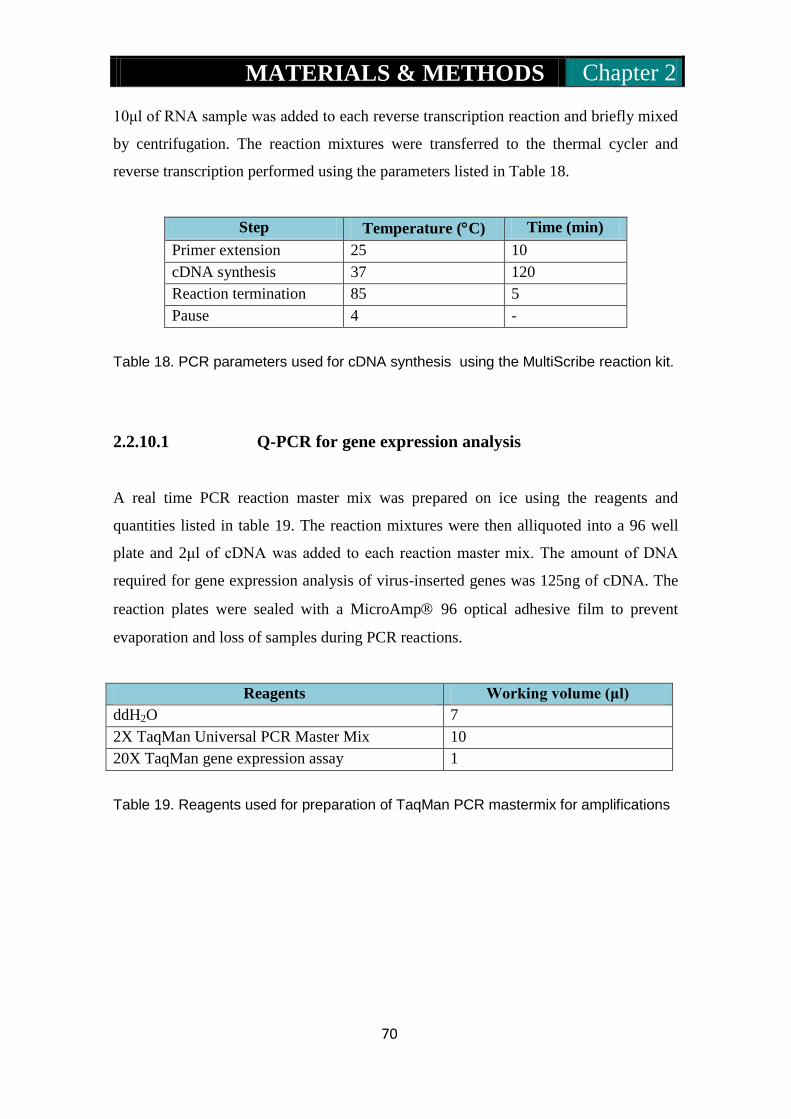
MATERIALS & METHODS Chapter 2
70
10μl of RNA sample was added to each reverse transcription reaction and briefly mixed
by centrifugation. The reaction mixtures were transferred to the thermal cycler and
reverse transcription performed using the parameters listed in Table 18.
Step Temperature (C) Time (min)
Primer extension 25 10
cDNA synthesis 37 120
Reaction termination 85 5
Pause 4 -
Table 18. PCR parameters used for cDNA synthesis using the MultiScribe reaction kit.
2.2.10.1 Q-PCR for gene expression analysis
A real time PCR reaction master mix was prepared on ice using the reagents and
quantities listed in table 19. The reaction mixtures were then alliquoted into a 96 well
plate and 2μl of cDNA was added to each reaction master mix. The amount of DNA
required for gene expression analysis of virus-inserted genes was 125ng of cDNA. The
reaction plates were sealed with a MicroAmp 96 optical adhesive film to prevent
evaporation and loss of samples during PCR reactions.
Reagents Working volume (μl)
ddH2O 7
2X TaqMan Universal PCR Master Mix 10
20X TaqMan gene expression assay 1
Table 19. Reagents used for preparation of TaqMan PCR mastermix for amplifications

MATERIALS & METHODS Chapter 2
71
The reaction mixtures were transferred to a 7900HT real time PCR thermal cycler
(Applied Biosystems). PCR amplifications were run in the absolute quantification blank
template format. The parameters for all amplification reactions are listed in Table 20.
Step Temperature (C) Time No. Cycles
… 50 2 minutes 1 x
Denaturation 95 10 minutes …
Denaturation 95 15 seconds
40 x Annealing 60 1 minute
Extension 72 90 seconds
Table 20. PCR parameters required for Q-PCR.
Validation experiments for PCR efficiency and optimal template concentration required
were calculated quantitatively. Raw data for each reaction plate consisted of CT values.
CT values were manually transferred from the thermal cycler to a CD for data analysis.
All reactions were performed in quadruplets and the reactions repeated on two
occasions. All genes were normalised using the house keeping gene (18sRNA) and
normal un- infected samples. The relative expression level of each gene was manually
calculated from CT values using the delta delta CT (ΔΔCT) method.
1. The average CT for each gene was subtracted from the average housekeeping
CT value to produce a ΔCT value.
2. ΔCT values from each sample was subtracted from the reference sample to yield
a ΔΔCT value (ΔΔCT = ΔCTsample – ΔCTnormal liver).
3. Relative gene expression values 2(-log fold value)
were calculated using the following
equation - 2-ΔΔCT
.
Statistical analysis including 95% confidence intervals, standard error of the mean
(SEM) and student T testing was performed on CT values to validate gene expression
data between normal and infected samples.

MATERIALS & METHODS Chapter 2
72
2.2.11 Microarray
RNA was extracted from cell monolayers, DNase treated and purified. Microarrays are
only performed using good quality RNA. All RNA was assessed for quantity and purity
using the Nanodrop and for integrity on the BioAnylzer. Concentration of RNA was
measured using the Nanodrop. RNA should ideally have a 260/280 ratio of 1.9 to 2.1.
Two microarray slides were done per experiment to reduce any errors.
2.2.11.1 cDNA synthesis from RNA
cDNA sysntheis was performed using the superscript III enzyme kit (Invitrogen).
In a sterile epindorph tube the RNA-RT Primer Mix (1.0 pmole/l) was prepared by the
addition of 2g of RNA in 5l being added to 1l of the relevant RT primer (Cy3 or
Cy5) as indicated in table 21.
CH1=Cy3 label (532) CH2=Cy5 label (635)
Sample ~ RNA Sample ~ RNA Slide barcode
Empty vector (1) 2ug/5ul NC 2ug/5ul 19710929
MLV(1) 2ug/5ul NC 2ug/5ul 19710927
EIAV(1) 2ug/5 ul NC 2ug/5ul 19710928
NC 2ug/5ul Empty vector (2) 2ug/5ul 19710930
NC 2ug/5ul MLV(2) 2ug/5ul 19710931
NC 2ug/5ul EIAV(2) 2ug/5ul 19710932
Empty vector (3) 2ug/5ul NC 2ug/5ul 19710933
MLV(3) 2ug/5ul NC 2ug/5ul 19710934
EIAV(3) 2ug/5ul NC 2ug/5ul 19710935
Table 21. Samples used for the reaction master mix of cDNA synthesis.
The solution was mixed, briefly centrifuged and heated on a pre-set 80C PCR machine
for 5 minutes to denature RNA secondary structures. Tubes were immediately placed on
ice for 3 minutes, quickly spun down and replaced on ice.
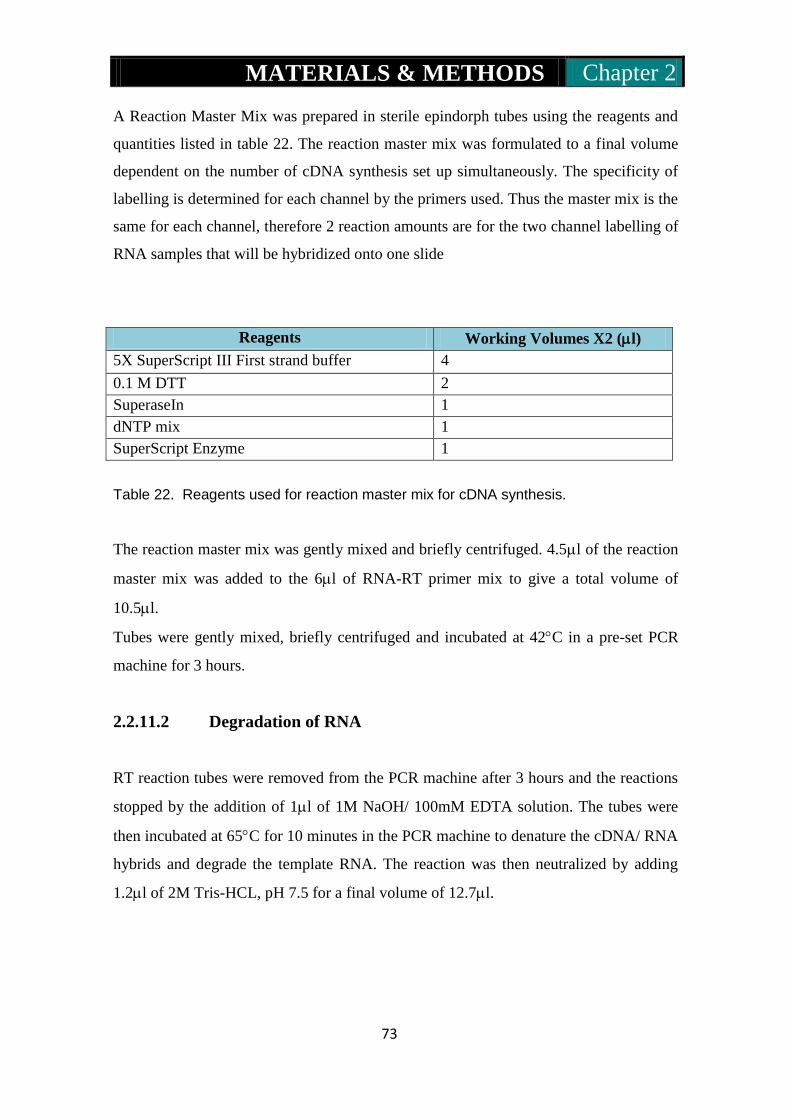
MATERIALS & METHODS Chapter 2
73
A Reaction Master Mix was prepared in sterile epindorph tubes using the reagents and
quantities listed in table 22. The reaction master mix was formulated to a final volume
dependent on the number of cDNA synthesis set up simultaneously. The specificity of
labelling is determined for each channel by the primers used. Thus the master mix is the
same for each channel, therefore 2 reaction amounts are for the two channel labelling of
RNA samples that will be hybridized onto one slide
Reagents Working Volumes X2 (l)
5X SuperScript III First strand buffer 4
0.1 M DTT 2
SuperaseIn 1
dNTP mix 1
SuperScript Enzyme 1
Table 22. Reagents used for reaction master mix for cDNA synthesis.
The reaction master mix was gently mixed and briefly centrifuged. 4.5l of the reaction
master mix was added to the 6l of RNA-RT primer mix to give a total volume of
10.5l.
Tubes were gently mixed, briefly centrifuged and incubated at 42C in a pre-set PCR
machine for 3 hours.
2.2.11.2 Degradation of RNA
RT reaction tubes were removed from the PCR machine after 3 hours and the reactions
stopped by the addition of 1l of 1M NaOH/ 100mM EDTA solution. The tubes were
then incubated at 65C for 10 minutes in the PCR machine to denature the cDNA/ RNA
hybrids and degrade the template RNA. The reaction was then neutralized by adding
1.2l of 2M Tris-HCL, pH 7.5 for a final volume of 12.7l.

MATERIALS & METHODS Chapter 2
74
2.2.11.3 Pre-slide scanning and Wash
Op Human Ready Array (microarrays Inc, USA) slides were handled with clean powder
free gloved hands. All slides were pre-scanned before to ensure their print quality using
the InnoScan (700A scanner) and Mapic software (version 3.1.0, Innoqsys, France).
2.2.11.4 Pre-hybridisation of slides
These slides were then pre-washed prior to use and scanned again to ensure that they
were clean and properly blocked.
Pre-hybridisation solution was prepared in a coplin jar using the reagents and quantities
in table…
Reagents Working volume x1
BSA solution (100mg/ml) 5ml
10% SDS 500l
20x SSC 8.75ml
MilliQ water 35.75ml
Total 50ml
Table 23. Reagents used to make pre-hybridisation solution for Microarray.
The coplin jar was then placed in a 65C hybridisation oven for 30 minutes. Array
slides were placed in the solution in the coplin jar and placed back in the 65C oven for
20 minutes.
Slides were removed from the coplin jar and secured into a black staining rack. This
was immediately immersed in a washing trough filled with MilliQ water and rinsed for
1 minute. The black staining rack was then immersed into a washing trough filled with
isopropanol and rinse for 1 minute. The slides were then completely dried using the
slide centrifuge.
Slides were then scanned again to check there are no smears / streaks from pre-
hybridisation and kept clean and dry by placing them in a slide holder container until
ready for use.
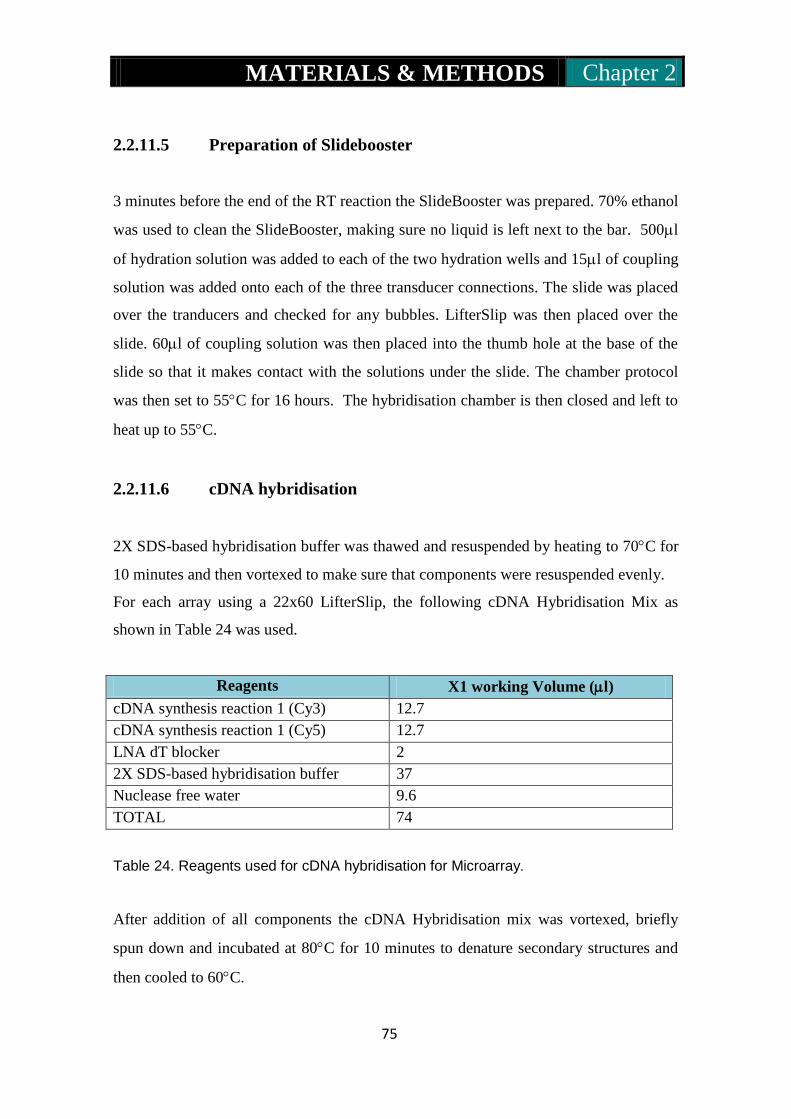
MATERIALS & METHODS Chapter 2
75
2.2.11.5 Preparation of Slidebooster
3 minutes before the end of the RT reaction the SlideBooster was prepared. 70% ethanol
was used to clean the SlideBooster, making sure no liquid is left next to the bar. 500l
of hydration solution was added to each of the two hydration wells and 15l of coupling
solution was added onto each of the three transducer connections. The slide was placed
over the tranducers and checked for any bubbles. LifterSlip was then placed over the
slide. 60l of coupling solution was then placed into the thumb hole at the base of the
slide so that it makes contact with the solutions under the slide. The chamber protocol
was then set to 55C for 16 hours. The hybridisation chamber is then closed and left to
heat up to 55C.
2.2.11.6 cDNA hybridisation
2X SDS-based hybridisation buffer was thawed and resuspended by heating to 70C for
10 minutes and then vortexed to make sure that components were resuspended evenly.
For each array using a 22x60 LifterSlip, the following cDNA Hybridisation Mix as
shown in Table 24 was used.
Reagents X1 working Volume (l)
cDNA synthesis reaction 1 (Cy3) 12.7
cDNA synthesis reaction 1 (Cy5) 12.7
LNA dT blocker 2
2X SDS-based hybridisation buffer 37
Nuclease free water 9.6
TOTAL 74
Table 24. Reagents used for cDNA hybridisation for Microarray.
After addition of all components the cDNA Hybridisation mix was vortexed, briefly
spun down and incubated at 80C for 10 minutes to denature secondary structures and
then cooled to 60C.
MATERIALS & METHODS Chapter 2
76
When the slide in the slide booster is warmed to 55C, the cDNA hybridisation mix is
pipetted to the microarray slide and hybridized overnight (16 hours) (mix power:27,
pulse power: 3/7).
2.2.11.7 Post cDNA hybridisation wash
The slide was removed from the slide booster and quickly placed into a pre warmed
trough with pre warmed (55C) 2x SSC, 0.2% SDS wash buffer. The LifterSlip was
carefully floated off the slide in the wash solution in the trough. The slide was then
inserted into the submerged rack. After the following washes took place:
Wash 1: Slide was washed for 10 minutes in the pre warmed 2x SSC, 0.2% SDS wash
buffer at an orbital rotation (150rpm) in the incubator at 55C.
Wash 2: Side was washed for 10 minutes in 2x SSC wash buffer at an orbital rotation
(150rpm) at room temperature.
Wash 3: Side was washed for 10 minutes in 0.2x SSC wash buffer at an orbital rotation
(150rpm) at room temperature.
The slide is immediately dried using the slide centrifuge.
2.2.11.8 Hybridisation of the fluorescently labelled 3DNA to the
Microarray Slide
The 3DNA capture reagents (Cy3 and Cy5) were pre-prepared for the 3DNA
hybridisation by firstly placing both vials in a light proof container in the dark as these
capture reagents contain fluorophores thus, light sensitive. These vials were then left at
room temperature for 20 minutes. After which they were incubated at 55C for 10
minutes in the heat block (covering the block with foil). The capture reagents were then
vortexed briefly and spun down. The tubes were checked for any aggregates, as
aggregates will prevent the array from labelling properly.
2X SDS-based hybridisation buffer was thawed and re suspended by heating to 70C
for 10 minutes and then vortexed to make sure that components were re suspended
evenly.

MATERIALS & METHODS Chapter 2
77
For each array a 3DNA hybridisation mix relevant for use on 22x60 LifterSlip, was
made according to Table 25.
Reagents X1 working Volume (l)
3DNA capture reagent- Cy3 2.5
3DNA capture reagent- Cy5 2.5
2X SDS-based hybridisation buffer 37
Nuclease free water 32
TOTAL 74
Table 25. Reagents used for 3DNA hybridisation mix for 1 slide for Microarray.
After addition of all components the 3DNA Hybridisation mix was vortexed, briefly
spun down and incubated at 80C for 10 minutes and then cooled to 55C.
During these 10 minutes the array and LifterSlip was placed in the Slide Booster (with
contact solution and correct hydration solution as before) and pre-warmed to 50C. The
3DNA hybridisation mix is pipetted to the microarray slide and hybridized for 4 hours
(mix power: 27, pulse power: 3/7).
2.2.11.9 Post 3DNA hybridisation wash
The slide was removed from the slide booster and quickly placed into a pre warmed
trough with pre warmed (50C) 2x SSC, 0.2% SDS wash buffer. The LifterSlip was
carefully floated off the slide in the wash solution in the trough. The slide was then
inserted into the submerged rack. After the following washes took place:
Wash 1: Slide was washed for 10 minutes in the pre warmed 2x SSC, 0.2% SDS wash
buffer at an orbital rotation (150rpm) in the incubator at 55C.
Wash 2: Side was washed for 10 minutes in 2x SSC wash buffer at an orbital rotation
(150rpm) at room temperature.
Wash 3: Side was washed for 10 minutes in 0.2x SSC wash buffer at an orbital rotation
(150rpm) at room temperature.
The slide is immediately dried using the slide centrifuge and placed in a lightproof slide
holder.
MATERIALS & METHODS Chapter 2
78
2.2.11.10 Microarray image acquisition.
Microarray slides were scanned with Innoscan 700A microarray scanner/Mapix 3.1.0
software (Innopsys, France). Laser and PMT settings were manipulated to balance
overall intensity between Cy3 and Cy5 channels and to avoid excess of saturated pixels
in the spots.
2.2.11.11 Microarray image analysis.
Microarrays scan .tiff images were imported into and analysed by BlueFuse for
Microarrays 3.2 (4484) (BlueGnome, UK). Microarray spots grid were generated from
.gal file (supplied by microarrays manufacturer), and manually adjusted to the spot
positions on the images. Spots were segmented and their intensities were calculated
according to the software algorithms. Calculated spot intensities then were normalised
by “Global Lowess” function, and spots replicates normalised intensities averaged by
“fused” function.
2.2.11.12 Microarray data analysis.
Output files with both normalised spots intensities and experiment/control log2 rations
were imported to the web implementations of Cyber-T (Kayala and Baldi, 2012) and
Rank-Product (Laing and Smith, 2010) software to find differentially expressed genes.
The cut-off for differentially expressed genes was more than 1.5 fold change and
P<0.05.
2.2.12 mFISH
In the current project M-FISH has been performed using human paints prepared from
flow-sorted human chromosomes. The ‘human paint mix’ has been obtained from
whole chromosome paints labelled with different combinations of four fluorochromes
(Cy5, Cy3.5, Cy3 and FITC) and one hapten (Biotin). In total, 24 unique combinations
have been obtained, and no more than 3 fluorochromes were used for each combination.
MATERIALS & METHODS Chapter 2
79
2.2.12.1 Slide preparation and metaphase spreads
Cells were fixed with freshly prepared Carnoy’s fixative (3:1 methanol/glacial acid).
This metaphase cell suspension were then dropped onto clean microscope slides
(sonicated at 1% decon and stored in 96% ethanol) using the water bath at 50ºC. Slides
were checked under the phase contrast microscope to ensure both the cell concentration
and the metaphase spreads are optimal.
2.2.12.2 Slide pre-treatment prior to hybridization
Slides were incubated in a coplin jar of 50% acetic acid (in water), at room temperature
for 3 minutes and then incubated in a jar of 100% methanol, at room temperature for 3
minutes and air dried. After the slides were dry they were incubated in a coplin jar of
0.01 HCL at room temperature for 3 minutes. After which slides were thoroughly rinsed
3 times in 2X SSC for 5 minutes each and air dried. Slides were then baked at 65 ºC for
an hour.
2.2.12.3 Hybridisation
Slides were denatured in a coplin jar containing 70% formamide (pre-warmed in a 72ºC
waterbath) for 1 minute 30 seconds and immediately quenched in 70% ice cold ethanol
for 1 minute. Slides were then dehydrated through an ethanol series (70%. 70%, 90%,
90% and 100%) for a minute each and air dried. Human M-FISH paint was vortexed,
pulse microfuged and denatured at 65 ºC for 10 minutes. 10µl of human M-FISH paint
probe was pipetted onto the slide and covered with a clean 22X22 coverslip and sealed
with fixogum. Slides were then incubated over night at 37 ºC incubator in a humid
chamber.
2.2.12.4 Post-hybridisation wash and detection
Fixogum was removed from slides and coverslips soaked off in 2X SSC at room
temperature. Slides were then incubated at 50% formamide/ 2X SCC at 42ºC for 5
minutes. This was repeated again in different coplin jar containing 50% formamide/ 2X
MATERIALS & METHODS Chapter 2
80
SCC. Slides were then washed in pre-warmed 2X SSC twice at 42ºC. slides were
drained and 150µl of anti-biotin Cy5.5 (1:200 dilution in 4X SSCT) was added to each
slide and allowed to incubate at 37 ºC for 15-20 minutes. Slides were then washed
thrice in 4X SSCT, 5 minutes each at 42ºC. Each slide was drained and approximately
15-20µl of DAPI counterstain was added, overlayed with a 22X50 mm coverslip and
finally, sealed with nail varnish. Slides were then ready for imaging.
2.2.12.5 mFISH Imaging
Multicolour FISH’d metaphase images are captured and processed using the
SmartCapture® (Digital Scientific, UK) digital imaging system that consists of a
epifluorescent Zeiss microscope (Axioplan2 Imaging or AxioImager DI) fitted with a
cooled charge coupled device (CCD) camera (Hamamatsu Orca ER), equipped with
narrow band pass filters for Cy5.5, Cy5, Cy3, Cy3.5, FITC (fluorescein isothiocyanate)
and DAPI (4’,6-diamidino-2-phenylindole) fluorescence and an iMAC computer
(Apple). Metaphase images are then karyotyped using the Digital Scientific, UK,
Smattype software.
In the current study 40 images from each cell line was imaged, karyotyped and
analysed.

RESULTS Chapter 3
81
3.1 Background
Retrovirus gene therapy vectors can deliver therapeutic genes to mammalian cells in a
permanent manner by integrating their genome into host chromosomes and therefore
provide the potential for long-term therapeutic gene expression. However, this is
contrasted by their ability to cause mutagenesis upon integration. This insertion appears
to be semi-random by integration into actively transcribed regions of the genome with
target site selectivity near promoter regions. Already known is that these insertions can
result in up-regulation or down-regulation of neighbouring gene expression by provirus
LTR promoters or enhancers or by splicing of virus sequences together with host genes.
Where the host genes are oncogenes or tumour suppressor genes IM can lead to
oncogenesis.
Lentiviruses (LV) are a subgroup of retroviruses that have similar characteristics to their
retrovirus counterparts, however, their integration target site selection appears to be the
gene transcription unit rather than promoter regions. These vectors have been designed
with SIN properties and therefore lack promoter sequences that switch on host gene
expression unless internal promoter read-through takes place. Little is known, however,
about their potential for IM.
The observation of HCC in mice treated by LV vectors described by Dr Themis’s group
in 2005 and more recently in 2013 (Appendix 1) highlights the potential for
genotoxicity by these vectors and how IS profiles differ between primate and non
primate vectors. Microarray characterization of these HCCs coupled with LAM PCR
revealed gene ontologies (GO’s) of genes with insertions involved in oxidative
reduction and DNA damage and repair and several were known oncogenes involved in
cancer and particularly HCC. Because, cancer development usually requires multiple
genetic events beginning with cell immortalisation then progression to malignancy, the
original hypothesis that IM caused oncogenesis alone is difficult to reconcile. The work
of this thesis was, therefore, directed at investigating whether virus infection and
integration could cause genotoxicity by an alternative route(s) than IM. One important
route based on the microarray data (Nowrouzi et al., 2012) is the possibility that virus
infection is associated with genome instability and this could be also contributing to the
cancer phenotype identified. This hypothesis is supported by a previously published

RESULTS Chapter 3
82
report by the Themis group (2003) that showed high level infection of cells in vitro
leads to the hprt –ve phenotype coupled to instability at this locus (Themis et al., 2003).
To begin this work, mouse liver tissues were investigated for genome instability using
the method of Comparative Genome Hybridization (CGH) in collaboration with Dr
Nathalie Conte of the Wellcome Trust. CGH enables chromosome amplification and
deletions to be examined using mouse chromosome specific probes. Hence CGH is a
molecular cytogenetic method for the analysis of copy number variations (CNV) (gains
or losses) in the DNA content of tumour cells compared with normal livers. In this
process, kidney genomic DNA was used to prove normal livers had similar CNV.
3.2 Investigation of mouse tumour DNA compared to non-tumour
liver using CGH
For CGH analysis, tumours that developed from mice treated with EIAV and HIV
vectors and a spontaneous tumour were used. These were compared with normal livers
and kidney samples for each respective liver tumour to control for normal liver CNV.

RESULTS Chapter 3
83
EIAV induced liver tumours vs. normal liver (n=6 each)

RESULTS Chapter 3
84
HIV induced liver tumours vs. Normal liver (n=3 each)
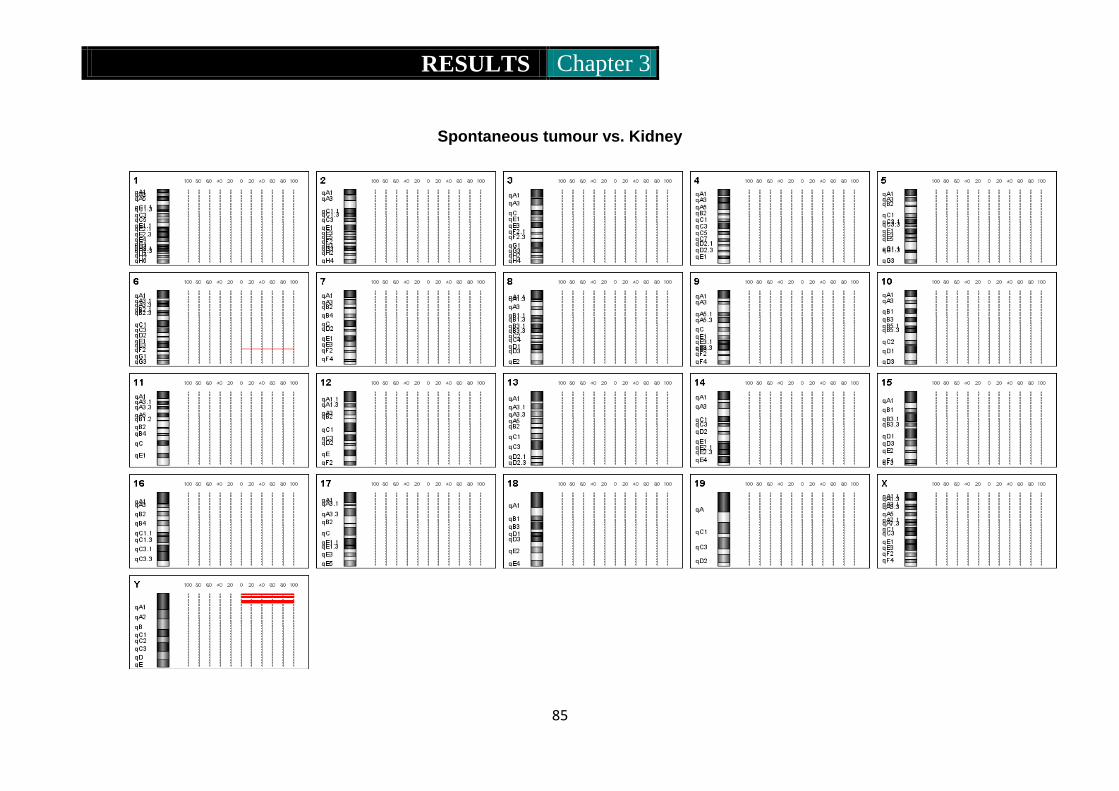
RESULTS Chapter 3
85
Spontaneous tumour vs. Kidney

RESULTS Chapter 3
86
Figure 7. CGH Ideograms representing pooled CNV of tumours.
Ideograms are shown of sample DNAs derived from mice treated with EIAV vector vs.
respective normals (n=6), tumours that derived from animals treated with the HIV
vector (n=3) and a spontaneous liver tumour. DNA from respective kidneys of each
mouse was compared with normal livers first (data not shown) before comparisons
between normal livers and tumours to ensure non-tumour liver DNA contained normal
CNV to the kidney. The spontaneous liver tumour (without infection) was compared
directly to the kidney of this animal. Chromosomes 1-19, X and Y are shown. CNV are
represented as: Green bars = deletions; red bars = amplification.
The CGH shown in figure 7 represents CNV between mouse tumour DNAs compared
with non-tumour livers infected with the EIAV vector. In these samples CNV
representing deletions in chromosome 1, 4, 7, 18 and whole loss of chromosome X were
observed. Amplifications were observed in chromosomes 2 and 6.
In the 3 HIV vector associated tumours small regions of amplifications and deletions
were found. These were observed in commonly known regions that are believed
unstable and found in independent CGH screens on several murine cell types at the
Wellcome Trust (personal communication with Dr Nathalie Conte). Hence, these were
believed unlikely to be caused by the HIV vector.
For the spontaneous tumour (not carrying a virus insertion) CNV were detected only in
the Y chromosome which is also known to be unstable and common in spontaneous
tumours (personal communication with Dr Nathalie Conte).
Because CNV were identified mainly in EIAV derived tumours more detailed
examination of the regions carrying these CNV was made.
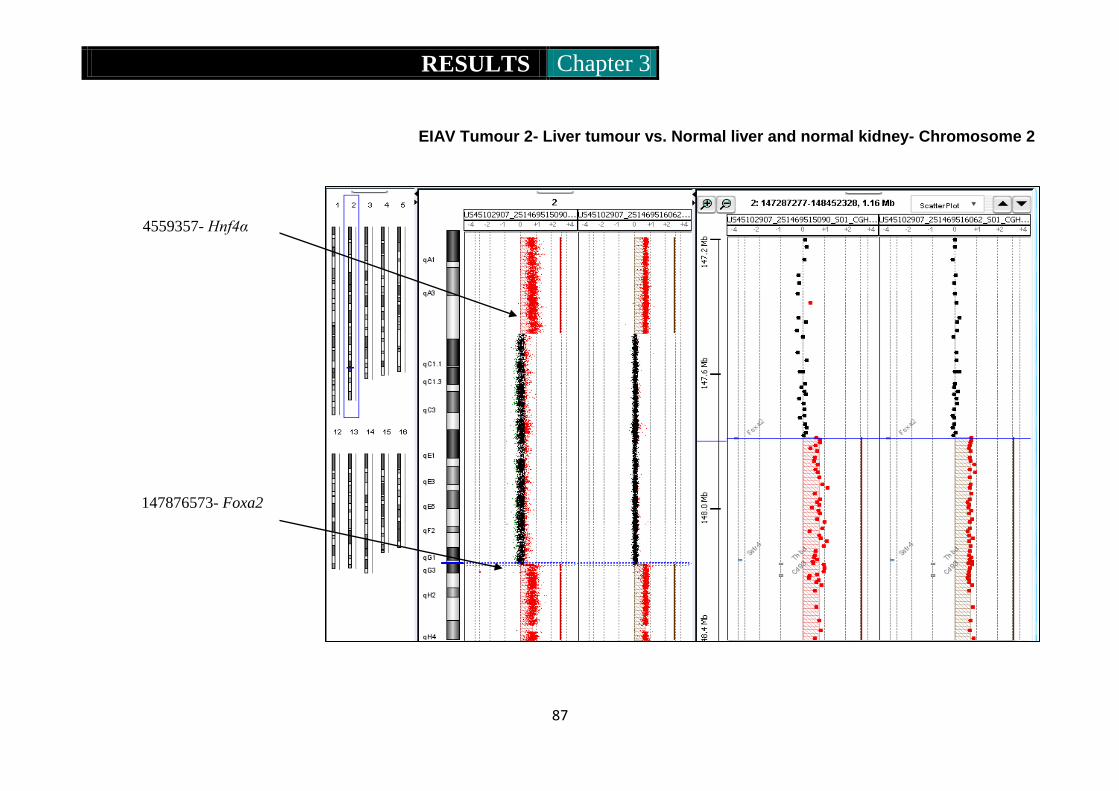
RESULTS Chapter 3
87
EIAV Tumour 2- Liver tumour vs. Normal liver and normal kidney- Chromosome 2
4559357- Hnf4α
147876573- Foxa2
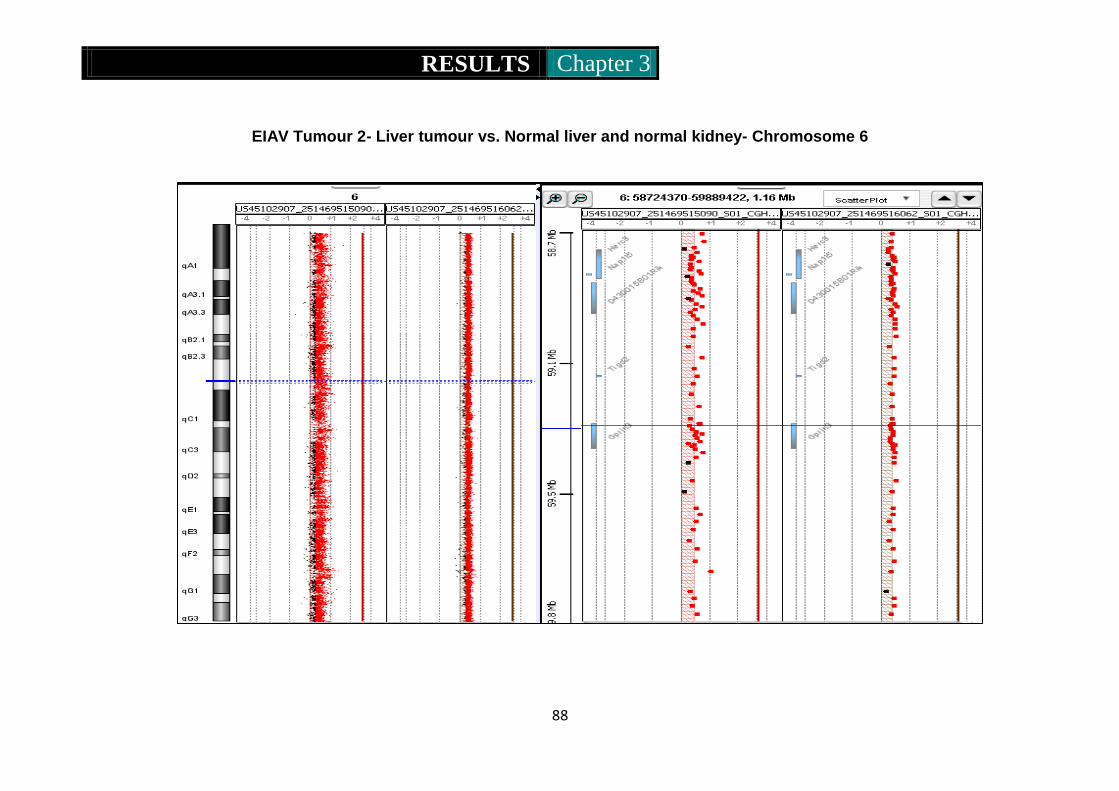
RESULTS Chapter 3
88
EIAV Tumour 2- Liver tumour vs. Normal liver and normal kidney- Chromosome 6

RESULTS Chapter 3
89
EIAV Tumour 2- Liver tumour vs. Normal liver and normal kidney- Monosomy X
Figure 8. CGH Ideograms representing CNV in EIAV Tumour 2. The ideograms show the regions carrying CNV. This information was used for
BLAST searches using NCBI (http://blast.ncbi.nlm.nih.gov/Blast.cgi) to identify the genes in the regions of CNV. In chromosome 2 a specific region
between 4559357 and 147876573 was amplified. Also complete amplification was observed in, chromosome 6 and entire loss of the X
chromosome.
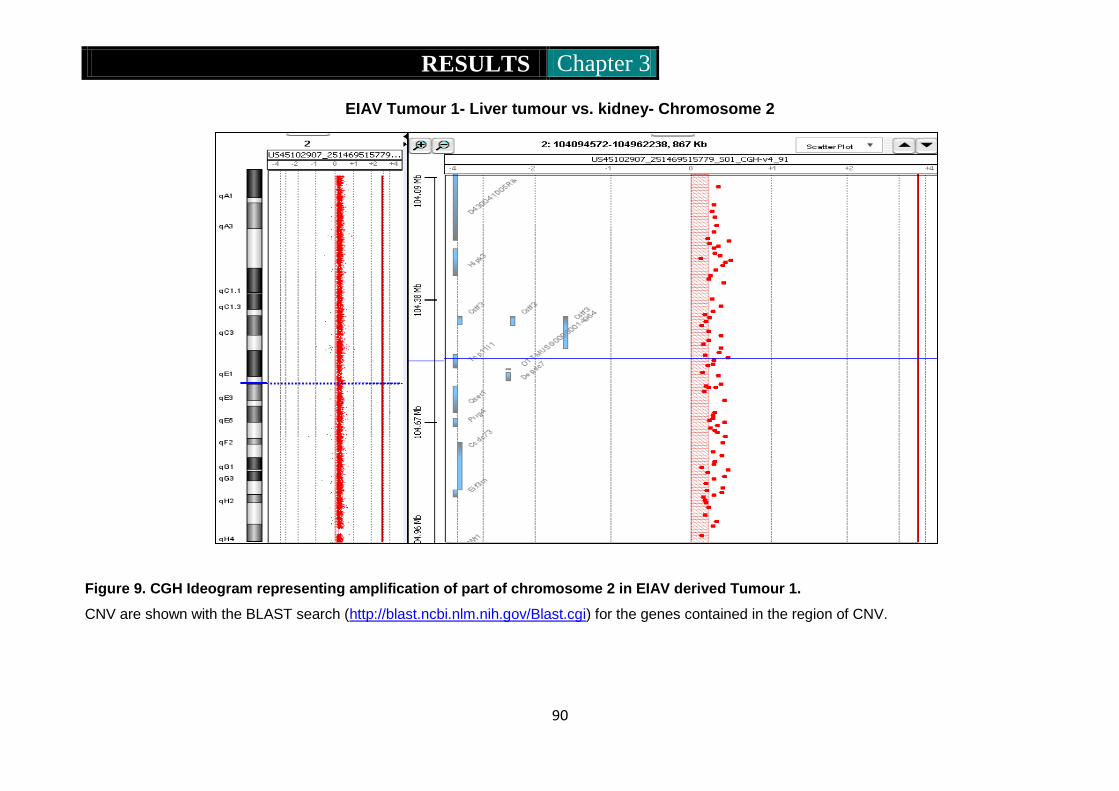
RESULTS Chapter 3
90
EIAV Tumour 1- Liver tumour vs. kidney- Chromosome 2
Figure 9. CGH Ideogram representing amplification of part of chromosome 2 in EIAV derived Tumour 1.
CNV are shown with the BLAST search (http://blast.ncbi.nlm.nih.gov/Blast.cgi) for the genes contained in the region of CNV.
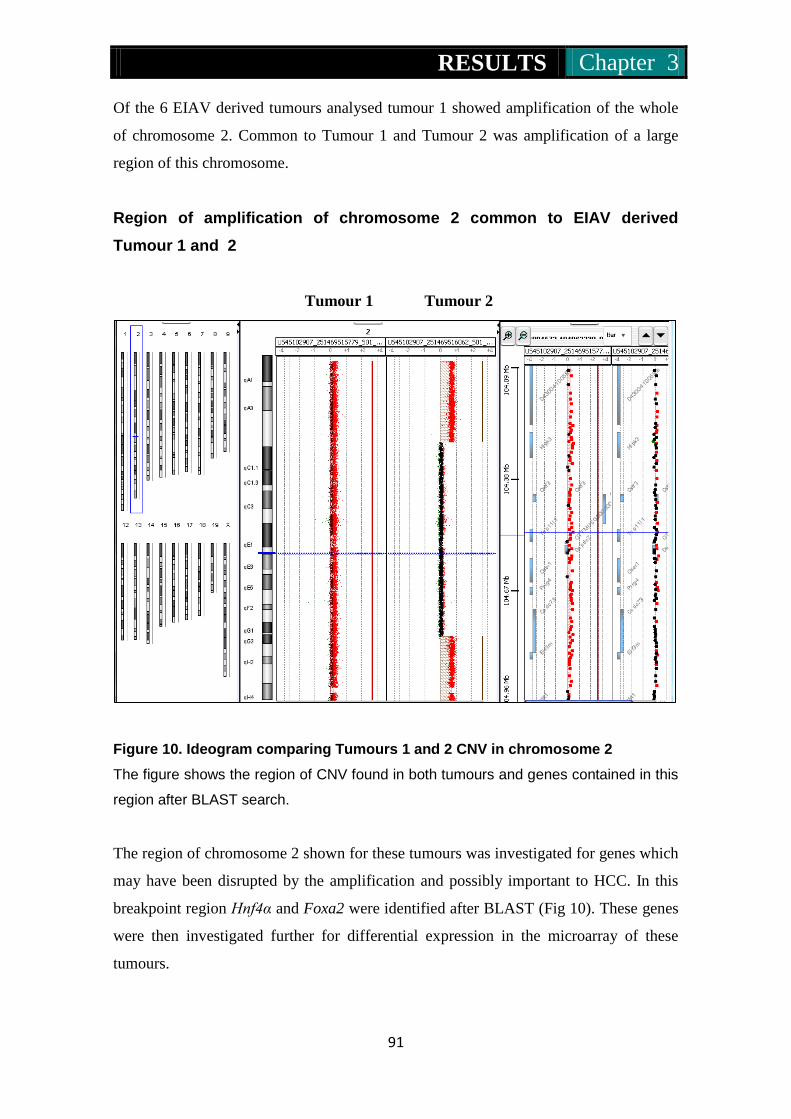
RESULTS Chapter 3
91
Of the 6 EIAV derived tumours analysed tumour 1 showed amplification of the whole
of chromosome 2. Common to Tumour 1 and Tumour 2 was amplification of a large
region of this chromosome.
Region of amplification of chromosome 2 common to EIAV derived
Tumour 1 and 2
Tumour 1 Tumour 2
Figure 10. Ideogram comparing Tumours 1 and 2 CNV in chromosome 2
The figure shows the region of CNV found in both tumours and genes contained in this
region after BLAST search.
The region of chromosome 2 shown for these tumours was investigated for genes which
may have been disrupted by the amplification and possibly important to HCC. In this
breakpoint region Hnf4α and Foxa2 were identified after BLAST (Fig 10). These genes
were then investigated further for differential expression in the microarray of these
tumours.

RESULTS Chapter 3
92
For Hnf4α, microarray data showed a 1.5 (p>0.05) fold decrease in expression of this
gene, whereas no change in expression was identified for the Foxa2 gene.
Interestingly, in Tumour 1 microarray showed Tgm2 expression increased by 4.5 fold
(p<0.05). Tgm2 is in the same region as the breakpoint region found in Tumour 2, and
this gene which codes for a transglutaminase has been shown to be differentially
expressed in HCC (Sun et al., 2008). To examine more accurately the changes in gene
expression observed by microarray, RT-PCR using primer/probes for each gene was
performed.
Table 26. Real time PCR relative change in gene expression of Hnf4α,
Hnf1α and Foxa2 in Tumour 1 and 2.
Gene name Relative change in gene expression
(log2)
Relative change in gene expression
(log2)
Tumour 1 (+/-SD) Tumour 2 (+/-SD)
Foxa2 1.57 (0.41) -0.75 (0.08)
Hnf1α -0.55 (0.15) -0.20 (0.05)
Hnf4α -0.62 (0.04) -0.18 (0.04)
RT PCR was used to measure levels of Hnf4α, Hnf1α and Foxa2 gene expression.
These were decreased in both Tumour 1 and 2 except in Tumour 1 Foxa2 gene
expression was increased compared with normal liver tumour samples. All levels of
expression are given as log 2 fold changes that were normalised to 18S RNA gene
expression that was set at 1. SD= standard deviation.
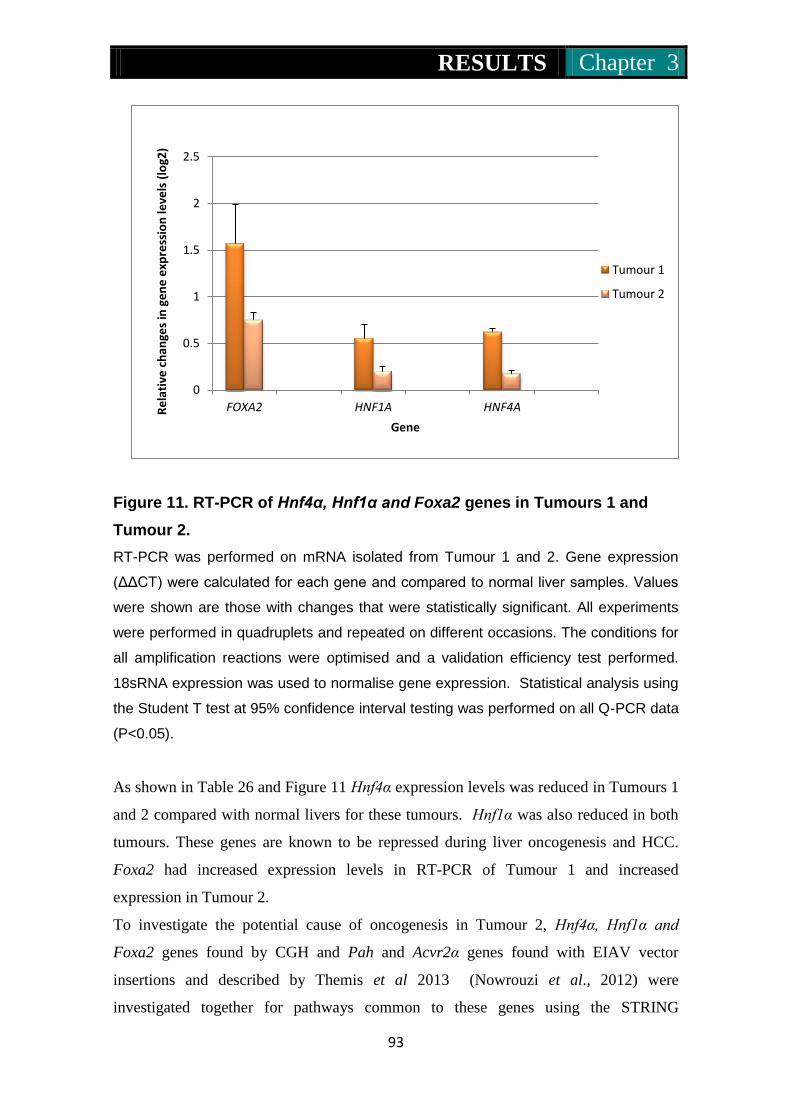
RESULTS Chapter 3
93
0
0.5
1
1.5
2
2.5
FOXA2 HNF1A HNF4A Re
lati
ve c
han
ges
in g
en
e e
xpre
ssio
n le
vels
(lo
g2)
Gene
Tumour 1
Tumour 2
Figure 11. RT-PCR of Hnf4α, Hnf1α and Foxa2 genes in Tumours 1 and
Tumour 2.
RT-PCR was performed on mRNA isolated from Tumour 1 and 2. Gene expression
(ΔΔCT) were calculated for each gene and compared to normal liver samples. Values
were shown are those with changes that were statistically significant. All experiments
were performed in quadruplets and repeated on different occasions. The conditions for
all amplification reactions were optimised and a validation efficiency test performed.
18sRNA expression was used to normalise gene expression. Statistical analysis using
the Student T test at 95% confidence interval testing was performed on all Q-PCR data
(P<0.05).
As shown in Table 26 and Figure 11 Hnf4α expression levels was reduced in Tumours 1
and 2 compared with normal livers for these tumours. Hnf1α was also reduced in both
tumours. These genes are known to be repressed during liver oncogenesis and HCC.
Foxa2 had increased expression levels in RT-PCR of Tumour 1 and increased
expression in Tumour 2.
To investigate the potential cause of oncogenesis in Tumour 2, Hnf4α, Hnf1α and
Foxa2 genes found by CGH and Pah and Acvr2α genes found with EIAV vector
insertions and described by Themis et al 2013 (Nowrouzi et al., 2012) were
investigated together for pathways common to these genes using the STRING

RESULTS Chapter 3
94
(http;//string-db.org/) database. This database identifies predicted protein interactions
that include direct (physical) and indirect (functional) associations. Four of the five
genes were found in related pathways (Fig 12). The Pah gene was found to be
associated with Hnf1a, Hnf4a and Foxa2 which are all associated with HCC. Foxa2,
Hnf1a and Hnf4a are closely related transcription factors which are critical to the
development and function of the mouse liver. Acvr2a and Tgm2 were not found to be
linked.
Figure 12. Analysis of the relationship between genes found by CGH and IM of
tumour 2
Foxa2, Hnf1α, Hnf4α and Tgm2 identified using CGH of Tumour 2 and Pah and Acvr2a
genes found with EIAV vector insertions were imputed into the STRING (http;//string-
db.org/) database. The Pah gene was found to be associated with Hnf1a, Hnf4a. No
association was found for these genes with Acvr2a and Tgm2, however, all 6 genes
are known to be associated with liver disease and specifically to HCC. Confidence
levels are provided from the STRING database for gene interactions.
The results obtained by CGH suggest genome instability. However, because the
tumours identified in the mice treated with EIAV were as a result of clonal evolution,
the CNV observed could not be strictly assigned to being caused by the EIAV vector.
The work carried out in this thesis, therefore, concerns the use of alternative assays to
investigate genotoxicity independent of IM. The work investigates the possible

RESULTS Chapter 3
95
connection between retroviral infection and genome instability and the host innate
response to infection in the form of epigenetic changes.
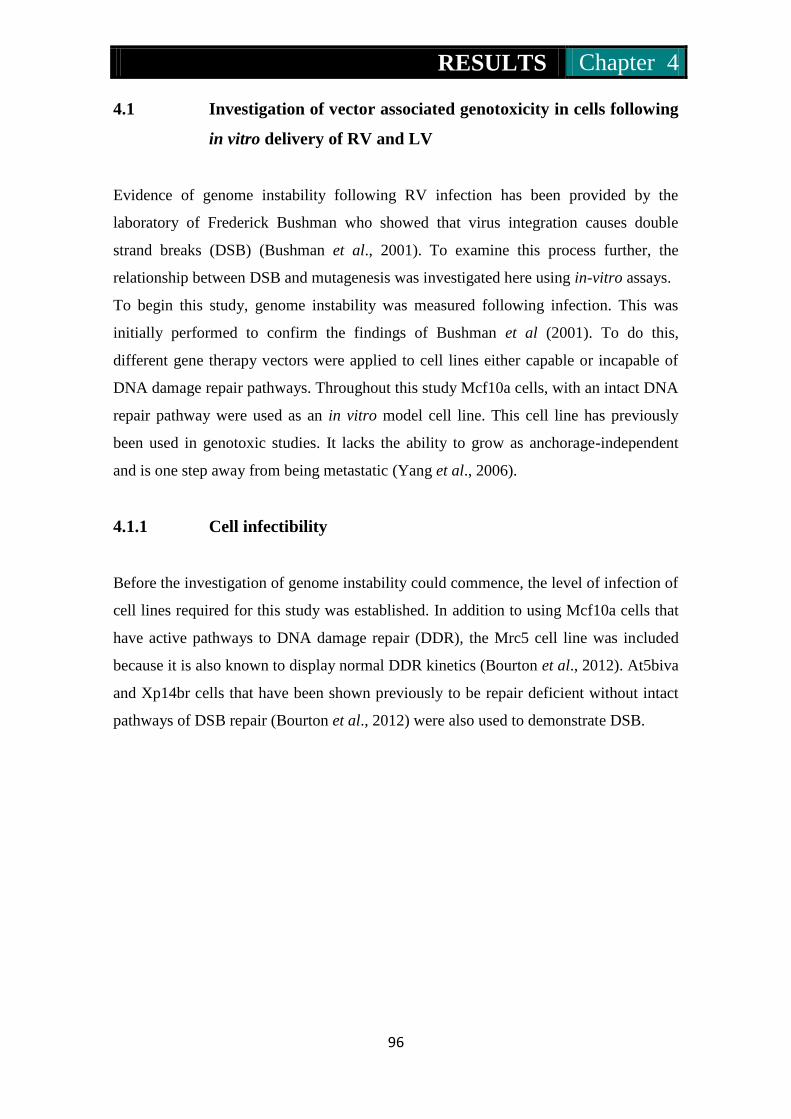
RESULTS Chapter 4
96
4.1 Investigation of vector associated genotoxicity in cells following
in vitro delivery of RV and LV
Evidence of genome instability following RV infection has been provided by the
laboratory of Frederick Bushman who showed that virus integration causes double
strand breaks (DSB) (Bushman et al., 2001). To examine this process further, the
relationship between DSB and mutagenesis was investigated here using in-vitro assays.
To begin this study, genome instability was measured following infection. This was
initially performed to confirm the findings of Bushman et al (2001). To do this,
different gene therapy vectors were applied to cell lines either capable or incapable of
DNA damage repair pathways. Throughout this study Mcf10a cells, with an intact DNA
repair pathway were used as an in vitro model cell line. This cell line has previously
been used in genotoxic studies. It lacks the ability to grow as anchorage-independent
and is one step away from being metastatic (Yang et al., 2006).
4.1.1 Cell infectibility
Before the investigation of genome instability could commence, the level of infection of
cell lines required for this study was established. In addition to using Mcf10a cells that
have active pathways to DNA damage repair (DDR), the Mrc5 cell line was included
because it is also known to display normal DDR kinetics (Bourton et al., 2012). At5biva
and Xp14br cells that have been shown previously to be repair deficient without intact
pathways of DSB repair (Bourton et al., 2012) were also used to demonstrate DSB.
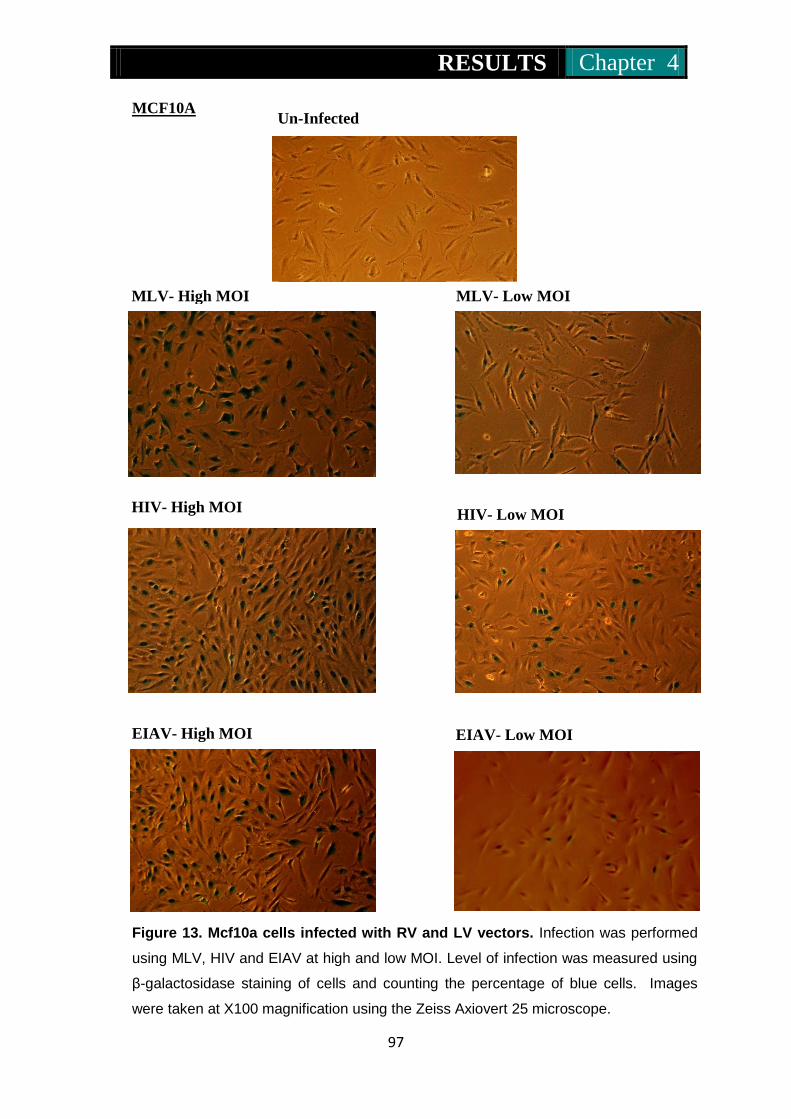
RESULTS Chapter 4
97
MCF10A
Figure 13. Mcf10a cells infected with RV and LV vectors. Infection was performed
using MLV, HIV and EIAV at high and low MOI. Level of infection was measured using
β-galactosidase staining of cells and counting the percentage of blue cells. Images
were taken at X100 magnification using the Zeiss Axiovert 25 microscope.
MLV- Low MOI
EIAV- High MOI EIAV- Low MOI
HIV- High MOI HIV- Low MOI
MLV- High MOI
Un-Infected
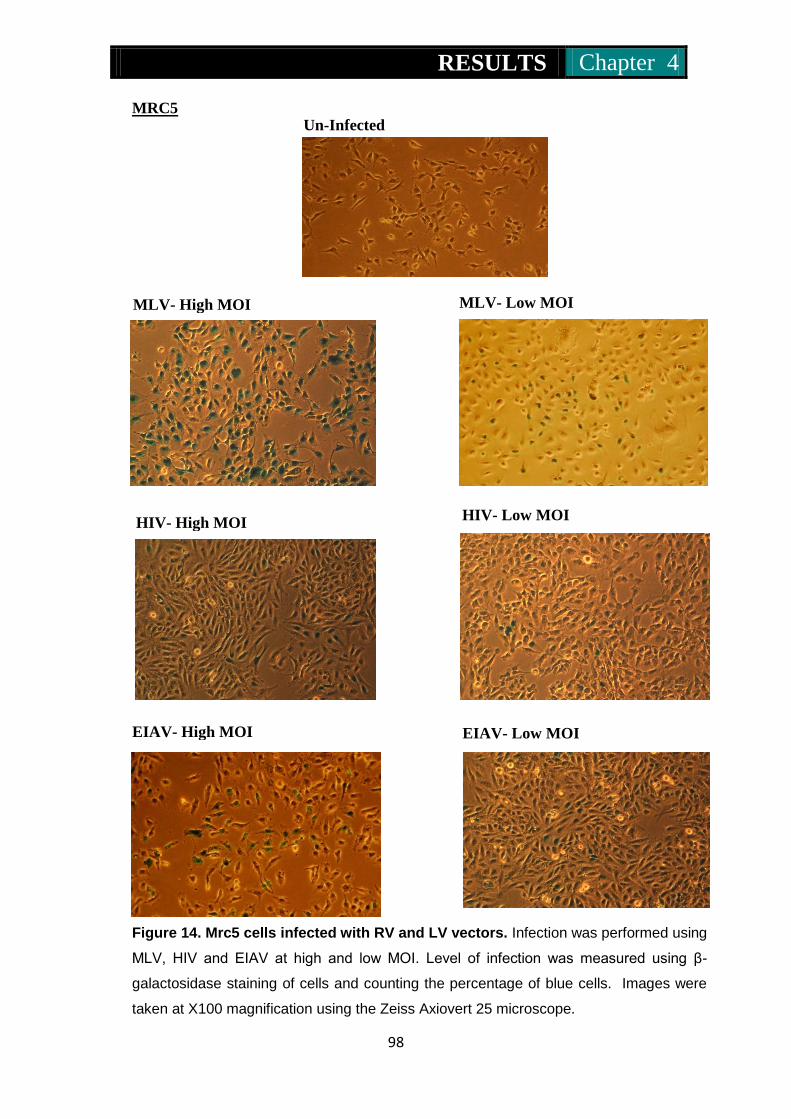
RESULTS Chapter 4
98
MRC5
Figure 14. Mrc5 cells infected with RV and LV vectors. Infection was performed using
MLV, HIV and EIAV at high and low MOI. Level of infection was measured using β-
galactosidase staining of cells and counting the percentage of blue cells. Images were
taken at X100 magnification using the Zeiss Axiovert 25 microscope.
Un-Infected
MLV- High MOI MLV- Low MOI
HIV- High MOI
EIAV- High MOI
HIV- Low MOI
EIAV- Low MOI

RESULTS Chapter 4
99
AT5BIVA
Figure 15. At5biva cells infected with RV and LV vectors. Infection was performed
using MLV, HIV and EIAV at high and low MOI. Level of infection was measured using β-
galactosidase staining of cells and counting the percentage of blue cells. Images were
taken at X100 magnification using the Zeiss Axiovert 25 microscope.
Un-Infected
MLV- High MOI MLV- Low MOI
HIV- High MOI
EIAV- High MOI
HIV- Low MOI
EIAV- Low MOI
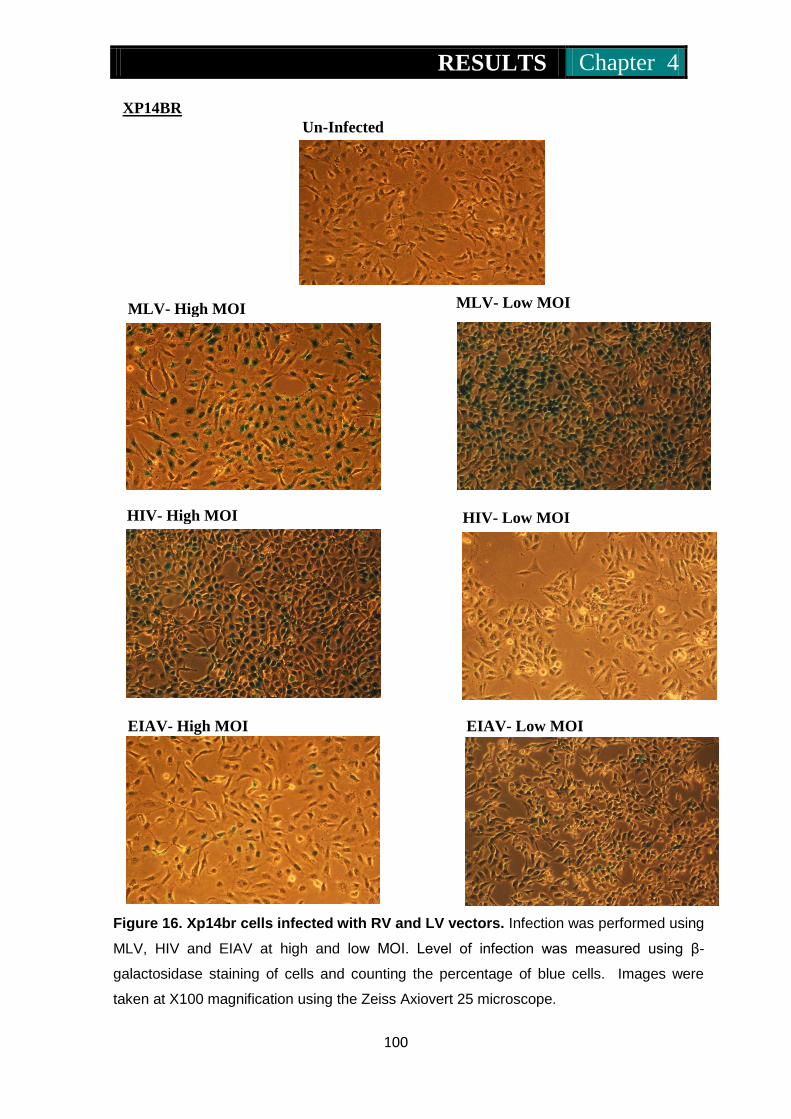
RESULTS Chapter 4
100
XP14BR
Figure 16. Xp14br cells infected with RV and LV vectors. Infection was performed using
MLV, HIV and EIAV at high and low MOI. Level of infection was measured using β-
galactosidase staining of cells and counting the percentage of blue cells. Images were
taken at X100 magnification using the Zeiss Axiovert 25 microscope.
Un-Infected
MLV- High MOI MLV- Low MOI
HIV- High MOI
EIAV- High MOI
HIV- Low MOI
EIAV- Low MOI
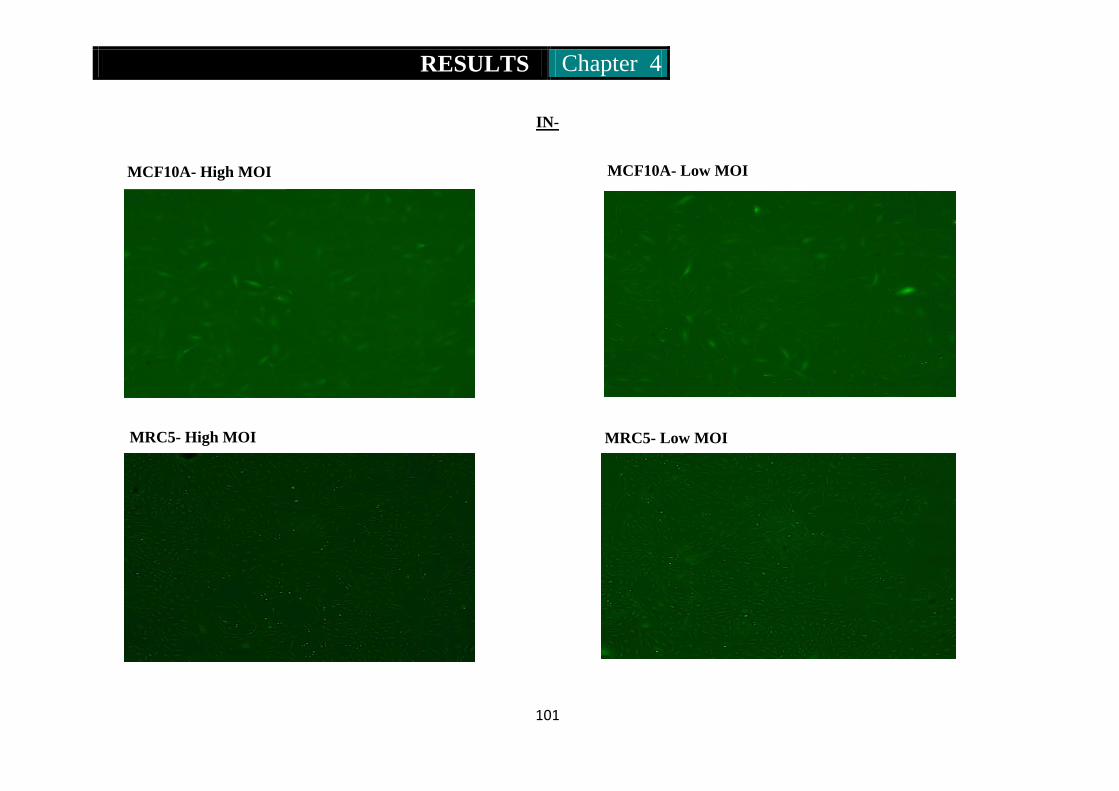
RESULTS Chapter 4
101
IN-
MCF10A- High MOI
MRC5- Low MOI MRC5- High MOI
MCF10A- Low MOI
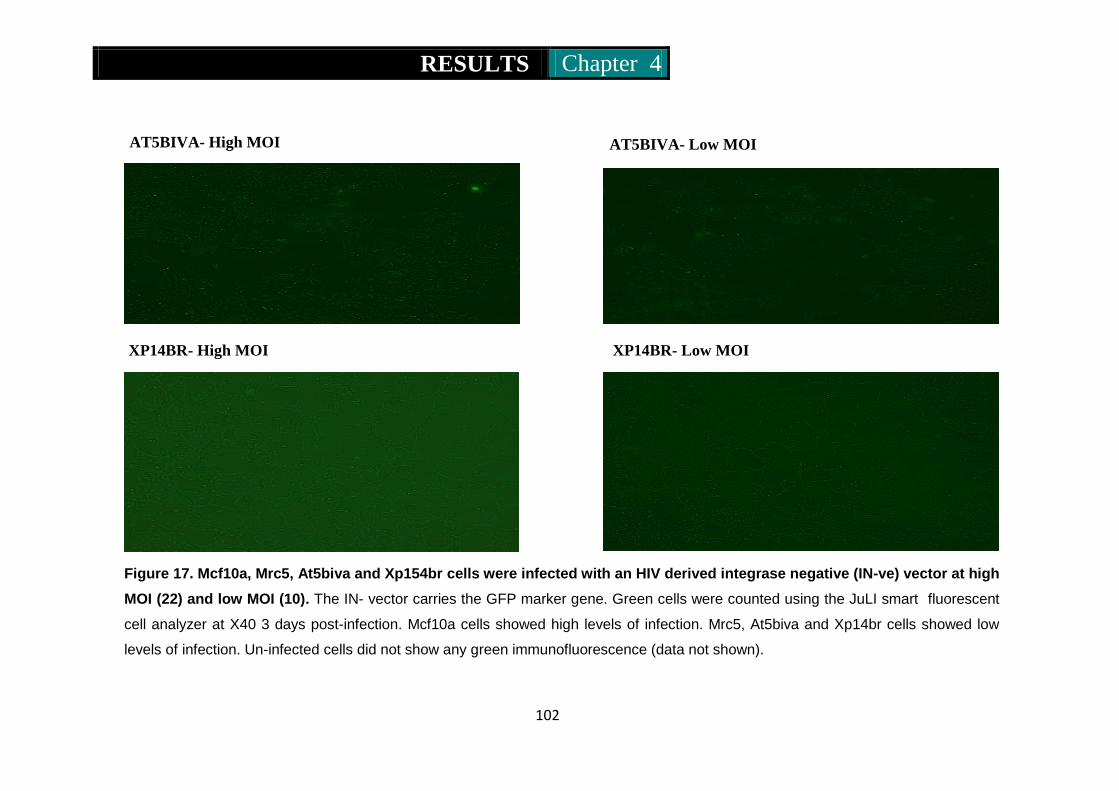
RESULTS Chapter 4
102
Figure 17. Mcf10a, Mrc5, At5biva and Xp154br cells were infected with an HIV derived integrase negative (IN-ve) vector at high
MOI (22) and low MOI (10). The IN- vector carries the GFP marker gene. Green cells were counted using the JuLI smart fluorescent
cell analyzer at X40 3 days post-infection. Mcf10a cells showed high levels of infection. Mrc5, At5biva and Xp14br cells showed low
levels of infection. Un-infected cells did not show any green immunofluorescence (data not shown).
XP14BR- Low MOI XP14BR- High MOI
AT5BIVA- Low MOI
AT5BIVA- High MOI AT5BIVA- Low MOI

RESULTS Chapter 4
103
Table 27. Percentage level of infection in Mcf10a, Mrc5, At5biva and Xp14br cells
Cells were infected with RV and LV vectors. Level of infection of cells was measured
using β-galactosidase staining of cells and percentages of blue cells were counted and
calculated. Negative controls were cultured in an identical manner to virally infected cells
and mock infected in the presence of 5µg/ml DEAE dextran. All infections used DEAE
dextran at 5µg/ml. 24 hours after infection cells were re-fed with complete medium and
24 hours later infection levels were calculated. Upon infection with LV or RV all cell lines
showed positive infection. Levels of infection are greater when a high MOI was used.
Un-infected cells showed no positively blue cells. Due to differences in titres between
viruses that could be generated, high and low MOIs, respectively, were not identical.
Mcf10a, Mrc5, At5biva and Xp14br cells were infected with MLV (High MOI:200, Low
MOI:10), HIV (High MOI:50, Low MOI:10), EIAV (High MOI:20, Low MOI:10), IN- (High
MOI:22, Low MOI:10). Un-Infected=negative control; MLV=Moloney murine leukaemia
virus; HIV=Human immunodeficiency virus; EIAV=Equine infectious anaemia virus; IN-,
Human immunodeficiency virus vector with mutated integrase=IN- This vector had a
GFP marker gene. SEM’s are derived from triplicate readings. High MOI=H, Low MOI=L
Cell Line MOI Percentage infection (+/- SEM)
MLV HIV EIAV IN-
MCF10A H 99 (1) 62 (8) 68 (4) 72 (3)
L 75 (5) 22 (5) 12 (4) 64 (4)
MRC5 H 100 (0) 21 (5) 43 (6) 22 (3)
L 37 (2) 8 (3) 14 (2) 15 (3)
AT5BIVA H 98 (2) 31 (2) 9 (5) 10 (5)
L 28 (5) 7 (0) 3 (3) 4 (7)
XP14BR H 98 (2) 44 (4) 27 (3) 5 (7)
L 88 (4) 8 (4) 11 (3) 2 (6)
RESULTS Chapter 4
104
Highest level infection for each vector was achieved at high MOI. 100% infection was
found on Mrc5 cells with the MLV vector at an MOI of 200 (Fig 14) in contrast to
negative controls. Mcf10a cells were infected at the highest level (99% +/-1) with MLV.
Lowest level of infection was found using the EIAV vector (12% +/-4) for this cell line
(Fig 13). Mrc5 level reached 8% (+/-3) using the HIV vector (Table 27). At5biva and
Xp14br cell lines showed highest levels of infection with the MLV vector at 98% (+/-2)
(Table 27).
Levels of infection using high or low MOI of the IN- vector were low for Mrc5, Atbiva
and Xp14br, however, levels of infection for Mcf10a cells infected with high MOI IN-
vector was 72% (+/-3) and 64% (+/- 4) with low MOI IN- vector.
The results obtained suggest the cell lines could be infected with RV and LV vectors
and that the highest infection was achieved using Mcf10a and Mrc5 cell lines. Next, cell
viability was tested on each cell line to determine the effects of virus infection on cell
survival.
4.1.2 Survival of cells following infection
Following infection cell survival assays were performed using the trypan blue assay.
Trypan blue staining of cells distinguishes between cells that are alive or dead. Cells
that are viable exclude the dye whereas dead cells do not and can be viewed by
microscopy. Cell viability assays were carried out on Mcf10a, Mrc5, At5biva and
Xp14br cell lines. Cells were infected with a range of retroviral vectors at high and low
MOI and percentages of viable cells were counted 0-5 days post infection.

RESULTS Chapter 4
105
Graphs showing percentage cell survival after infection with RV and LV at high MOI
Figure 18. Mcf10a and Mrc5 percentage cell survival following infection with RV and
LV at high MOI. Mcf10a cells that were either un-infected or irradiated show cell survival
levels between 95-100% over the 5-day period following infection. After infection with MLV,
HIV, EIAV, FIV and the MLV vector without the virus genome, cell viability decreased 24 to
48 hours post infection and then increased thereafter. Mrc5 cells showed similar survival to
Mcf10a cells post infection, however cells infection by the MLV vector 24 hours post infection
showed low cell viability (43%+/-5).
0
10
20
30
40
50
60
70
80
90
100
110
0 1 2 3 4 5
Via
bili
ty (
%)
Days Post-Infection
MCF10A
Un-Infected
IR
MLV
HIV
EIAV
FIV
-IN
Empty Vector
0
10
20
30
40
50
60
70
80
90
100
110
0 1 2 3 4 5
Via
bili
ty (
%)
Days Post-Infection
MRC5
Un-Infected
IR
MLV
HIV
EIAV
FIV
-IN
Empty Vector
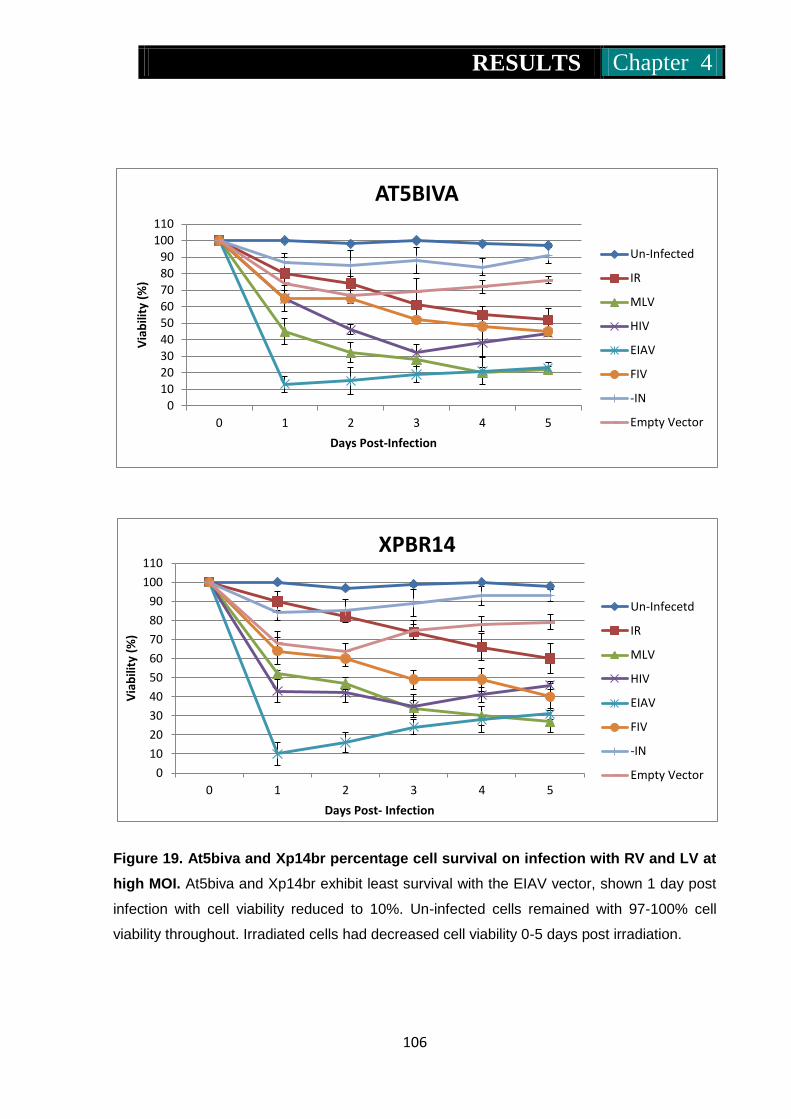
RESULTS Chapter 4
106
Figure 19. At5biva and Xp14br percentage cell survival on infection with RV and LV at
high MOI. At5biva and Xp14br exhibit least survival with the EIAV vector, shown 1 day post
infection with cell viability reduced to 10%. Un-infected cells remained with 97-100% cell
viability throughout. Irradiated cells had decreased cell viability 0-5 days post irradiation.
0 10 20 30 40 50 60 70 80 90
100 110
0 1 2 3 4 5
Via
bili
ty (
%)
Days Post-Infection
AT5BIVA
Un-Infected
IR
MLV
HIV
EIAV
FIV
-IN
Empty Vector
0
10
20
30
40
50
60
70
80
90
100
110
0 1 2 3 4 5
Via
bili
ty (
%)
Days Post- Infection
XPBR14
Un-Infecetd
IR
MLV
HIV
EIAV
FIV
-IN
Empty Vector
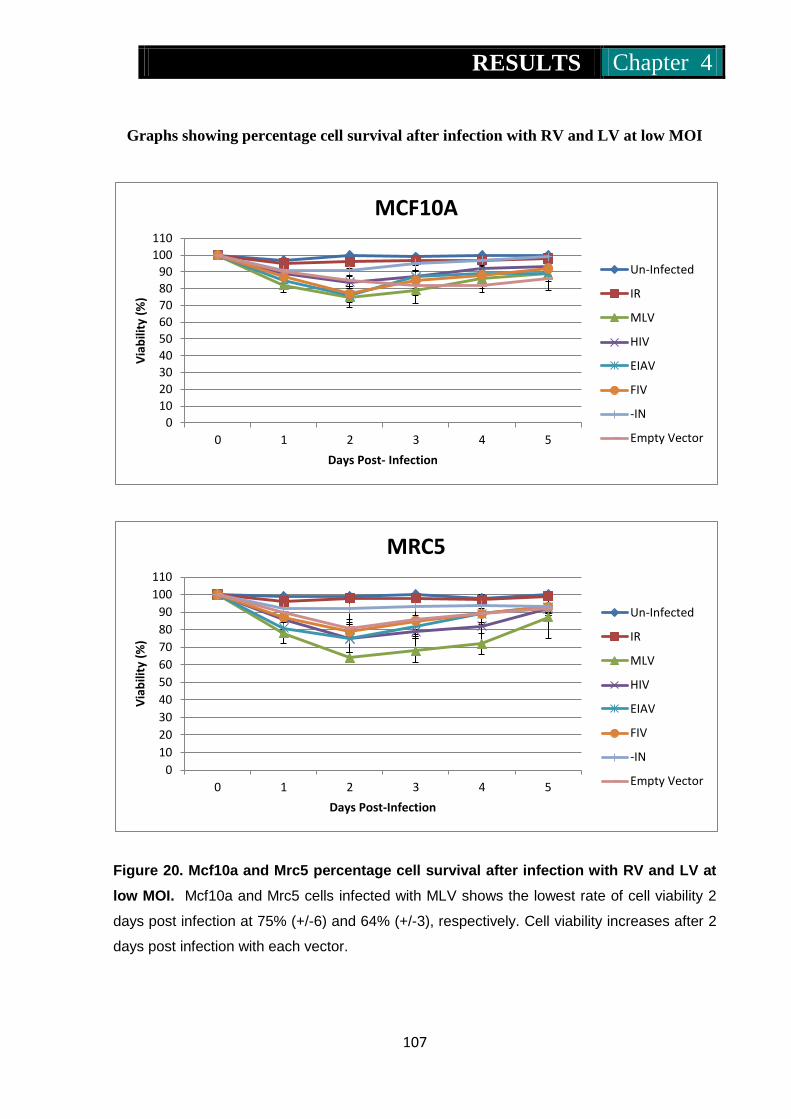
RESULTS Chapter 4
107
Graphs showing percentage cell survival after infection with RV and LV at low MOI
Figure 20. Mcf10a and Mrc5 percentage cell survival after infection with RV and LV at
low MOI. Mcf10a and Mrc5 cells infected with MLV shows the lowest rate of cell viability 2
days post infection at 75% (+/-6) and 64% (+/-3), respectively. Cell viability increases after 2
days post infection with each vector.
0
10
20
30
40
50
60
70
80
90
100
110
0 1 2 3 4 5
Via
bili
ty (
%)
Days Post- Infection
MCF10A
Un-Infected
IR
MLV
HIV
EIAV
FIV
-IN
Empty Vector
0
10
20
30
40
50
60
70
80
90
100
110
0 1 2 3 4 5
Via
bili
ty (
%)
Days Post-Infection
MRC5
Un-Infected
IR
MLV
HIV
EIAV
FIV
-IN
Empty Vector
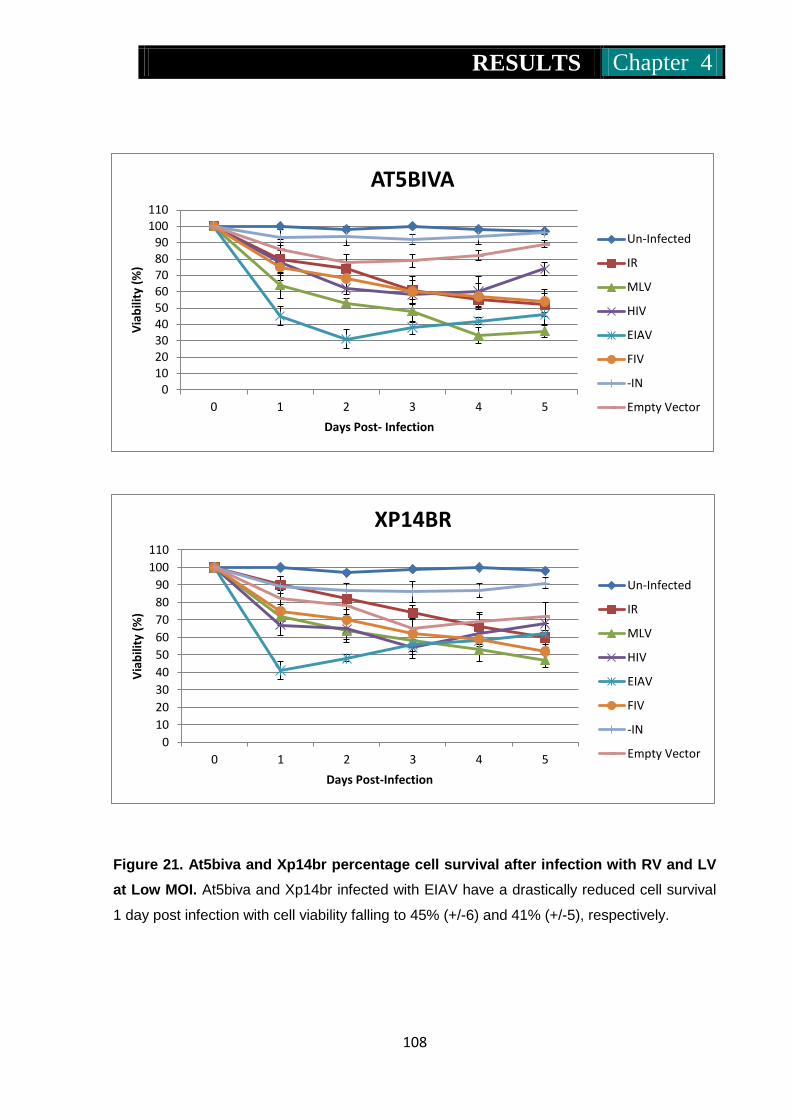
RESULTS Chapter 4
108
Figure 21. At5biva and Xp14br percentage cell survival after infection with RV and LV
at Low MOI. At5biva and Xp14br infected with EIAV have a drastically reduced cell survival
1 day post infection with cell viability falling to 45% (+/-6) and 41% (+/-5), respectively.
0 10 20 30 40 50 60 70 80 90
100 110
0 1 2 3 4 5
Via
bili
ty (
%)
Days Post- Infection
AT5BIVA
Un-Infected
IR
MLV
HIV
EIAV
FIV
-IN
Empty Vector
0
10
20
30
40
50
60
70
80
90
100
110
0 1 2 3 4 5
Via
bili
ty (
%)
Days Post-Infection
XP14BR
Un-Infected
IR
MLV
HIV
EIAV
FIV
-IN
Empty Vector
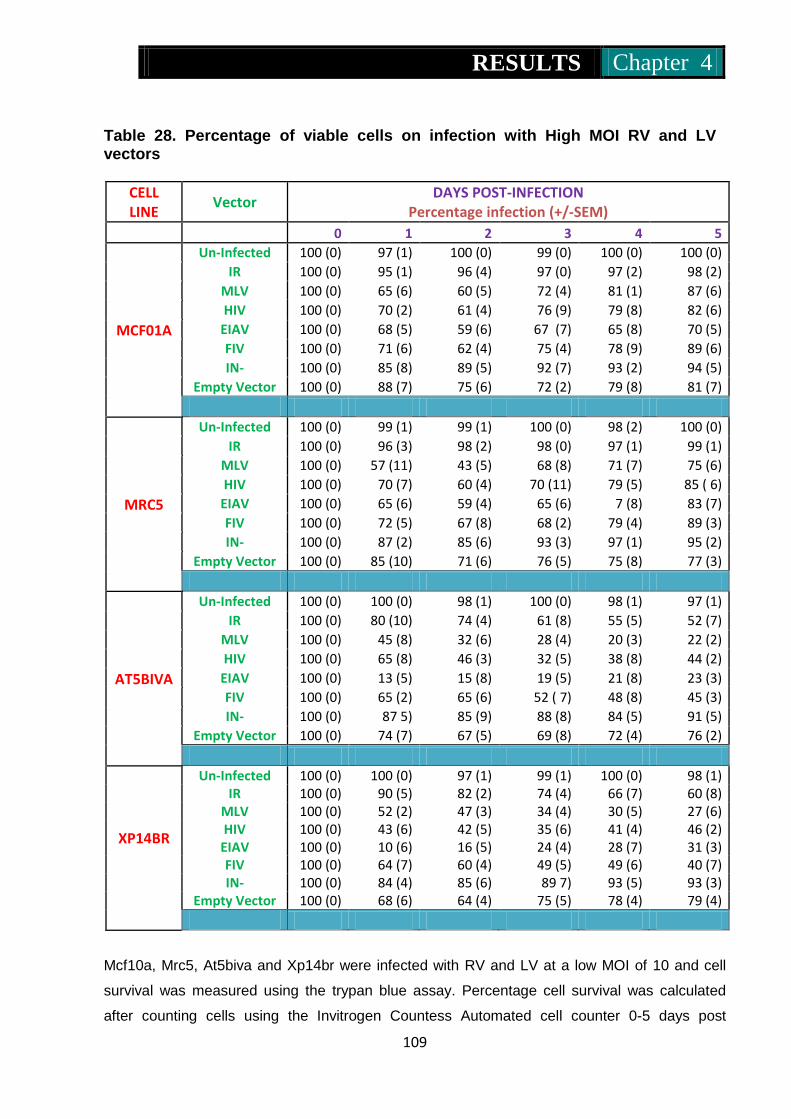
RESULTS Chapter 4
109
Table 28. Percentage of viable cells on infection with High MOI RV and LV vectors
CELL LINE
Vector DAYS POST-INFECTION
Percentage infection (+/-SEM)
0 1 2 3 4 5
MCF01A
Un-Infected 100 (0) 97 (1) 100 (0) 99 (0) 100 (0) 100 (0) IR 100 (0) 95 (1) 96 (4) 97 (0) 97 (2) 98 (2)
MLV 100 (0) 65 (6) 60 (5) 72 (4) 81 (1) 87 (6) HIV 100 (0) 70 (2) 61 (4) 76 (9) 79 (8) 82 (6)
EIAV 100 (0) 68 (5) 59 (6) 67 (7) 65 (8) 70 (5) FIV 100 (0) 71 (6) 62 (4) 75 (4) 78 (9) 89 (6) IN- 100 (0) 85 (8) 89 (5) 92 (7) 93 (2) 94 (5)
Empty Vector 100 (0) 88 (7) 75 (6) 72 (2) 79 (8) 81 (7)
MRC5
Un-Infected 100 (0) 99 (1) 99 (1) 100 (0) 98 (2) 100 (0) IR 100 (0) 96 (3) 98 (2) 98 (0) 97 (1) 99 (1)
MLV 100 (0) 57 (11) 43 (5) 68 (8) 71 (7) 75 (6) HIV 100 (0) 70 (7) 60 (4) 70 (11) 79 (5) 85 ( 6)
EIAV 100 (0) 65 (6) 59 (4) 65 (6) 7 (8) 83 (7) FIV 100 (0) 72 (5) 67 (8) 68 (2) 79 (4) 89 (3) IN- 100 (0) 87 (2) 85 (6) 93 (3) 97 (1) 95 (2)
Empty Vector 100 (0) 85 (10) 71 (6) 76 (5) 75 (8) 77 (3)
AT5BIVA
Un-Infected 100 (0) 100 (0) 98 (1) 100 (0) 98 (1) 97 (1) IR 100 (0) 80 (10) 74 (4) 61 (8) 55 (5) 52 (7)
MLV 100 (0) 45 (8) 32 (6) 28 (4) 20 (3) 22 (2) HIV 100 (0) 65 (8) 46 (3) 32 (5) 38 (8) 44 (2)
EIAV 100 (0) 13 (5) 15 (8) 19 (5) 21 (8) 23 (3) FIV 100 (0) 65 (2) 65 (6) 52 ( 7) 48 (8) 45 (3) IN- 100 (0) 87 5) 85 (9) 88 (8) 84 (5) 91 (5)
Empty Vector 100 (0) 74 (7) 67 (5) 69 (8) 72 (4) 76 (2)
XP14BR
Un-Infected 100 (0) 100 (0) 97 (1) 99 (1) 100 (0) 98 (1) IR 100 (0) 90 (5) 82 (2) 74 (4) 66 (7) 60 (8)
MLV 100 (0) 52 (2) 47 (3) 34 (4) 30 (5) 27 (6) HIV 100 (0) 43 (6) 42 (5) 35 (6) 41 (4) 46 (2)
EIAV 100 (0) 10 (6) 16 (5) 24 (4) 28 (7) 31 (3) FIV 100 (0) 64 (7) 60 (4) 49 (5) 49 (6) 40 (7) IN- 100 (0) 84 (4) 85 (6) 89 7) 93 (5) 93 (3)
Empty Vector 100 (0) 68 (6) 64 (4) 75 (5) 78 (4) 79 (4)
Mcf10a, Mrc5, At5biva and Xp14br were infected with RV and LV at a low MOI of 10 and cell
survival was measured using the trypan blue assay. Percentage cell survival was calculated
after counting cells using the Invitrogen Countess Automated cell counter 0-5 days post

RESULTS Chapter 4
110
infection. Negative controls were cultured in an identical manner to virus infected cells and mock
infected in the presence of 5µg/ml DEAE dextran. All infections used DEAE dextran at 5µg/ml.
24 hours after infection cells were re-fed with complete medium. All cell lines showed 100% cell
viability 0 days post infection. 24 hours post infection cell viability was significantly reduced.
Mcf10a, Mrc5, At5biva and Xp14br cells were infected at the maximum MOI allowed by virus
titre (high MOI). MLV (MOI 100), HIV (MOI 100), EIAV (MOI 100), IN- (MOI 22), FIV (MOI 100)
and empty Vector (MOI estimated at 100). Un-Infected cells were treated as negative control;
IR=Irradiated (1Gy); MLV=Moloney murine leukaemia virus; HIV=Human immunodeficiency
virus; EIAV=Equine infectious anaemia virus; IN-=Human immunodeficiency virus with mutated
integrase; FIV=Feline immunodeficiency virus; Empty Vector=MLV without viral genome.

RESULTS Chapter 4
111
Table 29. Percentage of viable cells following infection with RV and LV at low MOI
Mcf10a, Mrc5, At5biva and Xp14br cells were infected with RV and LV at a low MOI of 10 and
the percentage cell survival was measured using the trypan blue assay followed by counting
using an Invitrogen Countess Automated cell counter at 0-5 days post infection. Negative
controls were cultured in an identical manner to virally infected cells and mock infected in the
presence of 5µg/ml DEAE dextran. All infections were performed with DEAE dextran at
5µg/ml. 24 hours after infection cells were re-fed with complete medium. All cell lines showed
100% cell viability at day 0 post infection. 24 hours post infection cell viability appeared
reduced.
CELL LINE
Vector DAYS POST-INFECTION
Percentage Survival (SEM +/-) post infection
0 1 2 3 4 5
MCF01A
MLV 100 (0) 82 (4) 75 (6) 79 (8) 86 (6) 89 (2)
HIV 100 (0) 89 (6) 84 (3) 87 (3) 92 (6) 93 (5)
EIAV 100 (0) 85 (4) 76 (4) 87 (7) 89 (4) 89 (3)
FIV 100 (0) 87 (6) 77 (4) 85 (6) 88 (2) 92 (8)
IN- 100 (0) 91 (5) 91 (3) 95 (4) 97 (3) 99 (1)
Empty Vector 100 (0) 90 (3) 85 (5) 82 (6) 82 (4) 86 (7)
MRC5
MLV 100 (0) 78 (6) 64 (3) 68 (7) 72 (6) 87 (12)
HIV 100 (0) 86 (6) 75 (8) 79 (3) 82 (10) 92 (3)
EIAV 100 (0) 81 (5) 75 (8) 82 (2) 89 (6) 93 (4)
FIV 100 (0) 87 (9) 79 (2) 85 (8) 89 (7) 93 (5)
IN- 100 (0) 92 (3) 92 (8) 93 (5) 94 (5) 93 (5)
Empty Vector 100 (0) 90 (4) 81 (5) 86 (11) 89 (5) 92 (2)
AT5BIVA
MLV 100 (0) 64 (8) 53 (3) 48 (7) 33 (5) 36 (4)
HIV 100 (0) 78 (7) 62 (4) 58 (6) 60 (9) 74 (4)
EIAV 100 (0) 45 (6) 31 (6) 38 (4) 42 (2) 46 (7)
FIV 100 (0) 75 (8) 68 (6) 60 (7) 57 (8) 54 (7)
IN- 100 (0) 93 (5) 94 (6) 92 (3) 94 (5) 96 (1)
Empty Vector 100 (0) 86 (6) 78 (5) 79 ( 4) 82 (3) 89 (2)
XP14BR
MLV 100 (0) 72 (5) 64 (5) 58 (6) 53 (7) 47 (4)
HIV 100 (0) 67 (6) 65 (8) 54 ( 4) 62 (7) 68 (4)
EIAV 100 (0) 41 (5) 48 (2) 56 (8) 58 (7) 62 (6)
FIV 100 (0) 75 (4) 70 (6) 62 (3) 59 (3) 52 (2)
IN- 100 (0) 89 6) 87 (4) 86 (6) 87 (4) 91 (3)
Empty Vector 100 (0) 82 (5) 78 (9) 65 (6) 69 (5) 72 (8)

RESULTS Chapter 4
112
Un-infected Mcf10a and Mrc5 cells survival throughout the 5 day duration of cell
culturing was 97-100%. Irradiated (1Gy) Mcf10a and Mrc5 cell viability did not show a
large change in cell survival, however, the percentage of viable cells decreased slightly
after 24 hours post infection after which time cells appeared to recover possibly as a
result of DNA damage repair as cell viability increased to 98% (SEM +/- 2) and 99%
(+/-1) by day 5, respectively. Mcf10a and Mrc5 cells infected with MLV showed the
lowest rate of cell viability at 2 days post infection of 60% (+/-5) and 43% (+/-5),
respectively. Interestingly, cell infected with the HIV vector containing a mutated
integrase showed a similar pattern to that of the irradiated cell lines although the
percentage viable cells were slightly lower than the irradiated cells.
Irradiated (1Gy) At5biva and Xp14br cell viability decreased initially to 80% (+/-10)
and 90% (+/-5), respectively, then further decreased to 52% (+/-7) and 60% (+/-8),
respectively, 5 days post irradiation. Using the EIAV vector at high MOI to infect
At5biva and Xp14br the lowest level of viable cells was observed at 13% (+/-5) and
10% (+/-6), respectively.
The results obtained show percentage cells with intact DNA repair pathways have
decreased cell survival upon infection with RV and LV vectors 2 days post infection
after which cells appear to recover possibly due to DNA repair. Atbiva and Xp14br
cells without DNA repair pathways intact showed cell viability to decrease throughout
the 5 days.
Following the findings described, cells were next investigated to identify DSB in their
genomes following infection by each vector to attempt to correlate cell survival with
DNA damage.
RESULTS Chapter 4
113
4.1.3 The effect of infection by RV and LV on DNA DSB
DNA damage is known to cause chromosomal instability that can lead to tumour
induction. The extent of DSB caused by integrating RV and LV is not clearly defined. It
was necessary, therefore to investigate this for each vector and demonstrate proviral
integration as a major assault on the genome of the cell and whether this varies between
different vectors. DNA damage on the cell has already been shown following irradiation
or by the use of genotoxic drugs. DNA damage has been shown following integration
by the laboratory of F. Bushman using HIV-1 derived LV. The Bushman group
demonstrated a rapid DDR was measurable using γH2AX immunofluorescence to
identify DSB foci at the sites of DNA damage (Bushman et al., 2001). In the following
work, to measure the extent of DNA damage on the genome by several RV and LV,
cells were infected and immunofluorescence of the DNA damage/repair protein 53BP1
was used for measuring induction of foci representing DSB. 53BP1 was used as an
alternative to gH2AX because this protein is important in signalling pathways of DNA
repair as well as apoptosis. For this purpose, a number of cell lines were tested with and
without intact repair pathways followed by 53BP1 immunofluorescence.
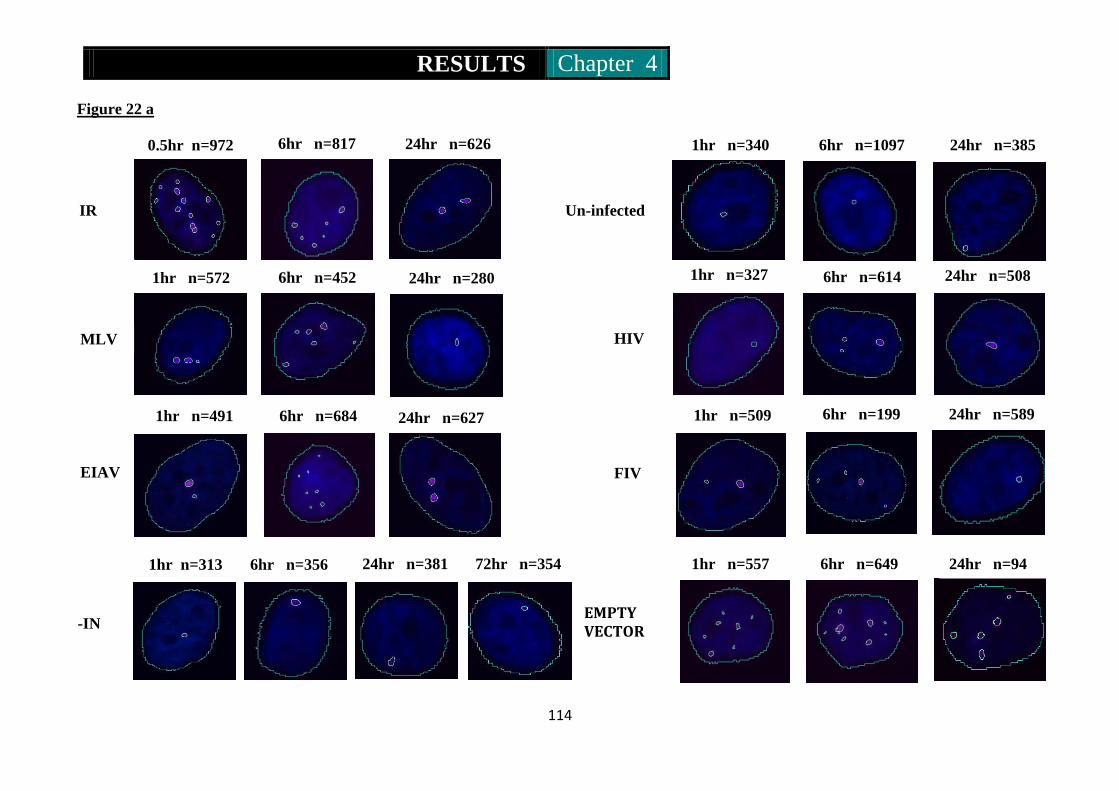
RESULTS Chapter 4
114
Figure 22 a
IR Un-infected
1hr n=340
0.5hr n=972
6hr n=817
0.5hr n=972
6hr n=1097
0.5hr n=972
24hr n=385
0.5hr n=972
MLV HIV
1hr n=572 6hr n=452 1hr n=327
0.5hr n=972
24hr n=280
0.5hr n=972
6hr n=614
0.5hr n=972
24hr n=508
0.5hr n=972
EIAV FIV
EMPTY VECTOR -IN
1hr n=491 6hr n=684 1hr n=509
0.5hr n=972
24hr n=627
0.5hr n=972
6hr n=199
0.5hr n=972
24hr n=589
0.5hr n=972
1hr n=313 6hr n=356 1hr n=557
0.5hr n=972
24hr n=381
0.5hr n=972
6hr n=649
0.5hr n=972
24hr n=94
0.5hr n=972
72hr n=354
0.5hr n=972
24hr n=626
0.5hr n=972
0.5hr n=972
0.5hr n=972
0.5hr
n=972 6hr n=817
1hr n=729
0.5hr n=972
6hr n=285
0.5hr n=972
24hr n=536
0.5hr n=972
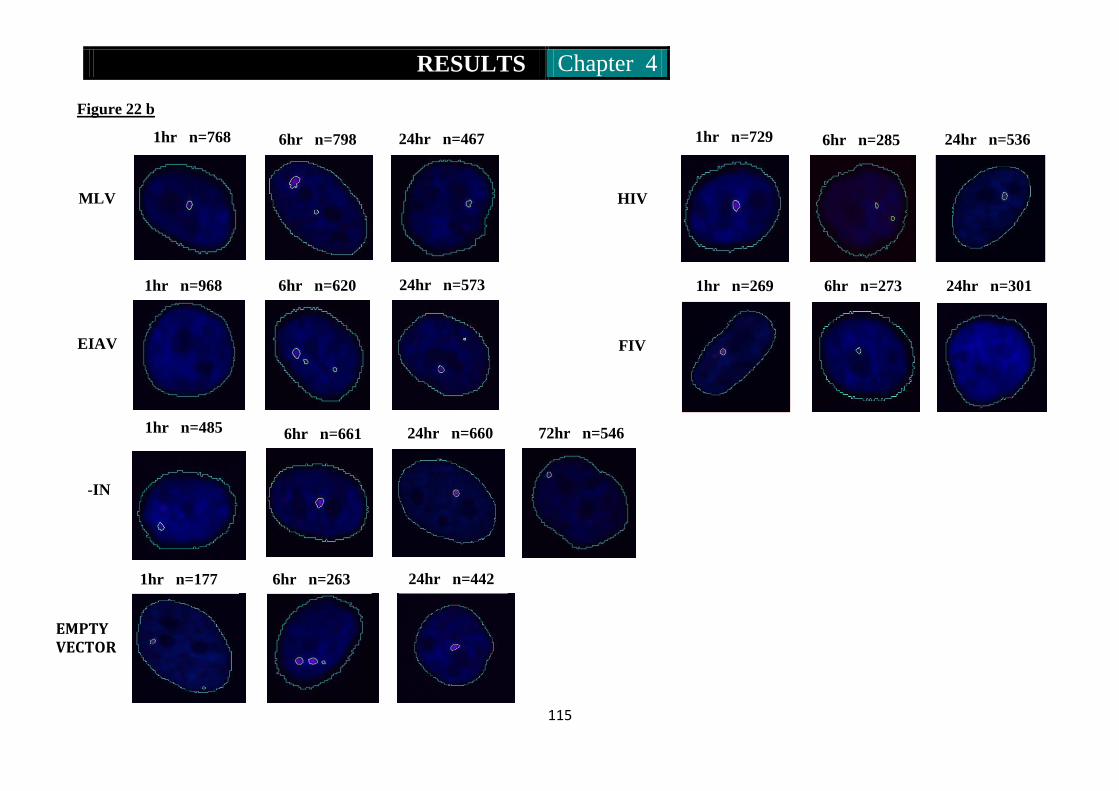
RESULTS Chapter 4
115
Figure 22 b
1hr n=768 6hr n=798 24hr n=467
0.5hr n=972
1hr n=968 6hr n=620 1hr n=269
0.5hr n=972
24hr n=573
0.5hr n=972
6hr n=273
0.5hr n=972
24hr n=301
0.5hr n=972
1hr n=485 6hr n=661 24hr n=660
0.5hr n=972
72hr n=546
0.5hr n=972
1hr n=177
0.5hr n=972
6hr n=263
0.5hr n=972
24hr n=442
0.5hr n=972
MLV HIV
EIAV
-IN
FIV
EMPTY VECTOR
1hr n=729 6hr n=285
EMPTY VECTOR
24hr n=536

RESULTS Chapter 4
116
Figure 22a and b. Photomicrographs of immunofluorescence of 53BP1 in MCF10a cells infected by RV and LV at high and low MOI. A
DNA damage response (DDR) is evident for each vector tested. Control positive cells were irradiated at 1Gy. Negative controls were cultured in
an identical manner to virus infected cells and mock infected in the presence of 5µg/ml DEAE dextran. All infections used DEAE dextran at
5µg/ml. Following irradiation the DDR increases followed by repair over a 6 hour period. RV and LV infection generates foci over a 6 hour
period believed to be the time required for infection and integration to occur. This is then followed by DDR. Where no viral integrase (-IN) is
present no DDR appears, however where the vector is present but no genome DDR occurs and shown by the presence of 53BP1 foci. The
number of nuclei counted is indicated.
IR=irradiated; NC=negative control; MLV=Moloney murine leukaemia virus; HIV=Human immunodeficiency virus; -IN=Human
immunodeficiency virus with mutated integrase; EIAV=Equine infectious anaemia virus; FIV=Feline immunodeficiency virus; Empty
Vector=MLV without viral genome. Photomicrographs are shown for Mcf10a cells infected with MLV at high MOI of 200 and low MOI of 10, HIV
high MOI of 50 and low MOI of 10, EIAV at high MOI of 20 and low MOI of 10, IN- at high MOI of 22 and low MOI of 10, FIV at high MOI of 10
and low MOI of 10, Empty Vector at high MOI of 200 and low MOI of 10, IR was performed using 1Gy. Images were viewed using the Zeiss
Axioplan 2 Imaging microscope and images were captured using the Metafer4 software. Images were then processed using the Definiens
programme.

RESULTS Chapter 4
117
Figure 23a. Mcf10a
0
0.2
0.4
0.6
0.8
1 hour 6 hour 24 hour
Nu
mb
er
of
Foci
/ C
ell
Time (hours)
Un-Infected
0
5
10
15
0.5 hour 6 hour 24 hour
Nu
mb
er
of
Foci
/ C
ell
Time (hours)
IR
0
1
2
3
4
5
6
1 hour 6 hour 24 hour
Nu
mb
er
of
Foci
/ C
ell
Time (hours)
MLV
0
0.5
1
1.5
2
2.5
3
1 hour 6 hour 24 hour
Nu
mb
er
of
Foci
/ C
ell
Time (hours)
HIV
0
2
4
6
8
10
1 hour 6 hour 24 hour
Nu
mb
er
of
Foci
/ C
ell
Time (hours)
EIAV
0
1
2
3
4
5
1 hour 6 hour 24 hour
Nu
mb
er
of
Foci
/ C
ell
Time (hours)
FIV
0
0.4
0.8
1.2
1.6
2
1 hour 6 hour 24 hour 72 hour
Nu
mb
er
of
Foci
/ C
ell
Time (hours)
-IN
0
2
4
6
8
10
1 hour 6 hour 24 hour
Nu
mb
er
of
Foci
/ C
ell
Time (hours)
Empty Vector
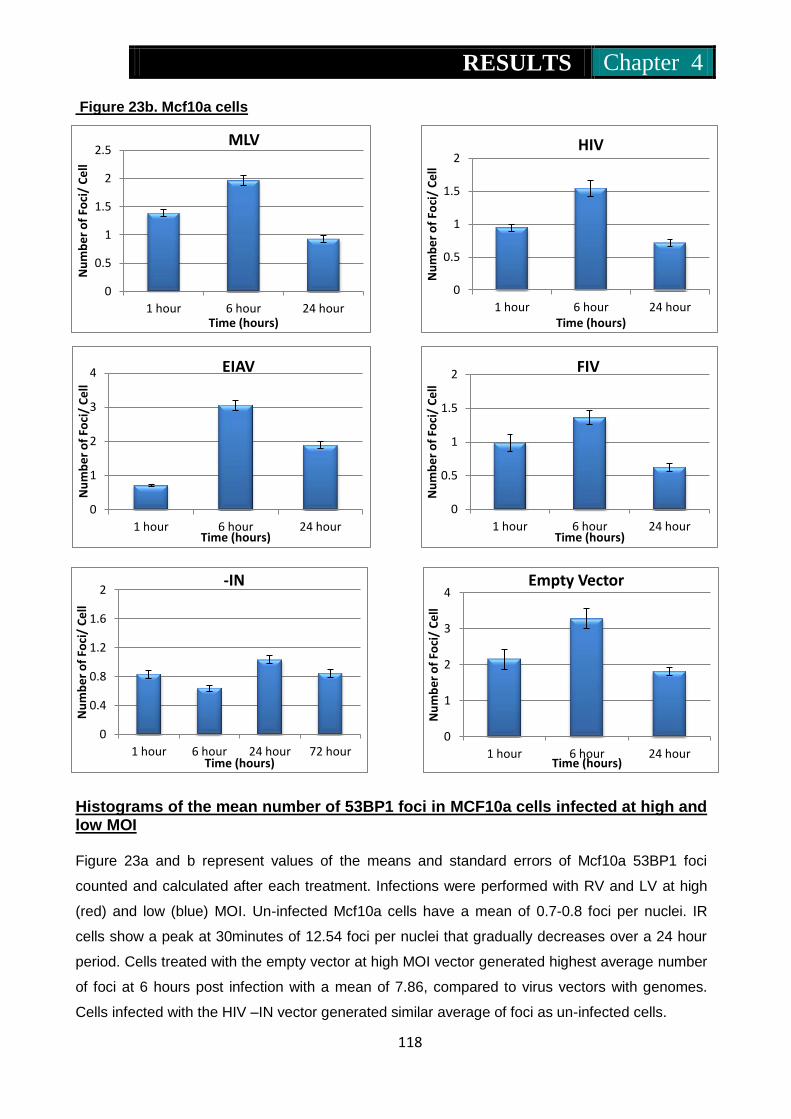
RESULTS Chapter 4
118
Figure 23b. Mcf10a cells
Histograms of the mean number of 53BP1 foci in MCF10a cells infected at high and low MOI Figure 23a and b represent values of the means and standard errors of Mcf10a 53BP1 foci
counted and calculated after each treatment. Infections were performed with RV and LV at high
(red) and low (blue) MOI. Un-infected Mcf10a cells have a mean of 0.7-0.8 foci per nuclei. IR
cells show a peak at 30minutes of 12.54 foci per nuclei that gradually decreases over a 24 hour
period. Cells treated with the empty vector at high MOI vector generated highest average number
of foci at 6 hours post infection with a mean of 7.86, compared to virus vectors with genomes.
Cells infected with the HIV –IN vector generated similar average of foci as un-infected cells.
0
0.5
1
1.5
2
2.5
1 hour 6 hour 24 hour
Nu
mb
er
of
Foci
/ C
ell
Time (hours)
MLV
0
0.5
1
1.5
2
1 hour 6 hour 24 hour
Nu
mb
er
of
Foci
/ C
ell
Time (hours)
HIV
0
1
2
3
4
1 hour 6 hour 24 hour
Nu
mb
er
of
Foci
/ C
ell
Time (hours)
EIAV
0
0.5
1
1.5
2
1 hour 6 hour 24 hour
Nu
mb
er
of
Foci
/ C
ell
Time (hours)
FIV
0
0.4
0.8
1.2
1.6
2
1 hour 6 hour 24 hour 72 hour
Nu
mb
er
of
Foci
/ C
ell
Time (hours)
-IN
0
1
2
3
4
1 hour 6 hour 24 hour
Nu
mb
er
of
Foci
/ C
ell
Time (hours)
Empty Vector

RESULTS Chapter 4
119
Table 30a. Mean number of DSB foci in Mcf10a nuclei at high MOI
Treatment Time (hours)
1 6 24 72
Un-infected
MEAN (+/- SEM) 0.80 (0.04) 0.72 (0.04) 0.71 (0.05)
p-value 0.15 0.06
No of nuclei 972 817 626
IR MEAN (+/- SEM) 12.54 (0.40) 6.32 (0.19) 2.34 (0.12) p-value 6.52E-10 8.80E-38 No of nuclei 340 1092 385
MLV MEAN (+/- SEM) 3.52 (0.16) 5.40 (0.25) 1.44 (0.11) p-value 1.61E-08 7.75E-27
No of nuclei 572 452 280
HIV MEAN (+/- SEM) 0.95 (0.10) 2.62 (0.12) 1.52 (0.08) p-value 4.09E-13 4.31E-12 No of nuclei 327 614 508
EIAV MEAN (+/- SEM) 2.40 (0.17) 7.62 (0.27) 2.17 (0.16) p-value 3.63E-46 4.12E-57 No of nuclei 491 684 627
FIV MEAN (+/- SEM) 2.60 (0.15) 4.32 (0.32) 1.03 (0.07) p-value 4.42E-08 6.98E-16 No of nuclei 509 199 589
IN- MEAN (+/- SEM) 1.12 (0.12) 0.82 (0.07) 1.13 (0.11) 0.84 (0.07) p-value 0.03 0.01 0.03
No of nuclei 313 356 381 354
Empty Vector
MEAN (+/- SEM) 7.17 (0.29) 7.86 (0.28) 4.54 (0.48)
p-value 0.01 5.80E-05
No of nuclei 557 649 94

RESULTS Chapter 4
120
Table 30b. Mean number of DSB foci in Mcf10a nuclei at low MOI
MCF10a cells exposed to RV and LV vectors at high and low MOI are shown in table 30a
and b above. The DNA damage response (DDR) was measured using 53BP1
immunoflourescence. Control positive cells were irradiated at 1Gy. Negative controls were
cultured in an identical manner to virus infected cells and mock infected in the presence of
5µg/ml DEAE dextran. All infections used DEAE dextran at 5µg/ml. Following irradiation
the DDR increases followed by repair over a 6 hour period. RV and LV infection appeared
to occur over an approximate 6 hour period where a peak in the mean number of 53bp1
foci was observed. This is then followed by a reduction in foci believed due to DDR. All
infected cells appear to show DDR. Where no viral integrase is present no DDR appears,
however where the MLV vector is present with no genome DDR occurs. Calculated mean
values, p-values obtained from standard t-test and no of nuclei counted are shown in the
table.
Treatment Time (hours)
1 6 24 72
MLV MEAN (+/- SEM) 1.39 (0.07) 1.96 (0.09) 0.93 (0.06)
p-value 2.16E-05 1.37E-09
No of nuclei 768 798 467
HIV MEAN (+/- SEM) 0.95 (0.05) 1.54 (0.12) 0.72 (0.05) p-value 5.75E-09 2.33E-08 No of nuclei 729 285 536
EIAV MEAN (+/- SEM) 0.71 (0.04) 3.05 (0.13) 1.88 (0.10) p-value 7.42E-50 2.08E-09 No of nuclei 968 620 573
FIV MEAN (+/- SEM) 0.99 (0.12) 1.36 (0.10) 0.62 (0.06) p-value 0.01 3.41E-09 No of nuclei 269 273 301
IN- MEAN (+/- SEM) 0.83 (0.06) 0.64 (0.04) 1.03 (0.06) 0.84 (0.06) p-value 0.00 4.01E-08 0.00 No of nuclei 485 661 660 546
Empty Vector
MEAN (+/- SEM) 2.15 (0.28) 3.28 (0.29) 1.81 (0.11) p-value 0.03 1.19E-05 No of nuclei 177 263 442

RESULTS Chapter 4
121
0
0.4
0.8
1.2
1.6
2
2.4
2.8
1 hour 6 hour 24 hour
Nu
mb
er
of
Foci
/ C
ell
Time (hours)
Un-Infected
0
2
4
6
8
0.5 hour 6 hour 24 hour
Nu
mb
er
of
Foci
/ C
ell
Time (hours)
IR
0
2
4
6
8
10
12
14
1 hour 6 hour 24 hour
Nu
mb
er
of
Foci
/ C
ell
Time (hours)
MLV
0
2
4
6
8
10
1 hour 6 hour 24 hour
Nu
mb
er
of
Foci
/ C
ell
Time (hours)
HIV
0
2
4
6
8
10
1 hour 6 hour 24 hour
Nu
mb
er
of
Foci
/ C
ell
Time (hours)
EIAV
0
2
4
6
8
1 hour 6 hour 24 hour
Nu
mb
er
of
Foci
/ C
ell
Time (hours)
FIV
0
1
2
3
4
5
6
7
8
1 hour 6 hour 24 hour 72 hour
Nu
mb
er
of
Foci
/ C
ell
Time (hours)
-IN
0
2
4
6
8
10
1 hour 6 hour 24 hour
Nu
mb
er
of
Foci
/ C
ell
Time (hours)
Empty Vector
Figure 24a. Mrc5 cells
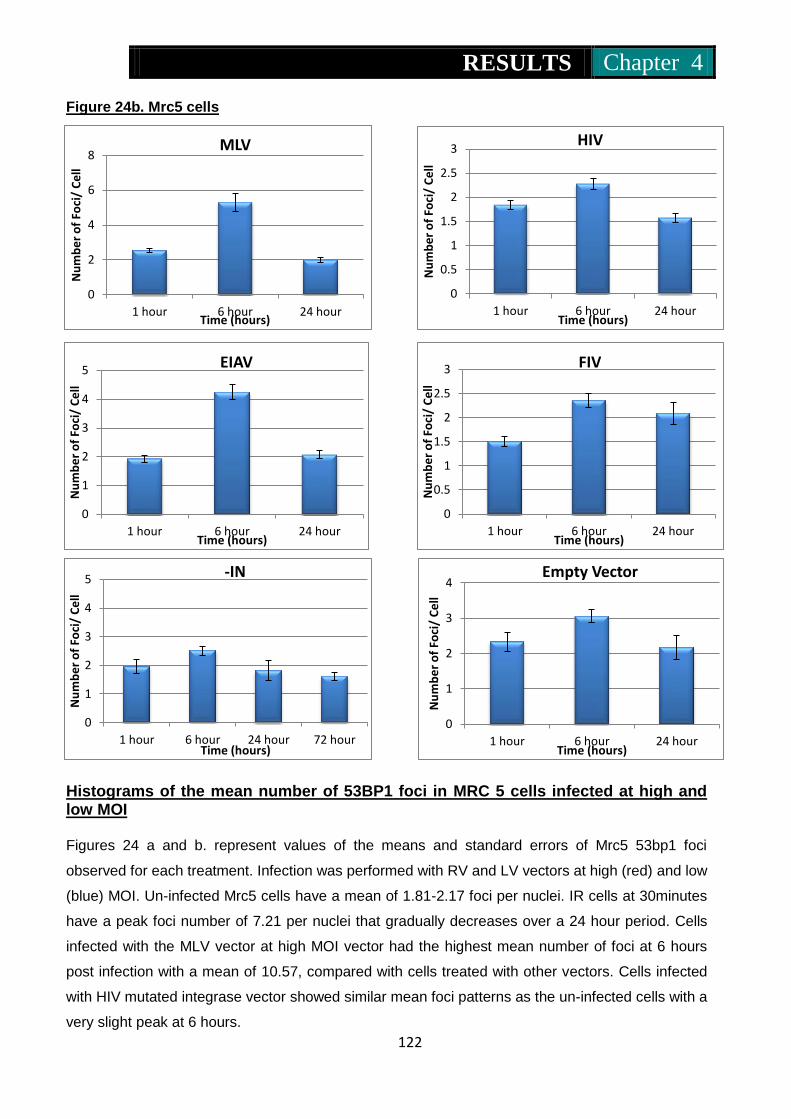
RESULTS Chapter 4
122
0
1
2
3
4
1 hour 6 hour 24 hour
Nu
mb
er
of
Foci
/ C
ell
Time (hours)
Empty Vector
Figure 24b. Mrc5 cells
Histograms of the mean number of 53BP1 foci in MRC 5 cells infected at high and low MOI Figures 24 a and b. represent values of the means and standard errors of Mrc5 53bp1 foci
observed for each treatment. Infection was performed with RV and LV vectors at high (red) and low
(blue) MOI. Un-infected Mrc5 cells have a mean of 1.81-2.17 foci per nuclei. IR cells at 30minutes
have a peak foci number of 7.21 per nuclei that gradually decreases over a 24 hour period. Cells
infected with the MLV vector at high MOI vector had the highest mean number of foci at 6 hours
post infection with a mean of 10.57, compared with cells treated with other vectors. Cells infected
with HIV mutated integrase vector showed similar mean foci patterns as the un-infected cells with a
very slight peak at 6 hours.
0
0.5
1
1.5
2
2.5
3
1 hour 6 hour 24 hour
Nu
mb
er
of
Foci
/ C
ell
Time (hours)
FIV
0
2
4
6
8
1 hour 6 hour 24 hour
Nu
mb
er
of
Foci
/ C
ell
Time (hours)
MLV
0
1
2
3
4
5
1 hour 6 hour 24 hour 72 hour
Nu
mb
er
of
Foci
/ C
ell
Time (hours)
-IN
0
0.5
1
1.5
2
2.5
3
1 hour 6 hour 24 hour
Nu
mb
er
of
Foci
/ C
ell
Time (hours)
HIV
0
1
2
3
4
5
1 hour 6 hour 24 hour
Nu
mb
er
of
Foci
/ C
ell
Time (hours)
EIAV
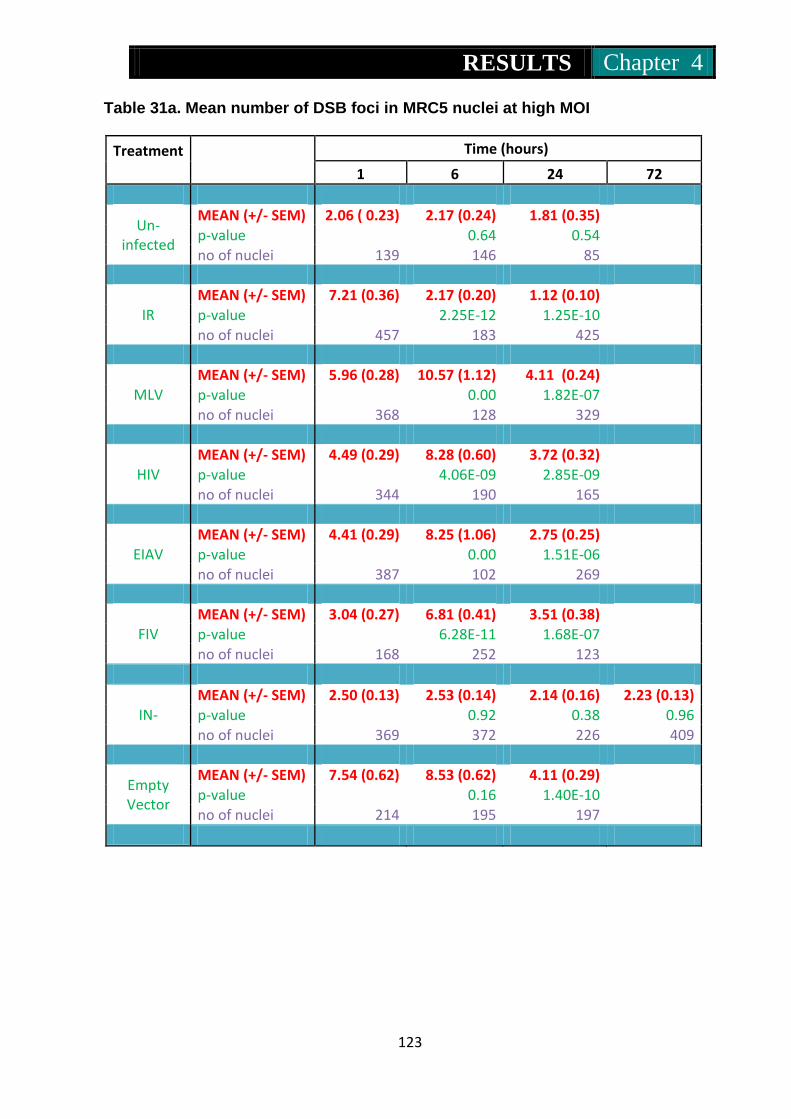
RESULTS Chapter 4
123
Table 31a. Mean number of DSB foci in MRC5 nuclei at high MOI
Treatment Time (hours)
1 6 24 72
Un-infected
MEAN (+/- SEM) 2.06 ( 0.23) 2.17 (0.24) 1.81 (0.35) p-value 0.64 0.54 no of nuclei 139 146 85
IR MEAN (+/- SEM) 7.21 (0.36) 2.17 (0.20) 1.12 (0.10)
p-value 2.25E-12 1.25E-10 no of nuclei 457 183 425
MLV MEAN (+/- SEM) 5.96 (0.28) 10.57 (1.12) 4.11 (0.24) p-value 0.00 1.82E-07 no of nuclei 368 128 329
HIV MEAN (+/- SEM) 4.49 (0.29) 8.28 (0.60) 3.72 (0.32) p-value 4.06E-09 2.85E-09 no of nuclei 344 190 165
EIAV MEAN (+/- SEM) 4.41 (0.29) 8.25 (1.06) 2.75 (0.25) p-value 0.00 1.51E-06 no of nuclei 387 102 269
FIV MEAN (+/- SEM) 3.04 (0.27) 6.81 (0.41) 3.51 (0.38) p-value 6.28E-11 1.68E-07 no of nuclei 168 252 123
IN- MEAN (+/- SEM) 2.50 (0.13) 2.53 (0.14) 2.14 (0.16) 2.23 (0.13) p-value 0.92 0.38 0.96 no of nuclei 369 372 226 409
Empty Vector
MEAN (+/- SEM) 7.54 (0.62) 8.53 (0.62) 4.11 (0.29) p-value 0.16 1.40E-10 no of nuclei 214 195 197

RESULTS Chapter 4
124
Table 31b. Mean number of DSB foci in MRC5 nuclei at low MOI
Treatment Time (hours)
1 6 24 72
MLV MEAN (+/- SEM) 2.53 (0.11) 5.30 (0.51) 1.99 (0.13) p-value 2.64E-07 4.09E-09 no of nuclei 605 347 373
HIV MEAN (+/- SEM) 1.84 (0.10) 2.27 (0.12) 1.57 (0.09) p-value 0.05 3.49E-06 no of nuclei 549 513 531
EIAV MEAN (+/- SEM) 1.92 (0.11) 4.25 (0.27) 2.06 (0.14) p-value 1.04E-14 1.83E-12 no of nuclei 578 434 543
FIV MEAN (+/- SEM) 1.51 (0.11) 2.36 (0.15) 2.09 (0.22) p-value 0.01 0.03 no of nuclei 458 580 212
IN- MEAN (+/- SEM) 1.96 (0.23) 2.51 (0.16) 1.81 (0.35) 1.61 (0.14) p-value 0.01 0.01 0.20 no of nuclei 75 335 85 323
Empty Vector
MEAN (+/- SEM) 2.34 (0.27) 3.05 (0.18) 2.17 (0.35) p-value 0.00 0.00 no of nuclei 177 297 104
Mrc5 cells exposed to RV and LV vectors at high and low MOI are shown in table 31a and
b.The DNA damage response (DDR) was measured using 53BP1 immuno-flourescence.
Control positive cells were irradiated at 1Gy. Negative controls were cultured in an identical
manner to virally infected cells and mock infected in the presence of 5µg/ml DEAE dextran.
All infections used DEAE dextran at 5µg/ml. Following irradiation the DDR increases followed
by repair over a 6 hour period. RV and LV infection appeared to occur over an approximate 6
hour period where a peak in the mean number of 53bp1 foci was observed. This is then
followed by a reduction in foci believed due to DDR. All infected cells appear to show DDR.
Where no viral integrase is present no DDR appears, however where the MLV vector is
present with no genome DDR occurs. Calculated mean values, p-values obtained from
standard t-test and number of nuclei counted are shown in the table.
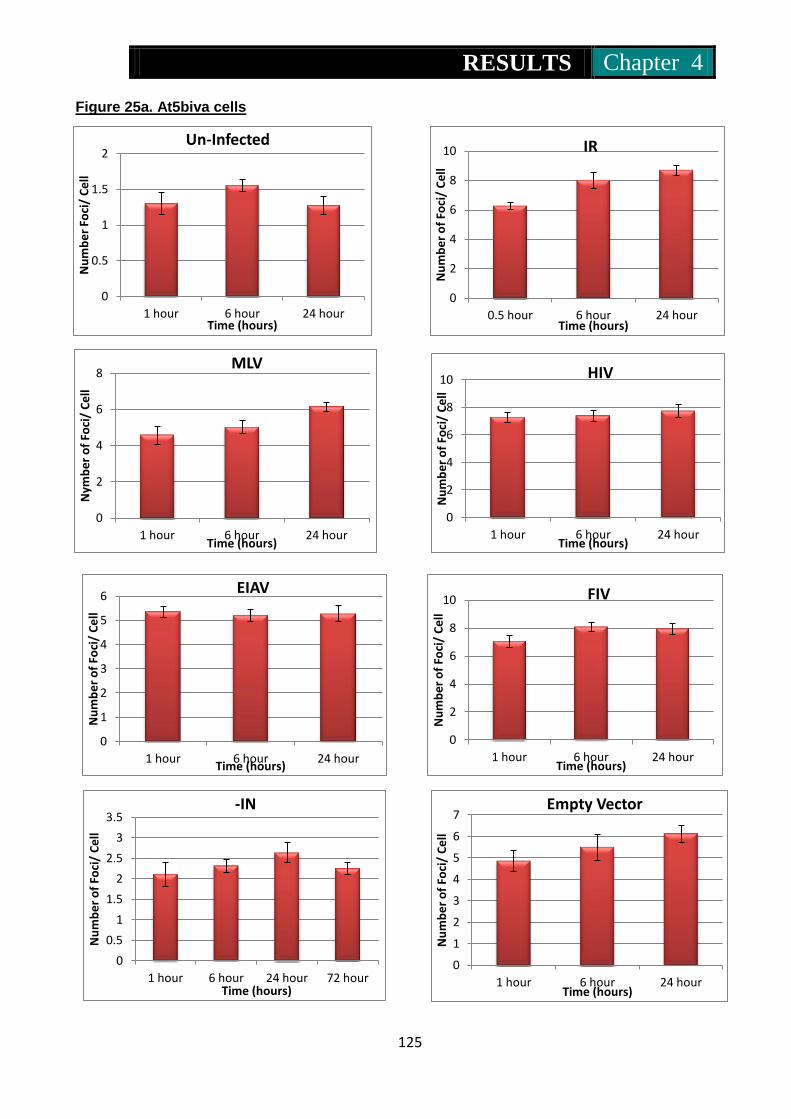
RESULTS Chapter 4
125
0
2
4
6
8
1 hour 6 hour 24 hour
Nym
be
r o
f Fo
ci/
Ce
ll
Time (hours)
MLV
Figure 25a. At5biva cells
0
0.5
1
1.5
2
1 hour 6 hour 24 hour
Nu
mb
er
Foci
/ C
ell
Time (hours)
Un-Infected
0
2
4
6
8
10
0.5 hour 6 hour 24 hour
Nu
mb
er
of
Foci
/ C
ell
Time (hours)
IR
0
2
4
6
8
10
1 hour 6 hour 24 hour
Nu
mb
er
of
Foci
/ C
ell
Time (hours)
HIV
0
1
2
3
4
5
6
1 hour 6 hour 24 hour
Nu
mb
er
of
Foci
/ C
ell
Time (hours)
EIAV
0
2
4
6
8
10
1 hour 6 hour 24 hour
Nu
mb
er
of
Foci
/ C
ell
Time (hours)
FIV
0
0.5
1
1.5
2
2.5
3
3.5
1 hour 6 hour 24 hour 72 hour
Nu
mb
er
of
Foci
/ C
ell
Time (hours)
-IN
0
1
2
3
4
5
6
7
1 hour 6 hour 24 hour
Nu
mb
er
of
Foci
/ C
ell
Time (hours)
Empty Vector

RESULTS Chapter 4
126
Figure 25b. At5biva cells
Histograms of the mean number of 53BP1 foci in At5biva cells infected at high and low MOI Figures 25a and b represent values of the means and standard errors of At5biva 53bp1 foci
observed for each treatment. Infection was performed with RV and LV vectors at high (red) and low
(blue) MOI’s. This cell line is repair deficient. Un-infected cells show a mean number of foci of
1.28-1.56 per nuclei. IR cells show foci number that increases up to the 24 hour period of
measurement at 8.70 foci per nucleus.
0
0.5
1
1.5
2
2.5
3
3.5
1 hour 6 hour 24 hour
Nu
mb
er
of
Foci
/ C
ell
Time (hours)
Empty Vector
0
0.5
1
1.5
2
2.5
1 hour 6 hour 24 hour 72 hour
Nu
mb
er
of
Foci
/ C
ell
Time (hours)
-IN
0
1
2
3
4
1 hour 6 hour 24 hour
Nu
mb
er
of
Foci
/ C
ell
Time (hours)
MLV
0
1
2
3
4
5
1 hour 6 hour 24 hour
Nu
mb
er
of
Foci
/ C
ell
Time (hours)
HIV
0
0.5
1
1.5
2
2.5
3
1 hour 6 hour 24 hour
Nu
mb
er
of
Foci
/ C
ell
Time (hours)
EIAV
0
1
2
3
4
1 hour 6 hour 24 hour
Nu
mb
er
of
Foci
/ C
ell
Time (hours)
FIV

RESULTS Chapter 4
127
Table 32a. Mean number of DSB foci in AT5BIVA nuclei at high MOI
Treatment Time (hours)
1 6 24 72
Un-infected
MEAN (+/- SEM) 1.30 (0.16) 1.56 (0.08) 1.28 (0.12) p-value 0.16 0.35 no of nuclei 459 483 300
IR MEAN (+/- SEM) 6.27 ( 0.25) 8.02 ( 0.55) 8.70 ( 0.35) p-value 0.04 0.03
no of nuclei 496 179 440
MLV MEAN (+/- SEM) 4.58 ( 0.50) 5.01 (0.36) 6.15 (0.26) p-value 0.39 0.02 no of nuclei 91 360 464
HIV MEAN (+/- SEM) 7.28 (0.38) 7.41 ( 0.40) 7.73 (0.48) p-value 0.02 0.01 no of nuclei 303 478 185
EIAV MEAN (+/- SEM) 5.36 ( 0.23) 5.20 (0.25) 5.27 (0.33) p-value 0.80 0.98 no of nuclei 558 377 280
FIV MEAN (+/- SEM) 7.04 ( 0.43) 8.08 ( 0.33) 7.94 (0.37) p-value 0.03 0.69 no of nuclei 314 425 364
IN- MEAN (+/- SEM) 2.11 ( 0.29) 2.31 ( 0.15) 2.63 ( 0.25) 2.25 ( 0.14) p-value 0.70 0.22 0.43 no of nuclei 133 277 183 251
Empty Vector
MEAN (+/- SEM) 4.86 ( 0.51) 5.50 ( 0.60) 6.12 ( 0.41) p-value 0.80 0.04 no of nuclei 141 288 163

RESULTS Chapter 4
128
Table 32b. Mean number of DSB foci in AT5BIVA nuclei at low MOI
At5biva cells exposed to RV and LV vectors at high and low MOI are shown in table 32a
and b. The DNA damage response (DDR) was measured using 53BP1
immunoflourescence. Control positive cells were irradiated at 1Gy. Negative controls
were cultured in an identical manner to virally infected cells and mock infected in the
presence of 5µg/ml DEAE dextran. All infections used DEAE dextran at 5µg/ml. At5biva
are deficient in DDR thus following irradiation instead of eventually decreasing in DSB
(foci) the level increases. This is also found for the virus infected cells. Mean, p-values
obtained from standard t-test and number of nuclei counted are all shown in the table.
Treatment Time (hours)
1 6 24 72
MLV MEAN (+/- SEM) 2.30 (0.12) 2.88 (0.17) 2.69 (0.19) p-value 0.01 0.89 no of nuclei 398 407 274
HIV MEAN (+/- SEM) 3.19 (0.19) 3.88 (0.31) 4.21 (0.32) p-value 0.14 0.19 no of nuclei 272 255 222
EIAV MEAN (+/- SEM) 1.82 (0.14) 2.26 (0.19) 2.49 (0.12) p-value 0.03 0.15 no of nuclei 299 288 450
FIV MEAN (+/- SEM) 2.29 (0.21) 3.13 (0.17) 2.36 (0.13) p-value 0.00 0.00 no of nuclei 221 348 399
IN- MEAN (+/- SEM) 1.61 (0.15) 2.01 (0.24) 1.91 (0.11) 1.7 (0.27) p-value 0.57 0.37 0.54 no of nuclei 243 72 442 250
Empty Vector
MEAN (+/- SEM) 1.51 (0.09) 1.89 (0.11) 3.04 (0.13) p-value 0.02 1.30E-05 no of nuclei 435 440 611

RESULTS Chapter 4
129
0
1
2
3
4
5
1 hour 6 hour 24 hour
Nu
mb
er
of
Foci
/ C
ell
Time (hours)
Empty Vector
0
1
2
3
4
5
6
1 hour 6 hour 24 hour
Nu
mb
er
of
Foci
/ C
ell
Time (hours)
FIV
Figure 26a.Xp14br cells
1
1.5
2
2.5
3
1 hour 6 hour 24 hour
Nu
mb
er
of
Foci
/ C
ell
Time (hours)
NC
0
2
4
6
8
10
0.5 hour 6 hour 24 hour
Nu
mb
er
of
Foci
/ C
ell
Time (hours)
IR
0
2
4
6
8
10
1 hour 6 hour 24 hour
Nu
mb
er
of
Foci
/ C
ell
Time (hours)
EIAV
0
0.4
0.8
1.2
1.6
2
2.4
1 hour 6 hour 24 hour 72 hour
Nu
mb
er
of
Foci
/ C
ell
Time (hours)
-IN
0
1
2
3
4
5
6
7
1 hour 6 hour 24 hour
Nu
mb
er
of
Foci
/ C
ell
Time (hours)
MLV
0
1
2
3
4
5
6
7
1 hour 6 hour 24 hour
Nu
mb
er
of
Foci
/ C
ell
Time (hours)
HIV
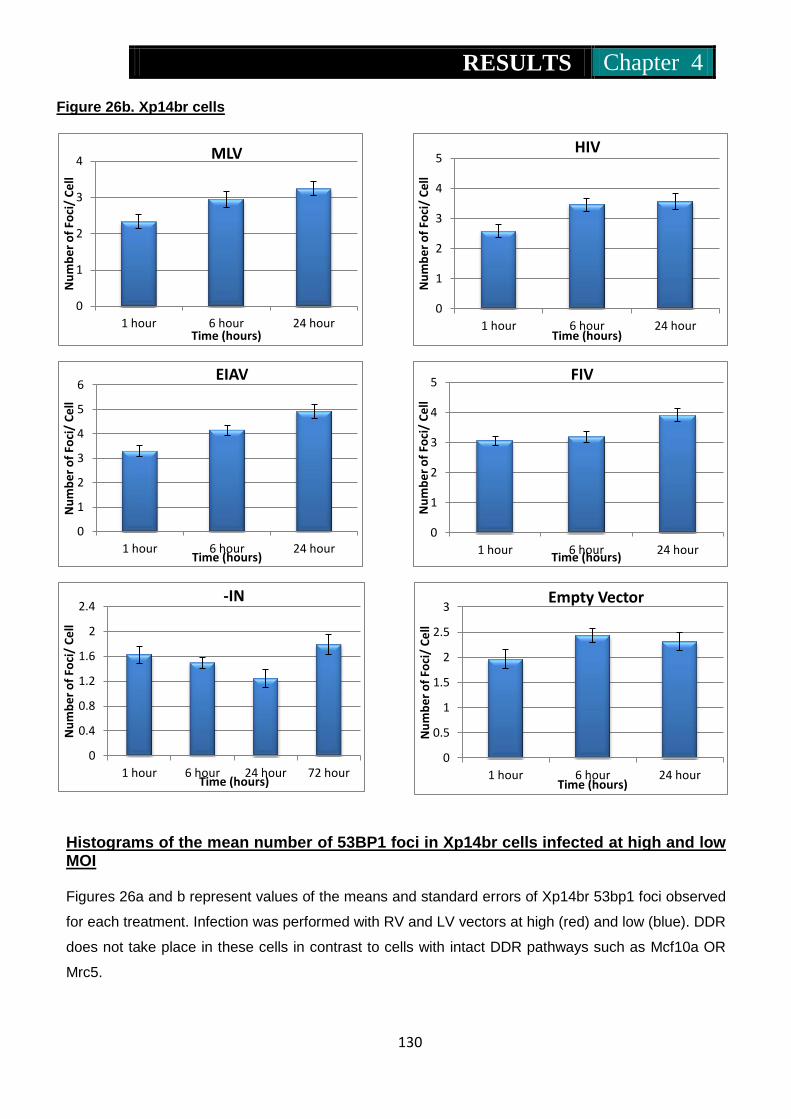
RESULTS Chapter 4
130
Figure 26b. Xp14br cells
Histograms of the mean number of 53BP1 foci in Xp14br cells infected at high and low MOI Figures 26a and b represent values of the means and standard errors of Xp14br 53bp1 foci observed
for each treatment. Infection was performed with RV and LV vectors at high (red) and low (blue). DDR
does not take place in these cells in contrast to cells with intact DDR pathways such as Mcf10a OR
Mrc5.
0
1
2
3
4
1 hour 6 hour 24 hour
Nu
mb
er
of
Foci
/ C
ell
Time (hours)
MLV
0
1
2
3
4
5
1 hour 6 hour 24 hour
Nu
mb
er
of
Foci
/ C
ell
Time (hours)
HIV
0
1
2
3
4
5
6
1 hour 6 hour 24 hour
Nu
mb
er
of
Foci
/ C
ell
Time (hours)
EIAV
0
1
2
3
4
5
1 hour 6 hour 24 hour
Nu
mb
er
of
Foci
/ C
ell
Time (hours)
FIV
0
0.5
1
1.5
2
2.5
3
1 hour 6 hour 24 hour
Nu
mb
er
of
Foci
/ C
ell
Time (hours)
Empty Vector
0
0.4
0.8
1.2
1.6
2
2.4
1 hour 6 hour 24 hour 72 hour
Nu
mb
er
of
Foci
/ C
ell
Time (hours)
-IN
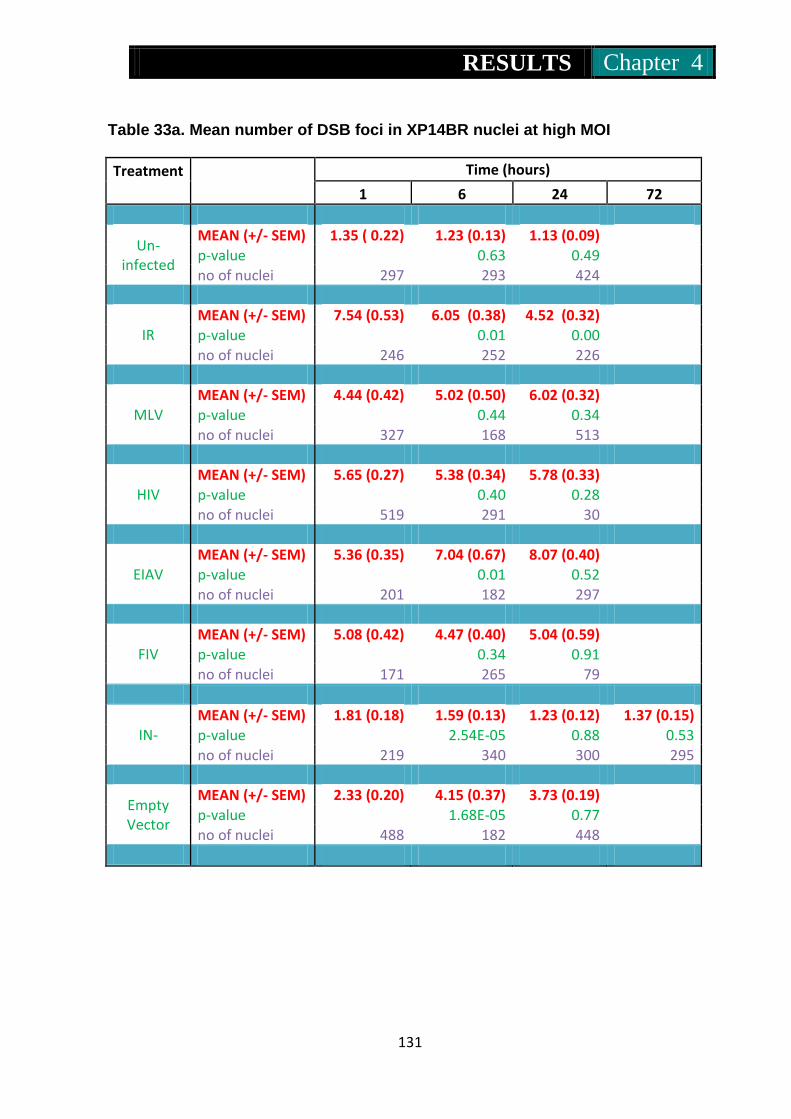
RESULTS Chapter 4
131
Table 33a. Mean number of DSB foci in XP14BR nuclei at high MOI
Treatment Time (hours)
1 6 24 72
Un-infected
MEAN (+/- SEM) 1.35 ( 0.22) 1.23 (0.13) 1.13 (0.09) p-value 0.63 0.49 no of nuclei 297 293 424
IR MEAN (+/- SEM) 7.54 (0.53) 6.05 (0.38) 4.52 (0.32) p-value 0.01 0.00 no of nuclei 246 252 226
MLV MEAN (+/- SEM) 4.44 (0.42) 5.02 (0.50) 6.02 (0.32) p-value 0.44 0.34
no of nuclei 327 168 513
HIV MEAN (+/- SEM) 5.65 (0.27) 5.38 (0.34) 5.78 (0.33) p-value 0.40 0.28 no of nuclei 519 291 30
EIAV MEAN (+/- SEM) 5.36 (0.35) 7.04 (0.67) 8.07 (0.40) p-value 0.01 0.52 no of nuclei 201 182 297
FIV MEAN (+/- SEM) 5.08 (0.42) 4.47 (0.40) 5.04 (0.59) p-value 0.34 0.91 no of nuclei 171 265 79
IN- MEAN (+/- SEM) 1.81 (0.18) 1.59 (0.13) 1.23 (0.12) 1.37 (0.15) p-value 2.54E-05 0.88 0.53
no of nuclei 219 340 300 295
Empty Vector
MEAN (+/- SEM) 2.33 (0.20) 4.15 (0.37) 3.73 (0.19) p-value 1.68E-05 0.77 no of nuclei 488 182 448
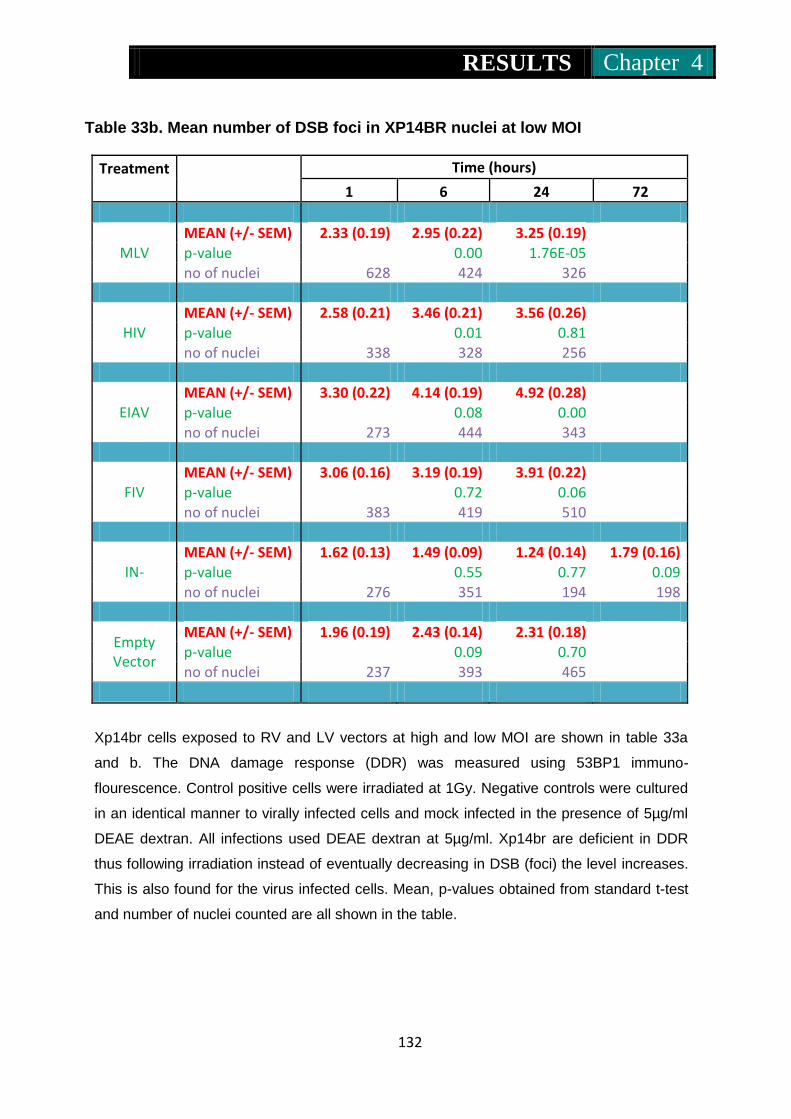
RESULTS Chapter 4
132
Table 33b. Mean number of DSB foci in XP14BR nuclei at low MOI
Treatment Time (hours)
1 6 24 72
MLV MEAN (+/- SEM) 2.33 (0.19) 2.95 (0.22) 3.25 (0.19) p-value 0.00 1.76E-05 no of nuclei 628 424 326
HIV MEAN (+/- SEM) 2.58 (0.21) 3.46 (0.21) 3.56 (0.26)
p-value 0.01 0.81 no of nuclei 338 328 256
EIAV MEAN (+/- SEM) 3.30 (0.22) 4.14 (0.19) 4.92 (0.28) p-value 0.08 0.00 no of nuclei 273 444 343
FIV MEAN (+/- SEM) 3.06 (0.16) 3.19 (0.19) 3.91 (0.22) p-value 0.72 0.06 no of nuclei 383 419 510
IN- MEAN (+/- SEM) 1.62 (0.13) 1.49 (0.09) 1.24 (0.14) 1.79 (0.16) p-value 0.55 0.77 0.09 no of nuclei 276 351 194 198
Empty Vector
MEAN (+/- SEM) 1.96 (0.19) 2.43 (0.14) 2.31 (0.18) p-value 0.09 0.70 no of nuclei 237 393 465
Xp14br cells exposed to RV and LV vectors at high and low MOI are shown in table 33a
and b. The DNA damage response (DDR) was measured using 53BP1 immuno-
flourescence. Control positive cells were irradiated at 1Gy. Negative controls were cultured
in an identical manner to virally infected cells and mock infected in the presence of 5µg/ml
DEAE dextran. All infections used DEAE dextran at 5µg/ml. Xp14br are deficient in DDR
thus following irradiation instead of eventually decreasing in DSB (foci) the level increases.
This is also found for the virus infected cells. Mean, p-values obtained from standard t-test
and number of nuclei counted are all shown in the table.

RESULTS Chapter 4
133
By infecting Mcf10a and Mrc5 cells it was demonstrated that the expected normal repair of
DSB occurs 6 hours post infection whereas for Xp14br and At5biva cells without intact
pathways for DSB DBR did not take place. Instead, DSB foci remain constant as visualized
by the presence of 53BP1 immuno staining up to the 24 hour time point where
measurements ceased.
The highest number of foci recorded at 6 hours post infection in the Mcf10a cell line was
induced by the MLV genome free vector. For the Mrc5 cell line this occurred with the MLV
vector carrying a genome. The HIV integrase mutated vector (IN-) induced similar numbers
of nuclei with foci to the un-infected Mcf10a and Mrc5 cells. At5biva and Xp14br infected
cell lines demonstrated genotoxicity to their genomes after infection where DBR does not
take place.
To measure the extent of DSB and the possible genotoxicity caused by integrative vectors on
cell genomes, the frequency of DSB were compared between vectors.

RESULTS Chapter 4
134
EIAV
0-5 foci
6-10 foci
11-15 foci
16-20 foci
21-25 foci
>30 foci
HIV
0-5 foci
6-10 foci
11-15 foci
16-20 foci
21-25 foci
>30 foci
MLV
0-5 foci
6-10 foci
11-15 foci
16-20 foci
21-25 foci
>30 foci
-IN
0-5 foci
6-10 foci
11-15 foci
16-20 foci
21-25 foci
>30 foci
FIV
0-5 foci
6-10 foci
11-15 foci
16-20 foci
21-25 foci
>30 foci
Empty Vector
0-5 foci
6-10 foci
11-15 foci
16-20 foci
21-25 foci
>30 foci
Frequency of foci in MCF10A nuclei at high MOI 6 hours post infection
IR
0-5 foci
6-10 foci
11-15 foci
16-20 foci
21-25 foci
>30 foci
Un-Infected
0-5 foci
6-10 foci
11-15 foci
16-20 foci
21-25 foci
>30 foci

RESULTS Chapter 4
135
Empty Vector 0-5 foci
6-10 foci
11-15 foci
16-20 foci
21-25 foci
>30 foci
-IN 0-5 foci
6-10 foci
11-15 foci
16-20 foci
21-25 foci
>30 foci
Frequency of foci in MCF10A nuclei at low MOI 6 hours post infection
Figure 27. Pie charts representing the frequency of 53BP1 foci in Mcf10a nuclei at 6
hours post treatment with IR, MLV, HIV, EIAV, FIV, IN- and MLV without genome.
MLV and EIAV have similar profiles with regards to nuclei with 6-10 foci but on the whole EIAV
appears to have nuclei with higher numbers of foci. FIV, which like EIAV is a non-primate LV,
shows a similar profile to EIAV but without nuclei with high numbers of foci. Of all the vectors
tested the HIV vector appears to have nuclei mainly very low numbers of foci. Interestingly,
however, cells infected with the MLV vector without a genome (empty vector) appeared with
nuclei the highest number of foci ranging from 0-5 up to more than 30 per nucleus. Also un-
infected cells appeared with a similar range of nuclei to cells infected with integrase negative
vector (IN-). Cells infected with vectors at low MOI followed a similar trend to those treated with
vectors at high MOI albeit with fewer foci per nucleus.
EIAV
0-5 foci
6-10 foci
11-15 foci
16-20 foci
21-25 foci
>30 foci
HIV
0-5 foci
6-10 foci
11-15 foci
16-20 foci
21-25 foci
>30 foci
MLV
0-5 foci
6-10 foci
11-15 foci
16-20 foci
21-25 foci
>30 foci
FIV
0-5 foci
6-10 foci
11-15 foci
16-20 foci
21-25 foci
>30 foci
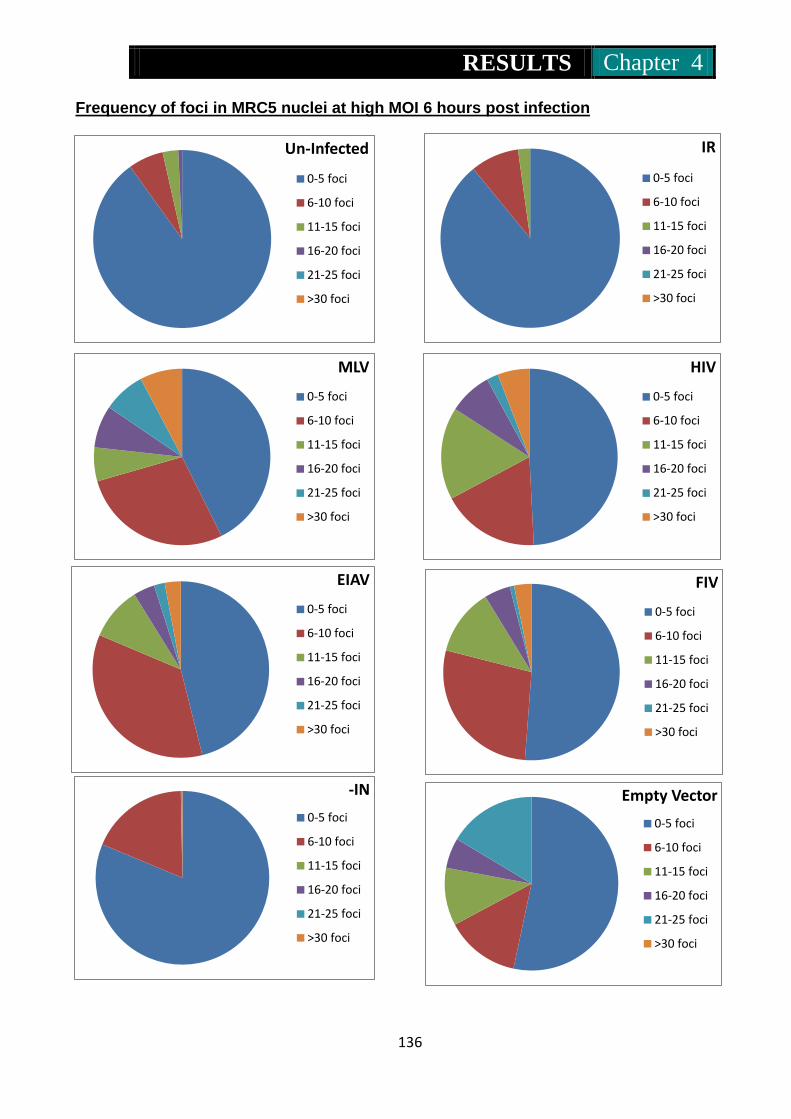
RESULTS Chapter 4
136
HIV
0-5 foci
6-10 foci
11-15 foci
16-20 foci
21-25 foci
>30 foci
Un-Infected
0-5 foci
6-10 foci
11-15 foci
16-20 foci
21-25 foci
>30 foci
MLV
0-5 foci
6-10 foci
11-15 foci
16-20 foci
21-25 foci
>30 foci
IR
0-5 foci
6-10 foci
11-15 foci
16-20 foci
21-25 foci
>30 foci
Empty Vector
0-5 foci
6-10 foci
11-15 foci
16-20 foci
21-25 foci
>30 foci
-IN
0-5 foci
6-10 foci
11-15 foci
16-20 foci
21-25 foci
>30 foci
FIV
0-5 foci
6-10 foci
11-15 foci
16-20 foci
21-25 foci
>30 foci
EIAV
0-5 foci
6-10 foci
11-15 foci
16-20 foci
21-25 foci
>30 foci
Frequency of foci in MRC5 nuclei at high MOI 6 hours post infection

RESULTS Chapter 4
137
-IN
0-5 foci
6-10 foci
11-15 foci
16-20 foci
21-25 foci
>30 foci
Frequency of foci in MRC5 nuclei at low MOI 6 hours post infection
Figure 28. Pie charts representing the frequency of 53BP1 foci in Mrc5 nuclei at 6
hours post treatment with IR, MLV, HIV, EIAV, FIV, IN- and MLV without genome.
Cells infected with IN- and un-infected cells have similar profiles of 6-10 nuclei with foci. EIAV and
FIV have very similar foci number in their nuclei. Interestingly, however, the MLV vector without a
genome (empty vector) appeared with a more evenly distributed range of nuclei with foci from 6-10
up to more than 30. Vectors at low MOI followed a similar trend to the high MOI vectors however
they had lower numbers of nuclei with foci.
MLV
0-5 foci
6-10 foci
11-15 foci
16-20 foci
21-25 foci
>30 foci
HIV
0-5 foci
6-10 foci
11-15 foci
16-20 foci
21-25 foci
>30 foci
Empty Vector
0-5 foci
6-10 foci
11-15 foci
16-20 foci
21-25 foci
>30 foci
EIAV
0-5 foci
6-10 foci
11-15 foci
16-20 foci
21-25 foci
>30 foci
FIV
0-5 foci
6-10 foci
11-15 foci
16-20 foci
21-25 foci
>30 foci
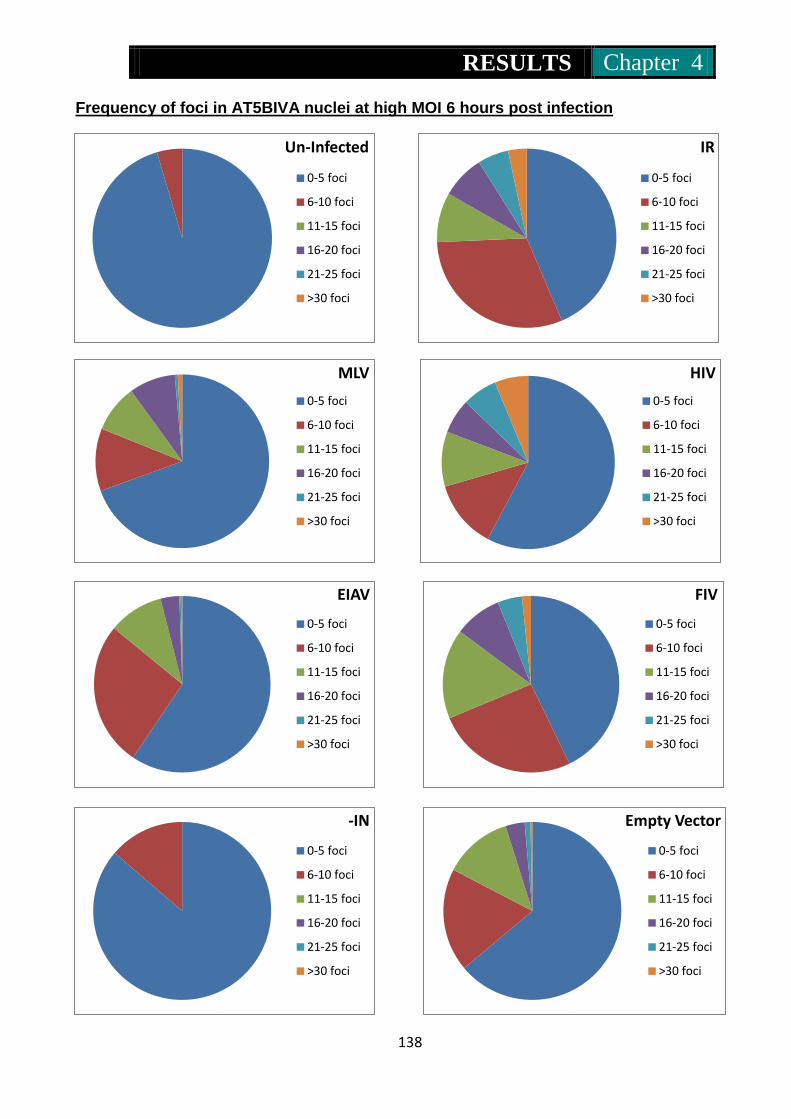
RESULTS Chapter 4
138
HIV
0-5 foci
6-10 foci
11-15 foci
16-20 foci
21-25 foci
>30 foci
MLV
0-5 foci
6-10 foci
11-15 foci
16-20 foci
21-25 foci
>30 foci
Un-Infected
0-5 foci
6-10 foci
11-15 foci
16-20 foci
21-25 foci
>30 foci
IR
0-5 foci
6-10 foci
11-15 foci
16-20 foci
21-25 foci
>30 foci
FIV
0-5 foci
6-10 foci
11-15 foci
16-20 foci
21-25 foci
>30 foci
EIAV
0-5 foci
6-10 foci
11-15 foci
16-20 foci
21-25 foci
>30 foci
Empty Vector
0-5 foci
6-10 foci
11-15 foci
16-20 foci
21-25 foci
>30 foci
-IN
0-5 foci
6-10 foci
11-15 foci
16-20 foci
21-25 foci
>30 foci
Frequency of foci in AT5BIVA nuclei at high MOI 6 hours post infection
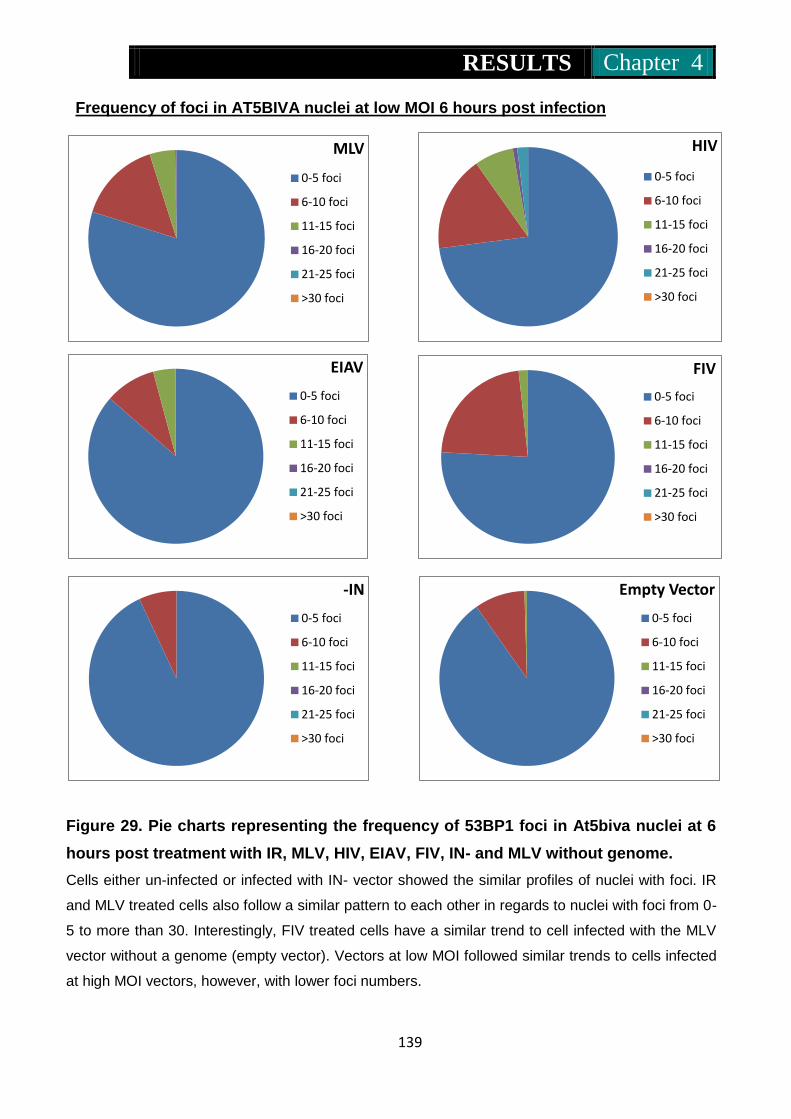
RESULTS Chapter 4
139
Empty Vector
0-5 foci
6-10 foci
11-15 foci
16-20 foci
21-25 foci
>30 foci
-IN
0-5 foci
6-10 foci
11-15 foci
16-20 foci
21-25 foci
>30 foci
EIAV
0-5 foci
6-10 foci
11-15 foci
16-20 foci
21-25 foci
>30 foci
MLV
0-5 foci
6-10 foci
11-15 foci
16-20 foci
21-25 foci
>30 foci
HIV
0-5 foci
6-10 foci
11-15 foci
16-20 foci
21-25 foci
>30 foci
FIV
0-5 foci
6-10 foci
11-15 foci
16-20 foci
21-25 foci
>30 foci
Frequency of foci in AT5BIVA nuclei at low MOI 6 hours post infection
Figure 29. Pie charts representing the frequency of 53BP1 foci in At5biva nuclei at 6
hours post treatment with IR, MLV, HIV, EIAV, FIV, IN- and MLV without genome.
Cells either un-infected or infected with IN- vector showed the similar profiles of nuclei with foci. IR
and MLV treated cells also follow a similar pattern to each other in regards to nuclei with foci from 0-
5 to more than 30. Interestingly, FIV treated cells have a similar trend to cell infected with the MLV
vector without a genome (empty vector). Vectors at low MOI followed similar trends to cells infected
at high MOI vectors, however, with lower foci numbers.
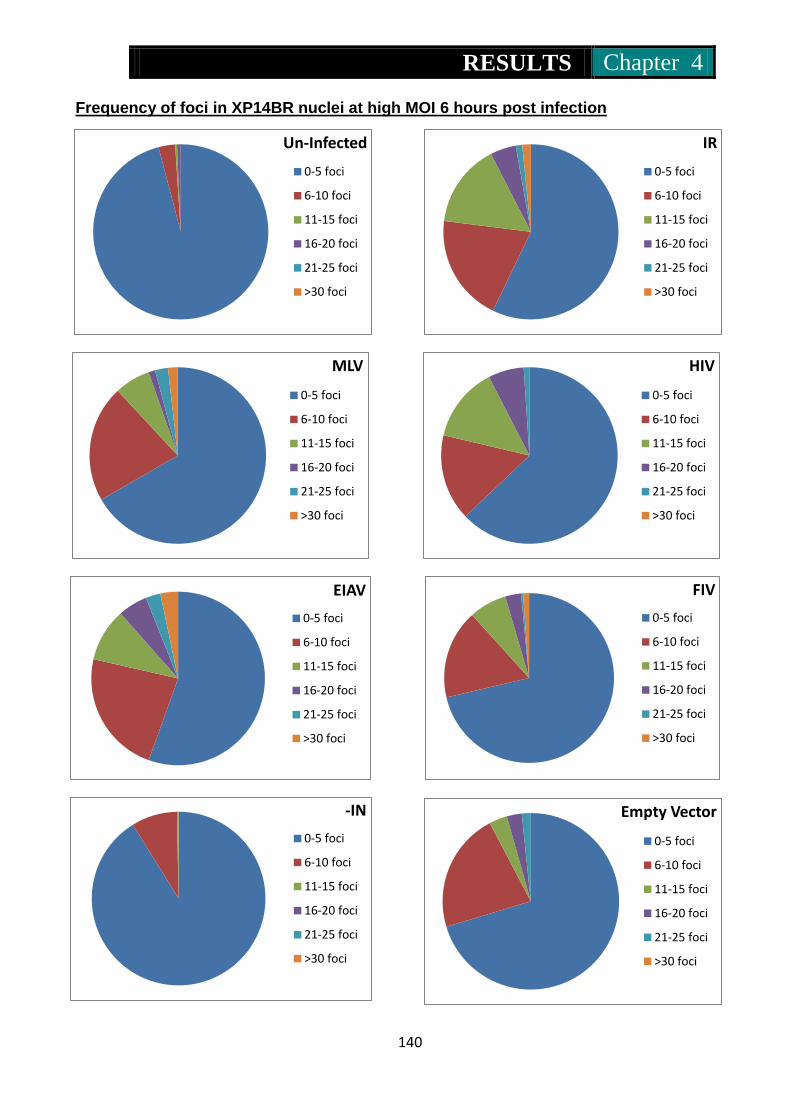
RESULTS Chapter 4
140
Un-Infected
0-5 foci
6-10 foci
11-15 foci
16-20 foci
21-25 foci
>30 foci
IR
0-5 foci
6-10 foci
11-15 foci
16-20 foci
21-25 foci
>30 foci
MLV
0-5 foci
6-10 foci
11-15 foci
16-20 foci
21-25 foci
>30 foci
HIV
0-5 foci
6-10 foci
11-15 foci
16-20 foci
21-25 foci
>30 foci
Empty Vector
0-5 foci
6-10 foci
11-15 foci
16-20 foci
21-25 foci
>30 foci
-IN
0-5 foci
6-10 foci
11-15 foci
16-20 foci
21-25 foci
>30 foci
FIV
0-5 foci
6-10 foci
11-15 foci
16-20 foci
21-25 foci
>30 foci
EIAV
0-5 foci
6-10 foci
11-15 foci
16-20 foci
21-25 foci
>30 foci
Frequency of foci in XP14BR nuclei at high MOI 6 hours post infection
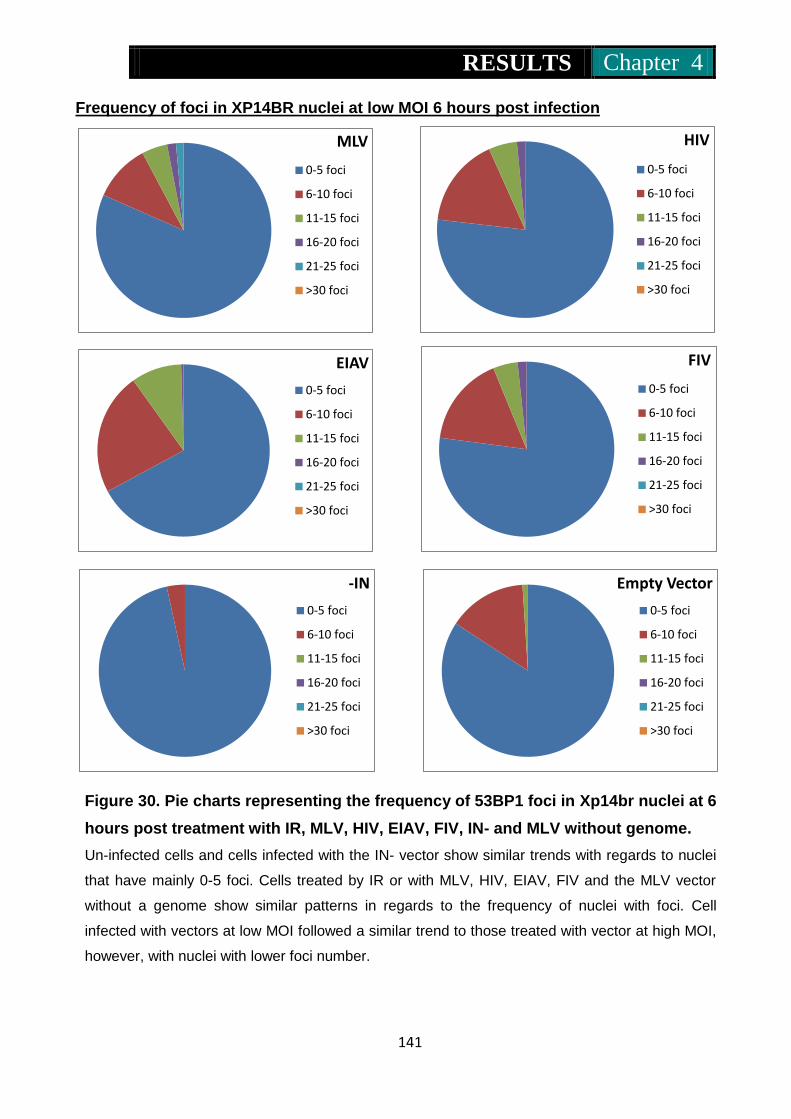
RESULTS Chapter 4
141
-IN
0-5 foci
6-10 foci
11-15 foci
16-20 foci
21-25 foci
>30 foci
FIV
0-5 foci
6-10 foci
11-15 foci
16-20 foci
21-25 foci
>30 foci
Empty Vector
0-5 foci
6-10 foci
11-15 foci
16-20 foci
21-25 foci
>30 foci
EIAV
0-5 foci
6-10 foci
11-15 foci
16-20 foci
21-25 foci
>30 foci
HIV
0-5 foci
6-10 foci
11-15 foci
16-20 foci
21-25 foci
>30 foci
MLV
0-5 foci
6-10 foci
11-15 foci
16-20 foci
21-25 foci
>30 foci
Frequency of foci in XP14BR nuclei at low MOI 6 hours post infection
Figure 30. Pie charts representing the frequency of 53BP1 foci in Xp14br nuclei at 6
hours post treatment with IR, MLV, HIV, EIAV, FIV, IN- and MLV without genome.
Un-infected cells and cells infected with the IN- vector show similar trends with regards to nuclei
that have mainly 0-5 foci. Cells treated by IR or with MLV, HIV, EIAV, FIV and the MLV vector
without a genome show similar patterns in regards to the frequency of nuclei with foci. Cell
infected with vectors at low MOI followed a similar trend to those treated with vector at high MOI,
however, with nuclei with lower foci number.

RESULTS Chapter 4
142
The frequency pie charts show the number of nuclei in Mcf10a cells with 53BP1
positive foci to be similar to Mcf10a cells infected with the IN- HIV based vector and
uninfected cells. This was also the case in Mrc5 cells. Mrc5 also appeared to show this
trend, however, this cell line appears to be a more sensitive cell line to DNA damage
with nuclei containing higher numbers of foci (6-10) than Mcf10a. The MLV vector
containing no genome (empty vector) showed similar patterns to cells treated with the
other vectors (excluding IN-). At5biva and Xp14br, which are cell lines that are repair
deficient again showed similar trends to each other.
To determine whether DSB are repaired following infection of Mcf10a cell that contain
intact DSB repair pathways whole chromosome analysis using muticolour fluorescent in
situ hybridisation (mFISH) and G-banding chromosomes was then performed. This was
to determine whether chromosome rearrangement occurs as a result of genome
instability caused by infection.
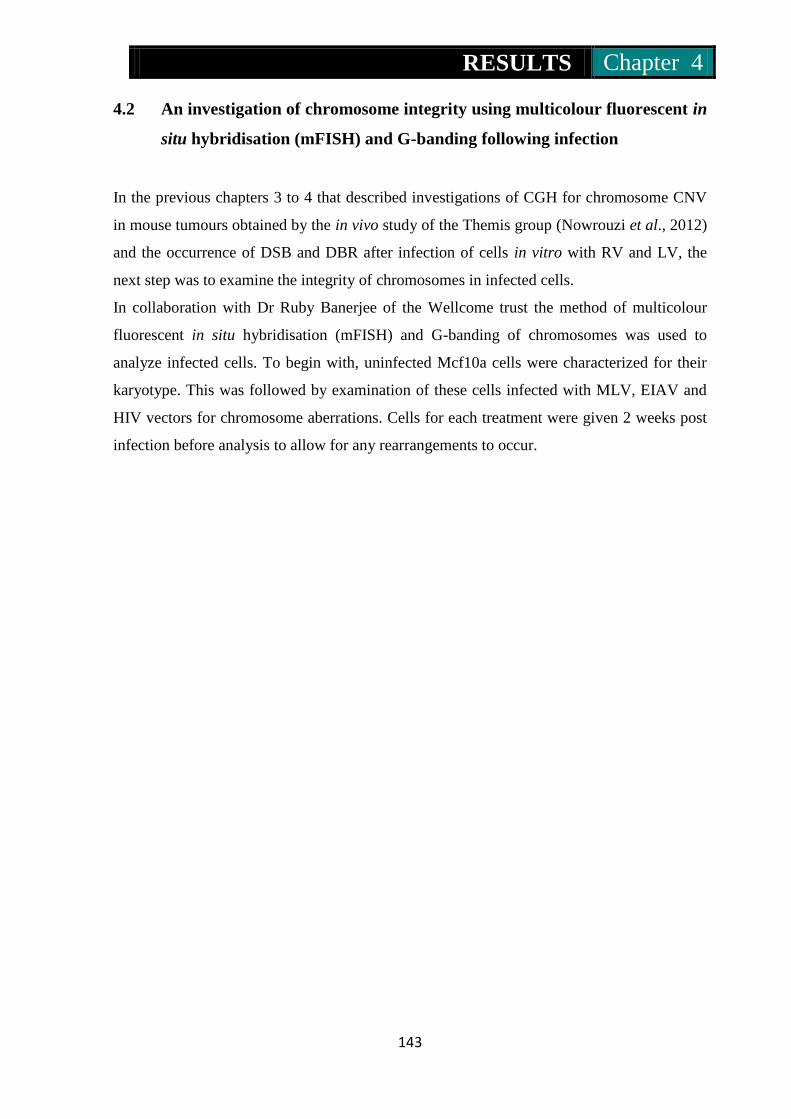
RESULTS Chapter 4
143
4.2 An investigation of chromosome integrity using multicolour fluorescent in
situ hybridisation (mFISH) and G-banding following infection
In the previous chapters 3 to 4 that described investigations of CGH for chromosome CNV
in mouse tumours obtained by the in vivo study of the Themis group (Nowrouzi et al., 2012)
and the occurrence of DSB and DBR after infection of cells in vitro with RV and LV, the
next step was to examine the integrity of chromosomes in infected cells.
In collaboration with Dr Ruby Banerjee of the Wellcome trust the method of multicolour
fluorescent in situ hybridisation (mFISH) and G-banding of chromosomes was used to
analyze infected cells. To begin with, uninfected Mcf10a cells were characterized for their
karyotype. This was followed by examination of these cells infected with MLV, EIAV and
HIV vectors for chromosome aberrations. Cells for each treatment were given 2 weeks post
infection before analysis to allow for any rearrangements to occur.
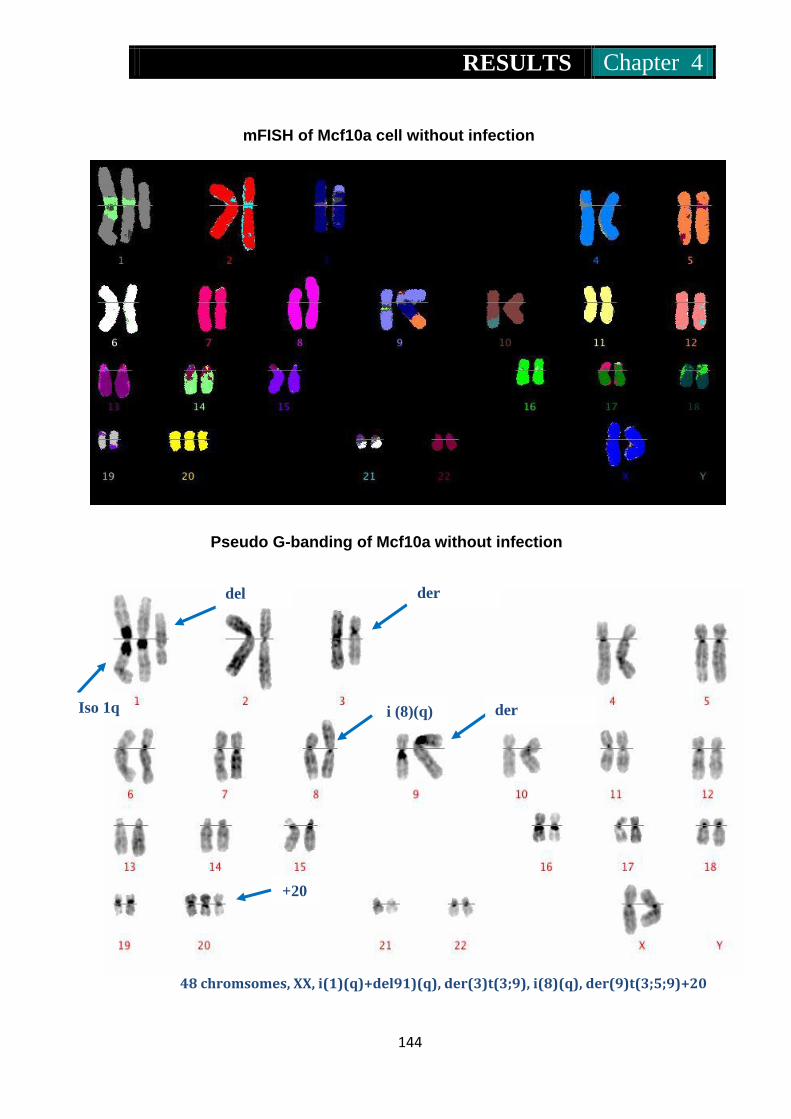
RESULTS Chapter 4
144
mFISH of Mcf10a cell without infection
Pseudo G-banding of Mcf10a without infection
48 chromsomes, XX, i(1)(q)+del91)(q), der(3)t(3;9), i(8)(q), der(9)t(3;5;9)+20
del
(1)(q)
der
(3)t(3;9)
der
(3)t(3;5;9) i (8)(q) Iso 1q
+20

RESULTS Chapter 4
145
Figure 31. mFISH and pseudo G-Banding of un-infected Mcf10a.
Structural aberrations (100%): chromosome 1- i (1)(q) and del (1)(q) showed an
isochromosome on chromosome 1 involving q arm and partial deletion on 1q.
Chromosome 3- der (3)t(3;9) showed a derivative chromosome 3 and translocation
involving chromosome 3 and 9. Chromosome 8- i (8)(q) showed isochromosome on
chromosome 8 involving q arm. Chromosome 9- der (3)t(3;5;9) Complex
rearrangement involving chromosome 3,5 and 9. 40 metaphases were analysed.
Numerical aberrations (100%) Chromosome 20- (+20) extra copy of chromosome 20.
The karyotype identified for the Mcf10a cell line appears to be identical to that reported
by Cowell et al (2005) and therefore, these cells have not undergone any gross
chromosomal changes during culturing in the laboratory (Cowell et al., 2005). This
provided a good basis to begin exploring the effects on these cells of virus infection.
Mcf10a cells were infected with MLV at MOI of 200, EIAV at MOI of 20 and HIV at
MOI of 50. Uninfected cells were treated in the same manner as infected cells except for
exposure to RV and LV then grown for 2 weeks after which mFISH and G-banding was
carried out.

RESULTS Chapter 4
146
mFISH of EIAV infected Mcf10a
Pseudo G-banding of EIAV infected Mcf10a
48 chromsomes, XX, i(1)(q)+del91)(q), der(3)t(3;9), i(8)(q), der(9)t(3;5;9)+20
del
(1)(q)
der
(3)t(3;9)
der
(3)t(3;5;9)
i (8)(q) Iso 1q
+20
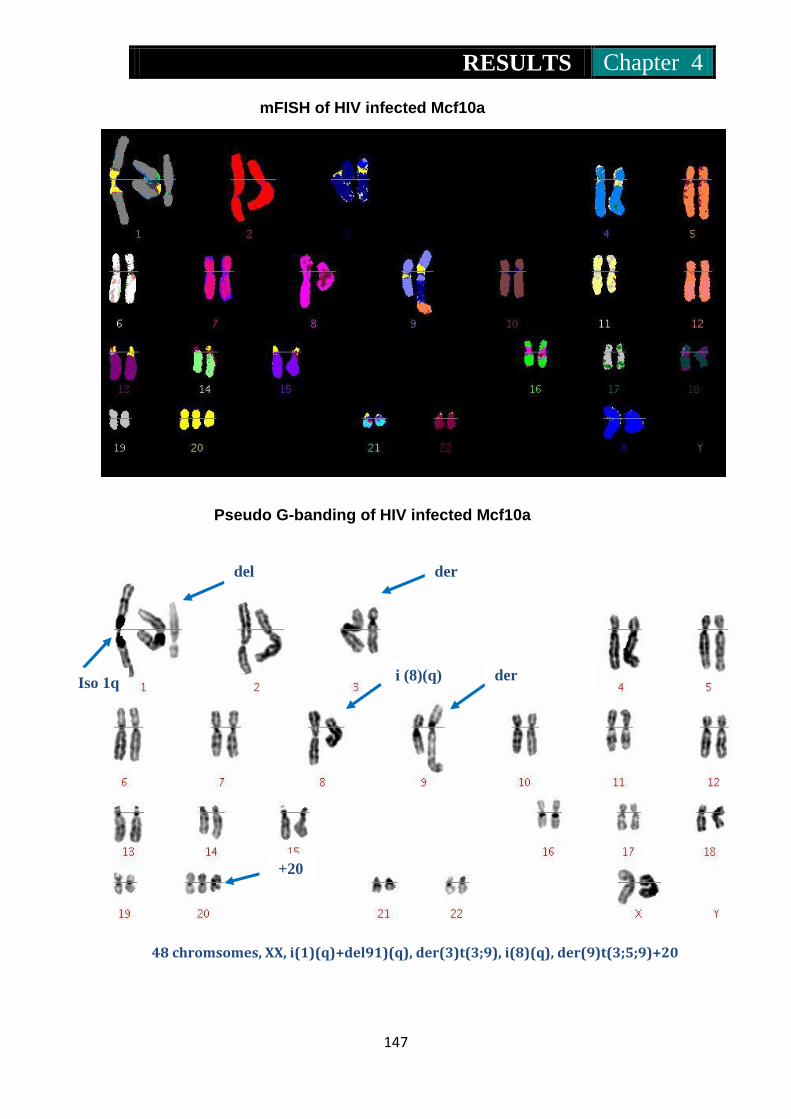
RESULTS Chapter 4
147
mFISH of HIV infected Mcf10a
Pseudo G-banding of HIV infected Mcf10a
48 chromsomes, XX, i(1)(q)+del91)(q), der(3)t(3;9), i(8)(q), der(9)t(3;5;9)+20
del
(1)(q)
der
(3)t(3;9)
der
(3)t(3;5;9)
i (8)(q) Iso 1q
+20
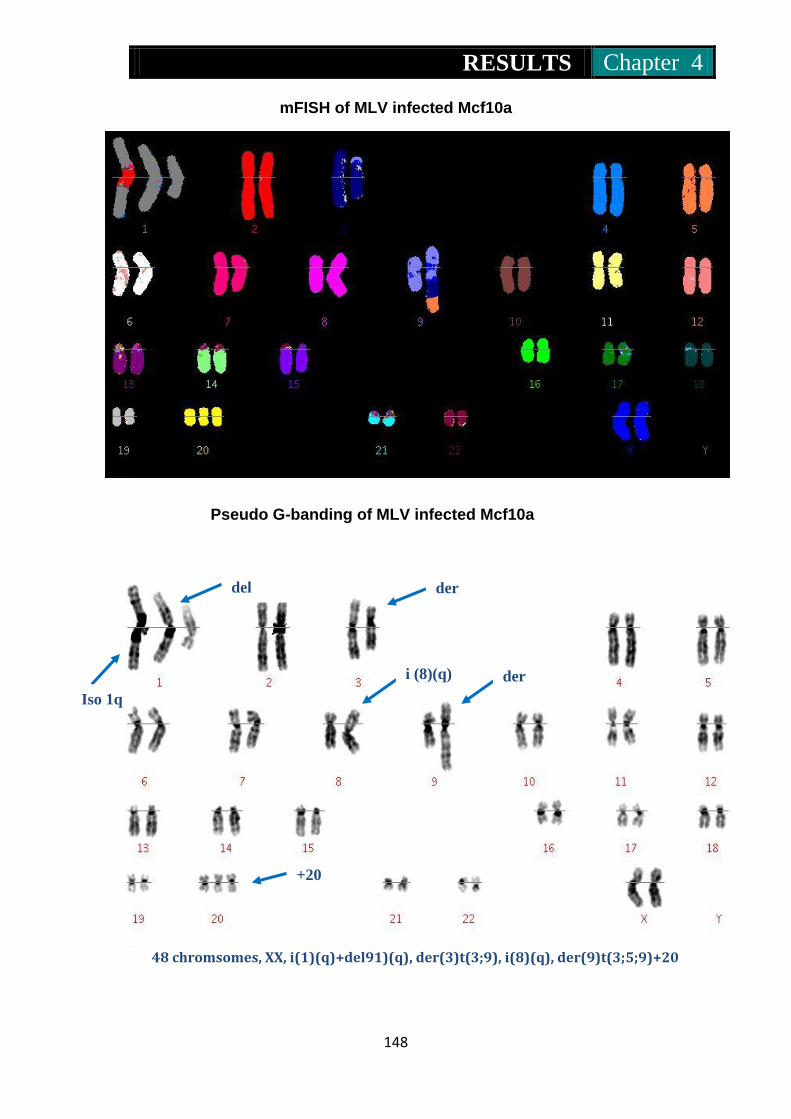
RESULTS Chapter 4
148
mFISH of MLV infected Mcf10a
Pseudo G-banding of MLV infected Mcf10a
48 chromsomes, XX, i(1)(q)+del91)(q), der(3)t(3;9), i(8)(q), der(9)t(3;5;9)+20
del
(1)(q) der
(3)t(3;9)
der
(3)t(3;5;9)
i (8)(q)
Iso 1q
+20
RESULTS Chapter 4
149
Figure 32. mFISH and pseudo G-Banding of EIAV, HIV and MLV infected
Mcf10a cells.
Structural aberrations (100%): chromosome 1- i (1)(q) and del (1)(q) showed an
isochromosome on chromosome 1 involving q arm and partial deletion on 1q.
Chromosome 3- der (3)t(3;9) showed a derivative chromosome 3 and translocation
involving chromosome 3 and 9. Chromosome 8- i (8)(q) showed isochromosome on
chromosome 8 involving q arm. Chromosome 9- der (3)t(3;5;9) Complex
rearrangement involving chromosome 3,5 and 9. 40 metaphases analysed.
Numerical aberrations (100%) Chromosome 20- (+20) extra copy of chromosome 20.
The karyotypes of Mcf10a infected with EIAV, HIV and MLV vectors were identical to
that of uninfected cells demonstrating that 2 weeks after infection no gross
chromosomal changes can be attributed to infection by RV or LV.

RESULTS Chapter 5
150
5.1 Epigenetic modification and E2F regulation of host genes
following RV and LV vector delivery
5.1.1 The effects of RV and LV infection on host epigenetics via
methylation
In previously published findings the group of Fang et al (2001) demonstrated a DNA
damage response following LV infection to be linked to global methylation changes in
lymphoblastoid cells. This was attributed to an immune response by cells via epigenetic
changes to protect the host cell from infection (Fang et al., 2001). Epigenetic changes
involve DNA methylation using DNA methyltransferases DNMT 1, 3a and 3b, where
DNMT 3a and b are involved in establishing new methylation of DNA in cells and
DNMT1 maintains methylation changes during division. In this chapter, the link
between RV and LV infection and host methylation is further examined.
To investigate whether the response by cells to RV and LV infection is not specific to
lymphoblastoid cells only, Mcf10a, HepG2 were infected with each of the MLV, HIV,
EIAV, FIV vectors. DNA methylation response was measured at 3 time points (6 hours,
24 hours and 3 days) after infection. Analysis of global methylation changes and DNMT
1, 3a and 3b gene expression levels were performed. To determine whether methylation
changes could be found related to the DDR, a 53BP1-/- cell line was also infected in the
same manner as for M cf10a and HepG2 cells and the epigenetic response investigated.
These cell lines were also infected with MLV, HIV, EIAV, FIV and MLV virus without
genome vectors and examined at the same 3 time points (6 hours, 24 hours and 3 days)
mentioned above post infection. To determine whether methylation changes were due to
virus integration, cells were also infected with the integrase negative HIV vector.

RESULTS Chapter 5
151
Table 34. Measurement of global methylation in Mcf10a cells infected
with RV and LV
vectors
The experimental samples represent Mcf10a infected with the following vectors: MLV,
HIV, IN- (HIV with mutated integrase), EIAV and Empty Vector (MLV without viral
genome).
Sample Time (hours) Relative
methylated levels (%) SEM
Un-infected 6 100 (0.01)
24 100 (0.02) 72 100 (0.02)
HIV 6 286.57 (0.03)
24 121.21 (0.03) 72 414.71 (0.08)
IN- 6 143.28 (0.01)
24 154.55 (0.05) 72 150.33 (0.02)
MLV 6 143.28 (0.01)
24 272.73 (0.04) 72 255.23 (0.01)
EIAV 6 205.97 (0.01)
24 96.97 (0.00) 72 33.33 (0.02)
Empty Vector 6 4423.88 (0.15)
24 1262.63 (0.12) 72 712.25 (0.07)
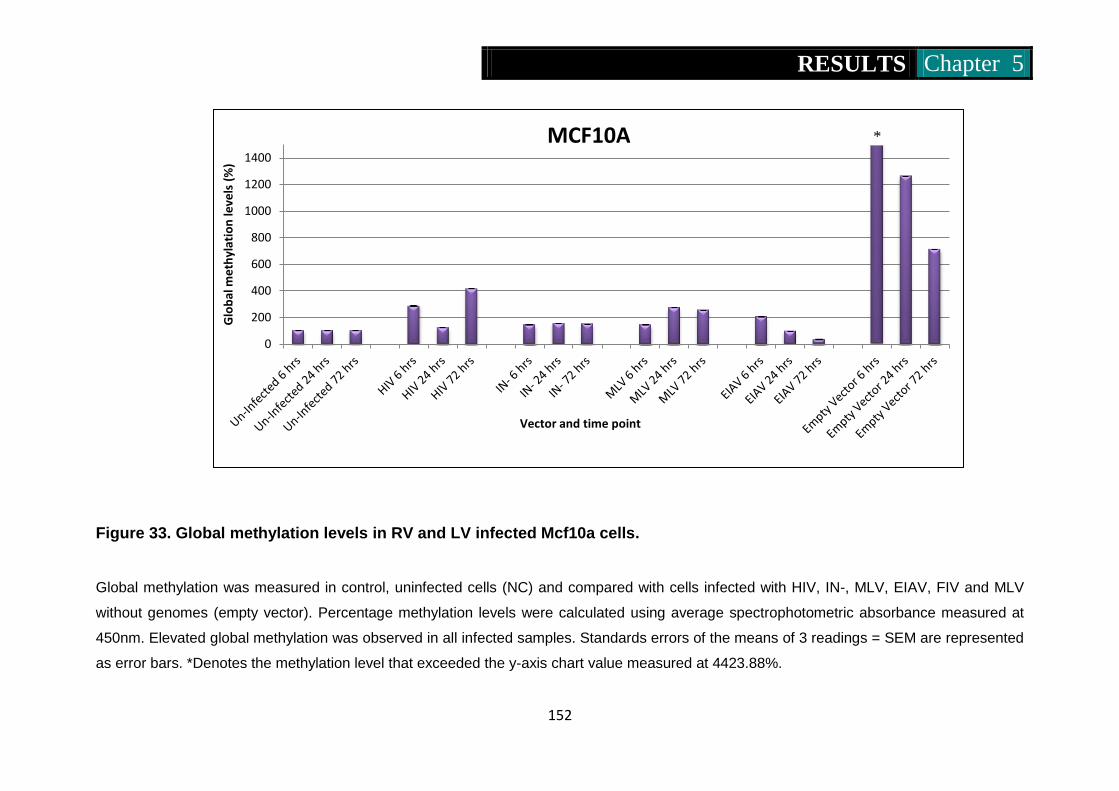
RESULTS Chapter 5
152
0
200
400
600
800
1000
1200
1400
Glo
bal
me
thyl
atio
n le
vels
(%
)
Vector and time point
MCF10A
0
200
400
600
800
1000
1200
1400
Glo
bal
me
thyl
atio
n le
vels
(%
)
Vector and time point
MCF10A
Figure 33. Global methylation levels in RV and LV infected Mcf10a cells.
Global methylation was measured in control, uninfected cells (NC) and compared with cells infected with HIV, IN-, MLV, EIAV, FIV and MLV
without genomes (empty vector). Percentage methylation levels were calculated using average spectrophotometric absorbance measured at
450nm. Elevated global methylation was observed in all infected samples. Standards errors of the means of 3 readings = SEM are represented
as error bars. *Denotes the methylation level that exceeded the y-axis chart value measured at 4423.88%.
*
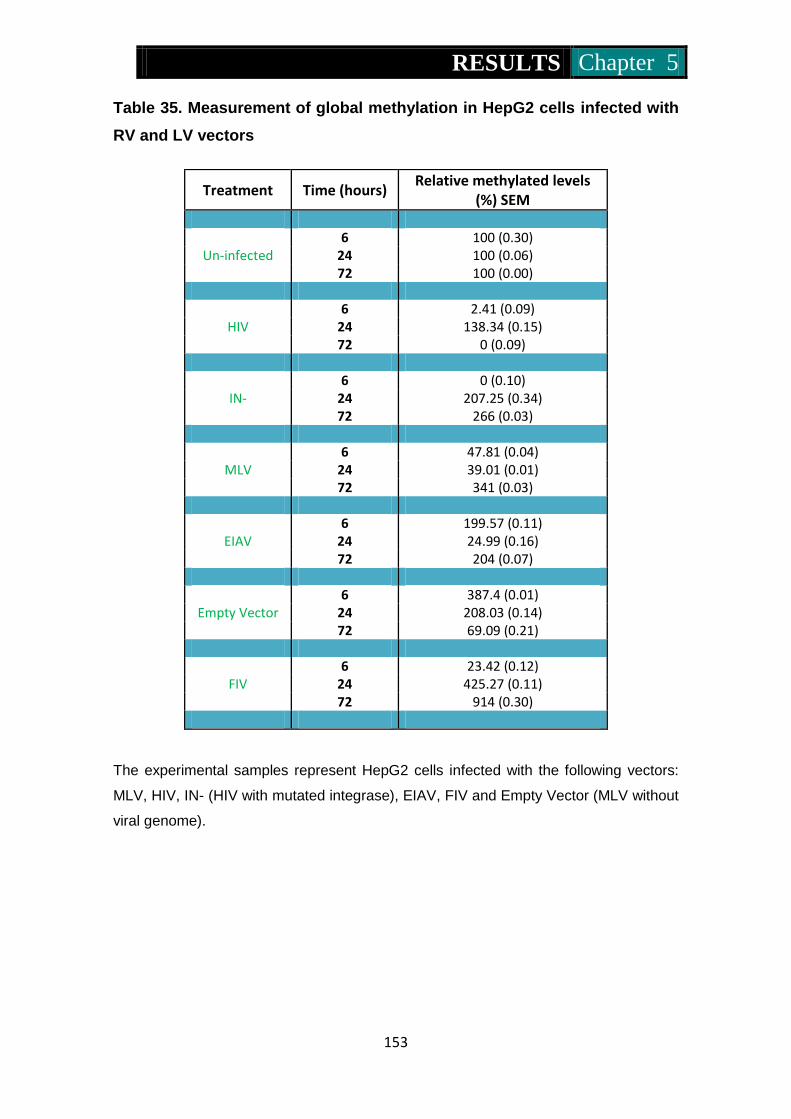
RESULTS Chapter 5
153
Table 35. Measurement of global methylation in HepG2 cells infected with
RV and LV vectors
The experimental samples represent HepG2 cells infected with the following vectors:
MLV, HIV, IN- (HIV with mutated integrase), EIAV, FIV and Empty Vector (MLV without
viral genome).
Treatment Time (hours) Relative methylated levels
(%) SEM
Un-infected 6 100 (0.30)
24 100 (0.06) 72 100 (0.00)
HIV 6 2.41 (0.09)
24 138.34 (0.15) 72 0 (0.09)
IN- 6 0 (0.10)
24 207.25 (0.34) 72 266 (0.03)
MLV 6 47.81 (0.04)
24 39.01 (0.01) 72 341 (0.03)
EIAV 6 199.57 (0.11)
24 24.99 (0.16) 72 204 (0.07)
Empty Vector 6 387.4 (0.01)
24 208.03 (0.14) 72 69.09 (0.21)
FIV 6 23.42 (0.12)
24 425.27 (0.11) 72 914 (0.30)
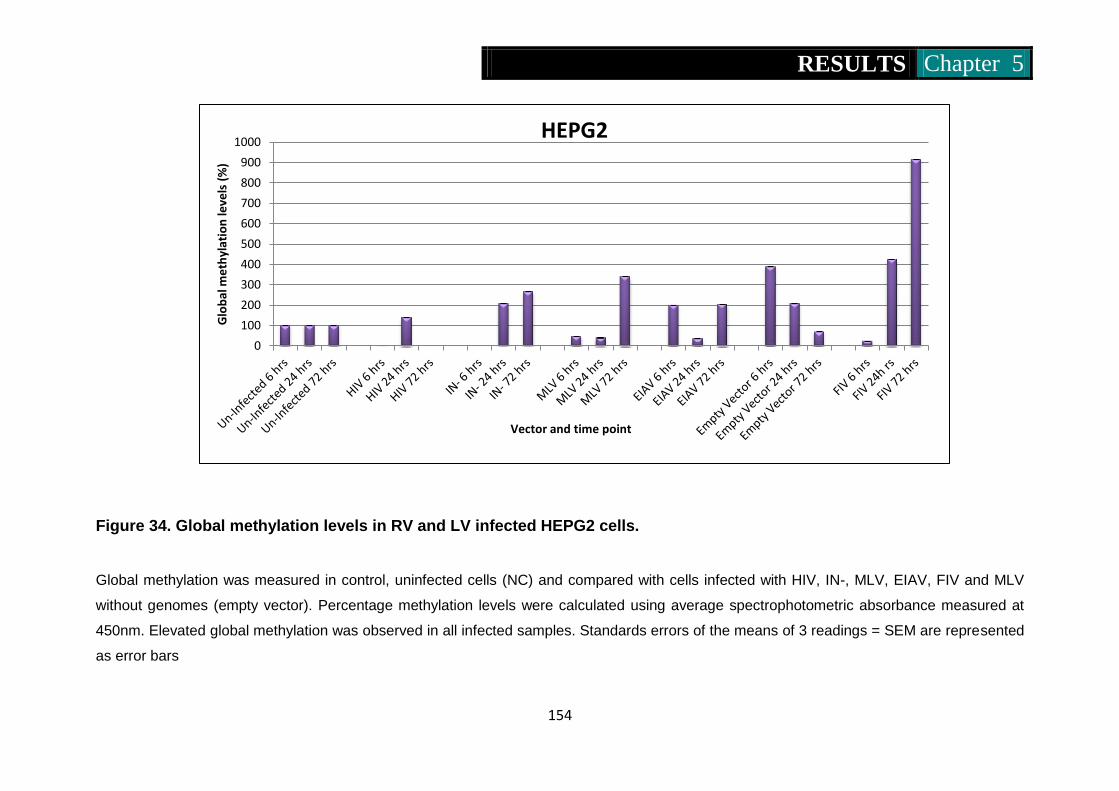
RESULTS Chapter 5
154
0
100
200
300
400
500
600
700
800
900
1000
Glo
bal
me
thyl
atio
n le
vels
(%
)
Vector and time point
HEPG2
Figure 34. Global methylation levels in RV and LV infected HEPG2 cells.
Global methylation was measured in control, uninfected cells (NC) and compared with cells infected with HIV, IN-, MLV, EIAV, FIV and MLV
without genomes (empty vector). Percentage methylation levels were calculated using average spectrophotometric absorbance measured at
450nm. Elevated global methylation was observed in all infected samples. Standards errors of the means of 3 readings = SEM are represented
as error bars

RESULTS Chapter 5
155
Table 36. Measurement of global methylation in 53BP1 -/- cells infected
with RV and LV vectors
The experimental samples represent 53BP1 -/- cells infected with the following vectors:
MLV, HIV, IN- (HIV with mutated integrase), FIV, EIAV and Empty Vector (MLV without
viral genome).
Treatment Time (hours) Relative methylated
levels (%) SEM
Un-infected 6 100 (0.08)
24 100 (0.00) 72 100 (0.15)
HIV 6 0 (0.01)
24 0 (0.02) 72 30.90 (0.01)
IN- 6 0 (0.01)
24 105.37 (0.02) 72 0 (0.16)
MLV 6 0 (0.02)
24 0 (0.01) 72 10.39 (0.00)
EIAV 6 135.45 (0.01)
24 0 (0.12) 72 0 (0.03)
Empty Vector 6 99.01 (0.12)
24 101.91 (0.12) 72 100.66 (0.04)
FIV 6 111.19 (0.07)
24 56.87 (0.22) 72 0 (0.31)

RESULTS Chapter 5
156
Figure 35. Global methylation levels in RV and LV infected 53BP1-/- cells.
Global methylation was measured in control, uninfected cells (NC) and compared with cells infected with HIV, IN-, MLV, EIAV, FIV and MLV
without genomes (empty vector). Percentage methylation levels were calculated using average spectrophotometric absorbance measured at
450nm. Elevated global methylation was observed in all infected samples. Standards errors of the means of 3 reading = SEM are represented
as error bars
0
20
40
60
80
100
120
140
160
Glo
bal
me
thyl
atio
n le
vels
(%
)
Vector and time point
53BP1 -/-
RESULTS Chapter 5
157
Global methylation assays performed on the Mcf10a cell line showed a significant
increase (P <0.05) in methylation levels at virtually all time points by all vectors
(excluding EIAV 24 and 72 hours). Global methylation levels in cells infected with
HIV, IN, MLV, EIAV, MLV without genomes were 4.14 (+/- 0.08), 1.54 (+/- 0.05),
2.72 (+/- 0.04), 2.05 (+/- 0.01) and 44.23 (+/- 0.15) fold greater, respectively, than
untreated cells. The highest increase in global methylation levels was associated with
MLV without genomes. Global methylation however decreased between 6 hours and 3
days for each treatment.
To test this observation in an alternative cell line, mouse liver cells (HepG2) were
chosen and the study was repeated. HepG2 cells showed similar results to that of
Mcf10a. Global methylation levels increased significantly (P <0.5) above control
untreated cells (excluding MLV). Interestingly, the highest global methylation
increases were observed in FIV samples which reached a maximum of 4.25 (+/- 0.11)
fold greater than untreated cells.
The 53BP1-/- mouse embryonic fibroblast cell line lacks the NHEJ DNA damage repair
pathway and is, therefore, useful to investigate whether the DDR pathway may be
associated with genome methylation. Cells infected with each vector showed very little
change in global methylation. Interestingly, only a small change in global methylation
levels was seen in cells infected by the EIAV vector 6 hours post infection (P <0.5).
Hence, this preliminary work suggests the DNA damage response may be associated
with genome methylation and to possible influence gene expression in infected cells.
Alongside this investigation DNMT expression was examined as the possible cause of
elevated global methylation levels.
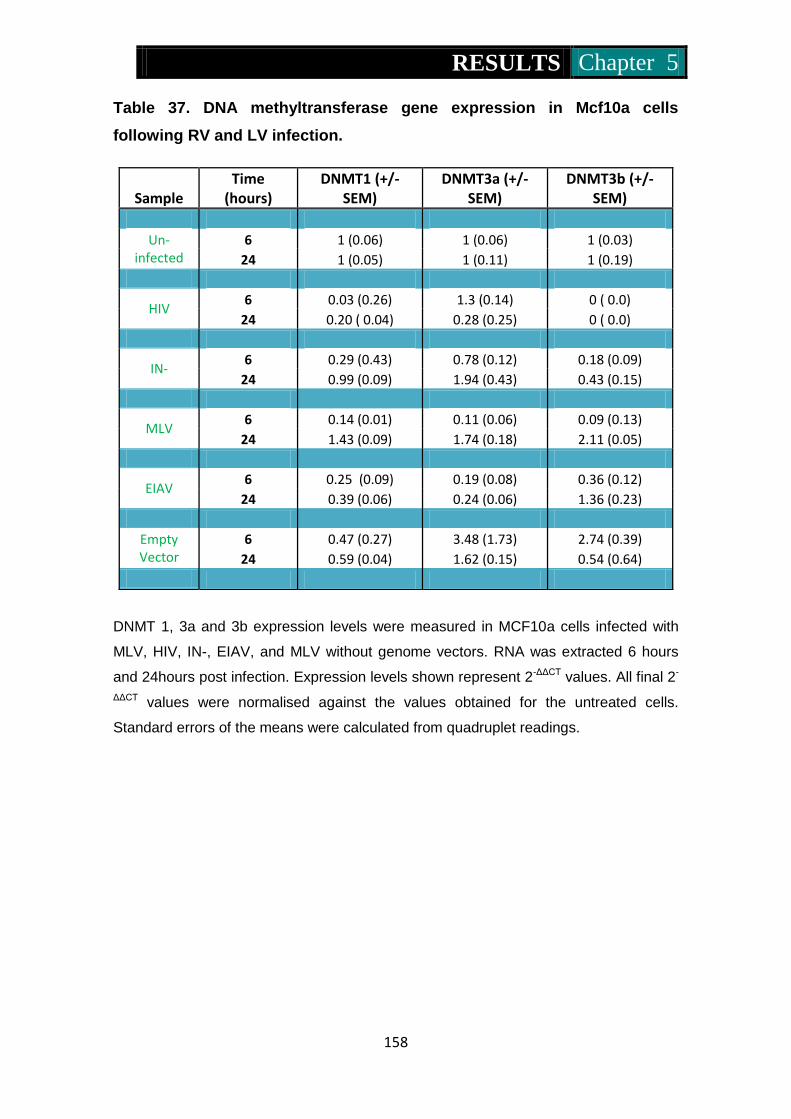
RESULTS Chapter 5
158
Table 37. DNA methyltransferase gene expression in Mcf10a cells
following RV and LV infection.
DNMT 1, 3a and 3b expression levels were measured in MCF10a cells infected with
MLV, HIV, IN-, EIAV, and MLV without genome vectors. RNA was extracted 6 hours
and 24hours post infection. Expression levels shown represent 2-ΔΔCT values. All final 2-
ΔΔCT values were normalised against the values obtained for the untreated cells.
Standard errors of the means were calculated from quadruplet readings.
Sample Time
(hours) DNMT1 (+/-
SEM) DNMT3a (+/-
SEM) DNMT3b (+/-
SEM)
Un-
infected 6 1 (0.06) 1 (0.06) 1 (0.03)
24 1 (0.05) 1 (0.11) 1 (0.19)
HIV 6 0.03 (0.26) 1.3 (0.14) 0 ( 0.0)
24 0.20 ( 0.04) 0.28 (0.25) 0 ( 0.0)
IN- 6 0.29 (0.43) 0.78 (0.12) 0.18 (0.09)
24 0.99 (0.09) 1.94 (0.43) 0.43 (0.15)
MLV 6 0.14 (0.01) 0.11 (0.06) 0.09 (0.13)
24 1.43 (0.09) 1.74 (0.18) 2.11 (0.05)
EIAV 6 0.25 (0.09) 0.19 (0.08) 0.36 (0.12)
24 0.39 (0.06) 0.24 (0.06) 1.36 (0.23)
Empty Vector
6 0.47 (0.27) 3.48 (1.73) 2.74 (0.39) 24 0.59 (0.04) 1.62 (0.15) 0.54 (0.64)
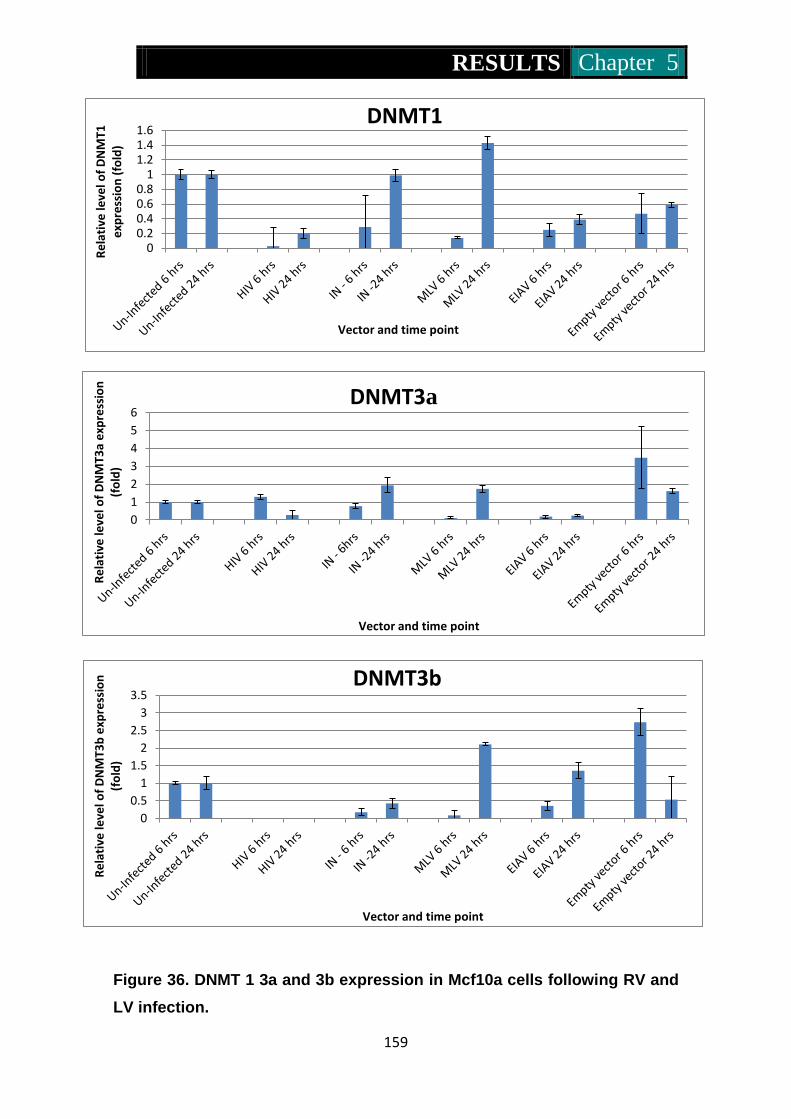
RESULTS Chapter 5
159
0 0.2 0.4 0.6 0.8
1 1.2 1.4 1.6
Re
lati
ve le
vel o
f D
NM
T1
exp
ress
ion
(fo
ld)
Vector and time point
DNMT1
0
1
2
3
4
5
6
Re
lati
ve le
vel o
f D
NM
T3a
exp
ress
ion
(f
old
)
Vector and time point
DNMT3a
0
0.5
1
1.5
2
2.5
3
3.5
Re
lati
ve le
vel o
f D
NM
T3b
exp
ress
ion
(f
old
)
Vector and time point
DNMT3b
Figure 36. DNMT 1 3a and 3b expression in Mcf10a cells following RV and
LV infection.

RESULTS Chapter 5
160
Q-RT-PCR was performed using DNMT1, 3a and 3b specific primer probes on
untreated cells and cells infected with HIV, IN-, MLV, EIAV, and MLV without genome
vectors.
To calculate RQ levels in experimental samples several steps were carried out:
DNMT values were normalized against 18sRNA CT values. All samples were
measured in triplicate. ΔCT values were used for calculations. ΔCT values from
experimental samples were subtracted from ΔCT values produced from controls
samples. Each bar represents the relative gene expression levels (RQ) - 2-ΔΔCT
calculated for each sample. The RQ levels for controls were set a value of 1. Error
bars, depict the standard error of the means taken from quadruplet readings. P.values
was derived using replicate CT values for T-tests.

RESULTS Chapter 5
161
Table 38. DNA methyltransferase gene expression in HepG2 cells
following RV and LV infection.
DNMT 1, 3a and 3b expression levels were measured in HepG2 cells infected with
MLV, IN-, EIAV, FIV and MLV without genome vectors. RNA was extracted 6 hours
and 24hours post infection. Expression levels shown represent 2-ΔΔCT values. All final 2-
ΔΔCT values were normalised against the values obtained for the untreated cells.
Standard errors of the means were calculated from quadruplet readings.
Sample Time
(hours) DNMT1 (+/-
SEM) DNMT3a (+/-
SEM) DNMT3b (+/-
SEM)
Un-
infected 6 1 (0.46) 1 (0.08) 1 (0.04)
24 1 (0.50) 1 (0.05) 1 (0.26)
IN- 6 0 (0.11) 0 (0.03) 0 (0.07)
24 0.09 (0.06) 0.11 (0.16) 0 (0.06)
MLV 6 0.1 (0.15) 0.13 (0.05) 0.18 (0.15)
24 0.05 (0.14) 0.02 (0.09) 0.03 (0.07)
EIAV 6 0.74 (0.33) 0.22 (0.05) 0.17 (0.12)
24 0.17 (0.25) 0.07 (0.13) 0.8 (0.15)
Empty Vector
6 0 (0.08) 0.01 (0.03) 0.01 (0.06) 24 0.69 (0.06) 1.52 (0.01) 0.19 (0.02)
FIV 6 0.05 (0.11) 0.6 (0.10) 0.12 (0.01)
24 0.77 (0.04) 33.13 (0.21) 8.22 (0.10)
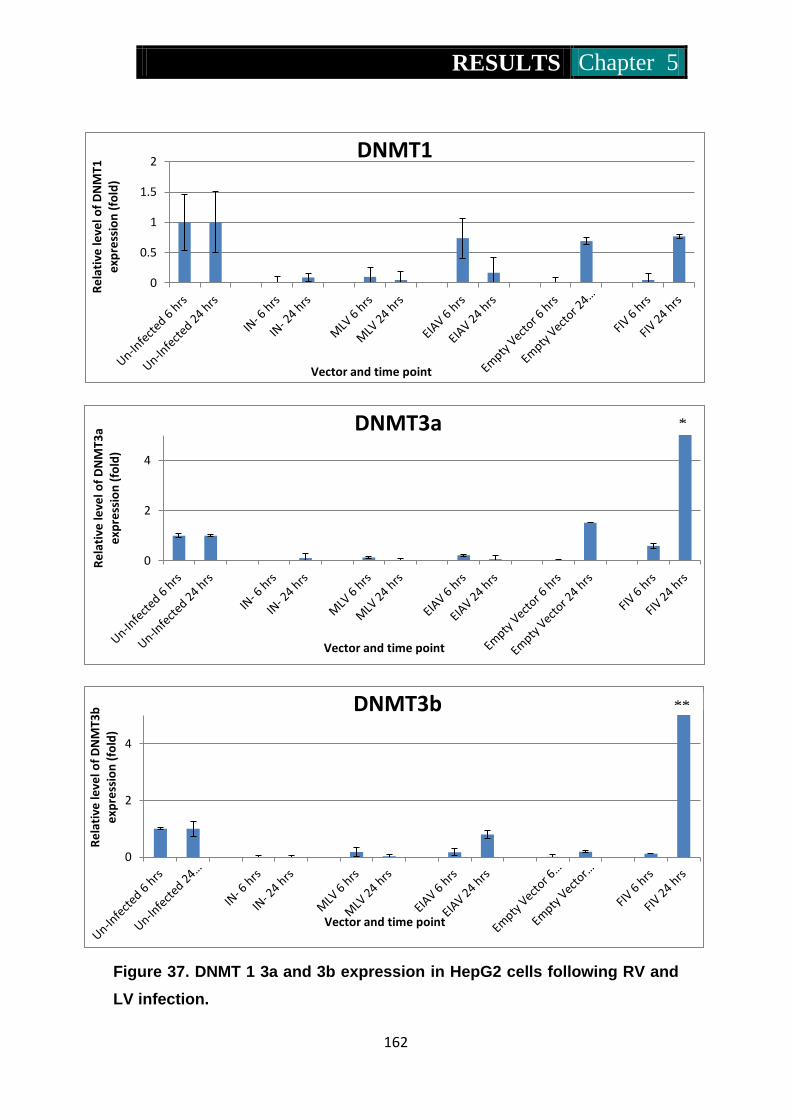
RESULTS Chapter 5
162
0
0.5
1
1.5
2
Re
lati
ve le
vel o
f D
NM
T1
exp
ress
ion
(fo
ld)
Vector and time point
DNMT1
0
2
4
Re
lati
ve le
vel o
f D
NM
T3a
exp
ress
ion
(fo
ld)
Vector and time point
DNMT3a
0
2
4
Re
lati
ve le
vel o
f D
NM
T3b
e
xpre
ssio
n (
fold
)
Vector and time point
DNMT3b
Figure 37. DNMT 1 3a and 3b expression in HepG2 cells following RV and
LV infection.
*
**

RESULTS Chapter 5
163
Q-RT-PCR was performed using DNMT1, 3a and 3b specific primer probes on
untreated cells and cells infected with FIV, IN-, MLV, EIAV, and MLV without genome
vectors.
To calculate RQ levels in experimental samples several steps were carried out:
DNMT values were normalized against 18sRNA CT values. All samples were
measured in triplicate. ΔCT values were used for calculations. ΔCT values from
experimental samples were subtracted from ΔCT values produced from controls
samples. Each bar represents the relative gene expression levels (RQ) - 2-ΔΔCT
calculated for each sample. The RQ levels for controls were set a value of 1. Error
bars, depict the standard error of the means taken from quadruplet readings. P.values
was derived using replicate CT values for T-tests.
*Denotes the DNMT3a level that exceeded the y-axis chart value measured at 33.13
fold greater.
** Denotes the DNMT3b level that exceeded the y-axis chart value measured at 8.22
fold greater.
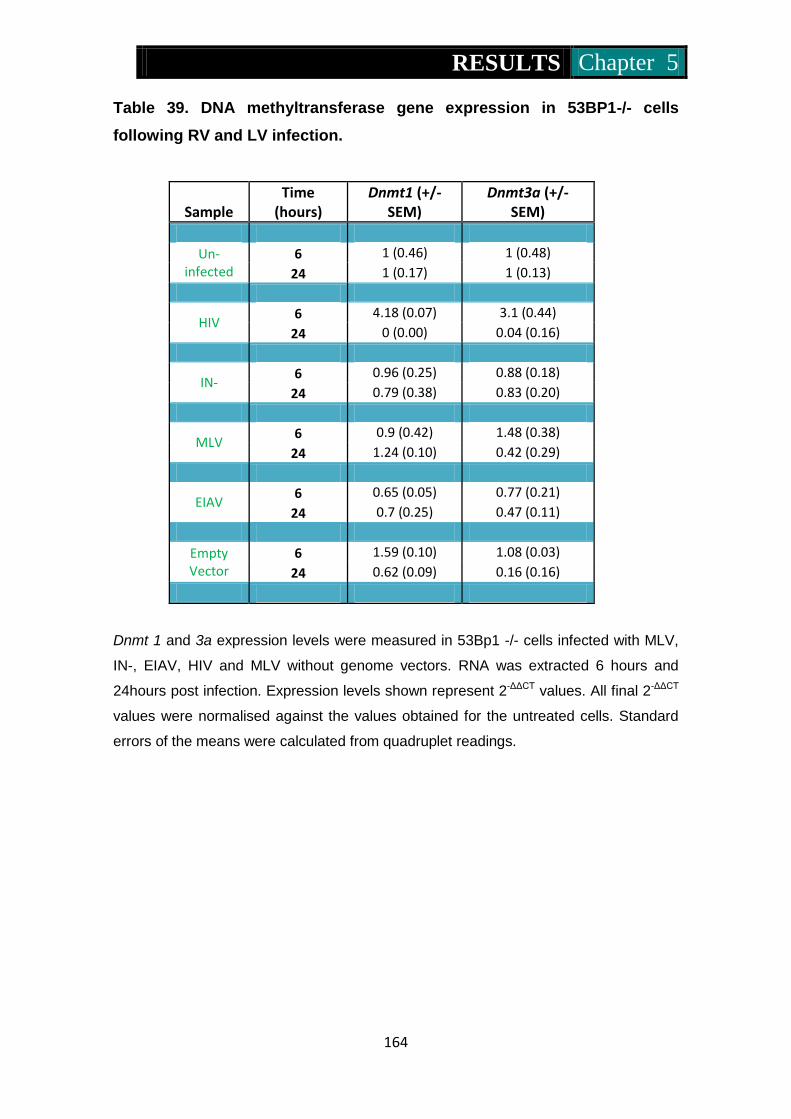
RESULTS Chapter 5
164
Table 39. DNA methyltransferase gene expression in 53BP1-/- cells
following RV and LV infection.
Sample Time
(hours) Dnmt1 (+/-
SEM) Dnmt3a (+/-
SEM)
Un-
infected 6 1 (0.46) 1 (0.48)
24 1 (0.17) 1 (0.13)
HIV 6 4.18 (0.07) 3.1 (0.44)
24 0 (0.00) 0.04 (0.16)
IN- 6 0.96 (0.25) 0.88 (0.18)
24 0.79 (0.38) 0.83 (0.20)
MLV 6 0.9 (0.42) 1.48 (0.38)
24 1.24 (0.10) 0.42 (0.29)
EIAV 6 0.65 (0.05) 0.77 (0.21)
24 0.7 (0.25) 0.47 (0.11)
Empty Vector
6 1.59 (0.10) 1.08 (0.03)
24 0.62 (0.09) 0.16 (0.16)
Dnmt 1 and 3a expression levels were measured in 53Bp1 -/- cells infected with MLV,
IN-, EIAV, HIV and MLV without genome vectors. RNA was extracted 6 hours and
24hours post infection. Expression levels shown represent 2-ΔΔCT values. All final 2-ΔΔCT
values were normalised against the values obtained for the untreated cells. Standard
errors of the means were calculated from quadruplet readings.

RESULTS Chapter 5
165
0
0.5
1
1.5
2
2.5
3
3.5
4
4.5
Re
lati
ve le
vel o
f D
nm
t1 e
xpre
ssio
n (
fold
)
Vector and time point
Dnmt1
0
0.5
1
1.5
2
2.5
3
3.5
4
Re
alti
ve le
vel o
f D
nm
t3a
exp
ress
ion
(fo
ld)
Vector and time point
Dnmt3a
Figure 38. Dnmt 1 and 3a expression in 53BP1-/- cells following RV and LV infection Q-RT-PCR was performed using Dnmt1 and 3a specific primer probes on untreated
cells and cells infected with IN-, MLV, EIAV, HIV and MLV without genome vectors.
To calculate RQ levels in experimental samples several steps were carried out:
DNMT values were normalized against 18sRNA CT values. All samples were
measured in triplicate. ΔCT values were used for calculations. ΔCT values from
experimental samples were subtracted from ΔCT values produced from controls
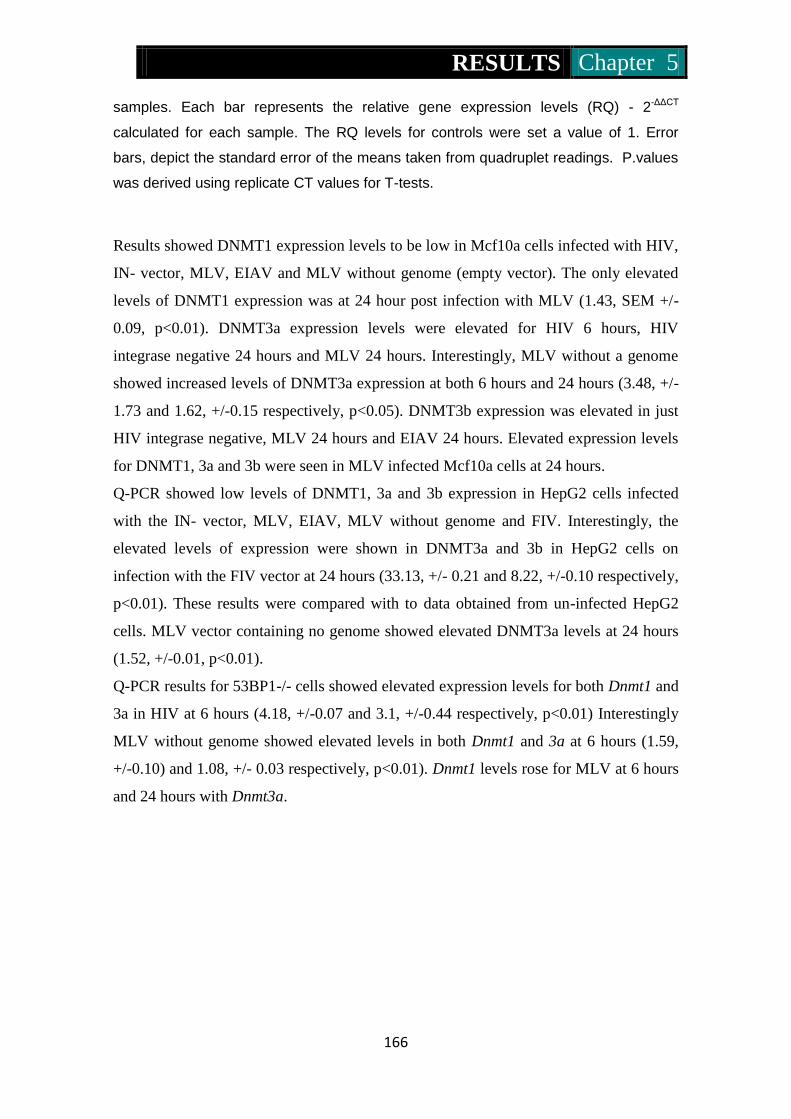
RESULTS Chapter 5
166
samples. Each bar represents the relative gene expression levels (RQ) - 2-ΔΔCT
calculated for each sample. The RQ levels for controls were set a value of 1. Error
bars, depict the standard error of the means taken from quadruplet readings. P.values
was derived using replicate CT values for T-tests.
Results showed DNMT1 expression levels to be low in Mcf10a cells infected with HIV,
IN- vector, MLV, EIAV and MLV without genome (empty vector). The only elevated
levels of DNMT1 expression was at 24 hour post infection with MLV (1.43, SEM +/-
0.09, p<0.01). DNMT3a expression levels were elevated for HIV 6 hours, HIV
integrase negative 24 hours and MLV 24 hours. Interestingly, MLV without a genome
showed increased levels of DNMT3a expression at both 6 hours and 24 hours (3.48, +/-
1.73 and 1.62, +/-0.15 respectively, p<0.05). DNMT3b expression was elevated in just
HIV integrase negative, MLV 24 hours and EIAV 24 hours. Elevated expression levels
for DNMT1, 3a and 3b were seen in MLV infected Mcf10a cells at 24 hours.
Q-PCR showed low levels of DNMT1, 3a and 3b expression in HepG2 cells infected
with the IN- vector, MLV, EIAV, MLV without genome and FIV. Interestingly, the
elevated levels of expression were shown in DNMT3a and 3b in HepG2 cells on
infection with the FIV vector at 24 hours (33.13, +/- 0.21 and 8.22, +/-0.10 respectively,
p<0.01). These results were compared with to data obtained from un-infected HepG2
cells. MLV vector containing no genome showed elevated DNMT3a levels at 24 hours
(1.52, +/-0.01, p<0.01).
Q-PCR results for 53BP1-/- cells showed elevated expression levels for both Dnmt1 and
3a in HIV at 6 hours (4.18, +/-0.07 and 3.1, +/-0.44 respectively, p<0.01) Interestingly
MLV without genome showed elevated levels in both Dnmt1 and 3a at 6 hours (1.59,
+/-0.10) and 1.08, +/- 0.03 respectively, p<0.01). Dnmt1 levels rose for MLV at 6 hours
and 24 hours with Dnmt3a.

RESULTS Chapter 5
167
Microarray analysis of cells infected with RV and LV vectors
In Chapters 4 and 5 on DNA damage and elevated methylation associated with RV and
LV infection were investigated. This suggested these processes linked where
comparisons were made in cells with or without 53BP1 related, DDR pathways. To
examine in detail pathways relating to DDR following infection, comparison was made
between infected and uninfected cells for differential gene expression. Significantly
differentially expressed genes (p<0.05) were then assigned to gene networks to
associate RV and LV infection with genes in pathways of DDR and methylation.
For this, Mcf10a cells were infected with MLV, EIAV and MLV without viral genome
vectors that provided the most obvious DDR and altered methylation status. Total RNA
was collected 6 hours post infection for cDNA synthesis and subsequent microarray
analysis. Gene expression analysis involved measurement of gene expression in infected
Mcf10a cells compared to normal uninfected Mcf10a cells.
Genes with gene ontology (GO) terms of “DNA repair”, “DNA damage” and “DNA
methylation” were selected from the microarray data. Then from these lists, genes with
differential expression of 1.2 fold or more were divided into sets that were up and down
regulated to create 6 sublists of genes for each of the 3 vectors.

RESULTS Chapter 5
168
Table 40. Genes up-regulated by 1.2 following infection of Mcf10a cells by MLV, EIAV and MLV without viral genome vectors.
Sample DNA Repair DNA Damage DNA
Methylation
MLV
CDT-2526A2.1 Hipk1 Trmt11 Eya3 Hmox1 Rpain Cdc14b
Upf1 Men1 Xrcc4
Cdc14b Men1
EIAV
Apex2 Bcl6 Tdrd9 Fgf10 Hmox1 Atrx Pole Nipbl Atrx Pml
Psma8 Sgk1
Vav3
MLV without genomes
Apex2 Hmox1 Eya2
The genes indicated are those whose ontologies belong to pathways involved in DNA
damage, repair and methylation. Genes highlighted in red indicate co-membership of
pathways. Fold changes in expression were calculated and those with statistically
significant fold changes in expression (Log2 1.5, with P<0.05) compared to control
untreated cells are shown.
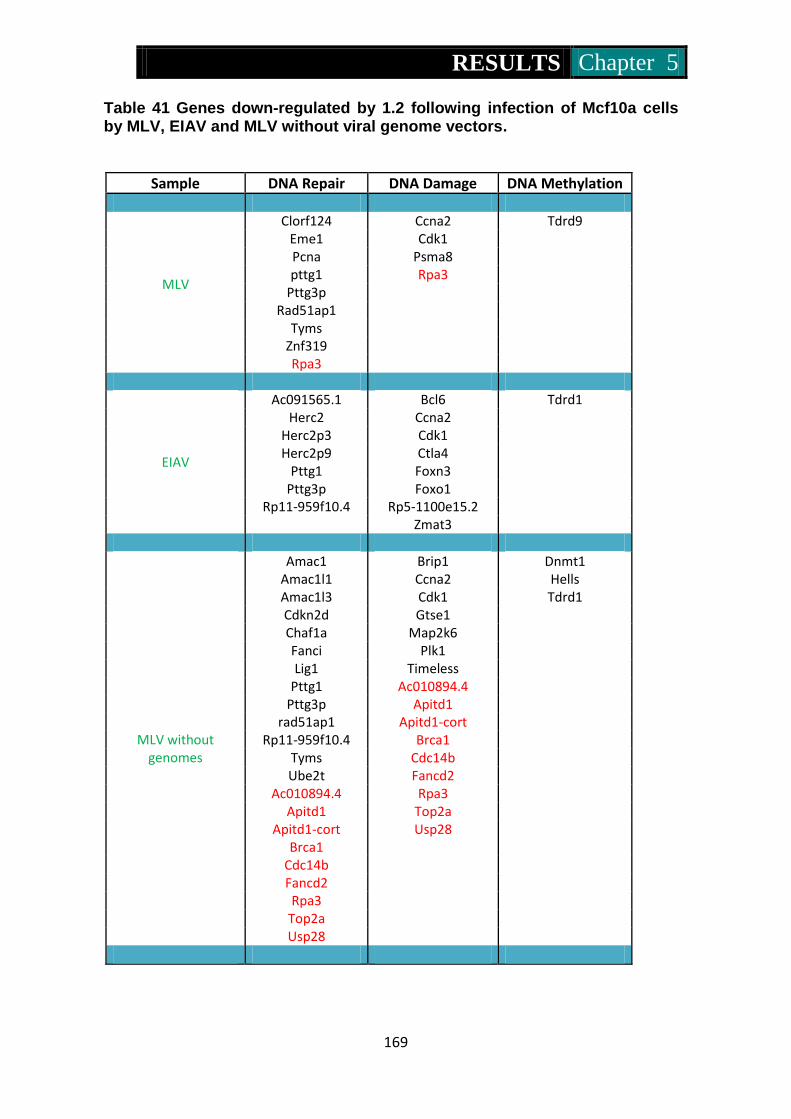
RESULTS Chapter 5
169
Table 41 Genes down-regulated by 1.2 following infection of Mcf10a cells by MLV, EIAV and MLV without viral genome vectors.
Sample DNA Repair DNA Damage DNA Methylation
MLV
Clorf124 Ccna2 Tdrd9 Eme1 Cdk1 Pcna Psma8 pttg1 Rpa3
Pttg3p Rad51ap1
Tyms Znf319 Rpa3
EIAV
Ac091565.1 Bcl6 Tdrd1 Herc2 Ccna2
Herc2p3 Cdk1 Herc2p9 Ctla4
Pttg1 Foxn3 Pttg3p Foxo1
Rp11-959f10.4 Rp5-1100e15.2 Zmat3
MLV without genomes
Amac1 Brip1 Dnmt1 Amac1l1 Ccna2 Hells Amac1l3 Cdk1 Tdrd1 Cdkn2d Gtse1 Chaf1a Map2k6 Fanci Plk1 Lig1 Timeless
Pttg1 Ac010894.4 Pttg3p Apitd1
rad51ap1 Apitd1-cort Rp11-959f10.4 Brca1
Tyms Cdc14b Ube2t Fancd2
Ac010894.4 Rpa3 Apitd1 Top2a
Apitd1-cort Usp28 Brca1
Cdc14b Fancd2 Rpa3
Top2a Usp28

RESULTS Chapter 5
170
The genes indicated are those whose ontologies belong to pathways involved in DNA
damage, repair and methylation. Genes in red indicate co-membership of pathways.
Fold changes in expression were calculated and those with statistically significant fold
changes in expression (Log2 1.5, with P<0.05) compared to control untreated cells are
shown.
Analysis of differential expression of target genes associated with the E2F
transcription factor
The E2F transcription factor has been found to be closely associated with oncogenesis
and is also known to control the expression of several genes in this process. E2F control
of its targets is also known to be closely controlled by methylation. Hence, the
microarray data generated in this study was also examined for differential expression of
E2F and its target genes. All genes differentially expression by Log2 1.2 fold or more
(up or down) with GO terms relating to pathways associated with DNA damage, repair
and methylation were analysed, using Opossum software
http://opossum.cisreg.ca/oPOSSUM3/ to carry predicted binding sites for the E2F
family of transcription factors. These genes are listed in Table 42. From the human
genome the number of genes that bind E2F was calculated to be 32.77%. From the
microarray the number of genes identified differentially expressed and binding E2F was
59%, which is significantly above the background.

RESULTS Chapter 5
171
Table 42 Genes associated with E2F binding from virus treated Mcf10a cells
Name Function
EIAV MLV MLV without genomes
P-value Differential expression P-value
Differential expression P-value
Differential expression
C1orf124 DNA repair 0.593754 0.166 0.464841 0.198 0.819603 0.055 BRCA1 DNA repair, DNA damage 0.679369 0.400 0.901237 0.103 0.679565 -0.272 FOXN3 DNA damage 0.197869 -0.497 0.273247 -0.374 0.821102 -0.058 EYA2 DNA repair 0.673374 0.324 0.851833 0.430 0.429063 1.179 FGF10 DNA repair 0.123058 1.692 0.943362 -0.050 0.229637 1.038 ATRX DNA methylation 0.020665 1.171 0.210453 0.442 0.407759 0.511 TDRD1 DNA methylation 0.361696 -1.388 0.680574 -0.467 0.296241 -2.252 LIG1 DNA repair 0.750754 -0.102 0.027018 -1.046 0.00024 -1.814 MAP2K6 DNA damage 0.078655 -0.955 0.156164 -0.604 0.007363 -1.165 RAD51AP1 DNA repair 0.4863 -0.265 0.027787 -0.586 0.009958 0.027 TIMELESS DNA damage 0.159691 -0.763 0.057118 -0.940 0.000786 -1.639 BCL6 DNA damage 0.004255 1.278 0.052734 0.255 0.960462 -0.009 HELLS DNA methylation 0.227824 -0.645 0.245671 -0.328 0.004707 -1.026 CDKN2D DNA repair 0.528424 -0.285 0.064288 -0.735 0.003066 -1.178 DNMT1 DNA methylation 0.700485 -0.170 0.056385 -0.922 0.002446 -1.385 PCNA DNA repair 0.090303 -0.948 0.022073 -1.353 0.016983 -0.992 VAV3 DNA damage 0.568429 1.667 0.263471 0.548 0.973223 0.323 BRIP1 DNA damage 0.331419 0.547 0.602064 0.291 0.011866 -1.806 FANCD2 DNA repair, DNA damage 0.247943 -0.589 0.966359 0.017 0.001998 -1.348 FOXO1 DNA damage 0.000345 -1.772 0.117376 -0.474 0.475278 -0.203 EME1 DNA repair 0.364587 -0.478 0.058038 -1.204 0.070106 -0.717 TDRD9 DNA methylation 0.920135 1.877 0.993967 0.003 0.198465 0.461 EYA3 DNA repair 0.707922 0.904 0.271913 1.953 0.658206 0.608
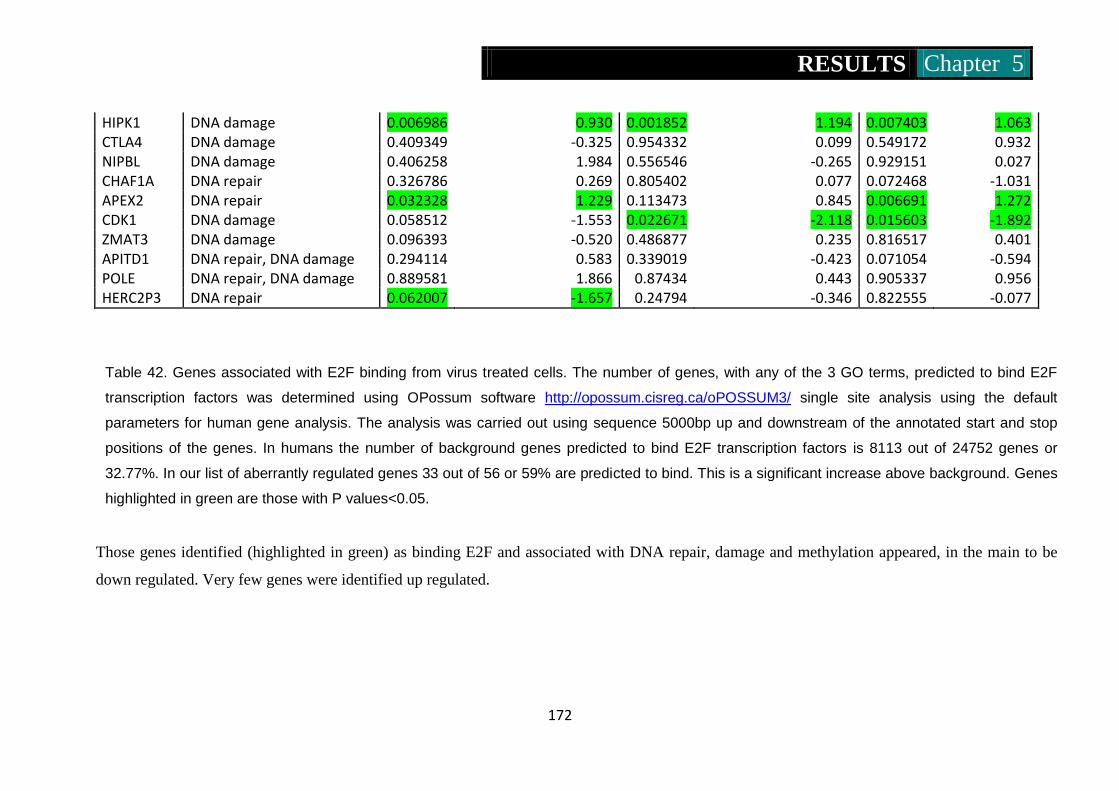
RESULTS Chapter 5
172
HIPK1 DNA damage 0.006986 0.930 0.001852 1.194 0.007403 1.063 CTLA4 DNA damage 0.409349 -0.325 0.954332 0.099 0.549172 0.932 NIPBL DNA damage 0.406258 1.984 0.556546 -0.265 0.929151 0.027 CHAF1A DNA repair 0.326786 0.269 0.805402 0.077 0.072468 -1.031 APEX2 DNA repair 0.032328 1.229 0.113473 0.845 0.006691 1.272 CDK1 DNA damage 0.058512 -1.553 0.022671 -2.118 0.015603 -1.892 ZMAT3 DNA damage 0.096393 -0.520 0.486877 0.235 0.816517 0.401 APITD1 DNA repair, DNA damage 0.294114 0.583 0.339019 -0.423 0.071054 -0.594 POLE DNA repair, DNA damage 0.889581 1.866 0.87434 0.443 0.905337 0.956 HERC2P3 DNA repair 0.062007 -1.657 0.24794 -0.346 0.822555 -0.077
Table 42. Genes associated with E2F binding from virus treated cells. The number of genes, with any of the 3 GO terms, predicted to bind E2F
transcription factors was determined using OPossum software http://opossum.cisreg.ca/oPOSSUM3/ single site analysis using the default
parameters for human gene analysis. The analysis was carried out using sequence 5000bp up and downstream of the annotated start and stop
positions of the genes. In humans the number of background genes predicted to bind E2F transcription factors is 8113 out of 24752 genes or
32.77%. In our list of aberrantly regulated genes 33 out of 56 or 59% are predicted to bind. This is a significant increase above background. Genes
highlighted in green are those with P values<0.05.
Those genes identified (highlighted in green) as binding E2F and associated with DNA repair, damage and methylation appeared, in the main to be
down regulated. Very few genes were identified up regulated.
DISCUSSION Chapter 6
173
6.1 Discussion
RV and LV gene therapy vectors deliver therapeutic genes to mammalian cells by
integrating their genome into host chromosome to provide the potential for permanent
therapeutic gene expression. However, this integration can be oncogenic as shown by
RV transduction of haematopoietic stem cells that led to leukaemia in animal models
and in several patients in gene therapy trials for the correction of X-SCID (Cavazzana-
Calvo, M. and Hacein-Bey-Abina, S., 2001; Cavazzana-Calvo et al., 2000) and caused
myelodysplasia in patients treated for chronic granulomatous disease (CGD) (Stein et
al., 2010; Malech et al., 1997; Bjorgvinsdottir et al., 1997). LV with SIN configuration
has been used successfully in the clinic for metachromic leukodystrophy and Wiskott-
Aldrich syndrome, however clonal dominance has been identified in patients following
transplantation of bone marrow in a patient with β-thalassemia (Cavazzana-Calvo, M.
and Hacein-Bey-Abina, S., 2010). In animal studies used to develop models for
genotoxicity, tumours have been associated with RV and LV delivery in a tumour prone
mouse and following non-primate LV administration in utero and neonatally to outbred
immune-competent mice. Transformation in vitro has also been documented in murine
stem cells. In the gene therapy trials for X-SCID performed by M. Cavazzana-Calvo in
France and A. Thrasher in the UK, the ex-vivo gene transfer protocol using MLV
transduction of hematopoietic stem cells (HSC) and re-infusion back to patients led to
intense research into the cause of the leukaemias in 5 patients from these trials. This
work enabled identification of RV integration into the LMO-2 gene and that this gene,
which is already known involved in childhood leukaemia, was dysregulated due to
active promoters and enhancers in the vector LTR(Cavazzana-Calvo et al, 2000;
Hacein-Bey-Abina et al, 2002; Gaspar and Thrasher, 2009).
The phenomenon of insertional mutagenesis (IM) has been studied for several years and
it is not entirely surprising this occurred in the gene therapy trials using RV vectors. IM
is clearly a genotoxic risk to the host as genes that are considered cancer associated are
potential targets for dysregulation. Down regulated gene expression has been
demonstrated following retrovirus insertion within genes and gene control regions or by
chromatin remodelling effects (Lazo and Tsichlis, 1988). This has resulted in tumour
suppressor gene inactivation (Ben-David et al., 1990). The genotoxic effects can occur
at some distance from the affected locus and furthermore, provirus can undergo
DISCUSSION Chapter 6
174
homologous recombination to elicit chromosomal rearrangements that could lead to
tumour development (Lazo and Tsichlis, 1988).
As a result of the findings of IM in gene therapy clinical trials, several groups including
that of Dr Michael Themis developed the highly sensitive in utero model to test the
safety of LV. In this genotoxicity model, lentiviral vectors were shown associated, at
high frequency, with the development of clonal liver tumours that have been
characterized as hepatocellular carcinoma (HCC). Both in adult KO mice for factor IX
(FIX) with haemophilia B and wild-type outbred, fully MF-1 immune-competent adult
mice, tumours were found to develop following administration of the EIAV (SMART2)
non-primate vector at day 16 gestation. Conversely, no tumours developed in mice
treated with primate HIV (HR’SIN-cPPT-S-FIX-W) vector carrying the human FIX
gene that enabled correction of the KO mouse model (Themis et al., 2005). These
findings were the origin of the fetal genotoxicity model and led to the proposal that gene
transfer in utero could be used as a valuable tool to evaluate LV genotoxicity and
discover genes involved in liver oncogenesis.
The development of liver tumours in mice treated with LV is suspected most likely due
to IM. However, tumour development varied with age in this model and some of the
clonal tumours had single virus insertions making difficult the assignment of
oncogenesis due only to IM but possibly due to alternative events supporting clonal
evolution either influenced and initiated by IM or completely independent to IM that are
synergistic to oncogenesis. Hence, oncogenesis may be due to provirus insertions within
or near to cancer genes on genes related to pathways of cancer and/or alternatively
events associated with virus infection.
6.1.1 Investigation of mouse tumour DNA compared to non-tumour
liver using CGH
Recently, Themis et al (2013) published two sets of findings using the in utero model.
In the first study they showed LV insertion is highly influenced by gene density and the
level of gene transcription, which they showed to be high in the foetal mouse. Also
these phenomena appear dependant on the vector where non-primate LV appears to
prefer highly transcribed genes whereas primate vector integration is less influenced by
this (Nowrouzi et al., 2012). In the second study, the group, in collaboration with Eithan

DISCUSSION Chapter 6
175
Galun at Haddassah Hospital, Jerusalem showed that genome instability is associated
with LV integration. This was demonstrated using comparative genome hybridisation
(CGH) that found amplifications and deletions of chromosomes following foetal
infection of mice and in cells in vitro with an alternative non-primate feline leukaemia
virus vector (Condiotti et al., 2013). Hence, in the work presented in this thesis CGH
was applied to 3 tumours isolated from the EIAV and HIV in utero treated mice of the
Themis model. Fortuitously, a spontaneous liver tumour that developed in an MF-1
mouse was also available for CGH. The CGH work out that was carried out in
collaboration with Dr Nathalie Conte of the Wellcome Trust indeed showed
amplifications and deletions in the non-primate treated tumours. Interestingly, in
Tumour 1 the entire chromosome 2 was amplified. In Tumour 2, a specific region
between 4559357 and 147876573 was amplified also and hence, further investigation of
this region was performed. Interestingly, in the region of amplification in Tumour 2,
near to the breakpoint, were the transcription factors Hnf4α and Foxa2. Foxa2 and
Hnf4a are closely related transcription factors and Hnf4a is also known to control
Hnf1a. Hnf4a and Hnf1a are known to be critical to the development and function of the
mouse liver (Wederell et al., 2008) and Foxa2 expression is also critical for hepatocyte
function (Wederell et al., 2008) . To test whether these genes were dysregulated RT-
PCR was applied to Tumour 1 and Tumour 2 compared with the normal livers of each
respective mouse.
In Tumour 1, Hnf4α and Hnf1α levels were found reduced by 0.62 log2 and 0.55 log
2
fold respectively (p<0.05) and Foxa2 was found increased in expression by 1.57 log2
fold (p<0.05). In Tumour 2, Hnf4α and Hnf1α and Foxa2 levels of expression were all
reduced by 0.18, 0.20 and 0.75 log2 fold (p<0.05), respectively. Hence, the CGH data
correlated with changes in gene expression. To further explore the possibility that
oncogenesis could involve IM and the genes identified by CGH of chromosome 2 in
Tumours 1 and 2, the provirus inserted genes in Tumour 2, described by Themis et al
(2005), were examined with Hnf4α and Hnf1α and Foxa2 for involvement in common
pathways relating to HCC.
Proviral insertions sites were retrieved from Tumour 2 mouse samples using LAM-PCR
retrieval. This resulted in the identification of insertions in the Pah and Acvr2a genes.
Acvr2a has not been found associated with HCC, however, the Pah gene that codes for
the enzyme phenylalanine hydroxylase has been found down-regulated when mutated in
DISCUSSION Chapter 6
176
individuals with phenylketonuria (PKU) who cannot process pheylalanine effectively
(Konecki and Lichter-Konecki, 1991) and has also been found down-regulated in HCC
(Lazarevich and Fleishman, 2008). As a result of this change in expression amino acids
build up to toxic levels in the blood and tissues. In Tumour 2, RT-PCR showed Pah
gene expression down regulated by 65.3%. To find a relationship between Pah and its
associated genes, Pah was investigated using the STRING (http;//string-db.org/)
database that finds predicted protein interactions that are directly (physical) and/or
indirectly (functional) associated in pathways between genes. From this analysis Pah
was found linked to Hnf4α and Hnf1α and Foxa2 along with several other genes that
were found differentially expressed in the microarray of Tumour 2. Unfortunately, the
microarray did not appear to show differential expression of Hnf1α and Foxa2 or Pah
but did identify reduced expression of Hnf4α.
Pah expression is linked to reduced expression of Hnf4α and Hnf4α, a master regulator
of hepatocyte transcription and as mentioned is linked to HCC. A study by Jixuan Li et
al showed that steady state levels of Pah could be seen in Hnf4α +/+ embryonic stem
cells derived from mouse livers and in the absence of Pah expression, Hnf4α expression
was found to be almost undetectable (Li et al., 2000).
Pcbd1 is known to be the stimulator of Pah in the phenylalanine hydroxylation pathway
with its co-factor hepatocyte nuclear factor (Hnf1α) a ubiquitous gene promoter
activator (Lockwood et al., 2003). It was therefore not surprising that Pcbd1 levels were
increased (0.343 log‾2, p-value 0.01) in Tumour 2. However, as Hnf4α, which is known
to activate Hnf1α was reduced in expression this may be the reason why it was not
possible to identify increased levels of Hnf1α in the microarray of this tumour. Indeed,
RT-PCR revealed Hnf1α levels reduced by 0.2 log2. In addition, reduced levels of Pah
is also linked to a reduced expression of Hnf1α. Disruption of the Hnf1α transcription
factor causes methylaton of the Pah promoter region, blocking hepatic chromatin
remodelling of the Pah locus and thereby results in undetectable levels of Pah gene
(Pontoglio et al., 1997). Hnf1α is also known to bind to Slc01α4 (Lockwood et al.,
2003) and since Hnf1α expression was reduced it therefore was not surprising that a
reduction in Slc01α4 expression was also identified (-0.113 log‾2, p=0.017).
The gene expression changes in Tumour 2 of the closely related transcription factors
Foxa2, Hnf1a and Hnf4a that are critical to the development and function of the mouse
liver appear to coincide with that expected for development of liver cancer (Wederell et
DISCUSSION Chapter 6
177
al., 2008). These changes also appear in line with altered Pah expression believed
caused by IM. This is also the case in Tumour 1 except for Foxa2, which was found
increased in expression by RT-PCR.
In conclusion, from these analyses, possible pathways to tumour development were
identified and the related genes that were found associated with genes identified using
CGH or by IM in the STRING data base support future research into mechanisms of
liver cell oncogenesis. However, it is well known that pathways to HCC are complex
and several pathways may exist for solid tumour development. Hence, the CGH and IM
data must be considered highly speculative before more detailed studies are applied to
the tumours found by the in utero genotoxicity model. What was evident from this work
was that vectors with the potential for genotoxicity exist and they differ in their
genotoxic potential.
Further study using Ingenuity Pathway analysis (IPA) of the microarray and RT-PCR of
these tumours revealed gene ontologies of genes in pathways of oxidative reduction and
DNA damage and repair (Nowrouzi et al., 2012). As already mentioned, cancer
development usually requires multiple genetic events beginning with cell
immortalization then progressing to malignancy and the hypothesis that IM alone cause
oncogenesis is hard to reconcile. Therefore, although the initial work using CGH and
IM inserted genes was useful, this study was directed towards investigating alternative
routes other than IM that contribute to oncogenesis. One such route was to investigate in
more detail the role of virus infection on genome instability. This choice of study was
based on the findings of genome instability by the Bushman laboratory that showed
virus integration to causes double strand breaks (Bushman et al., 2001). As this was
difficult to perform using the in utero model, assays to determine genome instability
involved the development of a cell culture model.
6.1.2 Investigation of vector associated genotoxicity in cells following in
vitro delivery of RV and LV
Four cell lines were used in the study. Two of which exhibited normal DNA repair
(Mcf10a and Mrc5) and two that are known to be repair deficient (At5biva and
Xp14br).

DISCUSSION Chapter 6
178
Most importantly, the level of infection of each cell line was first established. Each of
the four cell lines was found to be infectable albeit at different levels with RV and LV
vectors. At high titre, infection by MLV appeared highest for each cell line (98-100%)
followed by HIV (21-62%), EIAV (9-68%) and IN- (5-72%). These levels of infection
were assessed 24 hours post infection and the variation observed would also be
expected due to the survival of cells just after infection. Indeed, RV and LV DNA
integration is already known to cause damage to the host cell chromosome with DSB
being known to be highly pro-apoptotic, with as little as one DNA DSB sufficient to
arrest the cell cycle in G1 that then leads to cell death.
High concentrations of un integrated virus DNA which have free ends, may be sensed
as irreparable DNA damage in the cell, hence, the NHEJ pathway suppresses an
apoptotic response by joining ends to form circles. Where un-integrated viral DNA
accumulates cell death may occur. Indeed, At5biva and Xp14br cells showed low cell
survival after infection again suggesting virus infection causes cell death where DNA
damage repair is not present or inefficient. Interestingly, cell survival appeared lowest
in these cells compared to Mcf10a and Mrc5 cells when infected by most vectors, even
more so than when these cells were subject to 1Gy irradiation. Irradiation appeared to
cause little cell death in Mcf10a and Mrc5 cells compared to infection by virus vectors
suggesting the DNA damage caused by infection if not repaired is greater than when
cells are subjected to 1Gy irradiation. Levels of infection by the IN- vector were
measured after 72 hours using microscopy for GFP gene expression. Why this vector
infected cells to a greater level in cells with intact DNA repair pathways again points to
the requirement for DNA damage repair of RT converted virus genomes to circles
before gene expression can take place which is at a low level in At5biva and Xp14br
cells. Thus, high concentrations of unintegrated DNA may be toxic to cells as suggested
by Temim et al (1980) who showed un-integrated RV cDNA in infected cell correlates
with extent of the cytopathic effect observed after RV infection (Joy and Temin., 1980).
RV integration is catalyzed by the viral integrase protein which is required for the
insertion of virus DNA into the chromatin of host cells. Insertion of a 3-10kb vector into
the host DNA is likely to be sensed as a major assault on the genomic integrity of the
cell. Recruitment of DNA damage signaling and repair proteins to integration sites is
known to be essential for survival of the host cell and of the virus. In this respect
attenuated virus act in a similar manner to wild type replication competent virus. A
DISCUSSION Chapter 6
179
stable integrated provirus need not generally cause deleterious effects in the host cell,
however, if the DNA damage caused by the virus integrase in the host chromosome is
repaired and that unintegrated linear viral DNA is somehow protected so it is not
recognized by the DNA repair mechanism. The IN- vector showed a small decrease in
cell viability in all cell lines infected, however, it was far less so than the integrase
competent RV and LV. Therefore, if the IN- vector did induce apoptosis it was at low
levels. The fact that much lower cell survival was associated with the integrase
competent vector, especially in At5biva and Xp14br cells suggests that NHEJ activity
may be required for repair of DSB and possibly DNA gaps in integration intermediates
for cell survival. The requirement for cells to complete repair of DNA damage was also
demonstrated following irradiation of cells. The conclusion from these data is, therefore
that RV and LV infection is a DNA damage event that must be repaired for cell
survival. What is not known is how much repair is not completed and whether
incomplete repair leaves cell with mutations. Importantly, the fact that MLV without
genomes causes the highest DNA damage response suggests that vector production
should aim to reduce the number of active integrase enzyme molecules carried in virus
particles for gene transfer to reduce potential cell death or mutagenesis.
To quantify the DNA damage response to DSB in Mcf10a and Mrc5 that have been
previously shown with intact DNA repair pathways and Xp14br and At5biva cells
which do not have these pathways immunoflourescence of the DNA damage protein
53BP1 was used at 3 time points post infection or irradiation.
In Mcf10a and Mrc5 cells a typical, rapid recognition of DSB by 53BP1 was observed
and predictable induction of foci detected at 30 minutes post irradiation and at 6 hours
post RV and LV infection which was followed by repair of the DSB and reduction DSB
positive foci. The identification of DSB 6 hours post infection suggests this is the time
taken for the virus integrase to reach the nucleus and generate DSB. DSB is also known
to occur during DNA replication and cell division and also believed due to endogenous
agents such a reactive oxygen species from cellular metabolism within cells reactions
resulting in 1-2 foci being observable as ‘background’ DSB. This was observed in this
study as 53BP1 positive foci in the uninfected control cells. Positive controls for 53BP1
foci were irradiated cells (at 1Gy). The emergence of 53BP1 positive foci in the
irradiated cells were at a maximum level 30 minutes after irradiation where 13 foci per
nucleus was observed compared to 1-2 foci in the un-infected cells. Although not

DISCUSSION Chapter 6
180
examined for in this study, DSB are known to develop after 5 minutes following
irradiation (Schultz et al., 2000). Conversely, as mentioned, the number of DSB peaked
6 hours following infection as RV and LV need to cross the cell plasma membrane,
traverse the cytoplasm, penetrate the nuclear membrane and reach the genome for
insertion.
In the At5biva cell line derived from a classical ataxia telangiectasia patient, there was a
predictable induction of DSB. However due to the defect in the ATM gene which
results in a defective DSB repair there is a persistence of 53BP1 positive foci in the
cells 24 hour post irradiation and infection. In the Xp14br cells exposed to irradiation
and infection gave a similar observation. However, these cells have been shown
previously to be able to partially repair DSB following irradiation (Bourton et al., 2012).
This is believed due to the splicing defect in the DNA-Pkcs gene not eradicating all
active DNA-PKcs molecules enabling the remaining functional DNA-PKcs to support
the NHEJ repair pathway (Bourton et al., 2012). In the infected Xp14br cells, unlike
irradiation, infection may continue and cause further DSB. This was clearly observed by
the increase in DSB 6 hours post infection.
By using an IN- HIV derived defective vector, unlike the integrase positive vector a
similar number of 53BP1 positive foci to uninfected cells was found. Although the
extent of mutagenesis or lack of repair was not quantified in this study following
infection of cells, this would suggest once again the difference in the potential to cause
genotoxicity by each vector. This could be further tested using IN- and IN positive
vectors in the in utero mouse model where IN- would be expected not to be associated
with induction of HCC. Most importantly and as previously mentioned, the fact that the
vector not carrying genome caused such a high DSB response suggests this vector may
induce HCC in the in utero model if DSB induction is indeed involved in oncogenesis.
The study of virus integration being associated with DSB presented in this work
suggests a relationship between vector-related features and cell-intrinsic properties that
may be involved in oncogenesis. The outcome of infection and DSB repair is unknown.
One possible outcome is chromosomal instability and, therefore, it is tempting to
hypothesize that viral integration may induce tumour formation by this process acting
independently or synergistically with IM. DSB induced by treatment with irradiation or
genotoxic drugs has been suggested as a considerable pathway to oncogenesis
previously (Skalka and Katz 2005). By showing this also to be the cause during virus

DISCUSSION Chapter 6
181
infection, albeit at a lower level, suggests this mechanism of oncogenesis to be feasible
and should not be overlooked when infecting cells at high titre as is often performed
during ex-vivo gene therapy.
Several genes involved in cell division, growth and differentiation that are also known
involved in tumour development once mutated and classed as oncogenes or tumour
suppressor genes are potential targets for integration. If these genes are being ‘hit’ by
the virus integration leading to DSB and then repair, then any mistakes in this repair
will lead to mutagenesis. How much virus that recruits the DNA repair pathway
machinery is unknown. This could in turn reduce the ability of the cell to repair DSB
especially where infection involved high titre virus. Clearly, further examination of this
potential is required.
It is also natural to question whether the DSB breaks observed in vitro following
infection was the cause of genome instability leading to amplifications and deletions
identified by the CGH assay of the tumours harvested from the mice treated in utero by
EIAV LV. It would not be possible to determine this from the mouse tumours because
these evolved over several month’s time making it impossible to associate virus
infection and integration changes in DNA structure.
6.1.3 Investigation of chromosome integrity using mFISH and G-
banding following infection
To assign genome instability to virus integration, in vitro analysis of Mcf10a cells for
karyotypic chromosome changes was performed in collaboration with Ruby Banerjee at
the Welcome Trust, Hinxton, UK. This work involved multi-colour fluorescence in situ
hybridisation (mFISH). Mcf10a cells were infected with each of the MLV, HIV and
EIAV vectors and 2 weeks later cells were compared karyotypically with un-infected
Mcf10a cells. Because no rearrangements were observed in the infected cells no gross
chromosomal changes could be assigned to infection. However, it would be interesting
to perform this in a time course from 2 weeks to 6 weeks in case instability takes time to
manifest itself. Also, although not performed in this study, CGH of infected cells versus
uninfected controls would highlight amplifications or deletions that could have occurred
that would not be identified by mFISH.
DISCUSSION Chapter 6
182
Incoming retrovirus-like elements to the cell genome have been closely associated with
the innate immune response of the cell. This response, in the form of methylation has
evolved to protect the host genome from invasion by switching off gene expression
from the incoming invading element. This element can be bacterial or a virus and is
well documented for endogenous retrovirus particles and intracisternal A-type particles
(Rowe et al., 2013). DNA damage has been also been associated with the enzymes
involved in methylation and DNMT1 has also recently been found associated with DNA
repair (Palii et al., 2008). DNMT1 deficient MESCs were found to have a 10 fold
increase in de novo mutation of the hrpt locus (Chen et al., 1998) suggesting the increase
in the rate of mutation to be linked to a role by DNMT1 in the DNA repair pathway.
(Armstrong et al., 2012). DNMT1 is also known to be involved in maintaining genome
integrity as it has been shown to accumulate at sites of DNA damage. Cells deficient in
DNMT1 showed severe defects in the activation of key DSB responses such as lack of
gH2AX induction and reduced phosphorylation of p53 and CHK1 (Palii et al., 2008).
6.1.4 Epigenetic modifications and E2F regulation of host genes
following RV and LV vector delivery
Therefore this study also investigated the effects of RV and LV infection on global
methylation in Mcf10a, and HepG2 cells. MEF 53BP1 -/- cells were also used in this
analysis to determine whether a block in the repair of DSB restricts an increase in
methylation levels as opposed to that found in Mcf10a and HepG2 cells that have intact
DNA repair pathways. Also, to determine whether methylation changes were associated
only with integration, the IN- defective vector was used. A MLV vector containing no
genome (empty vector) was also used to identify whether infection alone without the
virus genome initiates methylation.
Global methylation levels in Mcf10a, HepG2 and MEF 53BP1 -/- cell genomes were
investigated to indicate whether host methylation had occurred following infection. In
Mcf10a cells global methylation levels increased significantly (P<0.05) at virtually all
time points for each vector (excluding the EIAV LV at 24 and 72 hours). Although
these increases were not consistent for all time points, the general trend was that
methylation increased following infection. This was found even more pronounced
following infection with the MLV empty vector and only partially with the IN- vector

DISCUSSION Chapter 6
183
that was consistent for each time point post infection. This observation appeared
repeated for HepG2 cells except that for these cells IN- at 24 and 72 hours, MLV at 72
hours and the alternative non-primate FIV vector all showed levels of global
methylation increase. Interestingly, the FIV vector that also were shown by the Themis
group in collaboration with the research group of Dr Eithan Galun at Haddassah
university, Jerusalem, to be associated with high frequency HCC (Condiotti et al., 2013)
caused the greatest increase of global methylation 4.25 (+/- 0.11) fold greater than un-
infected HeG2 samples. Interestingly, the IN- vector in this cells line appeared more
strongly associated with increased methylation suggesting that integration may add to
the cell’s methylation response to the incoming virus and that the presence of non-
integrating genomes can independently initiate a host innate immune response.
Importantly, though MLV empty particles induce a larger response in both Mcf10a and
HepG2 cells than IN- vector.
To associate the methylation response by cells to DNA damage, global methylation was
then measured in the MEF 53BP1-/- cell line. Only the EIAV vector appeared to
increase global methylation in these cells. As the rest of the vectors used on MEF
53BP1-/- cells did not cause elevated global methylation levels the EIAV observation
may be an anomaly and warrants repeating. Most importantly, very little or no increase
in methylation was found in this cell line following infection by the remaining RV and
LV strongly indicating DNA damage to be associated with the innate cells methylation
response. This is consistent with studies by Palii et al in 2008 that showed cells
deficient in DNMT1 resulted in defects in the activation of key DSB responses (Palii et
al., 2008).
DNA methyl transferase (DNMTs) contributes to the maintenance (DNMT1) of
methylation patterns in the mammalian genome and plays a key role in de novo
methylation (DNMT 3a and 3b). A number of studies have highlighted the role of viral
infection on stimulating the cellular methylation machinery. Leonard et al (2011)
showed an up regulation of DNMT3a and a down regulation of DNMT3b and DNMT1
following EBV infection of B cells (Leonard et al., 2011). Thus it was of significance
to show that the observed changes in the in global methylation found in RV and LV
infected cells correlated with changes in DNMT expression. Q-PCR analysis was used
DISCUSSION Chapter 6
184
to measure the expression of DNMT1, 3a and 3b in Mcf10a, HepG2 and 53BP1 -/- cell
types.
Analysis of DSB in Mcf10a cells infected with the MLV vector identified levels of
53BP1 foci increase at 6 hours and subsequently decrease at 24 hours, presumably due
to DNA repair. At this time point global methylation levels increased albeit slightly (1.4
fold) and then further at 24 hours (2.72 fold) and remained similar to this level after 72
hours. This follows the DNMT1 expression levels observed which although found
decreased at 6 hours (0.14 fold) increased at 24 hours (1.43 fold).
The MEF 53BP1-/-cell line that is NHEJ deficient showed no increases in DNA global
methylation at 6 and 24 hours post infection with MLV vectors suggesting 53BP1 may
be involved in initiation of host methylation. This appears accompanied by levels of
DNMT1 decreasing at 6 hours post infection with MLV followed by a very slight
increase at 24 hours (1.24 fold). For the cell lines that have DNA repair pathways, DSB
appear at 6 hours followed by repair at 24 hours onwards after infection except At5biva
and Xp14br cell lines where DSB continue to increase at 24 hours as no repair in taking
place. It would be interesting to measure global methylation and DNMT1 levels in
At5biva and Xp14br cell lines following infection to determine whether induction of
DNMT1 occurs and if this is truly dependent on the 53BP1 protein alone. Collectively,
these data suggests that DNA methylation may require DNMT1 for DNA repair.
Mcf10a cells infected with MLV vector containing no genome had a more pronounced
increase in numbers of 53BP1 foci at 6 hours post infection followed by repair at 24
hours shown by the decrease in 53BP1 foci at this time point. Global methylation levels
for this vector increased to the highest level compared to any of the other vectors used
(44.23 fold) at 6 hours. Once again, global methylation then decreased after 24 hours
and further at 72 hours (12.62 and 7.12 fold, respectively). However, DNMT1
expression levels were found decreased at 6 and 24 hours post infection. This was also
supported by microarray of Mcf10a cells with a decrease in DNMT1 levels at 6 hours
post infection for cells infected with the MLV without genome. This suggests
methylation does not require DNMT1. Also, where there is MLV genome but no
integrase (IN-) there is increasing global methylation and levels of DNMT1 increase. It
is impossible to reconcile this data because the IN- vector is HIV based and different
genomes or integrase molecules may have different effects on the host response to these
factors as found by the variation in DSB levels, global meathylation and DNMT levels

DISCUSSION Chapter 6
185
between treated cells. What is clearly evident is that lack of DNMT 1 coincides with
absence of global methylation. Ideally, focussing on MLV vectors alone with and
without genomes and with IN- would be beneficial to understanding the relationship
between DNA damage and methylation.
HIV vector infection of Mcf10a is followed by an increase in global methylation levels
at 6 hours (2.86 fold) then a decrease (1.21 fold) followed by an increase at 72 hours
(4.14 fold). DNMT1 levels were found to decrease at 6 hours (0.03 fold) and 24 hours
(0.20 fold) post infection. These results are inconsistent with the findings of Fang et al
(2000) (Fang et al., 2001) where cells infected with attenuated HIV vectors show an
increase in DNMT1 expression. Their DNMT1 measurements were, however,
performed at 3-5 days post infection and levels of DNMT1 in this study may have
increased in line with the increase in global methylation identified if measurements of
DNMT1 were taken at this time point. Surprisingly, DNMT1 rose markedly in MEF
53BP-/- cells infected with the HIV vector at 6 hours and slightly for EIAV.
Increases in DNMT 3a and 3b (the DNA methyltransferases required to establish DNA
methylation) levels in cells increased in Mcf10 cells for most vectors except IN-
suggesting the integrase is required to induce these methyltransferases. The requirement
for the vector genome to induce DNMT 3a and b expression is questionable since
infection with the MLV vector without genome appeared to be associated with the
highest DNMT 3a and b level increase. In HepG2 cells, no such increase in DNMT 3a
and b was observed except for when FIV vector was used, however, global methylation
increases did occur in these cells when infected by all vectors. This made the results
obtained in HepG2 difficult to explain and this work requires repeating.
It is obvious from the study presented here that different vectors appear to be associated
with different responses by the host. Not only were these differences found for MLV
and HIV vectors but even the FIV vector which is an alternative non-primate vector to
EIAV showed a markedly different host global methylation response to infection in
HepG2 cells. Indeed, in vivo the HIV vector was not associated with oncogenesis but
the EIAV and FIV vectors were. Although, analysis of DNMTs was not performed in
cells infected with the FIV vector, the lack of global methylation increase in MEF
53BP1-/- cells infected with this vector agrees with this finding for each of the other
vectors used in this study.

DISCUSSION Chapter 6
186
Our results from our methylation assay suggested infection to be related to DNA
damage and elevated methylation levels. To examine this is detail differential gene
expression in pathways for DNA damage, DNA repair and DNA methylation were
studied in Mcf10a cells. Gene expression was measured in all infected samples and
compared to normal un-infected Mcf10a samples. Mcf10a samples were infected with
the EIAV, MLV and MLV vector without genome (empty vector). Genes with gene
ontology terms of “DNA repair”, “DNA damage” and “DNA methylation” were
selected from the microarray data. Genes with 1.2 fold or more increase or decrease
difference were selected. Out of the 61 genes found to be up-regulated 62.3% were
found to be associated with the DNA damage pathway, 46% involved in the DNA repair
pathway and 8.2% in the DNA methylation pathway. 25 genes were found down
regulated. Out of these genes 52% were associated with DNA repair, 48% involved in
the DNA repair pathway and 12% in the DNA methylation pathway.
E2F control of its target genes is known to be controlled by methylation of CpG regions
of target gene promoters. It was suspected that the increased global methylation could
potentially lead to changes in the expression of these transcription factor target genes
some of which are oncogenes or tumour suppressor genes and known to be involved in
several cancers. E2F target genes are also genes involved in DNA damage and repair
mechanisms. This was shown by Polager et al (2002) who demonstrated E2F1 and
E2F3 actively up regulates DNA repair gene expression (Polager et al., 2002). Frame et
al (2006) also showed that following dysregulation of E2F1 that the MRN complex,
which is required NHEJ DNA repair cannot localise 53BP1 and γH2AX to sites of
DNA damage (Frame et al., 2006). Hence E2F transcription factors are closely linked to
DNA damage and this process is controlled by methylation which if altered could have
a role in cancer development.
Using Opossum software http://opossum.cisreg.ca/oPOSSUM3/, the number of genes in
the human genome with predicted motifs for E2F binding and are thus potential E2F
targets equates to 32.7%. The number of genes that have E2F binding motifs found
deregulated by microarray analysis (p<0.05) after infection of Mcf10a cells with EIAV,
MLV and MLV without genome was 59%. Hence, there were significant changes in
E2F targets differentially expressed in infected cells compared with un-infected cells.
Of the E2F target genes analysed 28.6% was found to be involved in DNA damage,
DISCUSSION Chapter 6
187
28.6% were known to be involved in DNA repair and 9% were found to be involved in
DNA methylation. Interestingly of the 56 genes found aberrantly expressed the number
of genes most significantly changed in expression levels (p<0.05) were in cells infected
by the MLV vector without genome and the majority of these genes are involved in the
DDR pathway. This also agrees with the DSB identified by 53BP1 immunofluorescence
in nuclei of Mcf10a cells infected with this vector.
6.1 Conclusion
The findings described in this thesis although preliminary suggest an alternative
pathway of genotoxicity related to virus infection whereby infection followed by
integration leads to DNA damage. This then provokes the host innate immune system to
methylate its own genome and this leads to changes in E2F target gene expression. As
these targets are known involved in cell proliferation, division, differentiation, control
of homeostasis and have a role in cancer, this suggests such changes in expression
would be detrimental to cells. We can hypothesize that this may be linked or
independent to insertional mutagenesis and may potentially be mechanistic to the HCC
found in mice treated with EIAV and FIV vectors. Although it was not shown here in
vitro that genome instability occurred after incomplete DNA damage repair this should
be further investigated.
Refrences
188
Abbaszadeh, F., Clingen, P.H., Arlett, C.F., Plowman, P.N., Bourton, E.C., Themis, M.,
Makarov, E.M., Newbold, R.F., Green, M.H. and Parris, C.N. (2010) "A novel splice
variant of the DNA-PKcs gene is associated with clinical and cellular radiosensitivity
in a patient with xeroderma pigmentosum ", Journal of medical genetics, vol. 47, no.
3, pp. 176-181.
Aiuti, A., Slavin, S., Aker, M., Ficara, F., Deola, S., Mortellaro, A., Morecki, S., Andolfi,
G., Tabucchi, A., Carlucci, F., Marinello, E., Cattaneo, F., Vai, S., Servida, P.,
Miniero, R., Roncarolo, M.G. and Bordignon, C. (2002) "Correction of ADA-SCID by
stem cell gene therapy combined with nonmyeloablative conditioning ", Science (New
York, N.Y.), vol. 296, no. 5577, pp. 2410-2413.
Akagi, K., Suzuki, T., Stephens, R.M., Jenkins, N.A. and Copeland, N.G. (2004) "RTCGD:
retroviral tagged cancer gene database ", Nucleic acids research, vol. 32, no. Database
issue, pp. D523-7.
Albanese, A., Arosio, D., Terreni, M. and Cereseto, A. (2008) "HIV-1 pre-integration
complexes selectively target decondensed chromatin in the nuclear periphery ", PloS
one, vol. 3, no. 6, pp. e2413.
Amsterdam, A., Burgess, S., Golling, G., Chen, W., Sun, Z., Townsend, K., Farrington, S.,
Haldi, M. and Hopkins, N. (1999) "A large-scale insertional mutagenesis screen in
zebrafish ", Genes & development, vol. 13, no. 20, pp. 2713-2724.
Arlett, C.F., Green, M.H., Priestley, A., Harcourt, S.A. and Mayne, L.V. (1988)
"Comparative human cellular radiosensitivity: I. The effect of SV40 transformation
and immortalisation on the gamma-irradiation survival of skin derived fibroblasts from
normal individuals and from ataxia-telangiectasia patients and heterozygotes ",
International journal of radiation biology, vol. 54, no. 6, pp. 911-928.
Armstrong, C.A., Jones, G.D., Anderson, R., Iyer, P., Narayanan, D., Sandhu, J., Singh, R.,
Talbot, C.J. and Tufarelli, C. (2012) "DNMTs are required for delayed genome
instability caused by radiation ", Epigenetics : official journal of the DNA Methylation
Society, vol. 7, no. 8, pp. 892-902.
Astrakhan, A., Sather, B.D., Ryu, B.Y., Khim, S., Singh, S., Humblet-Baron, S., Ochs,
H.D., Miao, C.H. and Rawlings, D.J. (2012) "Ubiquitous high-level gene expression in
hematopoietic lineages provides effective lentiviral gene therapy of murine Wiskott-
Aldrich syndrome ", Blood, vol. 119, no. 19, pp. 4395-4407.
Barnes, D.E. (2001) "Non-homologous end joining as a mechanism of DNA repair ",
Current biology : CB, vol. 11, no. 12, pp. R455-7.

Refrences
189
Barraza, R.A. and Poeschla, E.M. (2008) "Human gene therapy vectors derived from feline
lentiviruses", Veterinary immunology and immunopathology, vol. 123, no. 1-2, pp. 23-
31.
Bassing, C.H. and Alt, F.W. (2004) "The cellular response to general and programmed
DNA double strand breaks ", DNA repair, vol. 3, no. 8-9, pp. 781-796.
Bassing, C.H., Suh, H., Ferguson, D.O., Chua, K.F., Manis, J., Eckersdorff, M., Gleason,
M., Bronson, R., Lee, C. and Alt, F.W. (2003) "Histone H2AX: a dosage-dependent
suppressor of oncogenic translocations and tumors ", Cell, vol. 114, no. 3, pp. 359-370.
Bassing, C.H., Swat, W. and Alt, F.W. (2002) "The mechanism and regulation of
chromosomal V(D)J recombination ", Cell, vol. 109 Suppl, pp. S45-55.
Baum, C., Dullmann, J., Li, Z., Fehse, B., Meyer, J., Williams, D.A. and von Kalle, C.
(2003) "Side effects of retroviral gene transfer into hematopoietic stem cells ", Blood,
vol. 101, no. 6, pp. 2099-2114.
Baum, C., Kustikova, O., Modlich, U., Li, Z. and Fehse, B. (2006) "Mutagenesis and
oncogenesis by chromosomal insertion of gene transfer vectors", Human Gene
Therapy, vol. 17, no. 3, pp. 253-263.
Baum, C., von Kalle, C., Staal, F.J., Li, Z., Fehse, B., Schmidt, M., Weerkamp, F.,
Karlsson, S., Wagemaker, G. and Williams, D.A. (2004) "Chance or necessity?
Insertional mutagenesis in gene therapy and its consequences ", Molecular therapy :
the journal of the American Society of Gene Therapy, vol. 9, no. 1, pp. 5-13.
Baylin, S.B. and Herman, J.G. (2000) "DNA hypermethylation in tumorigenesis:
epigenetics joins genetics ", Trends in genetics : TIG, vol. 16, no. 4, pp. 168-174.
Ben-David, Y., Lavigueur, A., Cheong, G.Y. and Bernstein, A. (1990) "Insertional
inactivation of the p53 gene during friend leukemia: a new strategy for identifying
tumor suppressor genes ", The New biologist, vol. 2, no. 11, pp. 1015-1023.
Bendich, A. (1961) "Nucleic Acids and the Genesis of Cancer ", Bulletin of the New York
Academy of Medicine, vol. 37, no. 10, pp. 661-674.
Benit, L., Dessen, P. and Heidmann, T. (2001) "Identification, phylogeny, and evolution of
retroviral elements based on their envelope genes ", Journal of virology, vol. 75, no.
23, pp. 11709-11719.
Bestor, T., Laudano, A., Mattaliano, R. and Ingram, V. (1988) "Cloning and sequencing of
a cDNA encoding DNA methyltransferase of mouse cells. The carboxyl-terminal
domain of the mammalian enzymes is related to bacterial restriction methyltransferases
", Journal of Molecular Biology, vol. 203, no. 4, pp. 971-983.
Refrences
190
Bjorgvinsdottir, H., Ding, C., Pech, N., Gifford, M.A., Li, L.L. and Dinauer, M.C. (1997)
"Retroviral-mediated gene transfer of gp91phox into bone marrow cells rescues defect
in host defense against Aspergillus fumigatus in murine X-linked chronic
granulomatous disease ", Blood, vol. 89, no. 1, pp. 41-48.
Blackburn, M.R., Datta, S.K., Wakamiya, M., Vartabedian, B.S. and Kellems, R.E. (1996)
"Metabolic and immunologic consequences of limited adenosine deaminase expression
in mice ", The Journal of biological chemistry, vol. 271, no. 25, pp. 15203-15210.
Blaese, R.M., Culver, K.W., Miller, A.D., Carter, C.S., Fleisher, T., Clerici, M., Shearer,
G., Chang, L., Chiang, Y., Tolstoshev, P., Greenblatt, J.J., Rosenberg, S.A., Klein, H.,
Berger, M., Mullen, C.A., Ramsey, W.J., Muul, L., Morgan, R.A. and Anderson, W.F.
(1995) "T lymphocyte-directed gene therapy for ADA- SCID: initial trial results after
4 years ", Science (New York, N.Y.), vol. 270, no. 5235, pp. 475-480.
Borenfreund, E. and Bendich, A. (1961) "A Study of the Penetration of Mammalian Cells
by Deoxyribonucleic Acids ", The Journal of biophysical and biochemical cytology,
vol. 9, no. 1, pp. 81-91.
Bouard, D., Alazard-Dany, D. and Cosset, F.L. (2009) "Viral vectors: from virology to
transgene expression ", British journal of pharmacology, vol. 157, no. 2, pp. 153-165.
Bourton, E.C., Plowman, P.N., Zahir, S.A., Senguloglu, G.U., Serrai, H., Bottley, G. and
Parris, C.N. (2012) "Multispectral imaging flow cytometry reveals distinct frequencies
of gamma-H2AX foci induction in DNA double strand break repair defective human
cell lines ", Cytometry.Part A : the journal of the International Society for Analytical
Cytology, vol. 81, no. 2, pp. 130-137.
Boveri, T. (2008) "Concerning the origin of malignant tumours by Theodor Boveri.
Translated and annotated by Henry Harris ", Journal of cell science, vol. 121 Suppl 1,
pp. 1-84.
Brown, K.D. and Robertson, K.D. (2007) "DNMT1 knockout delivers a strong blow to
genome stability and cell viability ", Nature genetics, vol. 39, no. 3, pp. 289-290.
Brügger, B., Krautkrämer, E., Tibroni, N., Munte, C.E., Rauch, S., Leibrecht, I., Glass, B.,
Breuer, S., Geyer, M., Kräusslich, H., Kalbitzer, H., Wieland, F.T. and Fackler, O.T.
(2007) "Human Immunodeficiency Virus Type 1 Nef protein modulates the lipid
composition of virions and host cell membrane microdomains ", Retrovirology, vol. 4,
no. 1, pp. 70.
Buchschacher, G.L.,Jr and Wong-Staal, F. (2000) "Development of lentiviral vectors for
gene therapy for human diseases ", Blood, vol. 95, no. 8, pp. 2499-2504.
Bukrinsky, M.I., Sharova, N., McDonald, T.L., Pushkarskaya, T., Tarpley, W.G. and
Stevenson, M. (1993) "Association of integrase, matrix, and reverse transcriptase

Refrences
191
antigens of human immunodeficiency virus type 1 with viral nucleic acids following
acute infection ", Proceedings of the National Academy of Sciences of the United
States of America, vol. 90, no. 13, pp. 6125-6129.
Burns J C, Friedmann T and Driever W, Burrascano M, and Yee J K. (1993) “Vesicular
stomatitis virus G glycoprotein pseudotyped retroviral vectors: concentration to very high
titer and efficient gene transfer into mammalian and nonmammalian cells”, PNAS, Vol. 90,
no 17, pp.8033-8037
Bushman, F., Lewinski, M., Ciuffi, A., Barr, S., Leipzig, J., Hannenhalli, S. and Hoffmann,
C. (2005) "Genome-wide analysis of retroviral DNA integration", Nature
reviews.Microbiology, vol. 3, no. 11, pp. 848-858.
Bushman, F.D. (2007) "Retroviral integration and human gene therapy ", The Journal of
clinical investigation, vol. 117, no. 8, pp. 2083-2086.
Cardone, G., Purdy, J.G., Cheng, N., Craven, R.C. and Steven, A.C. (2009) "Visualization
of a missing link in retrovirus capsid assembly ", Nature, vol. 457, no. 7230, pp. 694-
698.
Cattoglio, C., Maruggi, G., Bartholomae, C., Malani, N., Pellin, D., Cocchiarella, F.,
Magnani, Z., Ciceri, F., Ambrosi, A., von Kalle, C., Bushman, F.D., Bonini, C.,
Schmidt, M., Mavilio, F. and Recchia, A. (2010) "High-definition mapping of
retroviral integration sites defines the fate of allogeneic T cells after donor lymphocyte
infusion ", PloS one, vol. 5, no. 12, pp. e15688.
Cavazzana-Calvo, M. and Hacein-Bey-Abina, S. (2001) "Correction of genetic blood
defects by gene transfer", Current opinion in hematology, vol. 8, no. 6, pp. 360-367.
Cavazzana-Calvo, M., Hacein-Bey, S., de Saint Basile, G., Gross, F., Yvon, E., Nusbaum,
P., Selz, F., Hue, C., Certain, S., Casanova, J.L., Bousso, P., Deist, F.L. and Fischer, A.
(2000) "Gene therapy of human severe combined immunodeficiency (SCID)-X1
disease ", Science (New York, N.Y.), vol. 288, no. 5466, pp. 669-672.
Celeste, A., Petersen, S., Romanienko, P.J., Fernandez-Capetillo, O., Chen, H.T.,
Sedelnikova, O.A., Reina-San-Martin, B., Coppola, V., Meffre, E., Difilippantonio,
M.J., Redon, C., Pilch, D.R., Olaru, A., Eckhaus, M., Camerini-Otero, R.D.,
Tessarollo, L., Livak, F., Manova, K., Bonner, W.M., Nussenzweig, M.C. and
Nussenzweig, A. (2002) "Genomic instability in mice lacking histone H2AX ",
Science (New York, N.Y.), vol. 296, no. 5569, pp. 922-927.
Chang, L.J., Liu, X. and He, J. (2005) "Lentiviral siRNAs targeting multiple highly
conserved RNA sequences of human immunodeficiency virus type 1 ", Gene therapy,
vol. 12, no. 14, pp. 1133-1144.
Check, E. (2002) "A tragic setback", Nature, vol. 420, no. 6912, pp. 116-118.

Refrences
192
Chellappan, S.P., Hiebert, S., Mudryj, M., Horowitz, J.M. and Nevins, J.R. (1991) "The
E2F transcription factor is a cellular target for the RB protein ", Cell, vol. 65, no. 6, pp.
1053-1061.
Chen, R.Z., Pettersson, U., Beard, C., Jackson-Grusby, L. and Jaenisch, R. (1998) "DNA
hypomethylation leads to elevated mutation rates ", Nature, vol. 395, no. 6697, pp. 89-
93.
Chen, S.T., Iida, A., Guo, L., Friedmann, T. and Yee, J.K. (1996) "Generation of packaging
cell lines for pseudotyped retroviral vectors of the G protein of vesicular stomatitis
virus by using a modified tetracycline inducible system ", Proceedings of the National
Academy of Sciences of the United States of America, vol. 93, no. 19, pp. 10057-
10062.
Cherepanov, P. (2007) "LEDGF/p75 interacts with divergent lentiviral integrases and
modulates their enzymatic activity in vitro ", Nucleic acids research, vol. 35, no. 1, pp.
113-124.
Cleaver, J.E. (1968) "Defective repair replication of DNA in xeroderma pigmentosum ",
Nature, vol. 218, no. 5142, pp. 652-656.
Coffin, J.M. (1996) "Retroviridae: the viruses and their replication.", Fields Virology, , pp.
1767-848.
Condiotti R, Goldenberg D, Giladi H, Schnitzer-Perlman T, Waddington S, Buckley SM,
Heim D, Cheung W, Themis M, Charles C, Simerzin A, Osejindu E, Wege H, Themis
M, Galun E. (2013) "Transduction of fetal mice with a feline lentiviral vector induces
liver tumors which exhibit an E2F activation signature.", Mol.Ther., [Online], .
[9/25/2013].
Cosset, F.L., Takeuchi, Y., Battini, J.L., Weiss, R.A. and Collins, M.K. (1995) "High-titer
packaging cells producing recombinant retroviruses resistant to human serum ",
Journal of virology, vol. 69, no. 12, pp. 7430-7436.
Coutelle, C., Themis, M., Waddington, S., Gregory, L., Nivsarkar, M., Buckley, S., Cook,
T., Rodeck, C., Peebles, D. and David, A. (2003) "The hopes and fears of in utero gene
therapy for genetic disease--a review ", Placenta, vol. 24 Suppl B, pp. S114-21.
Coutelle, C., Themis, M., Waddington, S.N., Buckley, S.M., Gregory, L.G., Nivsarkar,
M.S., David, A.L., Peebles, D., Weisz, B. and Rodeck, C. (2005) "Gene therapy
progress and prospects: fetal gene therapy--first proofs of concept--some adverse
effects ", Gene therapy, vol. 12, no. 22, pp. 1601-1607.
Cowell, J.K., LaDuca, J., Rossi, M.R., Burkhardt, T., Nowak, N.J. and Matsui, S. (2005)
"Molecular characterization of the t(3;9) associated with immortalization in the
MCF10A cell line ", Cancer genetics and cytogenetics, vol. 163, no. 1, pp. 23-29.
Refrences
193
Cronin, J., Zhang, X.Y. and Reiser, J. (2005) "Altering the tropism of lentiviral vectors
through pseudotyping ", Current gene therapy, vol. 5, no. 4, pp. 387-398.
Culver, K.W., Osborne, W.R., Miller, A.D., Fleisher, T.A., Berger, M., Anderson, W.F.
and Blaese, R.M. (1991) "Correction of ADA deficiency in human T lymphocytes
using retroviral-mediated gene transfer ", Transplantation proceedings, vol. 23, no. 1
Pt 1, pp. 170-171.
Cuozzo, C., Porcellini, A., Angrisano, T., Morano, A., Lee, B., Di Pardo, A., Messina, S.,
Iuliano, R., Fusco, A., Santillo, M.R., Muller, M.T., Chiariotti, L., Gottesman, M.E.
and Avvedimento, E.V. (2007) "DNA damage, homology-directed repair, and DNA
methylation ", PLoS genetics, vol. 3, no. 7, pp. e110.
Damico, R. and Bates, P. (2000) "Soluble receptor-induced retroviral infection of receptor-
deficient cells ", Journal of virology, vol. 74, no. 14, pp. 6469-6475.
Daniel, R., Greger, J.G., Katz, R.A., Taganov, K.D., Wu, X., Kappes, J.C. and Skalka,
A.M. (2004) "Evidence that stable retroviral transduction and cell survival following
DNA integration depend on components of the nonhomologous end joining repair
pathway ", Journal of virology, vol. 78, no. 16, pp. 8573-8581.
Daniel, R., Katz, R.A. and Skalka, A.M. (1999) "A role for DNA-PK in retroviral DNA
integration ", Science (New York, N.Y.), vol. 284, no. 5414, pp. 644-647.
Danos, O. and Mulligan, R.C. (1988) "Safe and efficient generation of recombinant
retroviruses with amphotropic and ecotropic host ranges", Proceedings of the National
Academy of Sciences of the United States of America, vol. 85, no. 17, pp. 6460-6464.
Das, S.R. and Jameel, S. (2005) "Biology of the HIV Nef protein ", The Indian journal of
medical research, vol. 121, no. 4, pp. 315-332.
Dave, U.P., Akagi, K., Tripathi, R., Cleveland, S.M., Thompson, M.A., Yi, M., Stephens,
R., Downing, J.R., Jenkins, N.A. and Copeland, N.G. (2009) "Murine leukemias with
retroviral insertions at Lmo2 are predictive of the leukemias induced in SCID-X1
patients following retroviral gene therapy ", PLoS genetics, vol. 5, no. 5, pp. e1000491.
DeGregori, J., Leone, G., Miron, A., Jakoi, L. and Nevins, J.R. (1997) "Distinct roles for
E2F proteins in cell growth control and apoptosis ", Proceedings of the National
Academy of Sciences of the United States of America, vol. 94, no. 14, pp. 7245-7250.
del Pozo-Rodriguez, A., Delgado, D., Solinis, M.A., Gascon, A.R. and Pedraz, J.L. (2008)
"Solid lipid nanoparticles for retinal gene therapy: transfection and intracellular
trafficking in RPE cells ", International journal of pharmaceutics, vol. 360, no. 1-2,
pp. 177-183.

Refrences
194
Delassus, S., Cheynier, R. and Wain-Hobson, S. (1991) "Evolution of human
immunodeficiency virus type 1 nef and long terminal repeat sequences over 4 years in
vivo and in vitro ", Journal of virology, vol. 65, no. 1, pp. 225-231.
Delviks-Frankenberry, K., Galli, A., Nikolaitchik, O., Mens, H., Pathak, V.K. and Hu, W.S.
(2011) "Mechanisms and factors that influence high frequency retroviral
recombination ", Viruses, vol. 3, no. 9, pp. 1650-1680.
Devaskar, S.U. & Raychaudhuri, S. (2007) "Epigenetics--a science of heritable biological
adaptation.", Pediatric research, vol. 5, no1R-4R
Dinauer, M.C., Gifford, M.A., Pech, N., Li, L.L. and Emshwiller, P. (2001) "Variable
correction of host defense following gene transfer and bone marrow transplantation in
murine X-linked chronic granulomatous disease ", Blood, vol. 97, no. 12, pp. 3738-
3745.
Dolinoy, D.C., Weidman, J.R. and Jirtle, R.L. (2007) "Epigenetic gene regulation: linking
early developmental environment to adult disease ", Reproductive toxicology
(Elmsford, N.Y.), vol. 23, no. 3, pp. 297-307.
Douar, A., Themis, M. and Coutelle, C. (1996) "Fetal somatic gene therapy ", Molecular
human reproduction, vol. 2, no. 9, pp. 633 <last_page> 641.
DS, G. (2005) "The molecular perspective: double-stranded DNA breaks", stem cells, vol.
23, no. 7, pp. 1021-2.
Dull, T., Zufferey, R., Kelly, M., Mandel, R.J., Nguyen, M., Trono, D. and Naldini, L.
(1998) "A third-generation lentivirus vector with a conditional packaging system ",
Journal of virology, vol. 72, no. 11, pp. 8463-8471.
Dyson, N. (1998) "The regulation of E2F by pRB-family proteins ", Genes & development,
vol. 12, no. 15, pp. 2245-2262.
Edelstein, M.L., Abedi, M.R. and Wixon, J. (2007) "Gene therapy clinical trials worldwide
to 2007--an update ", The journal of gene medicine, vol. 9, no. 10, pp. 833-842.
Erlwein, O., Bieniasz, P.D. and McClure, M.O. (1998) "Sequences in pol are required for
transfer of human foamy virus-based vectors ", Journal of virology, vol. 72, no. 7, pp.
5510-5516.
Essers, J., van Steeg, H., de Wit, J., Swagemakers, S.M., Vermeij, M., Hoeijmakers, J.H.
and Kanaar, R. (2000) "Homologous and non-homologous recombination
differentially affect DNA damage repair in mice ", The EMBO journal, vol. 19, no. 7,
pp. 1703-1710.
Refrences
195
Fang, J.Y., Mikovits, J.A., Bagni, R., Petrow-Sadowski, C.L. and Ruscetti, F.W. (2001)
"Infection of lymphoid cells by integration-defective human immunodeficiency virus
type 1 increases de novo methylation ", Journal of virology, vol. 75, no. 20, pp. 9753-
9761.
Fehse, B. and Roeder, I. (2008) "Insertional mutagenesis and clonal dominance: biological
and statistical considerations ", Gene therapy, vol. 15, no. 2, pp. 143-153.
Fernandez-Capetillo, O., Chen, H.T., Celeste, A., Ward, I., Romanienko, P.J., Morales,
J.C., Naka, K., Xia, Z., Camerini-Otero, R.D., Motoyama, N., Carpenter, P.B., Bonner,
W.M., Chen, J. and Nussenzweig, A. (2002) "DNA damage-induced G2-M checkpoint
activation by histone H2AX and 53BP1 ", Nature cell biology, vol. 4, no. 12, pp. 993-
997.
Finer, M.H., Dull, T.J., Qin, L., Farson, D. and Roberts, M.R. (1994) "kat: a high-efficiency
retroviral transduction system for primary human T lymphocytes", Blood, vol. 83, no.
1, pp. 43-50.
FitzGerald, J.E., Grenon, M. and Lowndes, N.F. (2009) "53BP1: function and mechanisms
of focal recruitment ", Biochemical Society transactions, vol. 37, no. Pt 4, pp. 897-904.
Follenzi, A., Ailles, L.E., Bakovic, S., Geuna, M. and Naldini, L. (2000) "Gene transfer by
lentiviral vectors is limited by nuclear translocation and rescued by HIV-1 pol
sequences", Nature genetics, vol. 25, no. 2, pp. 217-222.
Fouchier, R.A. and Malim, M.H. (1999) "Nuclear import of human immunodeficiency
virus type-1 preintegration complexes ", Advances in Virus Research, vol. 52, pp. 275-
299.
Fouty, B. and Solodushko; Chapter 4, V. (2011) "Viral Gene Therapy; The Glucocorticoid
Receptor in Retroviral Infection"
Frame, F.M., Rogoff, H.A., Pickering, M.T., Cress, W.D. and Kowalik, T.F. (2006) "E2F1
induces MRN foci formation and a cell cycle checkpoint response in human fibroblasts
", Oncogene, vol. 25, no. 23, pp. 3258-3266.
Friedberg, E.C. (2002) "The intersection between the birth of molecular biology and the
DNA repair and mutagenesis field", DNA Repair (Amst), vol. 1, pp. 855-867.
Friedmann, T. and Roblin, R. (1972) "Gene therapy for human genetic disease? ", Science
(New York, N.Y.), vol. 175, no. 4025, pp. 949-955.
Ganser-Pornillos, B.K., Yeager, M. and Sundquist, W.I. (2008) "The structural biology of
HIV assembly ", Current opinion in structural biology, vol. 18, no. 2, pp. 203-217.
Refrences
196
Gartler, S.M., Goldstein, L., Tyler-Freer, S.E. and Hansen, R.S. (1999) "The timing of
XIST replication: dominance of the domain ", Human molecular genetics, vol. 8, no. 6,
pp. 1085-1089.
Gaspar, H.B., Parsley, K.L., Howe, S., King, D., Gilmour, K.C., Sinclair, J., Brouns, G.,
Schmidt, M., Von Kalle, C., Barington, T., Jakobsen, M.A., Christensen, H.O., Al
Ghonaium, A., White, H.N., Smith, J.L., Levinsky, R.J., Ali, R.R., Kinnon, C. and
Thrasher, A.J. (2004) "Gene therapy of X-linked severe combined immunodeficiency
by use of a pseudotyped gammaretroviral vector", Lancet, vol. 364, no. 9452, pp.
2181-2187.
Gaspar, H.B., Parsley, K.L., Howe, S., King, D., Gilmour, K.C., Sinclair, J., Brouns, G.,
Schmidt, M., Von Kalle, C., Barington, T., Jakobsen, M.A., Christensen, H.O., Al
Ghonaium, A., White, H.N., Smith, J.L., Levinsky, R.J., Ali, R.R., Kinnon, C. and
Thrasher, A.J. (2004) "Gene therapy of X-linked severe combined immunodeficiency
by use of a pseudotyped gammaretroviral vector ", Lancet, vol. 364, no. 9452, pp.
2181-2187.
Gilbert, P.B., McKeague, I.W., Eisen, G., Mullins, C., Gueye-NDiaye, A., Mboup, S. and
Kanki, P.J. (2003) "Comparison of HIV-1 and HIV-2 infectivity from a prospective
cohort study in Senegal ", Statistics in medicine, vol. 22, no. 4, pp. 573-593.
Goff, S.P. (2001) "Intracellular trafficking of retroviral genomes during the early phase of
infection: viral exploitation of cellular pathways ", The journal of gene medicine, vol.
3, no. 6, pp. 517-528.
Goff, S.P. (1987) "Gene isolation by retroviral tagging ", Methods in enzymology, vol. 152,
pp. 469-481.
Goverdhana, S., Puntel, M., Xiong, W., Zirger, J.M., Barcia, C., Curtin, J.F., Soffer, E.B.,
Mondkar, S., King, G.D., Hu, J., Sciascia, S.A., Candolfi, M., Greengold, D.S.,
Lowenstein, P.R. and Castro, M.G. (2005) "Regulatable gene expression systems for
gene therapy applications: progress and future challenges ", Molecular therapy : the
journal of the American Society of Gene Therapy, vol. 12, no. 2, pp. 189-211.
Guo, G., Wang, W. and Bradley, A. (2004) "Mismatch repair genes identified using genetic
screens in Blm-deficient embryonic stem cells ", Nature, vol. 429, no. 6994, pp. 891-
895.
Hacein-Bey-Abina, S., Garrigue, A., Wang, G.P., Soulier, J., Lim, A., Morillon, E.,
Clappier, E., Caccavelli, L., Delabesse, E., Beldjord, K., Asnafi, V., MacIntyre, E., Dal
Cortivo, L., Radford, I., Brousse, N., Sigaux, F., Moshous, D., Hauer, J., Borkhardt,
A., Belohradsky, B.H., Wintergerst, U., Velez, M.C., Leiva, L., Sorensen, R.,
Wulffraat, N., Blanche, S., Bushman, F.D., Fischer, A. and Cavazzana-Calvo, M.
(2008) "Insertional oncogenesis in 4 patients after retrovirus-mediated gene therapy of
SCID-X1 ", The Journal of clinical investigation, vol. 118, no. 9, pp. 3132-3142.
Refrences
197
Hacein-Bey-Abina, S., Hauer, J., Lim, A., Picard, C., Wang, G.P., Berry, C.C., Martinache,
C., Rieux-Laucat, F., Latour, S., Belohradsky, B.H., Leiva, L., Sorensen, R., Debre,
M., Casanova, J.L., Blanche, S., Durandy, A., Bushman, F.D., Fischer, A. and
Cavazzana-Calvo, M. (2010) "Efficacy of gene therapy for X-linked severe combined
immunodeficiency ", The New England journal of medicine, vol. 363, no. 4, pp. 355-
364.
Hacein-Bey-Abina, S., Von Kalle, C., Schmidt, M., McCormack, M.P., Wulffraat, N.,
Leboulch, P., Lim, A., Osborne, C.S., Pawliuk, R., Morillon, E., Sorensen, R., Forster,
A., Fraser, P., Cohen, J.I., de Saint Basile, G., Alexander, I., Wintergerst, U., Frebourg,
T., Aurias, A., Stoppa-Lyonnet, D., Romana, S., Radford-Weiss, I., Gross, F., Valensi,
F., Delabesse, E., Macintyre, E., Sigaux, F., Soulier, J., Leiva, L.E., Wissler, M., Prinz,
C., Rabbitts, T.H., Le Deist, F., Fischer, A. and Cavazzana-Calvo, M. (2003) "LMO2-
associated clonal T cell proliferation in two patients after gene therapy for SCID-X1 ",
Science (New York, N.Y.), vol. 302, no. 5644, pp. 415-419.
Hacker, C.V., Vink, C.A., Wardell, T.W., Lee, S., Treasure, P., Kingsman, S.M.,
Mitrophanous, K.A. and Miskin, J.E. (2006) "The integration profile of EIAV-based
vectors ", Molecular therapy : the journal of the American Society of Gene Therapy,
vol. 14, no. 4, pp. 536-545.
Helleday, T., Lo, J., van Gent, D.C. and Engelward, B.P. (2007) "DNA double-strand break
repair: from mechanistic understanding to cancer treatment ", DNA repair, vol. 6, no.
7, pp. 923-935.
Hematti, P., Hong, B.K., Ferguson, C., Adler, R., Hanawa, H., Sellers, S., Holt, I.E.,
Eckfeldt, C.E., Sharma, Y., Schmidt, M., von Kalle, C., Persons, D.A., Billings, E.M.,
Verfaillie, C.M., Nienhuis, A.W., Wolfsberg, T.G., Dunbar, C.E. and Calmels, B.
(2004) "Distinct genomic integration of MLV and SIV vectors in primate
hematopoietic stem and progenitor cells ", PLoS biology, vol. 2, no. 12, pp. e423.
Holman, A.G. and Coffin, J.M. (2005) "Symmetrical base preferences surrounding HIV-1,
avian sarcoma/leukosis virus, and murine leukemia virus integration sites ",
Proceedings of the National Academy of Sciences of the United States of America, vol.
102, no. 17, pp. 6103-6107.
Howe, S.J., Mansour, M.R., Schwarzwaelder, K., Bartholomae, C., Hubank, M., Kempski,
H., Brugman, M.H., Pike-Overzet, K., Chatters, S.J., de Ridder, D., Gilmour, K.C.,
Adams, S., Thornhill, S.I., Parsley, K.L., Staal, F.J., Gale, R.E., Linch, D.C., Bayford,
J., Brown, L., Quaye, M., Kinnon, C., Ancliff, P., Webb, D.K., Schmidt, M., von
Kalle, C., Gaspar, H.B. and Thrasher, A.J. (2008) "Insertional mutagenesis combined
with acquired somatic mutations causes leukemogenesis following gene therapy of
SCID-X1 patients ", The Journal of clinical investigation, vol. 118, no. 9, pp. 3143-
3150.

Refrences
198
Huyen, Y., Zgheib, O., Ditullio, R.A.,Jr, Gorgoulis, V.G., Zacharatos, P., Petty, T.J.,
Sheston, E.A., Mellert, H.S., Stavridi, E.S. and Halazonetis, T.D. (2004) "Methylated
lysine 79 of histone H3 targets 53BP1 to DNA double-strand breaks ", Nature, vol.
432, no. 7015, pp. 406-411.
Iovino, F., Lentini, L., Amato, A. and Di Leonardo, A. (2006) "RB acute loss induces
centrosome amplification and aneuploidy in murine primary fibroblasts ", Molecular
cancer, vol. 5, pp. 38.
Jackson, S.P. (2002) "Sensing and repairing DNA double-strand breaks ", Carcinogenesis,
vol. 23, no. 5, pp. 687-696.
Jeggo, P.A. and Lobrich, M. (2007) "DNA double-strand breaks: their cellular and clinical
impact? ", Oncogene, vol. 26, no. 56, pp. 7717-7719.
Joachims, M.L., Marble, P.A., Laurent, A.B., Pastuszko, P., Paliotta, M., Blackburn, M.R.
and Thompson, L.F. (2008) "Restoration of adenosine deaminase-deficient human
thymocyte development in vitro by inhibition of deoxynucleoside kinases ", Journal of
immunology (Baltimore, Md.: 1950), vol. 181, no. 11, pp. 8153-8161.
Jones, P.A. and Laird, P.W. (1999) "Cancer epigenetics comes of age ", Nature genetics,
vol. 21, no. 2, pp. 163-167.
Josephson, C.D. and Abshire, T.C. (2006) "Clinical uses of plasma and plasma fractions:
plasma-derived products for hemophilias A and B, and for von Willebrand disease ",
Best practice & research.Clinical haematology, vol. 19, no. 1, pp. 35-49.
Kaiser, J. (2003) "Gene therapy. Seeking the cause of induced leukemias in X-SCID trial",
Science (New York, N.Y.), vol. 299, no. 5606, pp. 495.
Kanaar, R., Hoeijmakers, J.H. and van Gent, D.C. (1998) "Molecular mechanisms of DNA
double strand break repair ", Trends in cell biology, vol. 8, no. 12, pp. 483-489.
Kang, E.M. and Malech, H.L. (2009) "Advances in treatment for chronic granulomatous
disease ", Immunologic research, vol. 43, no. 1-3, pp. 77-84.
Kastan, M.B. and Bartek, J. (2004) "Cell-cycle checkpoints and cancer ", Nature, vol. 432,
no. 7015, pp. 316-323.
Katen, L.J., Januszeski, M.M., Anderson, W.F., Hasenkrug, K.J. and Evans, L.H. (2001)
"Infectious entry by amphotropic as well as ecotropic murine leukemia viruses occurs
through an endocytic pathway ", Journal of virology, vol. 75, no. 11, pp. 5018-5026.
Kayala, M.A. and Baldi, P. (2012) "Cyber-T web server: differential analysis of high-
throughput data ", Nucleic acids research, vol. 40, no. Web Server issue, pp. W553-9.

Refrences
199
Kim, J., Daniel, J., Espejo, A., Lake, A., Krishna, M., Xia, L., Zhang, Y. and Bedford, M.T.
(2006) "Tudor, MBT and chromo domains gauge the degree of lysine methylation ",
EMBO reports, vol. 7, no. 4, pp. 397-403.
Kim, J.B. and Sharp, P.A. (2001) "Positive transcription elongation factor B phosphorylates
hSPT5 and RNA polymerase II carboxyl-terminal domain independently of cyclin-
dependent kinase-activating kinase ", The Journal of biological chemistry, vol. 276,
no. 15, pp. 12317-12323.
King, W., Patel, M.D., Lobel, L.I., Goff, S.P. and Nguyen-Huu, M.C. (1985) "Insertion
mutagenesis of embryonal carcinoma cells by retroviruses ", Science (New York, N.Y.),
vol. 228, no. 4699, pp. 554-558.
Klose, R.J. and Bird, A.P. (2006) "Genomic DNA methylation: the mark and its mediators
", Trends in biochemical sciences, vol. 31, no. 2, pp. 89-97.
Kohn, D.B., Mitsuya, H., Ballow, M., Selegue, J.E., Barankiewicz, J., Cohen, A., Gelfand,
E., Anderson, W.F. and Blaese, R.M. (1989) "Establishment and characterization of
adenosine deaminase-deficient human T cell lines ", Journal of immunology
(Baltimore, Md.: 1950), vol. 142, no. 11, pp. 3971-3977.
Konecki, D.S. and Lichter-Konecki, U. (1991) "The phenylketonuria locus: current
knowledge about alleles and mutations of the phenylalanine hydroxylase gene in
various populations ", Human genetics, vol. 87, no. 4, pp. 377-388.
Kustikova, O.S., Geiger, H., Li, Z., Brugman, M.H., Chambers, S.M., Shaw, C.A., Pike-
Overzet, K., de Ridder, D., Staal, F.J., von Keudell, G., Cornils, K., Nattamai, K.J.,
Modlich, U., Wagemaker, G., Goodell, M.A., Fehse, B. and Baum, C. (2007)
"Retroviral vector insertion sites associated with dominant hematopoietic clones mark
"stemness" pathways ", Blood, vol. 109, no. 5, pp. 1897-1907.
Kustikova, O.S., Modlich, U. and Fehse, B. (2009) "Retroviral insertion site analysis in
dominant haematopoietic clones ", Methods in molecular biology (Clifton, N.J.), vol.
506, pp. 373-390.
Kustikova, O.S., Wahlers, A., Kuhlcke, K., Stahle, B., Zander, A.R., Baum, C. and Fehse,
B. (2003) "Dose finding with retroviral vectors: correlation of retroviral vector copy
numbers in single cells with gene transfer efficiency in a cell population ", Blood, vol.
102, no. 12, pp. 3934-3937.
Laing, E. and Smith, C.P. (2010) "RankProdIt: A web-interactive Rank Products analysis
tool ", BMC research notes, vol. 3, pp. 221-0500-3-221.
Lazarevich, N.L. and Fleishman, D.I. (2008) "Tissue-specific transcription factors in
progression of epithelial tumors ", Biochemistry.Biokhimiia, vol. 73, no. 5, pp. 573-
591.

Refrences
200
Lazo, P.A. and Tsichlis, P.N. (1988) "Recombination between two integrated proviruses,
one of which was inserted near c-myc in a retrovirus-induced rat thymoma:
implications for tumor progression ", Journal of virology, vol. 62, no. 3, pp. 788-794.
Lee, C., Chang, J.H., Lee, H.S. and Cho, Y. (2002) "Structural basis for the recognition of
the E2F transactivation domain by the retinoblastoma tumor suppressor ", Genes &
development, vol. 16, no. 24, pp. 3199-3212.
Lee, S., Lee, H.J., Kim, J.H., Lee, H.S., Jang, J.J. and Kang, G.H. (2003) "Aberrant CpG
island hypermethylation along multistep hepatocarcinogenesis ", The American journal
of pathology, vol. 163, no. 4, pp. 1371-1378.
Lee, Y.M., Choi, W.H., Kim, Y.B., Ha, C.S., Song, C.W., Lee, M., Joo, C.W., Hong, Y.,
Ho, S.H., Kim, S., Kim, J.M. and Koh, W.S. (2008) "Toxicity of repeated intravenous
injection of gene therapeutics for X-CGD in mice ", Human & experimental
toxicology, vol. 27, no. 5, pp. 401-407.
Lentini, L., Pipitone, L. and Di Leonardo, A. (2002) "Functional inactivation of pRB results
in aneuploid mammalian cells after release from a mitotic block ", Neoplasia (New
York, N.Y.), vol. 4, no. 5, pp. 380-387.
Leonard, S., Wei, W., Anderton, J., Vockerodt, M., Rowe, M., Murray, P.G. and
Woodman, C.B. (2011) "Epigenetic and transcriptional changes which follow Epstein-
Barr virus infection of germinal center B cells and their relevance to the pathogenesis
of Hodgkin's lymphoma ", Journal of virology, vol. 85, no. 18, pp. 9568-9577.
Lewinski, M.K., Yamashita, M., Emerman, M., Ciuffi, A., Marshall, H., Crawford, G.,
Collins, F., Shinn, P., Leipzig, J., Hannenhalli, S., Berry, C.C., Ecker, J.R. and
Bushman, F.D. (2006) "Retroviral DNA integration: viral and cellular determinants of
target-site selection ", PLoS pathogens, vol. 2, no. 6, pp. e60.
Li, E., Bestor, T.H. and Jaenisch, R. (1992) "Targeted mutation of the DNA
methyltransferase gene results in embryonic lethality ", Cell, vol. 69, no. 6, pp. 915-
926.
Li, J., Ning, G. and Duncan, S.A. (2000) "Mammalian hepatocyte differentiation requires
the transcription factor HNF-4alpha ", Genes & development, vol. 14, no. 4, pp. 464-
474.
Li, L., Olvera, J.M., Yoder, K.E., Mitchell, R.S., Butler, S.L., Lieber, M., Martin, S.L. and
Bushman, F.D. (2001) "Role of the non-homologous DNA end joining pathway in the
early steps of retroviral infection ", The EMBO journal, vol. 20, no. 12, pp. 3272-3281.
Li, Z., Dullmann, J., Schiedlmeier, B., Schmidt, M., von Kalle, C., Meyer, J., Forster, M.,
Stocking, C., Wahlers, A., Frank, O., Ostertag, W., Kuhlcke, K., Eckert, H.G., Fehse,
Refrences
201
B. and Baum, C. (2002) "Murine leukemia induced by retroviral gene marking",
Science (New York, N.Y.), vol. 296, no. 5567, pp. 497.
Lindwasser, O.W., Chaudhuri, R. and Bonifacino, J.S. (2007) "Mechanisms of CD4
downregulation by the Nef and Vpu proteins of primate immunodeficiency viruses ",
Current Molecular Medicine, vol. 7, no. 2, pp. 171-184.
Lo, M., Bloom, M.L., Imada, K., Berg, M., Bollenbacher, J.M., Bloom, E.T., Kelsall, B.L.
and Leonard, W.J. (1999) "Restoration of lymphoid populations in a murine model of
X-linked severe combined immunodeficiency by a gene-therapy approach ", Blood,
vol. 94, no. 9, pp. 3027-3036.
Lockwood, C.R., Bingham, C. and Frayling, T.M. (2003) "In silico searching of human and
mouse genome data identifies known and unknown HNF1 binding sites upstream of
beta-cell genes ", Molecular genetics and metabolism, vol. 78, no. 2, pp. 145-151.
Lukas, J., Lukas, C. and Bartek, J. (2004) "Mammalian cell cycle checkpoints: signalling
pathways and their organization in space and time ", DNA repair, vol. 3, no. 8-9, pp.
997-1007.
Malech, H.L., Maples, P.B., Whiting-Theobald, N., Linton, G.F., Sekhsaria, S., Vowells,
S.J., Li, F., Miller, J.A., DeCarlo, E., Holland, S.M., Leitman, S.F., Carter, C.S., Butz,
R.E., Read, E.J., Fleisher, T.A., Schneiderman, R.D., Van Epps, D.E., Spratt, S.K.,
Maack, C.A., Rokovich, J.A., Cohen, L.K. and Gallin, J.I. (1997) "Prolonged
production of NADPH oxidase-corrected granulocytes after gene therapy of chronic
granulomatous disease ", Proceedings of the National Academy of Sciences of the
United States of America, vol. 94, no. 22, pp. 12133-12138.
Matouk, C.C. and Marsden, P.A. (2008) "Epigenetic regulation of vascular endothelial gene
expression ", Circulation research, vol. 102, no. 8, pp. 873-887.
McBride, M.S. and Panganiban, A.T. (1997) "Position dependence of functional hairpins
important for human immunodeficiency virus type 1 RNA encapsidation in vivo ",
Journal of virology, vol. 71, no. 3, pp. 2050-2058.
McBride, M.S., Schwartz, M.D. and Panganiban, A.T. (1997) "Efficient encapsidation of
human immunodeficiency virus type 1 vectors and further characterization of cis
elements required for encapsidation ", Journal of virology, vol. 71, no. 6, pp. 4544-
4554.
McCabe, M.T., Davis, J.N. and Day, M.L. (2005) "Regulation of DNA methyltransferase 1
by the pRb/E2F1 pathway ", Cancer research, vol. 65, no. 9, pp. 3624-3632.
McKinnon, P.J. and Caldecott, K.W. (2007) "DNA strand break repair and human genetic
disease ", Annual review of genomics and human genetics, vol. 8, pp. 37-55.

Refrences
202
Mikovits, J.A., Raziuddin, Gonda, M., Ruta, M., Lohrey, N.C., Kung, H.F. and Ruscetti,
F.W. (1990) "Negative regulation of human immune deficiency virus replication in
monocytes. Distinctions between restricted and latent expression in THP-1 cells ", The
Journal of experimental medicine, vol. 171, no. 5, pp. 1705-1720.
Miller, A.D. and Buttimore, C. (1986) "Redesign of retrovirus packaging cell lines to avoid
recombination leading to helper virus production", Molecular and cellular biology,
vol. 6, no. 8, pp. 2895-2902.
Miller, M.D., Farnet, C.M. and Bushman, F.D. (1997) "Human immunodeficiency virus
type 1 preintegration complexes: studies of organization and composition ", Journal of
virology, vol. 71, no. 7, pp. 5382-5390.
Miller, M.D., Wang, B. and Bushman, F.D. (1995) "Human immunodeficiency virus type 1
preintegration complexes containing discontinuous plus strands are competent to
integrate in vitro ", Journal of virology, vol. 69, no. 6, pp. 3938-3944.
Mills, K.D., Ferguson, D.O. and Alt, F.W. (2003) "The role of DNA breaks in genomic
instability and tumorigenesis ", Immunological reviews, vol. 194, pp. 77-95.
Mitchell, R.S., Beitzel, B.F., Schroder, A.R., Shinn, P., Chen, H., Berry, C.C., Ecker, J.R.
and Bushman, F.D. (2004) "Retroviral DNA integration: ASLV, HIV, and MLV show
distinct target site preferences ", PLoS biology, vol. 2, no. 8, pp. E234.
Miyauchi, K., Marin, M. and Melikyan, G.B. (2011) "Visualization of retrovirus uptake and
delivery into acidic endosomes ", The Biochemical journal, vol. 434, no. 3, pp. 559-
569.
Miyoshi, H., Blomer, U., Takahashi, M., Gage, F.H. and Verma, I.M. (1998) "Development
of a self-inactivating lentivirus vector ", Journal of virology, vol. 72, no. 10, pp. 8150-
8157.
Modlich, U. and Baum, C. (2009) "Preventing and exploiting the oncogenic potential of
integrating gene vectors", The Journal of clinical investigation, vol. 119, no. 4, pp.
755-758.
Modlich, U., Bohne, J., Schmidt, M., von Kalle, C., Knoss, S., Schambach, A. and Baum,
C. (2006) "Cell-culture assays reveal the importance of retroviral vector design for
insertional genotoxicity ", Blood, vol. 108, no. 8, pp. 2545-2553.
Modlich, U., Kustikova, O.S., Schmidt, M., Rudolph, C., Meyer, J., Li, Z., Kamino, K., von
Neuhoff, N., Schlegelberger, B., Kuehlcke, K., Bunting, K.D., Schmidt, S.,
Deichmann, A., von Kalle, C., Fehse, B. and Baum, C. (2005) "Leukemias following
retroviral transfer of multidrug resistance 1 (MDR1) are driven by combinatorial
insertional mutagenesis ", Blood, vol. 105, no. 11, pp. 4235-4246.
Refrences
203
Montini, E., Cesana, D., Schmidt, M., Sanvito, F., Bartholomae, C.C., Ranzani, M.,
Benedicenti, F., Sergi, L.S., Ambrosi, A., Ponzoni, M., Doglioni, C., Di Serio, C., von
Kalle, C. and Naldini, L. (2009) "The genotoxic potential of retroviral vectors is
strongly modulated by vector design and integration site selection in a mouse model of
HSC gene therapy", The Journal of clinical investigation, vol. 119, no. 4, pp. 964-975.
Mortusewicz, O., Schermelleh, L., Walter, J., Cardoso, M.C. and Leonhardt, H. (2005)
"Recruitment of DNA methyltransferase I to DNA repair sites ", Proceedings of the
National Academy of Sciences of the United States of America, vol. 102, no. 25, pp.
8905-8909.
Moshous, D., Pannetier, C., Chasseval Rd, R., Deist Fl, F., Cavazzana-Calvo, M., Romana,
S., Macintyre, E., Canioni, D., Brousse, N., Fischer, A., Casanova, J.L. and Villartay,
J.P. (2003) "Partial T and B lymphocyte immunodeficiency and predisposition to
lymphoma in patients with hypomorphic mutations in Artemis ", The Journal of
clinical investigation, vol. 111, no. 3, pp. 381-387.
Mukhopadhyay, P., Rezzoug, F., Kaikaus, J., Greene, R. and Pisano, M. (2013) "Alcohol
modulates expression of DNA methyltranferases and methyl CpG-/CpG domain-
binding proteins in murine embryonic fibroblasts.", Reprod Toxicol, vol. 37, pp. 40-8.
Muller, H.J. (1927) "Artificial Transmutation of the Gene ", Science (New York, N.Y.), vol.
66, no. 1699, pp. 84-87.
Murnane, J.P., Fuller, L.F. and Painter, R.B. (1985) "Establishment and characterization of
a permanent pSV ori--transformed ataxia-telangiectasia cell line ", Experimental cell
research, vol. 158, no. 1, pp. 119-126.
Muthumani, K., Choo, A.Y., Zong, W.X., Madesh, M., Hwang, D.S., Premkumar, A.,
Thieu, K.P., Emmanuel, J., Kumar, S., Thompson, C.B. and Weiner, D.B. (2006) "The
HIV-1 Vpr and glucocorticoid receptor complex is a gain-of-function interaction that
prevents the nuclear localization of PARP-1 ", Nature cell biology, vol. 8, no. 2, pp.
170-179.
Muul, L.M., Tuschong, L.M., Soenen, S.L., Jagadeesh, G.J., Ramsey, W.J., Long, Z.,
Carter, C.S., Garabedian, E.K., Alleyne, M., Brown, M., Bernstein, W., Schurman,
S.H., Fleisher, T.A., Leitman, S.F., Dunbar, C.E., Blaese, R.M. and Candotti, F. (2003)
"Persistence and expression of the adenosine deaminase gene for 12 years and immune
reaction to gene transfer components: long-term results of the first clinical gene
therapy trial ", Blood, vol. 101, no. 7, pp. 2563-2569.
Naldini, L., Blomer, U., Gallay, P., Ory, D., Mulligan, R., Gage, F.H., Verma, I.M. and
Trono, D. (1996) "In vivo gene delivery and stable transduction of nondividing cells
by a lentiviral vector", Science (New York, N.Y.), vol. 272, no. 5259, pp. 263-267.

Refrences
204
Nam, C.H. and Rabbitts, T.H. (2006) "The role of LMO2 in development and in T cell
leukemia after chromosomal translocation or retroviral insertion ", Molecular therapy :
the journal of the American Society of Gene Therapy, vol. 13, no. 1, pp. 15-25.
Narayan, O. and Clements, J.E. (1989) "Biology and pathogenesis of lentiviruses ", The
Journal of general virology, vol. 70 ( Pt 7), no. Pt 7, pp. 1617-1639.
Nienhuis, A.W., Dunbar, C.E. and Sorrentino, B.P. (2006) "Genotoxicity of retroviral
integration in hematopoietic cells", Molecular therapy : the journal of the American
Society of Gene Therapy, vol. 13, no. 6, pp. 1031-1049.
Nisole, S. and Saib, A. (2004) "Early steps of retrovirus replicative cycle", Retrovirology,
vol. 1, pp. 9.
Nisole, S., Stoye, J.P. and Saib, A. (2005) "TRIM family proteins: retroviral restriction and
antiviral defence ", Nature reviews.Microbiology, vol. 3, no. 10, pp. 799-808.
Nowrouzi, A., Cheung, W.T., Li, T., Zhang, X., Arens, A., Paruzynski, A., Waddington,
S.N., Osejindu, E., Reja, S., von Kalle, C., Wang, Y., Al-Allaf, F., Gregory, L.,
Themis, M., Holder, M., Dighe, N., Ruthe, A., Buckley, S.M., Bigger, B., Montini, E.,
Thrasher, A.J., Andrews, R., Roberts, T.P., Newbold, R.F., Coutelle, C., Schmidt, M.
and Themis, M. (2012) "The Fetal Mouse Is a Sensitive Genotoxicity Model That
Exposes Lentiviral-associated Mutagenesis Resulting in Liver Oncogenesis",
Molecular Therapy,vol.21, no.6, pp. 324-327
O'Driscoll, M. and Jeggo, P.A. (2006) "The role of double-strand break repair - insights
from human genetics ", Nature reviews.Genetics, vol. 7, no. 1, pp. 45-54.
Okano, M., Bell, D.W., Haber, D.A. and Li, E. (1999) "DNA methyltransferases Dnmt3a
and Dnmt3b are essential for de novo methylation and mammalian development ",
Cell, vol. 99, no. 3, pp. 247-257.
Olsen, J.C. (2001) "EIAV, CAEV and other lentivirus vector systems", Somatic cell and
molecular genetics, vol. 26, no. 1-6, pp. 131-145.
Ott, M.G., Schmidt, M., Schwarzwaelder, K., Stein, S., Siler, U., Koehl, U., Glimm, H.,
Kuhlcke, K., Schilz, A., Kunkel, H., Naundorf, S., Brinkmann, A., Deichmann, A.,
Fischer, M., Ball, C., Pilz, I., Dunbar, C., Du, Y., Jenkins, N.A., Copeland, N.G.,
Luthi, U., Hassan, M., Thrasher, A.J., Hoelzer, D., von Kalle, C., Seger, R. and Grez,
M. (2006) "Correction of X-linked chronic granulomatous disease by gene therapy,
augmented by insertional activation of MDS1-EVI1, PRDM16 or SETBP1 ", Nature
medicine, vol. 12, no. 4, pp. 401-409.
Otto, E., Jones-Trower, A., Vanin, E.F., Stambaugh, K., Mueller, S.N., Anderson, W.F. and
McGarrity, G.J. (1994) "Characterization of a replication-competent retrovirus

Refrences
205
resulting from recombination of packaging and vector sequences ", Human Gene
Therapy, vol. 5, no. 5, pp. 567-575.
Palaniappan, C., Fuentes, G.M., Rodriguez-Rodriguez, L., Fay, P.J. and Bambara, R.A.
(1996) "Helix structure and ends of RNA/DNA hybrids direct the cleavage specificity
of HIV-1 reverse transcriptase RNase H ", The Journal of biological chemistry, vol.
271, no. 4, pp. 2063-2070.
Palii, S.S., Van Emburgh, B.O., Sankpal, U.T., Brown, K.D. and Robertson, K.D. (2008)
"DNA methylation inhibitor 5-Aza-2'-deoxycytidine induces reversible genome-wide
DNA damage that is distinctly influenced by DNA methyltransferases 1 and 3B ",
Molecular and cellular biology, vol. 28, no. 2, pp. 752-771.
Paull, T.T., Rogakou, E.P., Yamazaki, V., Kirchgessner, C.U., Gellert, M. and Bonner,
W.M. (2000) "A critical role for histone H2AX in recruitment of repair factors to
nuclear foci after DNA damage ", Current biology : CB, vol. 10, no. 15, pp. 886-895.
Pfeifer, A. and Verma, I.M. (2001) "Gene therapy: promises and problems", Annual review
of genomics and human genetics, vol. 2, pp. 177-211.
Polager, S., Kalma, Y., Berkovich, E. and Ginsberg, D. (2002) "E2Fs up-regulate
expression of genes involved in DNA replication, DNA repair and mitosis ",
Oncogene, vol. 21, no. 3, pp. 437-446.
Pontoglio, M., Faust, D.M., Doyen, A., Yaniv, M. and Weiss, M.C. (1997) "Hepatocyte
nuclear factor 1alpha gene inactivation impairs chromatin remodeling and
demethylation of the phenylalanine hydroxylase gene ", Molecular and cellular
biology, vol. 17, no. 9, pp. 4948-4956.
Pruss, D., Bushman, F.D. and Wolffe, A.P. (1994) "Human immunodeficiency virus
integrase directs integration to sites of severe DNA distortion within the nucleosome
core ", Proceedings of the National Academy of Sciences of the United States of
America, vol. 91, no. 13, pp. 5913-5917.
Qasim, W., Gaspar, H.B. and Thrasher, A.J. (2009) "Progress and prospects: gene therapy
for inherited immunodeficiencies ", Gene therapy, vol. 16, no. 11, pp. 1285-1291.
Qvarnstrom, O.F., Simonsson, M., Johansson, K.A., Nyman, J. and Turesson, I. (2004)
"DNA double strand break quantification in skin biopsies ", Radiotherapy and
oncology : journal of the European Society for Therapeutic Radiology and Oncology,
vol. 72, no. 3, pp. 311-317.
Ramezani, A., Hawley, T.S. and Hawley, R.G. (2008) "Reducing the genotoxic potential of
retroviral vectors", Methods in molecular biology (Clifton, N.J.), vol. 434, pp. 183-
203.

Refrences
206
Ricke, R.M., van Ree, J.H. and van Deursen, J.M. (2008) "Whole chromosome instability
and cancer: a complex relationship ", Trends in genetics : TIG, vol. 24, no. 9, pp. 457-
466.
Rieke, W.O. (1962) "The in vivo reutilization of lymphocytic and sarcoma DNA by cells
growing in the peritoneal cavity ", The Journal of cell biology, vol. 13, pp. 205-216.
Robertson, K.D. (2001) "DNA methylation, methyltransferases, and cancer ", Oncogene,
vol. 20, no. 24, pp. 3139-3155.
Robertson, K.D. and Wolffe, A.P. (2000) "DNA methylation in health and disease ",
Nature reviews.Genetics, vol. 1, no. 1, pp. 11-19.
Rodrigues, A; Paula, M; Coroadinh; Chapter 2, V. (2011) “Production of Retroviral and
Lentiviral Gene Therapy Vectors: Challenges in the Manufacturing of Lipid Enveloped
Virus”
Roe, T., Reynolds, T.C., Yu, G. and Brown, P.O. (1993) "Integration of murine leukemia
virus DNA depends on mitosis ", The EMBO journal, vol. 12, no. 5, pp. 2099-2108.
Rogakou, E.P., Pilch, D.R., Orr, A.H., Ivanova, V.S. and Bonner, W.M. (1998) "DNA
double-stranded breaks induce histone H2AX phosphorylation on serine 139 ", The
Journal of biological chemistry, vol. 273, no. 10, pp. 5858-5868.
Rohdewohld, H., Weiher, H., Reik, W., Jaenisch, R. and Breindl, M. (1987) "Retrovirus
integration and chromatin structure: Moloney murine leukemia proviral integration
sites map near DNase I-hypersensitive sites ", Journal of virology, vol. 61, no. 2, pp.
336-343.
Rowe, H.M., Friedli, M., Offner, S., Verp, S., Mesnard, D., Marquis, J., Aktas, T. and
Trono, D. (2013) "De novo DNA methylation of endogenous retroviruses is shaped by
KRAB-ZFPs/KAP1 and ESET ", Development (Cambridge, England), vol. 140, no. 3,
pp. 519-529.
Rowh, M.A., DeMicco, A., Horowitz, J.E., Yin, B., Yang-Iott, K.S., Fusello, A.M.,
Hobeika, E., Reth, M. and Bassing, C.H. (2011) "Tp53 deletion in B lineage cells
predisposes mice to lymphomas with oncogenic translocations ", Oncogene, vol. 30,
no. 47, pp. 4757-4764.
Sakurai, Y., Komatsu, K., Agematsu, K. and Matsuoka, M. (2009) "DNA double strand
break repair enzymes function at multiple steps in retroviral infection ", Retrovirology,
vol. 6, pp. 114-4690-6-114.
Sarkies, P. and Sale, J.E. (2012) "Cellular epigenetic stability and cancer ", Trends in
genetics : TIG, vol. 28, no. 3, pp. 118-127.

Refrences
207
Scherdin, U., Rhodes, K. and Breindl, M. (1990) "Transcriptionally active genome regions
are preferred targets for retrovirus integration ", Journal of virology, vol. 64, no. 2, pp.
907-912.
Schmidt, M., Zickler, P., Hoffmann, G., Haas, S., Wissler, M., Muessig, A., Tisdale, J.F.,
Kuramoto, K., Andrews, R.G., Wu, T., Kiem, H.P., Dunbar, C.E. and von Kalle, C.
(2002) "Polyclonal long-term repopulating stem cell clones in a primate model ",
Blood, vol. 100, no. 8, pp. 2737-2743.
Schroder, A.R., Shinn, P., Chen, H., Berry, C., Ecker, J.R. and Bushman, F. (2002) "HIV-1
integration in the human genome favors active genes and local hotspots ", Cell, vol.
110, no. 4, pp. 521-529.
Schvartzman, J.M., Sotillo, R. and Benezra, R. (2010) "Mitotic chromosomal instability
and cancer: mouse modelling of the human disease ", Nature reviews.Cancer, vol. 10,
no. 2, pp. 102-115.
Seger, R.A. (2008) "Modern management of chronic granulomatous disease ", British
journal of haematology, vol. 140, no. 3, pp. 255-266.
Shafiei, F., Rahnama, F., Pawella, L., Mitchell, M.D., Gluckman, P.D. and Lobie, P.E.
(2008) "DNMT3A and DNMT3B mediate autocrine hGH repression of plakoglobin
gene transcription and consequent phenotypic conversion of mammary carcinoma cells
", Oncogene, vol. 27, no. 18, pp. 2602-2612.
Sharma, S., Miyanohara, A. and Friedmann, T. (2000) "Separable mechanisms of
attachment and cell uptake during retrovirus infection ", Journal of virology, vol. 74,
no. 22, pp. 10790-10795.
Shibata, A., Barton, O., Noon, A.T., Dahm, K., Deckbar, D., Goodarzi, A.A., Lobrich, M.
and Jeggo, P.A. (2010) "Role of ATM and the damage response mediator proteins
53BP1 and MDC1 in the maintenance of G(2)/M checkpoint arrest ", Molecular and
cellular biology, vol. 30, no. 13, pp. 3371-3383.
Shin, D.S., Chahwan, C., Huffman, J.L. and Tainer, J.A. (2004) "Structure and function of
the double-strand break repair machinery ", DNA repair, vol. 3, no. 8-9, pp. 863-873.
Shrivastav, M., De Haro, L.P. and Nickoloff, J.A. (2008) "Regulation of DNA double-
strand break repair pathway choice ", Cell research, vol. 18, no. 1, pp. 134-147.
Skalka, A.M. and Katz, R.A. (2005) "Retroviral DNA integration and the DNA damage
response ", Cell death and differentiation, vol. 12 Suppl 1, pp. 971-978.
Smith, G.C. and Jackson, S.P. (1999) "The DNA-dependent protein kinase ", Genes &
development, vol. 13, no. 8, pp. 916-934.
Refrences
208
Somia, N. and Verma, I.M. (2000) "Gene therapy: trials and tribulations", Nature
reviews.Genetics, vol. 1, no. 2, pp. 91-99.
Stein, S., Ott, M.G., Schultze-Strasser, S., Jauch, A., Burwinkel, B., Kinner, A., Schmidt,
M., Krämer, A., Schwäble, J., Glimm, H., Koehl, U., Preiss, C., Ball, C., Martin, H.,
Göhring, G., Schwarzwaelder, K., Hofmann, W., Karakaya, K., Tchatchou, S., Yang,
R., Reinecke, P., Kühlcke, K., Schlegelberger, B., Thrasher, A.J., Hoelzer, D., Seger,
R., von Kalle, C. and Grez, M. (2010) "Genomic instability and myelodysplasia with
monosomy 7 consequent to EVI1 activation after gene therapy for chronic
granulomatous disease ", Nature medicine, vol. 16, no. 2, pp. 198-204.
Stocking, C., Bergholz, U., Friel, J., Klingler, K., Wagener, T., Starke, C., Kitamura, T.,
Miyajima, A. and Ostertag, W. (1993) "Distinct Classes of Factor-Independent
Mutants can be Isolated after Retroviral Mutagenesis of a Human Myeloid Stem Cell
Line ", Growth Factors, vol. 8, no. 3, pp. 197 <last_page> 209.
Strebel, K. (2003) "Virus-host interactions: role of HIV proteins Vif, Tat, and Rev ", AIDS
(London, England), vol. 17 Suppl 4, pp. S25-34.
Summers, K.C., Shen, F., Sierra Potchanant, E.A., Phipps, E.A., Hickey, R.J. and Malkas,
L.H. (2011) "Phosphorylation: the molecular switch of double-strand break repair ",
International journal of proteomics, vol. 2011, pp. 373816.
Sun, Y., Mi, W., Cai, J., Ying, W., Liu, F., Lu, H., Qiao, Y., Jia, W., Bi, X., Lu, N., Liu, S.,
Qian, X. and Zhao, X. (2008) "Quantitative proteomic signature of liver cancer cells:
tissue transglutaminase 2 could be a novel protein candidate of human hepatocellular
carcinoma ", Journal of proteome research, vol. 7, no. 9, pp. 3847-3859.
Suzuki, Y. and Craigie, R. (2007) "The road to chromatin - nuclear entry of retroviruses ",
Nature reviews.Microbiology, vol. 5, no. 3, pp. 187-196.
Swanton, C., Nicke, B., Schuett, M., Eklund, A.C., Ng, C., Li, Q., Hardcastle, T., Lee, A.,
Roy, R., East, P., Kschischo, M., Endesfelder, D., Wylie, P., Kim, S.N., Chen, J.G.,
Howell, M., Ried, T., Habermann, J.K., Auer, G., Brenton, J.D., Szallasi, Z. and
Downward, J. (2009) "Chromosomal instability determines taxane response ",
Proceedings of the National Academy of Sciences of the United States of America, vol.
106, no. 21, pp. 8671-8676.
Tan, H.H. and Porter, A.G. (2009) "p21(WAF1) negatively regulates DNMT1 expression in
mammalian cells ", Biochemical and biophysical research communications, vol. 382,
no. 1, pp. 171-176.
Tang, H., Kuhen, K.L. and Wong-Staal, F. (1999) "Lentivirus replication and regulation ",
Annual Review of Genetics, vol. 33, pp. 133-170.
Refrences
209
Tao, Q. and Robertson, K.D. (2003) "Stealth technology: how Epstein-Barr virus utilizes
DNA methylation to cloak itself from immune detection ", Clinical immunology
(Orlando, Fla.), vol. 109, no. 1, pp. 53-63.
Tarantal, A.F., Lee, C.I., Ekert, J.E., McDonald, R., Kohn, D.B., Plopper, C.G., Case, S.S.
and Bunnell, B.A. (2001) "Lentiviral vector gene transfer into fetal rhesus monkeys
(Macaca mulatta): lung-targeting approaches ", Molecular therapy : the journal of the
American Society of Gene Therapy, vol. 4, no. 6, pp. 614-621.
Tarantal, A.F., McDonald, R.J., Jimenez, D.F., Lee, C.C., O'Shea, C.E., Leapley, A.C.,
Won, R.H., Plopper, C.G., Lutzko, C. and Kohn, D.B. (2005) "Intrapulmonary and
intramyocardial gene transfer in rhesus monkeys (Macaca mulatta): safety and
efficiency of HIV-1-derived lentiviral vectors for fetal gene delivery ", Molecular
therapy : the journal of the American Society of Gene Therapy, vol. 12, no. 1, pp. 87-
98.
Telesnitsky A, G.S. (1997) "Reverse Transcriptase and the Generation of Ret...
[Retroviruses. 1997] - PubMed - NCBI ", In Retroviruses, , pp. 121-160.
Themis, M., May, D., Coutelle, C. and Newbold, R.F. (2003) "Mutational effects of
retrovirus insertion on the genome of V79 cells by an attenuated retrovirus vector:
implications for gene therapy ", Gene therapy, vol. 10, no. 19, pp. 1703-1711.
Themis, M., Waddington, S.N., Schmidt, M., von Kalle, C., Wang, Y., Al-Allaf, F.,
Gregory, L.G., Nivsarkar, M., Themis, M., Holder, M.V., Buckley, S.M., Dighe, N.,
Ruthe, A.T., Mistry, A., Bigger, B., Rahim, A., Nguyen, T.H., Trono, D., Thrasher,
A.J. and Coutelle, C. (2005) "Oncogenesis following delivery of a nonprimate
lentiviral gene therapy vector to fetal and neonatal mice", Molecular therapy : the
journal of the American Society of Gene Therapy, vol. 12, no. 4, pp. 763-771.
Thomas, C.E., Ehrhardt, A. and Kay, M.A. (2003) "Progress and problems with the use of
viral vectors for gene therapy", Nature reviews.Genetics, vol. 4, no. 5, pp. 346-358.
Thompson, L.H. and Schild, D. (1999) "The contribution of homologous recombination in
preserving genome integrity in mammalian cells ", Biochimie, vol. 81, no. 1-2, pp. 87-
105.
Thrasher, A.J., Gaspar, H.B., Baum, C., Modlich, U., Schambach, A., Candotti, F., Otsu,
M., Sorrentino, B., Scobie, L., Cameron, E., Blyth, K., Neil, J., Abina, S.H.,
Cavazzana-Calvo, M. and Fischer, A. (2006) "Gene therapy: X-SCID transgene
leukaemogenicity ", Nature, vol. 443, no. 7109, pp. E5 <last_page> E6.
Trono, D. (2000) "Lentiviral vectors: turning a deadly foe into a therapeutic agent ", Gene
therapy, vol. 7, no. 1, pp. 20-23.

Refrences
210
Tsai, K.Y., Hu, Y., Macleod, K.F., Crowley, D., Yamasaki, L. and Jacks, T. (1998)
"Mutation of E2f-1 suppresses apoptosis and inappropriate S phase entry and extends
survival of Rb-deficient mouse embryos ", Molecular cell, vol. 2, no. 3, pp. 293-304.
Ugolini, S., Mondor, I. and Sattentau, Q.J. (1999) "HIV-1 attachment: another look ",
Trends in microbiology, vol. 7, no. 4, pp. 144-149.
Uren, A.G., Kool, J., Berns, A. and van Lohuizen, M. (2005) "Retroviral insertional
mutagenesis: past, present and future ", Oncogene, vol. 24, no. 52, pp. 7656-7672.
van Attikum, H. and Gasser, S.M. (2009) "Crosstalk between histone modifications during
the DNA damage response ", Trends in cell biology, vol. 19, no. 5, pp. 207-217.
van Gent, D.C., Hoeijmakers, J.H. and Kanaar, R. (2001) "Chromosomal stability and the
DNA double-stranded break connection ", Nature reviews.Genetics, vol. 2, no. 3, pp.
196-206.
Varmus, H.E. (1982) "Form and function of retroviral proviruses ", Science (New York,
N.Y.), vol. 216, no. 4548, pp. 812-820.
Verma, I.M. and Weitzman, M.D. (2005) "Gene therapy: twenty-first century medicine",
Annual Review of Biochemistry, vol. 74, pp. 711-738.
Vertino, P.M., Yen, R.W., Gao, J. and Baylin, S.B. (1996) "De novo methylation of CpG
island sequences in human fibroblasts overexpressing DNA (cytosine-5-)-
methyltransferase ", Molecular and cellular biology, vol. 16, no. 8, pp. 4555-4565.
Vijaya, S., Steffen, D.L. and Robinson, H.L. (1986) "Acceptor sites for retroviral
integrations map near DNase I-hypersensitive sites in chromatin ", Journal of virology,
vol. 60, no. 2, pp. 683-692.
Vogt, P.K. (1997) "Historical Introduction to the General Properties of Retroviruses " in
Retroviruses , eds. J.M. Coffin, S.H. Hughes and H.E. Varmus,Cold Spring Harbor
(NY).
von Laer, D., Baum, C. and Protzer, U. (2009) "Antiviral gene therapy ", Handbook of
Experimental Pharmacology, vol. (189):265-97. doi, no. 189, pp. 265-297.
Waddington, C.H. (2012) "The epigenotype. 1942 ", International journal of epidemiology,
vol. 41, no. 1, pp. 10-13.
Waddington, S.N., Nivsarkar, M.S., Mistry, A.R., Buckley, S.M., Kemball-Cook, G.,
Mosley, K.L., Mitrophanous, K., Radcliffe, P., Holder, M.V., Brittan, M., Georgiadis,
A., Al-Allaf, F., Bigger, B.W., Gregory, L.G., Cook, H.T., Ali, R.R., Thrasher, A.,
Tuddenham, E.G., Themis, M. and Coutelle, C. (2004) "Permanent phenotypic
Refrences
211
correction of hemophilia B in immunocompetent mice by prenatal gene therapy ",
Blood, vol. 104, no. 9, pp. 2714-2721.
Walsh, C.E. (1999) "Fetal gene therapy ", Gene therapy, vol. 6, no. 7, pp. 1200-1201.
Wang, L., Takabe, K., Bidlingmaier, S.M., Ill, C.R. and Verma, I.M. (1999) "Sustained
correction of bleeding disorder in hemophilia B mice by gene therapy ", Proceedings
of the National Academy of Sciences of the United States of America, vol. 96, no. 7, pp.
3906-3910.
Ward, I.M., Minn, K., van Deursen, J. and Chen, J. (2003) "p53 Binding protein 53BP1 is
required for DNA damage responses and tumor suppression in mice ", Molecular and
cellular biology, vol. 23, no. 7, pp. 2556-2563.
Wederell, E.D., Bilenky, M., Cullum, R., Thiessen, N., Dagpinar, M., Delaney, A., Varhol,
R., Zhao, Y., Zeng, T., Bernier, B., Ingham, M., Hirst, M., Robertson, G., Marra,
M.A., Jones, S. and Hoodless, P.A. (2008) "Global analysis of in vivo Foxa2-binding
sites in mouse adult liver using massively parallel sequencing ", Nucleic acids
research, vol. 36, no. 14, pp. 4549-4564.
Weller, S.K., Joy, A.E. and Temin, H.M. (1980) "Correlation between cell killing and
massive second-round superinfection by members of some subgroups of avian leukosis
virus ", Journal of virology, vol. 33, no. 1, pp. 494-506.
Wilk, T., Gross, I., Gowen, B.E., Rutten, T., de Haas, F., Welker, R., Krausslich, H.G.,
Boulanger, P. and Fuller, S.D. (2001) "Organization of immature human
immunodeficiency virus type 1 ", Journal of virology, vol. 75, no. 2, pp. 759-771.
Wu, J., Prindle, M.J., Dressler, G.R. and Yu, X. (2009) "PTIP regulates 53BP1 and SMC1
at the DNA damage sites ", The Journal of biological chemistry, vol. 284, no. 27, pp.
18078-18084.
Wu, X., Li, Y., Crise, B. and Burgess, S.M. (2003) "Transcription start regions in the
human genome are favored targets for MLV integration ", Science (New York, N.Y.),
vol. 300, no. 5626, pp. 1749-1751.
Yamagata, Y., Parietti, V., Stockholm, D., Corre, G., Poinsignon, C., Touleimat, N.,
Delafoy, D., Besse, C., Tost, J., Galy, A. and Paldi, A. (2012) "Lentiviral transduction
of CD34(+) cells induces genome-wide epigenetic modifications ", PloS one, vol. 7,
no. 11, pp. e48943.
Yang, Z.Q., Streicher, K.L., Ray, M.E., Abrams, J. and Ethier, S.P. (2006) "Multiple
interacting oncogenes on the 8p11-p12 amplicon in human breast cancer ", Cancer
research, vol. 66, no. 24, pp. 11632-11643.
Refrences
212
Yu, S.F., von Ruden, T., Kantoff, P.W., Garber, C., Seiberg, M., Ruther, U., Anderson,
W.F., Wagner, E.F. and Gilboa, E. (1986) "Self-inactivating retroviral vectors
designed for transfer of whole genes into mammalian cells ", Proceedings of the
National Academy of Sciences of the United States of America, vol. 83, no. 10, pp.
3194-3198.
Zgheib, O., Huyen, Y., DiTullio, R.A.,Jr, Snyder, A., Venere, M., Stavridi, E.S. and
Halazonetis, T.D. (2005) "ATM signaling and 53BP1 ", Radiotherapy and oncology :
journal of the European Society for Therapeutic Radiology and Oncology, vol. 76, no.
2, pp. 119-122.
Zhang, J. and Temin, H.M. (1993) "Rate and mechanism of nonhomologous recombination
during a single cycle of retroviral replication ", Science (New York, N.Y.), vol. 259, no.
5092, pp. 234-238.
Zhang, W., Canziani, G., Plugariu, C., Wyatt, R., Sodroski, J., Sweet, R., Kwong, P.,
Hendrickson, W. and Chaiken, I. (1999) "Conformational changes of gp120 in
epitopes near the CCR5 binding site are induced by CD4 and a CD4 miniprotein
mimetic ", Biochemistry, vol. 38, no. 29, pp. 9405-9416.
Zhang, Y., Proenca, R., Maffei, M., Barone, M., Leopold, L. and Friedman, J.M. (1994)
"Positional cloning of the mouse obese gene and its human homologue ", Nature, vol.
372, no. 6505, pp. 425-432.
Zhao, Z., Wu, Q., Cheng, J., Qiu, X., Zhang, J. and Fan, H. (2010) "Depletion of DNMT3A
suppressed cell proliferation and restored PTEN in hepatocellular carcinoma cell ",
Journal of biomedicine & biotechnology, vol. 2010, pp. 737535.
Zheng, L., Flesken-Nikitin, A., Chen, P.L. and Lee, W.H. (2002) "Deficiency of
Retinoblastoma gene in mouse embryonic stem cells leads to genetic instability ",
Cancer research, vol. 62, no. 9, pp. 2498-2502.
Zufferey, R., Donello, J.E., Trono, D. and Hope, T.J. (1999) "Woodchuck hepatitis virus
posttranscriptional regulatory element enhances expression of transgenes delivered by
retroviral vectors ", Journal of virology, vol. 73, no. 4, pp. 2886-2892.
Zufferey, R., Dull, T., Mandel, R.J., Bukovsky, A., Quiroz, D., Naldini, L. and Trono, D.
(1998) "Self-inactivating lentivirus vector for safe and efficient in vivo gene delivery",
Journal of virology, vol. 72, no. 12, pp. 9873-9880.

213
Appendix 1
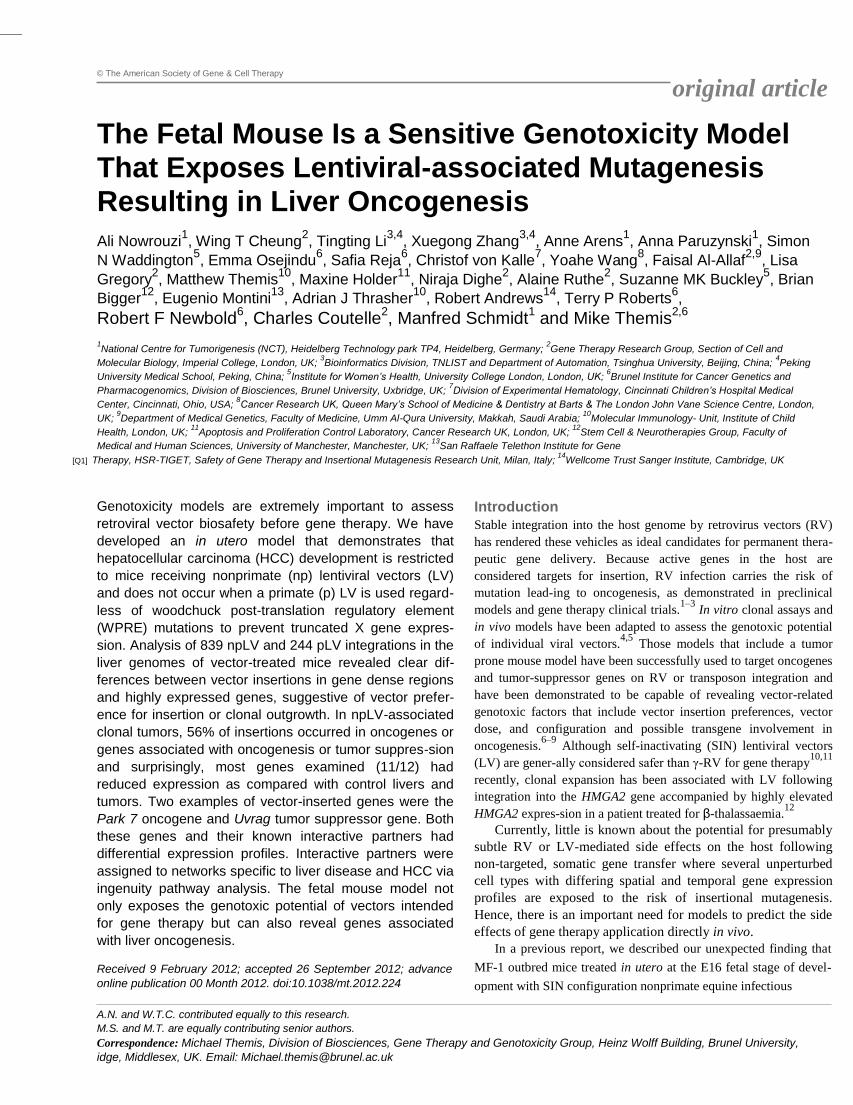
© The American Society of Gene & Cell Therapy
original article
The Fetal Mouse Is a Sensitive Genotoxicity Model That Exposes Lentiviral-associated Mutagenesis Resulting in Liver Oncogenesis
Ali Nowrouzi
1, Wing T Cheung
2, Tingting Li
3,4, Xuegong Zhang
3,4, Anne Arens
1, Anna Paruzynski
1, Simon
N Waddington5, Emma Osejindu
6, Safia Reja
6, Christof von Kalle
7, Yoahe Wang
8, Faisal Al-Allaf
2,9, Lisa
Gregory2, Matthew Themis
10, Maxine Holder
11, Niraja Dighe
2, Alaine Ruthe
2, Suzanne MK Buckley
5, Brian
Bigger12
, Eugenio Montini13
, Adrian J Thrasher10
, Robert Andrews14
, Terry P Roberts6,
Robert F Newbold6, Charles Coutelle
2, Manfred Schmidt
1 and Mike Themis
2,6
1National Centre for Tumorigenesis (NCT), Heidelberg Technology park TP4, Heidelberg, Germany;
2Gene Therapy Research Group, Section of Cell and
Molecular Biology, Imperial College, London, UK; 3Bioinformatics Division, TNLIST and Department of Automation, Tsinghua University, Beijing, China;
4Peking
University Medical School, Peking, China; 5Institute for Women’s Health, University College London, London, UK;
6Brunel Institute for Cancer Genetics and
Pharmacogenomics, Division of Biosciences, Brunel University, Uxbridge, UK; 7Division of Experimental Hematology, Cincinnati Children’s Hospital Medical
Center, Cincinnati, Ohio, USA; 8Cancer Research UK, Queen Mary’s School of Medicine & Dentistry at Barts & The London John Vane Science Centre, London,
UK; 9Department of Medical Genetics, Faculty of Medicine, Umm Al-Qura University, Makkah, Saudi Arabia;
10Molecular Immunology Unit, Institute of Child
Health, London, UK; 11
Apoptosis and Proliferation Control Laboratory, Cancer Research UK, London, UK; 12
Stem Cell & Neurotherapies Group, Faculty of
Medical and Human Sciences, University of Manchester, Manchester, UK; 13
San Raffaele Telethon Institute for Gene [Q1] Therapy, HSR-TIGET, Safety of Gene Therapy and Insertional Mutagenesis Research Unit, Milan, Italy;
14Wellcome Trust Sanger Institute, Cambridge, UK
Genotoxicity models are extremely important to assess
retroviral vector biosafety before gene therapy. We have
developed an in utero model that demonstrates that
hepatocellular carcinoma (HCC) development is restricted
to mice receiving nonprimate (np) lentiviral vectors (LV)
and does not occur when a primate (p) LV is used regard-
less of woodchuck post-translation regulatory element
(WPRE) mutations to prevent truncated X gene expres-
sion. Analysis of 839 npLV and 244 pLV integrations in the
liver genomes of vector-treated mice revealed clear dif-
ferences between vector insertions in gene dense regions
and highly expressed genes, suggestive of vector prefer-
ence for insertion or clonal outgrowth. In npLV-associated
clonal tumors, 56% of insertions occurred in oncogenes or
genes associated with oncogenesis or tumor suppres-sion
and surprisingly, most genes examined (11/12) had
reduced expression as compared with control livers and
tumors. Two examples of vector-inserted genes were the
Park 7 oncogene and Uvrag tumor suppressor gene. Both
these genes and their known interactive partners had
differential expression profiles. Interactive partners were
assigned to networks specific to liver disease and HCC via
ingenuity pathway analysis. The fetal mouse model not
only exposes the genotoxic potential of vectors intended
for gene therapy but can also reveal genes associated
with liver oncogenesis. Received 9 February 2012; accepted 26 September 2012; advance
online publication 00 Month 2012. doi:10.1038/mt.2012.224
Introduction Stable integration into the host genome by retrovirus vectors (RV)
has rendered these vehicles as ideal candidates for permanent thera-
peutic gene delivery. Because active genes in the host are
considered targets for insertion, RV infection carries the risk of
mutation lead-ing to oncogenesis, as demonstrated in preclinical
models and gene therapy clinical trials.1–3
In vitro clonal assays and
in vivo models have been adapted to assess the genotoxic potential
of individual viral vectors.4,5
Those models that include a tumor
prone mouse model have been successfully used to target oncogenes
and tumor-suppressor genes on RV or transposon integration and
have been demonstrated to be capable of revealing vector-related
genotoxic factors that include vector insertion preferences, vector
dose, and configuration and possible transgene involvement in
oncogenesis.6–9
Although self-inactivating (SIN) lentiviral vectors
(LV) are gener-ally considered safer than γ-RV for gene therapy10,11
recently, clonal expansion has been associated with LV following
integration into the HMGA2 gene accompanied by highly elevated
HMGA2 expres-sion in a patient treated for β-thalassaemia.12
Currently, little is known about the potential for presumably
subtle RV or LV-mediated side effects on the host following
non-targeted, somatic gene transfer where several unperturbed
cell types with differing spatial and temporal gene expression
profiles are exposed to the risk of insertional mutagenesis.
Hence, there is an important need for models to predict the side
effects of gene therapy application directly in vivo. In a previous report, we described our unexpected finding that
MF-1 outbred mice treated in utero at the E16 fetal stage of devel-
opment with SIN configuration nonprimate equine infectious A.N. and W.T.C. contributed equally to this research.
M.S. and M.T. are equally contributing senior authors. Correspondence: Michael Themis, Division of Biosciences, Gene Therapy and Genotoxicity Group, Heinz Wolff Building, Brunel University,
idge, Middlesex, UK. Email: [email protected]
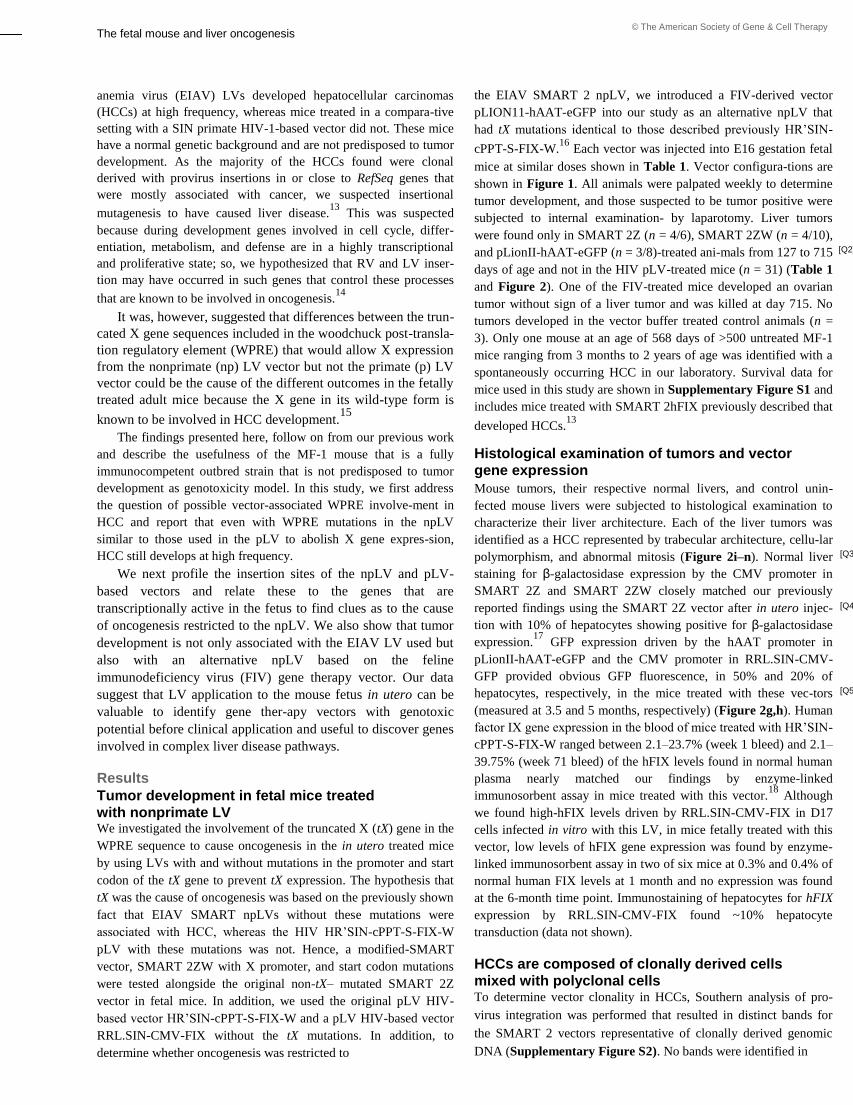
The fetal mouse and liver oncogenesis © The American Society of Gene & Cell Therapy
anemia virus (EIAV) LVs developed hepatocellular carcinomas
(HCCs) at high frequency, whereas mice treated in a compara-tive
setting with a SIN primate HIV-1-based vector did not. These mice
have a normal genetic background and are not predisposed to tumor
development. As the majority of the HCCs found were clonal
derived with provirus insertions in or close to RefSeq genes that
were mostly associated with cancer, we suspected insertional
mutagenesis to have caused liver disease.13
This was suspected
because during development genes involved in cell cycle, differ-
entiation, metabolism, and defense are in a highly transcriptional
and proliferative state; so, we hypothesized that RV and LV inser-
tion may have occurred in such genes that control these processes
that are known to be involved in oncogenesis.14
It was, however, suggested that differences between the trun-
cated X gene sequences included in the woodchuck post-transla-
tion regulatory element (WPRE) that would allow X expression
from the nonprimate (np) LV vector but not the primate (p) LV
vector could be the cause of the different outcomes in the fetally
treated adult mice because the X gene in its wild-type form is
known to be involved in HCC development.15
The findings presented here, follow on from our previous work
and describe the usefulness of the MF-1 mouse that is a fully
immunocompetent outbred strain that is not predisposed to tumor
development as genotoxicity model. In this study, we first address
the question of possible vector-associated WPRE involve-ment in
HCC and report that even with WPRE mutations in the npLV
similar to those used in the pLV to abolish X gene expres-sion,
HCC still develops at high frequency. We next profile the insertion sites of the npLV and pLV-
based vectors and relate these to the genes that are
transcriptionally active in the fetus to find clues as to the cause
of oncogenesis restricted to the npLV. We also show that tumor
development is not only associated with the EIAV LV used but
also with an alternative npLV based on the feline
immunodeficiency virus (FIV) gene therapy vector. Our data
suggest that LV application to the mouse fetus in utero can be
valuable to identify gene ther-apy vectors with genotoxic
potential before clinical application and useful to discover genes
involved in complex liver disease pathways. Results Tumor development in fetal mice treated with nonprimate LV We investigated the involvement of the truncated X (tX) gene in the
WPRE sequence to cause oncogenesis in the in utero treated mice
by using LVs with and without mutations in the promoter and start
codon of the tX gene to prevent tX expression. The hypothesis that
tX was the cause of oncogenesis was based on the previously shown
fact that EIAV SMART npLVs without these mutations were
associated with HCC, whereas the HIV HR’SIN-cPPT-S-FIX-W
pLV with these mutations was not. Hence, a modified-SMART
vector, SMART 2ZW with X promoter, and start codon mutations
were tested alongside the original non-tX– mutated SMART 2Z
vector in fetal mice. In addition, we used the original pLV HIV-
based vector HR’SIN-cPPT-S-FIX-W and a pLV HIV-based vector
RRL.SIN-CMV-FIX without the tX mutations. In addition, to
determine whether oncogenesis was restricted to
2
the EIAV SMART 2 npLV, we introduced a FIV-derived vector
pLION11-hAAT-eGFP into our study as an alternative npLV that
had tX mutations identical to those described previously HR’SIN-
cPPT-S-FIX-W.16
Each vector was injected into E16 gestation fetal
mice at similar doses shown in Table 1. Vector configura-tions are
shown in Figure 1. All animals were palpated weekly to determine
tumor development, and those suspected to be tumor positive were
subjected to internal examination by laparotomy. Liver tumors
were found only in SMART 2Z (n = 4/6), SMART 2ZW (n = 4/10),
and pLionII-hAAT-eGFP (n = 3/8)-treated ani-mals from 127 to 715
days of age and not in the HIV pLV-treated mice (n = 31) (Table 1
and Figure 2). One of the FIV-treated mice developed an ovarian
tumor without sign of a liver tumor and was killed at day 715. No
tumors developed in the vector buffer treated control animals (n =
3). Only one mouse at an age of 568 days of >500 untreated MF-1
mice ranging from 3 months to 2 years of age was identified with a
spontaneously occurring HCC in our laboratory. Survival data for
mice used in this study are shown in Supplementary Figure S1 and
includes mice treated with SMART 2hFIX previously described that
developed HCCs.13
Histological examination of tumors and vector gene expression Mouse tumors, their respective normal livers, and control unin-
fected mouse livers were subjected to histological examination to
characterize their liver architecture. Each of the liver tumors was
identified as a HCC represented by trabecular architecture, cellu-lar
polymorphism, and abnormal mitosis (Figure 2i–n). Normal liver
staining for β-galactosidase expression by the CMV promoter in
SMART 2Z and SMART 2ZW closely matched our previously
reported findings using the SMART 2Z vector after in utero injec-
tion with 10% of hepatocytes showing positive for β-galactosidase
expression.17
GFP expression driven by the hAAT promoter in
pLionII-hAAT-eGFP and the CMV promoter in RRL.SIN-CMV-
GFP provided obvious GFP fluorescence, in 50% and 20% of
hepatocytes, respectively, in the mice treated with these vec-tors
(measured at 3.5 and 5 months, respectively) (Figure 2g,h). Human
factor IX gene expression in the blood of mice treated with HR’SIN-
cPPT-S-FIX-W ranged between 2.1–23.7% (week 1 bleed) and 2.1–
39.75% (week 71 bleed) of the hFIX levels found in normal human
plasma nearly matched our findings by enzyme-linked
immunosorbent assay in mice treated with this vector.18
Although
we found high-hFIX levels driven by RRL.SIN-CMV-FIX in D17
cells infected in vitro with this LV, in mice fetally treated with this
vector, low levels of hFIX gene expression was found by enzyme-
linked immunosorbent assay in two of six mice at 0.3% and 0.4% of
normal human FIX levels at 1 month and no expression was found
at the 6-month time point. Immunostaining of hepatocytes for hFIX
expression by RRL.SIN-CMV-FIX found ~10% hepatocyte
transduction (data not shown). HCCs are composed of clonally derived cells mixed with polyclonal cells To determine vector clonality in HCCs, Southern analysis of pro-
virus integration was performed that resulted in distinct bands for
the SMART 2 vectors representative of clonally derived genomic
DNA (Supplementary Figure S2). No bands were identified in
www.moleculartherapy.org
[Q2] [Q3]
[Q4] [Q5]

© The American Society of Gene & Cell Therapy
The fetal mouse and liver oncogenesis
Table 1 Details of mice injected with lentivirus vectors Vector/mouse Titer Age at Liver
identification (per fetus) killing tumor VCN
Control buffers
A N/A 819 No N/A
B N/A 810 No N/A
C N/A 715 No N/A aSMART 2hFIX
1 2.7 × 10⁷ 348 Y Tumors T1+T2 (5 each)
2 2.7 × 10⁷ 231 Y 4
3 2.7 × 10⁷ 230 Y 2
4 2.7 × 10⁷ 238 Y 5
5 2.7 × 10⁷ 154 Y 13
6 2.7 × 10⁷ 376 Y N/D
7 2.7 × 10⁷ 355 Y N/D
8 2.7 × 10⁷ 299 Y 3
9 2.7 × 10⁷ 239 N N/D
10 2.7 × 10⁷ 406 N N/D
SMART 2Z
1 3.8 × 10⁷ 487 Y 9
2 1.2 × 10⁷ 369 N N/A
3 1.2 × 10⁷ 573 Y 6
4 1.2 × 10⁷ 531 Y 3
5 1.2 × 10⁷ 712 N N/D
6 1.2 ×x 107 644 Y Tumors T1+T2 (3 each)
NL 1.2 × 10⁷ N/A N 8.7 ± SE 0.23 (n = 4)
SMART 2ZW (mutated tX)
7 4.2 × 10⁷ 127 Y Tumors T1+T2 (7 each)
8 1.4 × 10⁷ 162 N N/A
9 1.4 × 10⁷ 279 Y Tumors T1 (9)+T2 (10)
10 1.4 × 10⁷ 369 Y 2
11 4.2 × 10⁷ 714 N N/D
12 1.4 × 10⁷ 537 Y Tumors T1+T2(3 each)
13 1.4 × 10⁷ 627 N N/D
14 1.4 × 10⁷ 502 N N/D
15 1.4 × 10⁷ 640 N N/D
16 1.4 × 10⁷ 447 N N/D
NL 1.2 × 10⁷ N/A N 14.5 ± SE 2.3 (n = 4)
pLionII-hAAT-eGFP (mutated tX)
17 1.0 × 10⁷ 484 Y Tumors T1 (8)+ T2 (9)
18 1.0 × 10⁷ 433 Y Tumors T1 (1)+T2 (6)
19 1.0 × 10⁷ 273 Y Tumors T1 (2)+T2 (10)
20 1.0 × 10⁷ 341 N N/D
21 1.0 × 10⁷ 622 N N/D
22 1.0 × 10⁷ 715 bN 2
23 1.0 × 10⁷ 715 N N/D
24 1.0 × 10⁷ 677 N N/D
NL 1.0 × 10⁷ N/A N 5.5 ± SE 0.31 (n = 4)
Molecular Therapy 3
Table 1 (Continued) Vector/mouse Titer Age at Liver identification (per fetus) killing tumor VCN HR’SIN-cPPT-S-FIX-W (mutated tX)
25–50 (NL) 1.0 × 10⁷ >666 N 0.9 ± SE 0.15 (n = 6)
RRL.SIN-CMV/-FIX
56 (NL) 1.0 × 10⁷ >666 N 0.6 ± SE 0.22 (n = 6)
MF-1 fetal mice were injected on day 16 (E16) of gestation with VSV-G
pseudotyped lentiviral vectors vectors after titration, or with vector buffer only.
Survival to birth of mice treated with these vectors routinely exceeded 90%.
Treated mice were examined by palpation and those with suspected tumors
underwent laparotomy. Those bearing tumors were killed for further analysis. Tumors that were found positive for distinct provirus bands following Southern
analysis are listed as clonal and VCNs are shown. No tumors were found in
mice treated with the vector buffer only (n = 3) or with HR’SIN-cPPT-S-FIX-W (n
= 25), and RRL.SIN-CMV-FIX (n = 6). Q-PCR analysis of VCNs in tumor DNAs agreed with those determined by Southern
analysis. VCNs with SEM were also determined using Q-PCR on normal livers (NL) of
SMART 2Z (n = 4), SMART 2ZW (n = 4), pLION11-hAAT-eGFP (n = 4), HR’SIN-
cPPT-S-FIX-W (n = 6), and RRL.SIN-CMV-FIX (n = 6) infected mice. Animals were
allowed to reach 666 or above days of age before killing based on the maximum age of tumor onset that we reported previously.
13 All
mice were monitored on a daily basis as per Home Office regulations and per
license stipulations. EIAV vector preparations were generated and titered by
Oxford BioMedica. Vectors with mutated truncated X (tX) are shown.
EIAV, equine infectious anemia virus; N/A, not applicable; N/D, not determined;
SIN, self-inactivating; VCN, vector copy numbers.
aMice shown from original study.
13 bMouse developed a clonal ovarian tumor
[Q6]
and no liver tumor.
the DNA of the suspected bone tumor that developed in a SMART
2ZW -treated animal (mouse 15) (Supplementary Figure S2), and
we suspected the bone tumors in this mouse either to have arisen
spontaneously or may have had lost vector sequences during
development. Each of the liver tumors in the pLionII-hAAT-eGFP
FIV-treated mice were also found to be clonal (data not shown) as
was the ovarian tumor that developed in the pLionII-hAAT-eGFP-
treated mouse where no liver tumor was identified (mouse 22). By
this analysis, we found vector copy numbers (VCN) in the EIAV
and FIV-derived tumors were between 1–6 and 1–5, respectively. Despite loading equal amounts of SMART 2 vector-derived tumor
DNAs (10 µg) to agarose gels before Southern analysis and repeating
several times (n = 5), band intensities differed significantly after
hybridization. This suggested the tumors were composed of clonal cells
mixed with heterogeneous polyclonal cell populations present in the
tumor masses (Supplementary Figure S2). This was also obvious by
the speckled β-galactosidase expression identified macroscopically in
these tumors (Figure 2). In contrast, tumors that developed in FIV-
treated mice had clear banding patterns after Southern analysis with no
variations in band intensities (data not shown). GFP expression in these
tumors was also highly intense and uniform throughout each tumor (data
not shown). The animals treated in this study received similar vector doses
(between 1 × 10⁷–4.2 × 10
7 vector particles); however, only EIAV
and FIV vector-treated mice developed tumors (Table 1). VCN
averages were measured using real-time PCR. VCNs with SEM for
SMART 2Z were found to be 8.7 ± SE 0.23 (n = 4), SMART 2ZW
14.5 ± SE 2.3 (n = 4), pLION11- hAAT-eGFP 5.5 ± SE 0.31 (n = 4),
HR’SIN-cPPT-S-FIX-W 0.9 ± SE 0.15 (n = 6), and for RRL.SIN-
CMV-FIX 0.6 ± SE 0.22 (n = 6). The VCNs found in the HIV LV-
treated animals closely matched those in our previous studies;13,18
however, the SMART 2 VCNs found
3
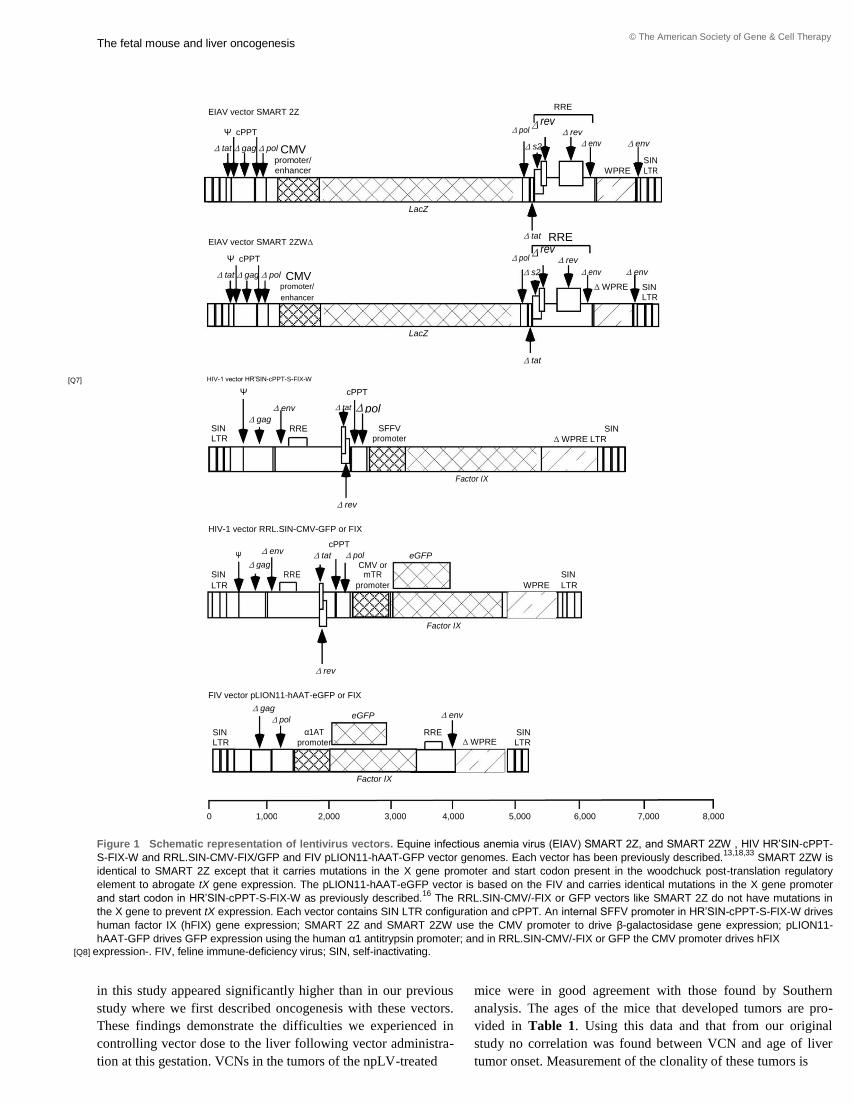
The fetal mouse and liver oncogenesis
EIAV vector SMART 2Z
Ψ cPPT
∆ tat ∆ gag ∆ pol CMV promoter/
enhancer
LacZ
EIAV vector SMART 2ZW∆
Ψ cPPT ∆ tat ∆ gag ∆ pol CMV
promoter/
enhancer
LacZ
[Q7] HIV-1 vector HR’SIN-cPPT-S-FIX-W
Ψ cPPT
∆ env ∆ tat ∆ pol
SIN ∆ gag
SFFV
RRE
LTR promoter
Factor IX
∆ rev
© The American Society of Gene & Cell Therapy
RRE
∆ pol ∆
rev
∆ rev ∆ env
∆ s2 ∆ env
WPRE
SIN
LTR
∆ tat RRE
∆ pol ∆
rev
∆ rev
∆ s2 ∆ env ∆ env
∆ WPRE SIN
LTR
∆ tat
SIN
∆ WPRE LTR
HIV-1 vector RRL.SIN-CMV-GFP or FIX
Ψ ∆ env cPPT
∆ tat ∆ pol eGFP
∆ gag
SIN
RRE CMV or
SIN
mTR
WPRE
LTR promoter LTR
Factor IX
∆ rev
FIV vector pLION11-hAAT-eGFP or FIX
∆ gag eGFP ∆ env
∆ pol
α1AT
SIN RRE ∆ WPRE
SIN
LTR promoter LTR
Factor IX
0 1,000 2,000 3,000 4,000 5,000 6,000 7,000 8,000
Figure 1 Schematic representation of lentivirus vectors. Equine infectious anemia virus (EIAV) SMART 2Z, and SMART 2ZW , HIV HR’SIN-cPPT-
S-FIX-W and RRL.SIN-CMV-FIX/GFP and FIV pLION11-hAAT-GFP vector genomes. Each vector has been previously described.13,18,33
SMART 2ZW is
identical to SMART 2Z except that it carries mutations in the X gene promoter and start codon present in the woodchuck post-translation regulatory
element to abrogate tX gene expression. The pLION11-hAAT-eGFP vector is based on the FIV and carries identical mutations in the X gene promoter
and start codon in HR’SIN-cPPT-S-FIX-W as previously described.16
The RRL.SIN-CMV/-FIX or GFP vectors like SMART 2Z do not have mutations in
the X gene to prevent tX expression. Each vector contains SIN LTR configuration and cPPT. An internal SFFV promoter in HR’SIN-cPPT-S-FIX-W drives
human factor IX (hFIX) gene expression; SMART 2Z and SMART 2ZW use the CMV promoter to drive β-galactosidase gene expression; pLION11-
hAAT-GFP drives GFP expression using the human α1 antitrypsin promoter; and in RRL.SIN-CMV/-FIX or GFP the CMV promoter drives hFIX [Q8] expression. FIV, feline immune-deficiency virus; SIN, self-inactivating.
in this study appeared significantly higher than in our previous
study where we first described oncogenesis with these vectors.
These findings demonstrate the difficulties we experienced in
controlling vector dose to the liver following vector administra-
tion at this gestation. VCNs in the tumors of the npLV-treated
4
mice were in good agreement with those found by Southern
analysis. The ages of the mice that developed tumors are pro-
vided in Table 1. Using this data and that from our original
study no correlation was found between VCN and age of liver
tumor onset. Measurement of the clonality of these tumors is
www.moleculartherapy.org

© The American Society of Gene & Cell Therapy
The fetal mouse and liver oncogenesis
a b c d
LT
LT
LT
LT
NL
e f g h
NL LT
NL NL
i j k l
NL
LT
NL LT
n
m
LT
NL LT
Figure 2 Macroscopic and microscopic analysis. Representative photomicrographs of tumors that developed in the fetally treated adult mice.These appear to
closely match those described in our previous study as solid masses surrounded by normal liver tissue. (a) SMART 2ZW -treated mouse 10 liver with tumor (killed at
369 days) (original magnification ×10); (b) β-galactosidase expression in EIAV mouse 10 tumor (original magnification ×40); (c) SMART 2ZW infected mouse 9
(killed at day 279) tumor with speckled staining of cells in foci positively expressing β-galactosidase (original mag-nification ×40); (d) SMART 2ZW -infected mouse 7
(killed at day 127) tumor also with speckled β-galactosidase expression (original magnification ×40); (e) EIAV mouse 7 normal liver stained for β-galactosidase
expression (original magnification ×40). (f) Representative liver tumors that developed in mouse 18 treated with feline immunodeficiency virus vector pLION11-
hAAT-eGFP (original magnification ×10); (g) Anti-GFP immunostaining of mouse 18 hepatocytes infected by pLION11-hAAT-eGFP. Approximately 50% of cells
appear positively for GFP expression (original magnification ×100); (h) Immunostaining for GFP in RRL.SIN-CMV-GFP infected cells shows ~20% express GFP
(original magnification ×100). Histological analysis; (i) Representative normal liver tissue of a vector buffer only treated mouse at 715 days with fatty degeneration
and normal hepatocyte morphol-ogy (hematoxylin and eosin staining, original magnification ×100); (j) Liver of EIAV SMART 2Z-treated mouse 4 killed at 531 days
also with normal hepatocyte morphology and fatty degeneration (hematoxylin and eosin staining, original magnification ×100); (k) Mouse 4 hepatocellular carcinoma
(HCC) showing a trabecular architecture of tumor cells (hematoxylin and eosin staining, original magnification ×100); (l) High-power magnification of EIAV SMART
2Z mouse 1, killed at 487 days, HCC with abnormal mitosis and dysplastic cells around central vein (hematoxylin and eosin staining, original magnification ×200);
(m) EIAV SMART 2Z W-treated mouse 7 killed at 127 days with HCC showing a cross-section of the liver with a border between normal liver and tumor
(hematoxylin and eosin staining, original magnification ×40); (n) Mouse 7 HCC with widespread polymorphic tumor cells (hematoxylin and eosin staining, original
magnification ×100). All livers of HIV HR’SIN-cPPT-S-FIX-W and RRL.SIN-CMV-FIX pLV HIV-treated mice appeared normal morphologically and histologically.
EIAV, equine infectious anemia virus; LV, lentiviral vectors; SIN, self-inactivating.
provided below that followed the identification of SMART 2
insertions in genes in tumors by linear amplification-mediated
(LAM) PCR and DNA sequencing. Tumor insertions occur in cancer-associated genes at high frequency Then, we examined tumor clonality in greater detail by identify-
ing the positions of virus insertions with respect to RefSeq genes
in the mouse genome using LAM PCR and DNA sequencing. In
total, provirus-genomic DNA junctions were sequenced from
five EIAV-derived tumors; two by Sanger and Coulson
sequencing, two by 454 pyrosequencing, and one by both
methods. Insertion sites were also retrieved from six FIV-derived
tumors and sequenced by the Sanger and Coulson method only. Molecular Therapy
To generate sets of provirus integrants from the normal liv-ers of EIAV and HIV-treated mice, we used LAM PCR and 454 pyrosequencing on the normal livers of the three SMART 2-treated mice (from which we had retrieved vector insertions from their tumors) and on two normal livers from HR’SIN-cPPT-S-FIX-W-treated animals. These data were then used for comparative analy-sis of the insertion profiles between EIAV and HIV vectors in the fetal mouse genome. Of note, this data were generated at the end of the study at the time of killing and may be influenced by clonal outgrowth in the liver caused by vector genotoxicity.
To obtain vector insertions, all LAM-PCR amplicon
sequences were aligned to the mouse genome using BLAST
(http://www. ncbi.nlm.nih.gov/genome/seq/MmBlast.html)
and BLAT searches [Q9] (http://genome.ucsc.edu). Using a
100 kb insertion site interval, 5

The fetal mouse and liver oncogenesis © The American Society of Gene & Cell Therapy
integration site sequencing confirmed the clonal nature of the
developed HCCs mixed with nonclonal cells. As deep sequenc-
ing efficiently retrieves integration sites from polyclonal cell
populations not involved in tumor formation in addition to those
involved in tumorigenesis, we subtracted tumor versus nontumor
relevant integrants by using the retrieval frequency of each inte-
grant. The higher the identical sequence count for each
integrant, the higher the likelihood of it being clonal and tumor
associated. Using sequence count data we were then able to
calculate the per-centage of cells with clonal insertions in the
three deep sequenced tumors relative to all infected cell
populations in each tumor. For the three tumors examined, these
percentages were 25.7, 49.9, and 3.9. These values, however, do
not include untransduced cells recruited to the tumors. Using each sequencing method, from the five EIAV and six
FIV-associated tumors, we obtained a total of 16 and 23 clonal
integrations in RefSeq genes, respectively. Of these, 56% were
either in known oncogenes, associated with oncogenes, or
involved in tumor suppression. We next identified the molecular
function and role in biological processes for each gene using the
gene ontology (GO) database. Each gene was also examined for
inclusion in the Mouse Retroviral Tagged Cancer Gene
Database (RTCGD, http://RTCGD.ncifcrf.gov) and for its
relationship to oncogenesis (Supplementary Table S1). A total
of 25 genes were found with known involvement in cancer and
13 specifically with HCC. Seven of these genes or family
members were also found listed in the RTCGD. Using both sequencing methods after LAM PCR on one of
the tumors examined (mouse 1T2 from our previous study), both
agreed that Park 7, Uvrag, and Rabgef genes were the clonal
integra-tion sites in this tumor (these genes were represented
with closely matching sequence count by the 454 method). It is
worth noting that Park7 is an oncogene and known to be
involved in HCC;19,20
and Uvrag is a tumor suppressor
important to autophagy21
and also involved in liver cancer. We used locus-specific Q-PCR to measure the levels of clonal-
ity in two of the three tumors where LAM PCR followed by 454
sequencing had provided the identification of genes with EIAV LV
insertions with high-sequence counts. From tumor 6T1 with
insertions in Pah, loc382044, and Acvr2a, we measured the abun-
dance of DNA-containing SMART 2Z in Pah; and from tumor 1T2
with insertions in Rabgef, Rnf 13, Uvrag, and Park 7, we mea-sured
the abundance of DNA-containing SMART 2Z in Uvrag. These
genes were chosen due to their proximity of the vector to the gene
that provided ideal conditions to design primer/probe [Q10] sets for Q-PCR analysis. From this analysis using GAPDH as the
gene locus which would be expected in 100% of cells, we found
the abundance of Pah and Uvrag insertions to be 35% ± 0.33
and 16% ± 0.23, respectively. Of note, these data reflect
clonality in these tumors as compared with cell populations that
are nonclonal with or without vector insertions. Comparison of EIAV and HIV vector integration profiles in normal livers At E16 to day 3 after birth, the period of time when vector inte-
gration was expected to have been completed, gene expres-sion
in the fetus is highly complex with many genes in a highly 6
transcriptionally active state.
14 These genes are known to be
involved in control of liver development and proliferation and with
known involvement in HCC.14
We suspected, therefore, that
insertion into these genes by a potentially genotoxic vector may
initiate outgrowth of subsets of cells and lead to liver disease. We
therefore characterized and compared the insertion profiles of EIAV
and HIV LVs in normal livers to look at differences in inser-tion site
selection that could have contributed to clonal outgrowth and
oncogenesis in the EIAV-treated mice. A total of 839 EIAV and 244 HIV nonredundant insertions were
retrieved. Of these, 642 (76.5%) and 193 (79%) insertions of EIAV
and HIV, respectively, were located in or close to RefSeq genes
(within a window of 100 kb), which is in agreement with previous
investigations of the insertion site frequencies into RefSeq genes by
these vectors.10,11
,22–24
Using the 839 EIAV and 244 HIV
nonredundant unique insertions, we made comparisons using the
following parameters: (i) region within the inserted gene and
relative to transcription start site, (ii) distance from the CpG island,
(iii) regional CG content, (iv) chromosome preferences, and (v)
regional gene density. Common insertions: hot spots for each vector
were also identified. First, independent and random-ized insertion
data sets for EIAV and HIV were created by setting each vector
insertion site randomly across the genome.25
As previously described for these LV vectors, each preferably
integrated into the transcription unit and not near the transcrip-tion
start site or CpG islands (Supplementary Figure S3a,b).10,11
In
addition, as already described, EIAV and HIV insertions posi-tively
correlated with AT rich region selection (P < 0.001)11,26
with a 35–
45% GC content around insertions using windows of 100, 250, 500,
750, and 1 kb on either side of each integrant. The 1 kb interval is
shown as representative of every window that has iden-tical
behavior (Supplementary Figure S3c). For both vectors, in contrast
to the random set, we found an uneven chromosomal distribution
that was independent of chromosome size and gene density with
HIV insertions in regions with lower gene density (0–59 genes/5 ×
106 bp) than EIAV (30–120 genes/5 × 10
6 bp) (P < 0.0001)
(Supplementary Figure S3d,e). We then tried to identify hotspots of EIAV insertions in com-
mon insertion sites within a narrow 500 bp interval. Insertions [Q11]
were found in several genes located on different chromosomes one of which was in Uvrag that we already identified in a clonal HCC
from our original study 13. Of note, GO assignment of the EIAV
common insertion sites showed their gene products to be relevant to
development, cell death, cycle, proliferation DNA replication/
repair, cell signaling, and cancer (http://www.ncbi.nlm.nih.gov/)
(Supplementary Table S2). Although HIV preference for insertion
hotspots have been previously described,11,23
we found no integra-
tion hotspots for the HR’SIN-cPPT-S-FIX-W HIV vector even when
we broadened our investigation for hotspots in a 100 kb interval
around each insertion site. Using this insertion site, window EIAV
hotspots were found in Park7, Cyp3A11, and Mrpl23 genes in addi-
tion to the Uvrag gene that was also identified in the clonal tumors13
(Supplementary Table S2). The hotspot region with most vector
insertions (using the 500 bp interval) contained 13 EIAV insertions
between the Ankrd17 and Alb genes clustered in a 115.3 kbp region
on chromosome 5. In the 1 Mbp region around this region, we found
six more EIAV insertions in the closely located Afm, Rassf6,
www.moleculartherapy.org
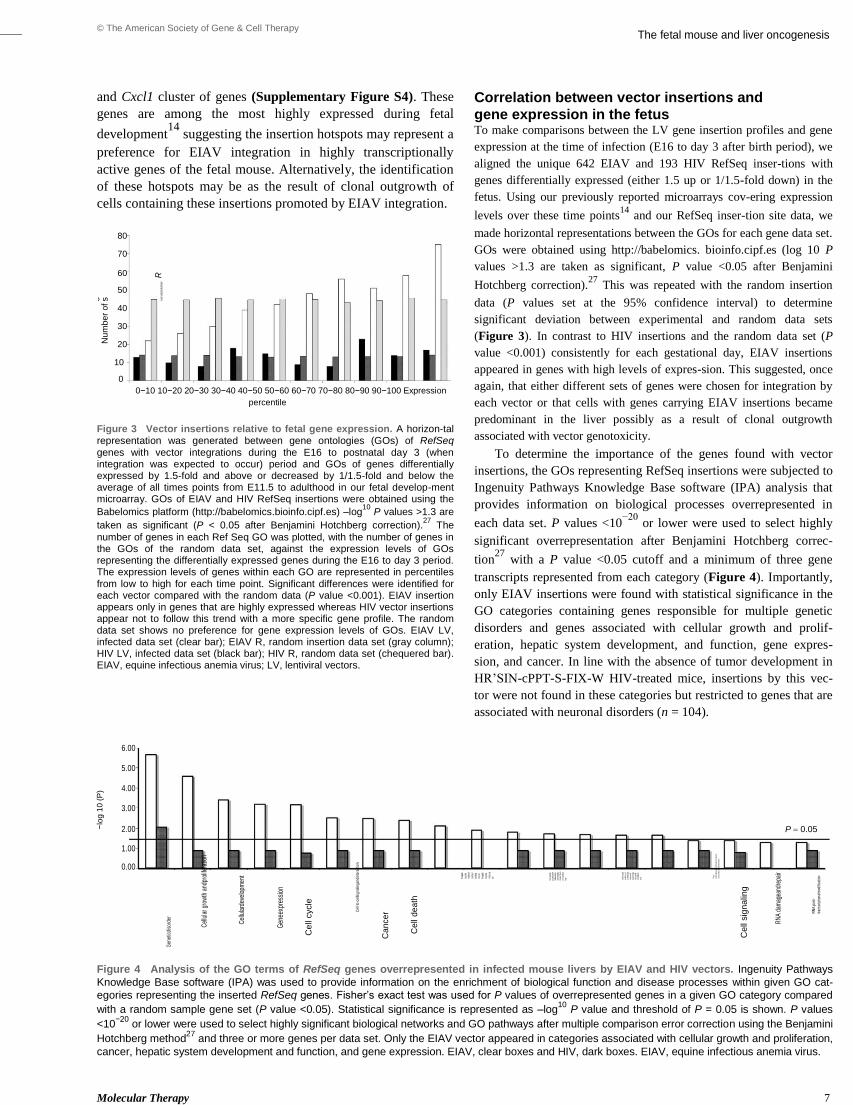
© The American Society of Gene & Cell Therapy The fetal mouse and liver oncogenesis
and Cxcl1 cluster of genes (Supplementary Figure S4). These
genes are among the most highly expressed during fetal
development14
suggesting the insertion hotspots may represent a
preference for EIAV integration in highly transcriptionally
active genes of the fetal mouse. Alternatively, the identification
of these hotspots may be as the result of clonal outgrowth of
cells containing these insertions promoted by EIAV integration. 80
70
60
L V
R
R
ge
ne
s 50
HIV
LV
HIV
EIA
VE
IAV
of
40
Nu
mb
er
30
20
10 0
0−10 10−20 20−30 30−40 40−50 50−60 60−70 70−80 80−90 90−100 Expression
percentile Figure 3 Vector insertions relative to fetal gene expression. A horizon-tal representation was generated between gene ontologies (GOs) of RefSeq
genes with vector integrations during the E16 to postnatal day 3 (when integration was expected to occur) period and GOs of genes differentially expressed by 1.5-fold and above or decreased by 1/1.5-fold and below the average of all times points from E11.5 to adulthood in our fetal develop-ment microarray. GOs of EIAV and HIV RefSeq insertions were obtained using the
Babelomics platform (http://babelomics.bioinfo.cipf.es) –log10
P values >1.3 are
taken as significant (P < 0.05 after Benjamini Hotchberg correction).27
The
number of genes in each Ref Seq GO was plotted, with the number of genes in the GOs of the random data set, against the expression levels of GOs representing the differentially expressed genes during the E16 to day 3 period. The expression levels of genes within each GO are represented in percentiles from low to high for each time point. Significant differences were identified for each vector compared with the random data (P value <0.001). EIAV insertion appears only in genes that are highly expressed whereas HIV vector insertions appear not to follow this trend with a more specific gene profile. The random data set shows no preference for gene expression levels of GOs. EIAV LV, infected data set (clear bar); EIAV R, random insertion data set (gray column); HIV LV, infected data set (black bar); HIV R, random data set (chequered bar). EIAV, equine infectious anemia virus; LV, lentiviral vectors.
Correlation between vector insertions and
gene expression in the fetus To make comparisons between the LV gene insertion profiles and gene
expression at the time of infection (E16 to day 3 after birth period), we
aligned the unique 642 EIAV and 193 HIV RefSeq inser-tions with
genes differentially expressed (either 1.5 up or 1/1.5-fold down) in the
fetus. Using our previously reported microarrays cov-ering expression
levels over these time points14
and our RefSeq inser-tion site data, we
made horizontal representations between the GOs for each gene data set.
GOs were obtained using http://babelomics. bioinfo.cipf.es (log 10 P
values >1.3 are taken as significant, P value <0.05 after Benjamini
Hotchberg correction).27
This was repeated with the random insertion
data (P values set at the 95% confidence interval) to determine
significant deviation between experimental and random data sets
(Figure 3). In contrast to HIV insertions and the random data set (P
value <0.001) consistently for each gestational day, EIAV insertions
appeared in genes with high levels of expres-sion. This suggested, once
again, that either different sets of genes were chosen for integration by
each vector or that cells with genes carrying EIAV insertions became
predominant in the liver possibly as a result of clonal outgrowth
associated with vector genotoxicity. To determine the importance of the genes found with vector
insertions, the GOs representing RefSeq insertions were subjected to
Ingenuity Pathways Knowledge Base software (IPA) analysis that
provides information on biological processes overrepresented in
each data set. P values <10−20
or lower were used to select highly
significant overrepresentation after Benjamini Hotchberg correc-
tion27
with a P value <0.05 cutoff and a minimum of three gene
transcripts represented from each category (Figure 4). Importantly,
only EIAV insertions were found with statistical significance in the
GO categories containing genes responsible for multiple genetic
disorders and genes associated with cellular growth and prolif-
eration, hepatic system development, and function, gene expres-
sion, and cancer. In line with the absence of tumor development in
HR’SIN-cPPT-S-FIX-W HIV-treated mice, insertions by this vec-
tor were not found in these categories but restricted to genes that are
associated with neuronal disorders (n = 104).
−lo
g 1
0 (
P)
6.00
5.00
4.00
3.00
2.00 P 0.05
1.00
0.00
Cel
lula
r gro
wth
and
prol
ifera
tion
Cel
l-to-
cells
igna
linga
ndin
tera
ctio
n
Pos
t-tra
nsla
tiona
lmod
ifica
tionC
ellu
larfu
nctio
nand
mai
nten
ance
Gen
etic
diso
rder
Cel
lula
rdev
elop
men
t
Gen
eexp
ress
ion
Ce
ll cycle
Ca
nce
r
Ce
ll d
ea
th
Hep
ati
csys
tem
deve
l
opm
en
tand
func
tion
Hep
ati
csys
te
mdi
sea
se
Hem
atol
ogi
cals
yste
mde
velo
pm
enta
ndfu
nctio
nTum
orm
orph
olog
y
DN
Are
pli
catio
n,re
com
bina
tio
n,an
drep
airN
ucle
icac
idm
eta
boli
sm
Ce
ll sig
na
ling
RN
A d
amag
eand
repa
ir
RN
A p
ost-
trans
crip
tiona
lmod
ifica
tion
Figure 4 Analysis of the GO terms of RefSeq genes overrepresented in infected mouse livers by EIAV and HIV vectors. Ingenuity Pathways
Knowledge Base software (IPA) was used to provide information on the enrichment of biological function and disease processes within given GO cat-
egories representing the inserted RefSeq genes. Fisher’s exact test was used for P values of overrepresented genes in a given GO category compared
with a random sample gene set (P value <0.05). Statistical significance is represented as –log10
P value and threshold of P = 0.05 is shown. P values
<10−20
or lower were used to select highly significant biological networks and GO pathways after multiple comparison error correction using the Benjamini
Hotchberg method27
and three or more genes per data set. Only the EIAV vector appeared in categories associated with cellular growth and proliferation,
cancer, hepatic system development and function, and gene expression. EIAV, clear boxes and HIV, dark boxes. EIAV, equine infectious anemia virus. Molecular Therapy 7
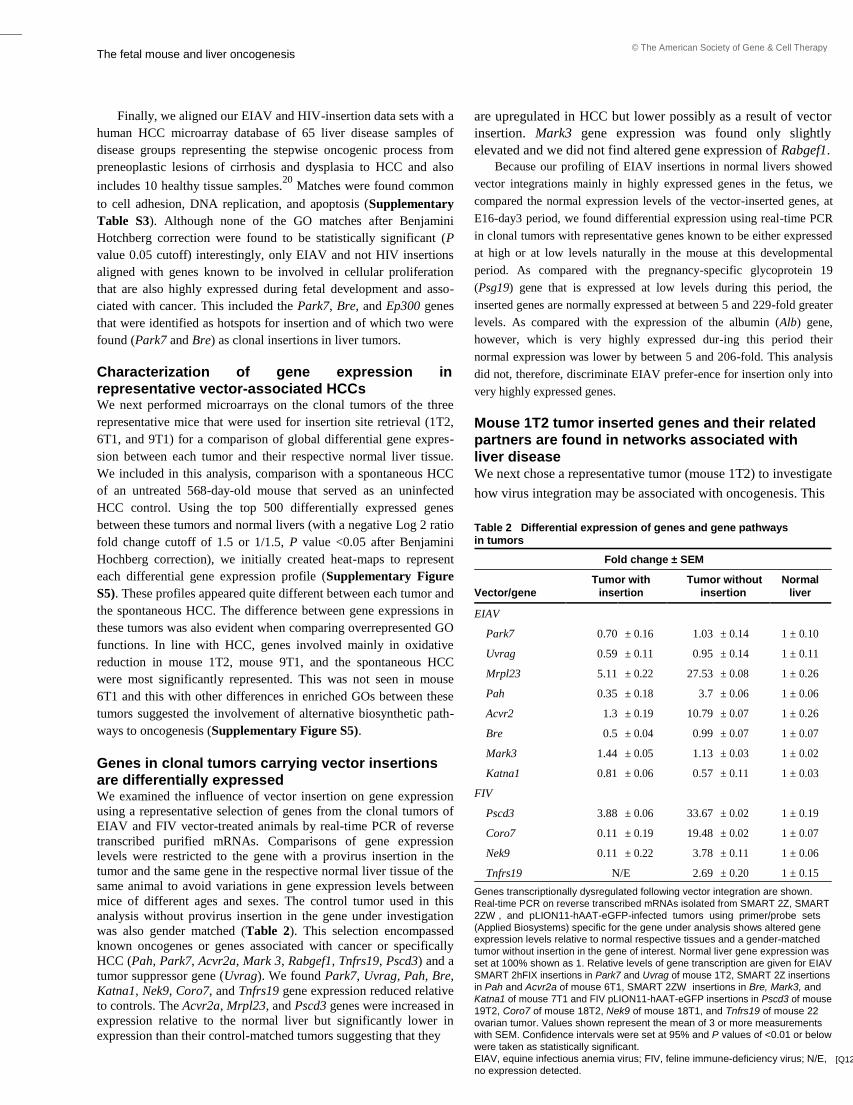
The fetal mouse and liver oncogenesis © The American Society of Gene & Cell Therapy
Finally, we aligned our EIAV and HIV-insertion data sets with a
human HCC microarray database of 65 liver disease samples of
disease groups representing the stepwise oncogenic process from
preneoplastic lesions of cirrhosis and dysplasia to HCC and also
includes 10 healthy tissue samples.20
Matches were found common
to cell adhesion, DNA replication, and apoptosis (Supplementary
Table S3). Although none of the GO matches after Benjamini
Hotchberg correction were found to be statistically significant (P
value 0.05 cutoff) interestingly, only EIAV and not HIV insertions
aligned with genes known to be involved in cellular proliferation
that are also highly expressed during fetal development and asso-
ciated with cancer. This included the Park7, Bre, and Ep300 genes
that were identified as hotspots for insertion and of which two were
found (Park7 and Bre) as clonal insertions in liver tumors. Characterization of gene expression in representative vector-associated HCCs We next performed microarrays on the clonal tumors of the three
representative mice that were used for insertion site retrieval (1T2,
6T1, and 9T1) for a comparison of global differential gene expres-
sion between each tumor and their respective normal liver tissue.
We included in this analysis, comparison with a spontaneous HCC
of an untreated 568-day-old mouse that served as an uninfected
HCC control. Using the top 500 differentially expressed genes
between these tumors and normal livers (with a negative Log 2 ratio
fold change cutoff of 1.5 or 1/1.5, P value <0.05 after Benjamini
Hochberg correction), we initially created heat-maps to represent
each differential gene expression profile (Supplementary Figure
S5). These profiles appeared quite different between each tumor and
the spontaneous HCC. The difference between gene expressions in
these tumors was also evident when comparing overrepresented GO
functions. In line with HCC, genes involved mainly in oxidative
reduction in mouse 1T2, mouse 9T1, and the spontaneous HCC
were most significantly represented. This was not seen in mouse
6T1 and this with other differences in enriched GOs between these
tumors suggested the involvement of alternative biosynthetic path-
ways to oncogenesis (Supplementary Figure S5). Genes in clonal tumors carrying vector insertions are differentially expressed We examined the influence of vector insertion on gene expression
using a representative selection of genes from the clonal tumors of
EIAV and FIV vector-treated animals by real-time PCR of reverse
transcribed purified mRNAs. Comparisons of gene expression
levels were restricted to the gene with a provirus insertion in the
tumor and the same gene in the respective normal liver tissue of the
same animal to avoid variations in gene expression levels between
mice of different ages and sexes. The control tumor used in this
analysis without provirus insertion in the gene under investigation
was also gender matched (Table 2). This selection encompassed
known oncogenes or genes associated with cancer or specifically
HCC (Pah, Park7, Acvr2a, Mark 3, Rabgef1, Tnfrs19, Pscd3) and a
tumor suppressor gene (Uvrag). We found Park7, Uvrag, Pah, Bre,
Katna1, Nek9, Coro7, and Tnfrs19 gene expression reduced relative
to controls. The Acvr2a, Mrpl23, and Pscd3 genes were increased in
expression relative to the normal liver but significantly lower in
expression than their control-matched tumors suggesting that they 8
are upregulated in HCC but lower possibly as a result of vector
insertion. Mark3 gene expression was found only slightly
elevated and we did not find altered gene expression of Rabgef1. Because our profiling of EIAV insertions in normal livers showed
vector integrations mainly in highly expressed genes in the fetus, we
compared the normal expression levels of the vector-inserted genes, at
E16-day3 period, we found differential expression using real-time PCR
in clonal tumors with representative genes known to be either expressed
at high or at low levels naturally in the mouse at this developmental
period. As compared with the pregnancy-specific glycoprotein 19
(Psg19) gene that is expressed at low levels during this period, the
inserted genes are normally expressed at between 5 and 229-fold greater
levels. As compared with the expression of the albumin (Alb) gene,
however, which is very highly expressed dur-ing this period their
normal expression was lower by between 5 and 206-fold. This analysis
did not, therefore, discriminate EIAV prefer-ence for insertion only into
very highly expressed genes. Mouse 1T2 tumor inserted genes and their related partners are found in networks associated with
liver disease We next chose a representative tumor (mouse 1T2) to investigate
how virus integration may be associated with oncogenesis. This
Table 2 Differential expression of genes and gene pathways in tumors
Fold change ± SEM Tumor with Tumor without Normal Vector/gene insertion insertion liver
EIAV
Park7 0.70 ± 0.16 1.03 ± 0.14 1 ± 0.10
Uvrag 0.59 ± 0.11 0.95 ± 0.14 1 ± 0.11
Mrpl23 5.11 ± 0.22 27.53 ± 0.08 1 ± 0.26
Pah 0.35 ± 0.18 3.7 ± 0.06 1 ± 0.06
Acvr2 1.3 ± 0.19 10.79 ± 0.07 1 ± 0.26
Bre 0.5 ± 0.04 0.99 ± 0.07 1 ± 0.07
Mark3 1.44 ± 0.05 1.13 ± 0.03 1 ± 0.02
Katna1 0.81 ± 0.06 0.57 ± 0.11 1 ± 0.03
FIV
Pscd3 3.88 ± 0.06 33.67 ± 0.02 1 ± 0.19
Coro7 0.11 ± 0.19 19.48 ± 0.02 1 ± 0.07
Nek9 0.11 ± 0.22 3.78 ± 0.11 1 ± 0.06
Tnfrs19 N/E 2.69 ± 0.20 1 ± 0.15 Genes transcriptionally dysregulated following vector integration are shown.
Real-time PCR on reverse transcribed mRNAs isolated from SMART 2Z, SMART
2ZW , and pLION11-hAAT-eGFP-infected tumors using primer/probe sets
(Applied Biosystems) specific for the gene under analysis shows altered gene
expression levels relative to normal respective tissues and a gender-matched
tumor without insertion in the gene of interest. Normal liver gene expression was
set at 100% shown as 1. Relative levels of gene transcription are given for EIAV SMART 2hFIX insertions in Park7 and Uvrag of mouse 1T2, SMART 2Z insertions in Pah and Acvr2a of mouse 6T1, SMART 2ZW insertions in Bre, Mark3, and
Katna1 of mouse 7T1 and FIV pLION11-hAAT-eGFP insertions in Pscd3 of mouse 19T2, Coro7 of mouse 18T2, Nek9 of mouse 18T1, and Tnfrs19 of mouse 22
ovarian tumor. Values shown represent the mean of 3 or more measurements
with SEM. Confidence intervals were set at 95% and P values of <0.01 or below were taken as statistically significant.
EIAV, equine infectious anemia virus; FIV, feline immune-deficiency virus; N/E, [Q12] no expression detected.
www.moleculartherapy.org

© The American Society of Gene & Cell Therapy
The fetal mouse and liver oncogenesis
mouse was chosen for the analysis because first we had character-
ized its tumor with elevated expression of genes associated with
oxidative stress, which is a hallmark of HCC and second as inser-
tions in the Park7 oncogene and Uvrag tumor suppressor gene were
found in this tumor. Although there were additional inser-tions in
the Mrpl23 and Rabgef1 genes, Rabgef1 was not found dif-
ferentially expressed and there is no association between Mrpl23
and cancer. Third, we had identified Park7 in the human HCC
database and Uvrag that is also associated with cancer. Finally,
these genes were also identified as hotspots for insertion and were
found reduced in expressed by real-time PCR. Initially, we found interactive partners to Park 7 and Uvrag genes
using the STRING (http://string-db.org/) database that provides
information on predicted protein–protein interactions that includes
direct (physical) and indirect (functional) associations to identify
interactive genes (with significant associated combined scores 0.4
confidence level). We then collated gene expression levels from our
microarray of this tumor according to a P value significance cut-off of
<0.05 (after Benjamini Hochberg correction) rather than 1.5 negative
log 2 fold cutoff to maximize our data set. We next identi-fied
differential expression of the interactive partners of Park 7 and
Uvrag in our microarray database of this tumor (Supplementary
Figure S6 and Supplementary Table S4). Finally, we subjected these gene sets to IPA network analy-
sis that directly links them to pathways involved in liver disease
and cancer of the liver. The pathways identified included apop-
tosis of hepatocytes, repair of DNA, liver tumorigenesis, hepato-
cyte proliferation, cell cycle progression, transcription, and HCC
(Figure 5). Discussion The potential for RV and LV-mediated side effects following non-
targeted, somatic gene transfer is still unknown. We suspect that a
significant genotoxic risk could be present following in vivo gene
transfer to several cell types with different spatial and temporal
profiles of gene expression by vectors that are known to prefer to
integrate into gene promoters and/or active gene transcription units.
In contrast to ex-vivo gene therapy, the in vivo approach does not
rely on cell engraftment for survival and proliferation and therefore,
it is possible that a significant population of cells harboring provirus
“hits” into cancer-related genes could sur-vive after gene transfer
which theoretically increases the risk of
Fx: Transcription
Fx: Apoptosis of cell lines RAB9A
PIK3C3
TOPORS SEMA5A GSTO1
SH3GLB1
MAPT
SOD2
SIRT5
QPRT
NQO1
Fx: Hepatocellular carcinoma
Fx: Carcinoma
KEAP1 ATG5 (includes EG:9474)
ATG7
DAXX
Fx: Apoptosis of hepatocytes
Fx: Liver cancer TP53
PIAS2
UVRAG Fx: Repair of DNA
Fx: Tumorigenesis of mice PARK7
ATG9A Fx: DNA damage response of cells
ATG12
BECN1
Fx: Cell cycle progression Fx: Re-entry into cell cycle progression of carcinoma cell lines
BAX XPC
BCL2
Fx: Transcription of gene
Fx: Proliferation of hepatocytes Fx: Tumorigenesis of liver
Figure 5 Biological networks and functional pathways linking Park7 and Uvrag genes. IPA network analysis of Park7 and Uvrag from (mouse 1T2) found with significant differential expression in the microarray from these mice compared with their respective controls and ranked
by fold change (−log2 ratio, cutoff P value <0.05 after Benjamini Hochberg correction). Networks show interactive genes linked to pathways that
include apoptosis in the liver, DNA repair, liver tumorigenesis, hepatocyte proliferation, cell cycle progression, transcription, and hepatocellular carcinoma (HCC). Their detailed involvement in HCC requires further investigation.
Molecular Therapy 9
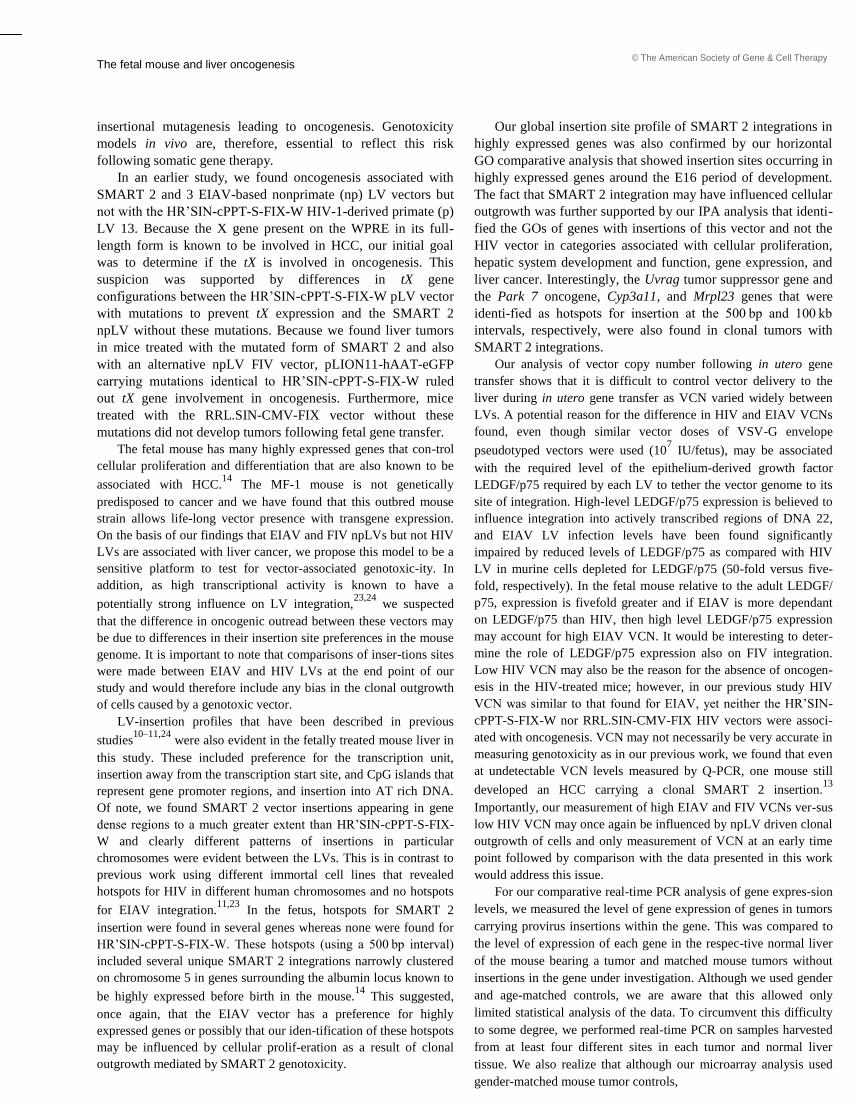
The fetal mouse and liver oncogenesis © The American Society of Gene & Cell Therapy
insertional mutagenesis leading to oncogenesis. Genotoxicity
models in vivo are, therefore, essential to reflect this risk
following somatic gene therapy. In an earlier study, we found oncogenesis associated with
SMART 2 and 3 EIAV-based nonprimate (np) LV vectors but
not with the HR’SIN-cPPT-S-FIX-W HIV-1-derived primate (p)
LV 13. Because the X gene present on the WPRE in its full-
length form is known to be involved in HCC, our initial goal
was to determine if the tX is involved in oncogenesis. This
suspicion was supported by differences in tX gene
configurations between the HR’SIN-cPPT-S-FIX-W pLV vector
with mutations to prevent tX expression and the SMART 2
npLV without these mutations. Because we found liver tumors
in mice treated with the mutated form of SMART 2 and also
with an alternative npLV FIV vector, pLION11-hAAT-eGFP
carrying mutations identical to HR’SIN-cPPT-S-FIX-W ruled
out tX gene involvement in oncogenesis. Furthermore, mice
treated with the RRL.SIN-CMV-FIX vector without these
mutations did not develop tumors following fetal gene transfer. The fetal mouse has many highly expressed genes that con-trol
cellular proliferation and differentiation that are also known to be
associated with HCC.14
The MF-1 mouse is not genetically
predisposed to cancer and we have found that this outbred mouse
strain allows life-long vector presence with transgene expression.
On the basis of our findings that EIAV and FIV npLVs but not HIV
LVs are associated with liver cancer, we propose this model to be a
sensitive platform to test for vector-associated genotoxic-ity. In
addition, as high transcriptional activity is known to have a
potentially strong influence on LV integration,23,24
we suspected
that the difference in oncogenic outread between these vectors may
be due to differences in their insertion site preferences in the mouse
genome. It is important to note that comparisons of inser-tions sites
were made between EIAV and HIV LVs at the end point of our
study and would therefore include any bias in the clonal outgrowth
of cells caused by a genotoxic vector. LV-insertion profiles that have been described in previous
studies10–11,24
were also evident in the fetally treated mouse liver in
this study. These included preference for the transcription unit,
insertion away from the transcription start site, and CpG islands that
represent gene promoter regions, and insertion into AT rich DNA.
Of note, we found SMART 2 vector insertions appearing in gene
dense regions to a much greater extent than HR’SIN-cPPT-S-FIX-
W and clearly different patterns of insertions in particular
chromosomes were evident between the LVs. This is in contrast to
previous work using different immortal cell lines that revealed
hotspots for HIV in different human chromosomes and no hotspots
for EIAV integration.11,23
In the fetus, hotspots for SMART 2
insertion were found in several genes whereas none were found for
HR’SIN-cPPT-S-FIX-W. These hotspots (using a 500 bp interval)
included several unique SMART 2 integrations narrowly clustered
on chromosome 5 in genes surrounding the albumin locus known to
be highly expressed before birth in the mouse.14
This suggested,
once again, that the EIAV vector has a preference for highly
expressed genes or possibly that our iden-tification of these hotspots
may be influenced by cellular prolif-eration as a result of clonal
outgrowth mediated by SMART 2 genotoxicity. 10
Our global insertion site profile of SMART 2 integrations in
highly expressed genes was also confirmed by our horizontal
GO comparative analysis that showed insertion sites occurring in
highly expressed genes around the E16 period of development.
The fact that SMART 2 integration may have influenced cellular
outgrowth was further supported by our IPA analysis that identi-
fied the GOs of genes with insertions of this vector and not the
HIV vector in categories associated with cellular proliferation,
hepatic system development and function, gene expression, and
liver cancer. Interestingly, the Uvrag tumor suppressor gene and
the Park 7 oncogene, Cyp3a11, and Mrpl23 genes that were
identi-fied as hotspots for insertion at the 500 bp and 100 kb
intervals, respectively, were also found in clonal tumors with
SMART 2 integrations. Our analysis of vector copy number following in utero gene
transfer shows that it is difficult to control vector delivery to the
liver during in utero gene transfer as VCN varied widely between
LVs. A potential reason for the difference in HIV and EIAV VCNs
found, even though similar vector doses of VSV-G envelope
pseudotyped vectors were used (107 IU/fetus), may be associated
with the required level of the epithelium-derived growth factor
LEDGF/p75 required by each LV to tether the vector genome to its
site of integration. High-level LEDGF/p75 expression is believed to
influence integration into actively transcribed regions of DNA 22,
and EIAV LV infection levels have been found significantly
impaired by reduced levels of LEDGF/p75 as compared with HIV
LV in murine cells depleted for LEDGF/p75 (50-fold versus five-
fold, respectively). In the fetal mouse relative to the adult LEDGF/
p75, expression is fivefold greater and if EIAV is more dependant
on LEDGF/p75 than HIV, then high level LEDGF/p75 expression
may account for high EIAV VCN. It would be interesting to deter-
mine the role of LEDGF/p75 expression also on FIV integration.
Low HIV VCN may also be the reason for the absence of oncogen-
esis in the HIV-treated mice; however, in our previous study HIV
VCN was similar to that found for EIAV, yet neither the HR’SIN-
cPPT-S-FIX-W nor RRL.SIN-CMV-FIX HIV vectors were associ-
ated with oncogenesis. VCN may not necessarily be very accurate in
measuring genotoxicity as in our previous work, we found that even
at undetectable VCN levels measured by Q-PCR, one mouse still
developed an HCC carrying a clonal SMART 2 insertion.13
Importantly, our measurement of high EIAV and FIV VCNs ver-sus
low HIV VCN may once again be influenced by npLV driven clonal
outgrowth of cells and only measurement of VCN at an early time
point followed by comparison with the data presented in this work
would address this issue. For our comparative real-time PCR analysis of gene expres-sion
levels, we measured the level of gene expression of genes in tumors
carrying provirus insertions within the gene. This was compared to
the level of expression of each gene in the respec-tive normal liver
of the mouse bearing a tumor and matched mouse tumors without
insertions in the gene under investigation. Although we used gender
and age-matched controls, we are aware that this allowed only
limited statistical analysis of the data. To circumvent this difficulty
to some degree, we performed real-time PCR on samples harvested
from at least four different sites in each tumor and normal liver
tissue. We also realize that although our microarray analysis used
gender-matched mouse tumor controls,
www.moleculartherapy.org

© The American Society of Gene & Cell Therapy
The fetal mouse and liver oncogenesis
these were not of identical ages and it is likely that in each tumor,
different pathways may be responsible for the development of liver
cancer. Furthermore, even though high-density microarray anal-ysis
is believed capable to confirm altered levels of gene expres-sion
found by real-time PCR, this is not always possible for every gene
set under investigation28
and we therefore, did not expect to be able
to achieve accurate matches between every differentially expressed
gene examined by the two techniques as was sometimes the case
during our analysis. Nonetheless, assuming our observations were mediated by
vector genotoxicity, we linked the Park7 and Uvrag genes that
car-ried viral insertions, showed reduced in expression by Q-
PCR, with their interactive partners using the STRING database
in a representative tumor, and identified these genes in our
tumor microarray. Applying this data set to IPA analysis, we
determined which gene networks could have been involved in
oncogenesis. Although this identified genes belonging to
pathways involved in liver disease, cancer, and specifically
HCC, that may have differ-ential expression influenced by
vector integration, we cannot rule out that these genes may be
altered in expression as a result of effects not related to vector
integration. Hence, we are still only able to speculate that
insertion by SMART 2 in the Park7 onco-gene and Uvrag tumor
suppressor gene in the same tumor may have initiated neoplasia. A possible mechanism behind mutagenesis in the treated mice
by SMART 2 and pLION11-hAAT-eGFP vector is the configura-
tion of splice donor and acceptor sites in these vectors. Aberrant
splicing is known to cause altered oncogene expression as was
shown in the tumor prone model.9 Interestingly, both SMART 2Z
and pLION11-hAAT-eGFP have splice donor and acceptor sites
some distance apart either side of the transgene and promoter as
opposed to HR’SIN-cPPT-S-FIX-W where both splice sites are 5′ to
the transgene and promoter. The importance of the splice acceptor
in SMART 2 and pLION11-hAAT-eGFP just 5′ of WPRE is yet to
be investigated. In theory, splicing of cellular genes with the vector,
if in the appropriate orientation, could result in WPRE being
introduced onto cellular RNA which could result in pro-longed
RNA half live and increased gene expression. Alternatively,
splicing could also result in nonfunctional truncated proteins
thereby effectively reducing gene expression. In summary and following on from our previous report, we
conclude in this study that the X gene is not directly involved in
oncogenesis after in utero gene transfer. We find genes mostly
downregulated following SMART 2 and pLION11-hAAT-eGFP
insertion and that the EIAV vector either has a preference for highly
expressed genes and gene dense regions or may have caused clonal
outgrowth of cells following integration. We aim to deter-mine this
by comparing our current insertion site profiles with those of mice
killed at a 2-week time point following SMART 2 administration
before clonal outgrowth could occur. We believe, therefore, this highly transcriptionally active and
proliferative model with an unperturbed genetic background to be a
particularly sensitive alternative animal system to test for genotox-
icity following in vivo gene transfer as demonstrated here by signifi-
cant differences in the genotoxic potential between the LVs tested.
We propose this model as highly useful to screen novel therapeutic
integrative vectors intended for safe clinical gene therapy. Due to Molecular Therapy
its sensitivity, this model may even be extended to nonintegrating
vectors that are currently considered safe because they only rarely
integrate in the genome in a more randomly manner.29
Although we
have not observed oncogenesis associated with the HIV-derived
vectors used in this study, we cannot rule out that these vectors may
be genotoxic in an alternative model and hence we cannot assume
them to be completely safe. As for any genotoxicity model, conclu-
sions about vector safety drawn from this fetal mouse model should
be made with caution as it may not be capable of accurately repre-
senting the likelihood of insertional mutagenesis in humans follow-
ing LV-mediated gene transfer. However, as HCC is such a common
disease being the fifth most common cancer in humans, we also
propose that the fetal model may also be considered as a useful tool
to research the cause of this disease. Materials and Methods Animal procedures and tissue harvests. MF1 mice were used for in
utero injection. All animal work was carried out in accordance with UK
Home Office regulation and was compliant with the guidelines of the
Imperial College London ethical review committee. Details of the animal
proce-dures and harvests used have been previously described.13
Sampling
was performed by dissection of four parts of each tissue to be investigated. Vector production and titration. EIAV SMART 2 lentivectors were pro-
duced using transient transfection of human embryonic kidney 293T cells
and titered as previously described.30,31
X-gal staining was performed using
standard procedures.17
No replication competent virus was identified using
the method described by Martin-Rendon et al.32
EIAV vector preparations were generated and titered by Oxford BioMedica.
[Q13] Recombinant
HR’SIN-cPPT-S-FIX-W HIV vectors were also produced by transient transfections of 293T cells and titered using a commercial
immunoassay kit for p24 gag (Beckman Coulter, High Wycombe, UK) as
previously described18
that routinely provided concentrations with a range
20–40 ng/µl of p24 protein. Generation of the HR’SIN-cPPT-S-FIX-W
vector carrying the human factor IX (hFIX) cDNA after replacement of GFP
from pHR’SIN-cPPT-SEW has also been described.18
Virus titers were
calculated using batches of HR’SIN-cPPT-S-FIX-W hFIX- and pHR’SIN-
cPPT-SEW eGFP-lentivirus prepared in parallel. Fluorescence- activated cell sorting analysis of cells after infection by eGFP-lentivirus [Q14]
yielded a titer of 5 × 10⁸ infectious particles/ml.
pLION11-hAAT-eGFP FIV particles were generated as previously
described using the 293T packaging cell line.33
HR’SIN-cPPT-S-FIX-W
and pLION11-hAAT-eGFP vector particles were concentrated 100-fold
by ultracentrifugation at 50,000 g for 90 minutes at 4 °C. The pellet was
resuspended in serum-free X-VIVO10 (BioWhittaker Europe, Verviers,
Belgium) and stored at −80 °C. Fluorescence-activated cell sorting analysis of cells after infection by
pLION11-hAAT-eGFP yielded a titer of 1 × 10⁹ infectious particles (TU)/
ml. All viruses used were pseudotyped using the VSV-G envelope. Measurement of hFIX antigen (hFIX:Ag) expression. Plasma samples
con-taining hFIX:Ag after collection of 100 µl of mouse blood in Na Citrate
and centrifugation was measured using a specific hFIX:Ag enzyme-linked
immunosorbent assay as directed by the manufacturer (Roche Diagnostics,
Mannheim, Germany). Human FIX reference supplied with the kit was used
to create standard curve measurements of diluted hFIX:Ag for direct
comparability. Mouse plasma samples were assayed at 50-fold dilution. Immunohistochemistry. Liver tissue fixed in 25% formalin overnight,
transferred to 70% ethanol, and processed into paraffin was used to
detect GFP expression. GFP was detected after microwaving in citrate
buffer then incubation with rabbit anti-eGFP (A-6455, Molecular
Probes, Eugene, Oregon) as previously described.18
11

The fetal mouse and liver oncogenesis
Quantitative of VCN by real-time PCR. Lentiviral copy number in DNA
samples was also determined using primer/probe sets designed to recog-nize
the human FIX cDNA (for HR’SIN-cPPT-S-FIX-W) or the EIAV and FIV
packaging signals in SMART 2 and pLION11-hAAT-eGFP, respec-tively.
Quantitative PCR was performed using an ABI PrismR7900HT sequence
detector (Applied Biosystems, Warrington, UK) as previously described.13
Absolute quantification was used to mathematically deter-mine the viral load
by comparing a range of standards concentrations. The range of standards
was derived from a reliable tumor sample with a known copy number via
Southern blot analysis. The genomic DNA was diluted twofold from a
starting concentration of 500 ng to provide a range of 500–15.625 ng. CT
values were obtained using probes specific to the [Q15]
GAPDH housekeeping gene, the WPRE virus vector sequences common to
HR’SIN-cPPT-S-FIX-W and pLION11-hAAT-eGFP and the packaging
signal (Ψ) of the SMART 2 vector. Raw CT values from tumors and normal
livers were normalized against those of the standard curve. The amplification was carried out in a final volume of 20 µl in which each
reaction contained 18 µl of TaqMan Universal PCR Master Mix (Amperase
UNG, AmpliTaq Gold polymerase, dNTP, Applied Biosystems), [Q16]
100 mmol/l of each primer and probe, and 31.25 ng of genomic DNA. All
samples were tested in triplicate and the variation between the CT of each
duplicate was ≤0.5 Ct. The total number of genomes was recorded for each
concentration in the dilution series. A standard curve was constructed with
Log10 genome values plotted against CT values for each concentration and a
linear regression equation plotted. For unknown samples, VCNs were
interpolated from the standard curve. For each unknown sample, the number
of vector copies per genome (diploid) was calculated using the average CT
values (per concentration) and linear regression values (slope and intercept) from the standard curve.
Real-time PCR to determine the effects of LV provirus insertion on
inserted genes. RNAs were extracted using TRI reagent (Sigma Aldrich,
Gillingham, UK) on tissue samples followed by chloroform extraction and
isopropanol precipitation. RNAs were purified before cDNA syn-thesis
using an Agilent Technology Company kit (Agilent technologies,
Stratagene, Stockport, UK) as per the manufacturers instructions. Purified
RNA was prepared using a High Capacity cDNA reverse transcription kit
(Applied Biosystems). A reverse transcriptase master mix was prepared with
RT buffer, dNTP mix, RT random primers, MultiScribe Reverse
transcriptase, RNase inhibitor, and nuclease-free distilled water accord-ing
to manufacturer’s instructions (Applied Biosystems) was used for cDNA
synthesis using 125 ng of total RNA. cDNA of 2 μl was used with PCR
Mastermix and TaqMan Assays (Amperase UNG, AmpliTaq Gold
polymerase, dNTP, Applied Biosystems). All reactions were carried out in
triplicate on an ABI Prism7900HT real-time PCR instrument (Applied
Biosystems) using primer/probe sets designed for each gene under exami-
nation obtained from Applied Biosystems. Absolute Quantification (stan-
dard curve) reactions were used to optimize the TaqMan reactions using
serially diluted cDNA samples (500–15.625 ng/µl). Relative quantification
was performed on quadruplicate PCR reactions using the Ct method.34
Data
were analyzed with SDS software and cycle thresholds obtained were
normalized ribosomal 18S expression (control) and calibrated to normal
tissue and a gender-matched tumor control for relative quantification. Locus-specific PCR was performed on two genes from two tumors which
were identified by LAM PCR/454 and Sanger and Coulson sequencing methods.
Primer/probe sets for Pah and Uvrag genes and the 5′ LTR of the SMART 2
vector were as follows: 1. Uvrag, Forward 5′-G TACCTTGCAGGC
TTTAATTGTCC-3′, Reverse 5′-AAGGTTATGAGAGCATCAGCAAC-3′.
Product 293 bp. Probe FAM 5′-CGCCTGGCTCCAGCGGCACC-3′ Tamra. Pah,
Forward 5′-CCTAGATAGAATCTTTCAGTTTGG-3′, Reverse 5′- CC
TTTGGGTTATACAAGGTT ATG-3′. Product 266 bp. Probe 5′-CCTCA
GTGCCACAAATTCAGGCTGC-3′. 5′ FAM, 3′ Tamra. EIAV-5′ LTR primer 5′-
GTTATACAAGGTTATGAGAGC-3′. PCR products were tested to identify the correct product sizes before Q-PCR. Genomic DNAs were subjected
12
© The American Society of Gene & Cell Therapy
to amplifications as described above. CT values using primer/probes specific
to the GAPDH housekeeping gene were used to calculate the presence of a
gene in 100% of the genomes of cells in each tumor. The CTs of each gene
under investigation was compared with that of GAPDH to obtain the
percentage of the locus-specific virus/gene representing clonally derived
cells. All samples were tested in quadruplicate and CT SDs were used to
represent SEMs. DNA from normal livers from each mouse and an
uninfected mouse were used as negative controls to show no amplifications. Amplification of vector-genomic DNA junctions. Genomic DNA
was extracted from tumors as previously described.13
LAM-PCR: linear
amplification for the SMART 2 EIAV vector was performed as
previously described.35,36
LAM-PCR of genomic DNA adjacent to the pLION11-hAAT-eGFP vector
was also performed using 100 ng of genomic DNA and 2.5 U Taq polymerase
using the following two biotinylated primers of sequences found in the 5′ LTR: 5′-
GTT CTC GGC CCG GAT TCC-3′ and 5′-CCC GGA TTC CGA GAC CTC-3′
(50 µl final volume). Cycle parameters of 95 °C for 5 minutes (single cycle)
followed by 95 °C for 60 seconds, 60 °C for 45 seconds, 72 °C 90 seconds for 50
cycles, 72 °C for 10 minutes. 2.5 U additional Taq polymerase was added and the
PCR run for another 50 cycles. PCR products were captured using the Dynabeads
kilobase binder kit (Dynal, Oslo, Norway) and the second DNA strand was
synthesized using Klenow (Invitrogen, Carlsbad, CA) with random
hexanucleotides (Invitrogen, Paisley, UK) (20 µl reaction mixture) at 37 °C for 1
hour. The double stranded DNA was digested with Tsp509I and a linker
oligonucleotide added (5′-GAC CCG GGA GAT CTG AAT TCA GTG GCA
CAG CAG TTA GG-3′ and 5′-AAT TCC TAA CTG CTG TGC CAC TGA ATT
CAG ATC-3′) followed by ligation with Fast Link DNA Ligase kit (Epicentre
Technologies, Madison, Wisconsin) for 15 minutes at room temperature. The
DNA was denatured with 0.1 mol/l NaOH before two rounds of PCR using the
same conditions as the linear amplification with primers: FIV LTR 5′-CTC GAC
AGG GTT CAA TCT C-3′ and linker 5′- GAC CCG GGA GAT CTG AAT TC-3′
followed by nested PCR primers: FIV LTR 5′-CTC AAA AGT CCT CAA CAA
AG-3′ and linker 5′ GAT CTG AAT TCA GTG GCA CAG-3′. PCR products
were separated on 3% agarose gels and DNA fragments were isolated using a
Quiex II gel extraction kit (Qiagen, Crawley, UK) and cloned into a TOPO TA
plasmid cloning kit (Invitrogen) as per the manufacturer’s instructions. Bacterial
colonies containing DNA fragments corresponding to those seen in the second
round PCR were sequenced using the FIV-specific nested primer (Leicester
University, Leicester, UK). EIAV and HIV-insertion sites cloned by LAM PCR
and nonrestrictive PCR techniques obtained using 100–300 ng of sample genomic
DNA were sequenced by deep parallel pyrosequencing (GS FLX/454: Roche,
Mannheim, Germany) then subjected to Blas2Seq and the Smith-Waterman
algorithm as previously described.37
Sequences were aligned with the mouse genome (Mus musculus
genome) assembly July 2007 (NCBI37/mm9, UCSC M. musculus genome
version 8) using UCSC BLAT genome browser (http://genome.ucsc.edu) or
BLAST (http://www.ncbi.nlm.nih.gov/genome/seq/MmBlast.html). The
molecular function and role in biological processes of each integration near
to or within a RefSeq gene (within a 100 kb window) was determined using
the Gene Ontology database and identified with potential to be a candidate
gene involved in tumorigenesis. Candidate genes were searched against the
Mouse Retroviral Tagged Cancer Gene Database (RTCGD;
http://RTCGD.ncifcrf.gov). Determination of lentivirus copy number by Southern analysis. Southern
analysis of genomic tumor DNA was carried out as previously described.13
Briefly, 10 µg of genomic DNAs were digested with Hind III that allows the
EIAV provirus and adjacent mouse 3′ genomic DNA to be identified after
separation in 0.6% agarose gels and hybridization with a 625 bp WPRE probe
excised from the pSMART 2Z plasmid. The FIV vector was probed with a 700 bp
GFP probe. Probes were routinely produced using a random primed labeling kit
(Mega-prime system Amersham, UK) with a-32P-CTP.
www.moleculartherapy.org
© The American Society of Gene & Cell Therapy
Autoradiographs were used to visualize provirus bands on
Hybond N+ nylon membranes (Amersham).
Microarrays. Total RNA was isolated from liver tissues using Trizol
reagent (Invitrogen) then subjected to gene expression profiling using
an Illumina mouse sentrix-8 microarray chip from Illumina
recognizing 25,000 sequences to provide a measurement of genes
whose expression had been up or downregulated with high sensitivity.
The gene expression values were extracted using the GenomeStudio
software and filtered according to fluorescence above chip
background. Data were quantile normalized(82) and analyzed using
the bioconductor http://www.bioconductor.org/,
http://www.bioconductor.org/packages/2.0/bioc/html/lumi.html lumi
and limma packages(83). Data were P value adjusted(40) to yield a
sorted list [Q17] of differentially expression genes.
GO function analysis of microarrays. The Gene Ontology file
(version: 1.513; Date: 09/29/2009) and the mouse annotation file
(gene_associa-tion.mgi. version: 1.806; Date: 01/15/2010) were
downloaded from http:// www.geneontology.org. We selected the top
500 significantly differen-tially expressed genes and ranked these by
fold change (log2 ratio, P value <0.05). Hypergeometric distributions
were used to detect overrepresented or underrepresented biological
process terms in the study set compared with the population set. Here,
the population set was constructed using all genes in the microarray of
mouse 1T2 13, mouse 6T1, and mouse 9T1 tumors and a spontaneous
HCC that occurred in a 568-days-old mouse. Probabilities obtained by
hypergeometric distributions were subject to Benjamini Hotchburg
correction.27
Randomized data set generation. To assess whether insertion sites
where assigned to chromosomes randomly, randomization was carried
out 100-times to yield 100 randomized counts of vector inserts per
chromosomes. A t-test (95% confidence) was performed between the
single observed count of sites per chromosome and the randomized
population of 100 counts. Similarly, for CG content and gene density
statistics, randomized data were generated across the genome. To
determine the nature of vector insertion distances from transcription
start site and regions within genes, t-tests were performed between
observed data and those data generated from sites assigned to random
locations, 100-times, within the gene.
Analysis of biological networks by Ingenuity Pathway Analysis (IPA). Network analysis was performed on lists of genes generated from the
earlier analyses described above as being differentially expressed.
IPA (Ingenuity Systems, Redwood City, CA) that contains data of
individually curated relationships between gene objects (e.g., genes,
mRNAs, and proteins) was used for the identification of the biological
processes that are significantly overrepresented to generate significant
biological networks and pathways. Statistical significance of the
biological overrepresentation was determined using Fisher’s exact P
value based on the relative overrepresentation of a minimum of three
genes in the particular pathway as compared with a random sample of
genes (P value cutoff of <0.05). Scores corresponding to P < 10−20
or lower after Benjamini Hotchburg correction were used to select
highly significant biological networks.
SUPPLEMENTARY MATERIAL Figure S1. Survival of cohorts treated with lentivirus vectors.
Figure S2. Representative Southern analysis of tumors and
respective normal livers.
[Q18] Figure S3. Figure S4. Linear representation of the regional hotspot for
EIAV SMART 2 vector insertion in chromosome 5. Figure S5. Global analysis of tumor gene expression. Figure S6. Gene pathways associated with provirus-integrated genes Park 7 and Uvrag Table S1. Vector integration sites in tumors. Table S2. Hotspots for EIAV integration using 500 bp and
100 kb intervals.
Table S3. Alignment of RefSeq insertions with human HCC samples.
Table S4. Microarray of differentially expressed genes belonging to
pathways associated with genes with altered expression identified by
real-time PCR. ACKNOWLEDGMENTS We are grateful to Eithan Galun, Goldyne Savad Institute of Gene
Therapy,Hadassah Hebrew University Hospital, Jerusalem, 91120, Israel
for providing pLION11-hAAT-eGFP virus containing supernatant. This
work was funded by Imperial College London, a Wellcome Trust Value in
People award and a Brunel University BRIEF award. REFERENCES 1. Hacein-Bey-Abina, S, Von Kalle, C, Schmidt, M, McCormack, MP, Wulffraat, N,
Leboulch, P et al. (2003). LMO2-associated clonal T cell proliferation in two patients
after gene therapy for SCID-X1. Science 302: 415–419. 2. Howe, SJ, Mansour, MR, Schwarzwaelder, K, Bartholomae, C, Hubank, M, Kempski,
H et al. (2008). Insertional mutagenesis combined with acquired somatic mutations
causes leukemogenesis following gene therapy of SCID-X1 patients. J Clin Invest
118: 3143–3150. 3. Ott, MG, Schmidt, M, Schwarzwaelder, K, Stein, S, Siler, U, Koehl, U et al. (2006).
Correction of X-linked chronic granulomatous disease by gene therapy, augmented
by insertional activation of MDS1-EVI1, PRDM16 or SETBP1. Nat Med 12: 401–
409. 4. Montini, E, Cesana, D, Schmidt, M, Sanvito, F, Ponzoni, M, Bartholomae, C et al.
(2006). Hematopoietic stem cell gene transfer in a tumor-prone mouse model
uncovers low genotoxicity of lentiviral vector integration. Nat Biotechnol 24: 687–696. 5. Modlich, U, Bohne, J, Schmidt, M, von Kalle, C, Knöss, S, Schambach, A et al.
(2006). Cell-culture assays reveal the importance of retroviral vector design for
insertional genotoxicity. Blood 108: 2545–2553. 6. Nienhuis, AW, Dunbar, CE and Sorrentino, BP (2006). Genotoxicity of retroviral
integration in hematopoietic cells. Mol Ther 13: 1031–1049.
7. Baum, C, Düllmann, J, Li, Z, Fehse, B, Meyer, J, Williams, DA et al. (2003). Side
effects of retroviral gene transfer into hematopoietic stem cells. Blood 101: 2099–
2114.
8. Modlich, U, Kustikova, OS, Schmidt, M, Rudolph, C, Meyer, J, Li, Z et al. (2005).
Leukemias following retroviral transfer of multidrug resistance 1 (MDR1) are driven by
combinatorial insertional mutagenesis. Blood 105: 4235–4246. 9. Montini, E, Cesana, D, Schmidt, M, Sanvito, F, Bartholomae, CC, Ranzani, M et al.
(2009). The genotoxic potential of retroviral vectors is strongly modulated by vector
design and integration site selection in a mouse model of HSC gene therapy. J Clin
Invest 119: 964–975. 10. Wu, X, Li, Y, Crise, B and Burgess, SM (2003). Transcription start regions in the
human genome are favored targets for MLV integration. Science 300: 1749–1751.
11. Hacker, CV, Vink, CA, Wardell, TW, Lee, S, Treasure, P, Kingsman, SM et al. (2006).
The integration profile of EIAV-based vectors. Mol Ther 14: 536–545.
12. Cavazzana-Calvo, M, Payen, E, Negre, O, Wang, G, Hehir, K, Fusil, F et al.
(2010). Transfusion independence and HMGA2 activation after gene therapy of
human ß-thalassaemia. Nature 467: 318–322. 13. Themis, M, Waddington, SN, Schmidt, M, von Kalle, C, Wang, Y, Al-Allaf, F et al.
(2005). Oncogenesis following delivery of a nonprimate lentiviral gene therapy vector
to fetal and neonatal mice. Mol Ther 12: 763–771. 14. Li, T, Huang, J, Jiang, Y, Zeng, Y, He, F, Zhang, MQ et al. (2009). Multi-stage
analysis of gene expression and transcription regulation in C57/B6 mouse liver
development. Genomics 93: 235–242. 15. Kingsman, SM, Mitrophanous, K and Olsen, JC (2005). Potential oncogene activity of
the woodchuck hepatitis post-transcriptional regulatory element (WPRE). Gene Ther
12: 3–4. 16. Zanta-Boussif, MA, Charrier, S, Brice-Ouzet, A, Martin, S, Opolon, P, Thrasher, AJ et
al. (2009). Validation of a mutated PRE sequence allowing high and sustained
transgene expression while abrogating WHV-X protein synthesis: application to the
gene therapy of WAS. Gene Ther 16: 605–619. 17. Waddington, SN, Mitrophanous, KA, Ellard, FM, Buckley, SM, Nivsarkar, M, Lawrence,
L et al. (2003). Long-term transgene expression by administration of a lentivirus-based
vector to the fetal circulation of immuno-competent mice. Gene Ther 10: 1234–1240. 18. Waddington, SN, Nivsarkar, MS, Mistry, AR, Buckley, SM, Kemball-Cook, G, Mosley,
KL et al. (2004). Permanent phenotypic correction of hemophilia B in
immunocompetent mice by prenatal gene therapy. Blood 104: 2714–2721. 19. Wu, F, Liang, YQ and Huang, ZM (2009). (The expression of DJ-1 gene in human
hepatocellular carcinoma and its relationship with tumor invasion and metastasis).
Zhonghua Gan Zang Bing Za Zhi 17: 203–206. 20. Wurmbach, E, Chen, YB, Khitrov, G, Zhang, W, Roayaie, S, Schwartz, M et al.
(2007). Genome-wide molecular profiles of HCV-induced dysplasia and
hepatocellular carcinoma. Hepatology 45: 938–947. 21. Liang, C, Feng, P, Ku, B, Oh, BH and Jung, JU (2007). UVRAG: a new player
in autophagy and tumor cell growth. Autophagy 3: 69–71.
22. Marshall, HM, Ronen, K, Berry, C, Llano, M, Sutherland, H, Saenz, D et al. (2007).
Role of PSIP1/LEDGF/p75 in lentiviral infectivity and integration targeting. PLoS
ONE 2: e1340. 23. Schröder, AR, Shinn, P, Chen, H, Berry, C, Ecker, JR and Bushman, F (2002).
HIV-1 integration in the human genome favors active genes and local hotspots.
Cell 110: 521–529. 24. Mitchell, RS, Beitzel, BF, Schroder, AR, Shinn, P, Chen, H, Berry, CC et al. (2004).
Retroviral DNA integration: ASLV, HIV, and MLV show distinct target site
preferences.
PLoS Biol 2: E234. 25. Dhami, P, Saffrey, P, Bruce, AW, Dillon, SC, Chiang, K, Bonhoure, N et al. (2010).
Complex exon-intron marking by histone modifications is not determined solely by
nucleosome distribution. PLoS ONE 5: e12339.
13
© The American Society of Gene & Cell Therapy
26. Ciuffi, A, Llano, M, Poeschla, E, Hoffmann, C, Leipzig, J, Shinn, P et al. (2005). A role
for LEDGF/p75 in targeting HIV DNA integration. Nat Med 11: 1287–1289.
27. Benjamini YaH, Y. (1995). Controlling the false discovery rate:a practical and powerful
approach to mulitiple testing. J Roy Statist Soc Ser B57: 289–300. 28. Dallas, PB, Gottardo, NG, Firth, MJ, Beesley, AH, Hoffmann, K, Terry, PA et al. (2005).
Gene expression levels assessed by oligonucleotide microarray analysis and quantitative
real-time RT-PCR – how well do they correlate? BMC Genomics 6: 59.
29. Mátrai, J, Cantore, A, Bartholomae, CC, Annoni, A, Wang, W, Acosta-Sanchez, A
et al. (2011). Hepatocyte-targeted expression by integrase-defective lentiviral
vectors induces antigen-specific tolerance in mice with low genotoxic risk.
Hepatology 53: 1696–1707. 30. Mitrophanous, K, Yoon, S, Rohll, J, Patil, D, Wilkes, F, Kim, V et al. (1999). Stable
gene transfer to the nervous system using a non-primate lentiviral vector. Gene Ther 6:
1808–1818. 31. Olsen, JC (1998). Gene transfer vectors derived from equine infectious anemia virus.
Gene Ther 5: 1481–1487.
14
32. Ciuffi, A, Llano, M, Poeschla, E, Hoffmann, C, Leipzig, J, Shinn, P et al. (2005). A role
for LEDGF/p75 in targeting HIV DNA integration. Nat Med 11: 1287–1289.
33. Benjamini YaH, Y. (1995). Controlling the false discovery rate:a practical and powerful
approach to mulitiple testing. J Roy Statist Soc Ser B57: 289–300. 34. Dallas, PB, Gottardo, NG, Firth, MJ, Beesley, AH, Hoffmann, K, Terry, PA et al. (2005).
Gene expression levels assessed by oligonucleotide microarray analysis and quantitative
real-time RT-PCR – how well do they correlate? BMC Genomics 6: 59.
35. Mátrai, J, Cantore, A, Bartholomae, CC, Annoni, A, Wang, W, Acosta-Sanchez, A
et al. (2011). Hepatocyte-targeted expression by integrase-defective lentiviral
vectors induces antigen-specific tolerance in mice with low genotoxic risk.
Hepatology 53: 1696–1707. 36. Mitrophanous, K, Yoon, S, Rohll, J, Patil, D, Wilkes, F, Kim, V et al. (1999). Stable
gene transfer to the nervous system using a non-primate lentiviral vector. Gene Ther 6:
1808–1818.
37. Olsen, JC (1998). Gene transfer vectors derived from equine infectious anemia virus.
Gene Ther 5: 1481–1487.
www.moleculartherapy.org


![Novel benzoxazole derived genotoxicity apoptogenic effects ... · STAT3 signaling pathway in immune cell [8]. Benzoxazole anticancer mechanisms were also reported in selectively inhibiting](https://img.pdfslide.net/doc/110x75/5d1b47c188c993dc468c92a1/novel-benzoxazole-derived-genotoxicity-apoptogenic-effects-stat3-signaling.jpg)