Embed Size (px)
Citation preview
Loughborough UniversityInstitutional Repository
A study of particle historiesduring spray drying using
computational fluid dynamicsimulations
This item was submitted to Loughborough University's Institutional Repositoryby the/an author.
Citation: ANANDHARAMAKRISHNAN, C. ... et al, 2010. A study of parti-cle histories during spray drying using computational fluid dynamic simulations.Drying Technology, 28 (5), pp. 566-576.
Additional Information:
• This is an electronic version of an article that was accepted for publicationin the journal, Drying Technology [ c© Taylor & Francis] and the definitiveversion is available at: http://dx.doi.org/10.1080/07373931003787918
Metadata Record: https://dspace.lboro.ac.uk/2134/7046
Version: Accepted for publication
Publisher: c© Taylor and Francis
Please cite the published version.
This item was submitted to Loughborough’s Institutional Repository (https://dspace.lboro.ac.uk/) by the author and is made available under the
following Creative Commons Licence conditions.
For the full text of this licence, please go to: http://creativecommons.org/licenses/by-nc-nd/2.5/

PARTICLE HISTORIES DURING SPRAY DRYING
1
A Study of Particle Histories During Spray Drying Using
Computational Fluid Dynamic Simulations
C. Anandharamakrishnan+, J. Gimbun, A.G.F. Stapley* and C.D. Rielly
Department of Chemical Engineering, Loughborough University
Loughborough, Leicestershire, LE11 3TU, UK
---------------------------------------------
*Correspondence: A.G.F. Stapley, Department of Chemical Engineering,
Loughborough University, Loughborough, Leicestershire, LE11 3TU, UK
*Tel:+44-1509-222525, E. Mail: [email protected]
+ Present address: Central Food Technological Research Institute, Mysore-
570020, India

PARTICLE HISTORIES DURING SPRAY DRYING
2
Abstract
Computational fluid dynamics (CFD) models for short-form and tall-form spray
dryers have been developed, assuming constant rate drying and including
particle tracking using the source-in-cell method. The predictions from these
models have been validated against published experimental data and other
simulations. This study differs from previous work in that particle time-histories
for velocity, temperature and residence time and their impact positions on walls
during spray drying have been extracted from the simulations. Due to wet-bulb
protection effects, particle temperatures are often substantially different from gas
temperatures, which is important, since the particle temperature-time history has
the most direct impact on product quality. The CFD simulation of an existing tall-
form spray dryer indicated that more than 60% of the particles impacted on the
cylindrical wall and this may adversely affect product quality, as solids may
adhere to the wall for appreciable times, dry out and lose their wet-bulb
protection. The model also predicts differences between the particle primary
residence time distributions (RTD) and the gas phase RTD. This study indicates
that a short form dryer with a bottom outlet is more suitable for drying of heat
sensitive products, such as proteins, due to the low amounts of recirculated gas
and hence shorter residence time of the particles.
------------------------------------------------------------------------------------------------------------
Keywords: Spray-drying, particle velocity and temperature, residence time,
impact positions.
PARTICLE HISTORIES DURING SPRAY DRYING
3
INTRODUCTION
Spray drying is a well established method for converting liquid feed
materials into a dry powder form[1, 2]. Spray drying is widely used to produce
powdered food products such as whey, instant coffee, milk, tea and soups, as
well as healthcare and pharmaceutical products, such as vitamins, enzymes and
bacteria[1]. In recent years, computational fluid dynamics (CFD) has been
increasingly applied to food processing operations[3, 4]. For spray-drying, CFD
simulation tools are now often used because measurements of air flow,
temperature, particle size and humidity within the drying chamber are very
difficult and expensive to obtain in large-scale dryers.
A number of articles have been published on CFD simulations of spray
drying [5-8] (see also the review by Langrish and Fletcher[9]). Both the Eulerian-
Eulerian and Eulerian-Lagrangian two-phase models have been used in
published simulations of spray drying. Here, the Eulerian-Lagrangian framework
was selected because it allows tracking of individual particles and hence
provides residence times for a wide range of particle sizes; generally such a
simulation method is suitable for relatively low volume fractions of the dispersed
phase, e.g. for spray-drying applications. Lagrangian tracking with a reasonable
number of particles may be performed using the “particle source in cell” (PSI-
Cell) model, which includes two-way coupling between the drying gas and the
spray particles[10]. The PSI-Cell model was used by Papadakis and King[11], who
found good agreement between model and experimental results in a co-current
spray dryer. Huang et al.[8] also used this method in their comparison of spray
PARTICLE HISTORIES DURING SPRAY DRYING
4
drying using rotary and pressure nozzles. However, although existing studies
have used particle tracking methods in performing simulations, no studies have
presented data relating to the particle histories themselves. An exception was
Kieviet[12], who studied the airflow pattern, temperature, humidity, particle
trajectories and residence times in a co-current spray dryer fitted with a pressure
nozzle. It should be noted, however, that Kieviet's[12] 2-D axi-symmetric model
did not consider swirl and recirculation and was not able to represent accurately
the real chamber geometry, which was asymmetric due to the outlet pipe exiting
from the side of the chamber cone[8].
Relatively, few articles have been published on particle histories during
spray drying. Woo et al. [13] simulated particle surface moisture contents using
Reaction Engineering Approach (REA) and characteristic drying curve (CDC)
methods and they found that both the models predicts almost similar particle
moisture and trajectories. Recently, Jin and Chen[14] studied the effects of particle
size on particle residence time using REA. However, particle temperature data
along with residence time and impact positions are the most important results
that can be derived from a spray drying simulation, especially if the product is
heat sensitive (e.g. proteins, enzymes and cells). In Eulerian-Lagrangian
simulations these data are accessible and can be extracted from the CFD
software using post-processing software to investigate particle time-histories,
trajectories and impact positions. Such data will now be reported here for two
systems:
PARTICLE HISTORIES DURING SPRAY DRYING
5
Case A: Short-form spray dryer simulation is conducted using the same
geometry and boundary conditions as Kieviet’s[12] experimental study.
This same system was also simulated by Huang et al.[8] using particle
tracking via the source-in-cell method. Case A thus serves as a useful
validation of the model set-up.
Case B: After validating the model in Case A, attention is focused on modelling
a tall-form spray dryer used in a previous study of protein
denaturation[15] to gain further insight into how and where denaturation
might occur in this system.
The main weakness of the model is that due to processing constraints
only a simple constant rate-drying model was used in these simulations.
Accordingly, the results should be interpreted by acknowledging that in practice
drying rates will be lower and temperatures correspondingly higher for particles in
the latter stages of drying.
SPRAY DRYING CFD SIMULATION METHODOLOGY
The CFD code Fluent 6.3 was used to simulate two co-current flow spray-
dryers, one fitted with a hydraulic pressure nozzle (Case A) and one using an air
blast (pneumatic) atomiser (Case B). The simulations were performed in a three
dimensional geometry assuming steady state conditions for air flow and particle
injection. In Case A, a three-dimensional (3D) model was created in GAMBIT; a
hexahedral mesh (typical mesh size 0.001 m) was used for the cylindrical part of
the drying chamber, whereas at the bottom of the cone chamber a tetrahybrid
PARTICLE HISTORIES DURING SPRAY DRYING
6
mesh was used (mesh size also 0.001 m) due to meshing problems in the outlet
pipe. The number of grid cells used was 295,090. In Case B, a 3D-model was
created in GAMBIT; a hexahedral grid (typical mesh size 0.001 m) was used
throughout, with 294,237 grid cells. Preliminary tests showed that this number of
cells was sufficient to ensure a grid independent prediction of the mean velocity
field.
Fluent employs the finite volume method to solve the partial differential
forms of the continuity and the Reynolds-Averaged Navier-Stokes equations
using the SIMPLE (Semi-Implicit Pressure-Linked Equations) method for
pressure-velocity coupling and a second-order upwind scheme to interpolate the
variables on the surface of the control volume. Particle Lagrangian tracking was
realized via a discrete phase model (DPM) model with two-way coupling between
the continuous flow and particle;[16] i.e., there is a feedback mechanism in which
the continuous and dispersed phase flows interact. The standard k-ε model was
employed as a turbulence closure method. The k and ε inlet values were
calculated using the equations given by Langrish and Zbicinski[17].
The combined Eulerian-Lagrangian model was used to obtain particle
trajectories by solving the force balance equation between particle momentum,
drag and buoyancy:
p
gpp
D
pp
p guvReC
ddt
ud
24
182
(1)
where, v is the fluid phase velocity vector, pu is the particle velocity vector, g is
the density of the fluid and p is the density of the particle.
PARTICLE HISTORIES DURING SPRAY DRYING
7
The slip Reynolds number (Re) and drag coefficient (CD) are given by the
following equations
ppg uvd
Re (2)
2
321
Re
a
Re
aaCD
(3)
where, pd is the particle diameter and 1a , 2a and 3a are constants that apply to
smooth spherical particles over several ranges of Re given by Morsi and
Alexander[18].
Turbulent particle dispersion was included in this model using the discrete
eddy concept (details are provided in the Fluent manual[16]). In this approach, the
turbulent air flow pattern is assumed to be made up of a collection of randomly
directed eddies, each with its own lifetime and size. Particles are injected into the
flow domain at the nozzle point and envisaged to interact with the mean flow and
with these random eddies until they impact the wall or leave the flow domain
through the product outlet; thus each particle experiences a stochastic effect on
its trajectory. In this study, particle stickiness and particle-particle collisions
(agglomeration) were not considered.
The species transport model was selected within the DPM to enable the
prediction of simultaneous heat and mass transfer to and from the particle during
the drying process. Thus heat and mass transfer effects between the particles
and the hot gas allowed particle temperature and moisture content time-histories
to be calculated. The heat transfer equation is:
PARTICLE HISTORIES DURING SPRAY DRYING
8
fgp
pgpppp hdt
dmTThATcm
dt
d (4)
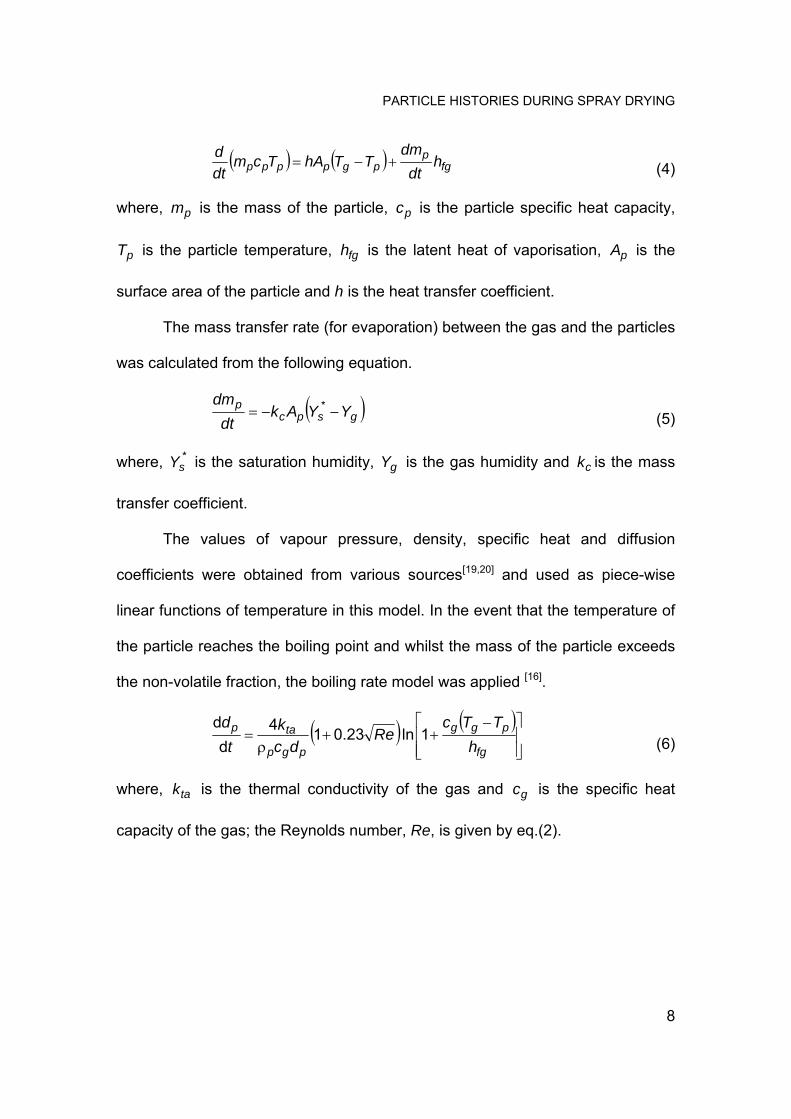
where, pm is the mass of the particle, pc is the particle specific heat capacity,
pT is the particle temperature, fgh is the latent heat of vaporisation, pA is the
surface area of the particle and h is the heat transfer coefficient.
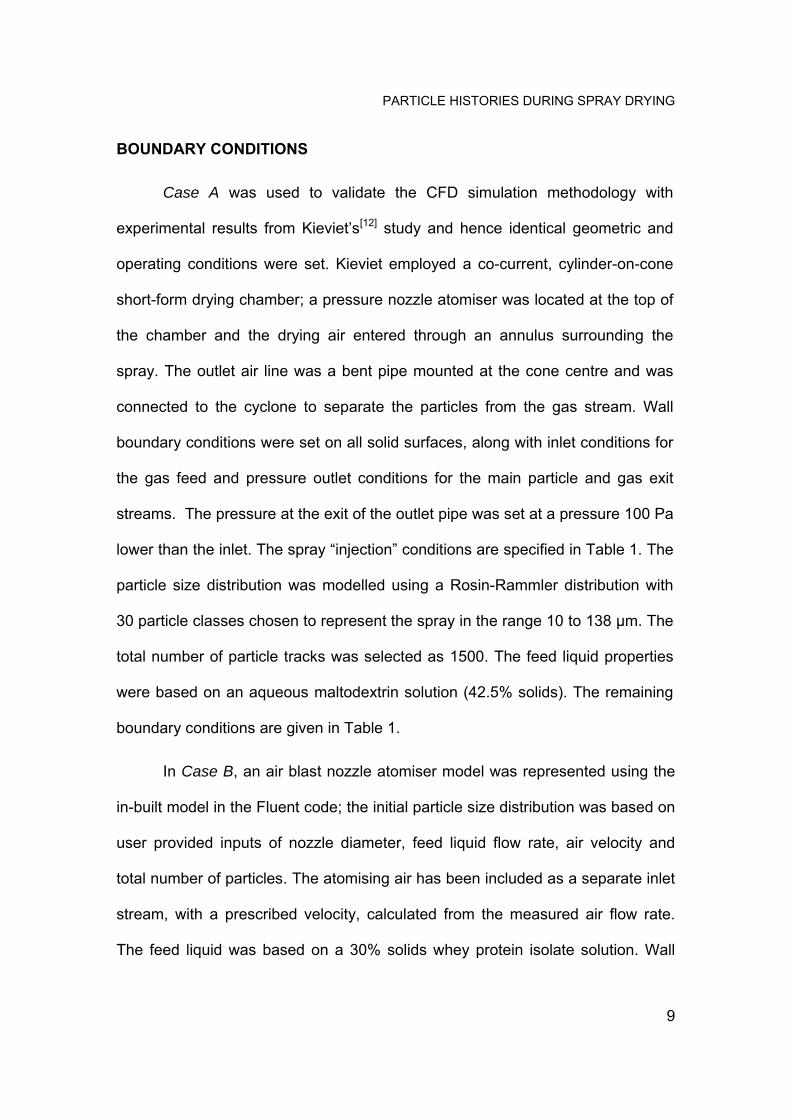
The mass transfer rate (for evaporation) between the gas and the particles
was calculated from the following equation.
gspcp YYAk
dt
dm * (5)
where, *sY is the saturation humidity, gY is the gas humidity and ck is the mass
transfer coefficient.
The values of vapour pressure, density, specific heat and diffusion
coefficients were obtained from various sources[19,20] and used as piece-wise
linear functions of temperature in this model. In the event that the temperature of
the particle reaches the boiling point and whilst the mass of the particle exceeds
the non-volatile fraction, the boiling rate model was applied [16].
fg
pgg
pgp
tap
h
TTcRe
dc
k
t
d1ln23.01
4
d
d
(6)
where, tak is the thermal conductivity of the gas and gc is the specific heat
capacity of the gas; the Reynolds number, Re, is given by eq.(2).
PARTICLE HISTORIES DURING SPRAY DRYING
9
BOUNDARY CONDITIONS
Case A was used to validate the CFD simulation methodology with
experimental results from Kieviet’s[12] study and hence identical geometric and
operating conditions were set. Kieviet employed a co-current, cylinder-on-cone
short-form drying chamber; a pressure nozzle atomiser was located at the top of
the chamber and the drying air entered through an annulus surrounding the
spray. The outlet air line was a bent pipe mounted at the cone centre and was
connected to the cyclone to separate the particles from the gas stream. Wall
boundary conditions were set on all solid surfaces, along with inlet conditions for
the gas feed and pressure outlet conditions for the main particle and gas exit
streams. The pressure at the exit of the outlet pipe was set at a pressure 100 Pa
lower than the inlet. The spray “injection” conditions are specified in Table 1. The
particle size distribution was modelled using a Rosin-Rammler distribution with
30 particle classes chosen to represent the spray in the range 10 to 138 μm. The
total number of particle tracks was selected as 1500. The feed liquid properties
were based on an aqueous maltodextrin solution (42.5% solids). The remaining
boundary conditions are given in Table 1.
In Case B, an air blast nozzle atomiser model was represented using the
in-built model in the Fluent code; the initial particle size distribution was based on
user provided inputs of nozzle diameter, feed liquid flow rate, air velocity and
total number of particles. The atomising air has been included as a separate inlet
stream, with a prescribed velocity, calculated from the measured air flow rate.
The feed liquid was based on a 30% solids whey protein isolate solution. Wall
PARTICLE HISTORIES DURING SPRAY DRYING
10
boundary conditions were set on all solid surfaces, along with inlet conditions for
the gas feed and pressure outlet conditions for the exit stream. The outlet
pressure was set 100 Pa lower than the inlet. The overall wall heat transfer
coefficient for Case B was previously determined experimentally from an energy
balance over the dryer. The full set of boundary conditions is given in Table 1.
The particle history data presented in the following sub-sections were
extracted from the simulation results using an in-house post-processing
computer program. A particle which hits the walls of drying chamber, was
assumed to have “escaped”, i.e. the particles are lost from the calculation at the
point of impact with the wall.
RESULTS AND DISCUSSION
Experimental validation of simulated air velocity and temperature profiles
for Case A: Short form spray dryer
Gas Velocity Profile without Spray Injection
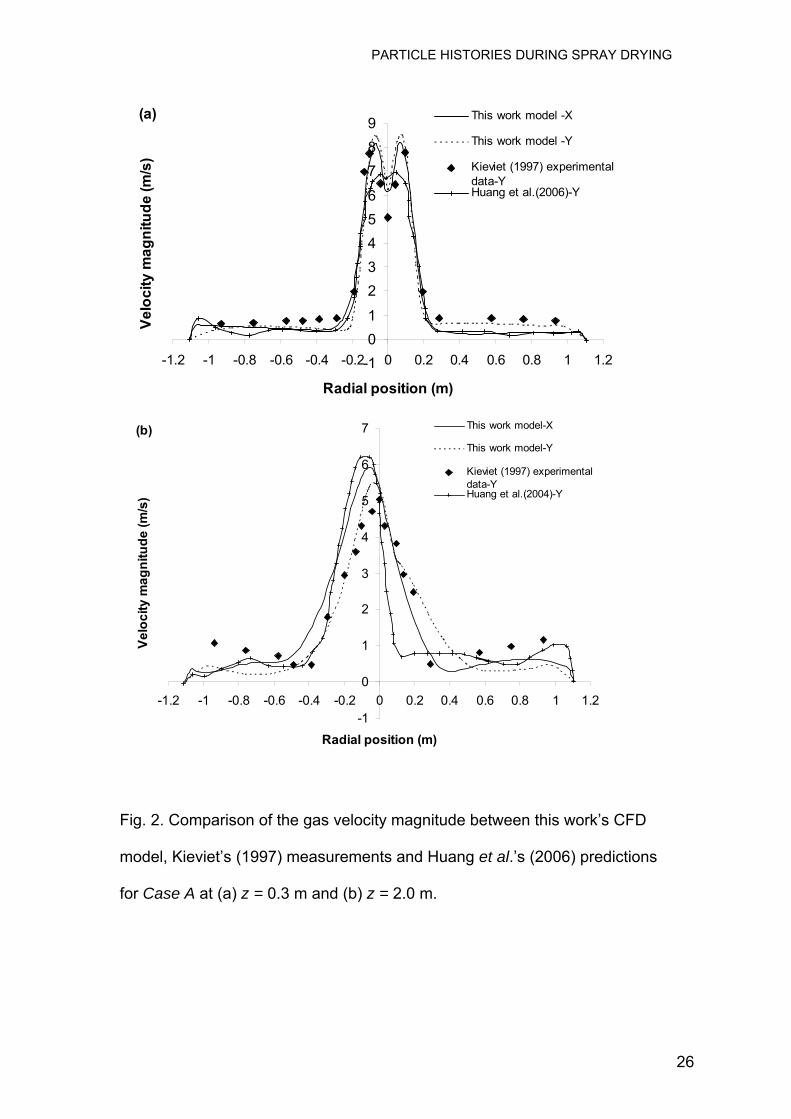
The gas velocity magnitude profiles are plotted in Fig. 2 (a) and (b) at two
different heights (z = 0.3 m and 2.0 m measured downwards from the ceiling) and
compared with Kieviet’s[12] experimental measurements and Huang et al.’s[8]
simulation predictions. Data obtained in the X-Z planes are labelled as ‘X’ and Y-
Z planes are labelled as ‘Y’ in Fig. 2 (a) and (b). The predictions from the current
simulation agree well with Kieviet’s[12] experimental results for the gas velocity
magnitudes. The gas centreline velocity reduces as the gas travels axially down
PARTICLE HISTORIES DURING SPRAY DRYING
11
the chamber: e.g. at z = 0.3 m the highest velocity magnitude is about 8 m/s,
whereas, at z = 2.0 m it is only 6 m/s. The gas flow patterns are almost
symmetric at z = 0.3 m (Fig. 2 a), but become more asymmetric at z = 2.0 m (Fig.
2 b) because of the bent outlet pipe (see Fig. 1) which reduces the area for gas
flow on one side of the drying chamber, as commented on previously[8].
Comparison of the Gas Temperature Profile with Spray Injection
Fig. 3 (a) and (b) show predicted radial profiles for gas temperature at
axial distances of z = 0.2 m and 1.4 m from the top of the chamber, in
comparison with Kieviet’s[12] experimental measurements. With the exception of
the centreline data point at z = 1.4 m the predictions were in good agreement
with the experimental results. In Kieviet’s[12] experiments, the feed was atomised
by using a pressure nozzle and this produced a hollow-cone spray. The
temperature at the centreline axis was lower in comparison to the rest of the core
region (Fig. 3 a), because this position was below the spray point. However, this
did not occur at z = 1.4 m due to greater mixing of gas by this point (Fig. 3 b).
The same result was shown by Huang et al.’s [8] model, which is also shown in
Fig. 3.
PARTICLE HISTORIES DURING SPRAY DRYING
12
Simulated particle histories for Case A
Radial Profiles of Particle Axial Velocity
The predicted radial profiles of particle axial velocity at z = 0.6 m and
2.0 m are shown in Fig. 4 (a) and (b) for four particle diameters of 17, 50, 75 and
100 μm which were selected to represent the behaviour of different particle size
classes. The particle axial velocities are different from the gas velocities with the
gas showing upward velocities outside of the central core region (also seen in
simulations by Woo et al. [13]) in contrast to the particles which are predicted to
travel downwards. In the core region of the chamber fewer data are shown for
particle velocities because only a small number of particles entered this region
due to the use of a hollow cone spray with a 76° spray angle. Where data exist
for particles in the core region the particle velocities are higher than that of the
gas. This can be attributed to the particles maintaining momentum from the spray
jet [10]. The larger particles would be expected to maintain larger velocities [11], but
this is not always observed in the simulation results and may be a result of the
relatively small sample size giving sampling errors.
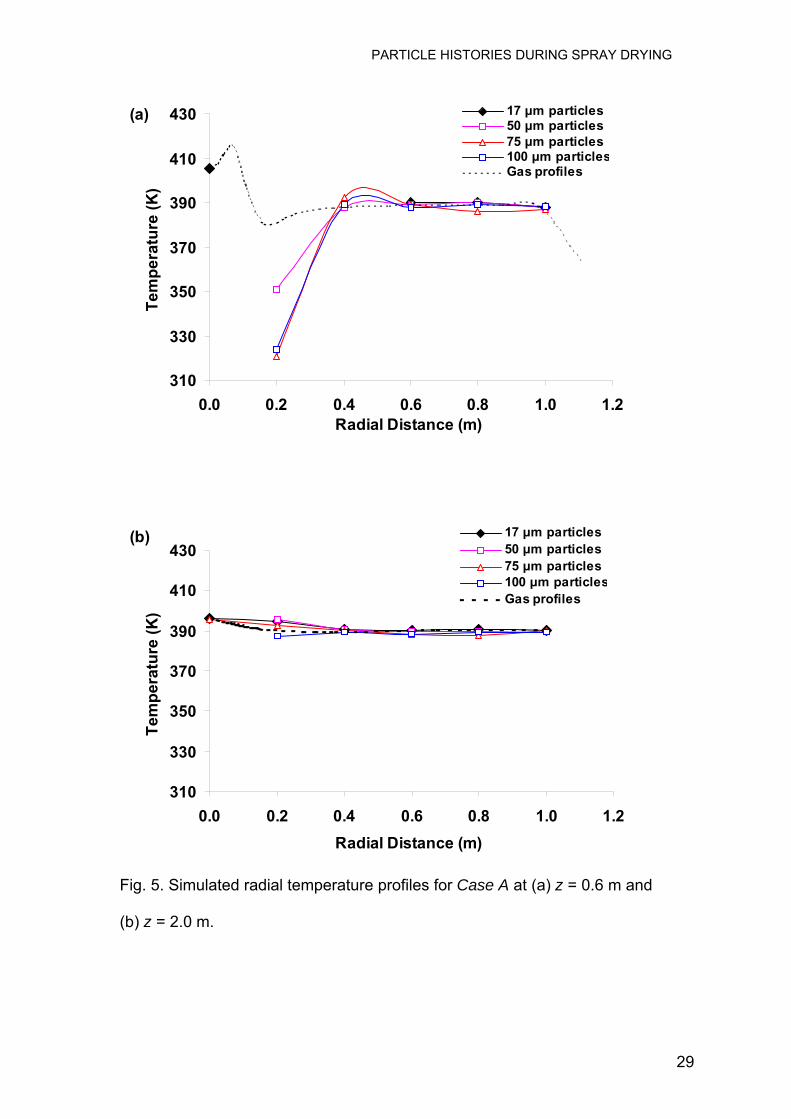
Radial Profiles of Particle Temperature
The predicted radial profiles of particle temperatures at z = 0.6 m and
2.0 m from the chamber top are shown in Fig. 5 (a) and (b). Significant wet-bulb
depression is seen in the main spray region (r < 0.4 m) at z = 0.6 m except for
the 17 µm diameter particles which have presumably already dried. Outside the
core region (0.4 < r < 1.2 m) the particle temperatures are almost equal to the

PARTICLE HISTORIES DURING SPRAY DRYING
13
gas temperatures, and relate to recirculating particles that have also dried. In the
core region, particle temperatures at z = 0.6 m and z = 1 m (not shown in Fig. 5)
were around 350 and 365 K respectively. Further down the chamber (z = 2 m), in
the core, the particles dry out and approach the gas temperature (391 K). This
result corroborates the widely held view that the outlet temperature has a greater
effect on the temperature histories experienced by particles than the inlet air
temperature.
Particle Residence Time Distributions
The particle trajectories were calculated in Fluent by integrating the
equation of motion, eq.(1), over time, assuming gravity and drag to be the only
significant terms. Particle residence time distributions (RTDs) were extracted
from the simulation data by using an in-house post-processor, written in Excel
VBA. The residence time (RT) can be divided into two parts namely, primary and
secondary residence times. The primary RT is calculated from the time taken for
particles leaving the nozzle to impact on the wall or leave at the outlet. For
particles that hit the wall a secondary residence time can be defined as the time
taken for a particle to slide along the wall from the impact position to the exit.
This is based on an assumption that particles move with constant velocity along
the wall from the impact position[12]. However, this assumption may not be
accurate, as the sliding behaviour of powders differs at various wall positions.
Furthermore, the layer of powder on the wall grows with time and is subject to
intermittent detachment of pieces of the layer. Moreover, mechanical hammers
are also often used to tumble the powders, so it is very difficult to calculate
PARTICLE HISTORIES DURING SPRAY DRYING
14
representative constant sliding velocities of the particles. Hence, only primary RT
results are given in this study.
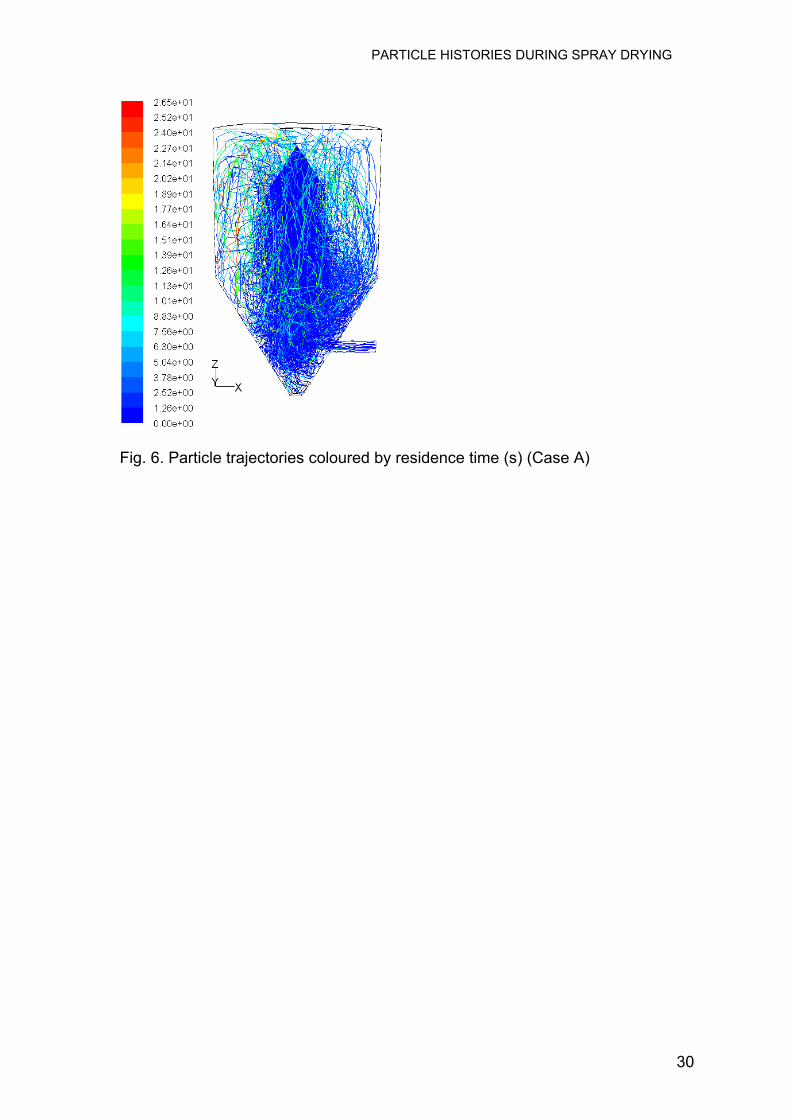
Fig.6. shows trajectories of the particles and it can also be seen that dried
particles tended to recirculate by the up flow of gas at the walls (the lighter colour
of the trajectories indicates a longer particle primary residence time)
Consequently, cold gas containing dried particles is mixed with down-flowing hot
inlet gas and dried particles will be exposed to the high inlet gas temperatures.
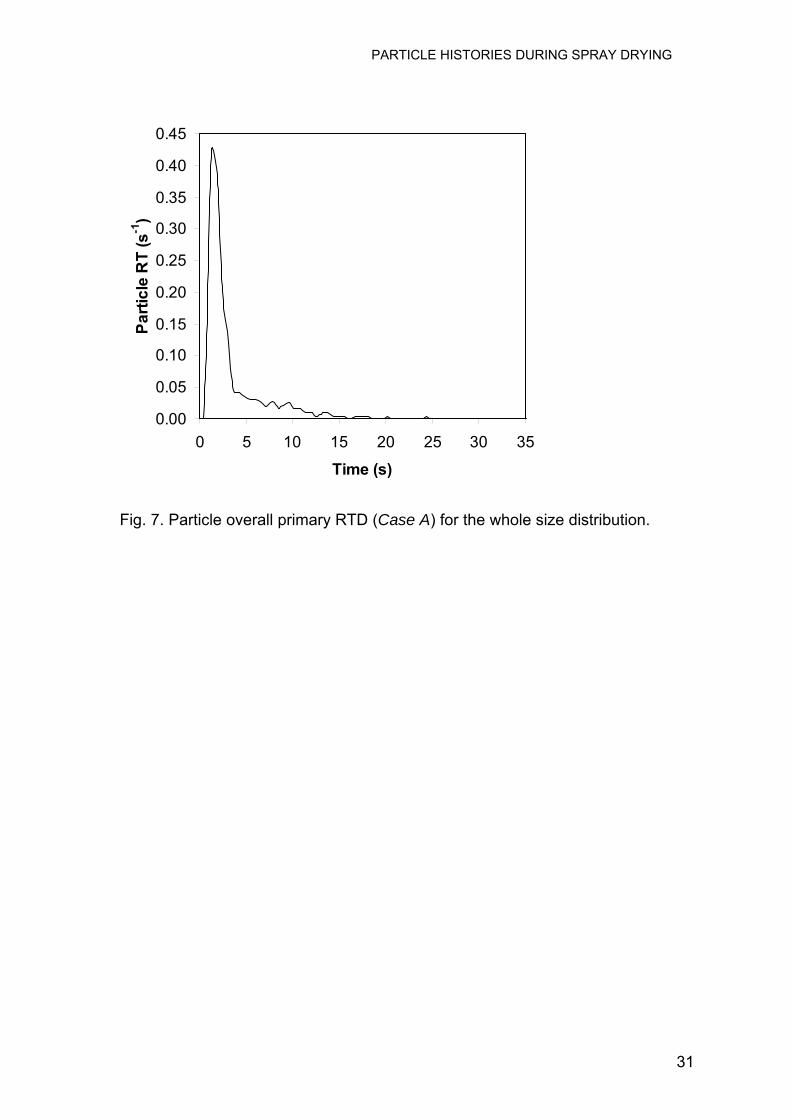
The overall primary RTD (for all particle diameters) is shown in Fig. 7. The
observed minimum and maximum particle RTs are 0.4 s and 34.5 s respectively.
The RTD curve shows a sharp peak at around 6 s (Fig. 7) and indicates that
some particles have a long RT, due to recirculation. The average RT is 3.3 s,
which is much lower than the gas residence time (22.4 s), because this RTD was
calculated for the primary RT and the particles travel with a high velocity for a
short period after leaving the atomiser. Zbicinski et al.[21] also concluded from
their experimental results that there is no simple relation between gas and
particle mean RTs. The RTDs of the different size classes of particles are shown
in Fig. 8. Larger diameter particles have longer RTs than smaller particles.
Smaller particles are more likely to follow the gas flow and thus exit the chamber
in less time[14]. The same trend was observed by Kieviet[12] as well as Jin and
Chen [14]. However, no direct measurements of primary RT are available to
confirm the predictions of Fig. 8.

PARTICLE HISTORIES DURING SPRAY DRYING
15
Particle Impact Positions
A knowledge of particle impact positions is important for the design and
operation of spray-dryers as it influences the product quality. Particle impact
positions were extracted from the CFD Lagrangian tracking data using the in-
house post-processor, and are depicted in Fig. 9 (a) and (b), which show the top
and front cross-sectional views of the simulated short-form dryer and Fig. 9c
shows the percentage of particles impact positions. These figures indicate that a
large fraction of the particles (50%) strike the conical part of the spray-dryer
chamber and 23% of particles hit the cylindrical part of the wall, but only a small
proportion (25%) of the particles come out of the outlet pipe line (the intended
destination). A very small fraction (2 %) of particles hit the ceiling despite the
large volume of re-circulated gas. Fig. 9c also shows some “incomplete” particles
which refers to particles that are still in the chamber after 30 s, which is the
timescale of the simulation for Case A. Here, an interesting point is that no
particles are seen to come out of the main chamber outlet, but particles hitting
the cone and/or cylindrical wall (73 %) should slide down to the main outlet aided
by mechanical hammer operations.
Simulated gas and particle behaviour for Case B: Tall-form spray dryer
Case B is concerned with the CFD simulations relating to a tall-form
spray-dryer used in experimental whey protein denaturation studies[15]. The
simulation methodologies used were the same for Cases A and B. However, the
tall-form spray dryer of Case B was constructed almost 25 years ago and there

PARTICLE HISTORIES DURING SPRAY DRYING
16
were no options for measurements of velocity and gas/particle temperature
inside the drying chamber. It was considered that the spray-dryer simulation
methodology had been validated with the Case A study and hence may be
applied with confidence to the Case B study. This simulation makes use of a
wide range of particle diameters from 6 to 60 μm, but four particles sizes of 10,
20, 30 and 40 μm were selected as representative in Figs. 10 and 11.
Particle Axial Velocity at Various Radial Positions
The radial profiles of particle velocity at z = 0.4 m and 2.1 m are shown in
Fig. 10 (a) and (b). In this simulation, the spray half angle is only 9° (solid cone)
and hence there are many control volumes where no particles pass through. The
particle axial velocities were almost equal to the gas velocity profiles. At z = 0.4
and 2.1 m the predictions show very similar axial velocities for all sizes of
particles; the gas and particle velocities decrease with distance away from the
nozzle, as the spray decelerates and the gas jet expands.
Radial Profiles of Particle Temperature
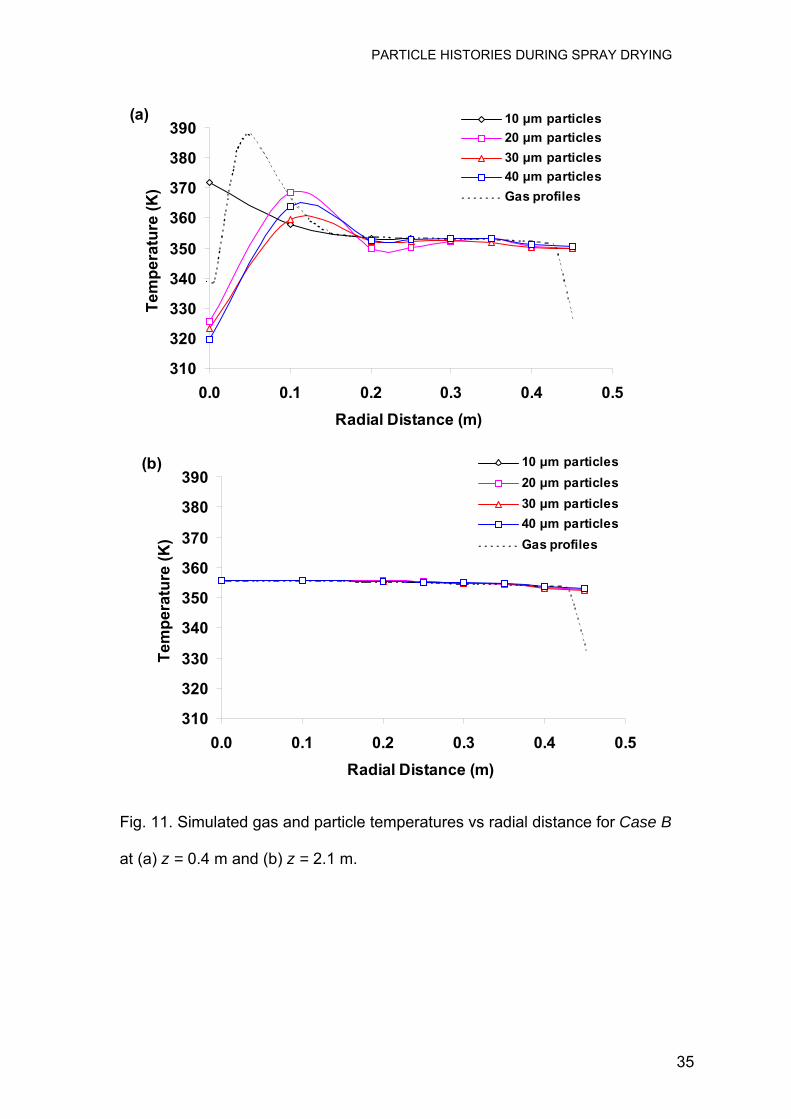
Fig. 11 (a) and (b) shows radial profiles of the particle temperature at
z = 0.4 m and 2.1 m. Similar results are found to Case A. On the centreline at
z = 0.4 m the 10 m particles have a much higher temperature than the larger
particles, because the latter are still drying. However, the fact that the 10 m
particle is hotter than the gas is curious, and may be the result of being
transported out from an adjacent hot air region by eddy motions. At r = 0.1 m and
z = 0.4 m the temperatures are relatively high for all particle sizes, due to the
PARTICLE HISTORIES DURING SPRAY DRYING
17
high gas temperatures from the gas inlet (Fig. 11 a). This region may be
responsible for high amounts of protein denaturation; here the particles are still
wet, which is conducive to denaturation taking place. Outside the core (r ≥ 0.2 m)
all the particle temperature profiles closely follow the lower gas temperature of
the recirculated gas. Fig. 11 (b) suggests that particles are totally dried as they
are very close to the gas temperature. In the simulation a constant drying rate
regime is used, which will tend to over-predict drying rates (compared to real
particles which will experience a falling rate period). This assumption will result in
the complete drying of particles at shorter residence times than would be the
case for real particles undergoing a falling rate drying process. Thus in practice
particle temperatures may still be a few degrees (0-3 K) cooler than in the
simulation.
Particle Residence Time Distributions
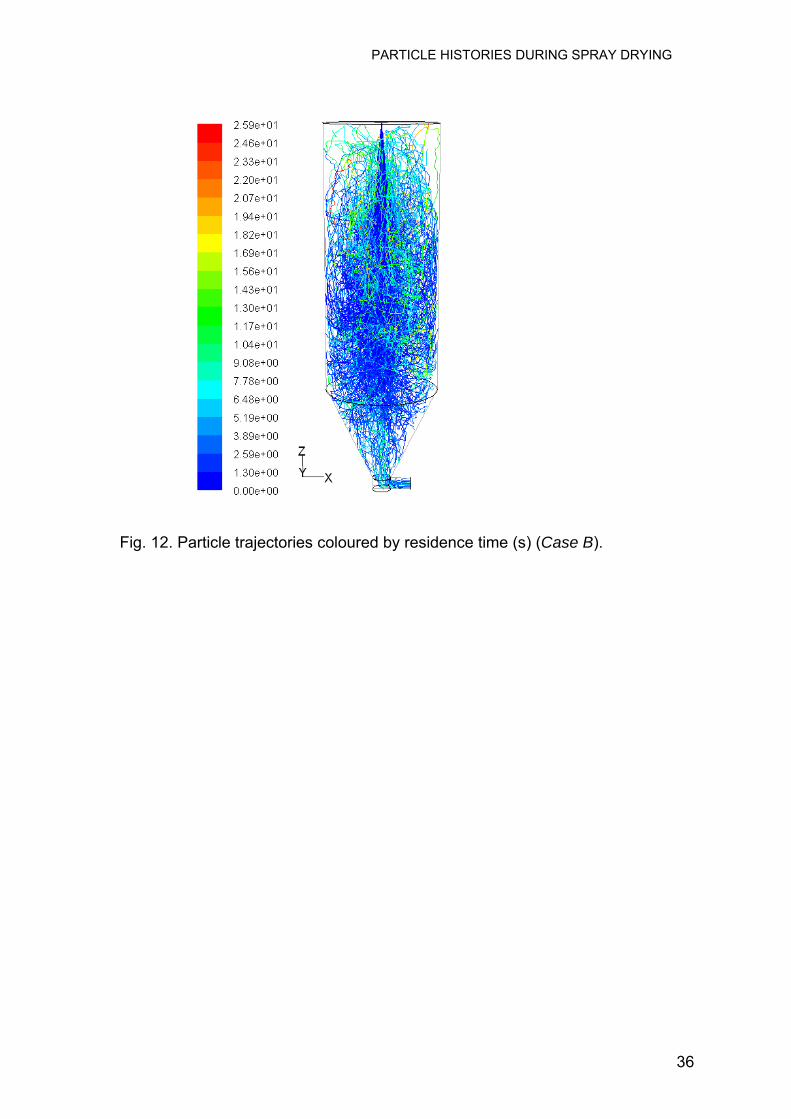
Fig. 12 shows particle trajectories for Case B in which some dried particles
can be seen to recirculate with the gas phase. These particles rise up the walls
and are entrained back into the jet leaving the nozzle. This may cause protein
denaturation as recirculated particles are exposed to higher inlet gas
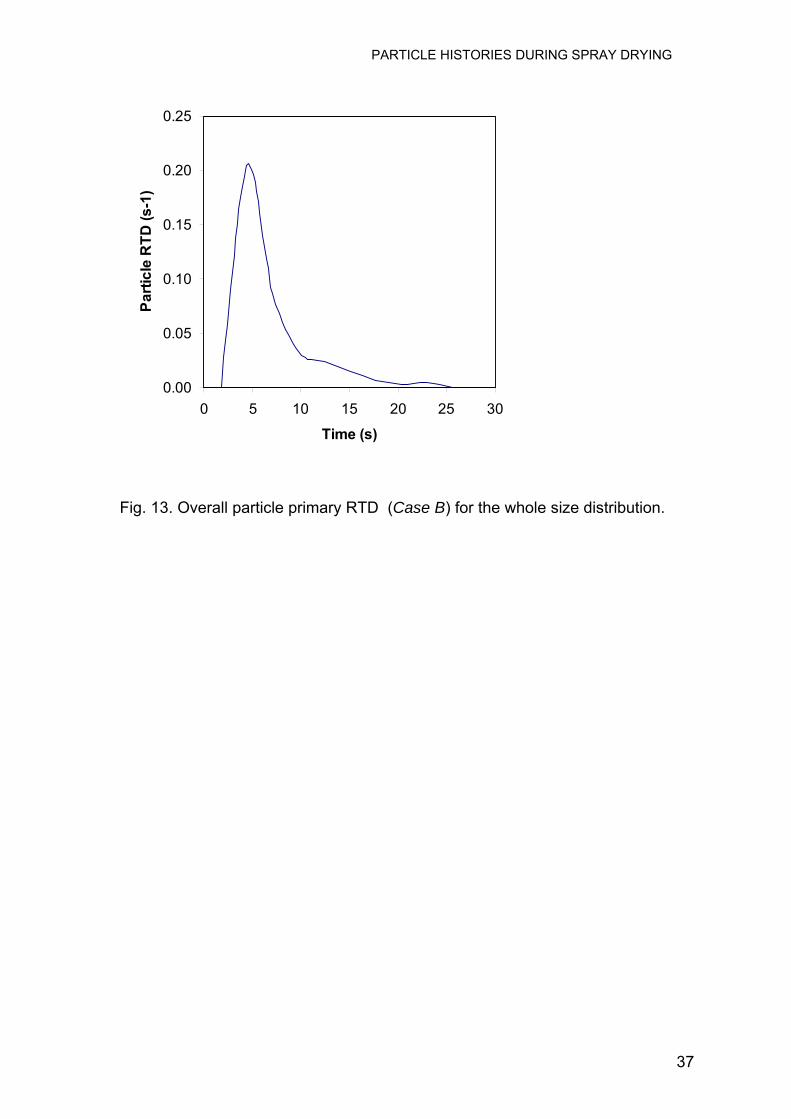
temperatures without wet bulb protection. The overall primary residence time
distribution of all particles is shown in Fig. 13 which indicates that a wide range of
RT is predicted. The minimum and maximum RT were 0.43 s and 27 s
respectively. The average RT is 4.2 s, which is much lower than the gas mean
residence time (22 s).
PARTICLE HISTORIES DURING SPRAY DRYING
18
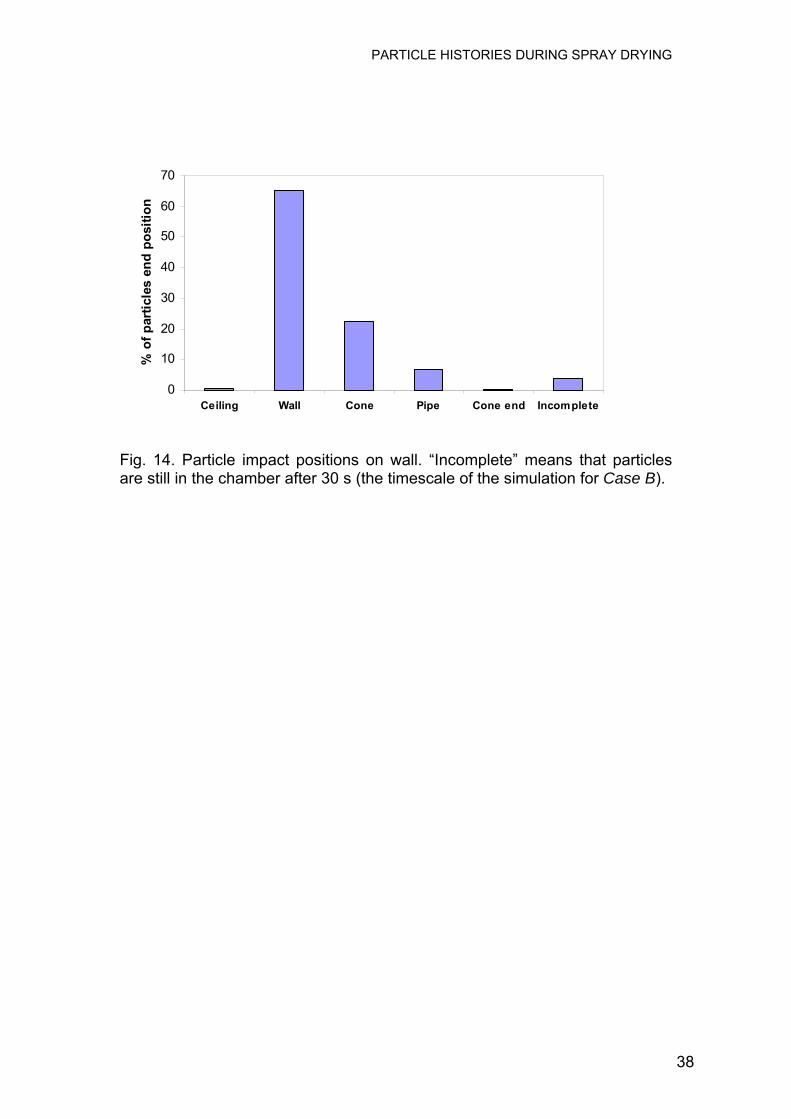
Particle Impact Positions
The particle impact positions for Case B are depicted in Fig. 14. These
indicate that 65 % of the particles strike the cylindrical part of the wall and 9.6 %
of particles hit the conical part of the wall, but only a small proportion (8%) of the
particles come out of the outlet pipe line. Less than 1% of particles impact on the
ceiling, as recirculation of gas only took place on a large scale at the bottom of
the chamber. The reduced proportion of particles reaching the exit pipe
compared to Case A contributes to an increase in the particle RT inside the
chamber. In turn this affects the product quality, especially for proteins, where
dried particles may be exposed to the highest temperature for a long time; the
degree of whey protein denaturation increases with the temperature and holding
time. This findings supports the experimental results[15], where some
denaturation of whey proteins has been found even at low outlet temperatures.
CONCLUSIONS
A three-dimensional CFD model for a short-form spray dryer was
developed and compared with published experimental results and predictions.
The comparison study shows good agreement between the model and published
experimental and prediction results for gas velocity and temperature profiles. The
study predicts that the particle residence time is not simply related to the gas
residence time, and also confirms that particle size distribution is important for
achieving higher evaporation rates because, smaller mean diameter particles dry
faster. As a result, small particles lose their wet-bulb protection sooner and
experience the high temperatures of the surrounding gas. In Case A, the wider

PARTICLE HISTORIES DURING SPRAY DRYING
19
spray angle provided a broader distribution of particle trajectories inside the
chamber and that led to higher rates of heat and mass transfer.
The successful validation of the short-form spray dryer (Case A) study
results gives confidence in the predictions for modelling the tall-form dryer (Case
B). The Case B model predicts fewer particles travelling to the dryer exit tube
which may adversely affect product quality (such as increased denaturation of
proteins). The tall-form dryer is predicted to have longer particle primary
residence time and this may also lead to more denaturation and insolubility of
proteins. These results confirm that the outlet dryer temperature has more
influence on the particle thermal history than the inlet temperature. However a
zone where the spray meets the hot air inlet may be responsible for much of the
denaturation that occurs in a spray dryer.
These short-form and tall-form spray dryer studies suggest that an
increase in the chamber diameter: (1) may reduce the particle deposition rates
on the cylindrical wall (e.g. in Case A), and (2) can accommodate a wider
atomiser spray angle, which improves heat and mass transfer rates. Hence, this
study concludes that a short-form dryer with a simple bottom outlet is most likely
to be suitable for the drying of heat sensitive products such as proteins.
ACKNOWLEDGEMENTS
We gratefully acknowledge the Commonwealth Scholarship Commission,
UK for the award of a Commonwealth Scholarship to CA, which enabled this
work to be carried out.

PARTICLE HISTORIES DURING SPRAY DRYING
20

PARTICLE HISTORIES DURING SPRAY DRYING
21
REFERENCES 1. Masters, K. Spray Drying Handbook; Longman Scientific and Technical;
Harlow, 1991.
2. Mujumdar, A. S. Handbook of Industrial Drying; Marcel Dekker; New York,
1987.
3. Anandharamakrishnan, C. Computational fluid dynamics (CFD) –
applications for the food industry. Indian Food Industry 2003, 22 (6), 62-68.
4. Norton, T.; Sun D.W. Computational fluid dynamics (CFD) - an effective and
efficient design and analysis tool for the food industry: A review. Trends in
Food Science and Technology 2006, 7, 600-620.
5. Langrish, T.A.G.; Oakley, D.E.; Keey, R.B.; Bahu, R.E.; Hutchinson, C.A.
Time-dependent flow patterns in spray dryers. Trans I Chem E, Part A
1993, 71, 355-360.
6. Zbicinski, I. Development and experimental verification of momentum, heat
and mass transfer model in spray drying. The Chemical Engineering Journal
1995, 58, 123-133.
7. Huang, L.X.; Kumar, K.; Mujumdar, A.S. A parametric study of the gas flow
patterns and drying performance of co-current spray dryer: Results of a
computational fluid dynamics study. Drying Technology 2003, 21(6), 957-
978.

PARTICLE HISTORIES DURING SPRAY DRYING
22
8. Huang, L.X.; Kumar, K.; Mujumdar, A.S. A comparative study of a spray
dryer with rotary disc atomizer and pressure nozzle using computational
fluid dynamic simulations. Chemical Engineering and Processing 2006, 45,
461-470.
9. Langrish, T.A.G.; Fletcher, D.F. Spray drying of food ingredients and
applications of CFD in spray drying. Chemical Engineering and Processing
2001, 40, 345-354.
10. Crowe, C.T.; Sharam, M.P.; Stock, D.E. The particle source in cell (PSI-
Cell) model for gas-droplet flows, Journal of Fluid Engineering 1977, 9, 325-
332.
11. Papadakis, S.E.; King, C.J. Air temperature and humidity profiles in spray
drying. 1. Features predicted by the particle source in cell model. Industrial
Engineering Chemistry Research 1988, 27, 2111-2116.
12. Kieviet, F.G. Modeling Quality In Spray Drying, Ph.D. thesis; Eindhoven
University of Technology; Netherlands, 1997.
13. Woo. M.W.; Daud, W.R.W.; Majumdar, A.S.; Wu, Z.H.; Talib, M.Z.M.;
Tasirin, S.M. CFD evaluation of droplet drying models in a spray dryer fitted
with rotary atomizer. Drying Technology 2008, 26(10), 1180-1198.
14. Jin, Y.; Chen, X.D. Numerical study of the drying process of different sized
particles in an industrial scale spray dryer. Drying Technology 2009, 27(3),
371-381.

PARTICLE HISTORIES DURING SPRAY DRYING
23
15. Anandharamakrishnan, C.; Rielly, C.D.; Stapley, A.G.F. Effects of process
variables on the denaturation of whey proteins during spray-drying. Drying
Technology 2007, 25, 799-807.
16. Fluent User Guide; Fluent Inc.: Lebanon, NH, 2005.
17. Langrish, T.A.G.; Zbicinski, I. The effects of air inlet geometry and spray
cone angle on the wall deposition rates in spray dryer. Trans I ChemE, Part
A 1994, 72, 420-430.
18. Morsi, S.A. ; Alexander, A.J. An investigation of particle trajectories in two-
phase flow systems. Journal of Fluid Mechanics 1972, 55 (2), 193-208.
19. Perry, R.H.; Chilton, C.H. Chemical Engineers Handbook; McGraw-Hill;
London, 1984.
20. Incropera, F.P.; Dewitt, D.P.; Bergman, T.L.; Lavine, A,S. Fundamentals of
Heat and Mass Transfer; John Wiley & Sons; New York, 2007.
21. Zbicinski, I.; Strumillo, C.; Delag, A. Drying kinetics and particle residence
time in spray drying. Drying Technology 2002, 20 (9), 1751-1768.
PARTICLE HISTORIES DURING SPRAY DRYING
24
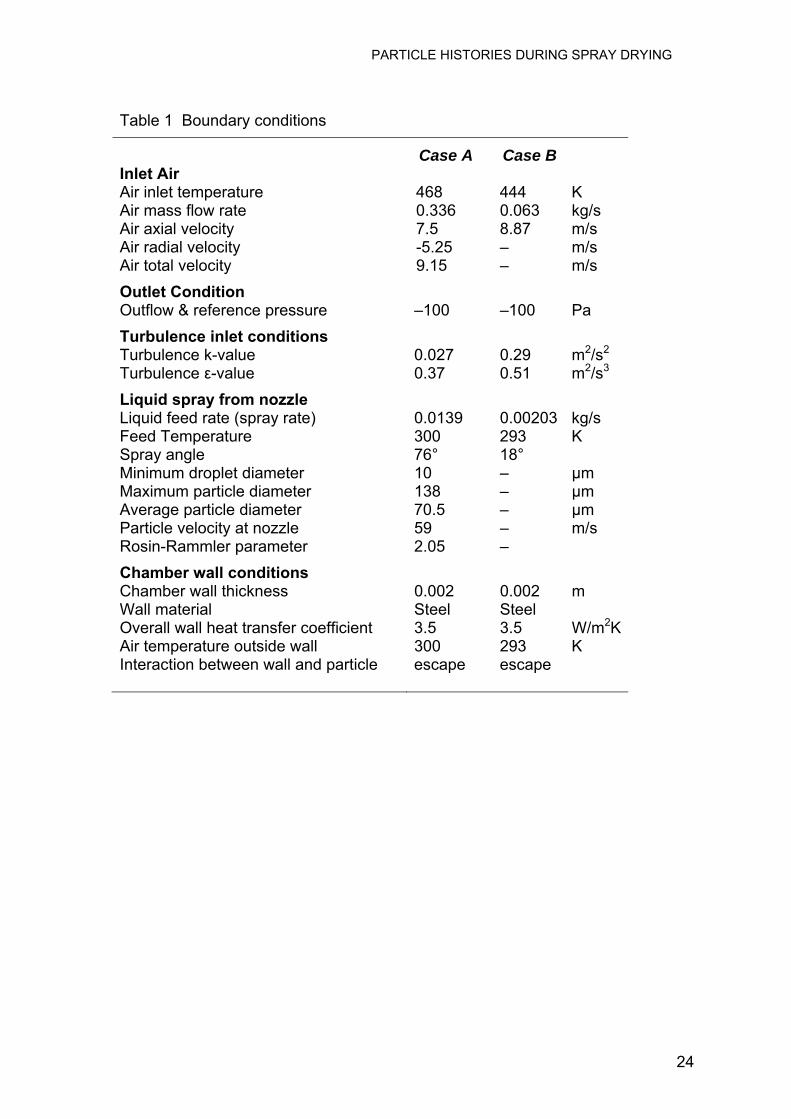
Table 1 Boundary conditions
Case A Case B Inlet Air Air inlet temperature 468 444 K Air mass flow rate 0.336 0.063 kg/s Air axial velocity 7.5 8.87 m/s Air radial velocity -5.25 – m/s Air total velocity 9.15 – m/s
Outlet Condition Outflow & reference pressure –100 –100 Pa
Turbulence inlet conditions Turbulence k-value 0.027 0.29 m2/s2 Turbulence ε-value 0.37 0.51 m2/s3
Liquid spray from nozzle Liquid feed rate (spray rate) 0.0139 0.00203 kg/s Feed Temperature 300 293 K Spray angle 76° 18° Minimum droplet diameter 10 – μm Maximum particle diameter 138 – μm Average particle diameter 70.5 – μm Particle velocity at nozzle 59 – m/s Rosin-Rammler parameter 2.05 –
Chamber wall conditions Chamber wall thickness 0.002 0.002 m Wall material Steel Steel Overall wall heat transfer coefficient 3.5 3.5 W/m2K Air temperature outside wall 300 293 K Interaction between wall and particle escape escape

PARTICLE HISTORIES DURING SPRAY DRYING
25
Fig. 1. Spray-dryer geometries: short form (left, Case A) and tall form dryer
(right, Case B).
PARTICLE HISTORIES DURING SPRAY DRYING
26
-1
0
1
2
3
4
5
6
7
8
9
-1.2 -1 -0.8 -0.6 -0.4 -0.2 0 0.2 0.4 0.6 0.8 1 1.2
Radial position (m)
Ve
loc
ity
ma
gn
itu
de
(m/s
)
This work model -X
This work model -Y
Kieviet (1997) experimentaldata-YHuang et al.(2006)-Y
(a)
-1
0
1
2
3
4
5
6
7
-1.2 -1 -0.8 -0.6 -0.4 -0.2 0 0.2 0.4 0.6 0.8 1 1.2
Radial position (m)
Ve
loc
ity
ma
gn
itu
de
(m
/s)
This work model-X
This work model-Y
Kieviet (1997) experimentaldata-YHuang et al.(2004)-Y
(b)
Fig. 2. Comparison of the gas velocity magnitude between this work’s CFD
model, Kieviet’s (1997) measurements and Huang et al.’s (2006) predictions
for Case A at (a) z = 0.3 m and (b) z = 2.0 m.

PARTICLE HISTORIES DURING SPRAY DRYING
27
320
340
360
380
400
420
440
460
480
-1.2 -0.9 -0.6 -0.3 0 0.3 0.6 0.9 1.2
Radial position (m)
Te
mp
era
ture
(K
)
This work model-X
This work model-Y
Kieviet (1997) experimentaldata -YHuang et al. (2006)-Y
(a)
320
340
360
380
400
420
-1.2 -0.9 -0.6 -0.3 0 0.3 0.6 0.9 1.2
Radial position (m)
Te
mp
era
ture
(K
)
This work model -X
This work model-Y
Kieviet (1997) experimentaldata -YHuang et al.(2006)-Y
(b)
Fig. 3. Comparison of gas temperature profiles between this work’s CFD
model, Kieviet’s (1997) measurements and Huang et al.’s (2006) predictions
for Case A at (a) z = 0.2 m and (b) z = 1.4 m.

PARTICLE HISTORIES DURING SPRAY DRYING
28
-2
0
2
4
6
8
10
12
0.0 0.2 0.4 0.6 0.8 1.0 1.2
Radial distance (m)
Axi
al v
elo
city
(m
/s)
17 μm particles50 μm particles75 μm particles100 μm particlesGas profile
(a)
-2
0
2
4
6
8
10
12
0.0 0.2 0.4 0.6 0.8 1.0 1.2
Radial distance (m)
Axi
al v
elo
city
(m
/s)
17 μm particles50 μm particles75 μm particles
100 μm particlesGas profile
(b)
Fig. 4. Radial profiles of the particle axial velocities for Case A at (a) z = 0.6 m
and (b) z = 2.0 m.
PARTICLE HISTORIES DURING SPRAY DRYING
29
310
330
350
370
390
410
430
0.0 0.2 0.4 0.6 0.8 1.0 1.2Radial Distance (m)
Tem
per
atu
re (
K)
17 μm particles50 μm particles75 μm particles100 μm particlesGas profiles
(a)
310
330
350
370
390
410
430
0.0 0.2 0.4 0.6 0.8 1.0 1.2
Radial Distance (m)
Tem
per
atu
re (
K)
17 μm particles50 μm particles75 μm particles100 μm particlesGas profiles
(b)
Fig. 5. Simulated radial temperature profiles for Case A at (a) z = 0.6 m and
(b) z = 2.0 m.
PARTICLE HISTORIES DURING SPRAY DRYING
30
Fig. 6. Particle trajectories coloured by residence time (s) (Case A)
PARTICLE HISTORIES DURING SPRAY DRYING
31
0.00
0.05
0.10
0.15
0.20
0.25
0.30
0.35
0.40
0.45
0 5 10 15 20 25 30 35
Time (s)
Pa
rtic
le R
T (s
-1)
Fig. 7. Particle overall primary RTD (Case A) for the whole size distribution.

PARTICLE HISTORIES DURING SPRAY DRYING
32
0.00
0.05
0.10
0.15
0.20
0.25
0.30
0.35
0.40
0 2 4 6 8Time (s)
Pa
rtic
le R
TD
(s
-1)
10-20 µm 20-30 µm 30-40 µm40-50 µm 50-60 µm 60-70 µm70-80 µm 80-90 µm 90-100 µm
Fig. 8. Simulated residence time distributions for different particle diameters (Case A).

PARTICLE HISTORIES DURING SPRAY DRYING
33
(a) (b)
0
10
20
30
40
50
60
Ceiling Wall Cone Pipe Exit Incomplete
% o
f p
arti
cles
en
d p
osi
tio
n
(c)
Fig. 9. Particle impact positions (Case A): (a) top view (b) front view (c) % of particles end position (Incomplete” refers to particles still in the chamber after 30 s - the timescale of the simulation).

PARTICLE HISTORIES DURING SPRAY DRYING
34
-1
1
3
5
7
9
0.0 0.1 0.2 0.3 0.4 0.5
Radial distance (m)
Axi
al v
elo
city
(m
/s)
10 μm particles
20 μm particles
30 μm particles
40 μm particles
Gas profile
(a)
-1
1
3
5
7
9
0.0 0.1 0.2 0.3 0.4 0.5
Radial distance (m)
Axi
al v
elo
city
(m
/s)
10 μm particles
20 μm particles
30 μm particles
40 μm particles
Gas profile
(b)
Fig. 10. Simulated gas and particle axial velocity profiles for Case B at
(a) z = 0.4 m and (b) z = 2.1 m.
PARTICLE HISTORIES DURING SPRAY DRYING
35
310
320
330
340
350
360
370
380
390
0.0 0.1 0.2 0.3 0.4 0.5
Radial Distance (m)
Tem
per
atu
re (
K)
10 μm particles
20 μm particles
30 μm particles
40 μm particles
Gas profiles
(a)
310
320
330
340
350
360
370
380
390
0.0 0.1 0.2 0.3 0.4 0.5
Radial Distance (m)
Tem
per
atu
re (
K)
10 μm particles
20 μm particles
30 μm particles
40 μm particles
Gas profiles
(b)
Fig. 11. Simulated gas and particle temperatures vs radial distance for Case B
at (a) z = 0.4 m and (b) z = 2.1 m.
PARTICLE HISTORIES DURING SPRAY DRYING
36
Fig. 12. Particle trajectories coloured by residence time (s) (Case B).
PARTICLE HISTORIES DURING SPRAY DRYING
37
0.00
0.05
0.10
0.15
0.20
0.25
0 5 10 15 20 25 30
Time (s)
Par
tic
le R
TD
(s-1
)
Fig. 13. Overall particle primary RTD (Case B) for the whole size distribution.
PARTICLE HISTORIES DURING SPRAY DRYING
38
0
10
20
30
40
50
60
70
Ceiling Wall Cone Pipe Cone end Incomplete
% o
f p
arti
cles
en
d p
osi
tio
n
Fig. 14. Particle impact positions on wall. “Incomplete” means that particles are still in the chamber after 30 s (the timescale of the simulation for Case B).