Embed Size (px)
Citation preview

A STUDY OF PERCEIVED ATTRIBUTES OF ASIAN FOODS:
COMPARISON OF IMPLICIT AND EXPLICIT ATTITUDE MEASURES
A Thesis presented to the Faculty of the Graduate School
University of Missouri
In Partial Fulfillment
of the Requirements for the Degree
Master of Science
by
KWANGHO LEE
Dr. Dae-Young Kim, Thesis Supervisor
MAY 2010

The undersigned, appointed by the dean of the Graduate School, have examined the thesis entitled
A STUDY OF PERCEIVED ATTRIBUTES OF ASIAN FOODS:
COMPARISON OF IMPLICIT AND EXPLICIT ATTITUDE MEASURES
presented by Kwangho Lee,
a candidate for the degree of Master of Science,
and hereby certify that in their opinion it is worthy of acceptance.
Dae-Young Kim, Ph.D., Department of Food Science
Hotel & Restaurant Management
James Groves, Ph.D., Department of Food Science
Hotel & Restaurant Management
Mark Ellersieck, Ph.D., Department of Statistics
Experiment Statistician

ii
ACKNOWLEDGEMENTS
I have been blessed with many people in my life that have provided me with academic
support. I would have not been able to accomplish the completion of this thesis without
supports and guidance of each of following individuals.
My deepest gratitude is to my advisor, Dr. Dae‐Young Kim. Without him I would not
have been able to complete my thesis, I greatly appreciate all of the advice that he has given me
and hope that we will able to succeed to work together again in the Ph.D. study at the University
of Missouri. I strongly believe that none of this would have been possible without his endless
efforts and guidance.
I also thank Dr. James Groves, for his support, guidance, encouragement, and caring. I
am thankful to Dr. Mark Ellersieck for his keen insights into statistical analyses and his
encouragement. I also express my heart‐felt gratitude to Amanda Alexander and Kyung‐A Sun,
my colleagues whom provided me with their dedicated support and wisdom.
I would like to give a special appreciation to my former advisor, Dr. Yeong‐Hyeon Hwang,
who has encouraged me to study in the United States. I am indebted to him for his continuous
support, encouragement and guidance.
Finally, I would like to express my sincere gratitude to my family for their endless love,
concern, and support for me. I dedicate this thesis to my mother, Hwa‐Ae Park, and brother,
Kyung‐hun Lee.

iii
TABLE OF CONTENTS
ACKNOWLEDGEMENTS........................................................................................................ii
LIST OF TABLES...................................................................................................................vii
LIST OF FIGURES.................................................................................................................. ix
Chapter
1. INTRODUCTION ..................................................................................................... 1
1.1 Background of the Study................................................................................... 1
1.2 Research Questions .......................................................................................... 5
1.3 Purpose of Study............................................................................................... 5
1.4 Research Model and Hypotheses ..................................................................... 7
1.5 The Conceptualized Definition of Terms ........................................................ 10
1.6 Significance of the Research ........................................................................... 11
1.7 Outline of Subsequent Chapters..................................................................... 13
2. LITERATURE REVIEW............................................................................................ 14
2.1 Introduction .................................................................................................... 14
2.2 Consumption of Asian Food............................................................................ 14
2.3 Perceived Attributes of Foods ........................................................................ 15
2.4 Significant Food Attributes in Attitude Formation ......................................... 17
2.5 Antecedent Factors on Food Attitudes........................................................... 19
2.6 The Relationship Among Salient Concepts ..................................................... 20
2.7 Psychological Approaches to Attitudes .......................................................... 23
2.7.1 Cognitive Consistence......................................................................... 23
2.7.2 Measure of Reaction Times ................................................................ 24
2.7.3 Ambivalence....................................................................................... 24

iv
2.8 Measurement of Attitudes ............................................................................. 26
2.8.1 Explicit Measures of Attitudes............................................................... 27
2.8.2 Implicit Attitudes Measures................................................................... 28
2.9 Implicit Association Test (IAT)......................................................................... 29
2.10 Summary ....................................................................................................... 31
3. METHODOLOGY................................................................................................... 33
3.1 Introduction .................................................................................................... 33
3.2 Research Design.............................................................................................. 33
3.3 Subject Population.......................................................................................... 34
3.4 Selection of Characteristics for Stimuli ........................................................... 35
3.5 Pilot Test of Measurement for Perceived Food Attributes (PFAs) ................. 37
3.5.1 Results of the Pilot Test in Developing PFAs ......................................... 38
3.5.2 The Deleted Items of PFAs through a Pilot Test .................................... 40
3.6 Research Instrument....................................................................................... 40
3.6.1 Survey Questionnaire............................................................................. 40
3.6.2 Implicit Association Test ........................................................................ 43
3.7 Data Collection................................................................................................ 46
3.8 Data Analysis ................................................................................................... 47
3.9 Summary ......................................................................................................... 48
4. ANALYSIS AND RESULTS ...................................................................................... 49
4.1 Introduction .................................................................................................... 49
4.2 Socio‐Demographic and Individual Characteristics of Subjects..................... 49
4.2.1 Demographic Characteristics of Respondents....................................... 49
4.2.2 Individual Characteristics of Respondents............................................. 50

v
4.3 Information Sources for Asian Food ............................................................... 53
4.4 Exploratory Factor Analysis (EFA) ................................................................... 54
4.4.1 EFA of Perceived Food Attributes (PFAs)............................................... 54
4.4.2 EFA of the Explicit Attitude .................................................................... 56
4.5 Paired t‐test of PFAs between Chinese Food and Japanese Food.................. 57
4.6 Differences of Explicit Attitudes between Chinese and Japanese.................. 59
4.7 Differences of Food Intentions between the Two Types of Asian Foods....... 61
4.8 Influential Factors toward Explicit and Implicit Attitudes .............................. 62
4.9 Correlation Matrix among Variables in Asian Foods ...................................... 63
4.9.1 Results of Correlations among Variables in Chinese food..................... 63
4.9.2 Results of Correlations among Variables in Japanese food................... 64
4.10 Measures of Implicit Attitudes ..................................................................... 66
4.11 Differences of Implicit Attitude between Chinese and Japanese Food........ 67
4.12 Results of Univariate Analysis of Variance (ANOVA) .................................... 68
4.12.1 The Types of Asian Foods and Perceived Food Attributes on Explicit Attitude ............................................................................................... 68
4.12.2 The Types of Asian Foods and Perceived Food Attributes on Implicit Attitude ............................................................................................... 70
5. DISCUSSION AND CONCLUSIONS ........................................................................ 72
5.1 Introduction .................................................................................................... 72
5.2 Summary of the Study. ................................................................................... 72
5.3 Discussion of Findings of the Study. ............................................................... 75
5.4 Theoretical and Practical Implications............................................................ 82
5.5 Limitations of the Study and Recommendation for Future Study.................. 84

vi
APPENDIX ............................................................................................................. 86
A. Institutional Review Board ........................................................................... 86
B. Consent Form................................................................................................ 87
C. Illustration of IAT in Computer Monitor ....................................................... 89
D. Questionnaire for the Study......................................................................... 90
REFERENCES ......................................................................................................... 95
vii
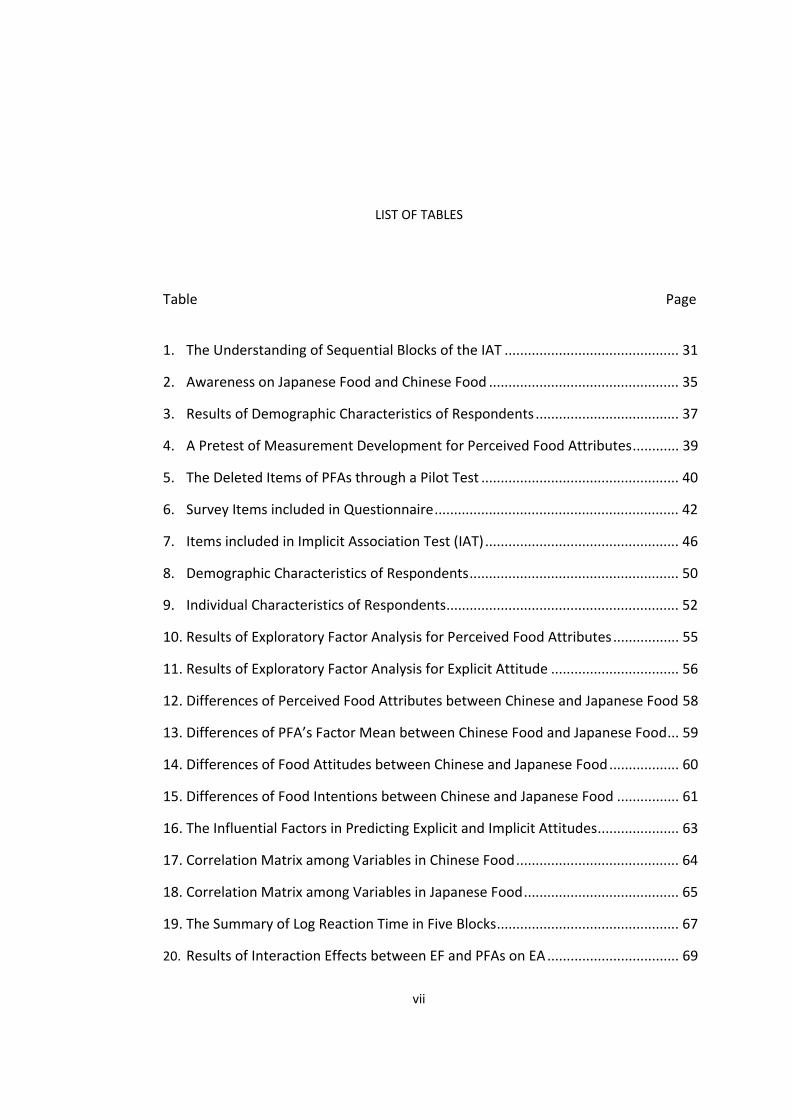
LIST OF TABLES
Table Page
1. The Understanding of Sequential Blocks of the IAT ............................................. 31
2. Awareness on Japanese Food and Chinese Food ................................................. 35
3. Results of Demographic Characteristics of Respondents ..................................... 37
4. A Pretest of Measurement Development for Perceived Food Attributes............ 39
5. The Deleted Items of PFAs through a Pilot Test ................................................... 40
6. Survey Items included in Questionnaire............................................................... 42
7. Items included in Implicit Association Test (IAT).................................................. 46
8. Demographic Characteristics of Respondents...................................................... 50
9. Individual Characteristics of Respondents............................................................ 52
10. Results of Exploratory Factor Analysis for Perceived Food Attributes................. 55
11. Results of Exploratory Factor Analysis for Explicit Attitude ................................. 56
12. Differences of Perceived Food Attributes between Chinese and Japanese Food 58
13. Differences of PFA’s Factor Mean between Chinese Food and Japanese Food... 59
14. Differences of Food Attitudes between Chinese and Japanese Food.................. 60
15. Differences of Food Intentions between Chinese and Japanese Food ................ 61
16. The Influential Factors in Predicting Explicit and Implicit Attitudes..................... 63
17. Correlation Matrix among Variables in Chinese Food.......................................... 64
18. Correlation Matrix among Variables in Japanese Food........................................ 65
19. The Summary of Log Reaction Time in Five Blocks............................................... 67
20. Results of Interaction Effects between EF and PFAs on EA.................................. 69

viii
21. Results of Interaction Effects between EF and PFAs on IA ................................... 71
22. Summary of Hypothesis Test ............................................................................................ 81

ix
LIST OF FIGURES
Figure Page
1. The Proposed Model of this Study........................................................................ 10
2. A Model of Differences of Perceived Food Attributes and Food Attitudes Among Asian Foods............................................................................................... 18
3. A Model of Perceived Food Attributes on Food Attitudes ................................... 20
4. A Model of the Relationship among Salient Concepts ......................................... 22
5. Structural Representation of the Attitude Models............................................... 27
6. Sources to Obtain Information of Asian foods ..................................................... 53
7. Summated Mean Difference of Explicit Attitude between Chinese Food and Japanese Food (7 point Likert‐scale) .................................................................... 60
8. Mean difference (Log(RT)) of Implicit Attitude between Chinese Food and Japanese Food....................................................................................................... 68
9. The Explicit Index Influenced by Ethnic Food and PFAs........................................ 70
10. The Implicit Index Influenced by Ethnic Food and PFAs ....................................... 71

‐ 1 ‐
CHAPTER 1
INTRODUCTION
1.1 Background of the Study
Assume you are standing at a fork in your road. What is the best choice in the
road? We presume that some people do not make the best decision in an uncertain
situation due to individuals’ unawareness of the attitudes on a choice context. In this
sense, how do you make an effective and best decision? Recently, one of the big issues
is how we can make decisions for something at the moment of truth. For 2000 years,
the research in the social psychology has primarily focused on attitudinal issues (Petty,
Fazio, & Brinol, 2009) as a way to examine influential factors that effect peoples’
decision‐making and behaviors (Fellows, 2006). Many social psychologists have
examined individual’s real feelings and thoughts to measure individual’s attitudes, and
have proposed that there are weakness of the traditional (explicit) attitude
measurement (i.e., self‐reported survey), such as midpoint synonyms (Petty, Fazio, &
Brinol, 2009) in evaluating objects. Thus, one of the effective instruments in uncovering
individual’s real attitudes is to apply measures of implicit attitudes compared to
measures of explicit (traditional) attitudes in a study of individual’s attitudes
(Wittenbrink & Schwarz, 2007). In this sense, the psychological studies have employed
the new technique of Implicit Association Test (IAT) in measuring the implicit attitudes
(Greenwald, McGhee, & Schwartz, 1998; Nosek, Greenwald, & Banaji, 2005).

‐ 2 ‐
Considering the features of the new technique (i.e., IAT) in measuring individual’s
implicit attitudes, it is assumed that an application of the new technique (i.e., IAT) could
be applied to measure peoples’ attitudes and expect their behaviors in decision‐making
process within the context of hospitality and tourism.
With the understanding of the decision‐making process in various contexts
(Connors, Bisogni, Sobal, & Devine, 2001), the focus of hospitality and tourism research
is to predict customers’ attitudinal behaviors in making better food choices in multi
food‐related attributes. The reason that potential customers have difficulties choosing
foods in various contexts is because they have different perceptions of food attributes
on food choices (Jang, Ha, & Silkes, 2009). In other words, food choice is a complex
process because it is influenced by many internal and external factors to the person, and
carries many different meanings in perception of diverse culture (Backman, Haddad &
Lee, 2002). With regard to influential factors toward customer’s behaviors of food
choices in some food‐related research, substantial studies proposed the importance of
attitudes, taste for healthful foods, control beliefs, knowledge and availability in
predicting food‐choice intentions (Backman et al., 2002; Bredahl, Grunert, & Frewer,
1998). This reveals that the issue of food choices in the decision making process should
be examined in psychological perspective in that the individual’s explicit attitudes are
usually inconsistent with their implicit attitudes (Abelson, Aronson, McGuire, Newcomb,
Rosenberg, & Tannenbaum, 1968) due to the ambivalence (Armitage & Conner, 2000;
van der Pligt., De Vries., Manstead, & van Harreveld, 2000) on options in making choice.
In this sense, psychological approaches will broaden our understanding of how people’s

‐ 3 ‐
perceived value of food‐related attributes in personal food‐choice systems and how
people solved value conflicts in ambivalent situations
In social psychology, the change of attitudes varies depending on cognitive
consistency and inconsistency, influencing individual’s behavior (Armitage 2003;
Armitage & Conner 2000; Conner, Sparks, Povey, Shepherd, & Armitage, 2002; Costarelli
& Colloca 2004; Sparks., Harris, & Lockwood, 2004) and decision making (H¨anze, 2001)
in ambivalent situations. More specifically, the attitudes in psychology research are a
critical predictor of judgments, decisions, and behavior (Abelson, Aronson, McGuire,
Newcomb, Rosenberg, & Tannenbaum, 1968) in terms of the cognitive decision making
processes (Gawronski & Strack, 2004). Until recently, research investigating the
relationship between cognitive consistency and attitudes focused primarily on explicit
attitude measures toward a given object, which is evaluated by self‐reported survey.
With the recent development of implicit attitude measures (Fazio & Olson, 2003),
research have become increasingly interested in the dynamics of cognitive consistency
at the automatic level. The application of implicit attitude measures to investigating
consistency phenomena is expected to improve our understanding of both implicit
measures (Greenwald, Banaji, Rudman, Farnham, Nosek, & Mellott, 2002), and cognitive
consistency in general (Gawronski & Strack, 2004).
More specifically, in regard to implicit measures of attitudes, it is most widely
measured depending on reaction (or response) time measurement (Wittenbrink &
Schwarz, 2007, p 4). The measures take advantage of the primary reliable observation
‐ 4 ‐
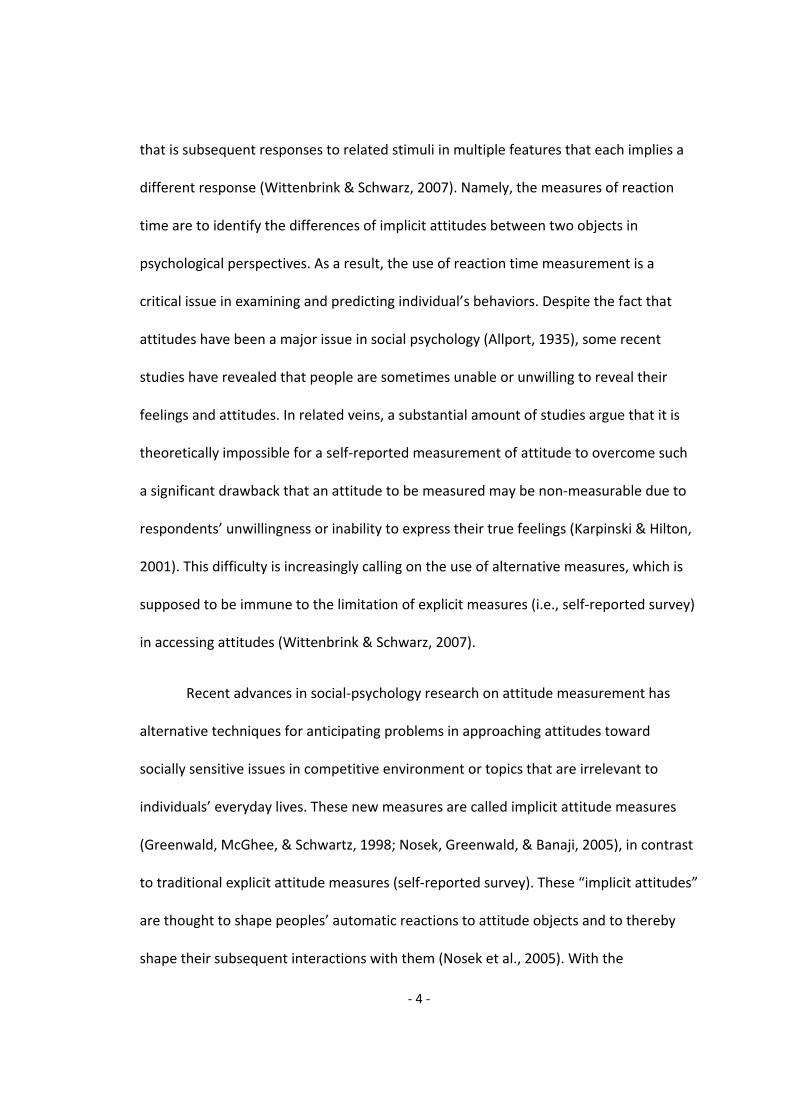
that is subsequent responses to related stimuli in multiple features that each implies a
different response (Wittenbrink & Schwarz, 2007). Namely, the measures of reaction
time are to identify the differences of implicit attitudes between two objects in
psychological perspectives. As a result, the use of reaction time measurement is a
critical issue in examining and predicting individual’s behaviors. Despite the fact that
attitudes have been a major issue in social psychology (Allport, 1935), some recent
studies have revealed that people are sometimes unable or unwilling to reveal their
feelings and attitudes. In related veins, a substantial amount of studies argue that it is
theoretically impossible for a self‐reported measurement of attitude to overcome such
a significant drawback that an attitude to be measured may be non‐measurable due to
respondents’ unwillingness or inability to express their true feelings (Karpinski & Hilton,
2001). This difficulty is increasingly calling on the use of alternative measures, which is
supposed to be immune to the limitation of explicit measures (i.e., self‐reported survey)
in accessing attitudes (Wittenbrink & Schwarz, 2007).
Recent advances in social‐psychology research on attitude measurement has
alternative techniques for anticipating problems in approaching attitudes toward
socially sensitive issues in competitive environment or topics that are irrelevant to
individuals’ everyday lives. These new measures are called implicit attitude measures
(Greenwald, McGhee, & Schwartz, 1998; Nosek, Greenwald, & Banaji, 2005), in contrast
to traditional explicit attitude measures (self‐reported survey). These “implicit attitudes”
are thought to shape peoples’ automatic reactions to attitude objects and to thereby
shape their subsequent interactions with them (Nosek et al., 2005). With the

‐ 5 ‐
recognition, this research explores the implicit measures of attitudes in tourism and
hospitality fields by examining individuals’ attitudes toward two Asian foods such as
Chinese food and Japanese food. Consequently, the primary focus of this study is to
apply the IAT of new techniques (Implicit Association Test (IAT)) to examine the
differences of explicit and implicit attitude measures between the two Asian foods (i.e.,
Chinese food and Japanese food) in the food decision‐making process.
1.2 Research Questions
Does the mean differ of between explicit attitudes (i.e., self‐report survey) and
implicit attitudes (i.e., reaction time (msec)) in two Asian foods (Chinese food and
Japanese food)? What determinants (i.e., perceived attributes of Asian foods) influence
explicit and implicit attitudes? Do interactions between the types of two Asian foods
(Chinese food and Japanese food) and perceived food attributes (i.e., high and low)
exist?
1.3 Purpose of Study
This study aims to examine the differences of perceived food attributes (PFAs)
between Chinese food and Japanese food in Caucasians, and the differences of explicit
attitude (i.e., self reported survey) and implicit attitude (i.e., reaction time) in evaluating
perception on Asian foods (Chinese food and Japanese food). This study also examines

‐ 6 ‐
the influential factors on explicit and implicit attitudes in terms of PFAs. Furthermore,
the interaction effects between PFAs (high vs. low) and the types of Asian foods (I.e.,
Chinese food vs. Japanese food) on explicit and implicit attitudes are examined within
the context of the hospitality and tourism setting, as well as the correlations among
salient factors in this study are examined. Understanding the results of this study will
allow for theoretical and practical implications in the tourism and hospitality field.
1) Describe subjects’ demographic information (i.e., gender, race, and grade
level) and personal characteristics (handedness, the most preferred Asian
food, frequency of visit to Asian restaurants, etc.)
2) Examine the differences of perceived attributes between the two Asian foods
(Chinese food and Japanese food).
3) Identify individual’s attitudes toward two Asian foods (Chinese and Japanese
foods) applying both explicit and implicit measures
4) Compare the results of the explicit and implicit measures;
5) Determine the antecedent factors on two measures of attitudes (i.e., explicit
and implicit attitudes);
6) Examine if there are correlations among perceived attributes,
implicit/explicit attitudes, and food intentions of two Asian foods;
7) Identify if there are interactions between two Asian foods and perceived
food attributes on explicit and implicit attitudes;

‐ 7 ‐
8) Describe further implications for the measurement of tourism and hospitality
study.
1.4 Research Model and Hypotheses
The hypotheses were developed based on the review of literature regarding
research of perceived attributes, implicit and explicit attitudes on Asian foods,
intentions on Asian foods, and other studies that focused on reaction time, ambivalence,
and Implicit Association Test (IAT). Perceived attributes of Asian foods consisting of four
dimensions are employed as the dependent variable to determine the salient factors on
explicit and implicit attitudes in this study. The following hypotheses were evaluated:
H1. There will be mean differences of perceived food attributes between Chinese
food and Japanese food.
H2. There will be mean differences among explicit and implicit attitudes between
Chinese food and Japanese food.
H2.1 There will be mean differences among explicit attitudes between the two
Asian foods (i.e., Chinese food and Japanese food)
H2.2 There will be mean differences among implicit attitudes between the two
Asian foods (i.e., Chinese food and Japanese food)

‐ 8 ‐
H3. There will be mean differences of intentions between Chinese food and Japanese
food.
H3.1 There will be mean differences of intention to eat Asian foods in terms of
Chinese food and Japanese food.
H3.2 There will be mean differences of intention to visit Asian destinations in
terms of China and Japan.
H4. PFAs have a positive impact on explicit and implicit attitudes
H4.1 PFAs have a positive impact on explicit attitudes
H4.2 PFAs have a positive impact on implicit attitudes
H5. There will be correlations among perceived food attributes (PFAs), explicit
attitude (EA), implicit attitude (IA), intention to eat Asian foods (IEAF), and intention
to visit destination to eat Asian foods (IVDEAF) in each Asian food (i.e., Chinese food
and Japanese food).
H5.1.1 PFAs will be positively related to EA in Chinese food
H5.1.2 PFAs will be positively related to EA in Japanese food
H5.2.1 PFAs will be negatively related to IA in Chinese food
H5.2.2 PFAs will be negatively related to IA in Japanese food
H5.3.1 PFAs will be positively related to IEAF in Chinese food

‐ 9 ‐
H5.3.2 PFAs will be positively related to IEAF in Japanese food
H5.4.1 PFAs will be positively related to IVDEAF in Chinese food
H5.4.2 PFAs will be positively related to IVDEAF in Japanese food
H5.5.1 EA will be negatively related to IA in Chinese food
H5.5.2 EA will be negatively related to IA in Japanese food
H5.6.1 EA will be positively related to IEAF in Chinese food
H5.6.2 EA will be positively related to IEAF in Japanese food
H5.7.1 EA will be positively related to IVDEAF in Chinese food
H5.7.2 EA will be positively related to IVDEAF in Japanese food
H6. There will be interactions between PFAs and the types of Asian foods on explicit
and implicit attitudes.
H6.1 There will be interactions between PFAs and the types of Asian foods on
explicit attitude.
H6.2 There will be interactions between PFAs and the types of Asian foods on
implicit attitude.

‐ 10 ‐
Figure 1. The Proposed Model of this Study
1.5 The Conceptualized Definition of Terms
This study mentioned perceived food attributes (PFA), explicit attitude, implicit
attitude, and intentions on Asian foods. The perception of 23 items of PFAs is
independent variables for explicit and implicit attitudes in the hypothesis. The PFAs
refer to the characteristics of foods in Asian restaurants, consisting of various positive
attributes in regard with Asian foods in this study based on Lewis’s (1983) definition
regarding attributes, which is defined as the product features that differ from those of
competitors’ products. It also utilizes determinant on people’s attitudes. In terms of the
explicit attitude, it can be defined by people’s external feeling and thoughts on objects
in the measurement by self‐report survey based on the features of attitudes, indicating
a set of feelings, beliefs, and behaviors dispositions directed towards specific persons,
ideas, and objects (Hillriegel, Slocum, & Woodman, 1989). In contrast, implicit attitude
refers to people’s internal feelings and reaction. As new alternative measures of

‐ 11 ‐
attitude, implicit attitude can be measured by reaction time in psychological
perspectives. Furthermore, intention to visit Asian restaurants and destinations to eat
foods can be employed for potential succeeding variables of attitudes. Intention to visit
restaurants and/or destination to eat foods is defined as feelings and willingness after
an experience about each Asian food.
1.6 Significance of the Research
This study focuses on an application of the new techniques in order to examine
people’s mindset and feelings from psychological perspectives. Many studies in social
psychology have attempted to identify the stereotype and prejudice on sensitive issues
regarding racism (Olson & Fazio, 2003; Cunningham, Preacher, & Banaji, 2001; Dasgupta,
McGhee, Greenwald, & Banaji, 2000), gender (Dasgupta & Asgari, 2004), sexuality
(Bamse, Seise, & Zerbes, 2001), and etc. in the cognitive process. As a result, many have
found people’s real feelings and thoughts on objects through in the research by
implementing IAT. In this sense, the theoretical and practical implications of the study
will be beneficial to the tourism and hospitality industry, more specifically in promoting
destination and/or ethnic food restaurants. It is shown that the results of the IAT can
uncover consumers’ attitudes toward foods that traditional measures can not detect.
This research is anticipated to contribute to the realm of hospitality field by proposing
an alternative approach to measure consumer’s food attitudes through an experimental

‐ 12 ‐
design. Our elaboration on the literature and the experimental study permits several
conclusions and recommendations.
In the world, healthy food has become an emerging trend in research due to
people’s interests in improving their health. A substantial study in regard with food‐
related attributes provides very critical implications for industrial practitioners in a
successful operating system within the context of the restaurant settings, in particular
focusing on Asian foods (Jang, Ha, & Silkes, 2009). In terms of examining the
determinants on implicit and explicit attitudes in this study, industrial practitioners in
the hospitality and tourism industry can understand customers’ preferences and
awareness on Asian foods. Thus, they will be able to apply the understanding of results
to marketing strategies in predicting customers’ decision‐making of food choices.
Understanding the prominent factors toward explicit and implicit attitudes can be
employed to be specific marketing tools in promoting Asian food restaurants. This study
suggests basic information pertinent to marketing strategies for positioning and product
development for Asian food restaurants. This study is unique in the sense that it applies
both explicit and implicit measures of attitudes in identifying differences of both
measures, and in predicting the determinants on both the measures of attitudes in
making choices of Asian foods.
1.7 Outline of Subsequent Chapters
The following chapters include the Literature Review, Methodology, Results, and
Discussion. In the Literature Review, Chapter 2, previous studies and literature on

‐ 13 ‐
perceived attributes of Asian foods, implicit and explicit attitudes, implicit association
test (IAT) and the salient factors toward implicit and explicit attitudes in this study are
reviewed. The research methodology employed to complete the study is addressed in
detail in Chapter 3. The results and data analysis of the study are presented and
explained in Chapter 4. Chapter 5 includes a brief summary of the study and results,
along with implications and suggestions for further research.
‐ 14 ‐
CHAPTER 2
LITERATURE REVIEW
2.1 Introduction
This chapter reviews the literature on the perceived food attributes (PFAs),
measures of explicit and implicit attitudes, and intentions to visit restaurants and/or
certain destinations to eat Asian foods, along with a brief discussion of relevant issues
and theories in the research framework. The influential factors on explicit attitude and
implicit attitudes are also discussed.
2.2 Consumption of Asian Food
Asian foods have become part of the mainstream food in the U.S. (Kruse, 2004).
Within a society, food has the ability of activity as a marketing tool in bridging people,
showing social status, and expressing sentiments, including laughter and joy (Bessiere,
2001). In recent research, the food consumption is one of the most critical issues in
marketing perspectives, as well as in promoting ethnic foods (Hamlett, Bailey, Alexander
& Shaw, 2008) and other cultures (Mitchell & Hall, 2003; Bessiere, 2001). Within the
behavioral complexity in consumer food choice, the understanding of the consumer
approaches to food consumption (shopping) has become presumably more complete in
recent research of food consumption (Hamlett et al., 2008). Specifically, Asian Food is a
well‐known aspect of Asian American culture. According to a substantial study that
focused on the food attributes in the level of consumer’s satisfaction among Asian foods

‐ 15 ‐
(Jang et al., 2009), it was observed that consumers’ satisfaction on each ethnic food
such as Japanese, Chinese, Thai, Korean food and etc. varies depending on different
food attributes with high performance of foods in successful marketing. The results are
consistent with other social and marketing research (Cui, 1997; Gren, 1999), indicating
the positive views of ethnicity as a category of identity, and strongly influencing
consumption decisions and consumers’ behaviors.
In terms of the features of Asian foods, Chinese cuisine is very liberal and
extensive in and is considered to be richest and most diverse culinary cuisine in the
world (Halvorsen, 1999). Specifically, the features of Chinese food might be diverse,
abundant, rich, spicy, oily and seasonal (Gu, Lee & Lee. 2006; Sen, 2004), revealing the
attractiveness and popularity of Chinese food in Americans is because Americans prefer
abundant and rich foods in food choice. On the other hand, the features of Japanese
food include healthy ingredients (i.e., vegetables, mushrooms, beans, and fish), natural
flavor, type of art (Barer‐Stein, 1999), and beautiful food decorations which look
delicious. This indicates that Japanese food would be unique, delicious, beautiful,
colorful, and tasty as compared to other Asian foods.
2.3 Perceived Attributes of Foods
Food attributes has been regarded as an important factor in predicting
consumers’ perceptions in food choices decision complexity. According to Lewis (1983)
suggestion, food Attributes are referred as to the product features in a distinction as
compared to competitors’ products. He has suggested distinctive and specific food

‐ 16 ‐
attributes regarding differentiated marketing strategies from other foods, involving
various food attributes such as taste, healthiness, social status and cost. In a recent
study of food attributes, the satisfaction levels of ethnic foods varies depending on
diverse food attributes (i.e., taste, fresh, colorful, unique, healthy) (Jang et al., 2009). In
related veins, in regard to the effectiveness of food attributes on consumer behavior, it
was observed that oyster consumption was mainly influenced by five food attributes,
including taste, nutritional value, freshness, cost and safety (Lin, 1991). Furthermore,
health‐related factors and visual differences were significant antecedents on satisfaction
for the purchase of branded beef (Menkaus et al., 1988) and important characteristics
or attributes can be classified into six categories: (1) energy content, (2) nutrient
content/health properties, (3) taste, (4) status/prestige properties, (5) environmental,
political, and ethical properties, (6) time/convenience attributes (Fischer, 2005; Mitchell,
2004).
In the hospitality and tourism industry, most of the attribute research has mainly
attempted to examine the effects of destination image in developing marketing
strategies (Gartner, 1989). That is, a study of the consumers’ perception on food
attributes is significantly important to define the most efficient food attributes in food
image formation. With understanding the perception of food attributes in Asian foods,
some studies focusing on food attributes suggested the importance of perceived food
attributes (i.e., taste), perceived value (i.e., price and portion size), and perceived
nutrition in food‐choice decision making process (Glanz, Basil, Maibach, Goldberg, &
Snyder, 1998). In similar veins, a significant study in evaluating six types of Asian foods
‐ 17 ‐
employed 20 items of perceived attitudes of Asian foods, including tasty, edible, quality,
fresh, digestible, clean, aromatic, healthy, attractive, colorful, inexpensive, unique,
traditional, neat, spicy, light, exotic, etc. in understanding the common and unique
characteristics of the six Asian food categories. Furthermore, in terms of perception on
food attributes, it is significantly observed that customer food preferences are based on
nine food attributes: search (price, color, and appeal), experience (taste, spiciness, and
convenience), and credence attributes (leanness, safety, and healthiness) (Verbeke &
Lopez, 2005). This reveals that food attributes presumably consist of several dimensions,
for example food attractiveness, taste, health, and popularity. With regards to food
attributes in the hospitality and tourism industry, there is little literature in applying
food attributes to examine the consumers’ perception on Asian foods. In spite of the
fact that there is the lack of literature in examining the consumers’ perception on Asian
foods using perceived food attributes, it is possible to apply perceived food attributes
based on previous research of food attributes.
2.4 Significant Food Attributes in Attitude Formation
Attitude formation plays a significant role on food choices in the decision making
process, which is regarded as a fundamental human behavior in choosing options
between objects (Fellows, 2006). It is anticipated that people would hesitate on food
choices between options in decision making process due to the ambivalence. Within the
complexity of food choice in food restaurants, it is expected that the most influential
food‐related values are involved with health (physical well‐being), taste (sensory

‐ 18 ‐
perceptions), cost (monetary considerations), convenience (time and effort), and
managing relationships (inter‐ personal interactions) (Connors, Bisogni, Sobal, & Devine,
2001). One study of food‐choices proposed general categories of food meaning,
including: pleasure, health, tradition and convenience (Rappoport, Peters, Huff‐Corzine
& Downey, 1992), indicating managing values in personal food systems across various
eating situations. Similarly, Jang et al. (2009) pointed out the importance of the food
related values in a confliction among various food choices. They especially focused on
broadening the understanding of people’s perception on values in personal food
systems, as well as solutions of value conflicts. People in post‐industrial societies are
faced with many food products and diverse eating situations that can make food‐choice
decision complexity (Connors et al., 2001). Thus, understanding the roles of preferred
attitude toward the certain types of food in food‐choice decision making process has
important implications for theoretical conceptualizations of the attitude formation
process.
Based upon the literature regarding the features of consumption of Asian foods,
perceived attributes of foods, significant food attributes in attitude formation, this study
suggests the following model (Figure 2).
Figure 2. A Model of Differences of Perceived Food Attributes and Food Attitudes among
Asian Foods

‐ 19 ‐
2.5 Antecedent Factors on Food Attitudes
In food marketing research, the effects of food marketing on consumers’
preferences are significant in food choice behavior (Chernin, 2008). One of the
significant reports (survey) in a study of consumer behaviors has employed preferences
to measure food attitudes on behavior (Devine, Lloyd & Gray, 2006). This means that
attitude can be an influential factor on behavior in food choice process. In this sense, it
is necessary to examine the determinants of food attitudes in various choices of food
attributes. According to Devine et al. (2006) in their final report, food attributes, such as
diet and nutrition had Impacts on the change of food attitudes and behaviour. It is also
argued that quality and price of food would be significantly considered when purchasing
foods in the change of food attitudes.
With regards to consumption choices, consumers consider certain attributes that
foods possess in food purchase. In other words, food attributes have great influence on
consumption choices along with food attitudes in the sense that customers have
differentiated perception on each product attribute (Keller, 2003; Kotler, 1988). With
understanding of food consumption choices and food attitudes, it can be expected that
consumers are concerned about nutritional content and food safety (Mitchell, 2004),
within significantly influences consumer behavior (Knight, Worosz & Todd., 2007;
Henson, Majowicz, Masakure, Sockett, Jones, Hart, Carr & Knowles, 2006; Kim, Nayga &
Capps, 2001). Most consumer surveys regarding food‐related issues indicated taste and
healthy‐related attributes (Chernin, 2008) as a dominant factor in food choice,

‐ 20 ‐
Expensive foods, origin‐specific foods, and especially dining out in expensive restaurants
convey the characteristics of status and prestige that consumers want to acquire
through food consumption (Senauer, 2001). Considering the positive relationship
between all food attributes and consumers’ perception and behavior, it seems that food
attributes would have impacts on food attitudes, such as explicit and implicit attitudes
in decision‐making systems.
With understanding of the literature in regard to antecedent factors on food
attitudes, this study suggests the following model (Figure 3).
Figure 3. A Model of Perceived Food Attributes on Food Attitudes
2.6 The Relationship among Salient Concepts
Food marketing is considered a critical issue in examining food preferences and
eating behavior (Hastings, Stead, McDermott, Forsyth, MacKintosh, Rayner, Godfrey,
Caraher & Angus, 2003; Livingstone & Helsper, 2004). In spite of the importance of
eating behavior (e.g., Auty & Lewis, 2004) in food marketing strategies, there is little
research focusing on food behavior due to the limitations that does not examine the
real behavior in food‐related research. An attitude study in predicting behavior found

‐ 21 ‐
that attitudes were the most important predictor of choice intentions, control beliefs,
knowledge and availability (Backman, Haddad, & Lee, 2002). In particular, the manner of
measuring implicit and explicit attitudes (i.e., automatic and deliberative measures)
matches the situations in predicting behavior (Vargas, 2004). Implicit attitudes are
postulated to guide behavior in spontaneous situations when people are not engaged in
much thought, whereas explicit attitudes are said to guide behavior when people are
being reflective (Dovidio, Kawakami, Johnson, Johnson, & Howard, 1997; Davidio,
Kawakami Smoak, & Gaertner, 2009). The research that examined the relationship
between explicit‐implicit attitudes proposed positive correlations of them, indicating
that participants who explicitly reported preferring A to B tended to show a similar
preference implicitly (Nosek, 2007). In a marketing study, attitudes and subjective
norms measured before tasting were poor predictors of purchase intents after tasting,
which imply the importance of taste and direct product experience in food choice. This
indicates that attitudes are significantly related with food intentions and knowledge in
food‐choice process, as well in a destination choice (Quan & Wang , 2004). In terms of a
psychological model based on attitude prediction for context‐aware services,
furthermore, the psychological research suggested that psychographic and demographic
contexts were crucial for analyzing the user’s potential needs. Thus, attitude can be
employed to be a significant determinant of user intention for use and even actual
usage of a service or purchase of a product (Kwon, 2010).
According to Devine, Lloyd and Gray (2006), people have different perceptions,
experiences and knowledge on foods. Specifically, potential consumers in the food‐

‐ 22 ‐
choice process rely heavily on prior attitude and knowledge in both positive and
negative perspectives. Thus, personal attitude (knowledge) might be one of the critical
predictors of food‐choice intentions and behaviors in the decision making (Fife‐Schaw &
Rowe, 2006), reveling that knowledge is an influential factor toward individual’s
perception in decision‐making process. In terms of the preference on foods, the attitude
model of the theory of reasoned action (TRA) has been applied mainly to predicting the
choice of familiar foods (Arvola, Lähteenmäki, & Tuorila, 1999). In social psychology,
liking (preference) is measured by emotional reaction, which implies the positive impact
to eating foods in eating behavior and enhancements from hedonic experience (Smith &
Berridge, 2005). Consequently, the results indicated that the change of attitudes on
foods varies depending on food familiarity.
Considering the literature regarding the relationship among salient concepts, this
study suggests the following model (Figure 4).
Figure 4. A Model of the Relationship among Salient Concepts

‐ 23 ‐
2.7 Psychological Approaches to Attitudes
2.7.1 Cognitive consistence
In social psychology, cognitive consistence has been assumed to be of crucial
importance in research on attitudes (Petty et al. 2009) as a significant concept to
examine people’s minds and true feelings since the early 1950s (Petty, Fazio, & Brinol,
2009). Despite some fundamental differences between different theories of cognitive
consistency (Abelson, Aronson, McGuire, Newcomb, Rosenberg, & Tannenbaum, 1968),
the primary assumption that cognitive inconsistency causes aversive feelings indicates
that cognitive consistency has a powerful influence on judgments, decisions, and
behavior. In recent decades, research investigating the impact of cognitive consistency
on attitudes has primarily employed explicit attitude measures (Petty et al., 2009). In
regard to the explicit attitude‐related studies, participants were simply asked to report
their attitude toward a given object. In this sense, new paradigm should be utilized to
examine the consistent impacts in people’s intrinsic feelings and thoughts on certain
objects. With the recent development of implicit attitude measures (Fazio & Olson,
2003), thus, researches have become increasingly interested in the dynamics of
cognitive consistency at the automatic level. The application of implicit attitude
measures is to investigate the consistency phenomena, and is expected to improve our
understanding of both implicit measures (e.g., Greenwald et al., 2002), and cognitive
consistency in general (Gawronski & Strack, 2004) based upon the reaction times.

‐ 24 ‐
2.7.2 Measure of Reaction Times
There is substantial amount of research regarding reaction time in measuring
intrinsic feelings and thoughts in psychological perspectives (Wittenbrink & Schwarz,
2007). Implicit measures of attitudes that are most widely used depend on reaction (or
response) time measurement. Several types of implicit measures have been developed,
including reaction‐time‐based tasks such as the affective priming task (Fazio, Jackson,
Dunton, & Williams, 1995), the implicit Association Test (IAT; Greenwald, McGhee, &
Schwartz, 1998), and the (extrinsic) affective Simon task (De Houwer, 2003; De Houwer
& Eelen,1998). In terms of the features in using psychology research, the reaction time‐
based measure takes advantage of one of two reliable observations; one is that the
observation that exposure to a stimulus facilitates subsequent responses to related
stimuli and second is that the observation that a stimulus is responded to more slowly
when it contains multiple features that each imply a different response (Wittenbrink &
Schwarz, 2007).
2.7.3 Ambivalence
The theoretical value of the ambivalence construct lies in its novel definition of
attitudes in social psychology. Ambivalence has been treated mostly as a distinct aspect
of attitude strength; both negative and positive (van der Pligt et al., 2000). In many
empirical literature, the functions of ambivalence has been utilized as influential
concepts on attitude‐behavior consistency (Armitage 2003; Conner et al., 2002; Sparks

‐ 25 ‐
et al., 2004), attitude pliability (Armitage & Conner 2000), and decision making (H¨anze,
2001).
With the crucial importance of ambivalence in research of attitudes,
ambivalence has been accessed by two concepts. First concept of ambivalent is explicit
ambivalence; it has data supporting the idea that attitudes can be based on separate
positive and negative components (Cacippo & Berntson, 1994; Thompson, Zanna, &
Griffin, 1995). In terms of the notion of explicit ambivalence on attitudes, it should be
determined by its strong positive and negative associations as compared to neutral
attitudes, positive attitudes, and negative attitudes (de Liver, van der Pligt, & Wigboldus,
2007). With the understanding of the concept of explicit ambivalence, it appears that
when people have both positive and negative reactions to an attitude object, they
typically recognize that their attitudes are ambivalent or mixed (Petty et al., 2009). In
regard to the implicit ambivalence, the concept has been employed in a more
complicated perspective compared with the explicit ambivalence. An example of implicit
ambivalence is a person who has eliminated ambivalence at the explicit level might still
be ambivalent at the implicit level (Petty et al., 2009). Thus, implicit ambivalence occurs
when people have both positive and negative associations to an attitude object, but one
of these is not endorsed (Petty, Tormala, Brñol, & Jarvis, 2006). That is, the implicit
ambivalence stems from the unrecognized conflict between the rejected old attitude
and the endorsed new attitude. People may well recognize the discrepancy between
their old and new attitudes (e.g., “I used to eat Asian food, but now I do not”), but it

‐ 26 ‐
may not recognize any conscious conflict or doubt with respect to the attitude object
(Petty et al., 2009).
2.8 Measurement of attitudes
Attitudes have been described as hypothetical constructs at times, and at other
times as real (Krosnick, Judd, & Wittenbrink, 2005). Attitudes are commonly defined as
people’s evaluations of a wide variety of objects, issues, and people, including the self,
as well as It has been assumed to be conscious and unconscious (e.g., see Greenwald &
Banaji, 1995), and referred to behavioral, cognitive, and/or emotional reactions (Zanna
& Rempel, 1988).In terms of attitude models, there are various significant attitude
models in social psychology, including single attitude model, dual attitudes model,
meta‐cognitive model (Petty, Briñol, & DeMarree, 2007). Among these attitude models,
dual attitudes model can take on different values in examining explicit and implicit
attitudes in this study.
Social psychologists more recently argue that people can hold separate explicit
(conscious, deliberative) and implicit (unconscious, automatic) attitudes (Greenwald &
Banaji, 1995; Wilson, Lindsey, & Schooler, 2000) in identifying different values on an
object. Regarding this, implicit and explicit attitudes are viewed as distinct mental
entities that are stored separately in different areas of the brain (DeCoster, Banner,
Smith, & Semin, 2006). Thus, a person might have a deliberative (explicit) attitude
toward an object of one valence but an automatic (implicit) attitude of a different
valence. Implicit attitudes are assumed to stem from associative processes such as

‐ 27 ‐
evaluative conditioning, whereas explicit attitudes stem from propositional processes
such as thinking about message arguments (Rydell, McConnell, Mackie, & Strain, 2006).
When considering all of these assumptions together, the dual attitudes framework
suggests that attitudes evaluated with automatic (implicit) and deliberative (explicit)
measures are quite different. Dual attitude model is employed to examine the
differences between explicit and implicit attitudes on objects in this study (see Figure 5)
Figure 5. Structural Representation of the Attitude Models.
Note: Depiction of the attitude models from the perspective of the Meta‐Cognitive Model (figure form Petty, Briñol, & DeMarree, 2007)
2.8.1 Explicit Measures of Attitudes
The explicit measures of attitudes are regarded as a significant issue in terms of
measuring psychological feelings and consumers’ behavior in the substantial psychology
and marketing research. Understanding consumers’ attitudes toward a certain brand
has been one of the primary concerns in tourism and hospitality research. In regard to
hospitality and tourism field, it is also not surprising that attitudes have been one of the
‐ 28 ‐
critical factors in evaluating brand equity (Gardner, 1985; Park, Jaworski, & Maclnnis,
1986). A majority of studies on tourist attitudes have utilized explicit measures of
attitudes such as self‐report survey methods (e.g, Likert‐type scale), due to important
psychometric criteria such as usefulness and efficiency (Brunel, Tietje, & Greenwald,
2004; Mischel, 1968). In regard to the limitations of explicit measures, however, there
are several notable explanations: (1) people who have never been exposed to a certain
topic are less likely to have a prior attitude, (2) prior formation of attitudes would not be
easily accessible to the individual (Fazio, 1986), and (3) individuals tend to be unwilling
to consciously admit, even to themselves, that they might have negative attitudes
toward a certain object (LaPiere, 1934). For these reasons, an alternative approach to
overcome the limited explicit measures of attitudes should exist and be evaluated.
2.8.2 Implicit Attitudes Measures
During the past decade, many new instruments that measure attitudes have
been developed, several of which received the label “implicit measure”. The definition
of implicit attitudes is “actions or judgments that are under the control of automatically
activated evaluation, which is without the performer's awareness of that causation”
(Greenwald & Banaji 1995, pp. 6‐8). Implicit measures of attitude are designed to reflect
the automatic impact of attitudes in order to not directly draw on attitude. In terms of
the unique advantages of implicit measures, it can provide a special insight into the
effects of the invisible attitude on the visible behavior (De Houwer, 2006). Regarding

‐ 29 ‐
this, social psychology researchers have suggested a variety of paradigms based on
reaction‐time including affective priming task (Fazio, Jackson, Dunton, & Williams 1995),
the (extrinsic) affective Simon task (De Houwer, 2003), and the Implicit Association Test
(IAT) (Greenwald, McGhee, & Schwartz, 1998) in developing a wide range of disciplines
(De Houwer & Moors, 2007). Considering the unique insight into the effects of the
implicit attitude, the applications of implicit attitude would lead to new paradigms in
the tourism and hospitality research.
2.9 Implicit Association Test (IAT)
Initially, the IAT test was developed by Greenwald et al. (1998); the introduction
of the IAT test shows a respondent’s implicit attitude toward objects identified in terms
of “willingness and ability” issues through the strength of mental associations between a
target concept and its evaluative attribute. In regard to the response latencies, the
strength of association in sorting adjectives into two combined categories represented:
“the target concept or the consistent evaluative attribute” versus “the target concept or
the inconsistent evaluative attribute”. As a result, substantial research distinguishes
three critical features of the IAT into implicitness, difference, and association (Haines &
Sumner, 2006). In relation with IAT’s features, (1) implicitness refers to the IAT’s ability
to tap on respondents’ automatic processes rather than their conscious self‐report, (2)
difference refers to the bias to be detected in the strength of association between two
target concepts and their two valences, respectively, and (3) association refers to the
central construct of the IAT, that is, the variable strength of the mental connection

‐ 30 ‐
between a target concept and its evaluative attribute, which presumably sub‐serve the
formation of human attitude. Furthermore, compared to explicit measures of attitude,
the IAT displays some meaningful qualities, such as (a) revealing more bias than the self‐
reported attitudes does, (b) weak correlation to the explicit attitude, and (c) yielding
large effect sizes (i.e., d > 1.0).
As one of the alternative approaches to attitudes, implicit measures can be
effectively applicable for a brand evaluation in that the IAT paradigm have achieved
increasing recognition (Sheldon, King, Houser‐Marko, Osbaldiston & Gunz, 2007). Due to
the advantages of IAT instrument, it has been employed in areas of social psychology
research measuring a series of social psychological variables such as implicit attitude
(Hong, Dengfeng, & Ye, 2006; Karpinski & Hilton, 2001), stereotypes (Puertas,
Rodriguez‐Bailon, & Moya, 2002), self‐esteem (i.e., Greenwald & Farnham, 2000) and
self‐concept (Asendorpf, Banse, & Mucke 2002). In regard to the IAT effects, it is shown
to be immune to a series of factors such as the number of items used, the inter‐trial
interval, or handedness (Greenwald et al., 1998). Meanwhile, supporting evidence is
steadily accumulating for the construct validity (Bosson, Swann, & Pennebaker, 2000;
Brunel et al., 2004; Greenwald et al., 2002; Karpinski, 2004; Pinter & Greenwald, 2005),
internal validity (Brunel et al. 2004; Greenwald et al., 1998; Nosek, Ottaway, Hayden &
Oakes, 2001) and statistical conclusion validity (Blanton & Jaccard, 2006; Greenwald,
Nosek, & Sriram, 2006; Greenwald, Rudman, Nosek, & Zayas, 2006) of the IAT in
literature. Table 1 shows the procedure of Sequential Blocks of the IAT in this study.

‐ 31 ‐
Table 1.
The Understanding of Sequential Blocks of the IAT
Sequence 1 2 3 4 5
Task
Description
Initial Target‐
Concept
Discrimination
Evaluative Attribute
Discrimination
Initial Combined
Task
Reversed Target‐
Concept
Discrimination
Reversed
Combined Task
Task
instruction *“CF” vs. “JF”*
*“Appealing”
“Unappealing”*
* “CF Or
Unappealing”
“JF OR
Appealing”*
*“JF” vs. “CF”*
*“JF OR
Unappealing”
“CF OR
Appealing”*
Stimulus
photos
*CFRP (e.g.,
Dumpling), JFRP
(e.g., Sushi) *
*PA (e.g., Tasty) vs.
NA (e.g., Stingy)*
* CFRP (e.g.,
Dumpling) or NA
(e.g., Stingy) OR
JFRP (e.g., Sushi)
or PA (e.g., Tasty)
*
*JFRTP (e.g.,
Dumpling), CFRTP
(e.g., Sushi) *
* JFRP (e.g.,
Sushi) or NA
(e.g., Stingy) OR
CFRP (e.g.,
Dumpling) or PA
(e.g., Tasty) *
*Note: 1) CF= Chinese Food; JF= Japanese Food; CFRP= Chinese food related photos; JFRP= Japanese food related
photos. 2) On the “task instruction” row, the phrase within the quotation marks defines a category for
discrimination. With an asterisk on the left, the category name would appear on the upper left corner of the
display. Similarly, with an asterisk on the right, the category name would be on the upper right corner of the
display.; 3) On the “stimulus examples” row, a stimulus with an asterisk on the left suggests that the correct
response to this stimulus is to press the left response key (the Q key); similarly, a stimulus with an asterisk on the
right suggests that the correct response is to press the right response key (ithe P key)
2.10 Summary
This chapter presents the literature on the consumption of Asian food, perceived
attributes of foods, influential food attributes in attitude formation, antecedent factors
on food attitudes, the relationship among salient concepts, psychological approaches to
attitudes, the measures of attitudes (i.e., explicit and implicit attitudes), and implicit
association test (IAT). The literature review focused on eight main sections:

‐ 32 ‐
2.2 The consumption of Asian food
2.3 Perceived attributes of foods
2.4 Influential food attributes in attitude formation
2.5 Antecedent factors on food attitudes
2.6 The relationship among salient concepts
2.7 Psychological approaches to attitudes
2.8 The measures of attitudes (i.e., explicit and implicit attitudes)
2.9 Implicit association test (IAT)

‐ 33 ‐
CHAPTER 3
METHODOLOGY
3.1 Introduction
This chapter discusses the methodology used to examine the hypotheses
developed in the proceeding chapter. The first section of this chapter addresses the
research design including subject population, selection of characteristics for stimuli, and
sample size. The second section of this chapter presents the pilot test of measurement
for perceived food attributes. In the third, forth, and fifth sections, subject population,
selection of characteristics for stimuli, and sample size are respectively presented. The
sixth section presents Pilot test of measurement for perceived food attributes. The
seventh section of this chapter presents the research Instrument. The procedures of
implicit association test (IAT) are presented. The eighth section presents the data
collection procedures. Finally, the ninth section discusses data analysis procedures.
3.2 Research Design
This study employed both an experimental research design and a survey method.
An experimental research design is commonly utilized for social psychology. Thus, the
experimental research design was developed based upon the psychological study
method, and it is implemented in a room equipped with 15‐inch LCD screens. Before
‐ 34 ‐
starting the actual experiment, pilot test was implemented in order to check the
reliability and validity of the concepts used in this study.
This study discusses the differences of salient concepts (i.e., perceived food
attributes (PFAs), explicit an implicit attitudes, intentions on foods), and addresses the
influence of PTAs on explicit and implicit attitudes and moderating impact of the Asian
food types (Chinese food vs. Japanese food) on the differences between PFAs (high PFA
vs. low PFA) and explicit/implicit attitudes. In regard to the PFAs as the independent
factors, specifically, PFAs were coded as the categorically “high (1)” and “low (0)” levels
on the basis of the summated mean values of each dimension.
3.3 Subject Population
A total of 81 participants were recruited in this study. As participants in
experimental design, 39 American (all Caucasian) undergraduate and graduate students
were recruited from a university in the Mid‐west region of the U.S. to serve as
participants in both the experiment and the survey. They were native English speakers
and participated in the study in exchange for research credit for a destination
management course. In addition, 42 participants who are voluntarily participated in the
survey were recruited from the same university mentioned above. They were also
undergraduate and graduate students in the hospitality and English‐related major.

‐ 35 ‐
3.4 Selection of Characteristics for Stimuli
In regard to the IAT classification tasks, this study consists of five classification
tasks, which used 20 adjectives and 20 image stimuli, including 10 names and 10
accompanying pictures for characteristics of Chinese Food (i.e., dumpling, Chinese beef,
etc.) and Japanese Food (i.e., sushi, roll, etc.), respectively, 10 appealing adjectives (i.e.,
exotic, colorful, popular, unique, etc.) and 10 unappealing adjectives (i.e., Horrible,
stingy, untasty, dirty, and etc.) (Table 2). The characteristics for either food were
selected based on responses from a prior survey given to the same set of subjects
before the experiment. The authors and an evaluation group judged that these
characteristics are generally positive and well known to the subject population.
Table 2
Awareness on Japanese Food and Chinese Food
Stimuli photosa
% of Awarenessb Usability Food types
Photo1 93% Selection Japanese Food
Photo2 33% Deletion Japanese Food
Photo3 47% Deletion Chinese Food
Photo4 96% Selection Japanese Food
Photo5 84% Deletion Chinese Food
Photo6 93% Selection Chinese Food
Photo7 98% Selection Japanese Food
Photo8 91% Deletion Japanese Food
Photo9 98% Selection Japanese Food
Photo10 100% Selection Chinese Food

‐ 36 ‐
Table 2 continue
Stimuli photosa
% of Awarenessb Usability Food types
Photo11 100% Selection Chinese Food
Photo12 98% Selection Japanese Food
Photo13 100% Selection Chinese Food
Photo14 96% Selection Chinese Food
Photo15 36% Deletion Chinese Food
Photo16 96% Selection Japanese Food
Photo17 100% Selection Chinese Food
Photo18 98% Selection Japanese Food
Photo19 98% Selection Japanese Food
Photo20 76% Deletion Chinese Food
Photo21 40% Deletion Japanese Food
Photo22 44% Deletion Japanese Food
Photo23 82% Deletion Chinese Food
Photo24 100% Selection Chinese Food
Photo25 100% Selection Chinese Food
Photo26 76% Deletion Chinese Food
Photo27 100% Selection Japanese Food
Photo28 80% Deletion Japanese Food
Photo29 87% Selection Chinese Food
Photo30 98% Selection Japanese Food
aPhotos were selected by a researcher and professionals in hospitality and tourism b The percentage was calculated based upon the formula (Awareness of “Yes”/total N )

‐ 37 ‐
3.5 Pilot Test of Measurement for Perceived Food Attributes (PFAs)
All survey items used in this study should be reviewed to establish validity. Thus
a panel of experts consisting of three scholars and graduate students was employed to
evaluate the questionnaire. Face validity and content validity were achieved through
the expert’s knowledge in the hospitality and tourism industry, information search
channels, and a statistical background. The experts reviewed and evaluated the
questionnaire and made recommendations to improve clarity, understanding and to
ensure that questions actually measured what was being asked. After the corrections
were made, the questionnaire was then distributed to 54 undergraduate and 5 graduate
students (see Table 3) in the Hotel and Restaurant Program to provide further feedback
and recommendations, then, final revisions were completed.
Table 3
Results of Demographic Characteristics of Respondents
Characteristic Undergraduate students N(%) Graduate students N(%)
Gender Female 39 (72.7) 3 (60.0)
Male 15(27.8) 2 (40.0)
Total 54(100) 5(100)

‐ 38 ‐
3.5.1 Results of the Pilot test in Developing PFAs
A total 30 PFAs‐related items in Asian foods such as Chinese and Japanese food
were used to examine the reliability in the pilot study. Results of reliability test showed
the item‐total correlation and Cronbach's Alpha value if Item Deleted of the PFAs (Table
4). The scale of PFAs is developed based on the prior PFA‐related studies (Jang et al.,
2009). On completing the reliability test, response to 23 items appears to be reliable in
the sense that the internal consistency reliability coefficient (Cronbach's Alpha if Item
Deleted) ranges from .857 to .882 and item‐total correlation ranges from .341 to .631
(Hair, et. al, 1998).
Table 4 shows the results of a pretest of measurement development for
perceived food attributes. The results of descriptive test for PFAs present mean values
of tasty (6.17), edible (6.08), delicious (6.02), pleasing (5.79), cultural (5.55), colorful
(5.45), popular (5.43), unique (5.43), abundant (5.25), fresh (5.19), authentic (5.11),
attractive (5.11), digestible (5.11), convenience (5.09), aromatic (4.92), speedy (4.92),
exotic (4.87), clean (4.40), nourishing (4.32), nutritious (4.26), healthy (4.25), neat (4.23)
and dietetic (3.72).

‐ 39 ‐
Table 4
A Pretest of Measurement Development for Perceived Food Attributes
Items of food attributes
Mean Standard deviation
Item‐Total Correlation
Cronbach's Alpha if Item Deleted
Exotic 4.87 1.373 .341 .882
Abundant 5.25 1.285 .652 .874
Colorful 5.45 1.218 .459 .879
Aromatic 4.92 1.426 .363 .882
Popular 5.43 1.421 .470 .879
Nutritious 4.26 1.508 .579 .875
Dietetic 3.72 1.419 .417 .880
Healthy 4.25 1.440 .519 .877
Nourishing 4.32 1.123 .505 .878
Pleasing 5.79 1.081 .483 .879
Delicious 6.02 1.083 .456 .879
Tasty 6.17 .995 .352 .882
Edible 6.08 1.035 .409 .880
Unique 5.43 1.152 .399 .880
Cultural 5.55 1.338 .397 .881
Fresh 5.19 1.345 .631 .874
Authentic 5.11 1.296 .378 .881
Neat 4.23 1.368 .542 .877
Attractive 5.11 1.325 .531 .877
Clean 4.40 1.419 .417 .880
Speedy 4.92 1.238 .506 .878
Convenience 5.09 1.260 .514 .877
Digestible 5.11 1.219 .455 .879
N=53, Cronbach's Alpha = .895

‐ 40 ‐
3.5.2 The Deleted Items of PFAs through a Pilot Test
As a result of the pretest 30 items, 7 items (Spicy, Traditional, Inexpensive,
Qualitative, Light, Smelly, and Comfortable) were eliminated due to the lack of accuracy
and reliability (Table 5).
Table 5
The Deleted Items of PFAs through a Pilot Test
Concept Measurement items
Reasons Total deleted items
Perceived Food
attributes
Spicy, Traditional, Inexpensive, Qualitative, Light, Smelly, and Comfortable
Deletion based upon the
limitation of Item‐Total
Correlation and validity of the
items
7 items
Note: 7 point likert scale where 7 points is strongly agree
3.6 Research Instrument
3.6.1 Survey Questionnaire
After completing evaluation for validity of questionnaire, the questionnaire was
finally developed based on a review of related research studies including 23 items on
perceived food attributes (Fischer, 2005; Jang, Ha, and Silkes, 2009; Letarte, Dube, &
Troche, 1997; Lewis ,1983; Menkaus et al., 1988; Mitchell, 2004; Rozin & Vollmecke,
2001), 5 items on explicit attitudes, 2 items on food intentions (Backman, Haddad and
Lee, 2002; Quan & Wang , 2004). Respondents were asked to rate each item on the 5
dimensions on a scale from 1 “strongly disagree” to 7 “strongly agree.” The survey

‐ 41 ‐
instrument also included questions on demographic information and individual
characteristics (Table 6).
More specifically, PFAs include 23 items of Exotic, Abundant, Colorful, Aromatic,
Popular, Nutritious, Dietetic, Healthy, Nourishing, Pleasing, Delicious, Tasty, Edible,
Unique, Cultural, Fresh, Authentic, Neat, Attractive, Clean, Speedy, Convenience, and
Digestible. Explicit attitudes included 5 items: (1) “I like Chinese/Japanese food very
much”, (2) “I would like to have Chinese/Japanese food in the near future”, (3) “I would
like to recommend Chinese/Japanese food to my close friends and relatives”, (4) “I
would like to talk about positive things of Chinese/Japanese food” and (5) “Overall, I
have favorable preference about Chinese/Japanese food” in each Asian food (i.e.,
Chinese food and Japanese food). Intentions consist of 2 items: (1) I would like to eat
Chinese/Japanese food in the near future” and (2) “I would like to visit China/Japan to
eat Chinese/Japanese food”. Knowledge and Liking includes single item in each Asian
food: “ the level of Knowledge about Chinese/Japanese food” and “the level of liking
about Chinese/Japanese food”, respectively. In regard to Individual Characteristics,
Frequency of visit to Asian restaurants, accompany types, Information sources, eat‐out
time, and experience to China and Japan was included in the questionnaire. Lastly,
Demographic Characteristics consists of Gender, race, handedness and grade level.

‐ 42 ‐
Table 6
Survey Items included in Questionnaire
Factors Measurements Items
(Chinese and Japanese food) Scales
Perceived food attributes
23 items
Exotic, Abundant, Colorful, Aromatic, Popular,
Nutritious, Dietetic, Healthy, Nourishing,
Pleasing, Delicious, Tasty, Edible, Unique,
Cultural, Fresh, Authentic, Neat, Attractive,
Clean, Speedy, Convenience, and Digestible
7 points
5 items
I like Chinese/Japanese food very much I would like to have Chinese/Japanese food in the near future I would like to recommend Chinese/Japanese food to my close friends and relatives I would like to talk about positive things of Chinese/Japanese food Overall, I have favorable preference about Chinese/Japanese food
7 pointsExplicit attitudes
Intentions
2 items
I would like to eat Chinese/Japanese food in the near future I would like to visit China/Japan to eat Chinese/Japanese food
7 points
Knowledge 1 item
The level of Knowledge about Chinese/Japanese food
7 points
Liking 1 item The level of liking about Chinese/Japanese food 7 points
Frequency of visit to Asian restaurants, accompany types, Information sources, eat‐out time, and experience to China and Japan
NominalIndividual Characteristics
8 items
Number of experience in last month, eat‐out expenditure, and tipping sizes
Open
Demographic Characteristics
4items Gender, race, handedness and grade level Nominal

‐ 43 ‐
3.6.2 Implicit Association Test
Subjects were asked to start the IAT task in regard to implicit attitude on
completing the explicit questionnaire. The subjects’ reaction time was measured based
on millisecond (ms) through E‐Prime software. The IAT consisted of 5 sequential blocks
based on the methods outlined by Greenwald et al. (1998) and Karpinski and Hilton
(2001): (1) Stage 1, initial evaluative attribute discrimination (Chinese Food vs. Japanese
Food), (2) Stage 2: initial target‐concept discrimination (Unappealing vs. Appealing), (3)
Stage 3, initial combined task (Japanese Food or Appealing vs. Chinese Food or
Unappealing), (4) Stage 4, reversed target‐concept discrimination (Japanese Food vs.
Chinese Food), and (5) Stage 5, reversed combined task (Japanese Food or Unappealing
vs. Chinese Food or Appealing). Two target concepts of the experiment were
“McDonald” versus “Japanese Food” and two evaluative attributes were “Appealing”
versus “Unappealing”. Instructions were given at the beginning of each block, describing
what two categories each stimulus was to be discriminated into and which response key
(the left one is the “q” key; the right one is the “p” key) was for either decision. In
addition, one category name remained at the upper left and right corner on the
computer screen during each block, reminding subjects of which response key was
assigned to which category. More specifically, the detailed IAT procedure conducted in
the experiment follows (Table 7):
Step 1: Initial evaluative attribute discrimination. First, respondents sort item
from two different concepts into their super ordinate categories (positive adjectives for

‐ 44 ‐
“appealing” and negative adjectives for “Unappealing”). Categorizations are mapped to
the super ordinate categories (the left one is the “q” key; the right one is the “p” key)
and stimulus items appear sequentially in the middle of the computer
Step 2: Initial target‐concept discrimination. In Step 2, subjects perform the same
task with the same two keys but now sort items representing two poles of an attribute
dimension (clean, unique, and tasty for “Appealing” and untasty, dirty, and stingy for
“Unappealing”)
Step 3: Initial combined task. In the third stage, these two sorting tasks are
combined such that, on alternating trials, respondents are identifying a food as Chinese
Food or Japanese Food and then a word as Appealing or Unappealing. In this case, one
key (“q”) is the correct response for two categories (Chinese Food or Unappealing) and
the other key (“p”) is the correct response for the other two categories (Japanese Food
or Appealing). Respondents perform a block of 40 trials with these sorting rules.
Step 4: Reversed target‐concept discrimination. In the fourth stage of the task,
only stimulus items for the target concepts (Japanese Food and Chinese Food) are
sorted for 20 trails, but this time the key assignment is reversed. In the present example,
appealing items would now require a “p” key response and unappealing items would
require a “q” key response.
Step 5: Reversed combined task: In the fifth stage of the task, respondents sort
items from both the attribute and target concept categories again, except that the
response key assignments now require Chinese Food and Appealing items to be

‐ 45 ‐
categorized with one key and Japanese Food and Unappealing items to be categorized
with the other key, the opposite association from the earlier block. Respondents sort
stimulus items with this response assignment for 40.
The IAT effect is calculated using latency data from Steps 3 and 5. Greenwald et
al. (2003) described the scoring algorithm for calculating the IAT effect in detail. In the
above example, sorting the stimulus items faster when Japanese Food or Appealing (and
Chinese Food or Unappealing) share a response key than the reverse pairings indicates a
stronger association strength between Chinese Food or Appealing (and Chinese Food or
Unappealing) compared to the reverse mapping, or an automatic preference for Chinese
Food relative to Japanese Food.

‐ 46 ‐
Table 7
Items included in Implicit Association Test (IAT))
Sources Measurements Items Scalesa
Stimuli 20 adjectives
Tasty, Attractive, Delicious, Pleasing, Authentic, Colorful, Unique, Popular, Exotic, Fresh, Untasty, Unpleasing, Dirty, Unclean, Horrible, Smelly, Monotonous, Stingy, Unpopular, Rotten
RT
20 photos 10 Japanese‐related photos 10 Chinese‐related photos
RT Stimuli
Associations (Relevant/irrelevant)
46 items Chinese and perceived food attributes (23 items) Japanese and perceived food attributes (23 items)
Dichotomy
RT
Black 1 20photos Initial evaluative attribute discrimination RT
Black 2 20adjectives Initial target‐concept discrimination RT
Black 3 20photos /20adjective
Initial combined task RT
Black 4 20adjectives Reversed target‐concept discrimination RT
Black 5 20photos /20adjective
Reversed combined task RT
aRT= Reaction Times
3.7 Data Collection
Data collection was conducted in a room equipped with computers at a
university located in Columbia, Missouri, March 9 ‐ 16, 2010 from 9 a.m. to 5 p.m. The
survey was conducted after obtaining Institutional Review Board (IRB) consent. In order
to protect participants’ rights in participating in the survey, it is required to get an

‐ 47 ‐
approval from the IRB at the University of Missouri. This study was granted permission
and was assigned the number 1163197.
Student respondents participated in an experiment and a survey, simultaneously.
43 participants out of a total 95 of participants in this study responded to both an
experiment and a survey in exchange for research credit for a destination management
course. The rest (N=52) participated in only a survey questionnaire. The reason that
student sample was used in this study is because of the limitations that the study
includes an experimental research design with a survey questionnaire. In order to
overcome the limitation of sample sizes when using statistical analyses, such as factor
analysis and multiple regression analysis, specifically, additionally 52 participants are
voluntarily recruited from out of the class. In regard to the selection of experimental
objects in this study, Asian foods of Chinese food and Japanese food are designated
based on the two considerations. The first is that the two Asian foods are representative
of the overall Asian foods in terms of participants’ awareness and liking on Asian foods
in this study. The second is that Chinese and Japanese restaurants are frequently found
in the city on which this study focuses as compared to other Asian restaurants.
3.8 Data Analysis
The data analysis of the study followed several statistical procedures; Excel, E‐
prime, and SPSS 15.0 were utilized to complete the tasks. The descriptive data including
frequencies, means, and standard deviations are obtained to examine the demographic

‐ 48 ‐
and personal characteristics of respondents. First of all, Paired‐t test was employed to
identify the differences between salient factors used in this study. A simultaneous
multiple regression method was used to examine the relationship between PFAs and
explicit and implicit attitudes, Furthermore, Two‐way analysis of variance (ANOVA) was
employed to examine the interaction effects between the types of Asian foods (Chinese
food vs. Japanese food) and PFAs (High PFAs vs. Low PFAs) on explicit and implicit
attitude.
3.9 Summary
This chapter discussed the methodology that was utilized to conduct this study.
The second section of the chapter reviewed the purpose of the study. The third section
presented the research design. Section four discussed the population and sampling
procedures, followed by the review process required by the Campus Institutional
Review Board in section five. Instrumentation was explained in section six, along with a
discussion of measurement and validity. Data collection procedures were presented in
section seven. Section eight presented the data collection procedures. Lastly, section
nine discussed statistical procedures adopted for data analysis.

‐ 49 ‐
CHAPTER 4
ANALYSIS AND RESULTS
4.1 Introduction
This chapter addresses the statistical analysis of the data. The socio‐
demographic characteristics are presented in the second section of this chapter. The
descriptive summary of variables, including mean and standard deviations comprise the
third section. The fourth section tests the hypotheses and includes results from t‐test, a
one‐way analysis of variance, and Duncan’s Post hoc.
4.2 Socio‐Demographic Characteristics of Subjects
4.2.1 Demographic Characteristics of Respondents
Table 8 presents respondent characteristics. Respondents consisted of 15 male
(38.5%) and 24 female (61.5%). It was observed that more Caucasian students (89.7%)
than African American ones (10.3%) participated in this study. In regard with current
grade level, it was shown that there are about 51.3% of Junior, 33.3% of senior, and
10.3% of graduate students, respectively.

‐ 50 ‐
Table 8
Demographic Characteristics of Respondents
Characteristic Category Frequency %
Male 15 38.5 Gender
Female 24 61.5
Caucasian 35 89.7 Race
African American 4 10.3
Grade level Freshman 0 0
Sophomore 2 5.1
Junior 20 51.3
Senior 13 33.3
Graduate 4 10.3
4.2.2 Individual Characteristics of Respondents
Respondents’ individual characteristics are shown in Table ‐‐. It was observed
that about 87 % of respondents have right handedness, whereas left handedness
accounts for about 12 %. A majority of respondents selected Chinese food (64%) and
Japanese food (28%) as the most preferred Asian food, respectively. This shows that the
validity of selecting two objectives (Chinese and Japanese food) is well reflected in the
study. In terms of frequency of visit to Asian restaurants, “once a year” accounted for
41.0 % of respondents, and “2 to 4 times per month” accounted for 35.9 percentage of
respondents. Moreover, about 74 % of respondents accompany friends to visit Asian
restaurants, whereas “alone” accounted for only 2.3 % of respondents. About 77 % of

‐ 51 ‐
respondents have diner for eat‐out, whereas about 23 % of respondents have lunch for
eat‐out.
In regard to number of visits to Asian restaurants in the last month, respondents
visited Chinese restaurants and Japanese restaurants about 1.15 times and 0.85 times in
the last month, respectively. In terms of eat‐out expenditure, respondents spend 6.72
dollar for lunch and 9.44 dollar for diner in Chinese food, whereas 7.44 dollar and 13.78
dollar accounts for respondents’ lunch and diner respectively in Japanese food with tip
sizes of 16.08 dollar for lunch and 18.41 for dinner. As a result, it was observed that
there were different perception and expenditures for two different Asian foods.

‐ 52 ‐
Table 9
Individual Characteristics of Respondents
Characteristic Category Frequency(n) %
Right 34 87.2 Handedness
Left 5 12.8
Chinese food 25 64.0
Japanese food 11 28.2
Korean food 1 2.6
Thai food 1 2.6
The most preferred
Asian food
Vietnamese food 1 2.6
Not more than once a year 2 5.1
2 to 4 times per year 7 17.9
Once a year 16 41.0
Frequency of visit to Asian Restaurants
2 to 4 times per month 14 35.9
Family/relatives 9 23.1
Friends 29 74.3 Accompany types
Alone 1 2.6
Dining‐out Lunch 9 23.1
Dinner 30 76.9
Characteristic Category Mean Demonstration
Chinese restaurants 1.15 Number of visit to Asian restaurants in the last month Japanese restaurants 0.85
Times
Lunch 6.72 Chinese food
Diner 9.44
Lunch 7.44 Eat‐out expenditure
Japanese food Diner 13.87
Dollar
Tip Lunch 16.08 Dollar
Diner 18.41

‐ 53 ‐
4.3 Information Sources for Asian food
Figure 6 represents the ratio of the sources when obtaining information of
Asian foods in multiple choices. The results showed that the percentage of using
information sources on Asian food was represented by relatives/colleagues/friends by
79.5%, followed by Asian restaurants by 48.7%, internet by .30.8%, food guidebooks by
15.4%, TV/radio by 12.8%, newspaper/magazine by 10.33% and other by 5.1%,
respectively (see Figure 3). The results indicated that a majority of respondents tend to
employ relatives, colleagues, and friends as the information sources for Asian food that
is most preferred and most influential when obtaining Asian food‐related information.
Figure 6. Sources to Obtain Information of Asian foods
79.5%Relatives/colleagues/friends
Internet
Food guidebooks
TV/radio
Newspaper/magazine
Asian restaurants
Other
30.8%
15.4%
12.8%
10.3%
48.7%
5.1%

‐ 54 ‐
4.4 Exploratory factor Analysis (EFA)
4.4.1 EFA of Perceived Food Attributes (PFAs)
This study conducted item‐total correlation analyses and an exploratory factor
analysis with the extraction method of eigenvalue greater than 1. Varimax rotation was
also applied in order to check the adequacy of items included in the questionnaire.
Based on the results, items, ‘exotic’, ‘convenience’, ‘digestible’ and ‘exotic’ were deleted
by the cut‐off factor loading score .50 considering the number of cases (n=78) (Hair,
Anderson, Tatham, & Black, 1998). KMO measure of sampling adequacy (.865) and
Bartlett’s test of Sphericity (Approx. χ2 = 1446.570, df.=171, sig.=.000) indicate that
correlation structure embedded in the data is adequate to apply factor analysis. Results
shown in Table 10 indicate that 19 items are in four factors, and these 4 factors account
for about 80% of the total variance. The resulting factor structure, in fact, corresponds
to the hypothesized factor structure implying that respondents’ response pattern can be
also distinguished into 4 inter‐related factors. Response to each factor appears to be
reliable in the sense that the internal consistency reliability coefficient ranges from .857
to .941 (Hair et. al., 1998).

‐ 55 ‐
Table 10
Results of Exploratory Factor Analysis for Perceived Food Attributes
N=78, KMO (Kaiser‐Meyer‐Olkin Measure of Sampling Adequacy.) = .809(p=.000); FL= Factor Loading;; CE= Communalities Extraction;
ITC= Corrected Item‐Total Correlation; CA= Cronbach's Alpha if Item Deleted; Eig(%)= Eigenvalues; RC(%)= Cronbach's Alpha
Item* FL CE ITC Mean CA % of variance Eig.(%) RC(%)
Attractiveness
Neat .874 0.84 .802 5.51 .929
Attractive .832 0.78 .780 5.71 .931
Clean .826 0.83 .851 5.49 .924
Unique .821 0.79 .754 5.38 .933
Cultural .804 0.78 .860 5.14 .923
Fresh .785 0.83 .739 5.44 .934
Authentic .717 0.70 .819 5.09 .927
40.843
7.760
.938
Taste
Delicious .923 0.90 .859 5.74 .923
Tasty .922 0.91 .917 5.82 .904
Pleasing .881 0.86 .926 5.82 .900
Edible .838 0.74 .742 5.74 .959
21.045
3.999
.941
Health
Dietetic .892 0.85 .849 4.65 .885
Healthy .877 0.91 .831 4.35 .891
Nutritious .841 0.86 .899 4.60 .867
Nourishing .759 0.72 .696 4.88 .934
10.152
1.929
.920
Popularity
Popular .783 0.73 .591 .591 .786
Aromatic .748 0.63 .609 .609 .777
Abundant .741 0.69 .655 .655 .756
Colorful .681 0.83 .682 .786 .744
7.823
1.486
.857

‐ 56 ‐
4.4.2 EFA of the Explicit Attitude
As shown in Table 11, The same procedure has been applied to those items
dealing with food attitudes. As the results of the factor analysis, KMO measure of
sampling adequacy (.911) and Bartlett’s test of Sphericity (Approx. χ2 = 536.272, df.=10,
sig.=.000) indicates that correlation structure embedded in the data is adequate to
apply factor analysis (Hair et. al., 1998). Results shown in Table 13 indicate that 5 items
included in the analysis could be distinguished as a single factor, and the factor accounts
for about 89% of the total variance. Response to the factor appears to be relatively
reliable in terms of the internal consistency reliability coefficient of .970 (Hair et. al.,
1998).
Table 11
Results of Exploratory Factor Analysis for Explicit Attitude
Item* FL CE ITC Mean CA % of variance Eig.(%) RC(%)
Attitude
Attitude1 .969 .904 .869 5.68 .964
Attitude2 .963 .927 .902 5.73 .959
Attitude3 .951 .874 .810 5.50 .966
Attitude4 .935 .849 .781 5.38 .970
Attitude5 .921 .939 .917 5.65 .958
89.856
4.493
.970
N=78*KMO (Kaiser‐Meyer‐Olkin Measure of Sampling Adequacy.) = .911(p=.000); FL= Factor Loading;; CE= Communalities Extraction; ITC= Corrected Item‐Total Correlation; CA= Cronbach's Alpha if Item Deleted; Eig(%)= Eigenvalues; RC(%)= Cronbach's Alpha

‐ 57 ‐
4.5 Paired t‐test between Chinese food and Japanese food
Table 12 shows mean differences of perceived food attributes (PFAs) between
Chinese food and Japanese food. Results of paired t‐tests indicated that respondent’s
evaluation was significantly different between Chinese food and Japanese food in
several perceived food attributes. Mean values of most attributes were found to be
higher in the Japanese food than in the Chinese food. There are statistically significant
mean differences of PFAs between Chinese food and Japanese food at significant level
of .05 and .01 in 19 perceived food attributes except for Aromatic (t=1.04), Delicious
(1.38), Tasty (t=1.03), Edible (t=1.46), and Digestible (t=‐1.43), respectively. In particular,
the negatively significant results of 13 items including exotic (t=‐5.48), colorful (t=‐4.40),
nutritious (t=‐6.22), dietetic (t=‐3.96), healthy (t=‐6.97), nourishing (t=‐3.92), unique (t=‐
5.99), fresh (t=‐4.39), cultural (t=‐8.53), authentic (t=‐6.71), neat (t=‐7.06), attractive (t=‐
4.26), and clean (t=‐6.82) indicates that respondents would be more positive
perceptions to Japanese food than Chinese food. On the other hand, there are
significantly positive differences of perceived food attributes between Chinese food and
Japanese food in Abundant (t=2.51), Popular (t=2.69), Pleasing (t=2.16), Speedy (t=3.77),
and Convenience (t=4.56), indicating that Chinese food would be a more positive food
than Japanese food in satisfactory food attributes.

‐ 58 ‐
Table 12
Differences f Perceived Food Attributes between Chinese Food and Japanese Food
Food attributes
MCFa % (LogRT) b MJFa % (LogRT) b (CF‐JF) Standard deviation
t‐value
Exotic 4.85 94.9(3.23) 6.15 84.6(3.08) ‐1.30 1.49 ‐5.48**
Abundant 5.69 97.4(3.18) 5.05 97.4(3.16) 0.64 1.60 2.51**
Colorful 5.26 94.9(3.22) 6.05 87.2(3.17) ‐0.79 1.13 ‐4.40**
Aromatic 5.26 92.3(3.17) 5.03 89.7(3.16) 0.23 1.39 1.04
Popular 5.95 76.9(3.16) 5.49 84.6(3.16) 0.46 1.07 2.69*
Nutritious 3.87 61.5(3.18) 5.44 82.1(3.23) ‐1.57 1.57 ‐6.22**
Dietetic 3.72 61.5(3.24) 4.97 84.6(3.20) ‐1.25 1.98 ‐3.96**
Healthy 3.77 84.6(3.20) 5.44 66.7(3.20) ‐1.67 1.49 ‐6.97**
Nourishing 4.46 64.1(3.24) 5.31 46.2(3.28) ‐0.85 1.35 ‐3.92**
Pleasing 5.92 66.7(3.20) 5.56 87.2(3.18) 0.36 1.04 2.16*
Delicious 5.95 59.0(3.27) 5.69 79.5(3.24) 0.26 1.16 1.38
Tasty 5.92 59.0(3.19) 5.72 82.1(3.20) 0.20 1.24 1.03
Edible 5.87 71.8(3.18) 5.62 79.5(3.31) 0.25 1.09 1.46
Unique 4.87 87.2(3.24) 6.15 51.3(3.18) ‐1.28 1.34 ‐5.99**
Cultural 5.28 82.1(3.19) 6.13 43.6(3.22) ‐0.85 1.20 ‐4.39**
Fresh 4.69 66.7(3.22) 6.28 64.1(3.24) ‐1.59 1.16 ‐8.53**
Authentic 4.79 41.0(3.14) 5.97 74.4(3.21) ‐1.18 1.10 ‐6.71**
Neat 4.31 46.2(3.19) 5.97 74.4(3.16) ‐1.66 1.48 ‐7.06**
Attractive 4.85 71.8(3.23) 6.03 69.2(3.31) ‐1.18 1.73 ‐4.26**
Clean 4.28 41.0(3.20) 5.90 66.7(3.19) ‐1.62 1.48 ‐6.82**
Speedy 5.62 46.2(3.18) 4.64 59.0(3.19) 0.98 1.61 3.77**
Convenience 5.56 35.9(3.21) 4.49 69.2(3.23) 1.07 1.48 4.56**
Digestible 5.00 25.6(3.23) 5.28 56.4(3.22) ‐0.28 1.23 ‐1.43 * p < .05, ** p < .01 a MCF(Mean of Chinese Food) and MJF (Mean of Japanese Food) b % is ratio of association between ethnic foods (i.e., Chinese food and Japanese food) and food attributes. Specifically, () is mean value of log transformed reaction times of associations between ethnic foods (i.e., Chinese food and Japanese food) and food attributes.

‐ 59 ‐
In regard to the differences of summated factor mean scores between Chinese
food and Japanese food (Table 13), it was found that there are statistically significant
mean differences of two dimensions, such as taste (t=‐.596, p<.01) and popularity (t=‐
7.96, p<.01), out of four between Chinese food and Japanese food. This reveals that
respondents prefer Japanese food to Chinese food due to taste and popularity of Asian
foods.
Table 13
Difference of PFA’s Factor Mean between Chinese Food and Japanese Food
Mean Factors CF JF
Difference (CF‐JF)
Standard deviation
t‐value
Attractiveness 5.54 5.40 0.14 0.79 1.07 n
Taste 3.95 5.29 ‐1.34 1.40 ‐5.96 a
Health 5.92 5.65 0.27 0.99 1.69 n
Popularity 4.73 6.06 ‐1.33 1.05 ‐7.96 a
nNon‐significant,
* p < .01,
a CF(Mean of Chinese Food) and JF (Mean of Japanese Food)
**
4.6 Differences of Explicit Attitudes between Chinese and Japanese food
Table 14 presents the descriptive mean scores and Paired t‐test results of the
food (explicit) attitudes between Chinese food and Japanese food. Explicit attitudes
were measured using seven Likert‐type scale questions for Chinese food and Japanese
food, respectively. The results revealed there are no significant mean differences
between two foods on all of them. In addition, the result of a summated mean

‐ 60 ‐
difference also reveals that there is no significant mean difference of food attitude
between Chinese food and Japanese food at .05 level (Figure 7).
Table 14
Difference of Food Attitudes between Chinese Food and Japanese Food
Mean Food attitudes
CF JF
Difference (CF‐JF)
Standard deviation
t‐value
Attitude1 5.92 5.44 0.48 1.79 1.70 n
Attitude2 5.95 5.51 0.44 1.85 1.47 n
Attitude3 5.72 5.28 0.44 1.83 1.49 n
Attitude4 5.46 5.31 0.15 1.80 0.53 n
Attitude5 5.92 5.38 0.54 1.98 1.69 n
Total (Summated mean )
5.79 5.38 0.41 1.77 1.45 n
nNon‐significant,
* p < .05,
a CF(Mean of Chinese Food) and JF (Mean of Japanese Food)
**
Attitude1= I like Chinese/Japanese food very much, Attitude2= I would like to have Chinese/Japanese food in the near future, Attitude3= I would like to recommend Chinese/Japanese food to my close friends and relatives, Attitude4=I would like to talk about positive things of Chinese/Japanese food, and Attitude5=Overall, I have favorable preference about Chinese/Japanese food
Figure 7. Summated Mean Difference of Explicit Attitude
between Chinese food and Japanese food (7 point Likert‐scale)
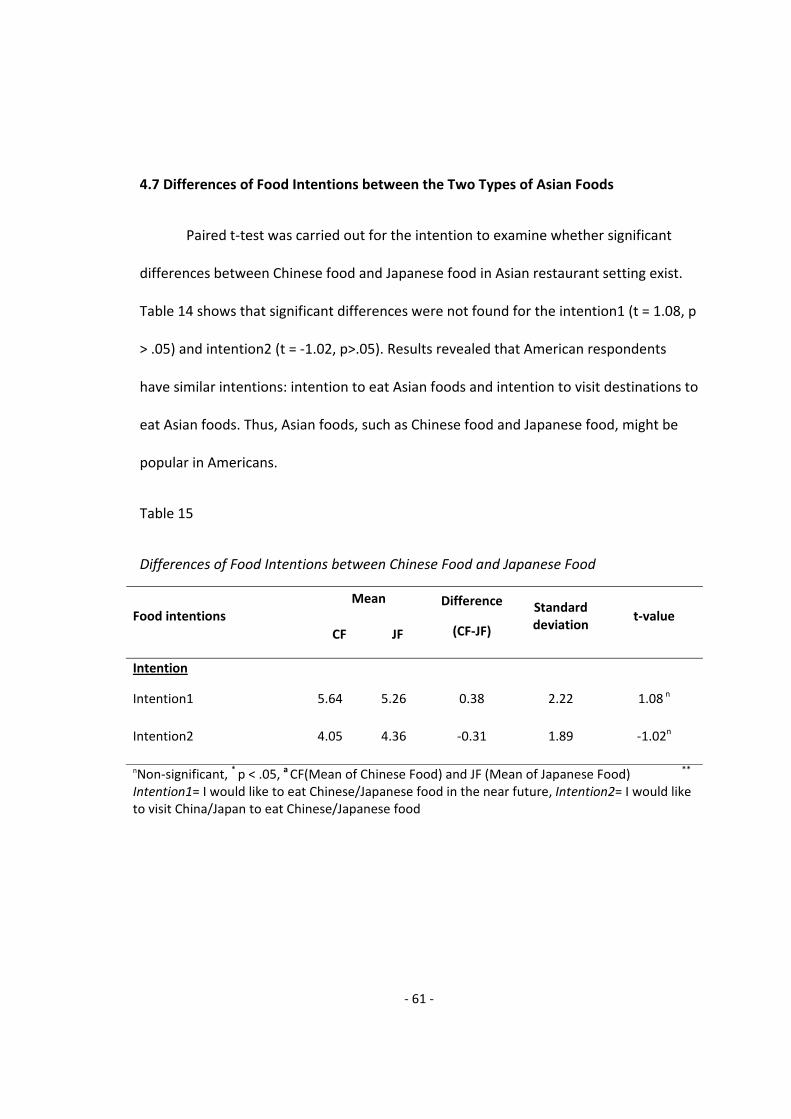
‐ 61 ‐
4.7 Differences of Food Intentions between the Two Types of Asian Foods
Paired t‐test was carried out for the intention to examine whether significant
differences between Chinese food and Japanese food in Asian restaurant setting exist.
Table 14 shows that significant differences were not found for the intention1 (t = 1.08, p
> .05) and intention2 (t = ‐1.02, p>.05). Results revealed that American respondents
have similar intentions: intention to eat Asian foods and intention to visit destinations to
eat Asian foods. Thus, Asian foods, such as Chinese food and Japanese food, might be
popular in Americans.
Table 15
Differences of Food Intentions between Chinese Food and Japanese Food
Mean Food intentions
CF JF
Difference
(CF‐JF)
Standard deviation
t‐value
Intention
Intention1 5.64 5.26 0.38 2.22 1.08 n
Intention2 4.05 4.36 ‐0.31 1.89 ‐1.02n
nNon‐significant, * p < .05, a CF(Mean of Chinese Food) and JF (Mean of Japanese Food) ** Intention1= I would like to eat Chinese/Japanese food in the near future, Intention2= I would like to visit China/Japan to eat Chinese/Japanese food

‐ 62 ‐
4.8 Influential Factors toward Explicit and Implicit Attitudes
Table 16 shows the influential antecedents of perceived food attitudes on
explicit and implicit attitudes in two Asian foods, a series of regression analyses were
conducted to examine the impacts of perceived food attributes on explicit attitudes and
implicit attitudes in both Chinese food and Japanese food. In regard with the influential
factors in predicting the explicit attitudes, the results of regression analysis in Chinese
food are statistically significant at .01 level (R2=.425, F=6.274, df=4, sig.=.001).
Moreover, it appears that “health” (β:.385, t:2.618) and “popularity” (β:. .913, t: 2.616)
have positive impacts on explicit attitudes. In case of the Japanese food, the results are
statistically significant at .01 level (R2=.601, F=12.798, df=4, sig.=000), and only
“health”(β:. 625, t: 4.791) has positive impacts on explicit attitudes out of four factors
(See table 5). In terms of the results of the influential factors on implicit attitudes
(Reaction time), it was observed that the dimension of attractiveness has marginally
positive impacts on implicit attitudes (β:. .350, t: 2.022). (R2=.164, F=1.666, df=4,
sig.=.181). The result in Chinese food was also not statistically significant at .05 level
(R2=.183, F=1.904, df=4, sig.=.132)..

‐ 63 ‐
Table 16
The Influential Factors in Predicting Explicit and Implicit Attitudes
Chinese food Japanese food Dependent Independent
B T R2 B T R2
Attractiveness .071 0.488 .311 1.982
Taste ‐.112 ‐0.806 ‐.061 ‐.427
Health .385 2.618* .625 4.791* Explicit Attitudes
Popularity .391 2.616*
.425
‐.057 ‐.404
.601
Attractiveness .350 2.022* .373 1.641
Taste .185 1.115 .160 .772
Health ‐.203 ‐1.160 ‐.315 ‐1.670
Implicit Attitudes
Popularity .082 .459
.183
‐.099 ‐.481
.164
N=39, *p<0.05
4.9 Correlation Matrix among Variables in Asian Foods
4.9.1 Results of Correlations among Variables in Chinese Food
Tables 17 and 18 provide the correlation matrix for all of the variables in Chinese
food and Japanese food. Given that one of the assumptions for the Pearson measure of
correlation is normality, the Spearman rank correlation was used to measure the
correlation between these dimensions.
The results of correlation among variables in Chinese food reveal that Dm1 is
positively and significantly correlated with Dim3 (R=.40, p<.05), Dim4 (R=.31, p<.01), and
EA (R=.33, p<.05). Taste has significantly positive correlation with Dim4 (R=.33, p<.05). In
addition, Dim3 has positive correlation with Dim4 (R=.33, p<.05), EA (R=.54, p<.01). Dim4

‐ 64 ‐
is positively and significantly correlated with EA(R=.50, p<.01), Intention1(R=.45, p<.01)
and Intention2(R=.45, p<.01). In terms of the EA, it is positively and significantly related
to Intention1(R=.72, p<.01) and Intention2(R=.50, p<.01). In regard with intentions,
intention1 has positive correlation with Intention2(R=.59, p<.01).
Table 17
Correlation Matrix among Variables in Chinese Food
Variablesa Dim1 Dim2 Dim3 Dim4 EA IA Int.1 Int.2
Dim1 1.00
Dim2 .14 1.00
Dim3 .40* . 04 1.00
Dim4 .31** .33* .33* 1.00
EA .33** .03 .54** .50** 1.00
IA .25 .09 ‐.05 .15 .05 1.00
Intention1 .15 ‐.02 .30 .45** .72** ‐.01 1.00
Intention2 .18 .11 .10 .45** .50** .10 .59** 1.00
*p<0.05, **p<0.01,
Note: Dim1(Attractiveness); Dim2(Taste); Dim3(Health); Dim4(Popularity), and intentions (intention1: willingness of
eating Asian food; intention2: willingness of visit to a destination to eat food)
4.9.2. Results of Correlations among Variables in Japanese Food
The results of correlation among variables in Japanese food reveal that Dim1 is
positively and significantly correlated with Dim2 (R=.61, p<.01), Dim3(R=.52, p<.01),
Dim4 (R=.57, p<.01), EA (R=.57, p<.01), IA (R=.39, p<.05), and Intention1 (R=.52, p<.01).
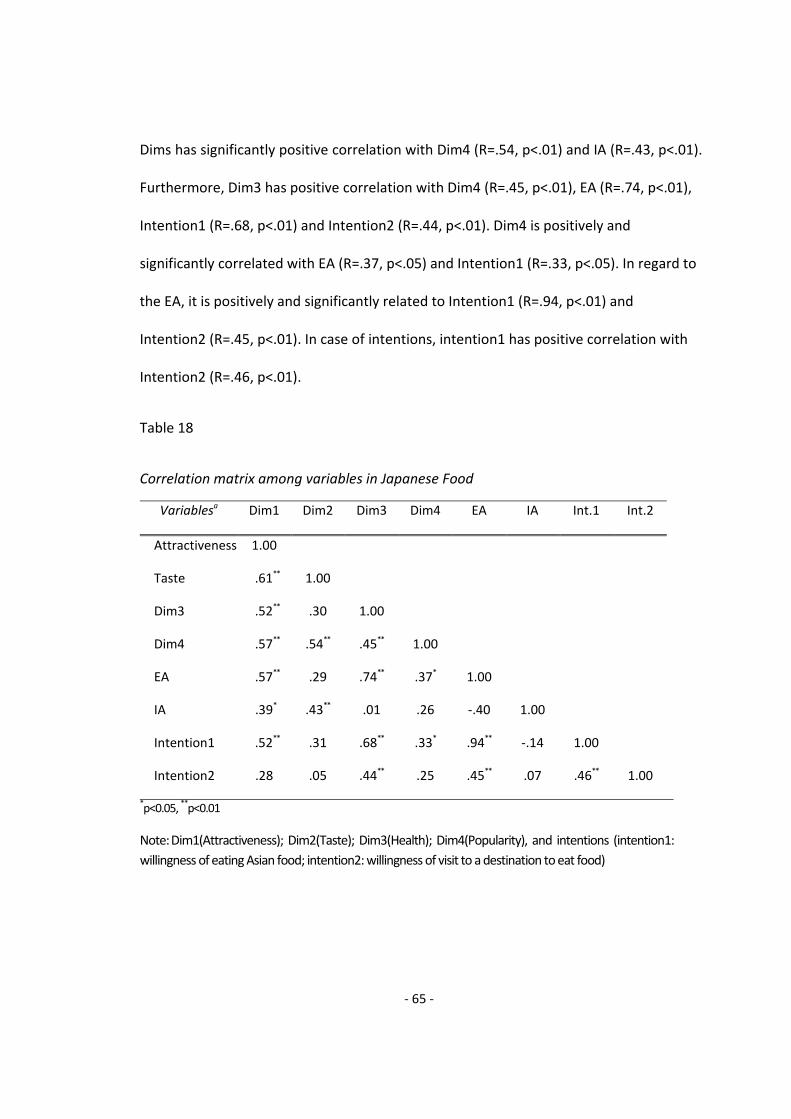
‐ 65 ‐
Dims has significantly positive correlation with Dim4 (R=.54, p<.01) and IA (R=.43, p<.01).
Furthermore, Dim3 has positive correlation with Dim4 (R=.45, p<.01), EA (R=.74, p<.01),
Intention1 (R=.68, p<.01) and Intention2 (R=.44, p<.01). Dim4 is positively and
significantly correlated with EA (R=.37, p<.05) and Intention1 (R=.33, p<.05). In regard to
the EA, it is positively and significantly related to Intention1 (R=.94, p<.01) and
Intention2 (R=.45, p<.01). In case of intentions, intention1 has positive correlation with
Intention2 (R=.46, p<.01).
Table 18
Correlation matrix among variables in Japanese Food
Variablesa Dim1 Dim2 Dim3 Dim4 EA IA Int.1 Int.2
Attractiveness 1.00
Taste .61** 1.00
Dim3 .52** .30 1.00
Dim4 .57** .54** .45** 1.00
EA .57** .29 .74** .37* 1.00
IA .39* .43** .01 .26 ‐.40 1.00
Intention1 .52** .31 .68** .33* .94** ‐.14 1.00
Intention2 .28 .05 .44** .25 .45** .07 .46** 1.00
*p<0.05, **p<0.01
Note: Dim1(Attractiveness); Dim2(Taste); Dim3(Health); Dim4(Popularity), and intentions (intention1:
willingness of eating Asian food; intention2: willingness of visit to a destination to eat food)

‐ 66 ‐
4.10 Measures of Implicit Attitudes
Implicit attitude was assessed by comparing the reaction time difference in
response to combined categories between two conditions. For instance, if a
participant’s reaction time is shorter in a condition with a combined category as
“Chinese food Or Appealing” (along with the other category “Japanese food Or
Unappealing) than in another condition with a combined category as “Chinese food Or
Unappealing” (along with the other category “Japanese food Or Appealing”), people had
stronger implicit preference toward Chinese food over England and vice verse. Data
clarification followed a three‐step procedure. (1) Outlying reaction time (RT) data in the
category discrimination tasks are conventionally defined as those below 300 ms and
above 3000 ms and they are recoded to 300 ms and 3000 ms, respectively, (2) logarithm
transformation of reaction times (denoted as Log (RT)) was employed for the
convenience of data processing and fulfillment of the assumptions in this study, and (3)
RT data from error trials were excluded from the analysis because these data did not
reflect the strength of association between target concepts and evaluative attributes
measured by reaction time.
In order to check learning/familiarity effects, half of the participants took 1‐2‐3‐
4‐5 order, and the other half took 1‐2‐5‐4‐3. The results showed that both orders are
not significantly different. This indicated that there are no learning/familiarity effects
between the two orders. The descriptive statistics of response time data for the implicit
measures across five blocks are reported in Table 19.

‐ 67 ‐
Table 19
The Summary of Log Reaction Time in Five Blocks
Subject Block ID Na Meanb Minimum Maximum Std.Dev.
Block 1 39 2.89 2.60 3.14 0.10
Block 2 39 3.01 2.68 3.29 0.14
Block 3 39 2.95 2.41 3.20 0.12
Block 4 39 3.00 2.77 3.26 0.11
American
Block 5 39 3.02 2.63 3.29 0.15
Note: a19 participants took 1‐2‐3‐4‐5 order, and 20 participants took 1‐2‐5‐4‐3, in order to check
learning/familiarity effects, and both orders are not significantly different in Black 3
(t=.850, p> .05) and Black 5 (t=‐.761, p>.05) (no learning/familiarity effects).
b The mean value of LogRt was 2.97 (Black3) and 2.94 (Black5) in 19 participants, and 3.00
(Black3) and 3.03 (Black5) in 20 participants.
4.11 Differences of Implicit Attitude between Chinese and Japanese Food
Figure 8 shows the difference of implicit attitudes between Chinese food and
Japanese food. The result reveals that there is statistically significant mean difference of
implicit attitude between Chinese food and Japanese food at .05 level. Specifically,
respondents have more positive attitudes toward Japanese food (Log(RT) mean= 2.954)
compared to Chinese food (Log(RT) mean= 3.017), SD=0.109 and p<.05.

‐ 68 ‐
Figure 8. Mean Difference (Log(RT)) of Implicit Attitude between Chinese Food and
Japanese Food
4.12 Results of Univariate Analysis of Variance (ANOVA)
All dependent measures were submitted to 2 x 2 analyses of variance with ethnic
foods (Chinese food versus Japanese food) and antecedent dimensions including
“Perceived food attributes (PFA)” as the independent variables. In terms of the
independent variables, Perceived food attributes (PFA) was coded as the categorically
“high (1)” and “low (0)” levels on the basis of the summated mean values of each
dimension.
4.12.1 The Types of Asian Foods and Perceived Food Attributes on Explicit Attitude
The explicit attitude data was submitted to a 2 x 2 ANOVA with the types of
Asian foods (i.e., Chinese food and Japanese food) and perceived food attributes (PFAs)
as the independent variables. In terms of the ethnicity foods and PFA on explicit attitude,
the results show that there was significant main effect for the type of ethnic food (i.e.,
American versus Chinese), F(1, 78)= 5.635, p<.05. There was also a main effect of

‐ 69 ‐
perceived food attributes, F(1, 78)= 14.855, p>.01. In terms of effect of interaction,
there was an expected interaction, F(1, 78)= 4.047, p<.05, indicating that the effect of
ethnic food on explicit attitude was greater in high [Chinese food: Mean (Std.
Deviation)= 6.17 (1.31); Japanese food: Mean (Std. Deviation)= 6.06(1.35), rather than
low [Chinese food: Mean(Std. Deviation)= 5.58(.0.81); Japanese food: Mean (Std.
Deviation)=4.19(2.03)] perceived food attributes (PFAs) condition.
Table 20 Results of Interaction effects between EF and PFAs on EA
Source a df Mean Square F P
EF 1 10.282 5.635 .020*
PFA 1 27.104 14.855 .000*
EF X PFA 1 7.385 4.047 .048*
Ethnic Food (No) Mean Std. Deviation
Chinese food High PFA (14) 6.17 1.31
Low PFA (25) 5.58 0.81
Japanese food High PFA (25) 6.06 1.35
Low PFA (14) 4.19 2.03

‐ 70 ‐
*p<0.05 a EF= Ethnic food and PFA= Perceived food attributes
R Squared = .219 (Adjusted R Squared = .187)
Note: PFA= Perceived Food Attributes Figure 9. The Explicit Index influenced by Ethnic Food and PFAs
4.12.2 The Types of Asian Foods and Perceived Food Attributes on Implicit Attitude
We also analyzed the implicit attitude (IM) index influenced by using the type of
ethnic food (EF) and perceived food attributes (PFA) as independence variables (Figure
10). Regarding the effect of ethnic food and PFA on implicit attitude, this analysis
revealed the expected main effect for a type of ethnic food (Chinese food and Japanese
food), F(1,78)= 4.493, p<.05, but there was not effect of perceived food attributes (PFA),
F(1, 78)= .826, p>.05. In addition, it was observed that there was no a type of ethnic
food x PFA interaction, F(1, 78)= .247, p>.05.
Table 21

‐ 71 ‐
Results of Interaction effects between EF and PFAs on IA
Source a df Mean Square F P
EF 1 429095.22 4.493 .037*
PFA 1 78917.71 .826 .366
EF X PFA 1 23628.24 .247 .620
Ethnic Food (No) Mean Std. Deviation
Chinese food High PFA (14) 948.96 229.19
Low PFA (25) 918.56 208.19
Japanese food High PFA (25) 1142.20 370.27
Low PFA (14) 1027.28 390.38
*p<0.05 a EF=
Ethnic food and PFA= Perceived food attributes
R Squared = .092 (Adjusted R Squared = .054)
Note: PFA= Perceived Food Attributes
Figure 10. The Implicit Index influenced by Ethnic Food and PFAs

‐ 72 ‐
CHAPTER 5
DISCUSSION AND CONCLUSIONS
5.1 Introduction
This chapter includes the discussion about the findings, implications, and
limitations of the study. The first section presents the summary of the study. The second
section summarizes the results of each hypothesis. The third section of this chapter
presents the general implications suggested by the findings of the study. The fourth
section addresses the limitations of the study. Finally, the last section of this study
presents several recommendations for future study.
5.2 Summary of the Study.
This study examined the differences of all prominent concepts used in this study
between two Asian foods (Chinese food and Japanese food), including perceived food
attributes (PFAs), explicit and implicit attitudes, and food intentions on Asian foods. The
primary purpose of this study was to focus on measuring people’s intrinsic feelings and
thoughts on the Asian foods by applying psychological methodology. Moreover,
influential factors on food attitudes and interaction between the types of Asian foods
(Chinese and Japanese food) and PFAs on attitudes were examined in this study.
There were four main goals in this study. The first goal was to examine the
differences of perception on Asian foods (Chinese and Japanese food) in terms of PCFs,
explicit attitudes (measure of the self‐report method), implicit attitude (reaction time),
and food intentions on each ethnic food (Chinese food and Japanese food). This study

‐ 73 ‐
focused more on identifying the difference of explicit and implicit attitudes between
Chinese food and Japanese food in Americans by employing psychological methodology.
In spite of the fact that participants (Caucasians) have a positive perception on PFAs of
Chinese food as compared to Japanese food, the results of the differences of perception
between the two Asian foods in the implicit attitude indicate that Chinese food would
be more appealing one than Japanese food in satisfaction level of Asian food attributes.
Thus, it appears that even though Americans are well aware of the importance of food
attributes in maintaining better health, actual preference on Asian food differs in terms
of the implicit attitude, but not explicit attitude.
The second goal was to find the influential determinants on PFAs. In order to
examine the antecedents on attitudes, four dimensions (attractiveness, taste, health,
and popularity) were found by factor analysis in PFAs. First of all, it was assumed that
PFAs had positive impacts on the explicit attitude measured by a self‐reported survey.
The results showed that the two dimensions of tastes and popularity out of four
dimensions were influential factors toward the explicit attitude, indicating the positive
change of external attitudes would be significantly determined by attributes of the taste
and the popularity in Chinese food service. Whereas, only a dimension of health has a
positive impact on explicit attitudes out of four factors in Japanese food service. That is,
participants (Caucasian) had the different perception on PFAs in predicting explicit
attitudes of each ethnic food (e.g., Chinese food vs. Japanese food) (Jang, Ha, and Silkes,
2009). In terms of the perception of PFAs on implicit attitudes, the implicit attitude
varied depending on only the dimension of food attractiveness in Chinese food, but not

‐ 74 ‐
in Japanese food. This indicated that the change of implicit attitude was not determined
by PFAs. With the understanding of the results of influential factors on attitudes in both
Chinese and Japanese foods, it was assumed that external attributes did not influence
on implicit attitudes in food service settings.
The third goal was to examine the correlation among PFAs, explicit and implicit
attitudes, intention to eat Asian foods, and intention to visit destinations. In the
hospitality and tourism industry, food marketing is a critical part of the successful
operation of food restaurants (Hastings et al., 2003; Livingstone and Helsper, 2004). In
order to predict the potential customers to visit actual restaurants and destinations in
marketing of food services, it is important for industrial practitioners to understand the
relationship among the theoretically prominent concepts into operation. The primary
results of the relationships of the concepts used in this study showed that the four
dimensions of PFAs were mostly positively related, with explicit attitude and the two
food intentions in both Chinese food and Japanese food. When considering the results
of the relationship among the salient concepts, it was recommended that an application
of the model suggested in this study would be effective for industrial practitioners in the
hospitality and tourism marketing.
The fourth goal was to examine the interaction effects between the types of
Asian foods (Chinese food vs. Japanese food) and PFAs (high vs. low) on attitudes
(explicit and implicit attitudes). Many research in social psychology have focused on the
issues of dual complexity attitude measures (DeCoster, Banner, Smith, & Semin, 2006;

‐ 75 ‐
Wilson, Lindsey, & Schooler, 2000) due to ambivalence in making choices between
certain options. It indicated that attitudes would be changed depending on various
different features of objects. In this sense, the results of interaction effects between the
types of the two Asian foods and PFAs on explicit and implicit attitude showed that the
significant interaction effects were found in explicit attitude, but not in implicit attitude.
Based on the above results, it appeared that external (explicit) attitudes would be
changed by perception of PFAs and/or the types of Asian foods in new experience or
knowledge on the foods. In other words, the change of explicit attitudes could be more
flexible than implicit attitudes in the sense that the image would be formed by much
virtual and/or actual experience toward certain products (food or destination) in
peoples’ intrinsic minds.
5.3 Discussion of Findings of the Study
Hypothesis 1. There will be mean differences of perceived food attributes (PFAs)
between Chinese food and Japanese food (Supported).
Hypothesis 1 of this study sought to examine the mean differences of PFAs
between Chinese food and Japanese food. Results indicated that mean values of most
attributes were found to be higher in the Japanese food than in the Chinese food in
terms of food attributes of exotic, colorful, nutritious, dietetic, healthy, nourishing,
unique, fresh, cultural, authentic, neat, attractive, and clean. Whereas, food attributes
of aromatic, delicious, tasty, edible, and digestible were more significantly and positively

‐ 76 ‐
evaluated in Japanese food as compared to Chinese food. The results were consistent
with a study by Jang et al. (2009), focusing on differences of the perception in
satisfaction and performance within the context of various Asian foods. The
understanding of consumer’s perception on food attributes would be effectively
employed in order to gain insight into consumer needs and wants in a competitive
hospitality and tourism marketing (Jang et al., 2009). Thus, a better understanding of
the results of this study allows marketers to achieve differentiated marketing strategies
in a competitive advantage, leading to higher satisfaction.
Hypothesis 2.1. There will be mean difference of explicit attitudes between the two
Asian foods (Chinese food and Japanese food)
Hypothesis 2.1 was not supported by paired‐t test of current data. Results of the
difference of explicit attitudes between the two Asian foods (Chinese food and Japanese
food) showed that no significant mean differences were found in terms of the explicit
attitude. The results might be consistent with a study by LaPiere (1934) which indicates
that even though people have negative attitudes toward a certain object, they do not
evaluate an object in measuring explicit attitude such as by self‐report method.
Hypothesis 2.2. There will be mean difference of implicit attitudes between the two
Asian foods (Chinese food and Japanese food)

‐ 77 ‐
Hypothesis 2.2 was supported by current data. The results showed that there
was a statistically significant mean difference of the implicit attitude between Chinese
food and Japanese food. This study focused primarily on whether significant mean
differences of the explicit attitude between the two Asian foods exist and whether
significant mean differences of the implicit attitudes between the two Asian foods were
found in this study. Results indicated that explicit attitudes which reveal the results of
no significant mean differences were inconsistent with the implicit attitudes found in
statistically significant mean differences. When considering the features of measures of
the implicit attitude in predicting peoples’ intrinsic minds (Greenwald & Banaji 1995, De
Houwer, 2006), the better understanding of implicit attitudes might admit new
paradigms to uncover intrinsic attitudes on an object in the hospitality and tourism
industry.
Hypotheses 3.1 and 3.2. There will be mean differences of intention to eat Asian foods
and visit Asian destination in terms of Chinese food and Japanese food.
Hypotheses 3.1 and 3.2 were not supported by current data. No significant
differences of both intention to eat Asian foods and intention to visit each Asian
destination between the two Asian foods were found in this study. In spite of the fact
that there were significant mean differences of PFAs, which indicated that respondents
had different perception of PFAs between Chinese food and Japanese food, the two
intentions on Asian foods were almost similarly evaluated by respondents between

‐ 78 ‐
Chinese food and Japanese food. This revealed the limitations of a study which focused
on differences of intention in an evaluation of food services.
Hypothesis 4.1 PFAs have a positive impact on explicit attitudes
Hypothesis 4.1 was partially supported by current data. The positive relationship
between attributes and attitudes has been examined in many hospitality and tourism
studies. Despite the importance of a study which examines the influential antecedents
of PFAS, there is a lack of research focused on the relationships between PFAs and
attitudes. Thus, this study attempted to find the determinants on explicit attitudes. The
result revealed that the two determinants of tastes and popularity had positive impacts
on explicit attitude in perception of Chinese food, whereas a food attribute of health
had a positive impact on explicit attitudes in perception of Japanese food. The results
implied that participants (Caucasian) had different perceptions on PFAs in terms of
explicit attitudes of each ethnic food (Chinese food vs. Japanese food) (Jang et al., 2009).
In hospitality and tourism marketing, it is recommended that food information should
be provided to improve awareness of Asian foods.
Hypothesis 4.2 PFAs have a positive impact on implicit attitudes
Hypothesis 4.2 was partially supported by current data. CFAs had an only
marginally positive impact on the implicit attitude measured by reaction time in

‐ 79 ‐
psychological methodology. Implicit attitudes have been regarded as a critical issue in
psychological research in order to examine the peoples’ intrinsic feelings and thoughts
(Greenwald, McGhee, & Schwartz, 1998; Fazio & Olson, 2003). This indicated that the
individuals’ intrinsic feelings and mindsets could not be changed by external food
attributes such as PFAs in food service industry.
Hypothesis 5.1 to 5.8. There will be correlations among perceived food attributes (PFAs),
explicit attitude (EA), implicit attitude (IA), and intentions on Asian Foods.
Hypotheses 5.1 to 5.8 regarding the correlation among PFAs, EA, IA, and the two
intentions on Asian Foods were partially supported. The results showed that PFAs which
include the dimensions of tasty, health, and popularity are positively correlated with EA
and the two intentions (intention to eat Asian foods and to visit destinations to eat
Asian foods). In terms of EA, it has a positive correlation with the two intentions. More
specifically, a dimension of PFAs is positively correlated with the two intentions (i.e.,
intention to eat Asian foods and to visit destinations to eat Asian foods).
Hypotheses 6.1 and 6.2. There will be interaction effects between PFA and the types of
Asian foods (Chinese food and Japanese food) on explicit attitude.
Hypotheses 6.1 and 6.2 regarding the interaction effects between the types of
the two Asian foods and PFAs on the explicit and implicit attitude were partially

‐ 80 ‐
supported. The results of interaction effects between the types of the two Asian foods
and PFAs on explicit and implicit attitude revealed that there were the significant
interaction effects between the types of the two Asian foods and PFAs on explicit
attitude, but not in implicit attitude. With better understanding of the results of
interaction effects among factors in this study, it seemed that the extrinsic attitudes
would be influenced by perception of PFAs and/or the types of Asian foods in formation
of new knowledge (information) on the foods. That is, it is assumed that the implicit
attitudes would be fixable, whereas the explicit attitudes would be more flexible than
implicit attitudes. The significant results of this study should be reflected to make
marketing strategies in the hospitality and tourism industry.

‐ 81 ‐
Table 22
Summary of Hypotheses Test
Hypothesis Contents Supported
H1 There will be mean differences of perceived food attributes between
Chinese food and Japanese food Yesa
H2 There will be mean difference of explicit and implicit attitudes between the
two Asian foods (i.e., Chinese food and Japanese food)
H2.1 There will be mean difference of explicit attitudes between the two Asian
foods (i.e., Chinese food and Japanese food) No
H2.2 There will be mean difference of implicit attitudes between the two Asian
foods (i.e., Chinese food and Japanese food) Yes
H3 There will be mean differences of intentions between Chinese food and
Japanese food
H3.1 There will be mean differences of intention to eat Asian foods between
Chinese food and Japanese food No
H3.1 There will be mean differences of intention to eat Asian foods between
Chinese food and Japanese food No
H4 PFAs have a positive impact on explicit and implicit attitudes in Both Chinese
food and Japanese food
H4.1.1 PFAs have a positive impact on explicit attitudes in Chinese food Yesa
H4.1.2 PFAs have a positive impact on implicit attitudes in Japanese food Yesa
H4.2.1 PFAs have a positive impact on explicit attitudes in Chinese food Yesa
H4.2.1 PFAs have a positive impact on implicit attitudes in Japanese food No
H5
There will be correlations among perceived food attributes (PFA), explicit
attitude (EA), implicit attitude (IA), intention to eat Asian foods (IEAF), and
intention to visit destinations to eat Asian foods (IVDEAF)
H5.1.1 PFA will be positively related to EA in Chinese food Yesa
H5.1.2 PFA will be positively related to EA in Japanese food Yesa
H5.2.1 PFA will be negatively related to IA in Chinese food No
H5.2.2 PFA will be negatively related to IA in Japanese food No

‐ 82 ‐
H5.3.1 PFA will be positively related to IEAF in Chinese food Yesa
H5.3.2 PFA will be positively related to IEAF in Japanese food Yesa
H5.4.1 PFA will be positively related to IVDEAF in Chinese food Yesa
H5.4.2 PFA will be positively related to IVDEAF in Japanese food Yesa
H5.5.1 EA will be negatively related to IA in Chinese food No
H5.5.2 EA will be negatively related to IA in Japanese food No
H5.6.1 EA will be positively related to IEAF in Chinese food Yes
H5.6.2 EA will be positively related to IEAF in Japanese food Yes
H5.7.1 EA will be positively related to IVDEAF in Chinese food Yes
H5.7.2 EA will be positively related to IVDEAF in Japanese food Yes
H6 There will be interaction effects between PFA and the types of Asian foods
(i.e., Chinese food and Japanese food) on explicit and implicit attitudes
H6.1 There will be interaction effects between PFA and the types of Asian foods
on explicit attitude Yes
H6.2 There will be interaction effects between PFA and the types of Asian foods
on implicit attitude No
Yesa= Partially supported
5.4 Theoretical and Practical Implications
The main purpose of the study was to examine whether or not there were
differences of perceived food attributes (PFAs), explicit attitudes, implicit attitudes, and
the two intentions (intention to eat Asian foods and to visit a destination to eat Asian
foods) between Chinese food and Japanese food in Americans. Its second purpose was
to find the influential factors on explicit and implicit attitudes. The third purpose was to
examine the interaction effects between the two types of Asian foods (Chinese vs.

‐ 83 ‐
Japanese food) and the perception of PFAs (high vs. low) on explicit and implicit
attitudes. Base on the results of this study, several theoretical and practical implications
were discussed in the hospitality and tourism marketing.
In regard to the theoretical implications in this study, the research model used in
this study would be effective in predicting customers’ behavior, in particular in the food
service industry and destination marketing. Specifically, measures of implicit attitudes
were applied to examine the individuals’ (Caucasians) real intrinsic feelings and thoughts
on Asian foods in psychological methodology. The understanding of the concept of
implicit attitudes is important to apply it to the future studies focusing on measuring on
individual’s intrinsic attitudes in the hospitality and tourism sector. A variety of the
attitude measures that are related to ambivalent feeling are not clear in a traditional
method such as by self reported survey. Thus, Implicit Association Test (IAT), one of the
some alternative approaches to the attitudes, can be efficiently used and readily
adopted for better understanding of tourist psychology. Furthermore, the utility of IAT
method help to uncover implicit and explicit attitudes simultaneously. With this
usefulness of IAT, it seems to be possible to identify implicit and explicit feelings and
thoughts by selecting appropriate tourism research topics in certain issues.
This study also suggests practical implications. In order to improve customer
perceptions of PFAs while raising awareness, industrial practitioners in Asian food
services need to make efforts at individual levels. Asian food marketers should consider
ways of creating a positive, unique image of their foods for American customers by

‐ 84 ‐
employing distinctively significant food attributes of their foods in various Asian food
contexts. More specifically, the marketers could build their appealing food attributes
(image) to attract potential customers to visit a certain Asian restaurant compared to
other ethnic restaurants and/or other Asian restaurants. Furthermore, it is
recommended that food information should be provided to improve awareness of Asian
foods. Consequently, the results found that industrial practitioners should focus on
individual’s awareness of Asian foods and the importance of PFAs in the hospitality and
tourism marketing.
5.5 Limitations of the Study and Recommendation for Future Study
In spite of the fact that the findings of this study have potential limitations,
several limitations exist. In this study, college student participants are not
representative of the whole food consumers. Thus, future studies are needed to
determine whether these findings can be replicated in other non‐student populations.
Another possible limitation is this study’s small sample size in using both an experiment
(N=39) and survey questionnaire (N=84), simultaneously. Even though the sample size
for an experiment meets the minimum requirement, the sample size for survey
questionnaire does not meet the minimum requirement for a simultaneous mulitiple
regression and analysis of variance (ANOVA). This study also selected only two Asian
foods for research participants’ evaluation due to the inability to control respondents’
familiarity with the various types of Asian foods. Regarding this, future researchers

‐ 85 ‐
should consider diverse Asian foods in order to generalize the research framework. In
addition, this study examined the relationships among the salient constructs on PFAs,
explicit and implicit attitudes, food intentions in the two foods by using multiple
regression analyses and correlation analysis. In terms of little empirical research which
focuses on examining the determinants of the explicit and implicit attitudes in
perception of Asian foods, it will be possible for future research to do similar studies
considering PFAs, explicit attitudes, and implicit attitudes to validate the results of this
study in the hospitality and tourism research.

‐ 86 ‐
APPENDIX A
Approval of Institutional Review Board
Your human subject research project entitled A study of "Perceived Food Attributes, Attitudes, and Intention" on Asian Foods (i.e., Chinese and Japanese foods). meets the criteria for EXEMPT APPROVAL and will expire on March 12, 2011. Your approval will be contingent upon your agreement to annually submit the "Annual Exempt Research Certification" form to maintain current IRB approval.
You must submit the Annual Exempt Research Certification form 30 days prior to the expiration date. Failure to timely submit the certification form by the deadline will result in automatic expiration of IRB approval.
Study Changes: If you wish to revise your exempt project, you must complete the Exempt Amendment Form for review.
Please be aware that all human subject research activities must receive prior approval by the IRB prior to initiation, regardless of the review level status. If you have any questions regarding the IRB process, do not hesitate to contact the Campus IRB office at (573) 882-9585.
Campus Institutional Review Board

‐ 87 ‐
APPENDIX B
Consent Form
You are invited to participate in a study investigating travelers’ feeling and opinions about two countries, China and England. As a major part of the research, this study is designed to better understand customer reactions to destination image. Your participation in this study is VOLUNTARY and you can withdraw at any time. For those who do not want to participate in the study or feel uncomfortable with the study, there will be other alternative assignments that give exactly same bonus points. Those who choose one of alternative assignments will be asked to turn in the one page short answer for the definition of the marketing term which they choose. As the alternative assignment, five marketing terms will be provided, and students will be expected to choose one of them. The amount of time for the both study participation and assignment will be virtually equal. I would like to ensure that there will be no other effects on the grade of participating or choosing a different extra credit assignment no matter what extra credit assignment the student choose.
This study is strictly for research purposes only. The information you provide will be kept CONFIDENTIAL and will NOT be disclosed. For absolute ANONYMITY the questionnaire has no ID number/identifier so your participation cannot be identified. No reference will be made in written or oral materials that could link you to this study. All records will be stored in a locked facility at University of Missouri for at most 3 years after completion of the study. After the storage time the information gathered will be destroyed.
Survey process is as below:
You will sit in the computer table and answer a series of questions in the computer monitor
The study will take about 15 minutes to complete. Your decision whether or not to participate will not prejudice your future relations with the University of Missouri. If you decide to participate, you are free to withdraw and discontinue participation at any given time without prejudice. If you have any questions at any time, please do not hesitate to contact study coordinator, Kwangho Lee at e-mail: [email protected], 111 Eckles Hall. This project has received approval by the University of Missouri-Columbia Campus Institutional Review Board (IRB) for Human Subjects. If you have further questions, you may contact the Campus IRB Compliance Office at 483 McReynolds Hall, tel: 882-9585.

‐ 88 ‐
Please indicate your agreement to participate in this study by signing this consent form on the following page. Your signature indicates that you have thoroughly read and understood the information provided and that you have agreed to participate. You may withdraw at any time without prejudice after signing this form if you choose to do so. You will be given a copy of this form to keep for your records. Thank you for your participation!
Name: ________________________________
Signature: ________________________ Date: _________________________
Principal Investigator: _Kwangho Lee_ Signature:_____________________

‐ 89 ‐
APPENDIX C
A
Figure 1. Illustration of IAT in Computer Monitor
Note:
*The position of two foods in Task 1 is reversed in Task 4.
**The association of “Chinese food or Unappealing, and “Japanese food or Appealing in Task 3 is
reversed in Task 5.
*** The half of participants took 1‐2‐3‐4‐5 order, and the half took 1‐2‐5‐4‐3, in order to check
learning/familiarity effects, and both orders are not significantly different (no
learning/familiarity effects).
Chinese Food Japanese Food
Stimulus Photos
Task 1 and 4*
Appealing Unappealing
Stimulus Words
Task 2
Chinese food
or
Unappealing
Japanese
or
Appealing
Stimulus Photos
or
Stimulus Words
Task 1 and 4*
Task 2
Task 3 and 5**

‐ 90 ‐
APPENDIX D
Questionnaire for Food Attributes
I.D:_______________
Thank you for your participation in advance! The goal of this study is designed to understand “Perceived Food Attributes, Attitudes, and Intention” of Asian Foods (i.e., Chinese and Japanese foods). Please answer carefully about following questions.
A. Individual Characteristics
How frequently do you visit Asian restaurants?
Not more than once a year 2 to 4 times per year Once a month 2 to 4 times per month 5 or more times per month
Who usually accompanies you to visit Asian restaurants ? (Please check one)
Family/relatives Friends Business associates Alone
Which information sources did you use to obtain information about Asian foods ? (Please check ALL that apply)
Relatives/colleagues/friends Internet Food guidebooks TV/radio Newspaper/magazine Asian Restaurants Other (Specify)_______
How many Chinese and Japanese restaurants have you visited in the last month ? Chinese restaurants: (______) times, Japanese restaurants: (_______) times
When do you usually dine out for Asian food? (Please check one) Lunch Diner Other (Specify)________
How much do you usually spend per person when you dine out at Asian restaurants? (Exclude Tip)
6-1. Chinese food: Lunch:_________ dollar, Diner:_________dollar
6-2. Japanese food: Lunch:________ dollar, Diner:_________dollar
How much do you usually spend per person for tips at Asian restaurants? (Please write down % based on total payment)
7-1. Lunch:________ %, Diner:_________ %
Have ever visited China or Japan ? China: Yes (____times) No Japan: Yes (___ times) No

‐ 91 ‐
B. Perceived Food Attributes on Asia Food
▣ The following questions ask you about your feelings regarding “Perceived Attributes”
on Chinese Food. Please rate from 1 to 7, with 1 “Strongly disagree” and 7 “Strongly
agree”
Food Attributes ------------------------------ Strongly -------------------Neutral ----------------------->Strongly disagree agree
Exotic ------------------------------
Abundant ------------------------------
Colorful ------------------------------
Aromatic ------------------------------
Popular ------------------------------
Nutritious ------------------------------
Dietetic ------------------------------
Healthy ------------------------------
Nourishing ------------------------------
Pleasing ------------------------------
Delicious ------------------------------
Tasty ------------------------------
Edible ------------------------------
Unique ------------------------------
Cultural ------------------------------
Fresh ------------------------------
Authentic ------------------------------
Neat ------------------------------
Attractive ------------------------------
Clean ------------------------------
Speedy ------------------------------
Convenience ------------------------------
Digestible ------------------------------

‐ 92 ‐
▣ The following questions ask you about your feelings regarding “Perceived Attributes”
on Japanese Food. Please rate from 1 to 7, with “1 Strongly disagree” and “7 Strongly
agree”
Food Attributes ------------------------------ Strongly -------------------Neutral ----------------------->Strongly disagree agree
Exotic ------------------------------
Abundant ------------------------------
Colorful ------------------------------
Aromatic ------------------------------
Popular ------------------------------
Nutritious ------------------------------
Dietetic ------------------------------
Healthy ------------------------------
Nourishing ------------------------------
Pleasing ------------------------------
Delicious ------------------------------
Tasty ------------------------------
Edible ------------------------------
Unique ------------------------------
Cultural ------------------------------
Fresh ------------------------------
Authentic ------------------------------
Neat ------------------------------
Attractive ------------------------------
Clean ------------------------------
Speedy ------------------------------
Convenience ------------------------------
Digestible ------------------------------

‐ 93 ‐
C.Food Attitudes on Asia Food
▣ The following questions ask you about your views regarding “Food Attitudes” on
Chinese and Japanese Food. Please rate from 1 to 7, with “1 Strongly disagree” and
“7 Strongly agree”
Food Attitudes ------------------------------ Strongly <--------------- Neutral- ------------------> Strongly disagree agree
Chinese Food
I like Chinese food very much ------------------------------
I would like to have Chinese food in the near future
------------------------------
I would like to recommend Chinese food to my close friends and relatives
------------------------------
I would like to talk about positive things of Chinese food
------------------------------
Overall, I have favorable preference about Chinese food
------------------------------
Japanese Food
I like Japanese food very much ------------------------------
I would like to have Japanese food in the near future
------------------------------
I would like to recommend Japanese food to my close friends and relatives
------------------------------
I would like to talk about positive things of Japanese food
------------------------------
Overall, I have favorable preference about Japanese food
------------------------------

‐ 94 ‐
D.Intention on Asia Food
▣ Please indicate how strongly you agree with the following statements about
“Chinese/Japanese Food”
▣ Please rate your level of knowledge about Asian foods?
▣ Please rate your level of liking about Asian foods ?
I appreciate your sincere responses to the questions included in the survey
Intention ------------------------------ Strongly <--------------- Neutral-------------------> Strongly disagree agree
After seeing the photos of each food…
I am willing to eat Chinese food in the near future
------------------------------
I am willing to eat Japanese food in the near future
------------------------------
After seeing the photos of each food…
I would like to visit China to eat Chinese Food
------------------------------
I would like to visit Japan to eat Japanese Food
------------------------------
Chinese Food: ------------------------------------------------
Do not know very well
Neutral Know very well
Japanese Food: ------------------------------------------------
Do not know very well
Neutral Know very well
Chinese Food: ------------------------------------------------
Strongly not liking
Neutral Strongly liking
Japanese Food: ------------------------------------------------
Strongly not liking
Neutral Strongly liking

‐ 95 ‐
REFERENCES
Abelson, R. P., Aronson, E., McGuire, W. J., Newcomb, T. M., Rosenberg, M. J., &
Tannenbaum, P. H. (1968). Theories of cognitive consistency: A sourcebook.
Chicago: Rand McNally.
Allport, G. W. (1935). Attitudes. In C. Murchison (Ed.), Handbook of social psychology
(pp. 798‐844). Worcester, MA: Clark University Press.
Armitage, C. J. (2003). Beyond attitudinal ambivalence: effects of belief homogeneity on
attitude‐intention‐behavior relations. European Journal of Social Psychology,
33, 551–563.
Arvola, A., Lähteenmäki, L., & Tuorila, H. (1999). Predicting the intent to purchase
unfamiliar and familiar Cheeses: The effects of attitudes, expected liking and
food neophobia. Appetite, 32 (1), 113‐126.
Asendorpf, J. B., Banse, R., & Mucke, D. (2002). Double dissociation between implicit
and explicit personality self‐concept: The case of shy behavior. Journal of
Personality and Social Psychology, 83 (2), 380‐393.
Auty, S., & Lewis, C. (2004). Exploring children’s choice: The reminder effect of product
placement. Psychology and Marketing, 21 (9), 697–714.
Backman D. R., Haddad, E. H, & Lee, J. W. (2002). Psychosocial predictors of healthful
dietary behavior in adolescents. Journal of Nutrition Education and Behavior, 34
(4), 184–193.
Bamse, R., Seise, J., & Zerbes, N. (2001). Implicit attitudes toward homosexuality:
Reliability, validity, and controllability of the IAT. Zeitschrift fur Experimentelle
Psychologie, 48, 145‐160.
Barer‐Stein, T. (1999). You eat what you are: people, culture and food traditions.
Toronto: Firefly Books.
Bessiere, J. (2001). The role of rural gastronomy in tourism. In: L. Roberts, D. Hall (Eds.),
Rural Tourism and Recreation: Principles to Practices (pp.115‐118). CABI, New
York.
Blanton, H., & Jaccard, J. (2006). Tests of multiplicative models in psychology: A case
study using the unified theory of implicit attitudes, stereotypes, self‐esteem, and
self‐concept. Psychological Review, 113 (1), 155‐166.

‐ 96 ‐
Bosson, J. K., Swann, W. B., Jr., & Pennebaker, J. W. (2000). Stalking the perfect measure
of implicit self‐esteem: The blind men and the elephant revisited? Journal of
Personality and Social Psychology, 79(4), 631‐643.
Bredahl, L., Grunert, K. G., & Frewer, L. J. (1998). Consumer attitude and decision‐
making with regard to genetically engineered food products – A review of the
literature and a presentation of model for future research. Journal of Consumer
Policy, 21 (3), 251‐277.
Brunel, F., Tietje, B., & Greenwald, A. (2004). Is the implicit association test a valid and
valuable measure of implicit consumer social cognition? Journal of Consumer
Psychology, 14 (4), 385‐404.
Cacioppo, J. T., & Berntson, G. G. (1994). Relationship between attitudes and evaluative
space: A critical review, with emphasis on the separability of positive and
negative substrates. Psychological Bulletin, 115, 401–423.
Chernin, A. (2008). The effects of food marketing on children's preferences: Testing the
moderating roles of age and gender. The ANNALS of the American Academy of
Political and Social Science, 615 (1), 101‐118.
Conner, M., Sparks, P., Povey, R., Shepherd, J. R., & Armitage, C. J. (2002). Moderator
effects of attitudinal ambivalence on attitude‐behavior relations. European
Journal of Social Psychology, 32, 705–718.
Connors, M., Bisogni, C.A., Sobal J., & Devine, C.M. (2001). Managing values in personal
food systems. Appetite, 36 (3), 189‐200.
Contento, I. R., Michela, J. L., & Goldberg, C. J. (1988). Food choice among adolescents:
population segmentation by motivations. Journal of Nutrition Education and
Behavior, 20, 289–298.
Cui, G. (1997). Marketing strategies in a multi‐ethnic environment. Journal of Marketing
Theory and Practice, 5(1), 120–132.
Cunningham, W.A., Preacher, K. J., & Banaji, M. R. (2001). Implicit attitude measures:
Consistency, stability, and convergent validity. Psychological Science, 12, 163‐170.
Dasgupta, N., & Asgari, S. (2004). Seeing is believing: Exposure to counter‐stereotypic
women leaders and its effect on the malleability of automatic gender
stereotyping. Journal of Experimental Social Psychology, 40, 642‐658.

‐ 97 ‐
DeCoster, J., Banner, M. J., Smith, E. R., & Semin, G. R. (2006). On the inexplicability of
the implicit: Differences in the information provided by implicit and explicit tests.
Social Cognition, 24 (1), 5–21.
De Houwer, J. (2003). The extrinsic affective Simon task. Experimental Psychology, 50 (2),
77‐85.
De Houwer, J. (2006). What Are Implicit Measures and Why Are We Using Them? In R.
W. Wiers, A. W. Stacy (Eds.), Handbook of implicit cognition and addiction (pp.
11‐28). Thousand Oaks, CA: Sage Publications, Inc.
De Houwer, J., & Moors, A. (2007). How to Define and Examine the Implicitness of
Implicit Measures. In B. Wittenbrink, N. Schwarz (Eds.), Implicit measures of
attitudes (pp. 179‐194). New York, NY: Guilford Press.
deLiver, Y., van der Pligt, J., & Wigboldus, D. (2007). Positive and negative associations
underlying ambivalent attitudes. Journal of Experimental Social Psychology, 43,
319–326.
Devine, P., Lloyd, K., & Gray, A.M. (2006). University Student Food Attitudes and
Behaviour Survey. UK, Final Report.
Dovidio, J., Kawakami, K., Johnson, C., Johnson, B., & Howard, A. (1997). The nature of
prejudice: Automatic and controlled processes. Journal of Experimental Social
Psychology, 33, 510–540.
Dovidio, J. F., Kawakami, K., Smoak, N., & Gaertner, S. L. (2009). The nature of
contemporary racial prejudice: Insights from implicit and explicit measures of
attitudes. In R. E. Petty, R. H. Fazio & P. Brinol (Eds.), Attitudes: Insights from the
New Implicit Measures (pp. 165–192). New York, NY: Psychology Press.
Fazio, R. (1986). How do attitudes guide behavior? In R. H. Sorrentino, E. T.
Higgins.(Eds.), The handbook of motivation and cognition: Foundation of social
behavior. (pp. 204‐243). New York: Guilford.
Fazio, R. H., Jackson J. R., Dunton B. C., & Williams, C. J. (1995). Variability in automatic
activation as an unobstrusive measure of racial attitudes: A bona fide pipeline?
Journal of Personality and Social Psychology, 69 (6), 1013‐1027.
Fazio, R. H., & Olson, M. A. (2003). Implicit measures in social cognition research: Their
meaning and use. Annual Review of Psychology, 54, 297–327

‐ 98 ‐
Fellows, L. K. (2006). Deciding how to decide: ventromedial frontal lobe damage affects
information acquisition in multi‐attribute decision making, Brain, 129(4), 944‐
952.
Fife‐Schaw, C., & Rowe, G. (2006). Public Perceptions of Everyday Food Hazards: A
Psychometric Study, Risk Analysis, 16 (4), 487‐500.
Fischer, C. (2005). In: Proceedings from 97th EAAE seminar: A theoretical model
explaining modern food consumption and implications for international food
product marketers, Reading, UK.
Gardner, M. P. (1985). Does attitude toward the ad affect brand attitude under a brand
evaluation set?. Journal of Marketing Research, 22 (2), 192‐198.
Gartner, W.C. (1989). Tourism image: Attribute measurement of state tourism products
using Multidimensional scaling techniques. Journal of Travel Research, 28 (2),
16‐20.
Gawronski, B., & Strack, F. (2004). On the propositional nature of cognitive consistency:
Dissonance changes explicit, but not implicit attitudes. Journal of Experimental
Social Psychology, 40, 535‐542.
Glanz K., Basil M., Maibach E., Goldberg J., Snyder D. (1998). Why Americans eat what
they do: taste, nutrition, cost, convenience, and weight control concerns as
influences on food consumption. Journal of American Diet Association, 98,
1118‐1126
Greenwald, A. G., & Banaji, M. R. (1995). Implicit social cognition: Attitudes, self‐esteem,
and stereotypes. Psychological Review, 102 (1), 4‐27.
Greenwald, A. G., Banaji, M. R., Rudman, L. A., Farnham, S. D., Nosek, B. A., & Mellott, D.
S. (2002). A unified theory of implicit attitudes, stereotypes, self‐esteem, and
self‐concept. Psychological Review, 109 (1), 3‐25.
Greenwald, A. G., & Farnham, S. D. (2000). Using the Implicit Association Test to
measure self‐esteem and self‐concept. Journal of Personality and Social
Psychology, 79 (6), 1022‐1038.
Greenwald, A. G., McGhee, D. E., & Schwartz, J. L. K. (1998). Measuring individual differences in implicit cognition: The implicit association test. Journal of
Personality and Social Psychology, 74 (6), 1464‐1480.
‐ 99 ‐
Greenwald, A. G., Nosek, B. A., & Sriram, N. (2006). Consequential validity of the implicit
association test: Comment on Blanton and Jaccard. American Psychologist, 61 (1),
56‐61.
Greenwald, A. G., Rudman, L. A., Nosek, B. A., & Zayas, V. (2006). Why so little faith? A
reply to Blanton and Jaccard's (2006) skeptical view of testing pure multiplicative
theories. Psychological Review, 113 (1), 170‐180.
Gren, C. (1999). Ethnic evaluations of advertising: Interaction effects of strength of
ethnic identification, media placement, and degree of racial composition. Journal
of Advertising, 28 (1), 49–59.
Gu, N., Lee, K. S., & Lee, S. (2006). Food culture in the world. S. Korea: Kyomunsa.
Haines, E. L., & Sumner, K. E. (2006). Implicit Measurement of Attitudes, Stereotypes,
and Self‐Concepts in Organizations: Teaching Old Dogmas New Tricks.
Organizational Research Methods, 9 (4), 536‐553.
Hair, J. F., Anderson, R. E., Tatham, R. L., & Black, W. C. (1998). Multivariate data analysis
(Fifth Edition). Upper Saddle River, NJ: Prentice‐Hall Inc.
Hamlett, J., Bailey, A. R., Alexander., A., & Shaw G. (2008). Ethnicity and Consumption:
South Asian food shopping patterns in Britain, Journal of Consumer Culture, 8 (1),
91‐116.
H¨anze, M. (2001). Ambivalence, conflict, and decision‐making: attitudes and feelings in
Germany toward NATO’s intervention in the Kosovo war. European Journal of
Social Psychology, 31, 693–706.
Hastings, G., Stead, M., McDermott. M., Forsyth, A., MacKintosh, A. M., Rayner, M.,
Godfrey, C., Caraher, M., & Angus, K. (2003). Review of research on the effects of
food promotion to children: Final report. Glasgow, UK: Centre for Social
Marketing.
Henson, S., Majowicz, S., Masakure, O., Sockett, P., Jones, A., Hart, R., Carr, D., Knowles,
L. (2006). Consumer assessment of the safety of restaurants: the role of
inspection notices and other information cues. Journal of Food Safety 26, 275–
301.
Hillriegel, D., Slocum, J. W., Jr., & Woodman, R. W. (1989). Organizational behavior. St.
Paul, MN: Harper & Row, Publishers.

‐ 100 ‐
Hong, Z., Dengfeng, W., & Ye, Y. (2006). Explicit and Implicit Measures of Intimate
Relationships and Their Association. Acta Psychologica Sinica, 38 (6), 910‐915.
Jang. S. S. C., Ha, A., & Silkes, C. A. (2009). Perceived attributes of Asian foods: From the
perspective of the American customers. International Journal of Hospitality
Management, 28 (1), 63–70.
Karpinski, A. (2004). Measuring self‐esteem using the Implicit Association Test: The role
of the other. Personality and Social Psychology Bulletin, 30 (1), 22‐34.
Karpinski, A., & Hilton, J. L. (2001). Attitudes and the Implicit Association Test. Journal of Personality and Social Psychology, 81 (5), 774‐788.
Keller, K. L. (2003). Strategic Brand Management: Building. Measuring and Managing
Brand Equity, second ed., Prentice Hall, Upper Saddle River, NJ.
Kim, S., Nayga Jr., R. M., Capps Jr., O. (2001). Food label use, self‐selectivity, and diet
quality. Journal of Consumer Affairs, 35 (2), 346–363.
Knight, A., Worosz, M., & Todd, E. (2007). Serving food safety: consumer perceptions of
food safety at restaurants. International Journal of Contemporary Hospitality
Management, 19 (6), 476–484.
Kotler, P. (1988). Marketing Management: Analysis, Planning, Implementation, and
Control. Prentice Hall, Upper Saddle River, New Jersey.
Krosnick, J. A., Judd, C. M., & Wittenbrink, B. (2005). The measurement of attitudes. In D.
Albarracín, B. T. Johnson, M. P. Zanna (Eds.), The handbook of attitudes (pp.
21–76). Mahwah, NJ: Erlbaum.
Kruse, N. (2004). Chains use Asian flavors to satisfy customers’ taste for adventure.
Nation’s Restaurant News. July 5.
Kwon, O. (2010). Psychological model based attitude prediction for context‐aware
services, Expert Systems with Applications, 37 (3), 2477–2485.
LaPiere, R. T. (1934). Attitudes vs. actions. Social Forces, 13, 230‐237.
Letarte, A., Dube, L., & Troche, V. (1997). Similarities and differences in affective and
cognitive origins of food likings and dislikes. Appetite, 28 (2), 115‐129.
Lewis, R.C. (1983). Getting the most from marketing research. The Cornell Hotel
andRestaurant Administration Quarterly, 24 (3), 25–35.

‐ 101 ‐
Lin, J. (1991). Consumer food attribute perceptions and consumption behavior.
Consumer Interests Annual 1991.
Livingstone, S., & Helsper, E. (2004). Advertising “unhealthy” foods to children:
Understanding promotion in the context of children’s daily lives. London:
Ofcom.
Menkaus, D. J., Whipple, G. D., Torok, S. J., & Field, R. A. (1988). Developing a marketing
strategy for branded, low fat, fresh beef. Agribusiness, 4 (1), 91–103.
Mischel, W. (1968). Personality and assessment. New York: Wiley.
Mitchell, L. (2004). U.S. and EU Consumption Comparisons. In U.S.‐EU Food and
Agriculture Comparisons, Normile, M.A., Leetm, S.E. (coordinators), U.S.
Department of Agriculture, Agriculture and Trade Report. WRS‐04‐04.
Mitchell, R., & Hall, C. M. (2003). Consuming tourists: food tourism consumer behavior.
In: Hall, C.M., Sharples, L., Mitchell, R., Macions, N., Cambourne, B. (Eds.), food
tourism around the world: Development, management and markets.
Butterworth‐Heinemann, Boston, pp. 60–80.
Nosek, B. A. (2007). Implicit–Explicit Relations, Current Directions in Psychological
Science, 16 (2), 65‐69 .
Nosek, B. A., Greenwald A. G., & Banaji, M. R. (2005). Understanding and using the
Implicit Association Test: II. Method variables and construct validity.
Personality and Social Psychology Bulletin, 31 (2), 166‐180.
Olson, M. A., & Fazio, R. H. (2003). Relations between implicit measures of prejudice:
What are we measuring? Psychological Science, 14, 636‐639.
Ottaway, S. A., Hayden, D. C., & Oakes, M. A. (2001). Implicit attitudes and racism:
Effects of word familiarity and frequency on the implicit association test. Social
Cognition, 19 (2), 97‐144.
Petty, R. E., Briñol, P., & DeMarree, K. G. (2007). The meta‐cognitive model (MCM) of
attitudes: Implications measurement, change, and strength. Social Cognition,
25 (5), 657‐686.
Petty, R. E., Fazio, R. H., & Brinol, P. (2009). Attitudes: Insights from the new implicit
measures. In A. J. Dijksterhuis, L. W. Albers, K. C. A. Bongers (Eds.), Digging for

‐ 102 ‐
the real attitude: Lessons from research on implicit and explicit self‐esteem,
(pp.229‐250). New York, NY: Psychology Press.
Petty, R. E., Tormala, Z. L., Briñol, P., & Jarvis, W. B. G. (2006). Implicit ambivalence from
attitude change: An exploration of the PAST Model. Journal of Personality and
Social Psychology, 90, 21–41.
Pinter, B., & Greenwald, A. G. (2005). Clarifying the role of the "other" category in the
self‐esteem IAT. Experimental Psychology, 52 (1), 74‐79.
Puertas, S., Rodriguez‐Bailon, R., & Moya, M. (2002). Automatic processing and implicit
measure of power related stereotypes. Revista de Psicologia Social, 17 (1), 69‐84.
Quan, S., & Wang, N. (2004). Towards a structural model of the tourist experience: an
illustration from food experiences in tourism, Tourism Management, 25 (3), 297–
305.
Rappoport, L. H., Peters, G. R., Huff‐Corzine, L., & Downey, R. G. (1992). Reasons for
eating: an exploratory cognitive analysis. Ecology of Food and Nutrition 28 (3),
171‐189.
Rozin, P., & Vollmecke, T. (2001). Food Likes and Dislikes. Annual Review of Nutrition, 6,
433‐456.
Rydell, R. J., McConnell, A. R., Mackie, D. M., & Strain, L. M. (2006). Of two minds:
Forming and changing valence–inconsistent implicit and explicit attitudes.
Psychological Science, 17, 954–958.
Senauer, B. (2001). The food consumer in the 21st century: New research perspectives.
Department of applied economics, The retail food industry center, University of
Minnesota.
Sheldon, K. M., King, L. Houser‐Marko, A., Osbaldiston, L., R., & Gunz , A. (2007).
Comparing IAT and TAT measures of power versus intimacy motivation.
European Journal of Personality, 21 (3), 263‐280.
Smith, K. S., & Berridge, K. C. (2005). The Ventral Pallidum and Hedonic Reward:
Neurochemical Maps of Sucrose "Liking" and Food Intake. The Journal of
Neuroscience, 25 (38), 8637‐8649.
Sparks, P., Harris, P. R., & Lockwood, N. (2004). Predictors and predictive effects of
ambivalence. British Journal of Social Psychology. 43, 371–383.

‐ 103 ‐
Thompson, M. M., Zanna, M. P., & Griffin, D. W. (1995). Let’s not be indifferent about
(attitudinal) ambivalence. In R. E. Petty & J. A. Krosnick (Eds.), Attitude strength:
Antecedents and consequences. Hillsdale, NJ: Erlbaum.
van der Pligt, J., De Vries, N. K., Manstead, A., & van Harreveld, F. (2000). The
importance of being selective: weighing the role of attribute importance in
attitudinal judgment. In Advances in Experimental Social Psychology,. M. P.
Znna (Ed.), 32, 135–200. San Diego, CA: Academic
Verbeke, W., & Lopez, G. P. (2005). Ethnic food attitudes and behaviour among Belgians
and Hispanics living in Belgium. British Food Journal, 107(10–11), 823–840.
Von Hippel,, V., Sekaquaptewa, D., & Vargas, P. (1997). The linguistic intergroup bias as
an implicit indicator of prejudice. Journal of Experimental Social Psychology, 33,
490‐509.
Wilson, T. D., Lindsey, S., & Schooler, T. Y. (2000). A model of dual attitudes.
Psychological Review, 107 (1), 101–126.
Wittenbrink, B., & Schwarz, N. (2007). Implicit measures of attitudes. 294 pp. New York,
NY: Guilford Press.
Zanna, M. P., & Rempel, J. K. (1988). Attitudes: A new look at an old concept. In D. Bartal,
A. W. Kruglanski (Eds.), The social psychology of knowledge (pp. 315–334).
Cambridge, UK: Cambridge University Press.