Embed Size (px)
Citation preview

NATIONAL CENTER Series 2
For HEALTH STATISTICS INumber 24
PROPERTYOFTHEPUBLICATIONSBRANCH EDITORIALLIBRARY
VITAL and HEALTH STATISTICS DATA EVALUATION AND METHODS RESEARCH
a study of the
AchievementTest Used in the Health Examination Surveys
of Persons Aged6-17 Years
A methodological
of the measures
(Cycle 11) and of
Washington, D. C.
U.S. DEPARTMENT
HEALTH, EDUCATION, AND
John W. Gardner
Secretary
study of
used in the
adolescents
OF
WELFARE
the Wide Range Achievement Test, one
Health Examination Survey of children
(Cycle Ill).
June 1967
Public Health Service
Wil Iiam H. Stewart
Surgeon General

Public Health Service Publication No. tOOO-Series z-No. 24
rs e e Su tenden of Doc ents, . Gov en Pri “
Was” n, ..,2 - Pr] ce ~ “Y

NATIONAL CENTER FOR HEALTH STATISTICS
FORREST E. LINDER, PH. D., Director
THEODORE D. WOOLSEY, Deputy D/rector
OSWALD K. SAGEN, PH. D., A.s.szskznt Director for State I?eltztzorzs
WALT R. SIMMONS, M. A., Statzstrczzl Aa’tlzsor
PHILIP S. LAWRENCE SC.D., Plarzrzzrzg O//iz-er
ALICE M. WATERHOUSE, M. D., Medzcd Consultant
JAMES E. KELLY, D. D. S., Dwztzzl Advzsor
LOUIS R. STOLCIS, M. A., Exccutlz’e O//zz-er
DONALD GREEN, in/ormatzon O//zcer
OFFICE OF HEALTH STATISTICS ANALYSIS
I WAOM. hiORIYAi4A, PH D. , h7c?ctOf
DIVISION OF VITAL STATISTICS
ROBERT D. GROVE, PH D.,~iyec~o,
DIVISION OF HEALTH INTERVIEW STATISTICS
E LU AH L. WHITE,A.M., Dzrector
DIVISION OF HEALTH RECORDS STATISTICS
MONROE G. SIRKEN.PH.D.,Dilecfv
DIVISION OF HEALTH EXAMINATION STATISTICS
ARTHUR J.MCDOWELL, Direcfnr
DIVISION OF HEALTH RESOURCES STATISTICS
SIEGFRIEDA. HOERMANN, 12zTector
DIVISION OF DATA PROCESSING
LEoNARD D. MC GANN, Direcfor
Public Health Service Publication No. 10 C!O-Series 2-No. 24
Library of Corzgress Catalog Card Number 67-60022

FOREWORD
The psychological ,programs of the Children’s Health Examination Survey (Cycle II) and the Adolescent’s Health Examination Survey (Cycle III) aim at providing information concerning the number of psychological problems which exist in the Nation’s noninstitutionalized population of persons aged 6 through 17. Achievement testing, therefore, was conducted not to evaluate achievement per se, but because many developmental and psychological problems first come to the attention of teachers, psychologists, physicians, or other caretakers as “achievement problems. ”
Because of the survey nature of the operation, no one health factor, whether physical, physiological, dental, or psychological, can be evaluated as thoroughly as it would be in a nonsurvey setting. As a result, most of the measurements are collected using either specially designed techniques or abbreviated forms of widely used, longer procedures. By means of methodological studies these special or abbreviated instruments are then evaluated to see what relationship exists between them and established, criterion measures.
The instrument chosen for measuring achievement in reading and arithmetic in the Children’s and the Adolescent’s Health Examination Surveys was the 1963 revision of the Wide Range Achievement Test (WRAT) originally published by Joseph Jastak in collaboration with Sidney Bijou in 1946. The WRAT is not an abbreviated version of a longer, well established test, nor was it specially developed for use in the survey. It is a hitherto relatively unproven short test for the rapid assessment of achievement skills. It was
selected because of its brevity and also because it was held by many clinicians to be a good predictor of performance on the more traditional achievement tests.
Because of the nature of the WRAT, a study was designed to establish the relationship between it and the Stanford Achievement Tests for individuals in grades 1 through 9 and the Metropolitan Achievement Tests for individuals in grades 10 through 12. Hopefully, a description of this relationship will permit the reader to evaluate our forthcoming reports dealing with the incidence of underachievement in the Nation’s population of persons aged 6 through 17.
In addition, scientists will have available, for the first time, information concerning the relationship between the Wide Range Achievement Test (reading and arithmetic sections) and appropriate subtests of the Metropolitan and Stan-ford Achievement Tests. For a test originally published in 1946, such a study is long overdue.
This study is the product of contract number PH 86-65-52 between West Virginia University and the National Center for Health Statistics. The project director was K. Warner Schaie, Ph. D., professor of psychology, West Virginia University; and I was the project officer. Contributions by the examiners and other project personnel are gratefully acknowledged. Their names are listed in Appendix III.
Lois R. Chatham, Ph.D. Psychological Advisor Division of Health Examination Statistics

---------------------------------------------------------- --
----------------------------------------------------------
------------------------------------------------
--------------------------------------------------------------------------------------------
----------------------------------------------------------------------------------
------------------------------------------
---------------------------------------------------------------------------------
----------------------------------------------------------------------
-----------------------------------------
----------------------------------
------------------------------
------
-------------------------------------------------------------------------------------------
-------------
I
CONTENTS
Foreword
Introduction
1. Desi~of the Study ------------------------------------------------
General Format
SubjectsMonongalia County SampleControl SampleSocioeconomic CharacteristicsGeneral Abili~ Level
Test InstrumentsWide Range Achievement TestStanford Achievement TestMetropolitan Achievement Test
Examination Procedure
Reliability of Scoring Procedure
11, The Elementary School Study ---------------------------------------
Background Data ------------------------------------------------
Adequacy of Grade Level Placement
Performanceon the SAT-----------------------------------------
Relation of theWRAT to the SAT---------------------------------
Discrepancies Between WRATand SAT Grade Level Estimates
The WRAT SectionsInterrelationshipRelation to General Ability and Socioeconomic Status
Page
i
1
2
2
2 2 2 4 6
8 8 9
10
11
12
14
14
14
18
19
23
24 24 26

-------- ------- ------- -------
--------- --------- ---------------
------
------------------------------------------------------------------------------------------
-------------
------------------------------
------------------ -------------
-----------------
----------------------------------------------------- ------- ------- -------------- --------
-------------
-----------------------
--------- --------- ---------
------------
---------
-------- -------- -------- -------- ------- -------- -------
-------- ------- --------------
----------------------------------------------------------- ---------------
------------------------------------------------
CONTENTS—Continued
Page
111. The Junior High Schml SWdy---------------------------------------
Back~ound Data ------------------------------------------------
Adequacy of Grade Level Placement -
Performance on the SAT----------------------------------------
Relation of theWRATtotheSAT
Discrepancies Between WRATand SAT Grade Level Estimates
The WRAT SectionsInterrelationshipRelation to General Ability and Socioeconomic Status
IV. The Senior High Schwl Smdy ---------------------------------------
Background Data -----------------------------------------------
Adequacy of Grade Level Placement
Performance on the MAT ---------
Relation ofthe WRAT to the MAT---------------------------------
Discrepancies Between WRATand MAT Estimates
The WRATSwtionsInterrelationship -
Relation to General Ability and Socioeconomic Status
V. Validity of the WRATat Extreme AbiliWLevels
WRAT Performance at Extreme Levels
Relation Between the WRATand the Criterion Variables
Discrepancies Between WRATand SATGrade Level Scores
VI. Conclusions
Appendix 1. Level Iofthe Wide Range Achievement Test Form Used inthe Elementary School S@dy----------------------------------------------
Personal Data -----------------------------------------------------Test Instructions, Level I Reading .-------
Pre-Reading SectionLevelI—Pronunciation Guide for Reading TestLevel I-Aritimetic
27
27
28
29
29
30
34 34 35
36
36
37
38
40
42
43 43 43
43
43
49
51
51
53 53 53 54 54 55

----------------------------------
------------------------------------------------------------------------
CONTENTS—Continued
Page
Appendix II. Level II of the Wide Range Achievement Test Form Used in the Junior and Senior High School Studies 56
Personal Data ------------------------------------------------------ 56 Reading Instructions 56 Level II—Pronunciation Guide for Reading Test 57 Aritimetic-Level II------------------------------------------------ 58 Oral Aritimetic-Level II------------------------------------------- 58
Appendix III. Personnel Participating in the Data Collection and Analysis--- 59
------------------------ ---
------------------
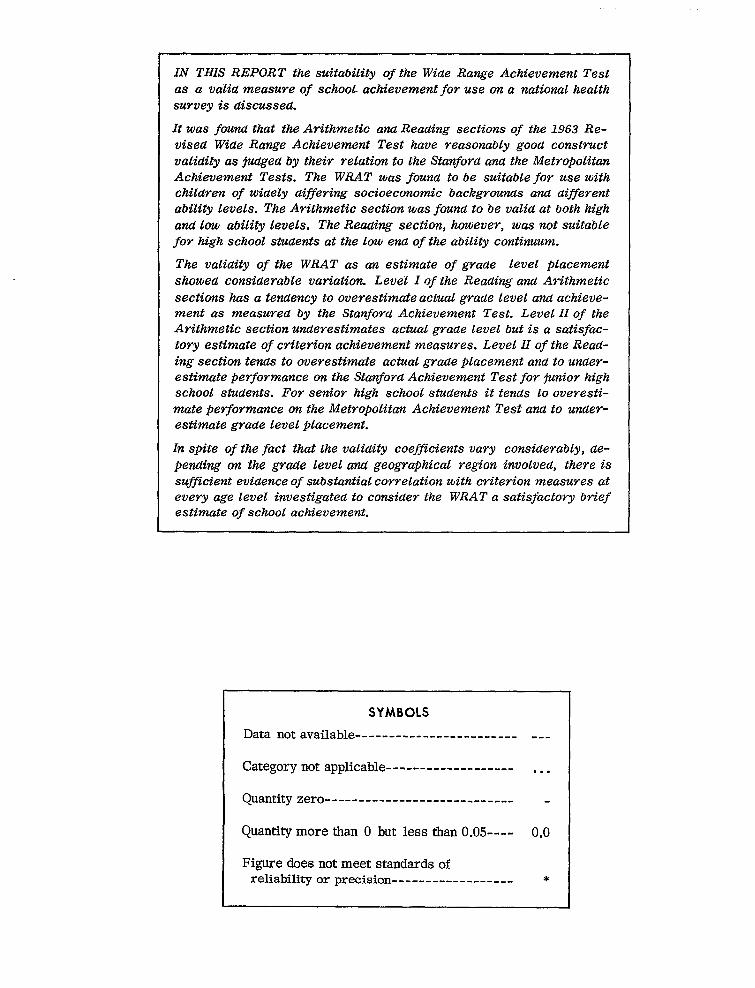
IN THIS REPORT the suitability of the Wide Range Achievement Test as a vaiia measure of schoo!. achievement for use on a national health .%?&veyis discussed.
It was found that the Arithmetic and Reading sections of the 1963 Re-vises Wide Range Achievement Test have reasonably good construct validity as jUdgeU by their relation to the Stanford ana the Met~opolitan Achievement Tests. The WRAT was founa to be suitable for use with children of widely aiflering socioeconomic back.gvwwuts and different ab;lity levels. The Arithmetic section was frond to be valia at both high and low ability levels. The Reaaing section, howeve~, was not suitable for high school students at the low end of the ability continuum.
The valiaity of the WRAT as an estimate of graae level placement showed considerable vaw”ation. Level I of the Reading and Arithmetic sections has a tendency to overestimate actual grade level and achievement as measured by the Stanfova Achievement Test. Level II of the Arithmetic section underestimates actual graae level but is a satisfactory estimate of cyitem”on achievement measures. Level II of the Reading St? CtiOn tenas to overestimate actual gYade placement a?ul to under-estimate performance on the Stanford Achievement Test for junior high school students. For senior high school students it tends to overestimate performance on the Metropolitan Achievement Test and to under-estimate graae level placement.
In spite of the fact that the validity coefficients vary considerably, de-pending on the Wade level ana geographical vegion involved, there is su.cient evidence of substantial cowelation with criterion measures at every age level investigated to consider the WRAT a satisjactovy brief estimate of school achievement.
SYMBOLS
Data not available
Category not applicable ------------------- . . .
Quantity zero ---------------------------- -
Quantity more than O but less than 0.05---- 0.0
Figure does not meet standards of reliability or precision *

A STUDY OF THE
ACHIEVEMENT TEST
USED IN THE HEALTH EXAMINATION SURVEYS
OF PERSONS AGED 6-17 YEARS 1
I
K. Warner Schaie, Ph. D., West Vivginia Univemity
INTRODUCTION
The purpose of this study is to assess the detail, grouped separately for the analysis of validity of the Wide Range Achievement Test the relation between the WRAT and criterion (WRAT) in terms of its ability to predict grade measures (1) in elementary grades, (2) for thelevel placement on the Metropolitan and the junior high school population, and (3) for theStanford Achievement Tests (MAT and SAT), senior high school group. In each instance,which are the criterion measures. Attention data and appropriate comparisons will be pre-is given to the discrepancies which exist between sented based on children in the geographical ythe WRAT grade level ratings and performance homogeneous sample (Monongalia County) andon the criterion measures, in terms of grade on children in control samples from widelylevels. This was done by analyzing the rela- separated geographic regions.tionships which exist between the WRAT and the A technical study of the type here reportedcriterion measures. requires samples which should be reasonably
To control for the bias which might be in- representative of the general population. This troduced by the geographic kxation of a sample, does not imply that concerted attempts should one sample was chosen which consisted of a be made to attain the exact replication of the population of children in grades 1 through 12, population census or to provide random samples all of whom were students in a single school of the total population. It is of greater importance system. Data from this sample were then com- to ensure the adequate representation of groups pared with data obtained from a sample con- at all levels of ability in order to be able to sisting of students from widely separated sec- assess properly the success of achievement tions of the country. tests in evaluating typical as well as atypical
Because of the nature of che population performance. Considerable effort was directed, investigated, this study had been divided into therefore, toward the objective of achievingthree parts. Thus, after the general design, representativeness by appropriate selection ofcriterion measures, and selection of subjects samples.are described, the results will be reported in
1

1. DESIGN OF
GENERAL FORMAT
The Arithmetic and Reading sections of the Wide Range Achievement Test (WRAT) formed the basic research instrument and were given to all subjects. A group-administered achievement battery was also given to each subject. The two group tests chosen as the criterion measures with which the WRAT was compared were the Metropolitan Achievement Test for use with grades 10 through 12 and the Stanford Achievement Test for use with grades 1 through 9. With the Stanford Achievement Test the form given varied with grade placement.
In addition to the Arithmetic and Reading
sections of the Wide Range Achievement Test and the group achievement tests, information was collected on the socioeconomic characteristics of the pupils, and scores on general ability tests were recorded.
SUBJECTS
Monongalia County Sample
The first sample selected was a relatively homogeneous school system chosen for the purpose of providing data concerning the efficacy of the WRAT across the different grades. The schools were selected to include the broadest representation possible of urban and rural children with a wide range of socioeconomic back-grounds. Schools having a marked concentration of university faculty children were not included in the sample.
To achieve adequate representation and to permit separate analyses at each grade level, approximately 50 boys and 50 girls were selected from each grade level. Data for the Monongalia County, W. Va., sample were obtained in three elementary schools, each of which covered grades 1-6; one junior high school (grades 7-9); one junior-senior high school (grades 7-12); and one senior high school (grades 10- 12).
For administrative reasons, as well as to avoid the possibility that selection schemes might artificially truncate the distribution of talent in
THE STUDY
the sample, all children in the elementar y schools, the junior-senior high school, and the junior high school were tested. Since the high school sample was predominantly rural, it was decided to supplement it by randomly selected cases from the University High School, which served an urban area. Here names were picked at random from the grade rosters until each grade quota was completed.
Approximately 10 percent oversampling was conducted to provide some insurance against the contingency that some children were likely to drop out or fail to be available for either the individual test or the group test. The practical necessity of including entire classrooms in the testing procedures in some instances required the testing of some additional children. Tables 1 and 2 give the total number of children included in the Monongalia County elementary and secondary samples to whom either a group or an individual test was given as well as the number of children included in the final sample. These latter figures indicate the number of subjects on whom scorabIe records were obtained in both individual and group testing situations and on whom data are included in the statistical analyses.
Control Sample
In order to avoid the possibility of obtaining data which would reflect the peculiar circumstances of a single homogeneous school system, additional data were collected on children in widely dispersed portions of the United States. Rather than testing smaller samples, it was decided to replicate the sample size but to collect data on only four grades in each of three different locations. Since the principal sample was collected in the mideastern part of the country, the control samples were placed in the Midwestern, Rocky Mountain, and west coast areas.
Control sample A covered the first, fourth, seventh, and tenth grades and involved two elementary schools, a junior high school, and a senior high school in Milwaukee County, Wis, The schools were selected so as to be at the
2

-------
---------
--------
----------------------
----------------------
-------
12 -----------------------3456
Table 1. Number of elementary school subjects included in the Monongalia County sampleand number on whom complete records were obtained, by sex and grade
Grade Total Boys Girls Total Boys Girls
Number withNumber in sample I complete records Total elementary school sample 736 368
Grade 1----------------------------,-.,--- 116 60 114 54 60 Grade 2----------------------------- 117 111 Grade 3-----------------------------~:----- 121 2? 113 ;: % Grade 4------------------------------------ 127 54 121 71 50 Grade 5------------------------------------ 111 59 105 50 Grade 6------------------------------------ 144 79 119 54 2:
Table 2. Number of secondary school subjects included in the Monongalia County sample and number on whom complete records were obtained, by sex and age
Grade Total I Boys Girls II I EIiEEIE
Number withNumber in sample complete records
Total secondary school sample 706 355 351 633 314 I 319
Total junior high 376 192 184 330 166 I 164
Grade 7------------------------------------ 125 53 111 61 50 Grade 8------------------------------------ 117 54 101 51 50 Grade 9------------------------------------ 134 77 118 54 64
Total senior high 330 167 303
Grade 10----------------------------------- 109 55Grade 11----------------------------------- 110 54 1:;Grade 12----------------------------------- 111 58 103
Table 3. Number of elementary school subiects in the control samDle and number on whom complete records wer; obtained, ky sex, grade, and locat;on of sample
Grade and location Total Boys Girls~
Number withNumber in sample
complete records
Total elementary school sample 680 338 342 6271[ 317 310
Grade (Wisconsin)------------------------ 103 103 Grade (California) 120 104 Grade (Colorado)------------------------- 113 104 Grade (Wisconsin)------------------------ 104 Grade (California)----------------------- 123 Grade (Colorado)------------------------- 117
3

periphery of the metropolitan area and thus are assumed to be reasonably comparable in socioeconomic distribution to the other samples.
Control sample B included the second, fifth, eighth, and eleventh grades and was collected in Duarte, a suburban semirural schd district in Los Angeles County, Calif. This district also had some similarities with the main sample in that it had a small sprinkling of rural and minority group children. Here, also, data were collected in two elementary schools, one junior high, and one senior high school.
Control sample C, finally, covered the third, sixth, ninth, and twelfth grades and was collected in Fort Collins, Colo, Fort Collins is a college town close to rural and mining areas with a metropolitan area similar in size to the Monongalia County situation. Again two elementary schools, a junior high, and a senior high school furnished the subjects for this sample.
Tables 3 and 4 give the number of elementary and secondary school children in the control sample, and table 5 gives, by geographic location, the number of children who were included in the sample and for whom complete records are available.
Socioeconomic Characteristics
Parents’ occupations and students’ ability levels were determined in order to ascertain whether the sample selected actually covered a representative range and to permit appropriate statistical adjustment if necessary. Occupational level for the head of household was coded according to the following scheme:
O - unskilled Iaborersl 1- domestic laborers (including gardeners
and janitors) 2- operators (factory, and similar work
requiring no special training) 3- service occupations (including mailmen,
service station employees, dry cleaners, etc., all requiring only limited training)l
lspecial cases-disabled and unemployed workers were
classified as O, retired workers as 3, undergraduate students as 7,and graduate students as level 8.
4- protective occupations (policemen, fire-men, guards, soldiers; however, sergeants were classified as 6 and commissioned officers as 8)
5- craftsmen (including all trades requiring an apprenticeship or formal training)
6- clerical and sales (excluding news vendors, grocery checkers, dime store clerks, who were classified as 3)
7- managerial and proprietors (including independent farmer-operators; tenant farmers and farm lalmrers, however, come under classifications 1 and O, respectively)l
8- semiprofessional (including most occupations requiring college training but not more than 2 years of graduate work) 1
9- professional (all occupations requiring 2 or more years of graduate work, including lawyers, social workers, all college instructors, and school administrators. Teachers and nurses would ordinarily be classified in level 8 unless they have administrative positions)
The scheme used is a modification of the major headings used in the 1950 census. It was first used in Measuring Behavioral Rigidity: A Factorial Investigation of Some Tests of Rigid Behavior (K. Warner Schaie, unpublished M.A. thesis, University of Washington, 1953).
The distribution of parents’ occupations for the subjects included in the Monongalia County elementary school sample is given in table 6. It may be seen that the distribution was quite uniform throughout the six grades included in this sample and would seem to be reasonably representative of the socioeconomic structure of the local community. Table 7 gives a similar distribution for the Monongalia County secondary school sample. The distribution again was quite uniform throughout the six grades examined. There was, however, some underrepresentation at the upper level due to the fact that the area where most university people live was avoided. Tables 8 and 9 give the socioeconomic characteristics of the control samples. The distribution for the elementary school samples was similar to that obtained in Monongalia County. The
4

--------
-----------------
---------------------
------------------------------------------------------------------------------------------------------
---------
--------------------------------------------------------------------
-------------------------------------------------------------------------
-----------------------------------------------------------------------
----------------------------------------------------------
--------------------------------------------------------------------------
Table 4. Number of secondary school subjects in the control sample and number on whomcomplete records were obtained, by sex, grade, and location of sample
Grade and location Total Boys Girls Total Boys Girls
Number withNumber in sample I complete records Total secondary school sample
Total junior high ---- JQ--ll-=-=t=lI=t=Grade 7 (Wisconsin)------------------------ 104 Grade 8 (California)----------------------- 128 :; Grade 9 (Colorado)------------------------- 279 156
Total senior high---------------------- 280 II 130
Grade 10 (Wisconsin)-----------------------Grade 11 (California)----------------------Grade 12 (Colorado)------------------------mTable 5. Number of subjects in the control samples and number on whom complete records
w&e obtained, by sex and-location of sample
Location Total Boys Girls Total Boys Girls
Number withNumber in sample complete recordsI
Combined samples 2,913 1,463 1,450 2,539
Wisconsin
Total control sample------------------- 1,471 740 731 1,223
California 477 234 243 421 Colorado 580 303 277 393
414 203 211 409RmTotal Monongalia County sample 1,442 723 719 1,316
I
209 212 196 197 203 206
656 I 660
Table 6. Number of elementary school subjects in the Monongalia County samples, bygrade of subject and occupational level of parent
Grade of subject
Occupational level of parent
Total 1 2 3 4 5 6
Number of subjects
O-Unskilled laborers 61 18 9 11 16 5 l-Domestic laborers2-Operatives3-Service occupations4-Protective occupations5-Craftsmen6-Clerical and sales7-Managerialand proprietors8-Semiprofessional9-Professional
24 5 4 2 2 : 10
1:; 18 2; 1% 2; 17
1% 1: 2? 2: 2; 22 80 15 18 11 100 18 1? 17 15 :: 63 12 8 12 14 10 39 8 7 6 4 8
— — —
5

-------------------------------------------------------------------
-------------------------------------------------------------------------
-----------------------------------------------------------------------
----------------------------------------------------------
--------------------------------------------------------------------------
-------------------------------------------------------------------
----------------------------------------------------------------
------------------------------------------------------------------------------------------------
------------------------------------------------------------
---------------------------------------
Table 7. Number of secondary school subjects in the Monongali.aCounty samples, bygrade of subject and occupational level of parent
Grade of subject
Occupational level of parent
Total 7 8 9 10 11 12
Number of subjects
O-Unskilled laborersI-Domestic laborers2-Operatives3-Service occupations4-Protective occupations5-Craftsmen6-Clerical and sales7-Managerialand proprietors8-Semiprofessional9-Professional
19 17 19 9 5 9
2 1; 22 li
2: 3; 10
: 10 6 2 1
secondaryschoolsamples in thecontrolgroup,however,tendedto have highersocioeconomiclevels,possiblysuggestingdifferentpatternsof high schoolattrition.This was particularlynoteworthyfortheColoradosamples.The ruralportions tobeoftheColoradosampleswerelikelychildrenof farm laborersforwhom highschooldropoutwouldbehigherthanfortheWestVirginia
Thisfactorresultedchildren. inahigheraveragesocioeconomic whoremainedlevelforthechildren
intheColoradosamples.
.
General Ability Level
ofgeneralabilityThe distribution inthesampieswas studied thescoreontheby determiningmost recentgroupintelligencetestwhicha givenchildhad taken.This meant thatscoreswereusedon testswhichhad beengivenanywherefrom3 months to 2 years priorto thepresentstudyand thatseveraldifferenttestsor testformsmight have beenutilized.Most scores,however,were from theCaliforniaMentalMaturityTest
Table 8. Number of elementary school subjects in the control samples, by grade of subject and occupational level of parent
Grade of subject
Occupational level of parent
Tots1 1 2 3 4 5 6
O-Unskilled laborersl-Domestic laborers
-2-Operatives3-Service occupations -.------4-Protective occupations5-Craftsmen-----..--6-Clerical and sales7-Managerialand proprietors8-Semiprofessional9-Rofessional
Number of subjects
110 27 11 7 2
i 1:; 10 2:
1:; 2? 2: 57 13 11 73 10 71 10 1; 22 2 2
. —
15
i16
2?
1:1214
6

-------------------------------------------------------------------
-------------------------------------------------------------------------
-----------------------------------------------------------------------
----------------------------------------------------------
--------------------------------------------------------------------------
-----------------------------
------------------------------------
Table 9. Number of secondary school subjects in the control samples, by grade of subject and occupational level of parent
Grade of subject
Occupational level of parent
Total 7 8 9 10 11 12
Number o subjects
O-Unskilled laborersl-Domestic laborers2-Operatives3-Service occupations4-Protectiveoccupations5-Craftsmen6-Clerical and salea7-Managerialand propri,etors8-Semiprofessional9-Professional
10 11 13 14 12
: 25 3: 1: 2:
2; 1: 1; 2A 12 13 11 10 14 18 23 16 9 91421 11 4
and theOtisGroup IntelligenceTests.Becauseof the varietyof intelligencetestswhich wereused,itwas decidedthatonlygrossclassificationswere inorder.Abilitylevelswerethereforerecordedon a 7-pointscale.Assuming thatthetestsused allhad a standarddeviationof 15points,theintervalsfortbe7-pointscaleweresetat intervalscomparableto thedescriptionsbeing used for the interpretationof individual
— 1
intelligencetests.The meaning of the abilitylevelsusedwas as follows:
1 -mentally defective(IQ of 70 or below)2- borderline(IQof71t080)3- dullnormal(IQof81t090)4-average (IQof91tol10)5 -brightnormal(IQoflllto 120)6- superior(IQof121to 130)7-very superior(IQ of 131 and above)
Table 10. Number of subjectsinthe Monongali.aCounty sample,by ability level and grade
Ability level (IQ)
Grade 13170 71- 81- 91- 111- 121- Or
b?low 80 90 110 120 130 above
Total---------------------------------
Grade 3-------------------------------------Grade 4-------------------------------------Grade 5-------------------------------------Grade 6-------------------------------------Grade 7-------------------------------------Grade 8.--------Grade 9-------------------------------------Grade 10------------------------------------Grade 11Grade 12------------------------------------
Number of subjects
21 43 125 577 236 15
7

- - - -- -- - -- -- - - -- -- - --- - - -- -- - - --
------------------------------
--------------------------------
-------------------------------
- - - - - --- -- -- - - - - -- -- -- --- --- - --- - - --
--------------------------------------- - - - -- - ----- -- - - -- -- -- -- - -- -- ---- - -- -- - - -- -- -- - -- -- - - -- --- -- - - -
- - --- ---- - -- -- - - -- -- -- - -- -- -- - -- -- --
- - - - - - - - - - - - -- - - - - - -
- - - -- - - - - - - - - - - - -- - - - -- -- - - - -- - -- - --
Table 11. Number of subjects in the control samples, by ability level, location of sample, and grade
Ability level (IQ)
Location and grade 70
b%ow ~
Number of subjects
Total - 1 25 582 318 172 44 _
California 2 245 75 26 8+
Colorado 1 19 8 164 103 79 24
Wisconsin 4 15 173 140 67 12
Grade . Grade L----------------------------------- :; 16
Grade Grade :------------------------------------- 31
30 :
15 Grade 5- ---- 24 9 Grade 6- - - -- 1 23 32 Grade - 33 22 Grade ;-------------------------------------Grade 9- - -- - - - - - - - - - - . -- :! 2: Grade 10------------------------------------ 36 14 Grade 11------------------------------------ 13 Grade 12 16 12
—.
The distribution of general intellectual ability for the Monongalia County samples is reported in table 10 separately for each grade and for all grades combined. However,noabilityscoreswere available for the Morgantown samples ingradesl and 2. Similar data for the control samples are given in table 11. A basically symmetric distribution extending to both extremes was obtained for the Monongalia Countysamples ,althoughthere was some upward skewingduetogreaterinclusion of children from highersocioeconomiclevels than had originally been anticipated. This skewingwas even more pronounced for the control samples in whose school districts policy decision leads to assignment of children of low ability to special classes both earlier and more systematically thanis thecaseinMonongaliaCounty. Theskewing was most pronounced for the Colorado samples and least pronounced in the Wisconsin samples. The distribution of children in the California samples was fairly similar to that found in
8
Monongalia County. Patterns across grades were fairly uniform within each geographical area.
While these samples arecertainly not exact replication of the distribution of talent within the population, they would seem to be broadly representative of typical school populations; thus they meet the sampling requirements set forthin the introduction to this report.
TEST INSTRUMENTS
Wide Range Achievement Test
The principal instrument used for this study was, ofcourse, the1963revision of the Wide Range Achievement Test, for which validity data were to be obtained. Because of the purpose of this study, the parts of the WRAT administered were confined to the ones included in the Health Examination Survey, i.e., the Reading and Arithmetic sections. Two levels are available for each

of these sections in the 1963 revision of the WRAT. One is designed for primary school children and the other for secondary school children. In this study one or the other form was used, depending on the appropriate grade level.
The Arithmetic section of the Wide Range Achievement Test consists of a series of written arithmetic problems ranging from simple addition and subtraction through algebraic problems. Although defined as a timed test, it is a power test in the sense that the outside time limit of 10 minutes amply permits the students to work up to the maximum level of their arithmetic skills.
The Reacting section of the test consists of a list of words ranking from very simple ones such as “cat, “ “go,” and “in” to complicated ones such as “belligerent” and “occurrence.” It is assumed that the student who fails to recognize a given word is likely to mispronounce it also. The test, nevertheless, is not one of pronunciation or diction, and speech defects or colloquial usages are not penalized. For students at the very low level of ability the Arithmetic section contains an oral part and the Reading section contains a preword part involving letter recognition.
The criterion measures used were the group achievement tests. These tests were the Stanford Achievement Tests in the appropriate form, de-pending on the grade level, for grades 1 through 9 and the Metropolitan Achievement Test for grades 10 through 12. Each of these group achievement test batteries contains subtests which are directly pertinent as validating criteria for the WRAT. In addition, they contain other subtests covering school performance, which is less directly related to reading or arithmetic. In designing this study it was required that certain tests of immediate relevance as criterion variables be routinely administered, while the other subtests could be administered at the discretion of the participating schools. As a result the minimal amount of required data is reported at all grade levels while additional, or complete, data on the criterion batteries vary from one grade to the next, de-pending upon the discretion of the schools.
Stanford Achievement Test
The specific forms of the Stanford Achievement Test (SAT) which were used are as follows: Primary I, Form W, for grade 1; Primary 11,
Form W, for grades 2 and 3; Intermediate I, Form W, for grade 4; Intermediate, Form J, for grades 5 and 6; and Advanced, Form Km, for grades 7, 8, and 9. Not all SAT forms have the same number of subtests. Thus, six subjects are covered at the first grade level, eight at the second and the third grade levels, ten at the fourth grade level, and nine at the fifth to ninth grade levels. The tabulations for data relating to SAT have been arranged to give maximum comparability from one grade level to the next. Missing data indicate subjects for which no SAT subtest was available at a given grade level because the particular school did not elect to administer the optional tests. The following paragraphs describe the subtests of the criterion batteries and their contents.
Two SAT subtests are diyectly yelevant criterion variables for the Reading part of the WRAT:
WoYdMeaning or Vocabulary (graaes 1-9). —
The Word Meaning, or Vocabulary, test employs a multiple choice type of item in which the pupil is required to select the proper answer for a given stimulus word from a series of three or four alternatives. This is essentially a word recognition test.
Pamgvaph Meaning (gYades 1-9) .—The Para-graph Meaning test consists of a series of paragraphs, graduated in difficulty, from each of which two or more words have been omitted. The pupil’s task is to demonstrate his comprehension of the paragraph by selecting the proper word for each omission from the choices that are given.
Four other subtests are useful as criteria for the Reading part of the WRAT because, theoretically, they are relatea to reading. These
are the following:
Spelling (graues 1-9) .—The Spelling test consists of multiple choice questions in which the pupil chooses the correct spelling from among three possible spellings or marks “rig” if the correct spelling is not given.
WoYa Study Skills (graaes 1-4). —The Word Study Skills subtest contains various combinations of auditory perception of beginning and ending sounds, phonics, and phono-
9

grams. For the beginning and ending sounds the pupil must match a word from a multiple choice selection matching the beginning or ending sound read by the teacher. The phonics involve selecting a written word which is the same as one he hears read by the teacher, and the phonogram requires matching a word he hears with a rhyming one which he reads.
Language (grades 2-5; 7-9).—This is an exercise in capitalization, punctuation, sentence sense, and language usage, with a few additional items of grammar. In all items a correct and an incorrect, or much less acceptable, usage are presented as options.
WoYa Reauing (grade 1) .—Pupils are required to look at a picture and then select the appropriate word from a multiple choice set. This subtest is designed to measure skills to analyze and identify words out of context.
The following three tests are used as the principal criterion variables Yelated to the Arithmetic portion of the WRA%
Arithmetic Concepts and Reasoning (gyades 1-9) .—The Arithmetic Concepts and Reasoning tests measure reasoning with problems taken from life experience, with the reading vocabulary being kept much below the problem-solving level being measured. Also tested here is the informational background of pupils and their understanding of the numbers system.
Arithmetic Computation (&aues 2-9) .—The Arithmetic Computation test measures proficiency in computational skills. The tests are multiple choice forms; the response “not given” is included as one of the choices in each question in order to discourage guessing.
Arithmetic Application. —This test occurs only at the fourth grade level and is designed to measure application of number concepts to practical situations.
Three additional criterion methods of school performance were included which are not azrectlv
~elatea to the predictive variables. These are the following:
Social StuUies (gyaaes 4-9). —The items in this test primarily measure social studies content or information with approximately equaI distribution among history, geography, civics, and social problems.
Science (graaes 4-9) .—This subtest contains about equal proportions of items from the areas of life science, health and safety, elementary physics, and chemistry, with a smaller representation for the earth sciences and conservation.
The form used for the second and third grade levels combines the above two topics into a Science and Social Studies Concepts test.
Stuay Skills (gYades 5-9). —This subtest measures study tools including reading charts, graphs, and tables; map reading; and using the dictionary.
Metropolitan Achievement Test
This test contains a total of 11 subtests, Because of the time factors involved, only 7 of the 11 subtests were given routinely, while 1 or more of the remaining tests were given in some of the grade samples, The five criterion variables thought to be most relevant (Reading, Spelling, Language, Mathematical Computation and Concepts, and Mathematical Analysis and Problem Solving) were administered in all instances.
One of the Metropolitan subtests, Reading, is a direct criterion for the WRAT Reading test:
Reading. —This test consists of four reading selections. The student’s reading comprehension is assessed by presenting him with multiple choice questions on content and word meaning.
Three other subtests are in~irectly relevant as criteria for the WRAT Reading test:
SPei~ing. —This test consists of a number of sentences, each containing one underlined term. The student has to decide whether the term is spelled correctly.
10

I
Language. —This test covers punctuation and
Icapitalization, recognizing correct word uses, and understanding correct word usage, as well as sentence structure.
Language Stuay Skills. —This is a test of the student’s ability to use a dictionary and to identify appropriate sources of information.
The following two tests serve as cviteyia for the WRAT Arithmetic Test:
Mathematical Computation ana Concepts. — This is a series of arithmetic problems comparable with those on the WRAT. However, answers are provided in multiple choice form and the procedure of solution may introduce a recognition element.
Mathematical Analysis and Problem Solving. —This is a set of somewhat more complex problems expressed in language form. They require the student to identify the problem as well as to select the correct solution from the set of multiple choice answers.
The remaining five Metropolitan Achievement subtests are not diyectly related to the WRAT:
Social Stuaies Information. —These are multiple ‘choice questions covering history, civics, and geography.
Social Stuaies Study SkilLs. —This subtest measures ability to read and interpret maps, tables, graphs, and charts and also assesses the student’s ability to draw inferences from such data.
Social Stuaies vocabu~ayy. —This is a multiple choice test of the student’s knowledge of terms (taken from newspapers, magazines, and school publications) relating to social science studies material encountered in and out of the classroom.
Scientific Concepts anct Unaen9tanaing. —This is a measure of the student’s science vocabulary and of his comprehension of printed scientific material of the kind covered in high school science courses.
Science Information. —This consists of multiple choice questions covering a broad area of the physical and biological sciences.
EXAMINATION PROCEDURE
The criterion achievement battery was ad-ministered by classroom teachers in the conventional manner in order to replicate the normal school use of achievement tests. To gain further assurance of normal administration, the services of the public school testing director were obtained to direct the group achievement test administration. In some instances the achievement tests were administered in a single day, but at other times 2 days were required.
In order to replicate the examination procedure used on the Health Examination Survey, the WRAT was administered individually. Examiners were classroom teachers from the participating schools who had been specially trained in WRAT administration. Although, for convenience and economy, children were examined by class-room teachers from their own schools, in no case was a child examined by his own teacher.
Each sample child was given the WRAT during one of two programed times (1) during the hour before the start of the day’s classes or (2) during the hour immediately after the end of the day’s classes. Children were randomly distributed between these two testing times. A systematic surveillance of’ the Reading test was effected by tape recording selected testing sessions.
Table 12 gives the number of examiners used in each grade for the Monongalia County samples and the control samples. Almost all examiners gave WRAT’S to children in all grade levels of the school in which they served as examiners. Differences in numbers of examiners at the secondary school level between the Monongalia County and control samples occurred because only teachers were used as examiners in the Monongalia County sample while graduate students in psychology were hired to supplement the examining staff in the control samples.
The teachers and other examiners were provided with a copy of the administration instructions lifted verbatim from the WRAT manual (see Appendixes I and II). In addition a training
11

----------------------------------- -- - - - - -- - - --- - ---- - --- - - - - - --
------------------------------------------------------------
Table 12. Number of examiners administering the WRATsubtests in the Monongalia County samples and in the control sampies,-by grade
Mo;::w;ia controlGrade
samples samples
Number of examiners
Grade 1------------Grade 2------------Grade 3------------Grade 4------------Grade 5------------Grade 6------------Grade 7------------Grade 8------------Grade 9------------Grade 10-----------Grade 11-----------Grade 12-----------
session wasconducted foreachgroup ofexaminers to insure uniform testing procedures. The examiners were instructed to serve primarily as recorders of the pupils’ responses. They were not expected to do any test scoring.
To insure uniformity inscoringandreporting of results, all tests were scored by research personnel. Achievement tests were machine scored directly from the students’ answer sheets
and then punched on IBM cards for analysis. Al’ WRAT’s were scored according to instructions ir the manual, and Jastak’s norms were used toobtaingrade level scores. Reliabilityofscoringwas spot checked and is reported in the following section.
RELIABILITY OF SCORING
PROCEDURE
The reliability of scores on the Reading section of the WRAT may have been seriously affected by three sources oftechnical error. The first of these was the failure of the examiner to record accurately whether the child correctly or incorrectly pronounced a given word. The second source of error was the scorers’ variability in interpreting the marks used by the examiners to recordthechildren’sperformances. A third possible source of error arose from the failure of the scorer to follow instructions todisregard correct responses made after 12 consecutive failures.
The first type of error was investigated by checking tape recordings of the Reading examination. Disagreements with the examiners appeared to be largely a matter of accepting localisms in pronunciation. The seriousness of this problem is underscored by the fact that for a sample of 30 records, a reviewer who was unfamiliar with local speech patterns obtained a
Table 13. Number of scoring errors made in processing WRATArithmetic and Reading tests, by sample
Ari.thmet-ic Reading
Number of errors Mononga lia Control Monongakia Control sample sample sample sample
(N=72) (N=72) (N=72) (N=72)
No error 7: 68 62 70 One error - 4 7 2 Two errors 2 Three errors 1 -
NOTES: Average scoring error per record: Arithmetic=O.035 points; Reading=O.111points.
N—number.
12

------
---
------
---
123456
123456
Table 14. Means and standard deviations on selected background data. bv grade for the..-Monongalia County elementary school ~am .es.
DayaOccupa- between Age at Grade leveltional Abili,ty individual time of at time of
Grade level of leve1 and group group test group testparent tests
Mean S.D. Mean S.D. Mean S.D. Mean S.D.z
Grade (N=l14)------- 4.69 2.84 5.00 9.26 6.98 0.36 1.80 0.01 Grade N-lll)------- 4.70 2.45 1.67 8.61 8.08 0.47 2.80 0.00 Grade [N=l13)------- 4.95 2.55 4.23 1.00 44.80 ;.;; 9.05 0.45 3.80 0.00 Grade (N=121)------- 4.65 2.53 4,32 1.05 3.45 10.17 0.56 4.80 0.00 Grade (N=105)------- ;.:; 2.29 4.08 0.97 8.32 5:19 11.13 0.67 5.80 0.01 Grade (N=l19)------- . 2.32 4.41 0.93 34.77 5.15 12.00 0.65 6.80 0.00
Combined rades2 and 3 ?N=224)------ 4.83 2.50 23.42 22.59 8.57 0.67 3.30 0.50
Combined rades5 and 6 fN=224)------ 4.97 2.32 4.25 0.96 27.69 18.91 11.59 0.79 6.33 0.50
NOTE: S.D.—standard deviation;N—number.
rho of .60withlocalexaminerdecisions.Pracalldisagreementstically ,however,wereresolved
infavoroftheexaminers‘scoringwhenallowancewas made forlocalisms.
The othertwo errorsourceswere investi-gatedby drawinga random sampleoftherecords
of threeboys and threegirlsfrom each gradeIevelandrescoringtheserecords.Table13givesthe frequencydistribution andof discrepanciessuggeststhatscoringerrorshave littleeffect
on dataanalysis.
Table 15. Means and standard deviations on selected background data, by grade for the..elementary school control sampl~s
DaysOccupa- between Age at Grade leveltion 1 Ability individual time of at time of
Grade level of leve1 and group group test group testparent tests
Mean S.D. Mean S.D. Mean S.D. Mean S.D. Mean S.D.
Grade (N=103)------ 4.18 Grade (N=104)------ 4.06
2.82 2.20
4.73 4.30
0.77 0.90
-1.63 9.78
8.70 13.98
6.95 8.03
0.26 0.37
1.87 2.86
0.05 0.05
Grade (N=104)------ 4.39 Grade (N=lOO)------ 4.01 Grade (N-llO)------ 4.54
2.85 2.88 2.50
4,44 4.82 4.25
0.70 1.11 1.01
0.99 12.77 9,95
3.45 6.30 8.75
9.27 9.97 11.03
0.55 0.32 0.40
3.80 4.88 5.90
0.00 0.04 0.00
Grade (N=106)------ 5.12 2.84 5.01 1.20 -4.27 8.17 12.25 0.65 6.80 0.00
Combined grades 2 and 3 (N=208)----- 4.23 2.55 4.37 0.81 4.39 11.51 8.65 0.78 3.33 0.47
Combined radea 5 and 6 7N=216)----- 4.82 2.69 4.63 1.17 2.97 11.06 11.63 0.82 6.34 0.45
NOTE: S.D.—standard deviation; N—number.
13

Il. THE ELEMENTARY SCHOOL STUDY
BACKGROUND DATA
The subjects for the Monongalia County sample for the elementary school study were obtained by the exhaustive testing of pupils in all six grades of three primary grade schools. These included one school in the central residential area, another in a predominantly middle-class area, and a third in a lower-class, semi-rural area. These schools were chosen in order to maximize the likelihood of obtaining a reason-ably representative selection of pupils from the population being studied. Table 14 shows that the desired results were approximated; that is, on ability and socioeconomic indices the population was close to, or slightly above, average.
Table 14 also includes data on the mean number of days that elapsed between the individual and group tests, the mean age of the students at the time the group test was administered, and the grade level at the time of the group testing. Intervals between individual and group tests for grades 3 and 6 are considerably longer than for the other grades. This may be accounted for by the fact that group test data for these children were obtained from a school-system wide testing program which was conducted approximately a month prior to the data collection for the present study.
Table 15 contains similar data on the control samples used in the elementary study. Comparison of tables 14 and 15 shows that the children in the control sample had parents of slightly lower socioeconomic status but that they averaged slightly higher on group tests of general ability. Mean age at the time of testing for the control samples was within a maximum of 3 months of the Monongalia County samples. The grade levels at the time the group tests were given were very close for the two samples, with a maximum discrepancy of a tenth of a grade level (or 1 month of class time). The matching for the control samples is probably as good as can be hoped for without census-type sampling procedures. Differences in general ability level need, however, be kept in mind when considering discrepancies between the principal and control samples.
ADEQUACY OF GRADE LEVEL
PLACEMENT
Tables 16 and 17 give the means and standard deviations for the entire population of WRAT raw scores and tables 18 and 19 give similar data for the grade level scores. Tables 18 and 19 show that except for the Arithmetic scores of the second and the fifth graders in the control sample, all subjects obtained WRAT scores somewhat above the actual grade levels of the class at the time the test was administered.
WRAT score means for the control and Monongalia samples for the elementary school study differed up to one grade level for the Reading section and up to approximately one-half grade level for the Arithmetic section and for the grade level estimate obtained by combining scores on Reading and Arithmetic. All differences are significant at the 1-percent level of confidence, except for the Reading section in grades 4 and 5 and for the combined Reading and Arithmetic score in grade 3.
The lower performance of the Monongalia first grade sample may have been due to the
absence of kindergarten classes. For the other grades, these data imply that the Colorado and Wisconsin samples demonstrated significantly higher skills in Reading than did the Monongalia sample. The Monongalia sample, in turn, significantly exceeded the California sample on both Reading and Arithmetic and the Colorado sample on Arithmetic alone.
Before suggesting that the above results yield positive evidence of overestimation of actual grade placement, attention must again be called to Jastak’s contention that the Reading and Arithmetic grade levels, similar to age-scale-derived intelligence quotients, cannot be expected to show systematic increment with grade wise promotion of pupils. To do justice to the test author, it is necessary, therefore, to determine the magnitude of the discrepancies of the findings of this study from the values given in the manual, Unfortunately, Jastak does not provide means and standard deviations for the samples on which his tables of norms
14

-------- -------- -------- ---
-------- -------- -------- ---
Table 16. Means and standard deviations on the WRAT, by subtest and grade for the Monongalia County elementary school samples (raw scores)
ArithmeticArithmetic Reading
+ ReadingGrade
Mean S.D. Mean S.D. Mean S.D.
Grade l----------------------------------- 21.31 3.51 38.57 9.13 59.87 11.79 Grade 2----------------------------------- 26.60 2.96 50.37 8.61 76.97 10.30 Grade 3----------------------------------- 32.32 3.05 61.77 9.38 94.08 11.11 Grade 4----------------------------------- 34.10 3.43 66.20 12.09 100.31 14.60 Grade 5----------------------------------- 37.31 4.57 70.16 9.28 107.48 11.81 Grade 6--,.----- 44.00 5.88 78.03 9.10 122.04 13.25
Combined grades 2 and 3------------------- 29.49 4.15 56.12 10.66 85.60 13.71
Combined grades 5 and 6------------------- 40.87 6.27 74.34 9.99 115.21 14.54
NOTE: S.D. -standard deviation.
are based, While a test of significance of discrepancies istherebyprecluded, itisnevertheless possible tomake a direct assessment ofthemagnitude of discrepancies by obtaining from Jastak’s manual the grade level equivalent tothe50th percentile atthe meanageofthis study’ssamples.
Tables 20 and 21 give the magnitudes of discrepancies from actual grade placement and from Jastak’s norms. These tables also contain the t-ratios for the test of significance of mean differences between obtained WRAT grade level scores and actual grade placement. Actual grade
Table 17. Means and standard deviations on the WRAT. bv subtest and grade for the elementary school control samples (ra; scores)
Grade
Grade l-----------------------------------Grade 2-----------------------------------Grade 3-----------------------------------Grade 4-----------------------------------Grade 5---------------------------------- -Grade 6 --------
Combined grades 2 and 3-------------------
Combined grades 5 and 6-------------------
NOTE: S.D. —standard deviation.
Arithmetic Reading Arithmetic
+ Reading
Mean S.D. Mean S.D. Mean S.D.
24.68 2.09 44.50 8.54 69.17 9.95 24.70 2.30 47.69 9.87 72.30 11.17 30.81 2.15 63.55 10.27 94.07 12.03 34.11 3.44 71.86 10.40 105.97 12.60 36.94 4.36 68.31 11.21 105.15 13.94 45.07 5.73 79.09 11.77 124.16 16.38
27.75 3.78 55.62 12.82 83.18 15.91
40.93 6 ;50 73.60 12.69 114.48 17.91
15

- - - -- - -- --- -- -- -- -- - -- -- -- - - - --- - --- - - ----
-- --- - - - -- - - -- - - - - -- -- - - -- - -- - -- - - - - - - - - - -
-- - -- - - -- -- - -- - -- - - - - - - - - -- - --- - - --- - --- - - -- - - - - -- -- - - - -- - -- - - - - - - - - - - -- --- - -
-------- -------- -------- -------- --
------------------
r
Table 18. Means and standard deviations on the WRAT, by subtest and grade for the Monongalia County elementary school samples (grade level scores)
ArithmeticArithmetic Reading + Reading Grade
Mean S.D. Mean S.D. Mean S.D.
Grade 1.97 0.59 2.06 0.76 2.02 0.60 Grade ;------------------------------------------ 3.02 0.69 3.08 1.03 3.05 0.72 Grade 4.49 0.72 4.74 1.63 4.62 1.02 Grade 4.91 0.77 5.70 2.31 5.30 1.43 Grade 5- - -- - - . 5.62 1.04 6.33 2.00 5.97 1.29 Grade 6 7.60 2.01 8.24 2.44 7.92 1.93
Combined grades 2 and 3-------------------------- 3.76 1.02 3.92 1.60 3.84 1.18
Combined grades 5 and 6-------------------------- 6.67 1.91 7.34 2.44 7.01 1.92
NOTE: S.D.— standard deviation.
2------------------------------------------
placement atthe timetheWRAT wasadministered actual grade level estimate. The adiusted method is obtained by adjusting the grade level at the also yields WRAT overestimates ;f grade level time the group test was taken bytheaverage time except for the second grade control sample and elapsed between the individual and group tests. for the fourth and fifth grade arithmetic scores
Results of these comparisons suggest that on both the principal and the control samples. the WRAT tends to overestimate grade level Since all but the second and fourth grade even when Jastak’s norms are used to adjust the control samples are slightly above average in
Table 19. Means and standard deviations on the WRAT, by subtest and grade for the elementary school control samples (grade level scores)
ArithmeticArithmeti-c Reading + Reading Grade
Mean S.D. Mean S.D. Mean S.D.
Grade 1------------------------------------------ 2.56 0.38 2.53 0.81 2.54 :.:: Grade 2------------------------------------------ 2.59 0.48 2.87 1.05 2.73 Grade 3------------------------------------------ 4.13 0.59 5.10 1.87 4.61 ;:;; Grade 4------------------------------------------ 4.92 0.77 6.76 2.27 5.84 Grade 5--------- 5.53 0.98 6.09 2.25 5.81 1:46 Grade 6------------------------------------------ 7.87 1.89 8.69 2.60 8.28 2.02
Combined grades 2 and 3-------------------------- 3.36 0.94 3.99 1.88 3.67 1.32
Combined grades 5 and 6-------- 6.68 1.90 7.36 2.76 7.02 2,15
Wl!JI: S.D.—standard deviation.
16

-----
-----------
-----------
I
I
! Table 20. Discrepanciesbetween observedWRAT grade level scores,actualgrade level, and Jastak’sage norms, by subtest and grade for the MonongaliaCounty elementaryschool samplea
DiscrepancyfromDiscrepancyfrom actual grade level
Jastak’s age norms
Arithmetic I Grade Arithmetic Reading + ArithmeticReading
Arithmetic Reading +Reading
D t D t D
I Grade L-------------- 1-0.15 12.68 +0.24 Grade 2-------------- +0.21 13.18 +0.27
13.38 +0. 20 12.75 +0.24
13.51 13.48
-0.05 -0.29
-0.16 -0.23
-0.20 -0.26
Grade 3-------------- +0.54 17.94 +0.79 15.16 +0.57 15.94 +0.44 +0.69 +0.57 I Grade 4-------------- +0.10 1.43 +0.79 13.76 +0.49 13.77 -0.10 +0 .69 ::.;;
I Grade 5-------------- -0.21 ~2.08 +0.50 Grade 6-------------- +0.68 3.70 +1.32
+o.141:::: +1.00 1;:;:
-0.11 +0.33
+0. 10 +0.97 +0:65
I C~m;t&a$ grades ------.-.---- +0.38 17.60 +0.54 15.74 +0.46 18.21 +0.08 +0.24 +0.16
C~~k&~ grades-------. +0.13 1.14 +0.92 16.01 +0.59 15.09 -0.17 +0.50 +0.17
Isiwificant at the l-percentlevel of ccmfidence.
NOTE: D-algebraic difference;t-t-test of the significanceof the differencebetweenmeans.
Table 21. Discrepanciesbetween observedWRAT grade level scores,actualgrade level, and Jaatak’aage norms, by subtestand grade, for the elementaryschool control samples
.
DiscrepancyfromDiscrepancyfrom actual grade level Jastak’s age norms
ArithmeticGrade Arithmetic Reading +
Arithmeticr
Reading Arithmetic ReadingRea;ing
D t D trGrade 1------------ +0,69 Grade 2------------ -0.30 Grade 3------------ +0. 33
‘18.65 +0.66 16.52 -0.02 15.69 +1.30
18.25 +0.67 0.20 -0.16 17.10 +0.81
112.89
1;:;;
+0. 74 -0.51 +0.08
+0.71 -0.23 +1.05
+0. 72 -0.37 +0. 76
Grade 4------------ +0.01 0.13 +1.85 18.15 +0. 93 14.10 +0.07 +1.91 +0.99 Grade 5------------ -0.40 Grade 6------------ +1.08
14.30 +0. 13 15.87 +1.90
0.61 +0.12 17.51 +1.49 1;:;:
-0.37 +0.67
+0. 16 +1.49
+0. 15 +1. 08
C~m;~; grades +0.03 0.71 +0.65 15.70 +0. 33 14.58 -0.08 +0. 54 +0.22
C~~ix&e~ grades +0.34 13.01 +1.02 ‘5.83 +0.68 15.67 +0. 30 +0. 98 +0. 64
Insignificant at the l-percentlevel Of confidence.
NOTR: D-algebraic difference;t—t-test of the significanceof the differencebetweenmeans.
17

------
------
----------
------
------
-------
Table 22. Means, standard deviations, and discrepancies from actual grade level on the Stanford Achievement Teat, Form Primary I, by sample and subtest for grade 1 -
Subtest
Word Reading-Paragraph Meaning
Vocabulary--- -Spelling W$orl;udy
Arithmetic-
Word Reading-ParagraphMeaning
Vocabulary----Spelling W%orludy
Artthmeti.c---
‘Significant of confidence.
Mean S.D. D t
Mono galia County sample (N=114)
1.80 0.58 0.00 0.00
1.91 0.57 +0.11 ~2.04 2.28 1.03 +0.48 1.95 0.54 +0.15 1::::
2.16 0.95 +0.36 14.042.08 0.61 +0.21 13.68
Wisconsin control sample (N=103)
2.17 0.52 +0.30 15.88
2.15 0.59 +0.28 14.832.24 0.68 +0.37 ‘5.442.29 0.66 +0.42 16.56
2.60 1.00 +0.73 17.372.L2 0.48 +0.25 15.21
at the l-percent level
NOTE: N—number; S.D.—standard devi,ati.on; D—algebraic difference; t—t-test of the significance of the difference be-tween means.
general ability, it is conceivable that the latter variable may account for the overestimation that occurred in the present study. Comparison of grade level estimates from the WRAT and the criterion measures will further bear on theissue of adequate grade placement and will reexamined inone of the following sections.
PERFORMANCE ON THE SAT
Means and standard deviations for the grade scores on the Stanford Achievement Test are reported in tables 22 through 27. Data have been tabulated separately for Primary Form I, used in the first grade; Primary Form II, used in the
second and third grades; Intermediate Form I, used in the fourth grade; andIntermediate FormJ, administered to the fifth and sixthgradechildren. ‘heverycase,d inferences fromactualgrade level attime oftest administration havebeencomputed, and these, along with the significance andmagnitude of the differences, are given in the above-mentioned tables. Our data suggest that the samples used for the elementary school study perform at, orslightlyabove,thenormedaverages on the group achievement measures. There are some minor discrepancies betweentheMonongalia County and control samples, with the formergenerally scoring slightly higher inall but the first grade samples.
Significantly higher than average performance was shown by all of the first graders on Vocabulary, Spelling, Word Study Skills, and Arithmetic; the Wisconsin control sample also scored higher on Word Reading and Paragraph Meaning. The second and third graders in the Monongalia County sample scored significantly above average on Science and Social Studies Concepts, and the third graders were also above average on Arithmetic Concepts. But the California second grade control sample was below average on all SAT variables, while the third grade (Colorado) control sample exceeded the norms for Word Meaning, Science and Social Studies Concepts, Spelling, Word Study Skills, and Language.
Performance of the fourth grade samples was at the normative level except for above average performance on Social Studies by the principal Monongalia sample and significant below average performance on Arithmetic Computation by the Wisconsin Control sample.
In graded 5 and 6 the Monongalia County samples attained above grade level means for Spelling, Social Studies, Science, and Smdy Skills, while the fifth grade sample had below average performance on Arithmetic Computation. The California fifth grade sample scored below average on all SAT subtests, while the Colorado sixth grade sample was significantly above normative levels on Paragraph Meaning, Spelling, Language, and Study Skills.
Most of the significant discrepancies of the SAT from actual grade level ranged from one-
18

------
----------
------
Table 23. Means, standard deviations, and discrepancies from actual grade level on the StanfordAchievement Test, Primary Form 11, by subtest for the Monongalia County samples, grades 2 and 3
Grade 2 Grade 3 :ombined grades 2 and 3 (N=lll) (N=113) (N=224)
Subtest
Nean S.D. D t Mean S.D. D t Mean S.D. D t
Word Meaning 2.73 0.75 -0.07 0.99 3.85 1.12 +0.05 0.47 3.30 1.11 0.00 0.00 Paragraph Meaning- 2.87 0.80 +0.07 0.92 3.95 1.11 -}0.25 2.45 3.42 1.11 -1-0.12 1.82 Science and Social Studies Concepts- 3.11 1.15 +0.31 12.84 4.32 1.21 +0.52 14.56 3.72 1.32 +0.42 15.32
Spelling---------W- 2.73 0.79 -0.07 0.93 3.97 1.14 +0.17 1.57 3.36 1.16 +0.06 ;.:; ord Study Skills- 3.02 1.46 +0.22 1.58 4.07 1.60 +0.27 1.80 3.55 1.62 +0. 25 Language 2.83 1.04 -40.03 0.30 4.00 1.16 +0. 20 1.83 3.42 1.25 +0.12 1:64 Arithmetic Computation------ 2.72 0.61 -0.08 1.38 3.72 0.65 -0.08 1.31 3.22 0.81 -0.08 1.90
Arithmetic Concepts--------- 2.75 0.92 -0.05 0.57 4.20 1.20 +0.40 13.51 3.48 1.29 +0. 18 2.47
I
lSi@ificant at the l-percent level Of confidence.
NOTE: N-number; S.D.— standard deviation; D-algebraic difference; t—t-test of the significance of the difference between means.
fourth to three-fourths of a grade level. The RELATION OF THE WRAT discrepancies from actual grade level inthecri-
TO THE SATterion must, of course, be considered inevalusting the seriousness of the deviations of the Validity coefficients describing the relation WRAT from actual grade level. Appropriate of the WRAT and the Stanford Achievement analyses of this complicating problem are re- Test have been grouped together for all grades
ported following the discussion of the WRAT’S to permit easier comparison. The reader must relation to the criterion measures. be reminded again that, due to the age levelof
Table 24. Means, standard deviations, and discrepancies from actual grade level on the Stanford Achievement Test, Primary Form II, by subtest for the California and Colorado control samples, grades 2 and 3
Grade 2 Grade 3 ICombined grades 2 and 3 (N=104) (N=104) rN=208)
Subtest
Mean S.D. D t Mean S.D. D t Mean S.D. D t--1--Word Meaning 2.36 0.60 -0.50 18.62 4.15 1.3s +0.35 12.74 3.26 1.35 -0.07 0.92 Paragraph Meaning- 2.40 0.66 -0.46 17.19 4.10 1.34 +0. 25 1.91 3.25 1.36 -0.08 1.03 Science and Social + Studies Concepts- 2.62 0.73 -0.44 16.11 4.31 1.47 +0.51 13.54 3.46 1.44 +0. 13 1.53
Spelling---------- 2.58 0.87 -0.28 13.33 4.22 1.18 +0.42 13.62 3.40 1.32 +0.07 0.93 Word Study Skills- 2.40 0.95 -0.46 14,95 4.61 1.85 +0.81 14.48 3.50 1.84 +0. 17 1.53 Language---------- 2.54 0.64 -0.42 16.77 4.26 1.54 +0.46 13.05 3.40 1.46 +0.07 0.81 Arithmetic Computation------ 2.30 0.50 -0.56 111.67 3.94 0.77 +0. 14 1.87 3.12 1.04 -0.21 14.20
Arithmetic Concepts--------- 2.30 0.69i -0.56 18.36 3.97 1.32 +0.17 1.32 3.13 1.34 -0.20 12.60T I
I.Significantat the l-percent level of confidence.
NOTE: N-number; S.D.-standard deviation; D-algebraic difference; t-t-test of the significance of the difference between means.
19

-------------------------------------
-----------------------------------------
-------------------------
------------------------
---------------------------------------------
--------------------------
--------
------
-----------------
Table 25. Means, standard deviations, and discrepancies from actual grade level on theStanford Achievement Test, IntermediateForm I, by sample and subtest for grade 4
Monongali.aCounty sample Wisconsin control sample(N=121) (N=1OO)
Subtest
Mean S.D. D t Mean S.D. D t
Word Meaning 4.99 1.47 +0.19 1.42 5.02 1.52 +0.14 0.92 Para raph Meaning 5.16 1.89 +0.36 2.09 5.14 1.83 +0.26 1.43 Spelf“mg 5.00 1.69 +0.20 1.30 4.98 1.54 +0.10 0.65 Word Study Skills 4.61 1.87 -0.19 1.12 5.25 1.88 +0.37 1.97 Language 4.91 1.92 +0.11 0.63 4.61 1.74 -0.27 11.55 Arithmetic Computati~----------- 4.86 0.93 +0.06 0.71 4.16 0.69 -0.62 8.98 Arithmetic Concepts 5.03 1.49 +0.23 1.70 5.14 1.54 +0.26 1.69 Arithmetic Applications 4.84 1.54 +0.04 4.83 1.35 -0.05 0,37 Social Studies 5.34 1.46 +0.54 1::;; 5.15 1.59 +0.27 1.71 Science 5.14 1.69 +0.34 2.21 5.21 1.72 +0.33 1.93
lSignif3_cantat the l-percent level of confidence.
NOTE: N-number; S.D.—standard deviation; D—algebraic difference t—t-test ofthe significanceof the difference between
thechildren notallcriterioninvolved, measuresare availableat allages.Dashesinthecolumns
of tablesindicatesuch missing data.Validityare givenseparatelycoefficients foreachgrade
and for the combinedsecondand thirdgradesand combinedfourthand fifthgrades.Table 28
means.
liststheappropriate measuresrelating. . validity theSAT grade scoresto thegradelevelscores on theVIRAT Arithmetic Valuesforthesection.relationshipswith the most pertinentcriteriahave been boxed.Coefficientsfortheindividualgrade samples (for ArithmeticConceptsand
Table 26. Means, standarddeviations,and discrepancies from actual grade level on the Stanfordk~i~vemant Test, Intermediate Form J, by subtest for the MonongaliaCounty samPles,grades 5
IGrade 5 Grade 6 Combinedgrades 5 and 6 (N-105) (N=119) (N=224)
Subtest
MeanJ S.D. D t klean S.D. D t Mean S.D. D t
+ ParagraphMeaning- ~.;; 1.71 +0.33 1.98 7.23 2.00 +0.43 1.95 +0.38 13.04 Word Meaning 1.53 +0.16 1.07 7.19 1.65 +0. 39 1.71 +0.29 12071 Spelling 6:23 1.46 +0.43 13.03 7.45 1.77 +0.65 1.74 +0.55 15.05 Langusge 5.85 2.08 +0.05 0.25 7.17 2.23 +0.37 2.26 +0.22 1.52 Arithmetic Reasoning 5.56 1.20 -0.24 2.05 7.04 1.48 +0.24 1.76I 6.35 1.55 +0.02 0.22 ArithmeticComputation 5.37 0.97 -0.43 14.53 6.81 1.16 +0.01 6.14 1.30 -0.19 12.60Social Studies---- 6.35 1.54 +0.55 13.67 7.51. 1.75 +0.71 6.97 1.75 +0.64 15.82Science 6.57 1.99 +0.77 13.97 7.40 2.04 +0.60 13.21 7.01 2.06 +0.68 ‘5,04Study Skills 6.48 1.95 +0.68 13.58 7.90 2.13 +1.10 15.64 7.23 2.17 +0.90 16.52
I
lsieificant at the l-percentlevel Of confidence.
NOTE: N—number; S.D.—standard deviation; D—algebraic difference;t—t-test of the significance of the differencebetweenmeans.
20

------
----------
--------
---
--- ------ ---
---
---
--- --- --- ---
--------
-----------------
--- ---
---
---
---
---
---
---
---
---
---
---
---
---
---
---
---
-----
--- ------ ---
---
---
------
---
--- ---
---
---
---
---
---
---
--- --- ---
---------
---------
Table 27. Means, standard deviations, and discrepancies from actual grade level on the Stanford Achievement Test, Intermediate Form J, by aubtest for the California and Colorado control samples, grades 5 and 6
Grade 5 Grade 6 lCombined grades 5 and 6(N=11O) (N=106) (N=216)
Subtest
I Mean S.D. D t Mean S.D. D TtMean S.D. D t
Paragraph Meaning- 5.42 1.69 -0.48 12.98 7.23 2.07 +0.53 12.69 6,31 2.09 -0.03 0.22 Word Spelling---------- . 1.59 -0.22 1.45 7.75 1.74 +0.95 g:;; ;:;: 1.96 +0. 36 1$:;
Language 5.19 2.20 -0.71 13.38 7.37 2.16 +0.57 12.77 6.26 2.44 -0.08 0.52 Arithmetic Reasoning 5.57 1.28 -0.33 12.70 6.82 1.60 +0.02 0.13 6.18 1.57 -0.16 1.62 Arithmetic
Meaning ;.;; 1.33 -0.13 1.03 6.76 1.81 -0.04 1.66 -0.08
I I Computation------ 5.41 1.10 -0.49 14.67 6.65 1.15 -0.15 1.36 6.02 1.29 -0.32 14.10
Social Studies---- ;.;; 1.38 -0.06 6.91 1.78 +0.11 0.65 6.37 1.68 -0.03 0.28 Science----------- 1.93 -0.50 1;::; 6.79 2.03 -0.01 -L2.10 -0.28 2.06 Study Skills------ 5:58 1.72 -0.32 1.96 7.74 2.00 +0.94 1:::; ;:;; 2.15 +0. 30 2.24
I Insignificantat the l-percent level of confidence.
NOTE: N-number; S.D.— standard deviation; D—algebraic difference; t—t-test of the significance of the difference between means.
Table 28. Validity coefficients describing the relation of the WRAT Arithmetic grade level scores with the grade level scores on the Stanford Achievement Test, by grade, sample,. and subtest for. the elemefitaryschool samples
Combined CombinedGrade 1 Grade 2 Grade 3 Grade 4 Grade 5 Grade 6 grades 2 gra:; 5
Subtest and 3
—
M c M c M c M c M c M c MCT M c
Word Meaning t or Vocabulary-- .44 .25 .47 .35 .33 .59 .60 .61 .59 .56 .64 .48 .59 .76 .67 .59
P~ara:h -.------ .45 .55 ;:; .50 .51 .61 .59 .61 .60 .54 .58 .44 .63 .77 .62 .56
Spelling .55 .65 .45 .36 .54 .56 .47 .46 .58 .59 .64 .62 .74 .61 .72 W::orl;:udy
.34 .51 .21 .&3 .39 .57 .56 .54 .44 .73 Language .48 .30 .46 .59 .63 .59 .61 .42 .65 .67 .63 .71 .66 .66 Word Reading---- .51 .55
—Arithmetic Concepts and Reasoning .61 .55 .59 .49 .64 .70 .75 .53 .78 .72 .78 .51 .76 .86 .82 .65
M.thmetic Computation---- .74 .59 .64 .61 .72 .68 .63 .69 .74 .50 .82 .79 .78 .67 Arithmetic Application---- .70 .63
— 1.60
1
.52Social Studies-- ..,-.63 .28 .39 .52 ,70 .57 .45 .57 .59 .38
.64 .69Scf.ence .58 .55 .59 .59 .53 .38 .55 .53Study Skills---- .64 .70 .71 .44 F-- .71 .65
NOTES: Social Studiee and Science were combined in a single subtest in the form usedfor grades 2 and 3.
M-Monongalia County samples; C-control samples.
21

---
---
---
---
---
---
---
---
---
---
---
---
---
---
----------------
-------- ------ --- ---
---
---
---
---
---
---
---
---
---
--- --- ---
-----
--
---------
----
------------
---
---
---
---
--- --- --- ---
---
---
---
---
------------
Table 29. Validity coefficients describing the relation of the WRAT Reading grade level scores with the grade level scores on the Stanford Achievement Test, by grade, sample, and subtest for the elementary school samples
Combined Combined Grade 2 Grade 3 Grade 4 Grade 5 Grade 6 gra~; 2 grades 5
and 6 Subtest
M c M c M c M c M c M c M c M c t
ord Meaning uor Vocabulary-- .68 .41 .79 .76 � 79 .75 .83 .70 .68 .79 .66 .60 .84 .84 .72 ,7L Paragraph Meaning .87 .79 .79 .71 .79 .78 .74 .71 .59 .65 .63 .48 .84 .85 .65 .64 Spelling .76 .80 .77 .84 .78 .81 .76 .63 .64 .76 .72 .80 .84 .88 .73 .84 ord StudySkills--------- .64 .77 .72 .72 .71 .78 .83 .78 .74 .85
Language -i .81
.67 .54 .72 .72 .77 .71 .67 .63 .62 .74 .77 .79 � 68 ,75 ord Reading---- 1
Arithmetic
Reasoning .64 .45 .64 .53 .55 .71 .62 .46 .47 .60 .54 .45 .70 .79 .60 .60 ArMunetic Computation-- .37 .33 .55 .54 .57 .65 .21 .47 .41 .43 .64 .71 .47 .57
Arithmetic Application----Social Studies--Science
.51 .21 .59 .51
.54
.63
.68
.62
.68
.68 .66 .64
.72
.68 .67 .54
.53
.46 .66 .64 .71 .60
.66
.63
Concepts and
Study Skills---- .64 .63 .61 .48 .67 .65
NOTES: Social Studies and Science were combined in a single subtest in the form used in grades 2 and 3.
M-Monongali.a County samples; C-control samples.
Reasoning, Arithmetic Computation, and Arithmetic Application) range from .59 to .78 for the Monongalia County samples and from .49to .72
in the control samples. Similar coefficients for the combined grades range from .76 to .82 and from .65to .86, respectively.
Substantial construct validity is supported,
at least in the principal sample, by the fact
that the most pertinent validity coefficients are higher than the associations with other criterion variables which are unrelated to the arithmetic
tasks. There seems to be some progression in increased validity from the first three grades to the higher grades. Most likely this reflects the
fact that the WRAT has, of necessity, fewer
items to be administeredto children in the lower grades, thus producing reduced variability.
The validity coefficients describing therelation between the Reaaing section of theWRATand
the grade scores of the Stanford Achievement
Test are reported in table 29. Validities for the
most pertinent, criteria (including Word Meaning
or Vocabulary, Paragraph Meaning, Spelling, Word Study Skills, Language, and Word Reading) are again boxed in this table. Their values range for the individual grades from .59 to .87 in the Monongalia County samples and from ,41to .84 in the control samples. The combined grade samples yield validity coefficients ranging from .65 to .84 and from .64 to .88, respectively. Itis again noted that evidence for construct validity may be inferred from the fact that the language-related subtests of the SAT have higher validities than the arithmetic-related ones when compared with theWRAT Reading section.
The validity coefficients describing the relationship between the combined Arithmetic and Reading grade level scores from the WRATand
22

---
---
------------
---
---
---
---
---
---
---
---
---
---
---
---
---
---
-----
--------
--------
-----
---------
---
---
------------
---
---
---
---
---
---
---
---
---
---
---
---
---
---
---
---
---
---
---
---
---
---
---
---
---
---
the grade scores from the Stanford Achievement Test are given in table 30. Use of the combined Arithmetic and Reading (A + R) score, as predicted, raises validities for the measures which are not specifically language or numerical ability related, but it does not markedly affect coefficients for the more specific measures.
DISCREPANCIES BETWEEN WRAT
AND SAT GRADE LEVEL ESTIMATES
A set of validity coefficients does no more, of course, than indicate the extent to which the distribution of scores on a predictor variable conforms to, or can be linearly transformed into, a set of scores on a criterion variable. It does not in itself give information on the magnitude of discrepancies in estimating grade levels on the criterion from the predictor measure. In previous sections the discrepancies of the test scores from
actual grade level at time of testing have been examined. These are necessarily related to the question, How closely do the samples conform to national averages? Quite independent thereof, and within this closed system, it is possible to examine the question, How well does the WRAT approximate the grade level estimates on the criterion instrument?
Discrepancies between the grade level means for the most pertinent criterion variables and the WRAT Arithmetic section are given in table 31 together with the t-ratios for the significance of these differences. It will be noted that the Arithmetic section of the WRAT significantly overestimates achievement on Arithmetic Concepts and Reasoning for the second and sixth grade samples as well as for the two combined samples. Arithmetic Computation, moreover, is overestimated by the WRAT at all levels except for the fourth grade sample. Overestimates of the
Table 30. Validity coefficients describing the relation of the WRJITcombined Arithmetic and Reading grade level scores with the grade level scores on the Stanford Achievement Test, by grade,sample, and subtest for the elementary school samples
*
Subtest
Word Meaning orVocabulary
ParagraphMeaningSpelling--------W$orl;udy
--------.LanguageWord Reading----ArithmeticConcepts andReasoning
ArithmeticComputation----
ArithmeticApplication---Social Studies-ScienceStudy Skills----
Combined Combined Grade 1 Grade 2 Grade 3 Grade 4 Grade 5 Grade 6 grades 2 g:;~: 5
and 3 — —
M c M c M c M c M c M c M c M c . — —
,65 .40 .79 .73 .74 .77 .83 .70 .77 .79 .75 .61 .82 .87 .79 .70
.77 .79 .76 .75 .81 .81 .75 .71 .70 .68 .70 .51 .84 .88 .72 .67
.75 .84 .77 .83 .75 .81 .77 .63 .68 .78 .76 .81 .83 .89 .77 .85
.57 .76 .62 .73 .70 .79 .82 .78 .69 .86 .71 .54 .73 .75 .80 .71 .77 .63 .73 ,79 .79 .82 .75 .78
.77 .81
.70 .54 .74 .60 .66 .77 .71 .46 .68 .70 .75 .52 .80 .84 .79 .67
.61 .47 .66 .61 .66 .65 .41 .59 .65 .51 .79 .81 .69 .66
;;: .62
.66 .26 .61 .56 .68 .70 .75 .73 .51 .75 .65 .70 .68 .74 .72 .62 .48 .72 .70 .65 .63
.76 .71 .76 .51 .78 .71
NOTES: Social Studies and Science were combined in a single subtest in the form used for grades 2 and 3.
M—Monongalia County samples; C—control samples.
23

Table 31. Discrepancies between selected criterion measures from the Stanford Achievement Test and the Arithmetic section of the WRAT, by. subtest, sample, and grade ;or. the elementary school samples
Arithmetic Concepts and Reasoning Arithmetic Computation
Grade
Grade l--------------------Grade 2--------------------Grade 3--------------------Grade 4--------------------Grade 5--------------------Grade 6--------------------
Combined grades 2 and 3----
Combined grades 5 and 6----
Monongalia county samples
D t
-0.13 2.60 +0. 26 13.61 +0. 14 1.63 -0.13 1.33 +0.05 0.68 +0 � 44 13.46
+0. 20 13.77
+0. 23 13.15
Control samples
D t
+0. 44 110.73 -1-0.26 14,33 +0. 16 1.63 -0.25 1.91 -0.07 +1.06 1;:;;
+0. 22 ‘4.40
+0. 50 14.95
Monongalia County samples
D t
. . . +0. 29 16:~(5
+0.62 111.27 +0. 04 +0. 24 1;:;; +0.67 15.28
+0. 44 111.OO
+0. 44 15.50
Control samples
D t
. . . +0. 26 1,5:~i
+0. 19 13.1L -1-0.73 112.37 +0. 09 +1.23 1;:::
+0. 23 *5.23
+0.66 16.54
Insignificant at the l-percent level of confidence.
NOTE: D-algebraic difference; t-t-test of the si.gni,flcance of the difference be-tween means. -
arithmetic criteria range up to a maximum of two-thirds of agradelevel and are replicated by the control sample in all instances except Arithmetic Computation ofgrade 5.
Similar data for the Rc~ding section of the WRAT are presented in table 32. Here it is obvious that the WRAT overestimates the criterion grade levels for all but the Monongalia County first grade sample. WRATReadingscores exceed significantly theSATWord Meaningscores for grades 2, 3, 4, and 6. The WRAT Reading score significantly exceeds the SAT scores for Paragraph Meaning and Language at all grade levels and the Spelling score at all but the first and fifth grade levels. It is also significantly higher than Word Study Skills at the third and fourth grade levels and at the second grade in the control sample. The magnitude by which the WRAT Reading section overestimates the criterion measures of verbal skills ranges up toa
full grade level and averages at approximately one-half grade levels. Again these findings are uniform for both samples except for Word Meaning at the first grade level.
THE WRAT SECTIONS
Interrelationship
Since the WRAT is being used as a brief estimate of school achievement, one mustfurther ask the question whether combining the scores from the Arithmetic and Reading sectionswould provide amore adequatepredictor ofgradeplacement or whether either of the two sections might prove to be a sufficient brief estimate ofachievement level. The relevant data are presented in table 33, where the intercorrelations be-tween the two sections of the WRAT are listed together with the correlation of each individual
24

--
--- ------ ---
--- ---
------
---
-------------------
----------------------------------------- ----
---------------------------------
------
---
---
1
I
I Table 32. Discrepanciesbetween selectedcriterionmeasures from the StanfordAchievementTest and the Reading sectionof the WRAT, by aubtest, sample,and grade for the elwentary school samples
-
Word Meaning or Vocabulary ParagraphMeaning Spelling
Monongalia Contro1 Monongalia Control Monongalia Contro1
samples samples County countyGrade county samples samples samples samples
-2-l-=D t D t D t D t I D t ,
Grade 1--- -0.24 13.38 +0.29 13.6 +0.13 13.61 +0.48 19.8 +0.09 1.92 +0.24 15.00 Grade 2--- +0.34 15.67 +0.48 15.0 +0.24 13.94 +0.44 1600 +0.34 15:23 +0.26 14064 Grade 3--- +0. 74 17.79 +0.95 17.7 +0. 64 16.74 +1.00 i8.6 +0.62 16.39 +0.88 17.86 Grade 4--- +0.70 15.60 +1. 71 110.5 +0053 13.68 +1.59 19.8 +0.69 15.07 +1. 75 19.89 Grade 5---Grade 6---
+0.34 +0.93 %;;
+0.29 +1.94
2.1 19.5’
+0..17 +0.89 1;:!;
+0.64 +1.47
13.9 16.2
+0.07 +0. 67
1:: g +0.38 +0.95
12.71 16.13
Combined grades 2 and 3--- to.541 19.15 to.72 llO.OI +0.42 17.00 +0073 110.2 +0.48 18.28 +0.58 18.79
Combined gra:e;d5
+0.64 ‘5.61 +1.11 18.21 +0.54 14.29 +1. 05 17.2 +0.37 13.33 +0. 66 16.23
Word Study Skills Language
Grade Monongalia Controlcounty
D tD t D
samples
D
samples ‘w
t$t Grade 1---------------- -0.08 1.14 -0.07Grade 2--------------------------- -KI.05 ;yj +0.24 13xi +0:;6 13X6Grade 3------------------- +0.52 $:;; z::: +0.59 ;5.51 +0.84 16.51 Grade 4 +1.08 9.08 -!=1.47 110:50 +0.78 5.82 +2.12 h: ;;; Grade 5--------- +0.45 12.78 +0.87 Grade 6-------------------- +0.95 14.15 +1.33 17:78
Combined grades 2 and 3--------------- +0. 29 13.72 +0.48 ‘6.76 +0.42 16.05 +0.58 17.25
Combined grades 5 and 6--------------- T +0.70 15.51I +1.10 18.73
&ignificant at the l-percent level of confidence.
NOTE: D—algebraic difference;t-t-test of the significanceof the differencebetween means.
section with the combined Arithmetic andReading would therefore be chosen as the appropriate de-score. It is found here that from one-fourth to vice if it were deemed necessary to reduce the one-third of the variance of the two sections time allocated by the Health Examination Survey is common. The Reading sectibn, moreover, is to the achievement measures. This conclusion a superior estimate of the combined score and on the use of parts of the WRAT as a sufficient
25

- - --- -- - - - - - - - -- -- - -- - -- - - - --- -- - - - - - - - - - .67 .46 .45 .66 .38
.63
.38
.50
Table 33. Correlation of the Ari_thmeti,c and Reading secti,ons of the WRAT.and correlation of each section with the Arithmetic and Reading (A+ R) composite score, b sample and grade for the elementary school samples (raw scores and grade level scores !?
Arithmetic with Ari.thmeti_c Reading
Reading with A + R with A + R Grade
M c M c M c
Raw scores
.61 .82 .73
.51 .67 .66
.57 .66 .68
.54 .78 .72
.52 .69 .72
.72 .83 .87
.75 .81 .84
.71 .83 .87
Grade level scores
.57 .86 .78
.43 .75 .70
.59 .70 .74
.54 .78 .72
.58 .69 .78
.62 .84 .86
.73 .85 .88
.70 .85 .89
Grade 1 .Grade 2------------------------------------------•Grade 3------------------------------------------•Grade 4------------------------------------------•Grade 5------------------------------------------Grade 6------------------------------------------
Combined grades 2 and 3--------------------------
Combined grades 5 and 6--------------------------
Grade l------------------------------------------Grade 2------------------------------------------Grade 3------------------------------------------Grade 4------------------------------------------ Grade 5------------------------------------------Grade 6------------------------------------------
Combined grades 2 and 3--------------------------
Combined grades 5 and 6--------------------------
NOTE: M—Monongalia County samples; C—control
.55
.65
.58
.58
.39
.43
.62
.56
.98 .99
.97 .98
.97 .96
.98 .97
.93 .96
.94 .97
.97 .98
.94 .97
.92 .96
.90 .95
.95 .98
.98 .97
.93 .96
.89 .93
.94 .97
.91 .95
;amples.
estimator of school achievements further sup-
ported by the data reported in tables 28 to30 and is discussed in the preceding section.
Relation to General Ability and
Socioeconomic Status
The relation of the WRAT to general ability and to the socioeconomic status of parents is of
some concern in interpreting these results. Correlations with crude indices for the above
variables are therefore given in table 34. Re
lation to parent’s occupation ranges from quite low to moderate, and it may be concluded that the WRAT improbably equallysuitable forchildren
of different economic backgrounds. Moderate
correlations with general ability were found, and they tend to increase with age. While there is relatively little correlation inthefirsttwogrades,
the relationship increases to the pointofaccounting for one-fourth to one-half of the common variance.
26

------
---
------
---
------
---
Table 34. Correlation of the WRAT grade level scores with general ability level and with occupational level of parent, by subtest, sample, and grade for the elementary school samples
General ability level with: Occupational level
of parent with:
Grade Arithmetic ArithmeticArithmetic Read-ing + Reading Arithmetic Reading + Reading
Grade 1----------Grade 2----------Grade 3----------Grade 4----------Grade 5----------Grade 6----------
Combinedgrades 2 and 3--
Combinedgrades 5 and 6--
M c M c M c M c M c M c
.37 .33 .36 .28 .10 .30 .24 .32 .23
.10 .08 .10 .21 .01 .28 .07 .29 .06 .34 .34 .59 .31 .59 .35 .21 .39 .31 .41 .32 .44 .54 .56 .52 .51 .56 .57 .14 .30 .16 .29 .17 .32 .47 .58 .35 .53 .45 .60 .30 .23 .21 .27 .28 .28 .65 .52 .62 .58 .71 .62 .26 .14 .25 .34 .28 .28
.19 .21 .22 .19 .19 .28 .28 .27 .27
.57 .59 .51 .62 .59 .66 .28 .20 .25 .32 .29 .29
NOTE: M—Monongalia County samples; C—control samples,
111.THE JUNIOR HIGH SCHOOL STUDY
BACKGROUND DATA
Subjects for the junior high school studyin
Monongalia County wereobtainedby theexhaustive testing of all students in the lower three grades
of a semirural junior-senior high school andof
U students in a suburban junior high school. A semirural suburban junior high school was also
used in the three controlsamples. This particular selection of schools appearedto be the most fea
sihle one for obtaining a broad socioeconomic
representation. Tables 7 and 9 showdistributions which suggest that this objective was generally reached. The summary givenintable35, however,
suggests some noteworthy discrepancies in the junior highschool samples between theMonongalia
County samples and the control samples. The Monongalia samples showed an average socio
economic level quite characteristic for thatre
gion but significantly lower than the level found for the con?rol samples. Moreover, while the Monongalia samples were centered at about the
national average for intellectual ability, it was found that both the Wisconsin and Colorado samples were above average on intellectual ability. These regional discrepancies must be
noted and taken into account in the interpretation of findings for the junior high school samples. Table 35 also gives data on age at time oftest and actual grade level. Here the Monongalia and
control samples were close to each other.
27

-------------------
-------------------
-------------------
-------------------
Table 35. Means and standard deviations on selected background data, by grade and sample for the junior high school samples
Grade and sample
Total junior high
Monongalia County samples
Control samples
Grade 7
Monongalla Countysamples
Control samples
Grade 8
Monongali.a County samples
Control samples
Grade 9
Monongalla County samples
Control samples
NOTE: S.D. -standard
Occupa- Days tions 1 between Age at Grade level
level of individual time of at time of and group group test group testparent tests
Mean S.D. Mean S.D. Mean S.D. Mean S.D. Mean S.D,
3.50 2.57 3.92 0.95 1.21 12.73 14.06 1.09 8.82 0.83 4.95 2.40 4.58 1.01 -4.31 5,94 14.08 0.92 8.88 0.80
3.87 2.65 3.86 1.03 8.40 7.09 13.02 0.66 7.80 0.02 , 5.41 2.25 4.72 0,89 -6.04 3.82 13.05 0.42 7.85 0.05
3.12 2.63 3.92 0.93 10.73 5.42 14.08 0.78 8.80 0.01 4.54 2.24 4.11 0.89 -9.03 4.55 14.06 0.45 8.90 0.00
3.48 2.39 3.97 y~ -1;.;; 5.68 15.03 0.66 9.79 0.02 4.92 2.59 4.91 . . 2.63 15.05 0.43 9.80 0.00
deviation.
ADEQUACY OF GRADE LEVEL
PLACEMENT
Meansand standard deviations for the raw scores on the Wide Range Achievement Test are reported in table 36. Similar data on grade level scores appear in table 37. While the elementary grade study showed generallyhigher performance for the Monongalia County samples, the reverse is true for the samples under consideration here. Particularly noteworthy for the Reading section of the WRAT are regional differences, which range from one-half of a grade level to more than two grade levels.
Comparison of obtained grade level with actual gradelevel anddiscrepancies fromJastak’s normsas obtained by referringtothevalues given at the 50th percentile are reported in table 38. The regional discrepancies present some difficulties in drawingadequateconclusions. However, it may be noted that both the West Virginia and the California eighth grade samples indicate significant underestimation of reading level. For the seventh and ninth grades, however, reading level is underestimated for the West Virginia samples and overestimated for the control samples. The WRAT Arithmetic section underestimates actual grade level throughoutexceptfor the ninth grade Colorado control sample.
28
I

---------------------
--------------------------------
--------------------------------
--------------------------------
IRelating these findings to the evidence on
general ability levels in the samples, it maybe concluded that the WRAT estimates which are high simply reflect above average intellectual functioning in the respective samples. Thus, it must still be concluded that, in general, the WRAT underestimates actual grade level placement at the junior high school level.
PERFORMANCE ON THE SAT
Means and standard deviations for the grade scores on the Stanford Achievement Test are re-ported in table 39. Mean scores for the Monongalia County samples were slightly below the expected values, but discrepancies were by no means as extensive as those reported for the WRAT. Mean scores for the Wisconsin and Colorado control samples were also below the expected but were considerably closer to the national norms, The Colorado ninth grade sam
ple, however, tended to equal or exceed the national norms. The Monongalia County samples did better on the Arithmetic subtest of the SAT than on the language-related tests. This appears to be a geographical peculiarity and is not replicated for the control samples.
RELATION OF THE WRAT TO THE SAT
Table 40 lists the validity coefficients de-scribing the relation of the WRAT Arithmetic grade level scores with the grade scores of Advanced Form Km of the Stanford Achievement Test. Coefficients are given for the three grades and for the combined junior high school sample. Coefficients giving relationships to the most pertinent criteria have been boxed. The coefficients for Arithmetic Reasoning and Arithmetic Computation range from .74 to .80 for the Monon-
Table 36. Means and standard deviations on the WRAT, by sub test, grade, and samplefor the junior high school samples (raw scores)
Arithmetic Reading Arithmetic + Reading
Grade and sample Number
Tota 1 junior high
Monongalia County sample s-----------Control samples
Grade 7
Monongalia County samples Control samples
Grade 8
Monongali.a County samples Control samples
Grade 9
Monongali.a County samples Control samples
NOTE: S.D. —standard deviation.
Mean S.D. Mean S.D. Mean S.D.
330 24.35 5.19 46.87 12.72 71.37 16.17 327 26.20 6,27 54.59 11.21 80.81 15.77
111 22.46 4.53 42.94 11.65 65.40 14.82 104 22.47 4.16 55.03 10.01 77.50 12.43
101 23.89 4.59 45 � 70 11.02 70.09 13.06 109 24.80 5.46 48.68 11.84 73.48 15.95
118 26.52 5.46 51.57 13.54 78.08 17.28 114 30.96 5.60 59.84 8,59 90.85 12.92
29

------------------------ --
------------------------------------------
------------------------------------------
------------------------- --------- --
Table 37. Means and standard deviations on the WRAT,by subtest, grade, and sample Eor the junior high school samples (grade level scores)
ArithmeticArithmetic Reading + Reading Grade and sample Number
Total junior high
Monongali.a County samples Control samples ----.--- -------.
Grade 7
Monongalia County samples Control samples
Grade 8
Monongali.a County samplesControl samples
Grade 9
Monongali.a County samples Control samples --.-----
NOTE: S.D.-standard deviation.
galia County samples and from .66to.84 for the control samples.
These values are substantial, and construct validity is again suggested since the most pertinent coefficients relating the Arithmeticsection of the WRATto the Arithmetic Contentarehigher than values relating the WRAT to other criterion tests.
Validity coefficients describing the relation between the Reading grade level scores from the WRAT and the grade scores on subtesw of the Stanford Achievement Testare given intable 41. Coefficients for themostpertinent criteria(Para-graph Meaning and Word Mean~ng) range from.57 to .80 and from .47 to .73, respectively. Intbis instance validity coefficients are almostas high for most other criterion variables with theexception of Study Skills and the Arithmetic tests.
Table 42 gives the validity coefficients for the relationship between the combined Arithmetic
Mean S.D. Mean S.D. Mean S.D.
330 7.79 2.03 8.36 2.90 :.;~ 2.20 327 8.62 2.61 10.11 2.73 . 2.38
111 7.03 1.57 7.41 2.60 7.21 1.87104 7.03 1.50 10.19 2.44 8.61 1.68
101 7.60 1.81 8.12 2.34 7.86 1.7710$ 7.98 2.13 8.68 2.79 8.33 2.22
llE 8.68 2.24 9.45 3.21 9.07 2.43 114 10.68 2.50 11,41 2.21 .1.04 2.13
andReadinggrade levelsfrom the WRAT and the grade scores from the Stanford Achievement Test. Validity coefficients in this instance range from .51 to .84 fortheMonongaliaCountysamples and from .53 to .79 for the control samples. It may be noted that combined scores will improve prediction for the language-related criterion variables, but not for the number-related criterion variables.
DISCREPANCIES BETWEEN WRAT
AND SAT GRADE LEVEL ESTIMATES
Attention must again be given to the question whether the reported underestimate of actual grade level placement noted for performanceof the junior high school samples on the WRATmay not be a function of the samples’ achievement levels being below their actual grade placement. Discrepancies have therefore been computed be-
30

-------------------
-------------------
-------------------
-------------------
Table 38. Discrepancies between observed WRATgrade level scores,actual grade level, and Jastak’s age norms, by subtest, grade, and sample for the junior high school samples
Grade and sample
Total junior high
Monongalia County samples
Control samples
Grade 7
Monongali.a County samples
Control samples
Grade 8
Monongalia County samples
Control samples
Grade 9
Monongalia County samples
Control samples
Discrepancy fromDiscrepancy from actual grade level Jastak’s age norms
Arithmetic Arithmetic Reading +
Reading Arithmetic Reading Arithmetic
+ Reading
D t D t D t
-1.03 19.81 -0.46 13.03 -0.75 16.64 -0.81 -0.24 -0.53 -0.27 2.18 +1. 22 18.13 +0. 47 13.88 +0.02 +1.51 +0. 76
-0.75 15.03 -0.37 1.50 -0.57 1.3.22 -0.82 -0.44 -0.64 -0.84 15.71 +2.32 19.67 +0. 74 14.48 -0.82 +2. 34 +0. 76
-1.17 ‘6.50 -0.65 12.79 -0.91 15.17 -1.00 -0.48 -0.74 -0.94 14.63 -0.24 0.90 -0.59 12.78 -0.67 +0.03 -0.32
-1.15 15.58 -0.38 1.29 -0.76 13.41 -0.52 +0.25 -0.13 +0.88 13.76 +1.61 17.78 +1.24 16.23 +1.48 +2.21 +1.84
lsignificant at the l-percent level of confidence.
NOTE: D—algebraic difference; t—t-test of the significance of the difference between means.
tween group means for the WRATsections andthe most appropriate criterion measures from the
Stanford Achievement Test.
Table 43 lists the discrepancies between means on the WRAT Arithmetic section and the Arithmetic Concepts and Reasoning and the
Arithmetic Computation tests on the SAT. While there are systematic trends forall but the ninth grade control samples in the direction of under-estimation of the SAT by the WRAT, only a few
of these discrepancies reach significance at the
l-percent level of confidence. The onlyindividual grade sample reaching significantlevels ofunder
estimation is the seventh grade Wisconsincontrol
sample. However, when the total Monongalia
County junior high school sample is combined,
significant underestimation is found for both criterion measures. But the magnitude of the
underestimation averages to two-tenths ofagrade
level, and it may therefore be concluded that the use of Jastak’s arithmetic grade level norms at the junior high school level will result in under-
estimation of actual grade placement but rel
atively accurate placement in terms of the students’ achievement as measured on the Stanford Achievement Test.
A rather different story emerges for the
Reading section of the WRAT. Relevant dataon the discrepancies and their significance arere~ortedin table 44. It will benoted that the WRAT. Reading section systematically tends to over-estimate the SAT performance. The extent of
31

----------------------------
----------------------------
---------
----------------------------
----------------------------
----------------------------
----------------------------
----------------------------
----------------------------
--- --- --- ---
Table 39. Means and standard deviations on the Stanford Achievement Test, by grade,subtest, and sample for the junior high school samples (grade level scores)
Total Grade 7 Grade 8 Grade 9junior highSubtest and sample
Mean S.D. Mean S.D. Mean S.D. Mean S.D.
Paragraph Meaning
Monongalia County samplesControl samples
Word Meaning
Monongalia County samplesControl samples
Spelling
Monongalia County samplesControl samples----------?--------
Language
Monongalia County samplesControl samples
Arithmetic Reasoning
Monongalia County samplesControl samples
Arithmetic Computation
Monongalia County samplesControl samples
Social Studies
Monongalia County samplesControl samples
Science
Monongalia County samplesControl samples
Study Skills
Monongalia County samplesControl samples
NOTE: S.D.—standard deviation.
32
7.93 2.31 7.25 2.23 7.84 2.34 8.65 2.148.78 2.39 8.19 2.24 7.96 2.47 10.09 1.80
8.06 2.36 7.11 2.16 8.01 2.13 9.00 2.349.57 2.24 8.88 2.20 8.89 2.32 10.08 1.52
7.90 1.99 8.90 2.348.71 2.10 8.34 1.93 8.23 2.07 9.51 2.04
7.57 2.99 7.14 3.04 6.57 2.61 8.83 2.818.90 2.46 7.82 2.32 8.63 2.56 10.15 1.86
8.02 2.10 7.14 1.79 7.92 1.90 8.94 2.158.74 2.05 7.74 1.60 8011 1.91 10.27 1.62
7.98 1.84 7.23 1.54 7.75 1.56 8.89 1.948,54 2.10 7.13 1.20 8,00 1.74 10.35 1.74
7.70 2.19 6.77 1.83 7.62 1.94 8.65 2.298.71 2.28 8.14 1.98 8.04 2.30 9.88 2.07
8.35 2.55 7.32 2.48 8,32 2.27 9.36 2.449.16 2.55 8.99 2.30 8.11 2.69 10.31 2.12
7.48 2.39 6.75 2.20 7.29 2.34 8.33 2.348.73 2.45 8.41 2.39 7.65 2.43 10.06 1.83

--------------------------- --------- ------
------------------------
-------------------------------------------------------------------
--------------------------------
-------------------
----------------------------------------------------
--- ---
----------------------------------------------
-------------------------------------------------------------------
------------------------
‘lable40. Validit coefficients describing the relation of the WRAT Arithmetic radelevel scores witx the grade level scores on Advanced Form Kmofthe StanfordAchfevement Test, by grade, sample, and subtest for the junior high school samples
Totaljunior Grade 7 Grade 8 Grade 9
Subtest high
M c M c M c M c
Paragraph Meaning--------------------------- .59 .66 .67 ,53 .52 .67 .53 .63Word Meaning---------.-----m-- ----b .58 .64 .65 .56 .44 .58 .51 .61 Spelling --a----d- .56 .49 .40 .58 .57 .50 Language.................------------...---- .58 .66 .68 � 52 .46 .60 .54 .64
Arithmetic Reasonin r.80 .80 .78 � 66 � 79 ,79 ,75 � 71 Arithmetic Computatfon---------------------- � 79 .84 .74 .69 .78 .78 .76 2.74
Social Studies � 57 .64 .61 .56 .42 .58 .51 .59 Science .60 .57 .66 � 47 .50 .62 .53 .52 Study Skills .67 .63 .74 � 51 .64 .68 .58 .58
NOTE: M-Monongalia County samples; C-control samples.
Table 41. Validity coefficientsdescribing the relationofthe WRAT Reading grade levelscores with the grade level scores on Advanced Form 13nof the StanfordAchievementTest, by grade, ~ample, and subtest for the junior high school samples—
—
Totaljunior Grade 7 Grade 8 Grade 9
Subtest high
M c M c M c M c —
Paragraph Meaning-------- .68 .64 .71 � 47 ,57 � 70 .69 .56 Word Meaning-------------------------------.78 .70 .80 .62 .72 .73 .75 .64 Spelling........-------- ,73 � 66 .72 .81 .82 .67 Language .... .70 .63 .73 .52 .62 .72 .71 .63
Arithmetic Reasoning .64 .60 .62 ;:: .51 .61 .64 .51 Arithmetic Computation .64 .53 .65 � 40 .57 .65 .50 Social Studies .64 061 .70 .59 .44 .67 .63 .42 science .70 .64 .76 .55 � 55 � 66 .68 .48 Study Skills --..---- .65 .58 .62 .43 .60 .63 .63 .38
NOTE: M-Monongalia County samples; C-control samples.
33

-- - - - --- - - --- - -- - - - - - --
-------- -------- -------- -------- ------------ ----------------
----------------------------------------------
------------------------------- - - - - - ------ --- - - - --- - - -- --- -- ---- - --
-------- -------- --------
--- ---
Table 42. Validity coefficients describing the relation of the WRAT combined Arithmetic and Reading grade level scores with the grade level scores on Advanced FormKm of the Stanford Achievement Test, by grade,sample, and subtest for the junior highschool samples
—
Subtest
Paragraph Meaning . - - -- . . - - - -----Word Meaning -. - . - - - - - - - - -- . - - - - - -SpellingLanguage . . . . . . . . ----Arithmetic ReasoningArithmetic computationSocial StudiesScienceStudy Skills ---.,----
Total junior Grade 7 Grade 8 Grade 9 high
M c M c M c M c
.72 .73 .78 .58 .65 .76 .70 .66
.78 .75 .84 ;;; .70 .74 ,73 .69 .72 .68 .79 .80 .64
,73 .72 .79 .61 .65 .74 .72 ,70 ,79 .79 .76 .69 .74 ;;; .77 .68 .78 .77 .77 .64 .66 .78 .69 .69 � 70 .75 .68 .51 .70 � 66 .56 .74 .68 .81 .61 .62 � 71 .69 .55 � 74 .68 .75 .54 .73 .72 .68 .53
NOTE: M—Monongali,a County samples; C—control samples.
the overestimate depends also on the criterion measure involved and shows decided regional differences. Thus, the WRAT Reading section significantly overestimates scores on all criterion measures for the Wisconsinand Colorado samples. Significant overestimates for the Monongalia County samples occur only for the eighth grade on Language, for the ninth grade on Paragraph Meaning, and for the combined junior high samples on both Language and Para-graph hleaning. Finally, the California (eighth grade) sample is overestimated on the Language subtest only.
In summary, it appears that there are substantial discrepancies between reading skill and actual grade placement in the junior high school level, although a definite relationship does exist. As a consequence, we find the apparent paradox that the WRAT Reading test in some instances will underestimate actual grade placement while overestimating language-related achievements measured by the Stanford Achievement Test. In a situation suchas this, the test author obviously faces the dilemma asto whetherto keyhis measures togradeplacementortoindependentachieve
ment indices. In the case of the norms for the WRAT for the pupils 13-15 years old, the test author apparently has achieved a compromise between these two alternatives.
THE WRAT SECTIONS
Interrelationship
Theissue of the interrelation of the twoparts of the WRAT usedin the Health ExaminationSurvey and the question of the advisability ofcombining these scores has alsobeeninvestigated for the junior high school samples. Table45gives the correlations between the two sections and their relation to the combined score for eachgradeancl the total junior high school samples, Again, substantial correlation between the two sections is noted, and as in the elementary school study, it appears that the Reading section correlates most highly with the combined score. Attention is again called totable 41, which showed that the Reading section of the WRAT predicted performance on the Arithmetic criterion variables reasonably well, although not quite as well as did
34

--------------------------------------------------------------------------
------------------------------------------
--------------------------------------------------------------------------
--------------------------------------------------------------------------
Table 43. DLscrepanci.esbetween selected criterionmeasures from the Stanford Achievement Test and the Arithmetic section of Ehe IJEU4T,by subtest, grade, and sample forthe junior high school samples
Arithmetic Arithmetic:onceptsand ComputationGrade and sample
Reasoning
D t D t
Total junior high
.19 -0.19 12.75Monongalia County samples -0.23 “.3Control samples -0.13 1.51 -0.07 0.90
Grade 7
Monongalia County samples------.-------.--------_---=-----0.09 0.83 -0.18 1.70Control samples -0.63 -4.74 -0.12 1.11
Grade 8
Monongali.aCounty samples -0.29 2.42 -0.12 1.05Control samples -0.15 1.17 +0.04 0.31
Grade 9
Monongalia County samples -0.30 2.10 -0.2.5 1.84Control samples +0.41 2.48 +0.33 2.09
lSignificantat the l-percent level of confidence.
NOTE: D—algebraic difference; t—t-test of the significanceof the difference between means.
Here also,then,theRead- to one-fourththeArithmeticsection. ofthevarianceiscommon withtheas a briefestimateof measure of generalability. withingsectionmight suffice Correlations
schoolachievement. parents’occupationallevel,however,remainor quitelow and in no instance
Relation to General Ability and accountformore than15percentofthecommon
Socioeconomic Status variance.As fortheelementaryschoolsample, itcan be concluded, thattheWRATis
nonsignificant
therefore,oftheWRAT reasonablyapplicableto subjectsof varyingTable46 givesthecorrelation andwiththe socioeconomic A similarconclusionwiththemeasure of generalability backgrounds.
socioeconomicstatusof thestudents’ however,parents. withrespectto levelsof intelligence,Itisfoundagainthatforthesesamplesone-third must awaitfurtherinvestigation.
35

-----------
-----------
-----------
-----------
---
---
---
---
Table 44. Grade level discrepanciesbetween selected criterionmeasures from the Stanford Achievement Test and the Readim~ section of the WRAT, by subtest. grade. and. . .-sample for the junior high school sam~les
CordMeaning Paragraph Spelling Languagex Vocabulary MeaningGrade and sample
Total junior high
Monongalia County samples-Control samples
Grade 7
Monongali.aCounty samples-Control samples
Grade 8
Monongalia County samples-Control samples
Grade 9
Monongali.aCounty samples-Control samples
D t D t D t D
+0.30 2.22 +0.43 ‘3.23 +0.89 15.97+0.53 14.82 -I-1.32110.91 +1.39 113.37 +1.20 19.68
+0.32 +0.18 +0.29 1.34::; +1.98 1:::: +1.83 11O.OO +2.35 110.22+1.29 1.:
+0.14 0.59 +&; +0.25 1.05 +1.48 15.76-0.21 1.14 . 1;:;; +0.43 12.74 +0.03 0.16
+0.41 +0.76 12.99 +0.51 2.06 +0.58 2.16+1.33 1:::; +1.32 17.37 +1.90 112.10 +1.26 *7*54
lSignifi.cantat the l-percent level of confidence.
NOTE: D—algebraic difference; t—t-test of the signi-fi.canceof the difference between means. -
IV. THE SENIOR HIGH SCHOOL STUDY
BACKGROUND DATA
The subjectsfortheseniorhighschoolstudywere obtainedin MonongaliaCountyby theex-haustivetestingof studentsin theupper threegrades of a semiruralhighschool,and quotaswere completedby random samplingfrom theUniversityHigh School.Similarquotasamplingwas used in one highschoolineachofthethreecontrolareas.Because of thedemograpbicdistributions theaverageinthesamplingareas, occupationallevelof theparentswas somewhatlowin West Virginiaand California.The remaining
two samples (Coloradoand Wisconsin)werecloserto,or slightlyabove,thenationalaverage.With respectto intellectual rathercloseability,
matchingtonationalaverageswas obtainedfortheWest VirginiaandCaliforniasamples,whilethe Wisconsin and Coloradosamples showedaboveaverageability probablyreflectinglevels,different ofhighschooldropoutthanwaspatternstruefortheprincipalsample.Table47 givesthe
relevant pupilabilitydataonparent’soccupation,level,days betweenindividualand group tests,age at time of test,and grade levelattimeoftest.Itshouldbe notedthatforthehfonongalia
36

------------------------
------- ------- ------- ------------- ------------- ------- ------- ------- ------- -----
------------------------
------- ------- ------- ------- -----
snd control samples both grade and age levels have been matched to within less than one-tenth of a grade level.
ADEQUACY OF GRADE LEVEL PLACEMENT
Table 48 gives means and standard deviations for the WRAT raw scores, and similar data for the WRAT grade level scores are provided in table 49. All grade level estimates (with the exception of the Wisconsin tenth grade sample) wure below actual grade level placement. Regional discrepancies were again the most noteworthy. The West Virginia and California samples showed actual grade level placement underestimates ranging from two to three grade levels, while the remaining samples came very close to actual grade level. Magnitude of discrepancy from actual grade level and associated significance test results are reported in table 50. Considering the above-average intellectual level forthe Wisconsin and Colorado samples, it must again be concluded
that the WRAT, in general, seriously under-estimates actual grade level for senior high school students.
A fair consideration of the test author’s position once again must include reanalysis of the data with respect to the notion that grade levels are not expected to show systematic increment because of different(and oftenautomatic)pro
motion policies. The grade level equivalent at the 50th percentile corresponding to the average age of our grade sample was obtained from Jastak’s manual, and discrepancies were recomputed using these new levels as reference points. No significance tests are available for the re-vised discrepancies also reported in table 50. By inspection, however, it may now be seen that use of Jastak’s conversion tables results in discrepancies which seem to reflect the intellectual levels of the several samples. Thus use of the conversion tables leads to obvious overestimates of grade level for the Wisconsin and Colorado samples. However, grade level estimates for the
Table 45, Correlation of the Arithmetic and Reading sections of the WRAT and correlation of each section with the Arithmetic and Reading (A -IR) composite score, bysample and grade for the junior high school samples (raw scores and grade level scores)
.
Grade ,
M c M c M c
Raw scores
Total junior high
Grade 7 GradeGrade ;----------------------------------------
Grade level scores
Total junior high .59 .70 .85 .89 .93 .95
Grade ---.--- .57 .42 .82 .75 .94 .91 Grade L---------------------------------------- .63 .81 .88 .89 .93.45 Grade .58 .64 .84 .92 �93 .89
NOTE: M-Monongalia County samples; C-control samples.
37

-----------------------------
----- - - -- - -- - -- - -- -- - - - - -- - - - - - - - - --
-- -- - - - - - - - -- - - -- -- --- - -- -- -- -- - -- - ----
----------------------------
-------- -------- -------- ----
Table 46. Correlation of WRATgrade level scores with general ability level and with occupational level of parent,by subtest, sample,and s amples
Grade
Total junior high
Grade . - - *.. - - --Grade :--------------------------------------------Grade 9- - -- -
Grade
grade for the junior high schoo.L
General ability level with:
ArithmeticArithmetic Reading + Reading
M c M c M I c
.49 .59 .56 .62 .59 I .66
.54 .51 .56 .63 .62 �68
.51 .60 .52 .60 .61 .66
.50 .35 .63 .38 .65 .401Occupational level
of parent with:
ArithmeticArithmetic Reading + Reading
m T
Total junior high .181 .29
Grade 7--------------------------------------------- .31 .09 Grade 8-------------------------------------------- .28 .39 Grade 9-------- ---.---- m
I .09 .19
I I NOTE: M—Monongalia County samples; C—control samples,
West Virginia and California samples now more closely approach their actual grade average.
Perhaps some closure can be achieved by considering the discrepancies for the combined senior high school samples. Inspection of the totals in table 50 suggests that use ofgrade level estimates for senior high school students under-estimates actual level while use of Jastak’s conversion table results ina slightoverestimate.
PERFORMANCE ON THE MAT
Data on the student’s performances on the Metropolitan Achievement Test (MAT), thecriterion variables for the senior high school sampie, were analyzed in twodifferent ways.Standard scores are available which indicate the student’s performance as compared with the total high school sample, onwhichthetestwas standardized.
38

------------------------
------------------------
------------------------
------------------------
I
Table 47. Means and standarddeviationson selectedbackgrounddata, by grade and sample for thesenior high school samples
DaysOccupa- between Age at Grade leveltional individual time of at time oflevel of and group group test group testGrade and sample parent tests
Mean S.D. Mean S.D. Mean S.D. Mean S.D. Mean ;.D.
Total seniorhigh
Monongal.iaCounty samplesControl samples
Grade 10
MonongaliaCounty samplesControl samples
Grade 11
MonongaliaCounty samplesControl samples
Grade 12
MonongaliaCounty samplesControl samples
3.70 2.36 4.14 1.05 6.63 10.51 ;;.(); 1.06 11.85 0.81 4.83 2.57 4.41 0.94 -4.74 3.22 . 0.85 11.78 0.51
3.69 2.30 4.17 1.08 6.79 11.05 16.09 0.62 10.83 0.055.11 2.64 4.58 0.79 -7.18 1.02 16.11 0.44 10.90 0.00
3.71 2.28 ;.;: 1.10 7.02 10.32 17.03 0.80 11.82 0.044.02 2.34 . 0.87 -5.88 0.81 17.00 0.45 11.90 0.00
3.70 2.40 4.11 0.95 6.11 10.17 18.04 0.67 12.82 0.045.55 2.46 4.83 0.98 0.46 0.53 17.99 0.39 12.90 0.00
NOTE: S.D.-standard deviation.
These scores are in the typicalT-score form
with a nleanof50 anda standarddeviationof lO.
On scores such as these, one would expect the eleventh grader to fall atabout the average while the tenth grader should be below and the twelfth grader above the mean given for the totalnormative population. A second type of score,thewithin grade stanine, permits comparison of the study’s subsamples withnationalnorms. Means andstandard deviations in T-score form are reportedin
table 51 and their grade stanine equivalents are given in table 52.
The Monongalia County sample fell at or above average on the subtests of Reading, Language, Language Study Skills, Social Studies ~-formation, and Science Information, while itfell somewhat below the national average on Spelling, Mathematical Computation, and Mathematical Analyses. Underestimates ofachievementofgrade level for the Arithmetic part of the Wide Range
39

Achievement Test for these samples may there-fore be attributable to their generally lower level in mathematics achievement.
As on the WRAT, the control samples from Colorado and Wisconsin exceeded the West Virginia samples on practically all of the Metropolitan subtests, while the California sample per-formed slightly below the West Virginia sample. Care must be taken, however, to remember the higher average on the general ability index for the two control samples before interpreting these results.
Comparison of the control samples to national averages requires consideration of the within grade stanines reported in table 52. The average stanine has a value of five. Hence, it follows that the Wisconsin sample was at about the national average on most subjects except Language, on which it was low, and Science and Social Studies, on which it was high. The California sample appeared to be at or near average on Reading,
Social Studies, and Science and low on all other subjects, while the Colorado sample was at or about average on Spelling and Language and above average on all other items. The Monongalia County samples, finally, were all below average on Mathematics and Spelling, and the twelfth grade sample appeared low on all subjects except Science and Social Studies.
RELATION OF THE WRAT
TO THE MAT
Table 53 gives the validity coefficients de-scribing the relation of the WRAT Arithmetic section grade level scores with the standard scores on the Metropolitan Achievement Test. Results for individual grade levels and combined high school samples are given separately for the Monongalia County and control groups. The boxed group of coefficients in this table represents the
Table 48. Means and standard deviations on the WRAT, by subtest,grade, and sample for the seniorhigh school samples (raw scores)
Grade and sample
Total senior high
Monongalia County samples----------------------Control samples................----------------
Grade 10
Monongalia County samples----------------------Control samples--------------------------------
Grade 11
Monongalia County samples----------------------Control samples--------------------------------
Grade 12
Monongalia County samples----------------------Control samples--------------------------------
NOTE: S.D.—standard deviation.
ArithmeticAritkxtic Reading + Reading
Mean S.D. Mean S.D. Mean S.D.
301 28.30 6.34 55.21 13.04 83.52 17.38 26$ 30.11 6.75 59.54 10.74 89.62 15.50
95 27.07 5.93 51.52 12.75 78.59 16.24 102 31.11 5.92 60.03 9.38 91.14 13.21
103 28.85 6.22 57.43 13.40 86,31 17.9898 26.36 6.30 55.98 11.67 82.34 16,06
103 28.87 6.66 56.40 12.18 85.27 16.8169 33.96 5.74 63.87 9.45 97.71 12.95
40
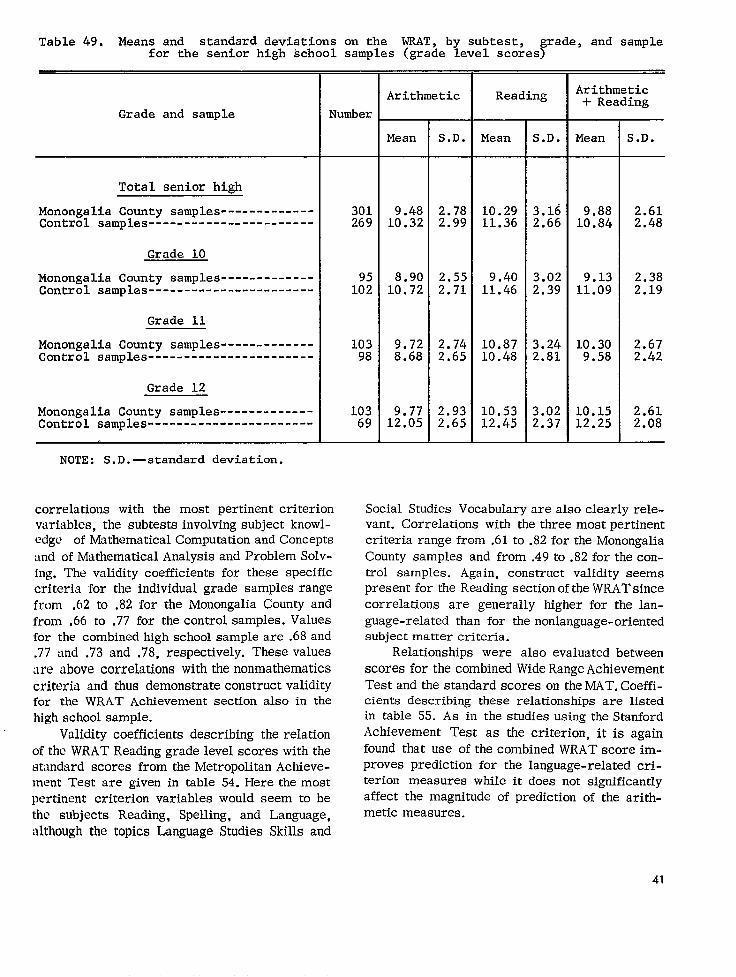
------------------------------------
------------------------------------
------------------------------------
------------------------------------
Table 49. weans and standard deviations on the WRAT, by subtest, grade, and sample for the senior high school samples (grade level scores)
ArithmeticArithmetic Reading
+ ReadingGrade and sample Number
Total senior high
Monongalia County samplesControl samples
Grade 10
Monongalia County samplesControl samples
Grade 11
Monongali.a County samples Control samples
Grade 12
Monongalia County samplesControl samples
NOTE: S.D.—standard deviation.
Mean S.D. Mean S.D. Mean S.D.
301 9.48 2.78 10.29 3.16 9.88 2.61 269 10.32 2.99 11.36 2.66 10.84 2.48
95 8.90 2.55 9.40 3.02 9.13 2.38 102 10.72 2.71 11.46 2.39 11.09 2.19
103 9.72 2.74 10.87 3.24 10.30 2.67 98 8.68 2.65 10.48 2.81 9.58 2.42
103 9.77 2.93 10.53 3.02 10.15 2.61 69 12.05 2.65 12.45 2.37 12.25 2.08
correlations with the most pertinent criterion variables, the subtests involving subject knowledge of Mathematical Computation and Concepts and of Mathematical Analysis and Problem Solving. The validity coefficients for these specific criteria for the individual grade samples range from .62 to .82 for the Monongalia County and from .66 to .77 for the control samples. Values for the combined high school sample are .68and .77 and .73 and .78, respectively. These values are above correlations with the nonmathematics criteria and thus demonstrate construct validity for the WRAT Achievement section also in the high school sample.
Vtilidity coefficients describing the relation of the WRATReading grade level scores with the stondard scores from the Metropolitan Achievement Test are given in table 54. Here the most pertinent criterion variables would seem to be the subjects Reading, Spelling, and Language, although the topics Language Studies Skills and
Social Studies Vocabulary are also clearly relevant. Correlations with the three most pertinent criteria range from .61 to .82 for the Monongalia County samples and from .49 to .82 for the control samples. Again, construct validity seems present for the Reading section oftheWRATsince correlations are generally higher for the language-related than for the nonlanguage-oriented subject matter criteria.
Relationships were also evaluated between scores for the combined Wide Range Achievement Test and the standard scores on theMAT. Coefficients describing these relationships are listed in table 55. As in the studies using the Stanford Achievement Test as the criterion, it is again found that use of the combined WRATscore improves prediction for the language-related criterion measures while it does not significantly affect the magnitude of prediction of the arithmetic measures.
41

-----------
Table 50. Discrepancy.ee between observed WRATgrade level scores,actual grade level, and Jastak’s age norms, by subtest, grade, and sample for the senior high school samples
I Discrepancy fromDiscrepancy from actual grade level
Jastak’s age norms
ArithmeticGrade and sample Arithmetic Reading i-Arithmetic
r Reading Arithmetic Reading +
Reading
t D t D t
Total senior high I
Monon alia County sampfes----------- -2.37 ‘14.81 -1.56 18.62 -1.97 113.13 -0.29 +0.52 +0.11
Control samples---- -1.47 18.12 -0.43 12.65 -0.95 16.33 +0.57 +1.61 -!-1.09
Grade 10I
Monongalia County samples----------- -1.91 17.38 -1.41 14.56 -1.68 16.94 -0.65 -0.15 -0.42
Control samples---- -0.20 0.75 +0. 56 2.36 +0. 19 0.88 +1.12 +1.88 j-1.51
Grade 11I
Monongalia County samples----------- -2.08 17.76 -0.93 12.92 -1.50 15.72 -0.03 +1.12 +0. 55
Control samples---- -3.24 112.09 -1.44 ‘4.91 -2.34 ‘9.59 -1.07 +0. 73 -0.17
Grade 12 I Mcm~~.ia County
-3.03 110.52 -2.27 ‘7.64 -2.65 110.27 -0.18 +0.58 +0. 20 Control samples---- -0.85 12,66 -0.45 1.58 -0.65 2.60 -I-2.10 +2. 50 +2. 30
lSignificant at or beyond the l-percent level of confidence.
NOTE: D—algebraic difference; t—t-test of the significance of the difference between means.
DISCREPANCIES BETWEEN WRAT AND MAT ESTIMATES
While the correctness of grade level estimation may not be as crucial at the high school level as it is for children at the earlier ages, it is nevertheless importanttoassess towhatextent, ifany,theWRAT tends to overestimate or under-estimate school achievement as measured byan independent assessment procedure.
No grade level estimates were available for the MAT, but itwaspossibletouseJastak’s tables to convert grade levels into standard scoreform. Jastak’s standard scores were converted into the conventional T-score form, and discrepancies were computed, even though the absence ofap
propriate ,statistics in the manuals precluded formal significance tests.
Tables 56 and 57 give the WRAT Arithmetic and Reading score means in T-score form and list the discrepancies in T-score points from the corresponding means on the Metropolitan Achievement Test. There is considerable variability among grade levels and samples. The clearest picture merges when we consider the combined means for thetotalhighschoolsamples. Here it appears that the Arithmetic sectiononthe WRAT slightly overestimated achievement in mathematics for the Monongalia County samples but was approximately close, onthe average, for the control samples. The WRAT Reading section closely predicted average level for the Metro-
42

politan Reading Test (except for marked under-estimate of the Colorado twelfth grade sample) but seemed to overestimate the Spelling and Language subtests of the Metropolitan by an average of one-half of a standard deviation.
THE WRAT SECTIONS
Interrelationship
Table 58 gives the intercorrelations between the Arithmetic and Reading sections of the WRAT for the high school samples. Substantial correlation exists between these sections for all samples, and the finding for the elementary and junior high samples regarding the higher correlation of the Reading section with the combined Arithmetic and Reading score is replicated. Inspection of tables 55 through 57, however, suggests somewhat better definition in criterion prediction for the two forms of the test. Thus,
while the Reading section presents a better choice if the battery has to be shortened, there appears to be greater justification for retaining both subtests of the WRAT at the high school level than at the lower grades.
Relation to General Ability and
Socioeconomic Status
The correlation of the WRAT parts and combined score with the measure of intellectual ability and occupation of parent is given in table 59. For the high school samples, correlations of the WRAT with occupational level, as the estimate of socioeconomic status, are nonsignificant, or trivial, and present evidence of the utility of the test for children from varying socioeconomic backgrounds. Correlation with intellectual ability is again quite substantial, although some decrement in the relationship occurs at the twelfth grade level.
V. VALIDITY OF THE WRAT’ AT EXTREME ABILITY LEVELS
WRAT PERFORMANCE AT EXTREME LEVELS
In the previous section substantial correlations were reported between the WRAT scores and the measure of general ability. These findings raised serious questions as to the suitability of the WRAT at extreme levels of intellectual ability. In order to handle this problem, special studies were conducted on samples of subjects at both the lowest and highest levels of the ability range. For this study subjects were pooled from the Monongalia County and the control samples and subsamples were pooled wherever comparable forms of the criterion tests were available. As u result, data are presented on four samples. Two of these represent students from the fifth through the ninth grades, all of whom took the
Stanford Achievement Test. The other two samples represent students from grades 10-12, on whom we had comparable data on the Metropolitan
Achievement Test. In each set, one sample represents students with IQ’s of 80 or below, while the other sample represents students with IQ’s of 121 or above.
Table 60 shows the mean age and grade level placement for each of these samples, as well as the WRAT grade level scores. As would be expected, mean ages are higher for the low-ability groups and the average grade level scores on the WRAT are much below actual grade level for the low-ability groups. The two high-ability groups are substantially above their expected grade level, but of course, the discrepancy here is not as great for the low-ability group.
In the analysis of the validity of the WRAT for the extreme groups, the matter of the relation of the WRAT to the most pertinent criteria from the Stanford and Metropolitan Achievement Tests will again be attended to and, in the case of the SAT, the discrepancy between grade levels will be considered.
43

-------------
-------------
-------------
-------------
-------------
-------------
-------------
-------------
-------------
-------------
-------------
---
------
---
---
---
------
---
------
---
---
---
------
---
---
---
---
---
---
---
---
------
---
------
--------
---
------
---
---
---
---
---
---
---
---
---
----
Table 51. Means and standard deviations on the MetropolitanAchievement Test,b grade,aubtest, and sample for the senior high school samples (standard scores7
Subtest and sample
Reading
Monongalia County samples---Control samples
Spelling
Monongalia County samples---Control samples
Language
Monongalia County samples---Control samples
Language Study Skills
Monongalia County samples---Control samples
Social Studies Skills
Monongalia County samples---Control samples
Social Studies Vocabulary
Monongalia County samples---Control samples
Social Studies Information
Monongalia County samples---Control samples
Mathematical Computationand Concepts
Monongalia County samples---Control samples
MathematicalAnalysisand Problem Solving
Monongalia County samples---Control samples
Science Information
Monongalia County samples---Control samples
Science Concepts
Monongalia County samples---Control samples
Total Grade 10 Grade 11 Grade 12senior high
Mean S.D. Mean S.D. Mean S.D. Mean S.D.
52.70 13.76 50.54 13.18 54.83 13.69 52.56 14.0256.41 13.86 52.39 12.80 52.61 12.60 67,74 10.41
47.76 16.16 43.96 14.79 48.59 16.17 50.45 16.7150.96 15.84 49.72 14.57 47.49 16.71 57.71 14.24
51.06 16� 21 48.63 15.63 51.87 15.67 52.49 16.99 52.15 14.12 46.76 12.52 50.24 12.95 62,83 12.08
51.18 18.27 51.30 18.9856.84 15.56 53.16 14.23 52.15 14.45 68.93 12.30
53.16 14.23 67.68 13.77
58.48 17.00 54.34 15.37 54.07 15.56 70.87 15.07
52.66 15.09 49.66 13.67 53.61 13.94 54.47 16.9154.12 12.33 56.08 13.64
46.54 15.54 43.39 13.62 48.87 14.58 47.12 17.5252.83 16.47 51.24 13.47 46.41 15.77 64.29 15.55
46.19 17.51 44.40 16.94 46.37 16.60 47.66 18.7253.59 17.55 51.15 14,65 46,99 16.26 66.59 16.38
51.62 14.82 52.74 14.85 51.94 12.38 50.26 16.7956.77 13.62 51.77 15.97
57.87 14.33 67.29 15.34
NOTE: S.D.—standard deviation.
44
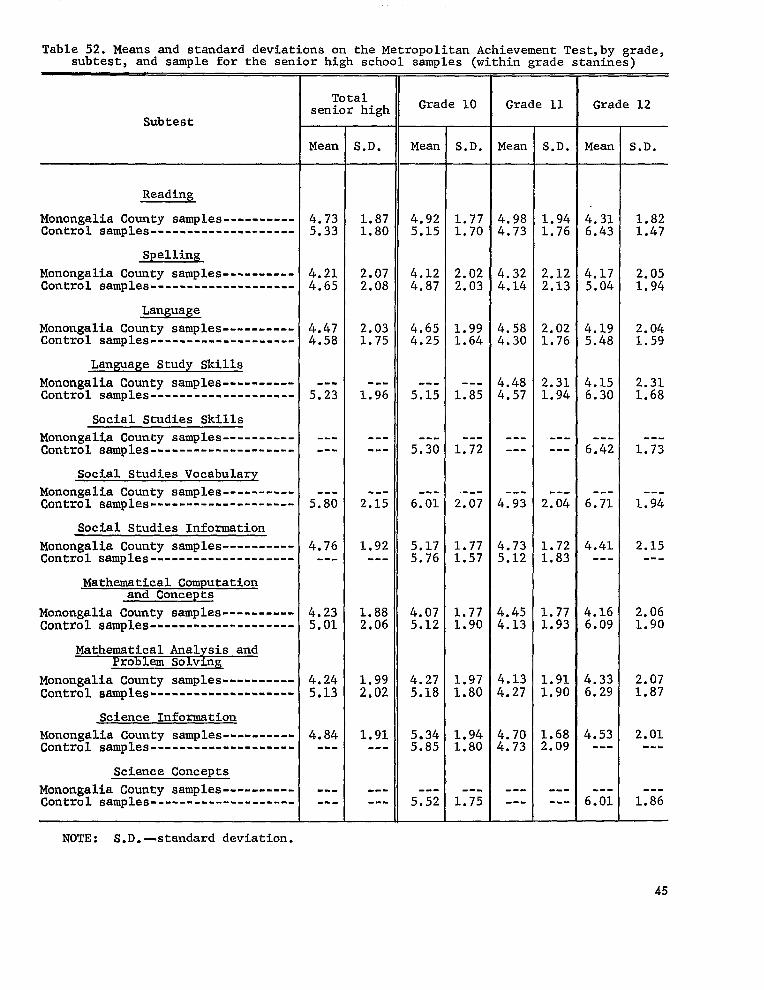
------------------------------
------------------------------
------------------------------
------------------------------
------------------------------
------------------------------
------------------------------
------------------------------
------------------------------
------------------------------
------------------------------
---
------
---
---
---
------
---
------
---
---
---
------
---
---
---
---
---
---
---
------
---
------
------
---
------
---
---
---
---
---
---
---
---
Table 52. Means and standard deviations on the Metropolitan Achievement Test,by grade,subtest, and sample for the senior high school samples (within grade stanines)
Subtest
Reading
Monongalia County samplesControl samples
Spelling-
Monongalia County samplesControl.samples
Language
Monongalia County samplesControl samples
Language Study Skills
Monongalia County samplesControl samples
Social Studies Skills
Monongalia County samplesControl sa~ples
Social Studies Vocabulary
Monongalia County samplesControl samples
Social.Studies Information
Monongalia County samplesControl samples
Mathematical Computationand Concepts
Monongalia County samplesControl samples
Mathematical Analysis andProblem Solvin~
MonongaUa County samplesControl samples
Science Information
Monongalia County samplesControl samples
Science Concepts
Monongalia County samplesControl samples
NOTE: S.D.-standard deviation.
Totalsenior high Grade 10 Grade 11 Grade 12
Mean S.D. Mean S.D. Mean S.D. Mean S.D.
4.73 1.87 4.92 1.77 4.98 1.94 4.31 1.825.33 1.80 5.15 1.70 4.73 1.76 6.43 1.47
4.21 2.07 4.12 2.02 4.32 2.12 4.17 2.054.65 2.08 4.87 2.03 4.14 2.13 5.04 1.94
4.47 2.03 4.65 1.99 4.58 2.02 4.19 2.044.58 1.75 4.25 1.64 4.30 1.76 5.48 1.59
4.48 2.31 4.15 2.315.23 1.96 5.15 1.85 4.57 1.94 6.30 1.68
5.30 1.72 6.42 1.73
5.80 2.15 6.01 2.07 4.93 2.04 6.71 1.94
4.76 1.92 5.17 1.77 4.73 1.72 4.41 2.155.76 1.57 5.12 1.83
4.23 1,88 4.07 1.77 4.45 1.77 4.16 2.065.01 2.06 5.12 1*9O 4.13 1.93 6.09 1.90
4.24 1.99 4.27 1.97 4.13 1.91 4.33 2.075.13 2.02 5.18 1.80 4.27 1.90 6.29 1.87
4.84 1.91 5.34 1.94 4.70 1.68 4.53 2.015.85 1.80 4.73 2.09 ..- .-.
--.,5.52 1.75 6.01 1.86
45

----
---
---------
---
---
---------
------
--- ---
----------------------------------------------------------------------------------
-------------------------------------
---
-------
--------- --- ---
----------------------------------------------------- --- ---
---------
---
--- ------
--- ---
---
---
------
--------------------------------------------------------------------------------------------------------------
----------------------------------------------
-------------------------------------
-------
-----------------------------------------------------
----------
--- ---
------ ---
Table 53. Validity coefficientsdescribing the relation of the WRAT Arithmetic grade level scores w?th the standard scores-on the Metropolitan Achievement Tes~, by grade, sample, and subtest for the senior high school samples
Total i senior Grade 10 Grade 11 Grade 12
Subtest high IM c M c M c M c
.62 .57 .58 .50 .58 .55 .68 .50
.58 .54 .51 .56 .50 .50 �66 ,43 Language .66 .58 .64 .46 .57 .69 ;;; .61 Language Study Skills .59 .45 .52 .57 ;;5 Social Studies Skills .46 Social Studies Vocabulary .59 .62 .60 .52 Social Studies Information .59 .54 .43 .53 .56 .65
Mathematical Computation and Concepts .77 .78 .70 .77 .76 .76 .82 .73Mathematical Analysis and Problem Solving--- —
.68 .73 .74 .66 .62 .69 .69 1.74
Science Information .52 .51 .52 .51 .49 .58Science Concepts .50 .57
NOTE: M—Monongalia County samples; C—control samples.
Table 54. Validitv coefficients describing the relation of the WRAT Readinz grade level scores with the standard scores on-the Metropolitan Achievement grade, sample, and subtest for the senior high school-samples
Totalsenior Grade 10 Grade 11 Gra 12
Subtest I high
M c M c M c M c
Reading .61 -xi .66 .57 .61 .65 .49 Spelling .73 .76 .69 .69 .82 .82 .66 .69 Language .65 .65 .72 .67 .62 .74 .63 3.49Language Study Skills .61 .55 .62 .67 .53 .48 Social Studies Skills .40 .13 Social Studies Vocabulary .62 .54 .67 .58 Social Studies Information .56 .62 .43 .59 .52 .48 ..-Mathematical Computation and Concepts .53 .54 .56 .51 .57 .58 .46 .30 MathematicalAnalysis and Problem Solving--- .49 .53 .51 .46 .48 .44 .48 .31 Science Information .56 .63 .56 .63 .44 .51 Science Concepts .54 .48
8
NOTE: M-Monongalia County samples; C—control samples.
46

------
---
---
---
------
---
---------
---
---
---
------
---------
---
---
---
-------------------------------------------------------------------------------------------------------------
----------------------------------------------
-------------------------------------
-------
-----------------------------------------------------
--------------------------------------------
--------------------------------------------
------------------------------------
------------------------------------
�
Table 55. Validity coefficientsdescribing the relation of the combined WRAT Arithmetic and Reading grade level scores with the standard scores on the MetropolitanAchievement Test, by grade, sample, and subtest for the senior high school samples
Total senior Grade 10 Grade 11 Grade 12
Subtest high
M c M c M c M c
Reading .70 .67 .73 .63 .67 .68 .70 .60 Spelling .75 .73 .72 .72 .75 .75 .75 .67 Language .75 .70 .80 .65 .67 .80 .78 .67 Language Study Skills .68 .58 .65 .70 .69 .67 Social Studies Skills .50 .44 Social Studies Vocabulary .69 .61 ;;: .66 Social Studies Information .66 .68 .50 .6,3 .64 Mathematical Computation and Concepts .73 .75 .72 .75 .74 .75 ;:; .64 Mathematical Analysis and Problem Solving--- .66 .69 .72 .66 .60 .63 .65 Science Information .62 .68 .63 .65 .52 .62 Science Concepts .60 .64
NOTE: M—Monongalia County samples; C—control samples.
Table 56. T-score discrepancies between selected criterion measuresonthe MetropolitanAchievement Test and the Arithmetic section of the WRAT,by subtest, grade,and samplefor the senior high school samples
WRATArithmetic
Grade and sample score inT.-score
Mathematical MathematicalComputation Analysis andand Concepts Problem Solving
Total senior high
Monongalia County samplesControl samples
Grade 10
Monongalia County samplesControl samples
Grade 11
Monongalia County samplesControl samples-.------
Grade 12
Monongalia County samplesControl samples----_.---
NOTE: D—algebraic difference.
form
49.353.0
47.353.3
50.046.0
49.357.0
D D
+2.8+0.2
+3.9+2.1
+1.1 -0.4
+2.2-7.3
-I-3.1 -0.6
+2.9 +1.1
+3.6 -1.0
:;.:
47

------------------------------------------------
------------------------------------------------
------------------------------------------------
------------------------------------------------
-------
-- -- -- --- -- -- ---- --- -- -------- ---- ---- -- --- -- -- ----
----- ---- ---- -- ------ ---- ---- ---- ------ --- -- -- -- -- ---- -- ----
Table 57. T-score discrepanciesbetween selected criterion measuresonthe MetropolitanAchievement Test and the Reading section of the WRAT, by subtest, grade, and samplefor the senior high school samples
WRATArithmetic Reading Spelling Language
Grade and sample score inT-score D D Dform
Total senior high
Monongalia County samples 52.0 -0.7 1-4.2 +0.9Control samples 56.0 -0.4 +6.0 +3.8
Grade 10
Monongalia County samples ::.; -1.8 +4.7 +0.1Control samples . +3.6 +6.3 +9.2
Grade 11
Monongalia County samples 52.0 -2.8 +3.4 +0.1Control samples 52.7 +0.1 +5.2 +1,5
Grade 12
Monongalia County samples 52.0 -0.6 -1.5 -0.5Control samples 58.3 -9.4 -1.6 -4.5
NOTE: D—algebraic difference.
Table 58. Correlation of the Arithmetic and Reading sections of the WRAT and correlation of each section with the Arithmetic and Reading (A -1-R) composite score, bsampleand grade forthe senior high school samples (raw scoresandgrade level scores7
Arithmeticwith Arithmetic Reading
with A + R with A -1-RGrade Reading
z T
Raw scores
-Total senior high------------------ .55 I .54 I .78] .811 .951 ,93
I I I 1 IGrade 10----------------------------------------- .44 .46 .71 .78 .94 .92
-- - -- - --- --- -Grade .61 .56 .81 .80 .96 ,95Grade :;-..----- -- - -- - - - -- .55 .38 .80 .73 .94 .90
Grade level scores
Total senior high-------------------------- .54 .54 .86 I .89 I .891 .86I I I
Grade 10----------------------------------------- .45 .47 .82 .88 .88 .84-- - - --Grade .59 .57 .87 ,88 .91 .89
Grade H -- - ---- -- - - -- -- -- .54 .36 .87 .85 .88 .80I
NOTE: M—Monongalia County samples; C—control samples.
48

------- ------- ------- -------
------- ------- ------- ------- ------- -------------- -------- -------- -------- ----
-------- -------- ---
-------- -------- ----
------------------- --------------- -------- ---------------- ---
-------- -------- ---
Table 59. Correlation of WRATgrade level scores with general ability level and with occupational level of parent, by subtest, sample, and grade for the senior high school samples
I General ability level with:
1 I ArithmeticGrade Aritbmeti.c IReading
I + Reading
i
I M
Total senior high .58 L
Grade 10-- .63 Grade 11 --------- .60 Grade 12 -------- . . . . . . . . -------- .56
I Grade Arithmetic
c M c M
,61 .64 .61 �7O
.56 .70 .66 .78
.58 .73 .66 .75
.45 .54 .35 .62
Occupational level of parent with:
c
.70
.71
.70
.49
IReading
+
M c M c
Total senior high ..-.---9, .13 .23 .09 .11 —
Grade 10 ------------------ .05 .14 .10 .18 Grade 11 -------- .10 .04 .09 .07 Grade 12 . ..--... . . . . . . . . . . . . . . . . .21 .28 .09 ,02
NOTE: M-Monongalia County samples; c-control samples.
Arithmetic + Reading
M cI
.12 .20
I .10 .18 .10 .02 .17 .19
I
RELATION BETWEEN THE WRAT AND THE CRITERION VARIABLES
Table 61 gives validity coefficients for the grcup of extreme intellectual ability. It maybe seen that at these levels theWRATworksreasonably wellinpredicting performance ontheStanford Achievement Test at both high and low ability levels and that further evidence of construct validityis presentedby the fact that thepertinent criterion variables correlate higher with the appropriate section of the WRAT.
Less favorable results occur in therelationship of the WRAT to the Metropolitan Achievement Test for the groups drawn from the senior high school samples. While there insignificant prediction in the expected direction for the bighability samples, validities are notas bighas one would hope for. Of more concern is the fact that the Reading section of the WRAT completely fails to predict relevant criterion variables for the low-ability group. It is true that this group is represented only by a small sample (N=25). How-ever, modest correlations are yielded by this
49

---------------------------------------------------------------------
-----------------------------------------
-------------------------------------------
----------------------------------------------------------------------------------------------------------------------------
---------------------------------
Table 60. Heans and standard deviations on the WRAT, age at time of test, and grade level attime of test for groups of “extr~me ability
WRATAge at time Grade level Arithmetic Reading A-I-R
grade level grade levelAbility group Numberm Mean S.D. Nean S,D,
Low ability,grades 5-9------------ 52 5.04 1.82 5.14 1.35
High ability,grades 5-9------------ 51 10.74 2.57 9.90 2,00
Low ability,grades 10-12---------- 25 18.04 1.46 11.78 0.67 5.92 1.46 5.36 1.79 5.64 1.26
High ability,grades 10-12---------- 59 16.87 1.02 11.93 0.87 12.92 0.64 13.67 1.96 13.30 1.79
NOTE: S.D.--standard deviation; A + R—Arithmetic and Reading.
Table 61. Correlation between the WRAT and selected criterion measures,. by subtest for. groups of extreme ability
ArithmeticArithmetic Reading +
Subtests of the Stanford Readingand Metropolitan Achievement Tests
I --1--Low High Low High Low High
Stanford Achievement Test T Paragraph Meaning .34 .38 .61 .50 .59 .50 Word Meaning .10 .45 .60 .64 .45 .62
.50 1 .74 .42 .74Language .16 .57 L.57 .55Arithmetic Reasoning and Concepts .58 .61 .38 T
.65 Arithmetic Computation .60 .62 .24 .60 .46 .68
Metropolitan Achievement Test TReading .17 .23 -.17 .41 -.02 .40 Spelling .23 .22 .00 .64 .13 ;;:
.14Language .27 .41 r I.43 .26
Mathematical Computation .06 .26 .30 .67L .63Mathematical Analysis and Problem Solving .06 .28 .25
50

---
-----
sample between the Arithmetic section of the WRA’T and appropriate criterion variables. The use of the Reading section of the WRAT at the high school level for students of low ability must therefore be viewed with great caution.
DISCREPANCIES BETWEEN WRAT AND SAT GRADE LEVEL SCORES
A final analysis of the performance of the extreme ability groups concerns the discrepancy of grade levels as estimated by the WRAT from the grade level estimates provided by the group achievement test battery. Table 62 presents data on the most pertinent criterion measures. There seems to be a tendency for the Arithmetic section to underestimate the mathematics criteria. However, the magnitude of the under-estimation is more serious for Arithmetic Computation than Arithmetic Reasoning and is probably significant only for the high-ability group.
The WRAT Reading section for the high-ability group tends to overestimate the language-related skills by more than one grade level. For the low-ability group, however, WRAT estimates are quite close to the criteria for Paragraph and Word N4eaning, but again the WRAT overestimates performance on the SAT language subtest. These
Table 62. Discrepancies between the WRAT grade level scores and the Stanford Achievement Test grade level scores, by subtest for groups of extreme ability
1 I
Low ability High ability group group
SAT subtest
Mean D Mean D
WRATArithmetic test
Arithmetic Reasoning and
Concepts 5.33 -0.08
I 8.68 -0.39
Arithmetic Computation- 5.52 -0.27 8.23 -0.74
I WiZATReading test
Paragraph Meaning ;.;; ::.;; 9.34 +1.40
word Meaning- . . 8.84 +1.90 Language---- - 3.74 II+1.16 9.32 +1.42
NOTE: D—algebraic difference.
findings are, of course, quite similarto thosereported for the total sample, and they suggest that the WRAT canbe consideredapplicable toextreme ability levels for the elementary and junior high school children.
V1. CONCLUSIONS
The basic questions raised in this study involved the validity of the WRAT as a brief measure of school achievement and its adequacy for accurately predicting actual school performance as measured by conventional, comprehensive achievement measures.
On the first issue it seems fair to conclude that the Arithmetic and Reading sections for both Levels I and II of the 1963 Revised Wide Range Achievement Test have reasonably good construct validity as judged by their relation to conventional group school achievement tests. While there is a considerable range in the magnitude of validity coefficients depending on the level and geographical region involved, there is sufficient evidence of substantial correlation with criterion measures at every age level investi
gated to consider the WRAT a satisfactory brief estimate of school achievement.
Adequacy of the WRAT has also been investigated at extreme levels of ability, and it is concluded that the WRAT is quite satisfactory with high-ability students. With respect to students of low ability, the WRAT still seems satisfactory except for the use of the Reading section with high school students, where validity seems in doubt. Since the correlation of the WRAT with level of parental occupation is quite low, it may further be concluded that the test is applicable for children with widely differing socioeconomic backgrounds.
The question of grade level placement is rather complex. Here the WRAT must be rated as varying from being satisfactory to being in
51

considerable error, depending on the criterion used and the level at which the test is applied. Level I of both the Reading and Arithmetic sections of the WRAT overestimates both actual grade level and achievement on criterion measures from the Stanford Achievement Test. The tendency for the WRAT to overestimate is particularly serious for the Reading section, and since it is found in various area samples it cannot be dismissed as being due to geographic peculiarities.
Level II of the WRAT, on the other hand, tends to underestimate actual grade level but is quite close in predicting achievement levels on the Stanford Achievement and Metropolitan mathematics-related subtests. The WRAT Level 11 Reading test overestimated actual grade level for the junior high students but underestimated it for the senior high students. Likewise, performance on the SAT was underestimated, while performance on the Metropolitan criterion variables was overestimated.
Consideration of Jastak’s age norms helps in some instances, such as providing more accurate grade level assignment at the junior high school level, but in other instances use of his tables increases the reported discrepancies.
Analysis of the interrelation between the WRAT Arithmetic and Reading sections and their
—ooo
relation to criterion variables suggests that it would be possible to rely upon the Reading section as the sole achievement estimate at the elementary and junior high levels. However, such reduction of the achievement estimate wouId seriously reduce the accuracy of the estimate for mathematics-related skills, particular y for the senior high school levels.
Replication of our analyses for the Monongalia County samples with the geographically , dispersed control samples produced additional evidence of test validity but confirmed further that the grade level placement provided in the test manual must be used with caution, and may be subject to considerable geographical variation due to different educational policies and ability distributions.
In summary, it may be suggested that the Arithmetic and Reading sections of the WRAT provide useful estimates of school achievement but that restandardization of raw scores and their grade placement equivalents on the basis of the Health Examination Survey data would be desirable. Such restandardization ought to provide separate norms for broad geographic areas and, to be most useful, should provide separate norms for various age levels.
—
52

APPENDIX i
LEVEL I OF THE WIDE RANGE ACHIEVEMENT TEST
FORM USED IN THE ELEMENTARY SCHOOL STUDY
Personal Data
The four lines at the top of the title page should be carefully filled out before the test is begun. This section provides necessary statistical information. The following uniform procedures should be observed in completing the blanks.
Name: Print last name first, then first name and =s. Never assume that you know how to spell a name (not even Smith). Have ~ spell or write it for you on the line provided on the test form. A correct name may save much time in filing and finding records when needed.
Birthdate: Example: 10-18-1955 for October 18,1955.
M. F.: Encircle M for male; F for female.
Chronological Age: List completed years and months up to age 15 yeara, 11 months. For example, a child born on7-21-1957 was 6 yrs., 3mos. old on 11-15-1963. At 16 yrs. and almve, list age in years only, using the year completed on the last birthday. A.person hm on 10-18-1943 was 19 yrs. old on 6-5-1963.
School: Write down name of school attended at the time of the test.
Grade: Enter the grade he is attending at the time of the examination in the case of school children.
~ Always record the date on the teat. Example: 10-1S-1960 for October 15, 1960.
Examiner: Print name of person administering test.
DO NOT COMPLETE ANY OTHER ITEMS.
Now have the child write his name on the line below the little boxes on the firat page.
Test Instructions, Level I Reading
EJ should acquaint himself with the pronunciation of the words in the list. The pronunciation guide is provided for the examiner on page 6. The transcription symbols are those found in Webster’s New Collegiate Dictionary, The ~ may use other standard dictionaries
or the symbols of the International Phonetic Association in learning to pronounce the words.
Since this is primarily a reading test and not a test of speech or diction, unusual pronunciations due to colloquialism, foreign accent, and defective articulation are accepted as correct. An incorrect answer is any misreading due to improper sequence of letter sounds, confusion of phonetic valuea, and misplaced accent.
Always begin the administration with the word pronunciation test (75 words). Two copies of the test form may be used, one for &to read from, and one (with personal data filled out) for ~to record on. Point to the first word “cat” and say Look at each word
cayefully arm say it aloud. Begin here (point) ana YeaU the woras across the page so I can hear you. When you jinish the first line, go to the next line ana then the next. In the case of young children (S to 7 yrs.), each word should be pointed to with a pencil while —S attempta to read.
Time: 10 seconds per word.
The reading part should be administered with as few interruptions as pmsible. Any clesrcut response should be accepted and scored as either right or wrong. The first time an error is made, &is asked to say the word again. His response is scored right, if he corrects himself on the second trial. From then on, the first response is scored as either right or wrong, unless S spontaneously corrects the error he has made. —
If the response is not clear, ~ may ask&to repeat the word. The ~ should not intimate, by either motion or emotion, that he is dissatisfied with the answers, Spontaneous corrections are credited, but teaching, coaching, or questioning should be avoided.
The reading speed may be controlled by E. Saying— “next” at the end of the time limit of 10 sec. is one way of controlling the rate of performance. Refusals to read within time limits should not always be accepted as evidence of failure. If& hesitates or says “I don’t know this word”, ~ should encourage~ to try the word anyway or “take a guess” at it.
53

Testing Limits: 12 consecutive failures,
Recording.
a. Underline the first letter if the word is correctly pronounced. Example: ~t, ~lock.
b. Cross out the firat letter of the mispronounced word. Example: #at, Mock.
c. If& first mispronounces the word, then corrects his error, cross out the first letter and under-line the second letter of the word. Example g!!t, J&ock. Score right.
d. If& first pronounces the word correctly, then mispronounces it, underline the first letter and cross out the second letter of the word. Example 2A, ~~ock. Score wrong.
On the reading test, some~s tend to skim over the words or produce a response that sounds superficially correct. The & should he alert to these near successes and score them wrong, or ask ~ to repeat if no clear-cut decision can be made.
Examples of such near successes are:
bl~k for bl?k, &ksk5p for &k5p, h;m;~t! for
hi!im%t~, k;ntem/fwri for k&&porari, ak&?’for ;l’k~v,
k&&mpiius for k&&mpd&, ben?~or I&@ pr5t&&r?ms
for pr6tG&%ns, s~ntri’f!g~l for .&try%gal, ab?~m%
for ab;zfnal, s%~ngkt for s;ks~ngkt~ etc.
Pre-Reading Section
Whenever failures occur in the first line of the reading test, the three pre-reading parts of the sub-test are administered as follows:
letter? or What is this letter? And this one? (pointing to the next letter). The ~ may stop after the second correctly named letter.
Time: 10 seconds per letter
Recording: Underline letter correctly named or recognized, cross out letter incorrectly identified or named within time limits.
Level l–Pronuciation Guide for Reading Test
1. 2. 3.
4. 5. 6. -7/. 8.
9.
10. 11. 12. 13. 14. 15. 16. 17. 18. 19. 20. 21, 22. 23. 24. 25. 26. 27. 28. 29. 30. 31. 32. 33. 34. 35. 36. 37. 38. 39. 40. 41. 42. 43. 44. 45. 46.
47.
cat . . . . . . . . . . . . . .. . . . . . . . . k~tto . . . . . .. . . . . . . . . . . . . . . . . . tmsee . . . . . . . . . . . . . . . . . . . . . . sEbook . .. . . . . . . . . . . . . . . . . . . &X5kbig . . . . . . . . . . . . . . . . . . . . . . . b~geat . . . . . . . . . . . . . . . . . . . . . . . Etwas . . . . . . . . . . . . . . . . . . . . . . W8Zred . . . . . . . . . . . . . . . . . . . . . . ridhim . . . . . . . . . . . . . . . . . . . . . . himletter . . . . . . . . . . . . . . . . . . . WZropen . . . . . . . . . . . . . . . . . . . . . G’p&how .. .. . . . . . . . . . . . . . . . . . . houthen . . . . . . . . . . . . . . . . . . . . . th%deep, . . . . . . . . . . . . . . . . . . . . d~pwork . . . . . . . . . . . . . . . . . . . . w&kjar . . . . . . . . . . . . . . . . . . . . . . jarawake . . . . . . . . . .. . . . . . . . . &_wtik/size . . . . . . . . . . . . . . . . . . . . . sizspell . . . . . . . . . . . . . . . . . . . . sp~llip... . . . . . . . . . . . . . . . . . . . . l?pblock . . . . . . . . . . . . . . . . . . . . bldkweather . . . . . . . . . . . . . . . . w&h@reven . . . . . .. . . . . . . . . . . . . . . ~’vgnfinger . . . . . . . . . . . . . . . . . . . fing’g=rshould,., . . . . . . . . . . . . . . . sho”i%cliff . . . . . . . . . . . . . . . . . . . . . kflffelt . . . . . . . . . . . . . . . . . . . . . . f:ltstalk . . . . . . . . . . . . . . . . . . . . st~ktray . . . . . . . . . . . . . . . . . . . . . trZhuge . . . . . . . . . . . . . . . . . . . . . hiijapprove . . . . . . . . . . . . . . . . &prtiv’lame, . . . . . . . . . . . . . . . . . . . Eimplot . . . . . . . . . . . . . . . . . . . . . . pl&struck . . . . . . . . .. . . . . . . . . strfikquality . . . . . . . . . . . . . . . . . . kw:l{ dsour . . . . . . . . . . . . . . . . . . . . . soururge . . . . . . . . . . . . . . . . . . . . . lirjabuse . . . . . . . . .. . . . . . . . . . &Ubiiz’or ~biis’collapse . . . . . . . . . . . . . . . . k~ l~ps’exhaust . . . . . .. . . . . . . . . . . 14g2Wbulk.,..., . . . . . . .. . . . . . . . b$ku “residence . . . . . . . . . . . . . . re;}~wdgnsclarify . . . . . . . . . . . . . . . . . . klar’~fihumidity . . . . . . . . . . . . . . . l$m?d~t~imply . . . . . . . . . . . . . . . . . . . nil plz’quarantine . . . . . . . . . . . . . kw;rl~n tEnthreshold . . . . . . . . . . . . . . thr&h@ld OY thr&h’hi51d
1.
2.
3.
Naming 13 letters: Say, Reau these letters abut. what is this or What do you call this? (Point to the firat letter in the second row of capital letters printed above the word Iisti A B O, etc.) Point to each letter consecutively as S reads them.
Time: 10 seconds per letter
Recognizing 10 letters: Cover the word list with a sheet of paper, point to the first letter (A) in the top row on page 4 of the test form and say Fins! one just Like this mum here (pointing to the row of letters underneath). The instructions may be repeated if necessary. Each letter should be pointed to.
Time: 10 seconds per letter
Two letters in name: Point to the first letter in the name which ~ has written on page one of the test form and say: What do you call this
54

48. 49. 50, 51. 52. 53. 54. 55. 56, 57, 58, 59. 60, 61. 62, 63, 64. 65, 66. 67. 68. 69. 70. 71,
72. 73. 74, 75.
glutton . . . . . . . . . . . . . . . . . . recession . . . . . . . . . . . . . . participate . . . . . . . . . . . . horizon . . . . . . . . . . . . . . . . . emphasis . . . . . . . . . . . . . . aeronautic.., . . . . . . . . . . intrigue... . . . . . . . . . . . . . luxurious . . . . . . . . . . . . . . endeavor . . . . . . . . . . . . . . . persevere . . . . . . . . . . . . . rescinded . . . . . . . . . . . . . discretionary . . . . . . . . . mitosis . . . . . . . . . . . . . . . . repugnant . . . . . . . . . . . . . . putative.,,,..., . . . . . . . . rudimentary.. . . . . . . . . heresy . . . . . . . . . . . . . . . . . . usurp . . . . . . . . . . . . . . . . . . . novice . . . . . . . . . . . . . . . . . . audacious . . . . . . . . . . . . . . anomaly . . . . . . . . . . . . . . . seismograph.., . . . . . . . idiosyncrasy . . . . . . . . . . itinerary,, . . . . . . . . . . . . . spurious . . . . . . . . . . . . . . . miscreant . . . . . . . . . . . . . aborigines . . . . . . . . . . . . . pseudonym . . . . . . . . . . . .
Level i-Arithmetic
This test is composed of an oral and a written part. The oral part of the subtest consists ok
1. Counting 15 dots . . . . . . . . . . . . . . . . . . . . . . . . . . . . . . . . . . . . . . . . . . . . . .. . . . . . . . 8 points & Reading 5 digitq. . . . . . . . . . . . . . . . . . . . . . . . . . . . . . . . . . . . . . . . . . . . . . .. . . . . . . . 5 ,s
3. Showing 3and8fingers . . . .. . . . . . . . . . . . . . . . . . . . .. . . . . . . . . . . . . . . . . . . . 2 “ 4. Tellirrg which numlrerismorw90r6; 420r 28 . . . . . . . . .. . . . . . 2 “ fi. Tbraoorrdaddition mrdsubtmction probkams . . . . . . . . . . .. . . . . . 8 “
20 points
The written part consists of 43computationprob-Iems.
Test Instructions:
Begin the testing with the written computations. In examining young children (5 to 7 yrs.) point to the first problem ( 1 + 1 = ) and say: Read this. If the problem, including the signs, is read correctly, ask: PIwhat is the answer?’ When the answer is given, saY
WYite it uor.on on this line. Then say: Now reaa this (pointing to 4 - 1 = ) am @t the answer. on the Line (point). Next read this (pointing to 6 + 2) andput the answer unaev the line. Then reart all the other pYoblems in this YOUI(pointing) arut uwite your answers on OY untter the lines.
000
If the child is unable to read the first problem (1 + 1 =), discontinue the written part and administer the oral parts according to the instructions outlined below.
Children of ages 5 to 7 yrs. and persons who obtain a score of less than 7 points on the written part, are given the oral parts of the subtest.
1. Counting 15 dots: Point to the dots printed at the top of page 2 of the test form and say: Point with youY finger ana count these sots one by one beginning here (~’s left) and going this way (moving to the right, motion). Count them aloud so I can hear you and tell me how many dots there are.
2. Reading Numbers 3, 5, 6, 17, 41: Point to the numbers (printed upside down on the form) and say: Reaa these numbeys. What is this? (pOitlting to the 3). Arm this. Etc.
3. Showing Fingers: Say Show me 3 fingers. Show we 8 fingers.
4. Telling Which Number is More: Say: Which is
more, 9 OY 6? Which is more, 42 OY28 ?
5. Add and Subtract: Ask: (a) If you have 3 pennies and spend 1 of them, how many have you Left? (b) How many are 3 apples and 4 apples? (c) Jack haa 9 marbles. He lost 3 of them. How many were left?
Time Limits: 10 minutes for page of written computations.
1 minute for counting 15 dota. 1 minute for reading atl five numbers. 1 minute for showing fingers (both prob
lems). 1. minute for telling which is more
(both problems). 1 minute for each of the three oral
problems.
Recordimz Oral Parh
Counting dots —underline the last number correctly counted and pointed to. Reading numbers, Showing fingers, Which is more, and Solving problems-underline numbers on form if correc~ cross them out if incorrect.
DO NOT SCORE WRITTEN PART.
CumuL Answer Key - Arithmetic, Level I Points
Oral Park Counts 15 dots, 1 point for each of tbe following 1, 2-3, 4-5, 6-7, 8-9, 10-11, 12-13, 1415 . . . . . . . . . . . . . 8 Reada 5 numbers. . 5 pts. Fingsrs. .2 pa... . . . . . . . 15 Which is more. .2 pts. Answera toproblems:2 78... 20
55

APPENDIX II
LEVEL II OF THE WIDE RANGE ACHIEVEMENT TEST
FORM USED IN THE JUNIOR AND SENIOR HIGH SCHOOL STUDIES
Personal Data
The four lines at the top of the title page should be carefully filled out before the test is begun. This section provides necessary statistical information. The following uniform procedures should be observed in completing the blanks.
-. Print last name first, then first name and initials. Never assume that you know how to spell a name (not even Smith). Have ~ spell or write it for you on the line provided on the test form. A correct name may save much time in filing and finding records when needed.
Birthdate: Example: 10-18-1955 for October 18,1955.
M. F.: Encircle M for male; F for female.
Chronological Age: List completed years and months Up to age 15 yrs., 11 mos. For example, a child born on 7-21-1957 was 6 yrs., 3 mos. old on 11-15-1963. At 16 yrs. and ahove, list age in years only, using the year completed on the last birthday. A person born on 10-18-1943 was 19 yrs. old on 6-5-1963.
School: Write down name of school attended at the time of the test.
Grade: Enter the grade he is attending at the time of the examination in the case of school children.
Date: Always record the date of the test. Example: =5-1960 for October 15, 1960.
Examiner: Print name of person administering test.
DO NOT COMPLETE ANY OTHER ITEMS.
Now have the child write his name on the line be-low the little boxes on the first page.
Reading Instructions
Before administering this test, study the pronunciation guide on page 5. The transcription synhls are those found in Webster’s New Collegiate Dictionary. The ~ may use other standard dictionaries or the
symlmls of the International Phonetic Association in learning to pronounce the words.
Since this is primarily a reading test and not a test of speech or diction, unusual pronunciations due to colloquialism, foreign accent, and defective articulation are accepted as correct. An incorrect answer ia any misreading due to improper sequence of letter sounds, confusion of phonetic values, and misplaced accent.
Always begin the administration with the word pronunciation test (74 words). Two copies of the test form may be used, one for -& to read from, and one (with personal data filled out) for ~ to record on. Point to the first word “in” and say: Look at each woya cayefilly and say it abua. Be@”nheye (point)and Yeaa the woras acyoss the page so I can heav you. When you f?nish the j%st line, go on to the next line anti then the next. In the case of young children (5 to 7 yrs.), each word should be pointed to with a pencil while S attempts to read.
T- 10 seconds per word.
The reading part should be administered with as few interruptions as possible. Any clearcut response should be accepted and scored as either right or wrong. The first time an error is made, &is asked to say the word again. His response is scored right, if he corrects himself on the second trial. From then on, the first response is scored as either right or wrong, Unless ~ spontaneously corrects the error he has made.
If the response is not clear, E may ask ~ to re-peat the word. The ~ should not %tirnate, by either motion or emotion, that he is dissatisfied with the answers. Spontaneous corrections are credited, but teaching, coaching, or questioning should be avoided.
The reading speed may be controlled by E. Saying “next” at the end of the time limit of 10 sec. is one way of controlling the rate of performance. Refusals to read within the time limits should not always be accepted as evidence of failure. If ~ hesitates or says “I don’t know this word,” ~ should encourage ~ to try the word anyway or “take a guess” at it,
Testing Limits: 12 consecutive failures.
56

Recording: 17. contemporary . . . . . 18. toughen.
a. Underline the first letter if the word is cor- 19. rectly pronounced. Example: $at, Qlock. 20.
b. Cross out the first letter of the mispronounced 21.
word. Example: cat, flock. 22. 23.
c, If ~ first mispronounces the word, then cor- 24. rects his error, cross out the first letter and 25. underline the second letter of the word. Example: 26. $&, Mock. Score right 27.
d. If ~ first pronounces the word correctly, then 28.
mispronounces it, underline the first letter 29.
and cross out the second letter of the word. 30.
Example: @, l&ck. Score wrong. 31. 32.
On the reading test, some~s tend to skim over the 33. words or produce a response that sounds superficially 34. correct. The ~ should be alert to these near successes 35. and score them wrong, or ask ~ to repeat if no clear- 36. cut decision can be made. 37.
Examples of such near successes are: 38. 39.
bl~k for bldk, ~kskZip for &kZp, h~m%% for 40.
hikm~l%t~,k&tem’pri for k&W~m$orari, akav’for &5v, 41. 42.
k&t8mpiius for k&&mpt&, ben~~or b$n~n(prZi&&%s 43.
for pr75tlib’&%ns, s&tri’ f~g~l for s&tr;fkgal, ab~s’m~l 44. 45.
for ab;z(nal, s%?ngkt for s~ks%gkt( etc. 46.
Pre-Word Level: 47. 48.
If & obtains a score of 10 points or less in the 49.regular reading part, he should be asked to name the 50.13 capital letters printed above the word list and 51.to name at least 2 letters in his name which he has 52.written or printed on the line provided on the first page 53.of the test form. One point is assigned for each of the 54.2 letters in his name and the 13 letters to be identified. 55.
56.
Level n-Pronunciation Guide for Reading Tesf 57. 58.
1. in . . . . . . . . . . . . . . . . . . . . . % 59. 2, milk.., . . . . . . . . . . . . . . m~lk 60. 3. tree..,,., . . . . . . . . . . . . tr~ 61. 4. city . . . . . . . . . . . . . . . . . . s%’? 62. 5, animal . . . . .. . . . . . . . . ~~’~ m~l 63. 6. himself . . . . . . . . . . . . . him s~lf’ 64. 7, between .. . . . . . . . . . . . bi$UtwFn’ 65. 8. chin..., . . . . . . . . . . . . . . chin 66. 9, split . . . . . . . . . . . . . . . . . splY.t 67.
10. grunt . . . . .. . . . . . . . . . . gftint 68. 11, form . . . . . . . . . . .. . . . . . form 69. 12. stretch,, . . . . . . . . . . . . str~ch 70. 13. aboard ., . . . . . . . . . . . . & bi5rd’ 71. 14. theory,.., . . . . . . . . . . . thiX!ir? 72. 1S. escape . . .. . . . . . . . . . . & k=p’ OY ?S k=p’ 73. 16. grieve . . . . . . . . . . . . . . . gr~v 74.
. . . . . . . . . . . . contagious . . . . . . . . . ethics . . . . . . . . . . . . . . . image . . . . . . . .. . . . . . . triumph . . . . . . . . . . . .. conspiracy . . . . . . . . . eliminate . . . . . . . . . . . rancid . . . . . . . . .. . . . . . tranquility . . . . . . . . deny .. . . . . . . . . . . . . . . . humiliate . . .. . . . . . . . alcove . . . . . . . . . . . . . . . scald.. . . . . . . . . . . . . . . municipal . . . . . . . . . . desolate . . . . . . . . . . . . mosaic . . . . . . . . . . . . . . bibliography . . . . . . . unanimous . . . . . . . . . decisive .. . . . . . . . . .. contemptuous . . . . . predatory . . . . . . . . . . benign . . . . . . . . . . .. . . . deteriorate . . . . . . . . protuberance . . . . . . stratagem . . . . . . . . . . regime . . . . . . . . . . . . . . predilection . . . . . . . prevalence . . . . . . . . . irascible... . . . . . . . . peculiarity . . . . . . . . . abysmal . . . . .. . . . . . . pugilist . . . . . . . . . . . . . soliloquize . . . . . . . . . enigmatic . . . . . . . . . . centrifugal . . . . . . . . . emaciated . . . . . . . . . . oligarchy . . . . . . . . . . . covetousness . . . . . . “ingratiating . . . . . . . . coercion . . . . . . . . . . . . vehemence . . . . . . . . . sepulcher . . . . . . . . . . longevity.. . . . . . . . . . evanescence . . . . . . . beneficent . . . . . . . . . . subtlety . . . . . . . . . . . . . succinct . . . . .. . . . . .. beatify . . . . . . . . . . . . . . regicidal.. . . . . . . . . . schism . . . . . . . . . . . . . . heinous . . . . . . . . . . . . . desuetude . . . . . . . . . . egregious . . . . . . . . . . misogyny .. . . . . .. . . . internecine . . . . . . . . synecdoche . . . . . . . . ebullience . . . . . . . . . .
k&Nt~m’p6 r~r~tuf Enk~n tZ’j&$&sim+’jtr~timf$$ s)p#~ STe lim ~nat&#s~d
tr%n kw$l~ ~ or tr%ng kw~l~ t!d~n~~,Y_hh mil I attil’kavsk$ldmti n%’!’ p~ldgs’b Ifm* Z2?Kb?b’l? ~g’rkl f~tiLn!$,P+mt&de si SIVk& t~mp’~ &pr~d’tj tE rib$n~’d$ ti+~ 6 rZitprh tii’b~r !nsstr% ‘Aj&mr~ zh=m’pr=’d~ l~~shfinpr~v’~ l~ns~ r%st~ b’1 ov !-
J. _, Yu/YQpe ku h ar AtlQ b!z’m$hpii’j!l’fs;S6 $6 ‘kw~z? nig m%YYkor % ‘lg m%’?ks~n tr!f$_g~$ m~’shi at ed~1’~gar k~$V{_&sUn$svin gra’shi Zt mgk~ fir’shinvG’~ m&ss~p’~1 k~u$? Jev/1 tiev &n& &sbe n~f$ s!%ts~tl’luus& singktjb$ ~J’l_f$ur~j &sid @siz’mhX%&d~s’w$ tiid
~ ,$K;j$%”;r am%%tnlin ter & /6yn
s. n~k’d~ k~ $ b~l~ ~ns
57

Arithmetic–Level [1
Instructions: Say: This is an. aytthmetic test. Tunr. to
page 3 where it says Arithmetic, Level II and look at the problems printed below the heavy line (hold test form up and point). Ita like to know how many of the pyoblems on this page you can figu?-e out. Look at each problem carefully to see what you are supposeu to
do - add, subtyact, multiply, or divide - and then put down yowv answer in the space on or undeY the lines. Should you wish to figure on the paper, you may use the empty spaces or the margins to write on. Finst do the top YOW, then the second yew, then the third row, etc. The problems get moye dijjlcult as you go down the page. Don’t spend too much time on any one pYoblem. You can skip a problem if it is too dij%xlt joy you,
but do as many as you can one by one. You will have 10 minutes. Now, go ahead and do as many as you can.
T= 10 minutes for page of computations.
IX) NOT SCORE RESULTS.
Oral Arithmetic-Level II
Any person obtaining less than five points in the written part must be given the oral part as follows:
1. Counting 15 dots: Point to the dots printed at the top of page 2 of the test form and sav:.-Point with you; fingey ancz count these dots one by one beginning heye @’s left) and going this way (moving to the right). Count them aloud so I can hear you and .&& me how many dots there aye.
(On top of page check once for correct count from 1 to 6 and again for correct count from 6 to 15.)
2. Reading numbers 3, 5, 6, 17, 41: Point to the numbers (printed upside down on page 2 of the.-test form) and say: Read these numbers, What is this? (Pointing to 3) And this? Etc.
3. Solving three problems: Ask: (a) If you have thyee pennies and spend one of them, how many
have you left? (b) How many are three apples and fww apples? (c] Jack had nine marbles. He lost three of them. HOWmany were lejt?
(Record answers to questions a, b, and c at the top of the test form page.)
ooo —
58

APPENDIX Ill
PERSONNEL PARTICIPATING IN THE DATA COLLECTION AND ANALYSIS
Project DivectoY
K. Warner Schaie, Ph.D.
Project SecYetary
Margaret D. Auberle
Resea~ch Assistants
Ronald Bone, A.B.Don SimonsClaude Southerly, M.A.Barbara Stone, A.B.
Field Testing Consultants
Ruth Camp, M.A. (Morgantown, W. Vs.)John Ivanoff, Ph.D. (Milwaukee, Wis.)
Seymour Levitan, Ph.D. (Los Angeles, Calif.)Naomi A. Patterson, Ph.D. (Fort-Collins, Colo.)
Examiners
MONONGALIA COUNTY, W. VA.
Clay -Battelle GroupJoin Clovis (in charge)Anne BarrRobert BeachLinda BosleyVirginia BunnerCarillon Copeland
Margie FoxPatricia LowryFelix LunghiFred Miller
Michael ResetarWilliam SandersKent StaggersWilliam SterlingBonnie TennantGladys WhiteHuey Wilson
Central GroupVivian Price (in charge)Margaret BrandEleanor CollinsMaxine GloverEleanor HenryKatherine Reed
Cheat Lake GroupHarold Pickens (in charge)Patricia BakerRonald ColovincenzoThomas W. CobunMabel B. HarrahJohn KapsaroffJane LemleyMary McGregorElaine ShaleWilliam Spangler
First Ward GroupWilliam F. Cunningham (in charge)Ethel BagshawMarguerite FranklinJulia FrumDaun JohnsonVirginia LongCarol MayleThelma MorganDorotha MorrisRuth Morton
Irene MossburgVirginia PixlerPauline TrickettMildred Williams
Westover GroupMrs. Sylva Fetty (in charge)Mrs. L. Douglas CumutteMrs. William FournierElizabeth J. HallAnne Heiskell
59

Mrs. Claude KemperMrs. C. N. RoseneckerW. E. Spangler
University High GroupMichael CarusoWayne G. BakerAllen R. BryantGloria J. CunninghamJanet D. CallahanSara E. LoganDavid LoughrieWilliam P. HawleyLillie W. MorganRichard N. RyanJoseph P. TalericoDarrel E. Wood
FORT COLLINS, COLO.
Dick DeCookJohn DyckKaren GabbertMichael GaynorJoel GoldDal HedlundAl HinkleBill JonesAnita LeightonRobert LeightonLarry Motzkus
60
Joan Muser Marilyn Rhodes James L. Sheard Lowell Wilson
LOS ANGELES COUNTY, cALIF,
Kerby AlvyMaureen BehrensG. William DomhoffCarol GrieshaberRichard MachFrank E. Webb
MILWAUKEE COUNTY, WIS.
Sara Derman Charles Droege D. Enders James HanIon Margaret A. Hendricks Joanne Ivanoff Helen Kilgore Ame Nesbit Dianne Perone Lalia Peterson Lois Schaper Demis Scbrank S. B. Schultz Maribeth Schultz
* U.S. GOVERIIMEHT PRINTING OWICC t 1S67 0-244-201

OUTLINE OF REPORT SERIES FOR VITAL AND HEALTH STATISTICS
Public Health Service Publication No. 1000
SeTies 1. l+ogra?ns and collection pvoceduYes.— Keports which describe the general programs of the National
Center for Health Statistics and its offices and divisions, data collection methods used, definitions, and other material necessary for understanding the data.
Se3-ies 2. Data evaluation and methods reseavch. —Studies of new statistical methodology including: experimental tests of new survey methods, studies of vital statistics collection methods, new analytical techniques, objective evaluations of reliability of collected data, contributions to statistical theory.
Series 3. Analytical st?ufzes. -Reports presenting analytical or interpretive studies based on vital and health statistics, carrying the analysis further than the expository types of reports in the other series.
SeYies 4. Documents and committee reports. — Final reports of major committees concerned with vital and health statistics, and documents such as recommended model vital registration laws and revised birth and death certificates.
Series 10. Data from the Health InteYview Survey. —Statistics on illness, accidental injuries, disability, use of hospital, medical, dental, and other services, and other health-related topics, based on data collected in a continuing national household interview survey.
Series 11. Data from the Health Examination Survey. — Data from direct examination, testing, and measurement of national samples of the population provide the basis for two types of reports: (1) estimates
of the medically defined prevalence of specific diseases in the United States and the distributions of the population with respect to physical, physiological, and psychological characteristics; and (2)
analysis of relationships among the various measurements without reference to an explicit finite universe of persons.
Series 12. Data fyom the Institutional Population Surveys.— Statistics relating to the health characteristics of persons in institutions, and on medical, nursing, and personal care received, based on national samples of establishments providing these services and samples of the residents or patients.
Series 13. Data from the Hospital Dischavge .Swvey. —Statistics relating to discharged patients in short-stay hospitals, based on a sample of patient records in a national sample of hospitals.
Series 20. Data on moytality. —Various statistics on mortality other than as included in annual or monthly reports— special analyses by cause of death, age, and other demographic variables, also geographic and time series analyses.
Series 21. Data on natality, rnam-iage, and divovce. —Various statistics on natality, marriage, and divorce other than as included in annual or monthly reports— special analyses by demographic variables, also geographic and time series analyses, studies of fertility.
Series 22. Data from the National Natality and kfo~tality Surveys. — Statistics on characteristics of births and deaths not available from the vital records, based on sample surveys stemming from these records,
including such topics as mortality by socioeconomic class, medical experience in the last year of life, characteristics of pregnancy, etc.
For a list of titles of reports published in these series, write to: mfice of Information
National Center for Health Statistics U.S. Public Health Service Washington, D.C. 20201