Embed Size (px)
Citation preview

A Study of the Effect of Pictorial Markings and Warning Labels on Handling of Packages in the DHL Single-Parcel Environment
J. Singh
Industrial Technology, Cal Poly State University, San Luis Obispo, CA, USA
S. P. Singh
School of Packaging, Michigan State University, East Lansing, MI, USA
T. Voss
Packaging Department, Rochester Institute of Technology, Rochester, NY, USAK.
K. Saha
School of Packaging, Michigan State University, East Lansing, MI, USA
ABSTRACT
Over the past two decades, there has been a heavy influx in the number of direct-to-consumer express
shipments of packaged products. As a consequence, parcel delivery companies, such as DHL, FedEx and
UPS, have strengthened their presence in air transport. This study measured and analysed the effect of
moving single packages through air shipments in the USA using one of the newest service providers,
DHL. The study also quantified the effect of placing pictorial markings and warning labels on mid-sized
and lightweight packages when using Next-Day and 2nd Day services provided by the carrier DHL.
Instrumented packages measuring 0.38 m x 0.34 m x 0.34 m and weighing 6.8 kg were shipped from
Michigan to California and New York. A total of 48 trips were conducted to collect the data for this
study.
The results show that for the Next-Day and 2nd Day service, packages with labels, as compared with
those without labels, were subjected to approximately the same number of drops for shipment to
California, and approximately 35% less drops for shipments to New York. The drop-height data for the
shipments are presented in terms of drop heights associated with the 90, 95 and 99th percentile of
occurrence. Impact orientation is also discussed.
KEY WORDS: package handling; express delivery; pictorial markings; warning labels; drops
INTRODUCTION
Express parcel shipping may be defined as the provision of integrated door-to-door transport and
delivery of next-day or time-definite (2–3 days) shipments including documents, parcels and
merchandise goods. Express delivery companies today serve over 220 countries with four companies,
DHL, Federal Express (FedEx), TNT and United Parcel Service (UPS), poised as the leaders of the global
express industry.1 DHL represents the largest global air carrier of parcels. UPS is the largest US parcel
carrier, and the vast majority of its shipments are ground. FedEx is the largest parcel air delivery
company in the USA. United States Postal Service is the US mail carrier, and handles letters, bills,
magazines, printed materials and parcels. In terms of the individual pieces handled and delivered, it is
the world’s largest transportation company. Express delivery services are expected to average 8% a year
growth over the next decade.1 Growth reflects the continued expansion of international trade and the
increasing need for rapid, guaranteed delivery. Goods transported by air account for 40% by value of all
goods traded globally, of which express delivery represents a substantial proportion.1
Express delivery operators offer door-to-door services to their customers, providing not only
transportation systems in which the location and progress of packages is constantly tracked, but also
cross-border customs clearance and collection of payments from customers.1 Express delivery operators

Table I. DHL's express worldwide market share'
Market sizeDHL shareLeaderKey competitors
Europe*
€36 billion20%DHLTNT, La Poste, UPS, Royal Mail
USA
€4S billion9%UPSFed Ex, UPS, USPS
Asia Pacific
€20 billion33%tDHLFed Ex, UPS
* 2004: Market size for six core markets: Germany. UK. France, Netherlands, Italy and Spain = €28 billion.t International only; including domestic = 12%.
make it possible for businesses of any size to compete effectively in the modern global marketplace,
serving their customers across a continent or around the world.
Express shipping market is valued approximately at $70 billion in the USA, making it the single largest
express distribution market globally.2 While DHL Worldwide Network S.A./N.V., wholly owned by
Deutsche Post AG since December 2002, is the world’s leading cross-border express delivery service,
UPS and FedEx hold a combined market share of over 70% of the US market.2 With DHL’s acquisition of
Airborne Express in 2003 and subsequent investments in infrastructure and technology, it is rapidly
becoming a very competitive alternative to UPS and FedEx. Table 1 shows some key data for DHL’s
express business.
Packaged goods are shipped globally using various means of transportation. Over the past two decades,
there has been a continuous increase in studies that measure and analyse dynamic events that occur to
packages during transportation and handling. These data offer useful information to design and test
packages, and provide protection from potential hazards like drops and impacts. The methods used to
determine these dynamic levels have been well established in several studies previously performed.
• Goff4 developed performance requirements that were necessary for parcel post packages in
1974. The study recommended performance-based test methods that could be used to reduce
physical damage to parcel post packages.

• Singh and Voss,5 and Singh and Cheema6 measured the dynamics of small parcel environment
in the UPS ground-shipping environment. The study tested packages of different sizes and
weights that were instrumented with drop-height recorders and then shipped through UPS. The
study showed that the highest drop height measured was 1.06 m, and that the size of the
package had no significant effect on the drop heights associated with medium and larger-size
packages. However, small-size and lighter-weight packages did experience higher drop heights.
This was attributed to the use of automated handling for the larger and heavier packages in the
UPS sorting environment. The smaller and lighter packages are often placed on top in the
delivery truck and are therefore subject to higher drops.
• Singh et al.7 measured the environment within UPS for packages weighing up to 64 kg. In
addition, the effect of label position on drop orientation has also been studied in parcel
shipments for large and heavy packages.8
• Singh et al.9 concluded that the package size and weight had no effect on measured drop
heights for packages classified as small and lightweight within the FedEx Second-Day Air delivery
system. The study also found that warning labels reading ‘Fragile – Handle with Care’ had no
significant effect on the handling of packages in the FedEx system for these types of packages.
• In another study measuring the parcel shipping environment within FedEx for lightweight and
small-size packages, Singh et al.10 concluded that neither the package size/weight nor the labels
had any significant effect on the severity of drop heights. The highest drop height measured was
1.85 m.
• A study11 measuring and analysing the express shipping environment for mid-sized and
lightweight packages for DHL, FedEx and UPS concluded that the handling environments within
FedEx and UPS are not significantly different between ground shipping, second-day and next-
day, regardless of package size and weight of packages. The data showed that while the highest
drop height was similar in all three carriers, subsequent drops were higher in the DHL system
than in the FedEx and UPS.
• In a recent study, Singh et al.12 summarized that the number of drops experienced by the
packages in the Overnight (Next-day) environment for USPS was comparable with average of
those for DHL, FedEx and UPS. The Priority (Second-day) shipments in the USPS environment,
however, experienced 2.3 times lesser drops as compared with the average of those
experienced in DHL, FedEx and UPS shipments. The study also found that the average drop
height of the 10 highest drops experienced in the USPS shipping environment for both the
Express (Next-day) and Priority (Second-day) service was higher than that for DHL, FedEx and
UPS.
Due to a lack of data from past studies, this research focused on measuring the effect of pictorial
markings and warning labels in the express parcel shipping environment for mid-sized and lightweight
packages for DHL. It is known that as large parcel carriers have expanded their parcel handling volumes,
they have automated the processing, sortation, diverting and conveying functions during parcel handling
at hub facilities. During these functions, pictorial markings do not play any role due to limited human
interaction. However, for functions such as pickup, delivery, loading and unloading of vehicles and air
containers, the process is manual. These operations are usually very fast with limited interaction time
between the package and operator. It is during these events that packages may get dropped or
mishandled due to limited time constraints. It is for this reason, this study further investigated the effect
of pictorial markings such as ‘Fragile’ and ‘Handle with Care’.
The study had the following objectives:
1. To characterize the dynamics of the Next-Day and 2nd Day express shipping shock-and-drop
environment for mid-sized and lightweight packages shipped by DHL within the USA

2. To determine the effect of pictorial markings and warning labels, such as ‘This Side Up’ and
‘Fragile – Handle With Care’, on the handling of these packages
3. To provide recommended test levels for drop-testing packages for DHL single-parcel shipping
environment.
METHOD
An EDR-3C recorder (Instrumented Sensor Technology, Okemos, MI, USA) was used to capture and
record impact data in three axes. Based on previous studies7–12, the pre-trigger and post-trigger times to
be recorded were set at 50 and 250 ms, respectively. The sampling rate was 1000 Hz and the trigger
level was 2 G for all three axes. The test duration was set at 60 days, and the recorder was set to record
with an overwrite limit of 900 events. The overwrite parameter ensures that the EDR-3C records the
most severe events if the recorder experiences more than 900 events. The recorders were set up with
similar parameters as previous studies, so the data can be compared with previous studies.
Test packages were used to ship the EDR-3Cunits to measure the dynamic events experienced in the
Next-Day and 2nd Day express small-parcel environment for DHL. The EDR-3C units were encased in
high-density polyethylene foam cushion. The cushions were placed on all six sides so that the unit was at
the geometric centre of a two-piece, blow-moulded, double-walled plastic case with four metal latches.
This plastic case was then contained in a double-wall regular slotted container corrugated board box. All
recorders were placed in the same orientation in all packages for every shipment. The corrugated
shipping boxes were sealed using 51 mm wide general-purpose plastic box sealing tape. All
instrumented packages were 0.38 m x 0.34 m x 0.34 m in external dimensions and weighed
approximately 6.8 kg.

The packages were shipped from East Lansing, MI to San Luis Obispo, CA and Rochester, NY. Three
round trips (six one-way trips) were made for all packages, with and without the precautionary labels,
using DHL’s Next-Day and 2nd Day service for a total of 48 trips for the study. The distance between East
Lansing, MI to Rochester, NY is approximately 400 miles, whereas that between East Lansing, MI and
San Luis Obispo, CA is approximately 2400 miles. However, due to the hub-and-spoke model used by all
small-parcel shipping companies, the actual distance travelled by the packages varied from the actual
distances mentioned. The carriers use the hub-and-spoke system to route packages to one major hub
every night that is located geographically in the centre, where packages are sorted and then shipped on
to the final destinations. Ideally, packages shipped to major cities like Los Angeles, Chicago, Atlanta, New
York, etc., may go through a sort at the major hub at night and delivered the next morning. However, for
destinations such as San Luis Obispo, CA, the packages may get additional handling after reaching Los
Angeles, and either sent on to San Luis Obispo in a smaller aircraft also known as the ‘feeder’ or in a
truck. This results in additional handlings of the package due to additional sorts, and loading and
unloading.
RESULTS
Based on the data collected, drop height, impact orientation and frequency of occurrence were
tabulated for each package. Tables 2–7 and Figures 1 and 2 show the results for packages shipped in the
Next-Day and 2nd Day environments for DHL. During the data analysis, drop heights below 76 mm were
ignored since they typically produce very little damage on small packages, as observed in the past
studies.5–7
For the Next-Day service, packages with labels, as compared with those without labels, were subjected
to approximately the same number of drops for shipment to California, and approximately 35%

Table 2. Summary of drop height data measured above 76 mm: Michigan to California
Next-day 2nd day Next-day
Drop data No label Label
Number of drops 91 107 93Maximum drop height (m) 0.95 0.98 0.99Drop height at 99% occurrence (m) 0.95 0.95 0.96Drop height at 95% occurrence (m) 0.73 0.76 0.67Drop height at 90% occurrence (m) 0.58 0.54 0.49
2nd day
1711.100.960.450.35
Table 3. Summary of drop height data measured above 76 mm: Michigan to New York
Next-day 2nd day Next-day
Drop data No label Label
Number of drops 122 79 79Maximum drop height (m) 1.03 1.05 1.06Drop height at 99% occurrence (m) 0.90 1.05 1.05Drop height at 95% occurrence (m) 0.50 0.65 0.82Drop height at 90% occurrence (m) 0.43 0.55 0.68
Table 4. Drop height levels for shipments: Michigan to California
Next-day 2nd day Next-day 2nd dayDropheight (m) No label Label
Highest 0.95 0.98 0.99 1.102nd highest 0.89 0.93 0.93 0.943rd highest 0.86 0.83 0.79 0.754th highest 0.85 0.82 0.76 0.695th highest 0.71 0.77 0.67 0.686th highest 0.70 0.76 0.62 0.687th highest 0.61 0.71 0.59 0.528th highest 0.61 0.71 0.56 0.529th highest 0.60 0.64 0.54 0.5010th highest 0.59 0.61 0.48 0.50
2nd day
820.730.730.580.45

Table S. Drop height levels for shipments: Michigan toNew York
Next-day 2nd day Next-day 2nd dayDropheight (m) No label Label
Highest 1.03 1.05 1.06 0.732nd highest 0.87 0.72 0.97 0.733rd highest 0.80 0.71 0.83 0.614th highest 0.73 0.68 0.83 0.605th highest 0.59 0.63 0.81 0.586th highest 0.53 0.60 0.73 0.537th highest 0.49 0.58 0.70 0.468th highest 0.48 0.58 0.66 0.459th highest 0.48 0.52 0.65 0.4510th highest 0.47 0.50 0.64 0.41
Table 6. Percent orientation of impacts forpackages: Michigan to California
Orientation of drops (%)
Shipment type Face Edge Corner
Next-day Label 87.9 9.9 2.2No label 91.6 2.8 5.6
2nd day Label 82.8 7.S 9.7No label 83.0 7.1 9.9
Table 7. Percent orientation of impacts forpackages: Michigan to New York
Orientation of drops (%)
Shipment type Face Edge Corner
Next-day Label 87.7 4.9 7.4No label 92.4 6.3 1.3
2nd day Label 93.7 2.5 3.8No label 89.0 6.1 4.9
. ~~-:.t. '*- ~'8' '-1>/. • '~'~_Er.... e:,....~_Et
;i~3·
i]I:,!Iit
flJ
I
110%
100%
90%
"80%
'"~ 70%~
"e60%
~
"~ 50%
'"~~ 40%E~
U 30%
20%
10%
0%
o 0.2 0.4 0.6
Drop Height (m)
0.8 1.2
- 8- Next Day with Label- 0-. 2nd Day with Label
.. * .. Next Day without Label----6- 2nd Day without Label
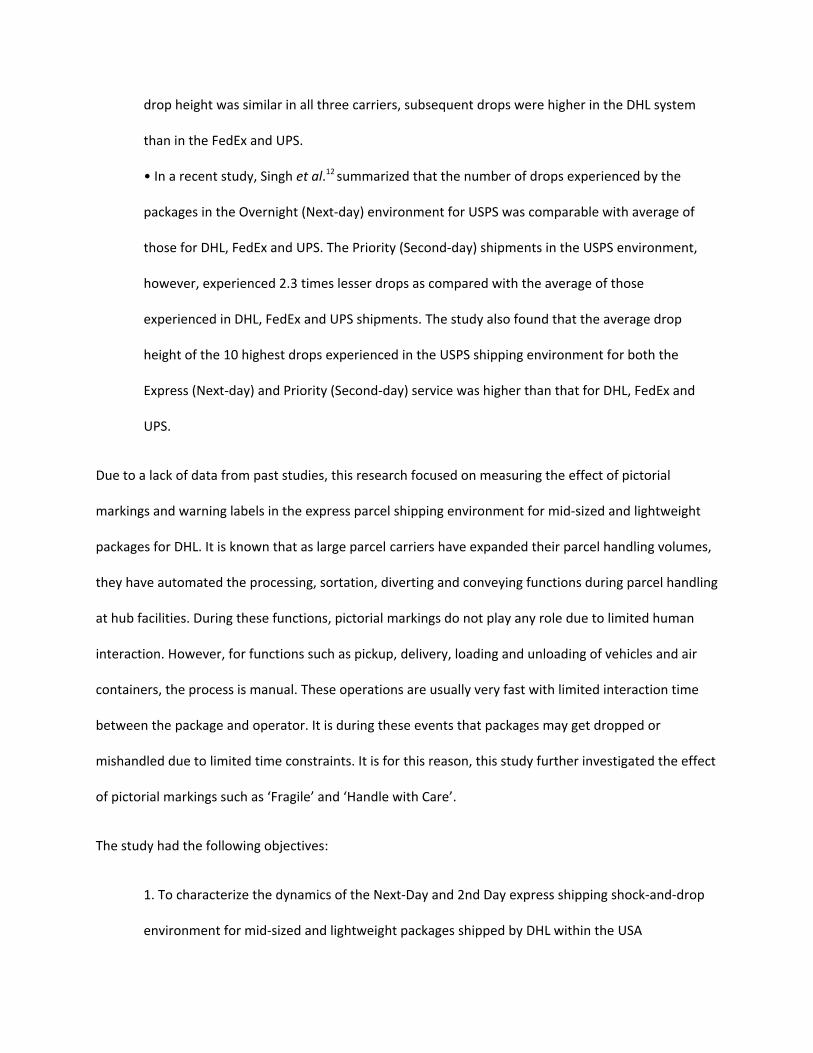
Figure 1. Cumulative percentage versus drop height for shipments to California.

,a-- _ ." -",c·"'~.J'F~4>'''''F~·~.~•. -.Jf- ,..: _..0- .-e-
..a-~...G'"~~--o-.-<r-A:T, _ -: -y.•
//%,.:z
'7'r !Ii
/1~ ,/1.,.;-~P'I; .
Jil,I••
~fI;
y
110%
100%
90%
80%
"'"l!! 70%~
"e60%"11.
~ 50%
'"~~
40%E~
030%
20%
10%
0%o 0.2 0.4 0.6
Drop Height 1m)
0.8 1.2
- 8- Next Day with Label· . ~ .. Next Day without Label - 0-. 2nd Day with Label ----0- 2nd Day without Label
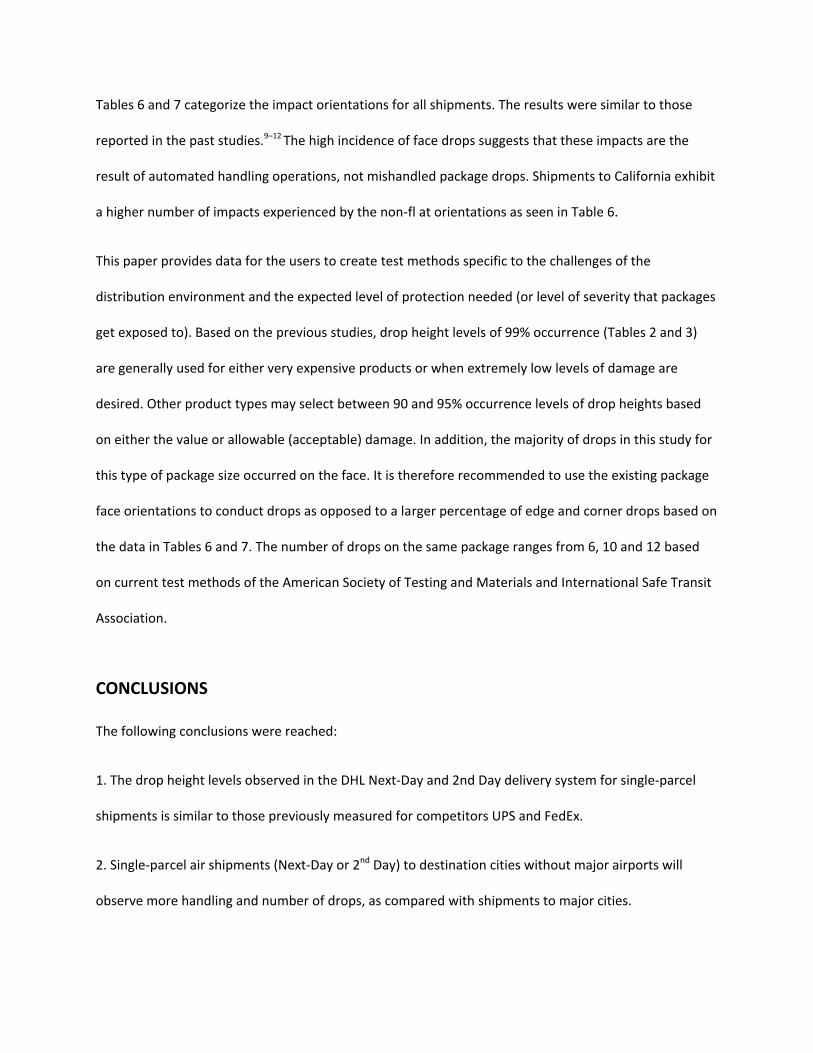
Figure 2. Cumulative percentage versus drop height for shipments to New York.
less drops for shipments to New York. For the 2nd Day service, approximately 37% more drops were
noted for shipments to California for packages with labels, whereas the shipments to New York
experienced the same number of drops. Following are the general observations based on the results.
For shipments with labels:
• Shipments from Michigan to California using the Next-Day option showed 15% higher number
of drops as compared with those to New York, and the shipments using the 2nd Day option
experienced over 52% more drops for the same comparison.
• For shipments without labels:
• Shipments from Michigan to New York using the Next-Day option experienced 25% more
drops as compared with those for California, whereas the shipments using the 2nd Day option
for California experienced 26% more drops as compared with those for New York.

Tables 2 and 3 show the number of impacts measured above 76 mm, the highest drop height recorded
during any one-way trip, and the 90th, 95th and 99th percentile drop heights for all five package sizes.
The term ‘90% occurrence’ means that 90% of all recorded drop heights were below this level.
Packages without any pictorial markings shipped using the Next-Day service from Michigan to New York,
for example, experienced 122 impacts with a drop height of 76 mm or higher for the six one-way trips.
This amounts to nearly 20 impacts per trip with a drop height higher than 76 mm (3 in.). The majority of
these impacts result from automated handling, conveying and sorting equipment used at major hubs. A
smaller majority of events, usually the most severe, are actual package drops during loading and
unloading of vehicles or air containers. The largest drop height recorded in this study was 1.10 m to a
package shipped with pictorial markings and labels between Michigan and California using the 2nd Day
service.
The drop heights reported in Tables 4 and 5 are based on averaging the results of six one-way trips each
between Michigan and California, and Michigan and New York. This format is often used as the basis for
lab-simulated drop tests where drop testing is performed in sequentially reducing drop height levels.9–12
Averaging the results of the one-way trips is done because the lab-simulated tests are intended to
represent a typical one-way trip, and not the absolute worst case as represented by the highest drop
height measured. Tables 4 and 5 show these averaged drop heights for packages shipped in the Next-
Day and 2nd Day shipping environment for DHL. The data show that all shipments without labels to New
York, regardless of the type of shipping method, experienced the highest drop heights. The Next-Day
shipments with warning labels to New York also experienced higher drop heights. The 2nd Day
shipments with labels to California experienced the highest drop height as compared with those to New
York.
Tables 6 and 7 categorize the impact orientations for all shipments. The results were similar to those
reported in the past studies.9–12 The high incidence of face drops suggests that these impacts are the
result of automated handling operations, not mishandled package drops. Shipments to California exhibit
a higher number of impacts experienced by the non-fl at orientations as seen in Table 6.
This paper provides data for the users to create test methods specific to the challenges of the
distribution environment and the expected level of protection needed (or level of severity that packages
get exposed to). Based on the previous studies, drop height levels of 99% occurrence (Tables 2 and 3)
are generally used for either very expensive products or when extremely low levels of damage are
desired. Other product types may select between 90 and 95% occurrence levels of drop heights based
on either the value or allowable (acceptable) damage. In addition, the majority of drops in this study for
this type of package size occurred on the face. It is therefore recommended to use the existing package
face orientations to conduct drops as opposed to a larger percentage of edge and corner drops based on
the data in Tables 6 and 7. The number of drops on the same package ranges from 6, 10 and 12 based
on current test methods of the American Society of Testing and Materials and International Safe Transit
Association.
CONCLUSIONS
The following conclusions were reached:
1. The drop height levels observed in the DHL Next-Day and 2nd Day delivery system for single-parcel
shipments is similar to those previously measured for competitors UPS and FedEx.
2. Single-parcel air shipments (Next-Day or 2nd Day) to destination cities without major airports will
observe more handling and number of drops, as compared with shipments to major cities.

3. Pictorial markings and warning labels like ‘Fragile’ and ‘Handle with Care’ do not improve the handling
of packages or result in lower drop levels in the DHL single-parcel environment.
4. The most common orientation of drops is ‘fl at’, followed by ‘edge’ and ‘corner’.
ACKNOWLEDGEMENTS
The authors would like to thank the Consortium of Distribution Packaging Research at Michigan State
University for funding this project.
REFERENCES
1. http://www.global-express.org/ [accessed 8th March 2007].
2. http://www.unishippers.com/update/dhl_reliability_leader.asp [accessed 8th March 2007].
3. http://www1.finanzberichte.dpwn.de/2005/ar/en/servicepages/welcome [accessed 8th March 2007].
4. Goff J. Development of Performance Standards for Parcel Post Packages. Michigan State University,
Project No. 3108, 1974.
5. Singh SP, Voss T. Drop heights encountered in the United Parcel Service Small Parcel Environment in
the United States. J. Test. Eval. 1992; 20(5): 382–387.
6. Singh SP, Cheema A. Measurement and analysis of the overnight small package shipping environment
for Federal Express and United Parcel Service. J. Test. Eval. 1996; 24(4): 205–211.
7. Singh SP, Burgess G, Hays Z. Measurement and analysis of the UPS ground shipping environment for
large and heavy packages. J. Test. Eval. 2001; 29: 11–17.
8. Newsham MD, Pierce S, Singh SP. Distribution, parcel labels pose challenges for drop orientation.
Packag. Technol. Sci. 1999; 8(4).

9. Singh P, Burgess G, Singh J. Measurement and analysis of the small and light weight parcel shipping
environment. J. Test. Eval. 2004; 32(5): 1–7.
10. Singh P, Burgess G, Singh J. Measurement and analysis of the second-day air small and light-weight
package shipping environment within Federal Express. Packag. Technol. Sci. 2004; 17: 119–127.
11. Singh P, Burgess G, Singh J, Kremer M. Measurement and analysis of the next-day air shipping
environment for mid-sized and lightweight packages for DHL, FedEx and United Parcel Service. Packag.
Technol. Sci. 2006; 19: 227–235.
12. Singh J*, Singh, SP, Burgess G, Saha K. Measurement, analysis and comparison of the parcel shipping
shock and drop environment of United States Postal Service with commercial carriers. J. Test. Eval. 2000;
35(4): 1–5.