Embed Size (px)
Citation preview
A STUDY OF THE EFFECTS OF EVERYDAY MATHEMATICS ON
STUDENT ACHIEVEMENT OF THIRD-, FOURTH-, AND
FIFTH-GRADE STUDENTS IN A LARGE NORTH
TEXAS URBAN SCHOOL DISTRICT
Robert D. Waite, B.A., Th.M.
Dissertation Prepared for the Degree of
DOCTOR OF EDUCATION
UNIVERSITY OF NORTH TEXAS
August 2000
Approved:
Hoyt Watson, Major ProfessorRichard Simms, Minor ProfessorGary Anderson, Committee MemberWilliam E. Camp, Program CoordinatorJohn C. Stansel, Chair of the Department of
Teacher Education and AdministrationM. Jean Keller, Dean of the College of
EducationC. Neal Tate, Dean of the Robert B. Toulouse
School of Graduate Studies
Waite, Robert D., A study of the effects of Everyday Mathematics on
student achievement of third-, fourth, and fifth-grade students in a large North
Texas Urban School District. Doctor of Education (Education
Administration), August 2000, 155 pp., 28 tables, 34 illustrations, references,
82 titles.
Data were examined in this study from student records in a large North
Texas urban school district who were taught with two different mathematics
curricula to determine whether or not they had different effects on student
achievement. One of the mathematics curricula, Everyday Mathematics, was
developed upon national mathematic standards, written by the National
Council of Teachers of Mathematics. The other mathematics curriculum was
district-approved, using a textbook from a large publisher, with a more
traditional approach.
The students selected for the experimental group came from six schools
that had implemented the Everyday Mathematics curriculum for the 1998-99
school year. An experimental group was formed from these students. Twelve
schools with similar socioeconomic ratios, ethnic makeup and 1998 Iowa Test
of Basic Skills mathematic score profiles were selected. A control group was
formed from this population of students that was similar to the experimental
group with the exception of having been taught using the district-approved
mathematics curriculum.
These two groups were very similar in socioeconomic, ethnic, gender,
and grade level makeup. Most importantly, the experimental group and control
group were almost identical (there was no statistically significant difference) in
their 1998 Iowa Test of Basic Skills mathematics scores, a gauge used to
demonstrate that prior mathematics ability was equal going into the 1998-99
school year.
In the statistical analysis, almost all comparisons showed that the
experimental group taught with the Everyday Mathematics curriculum had
higher scores on the 1999 Texas Assessment of Academic Skills mathematics
test. When compared to children with similar mathematics ability at the
beginning of the 1998-99 school year, the students in this study who were
taught using Everyday Mathematics showed greater achievement gains than
students in classes that used the district-approved curriculum.
ii
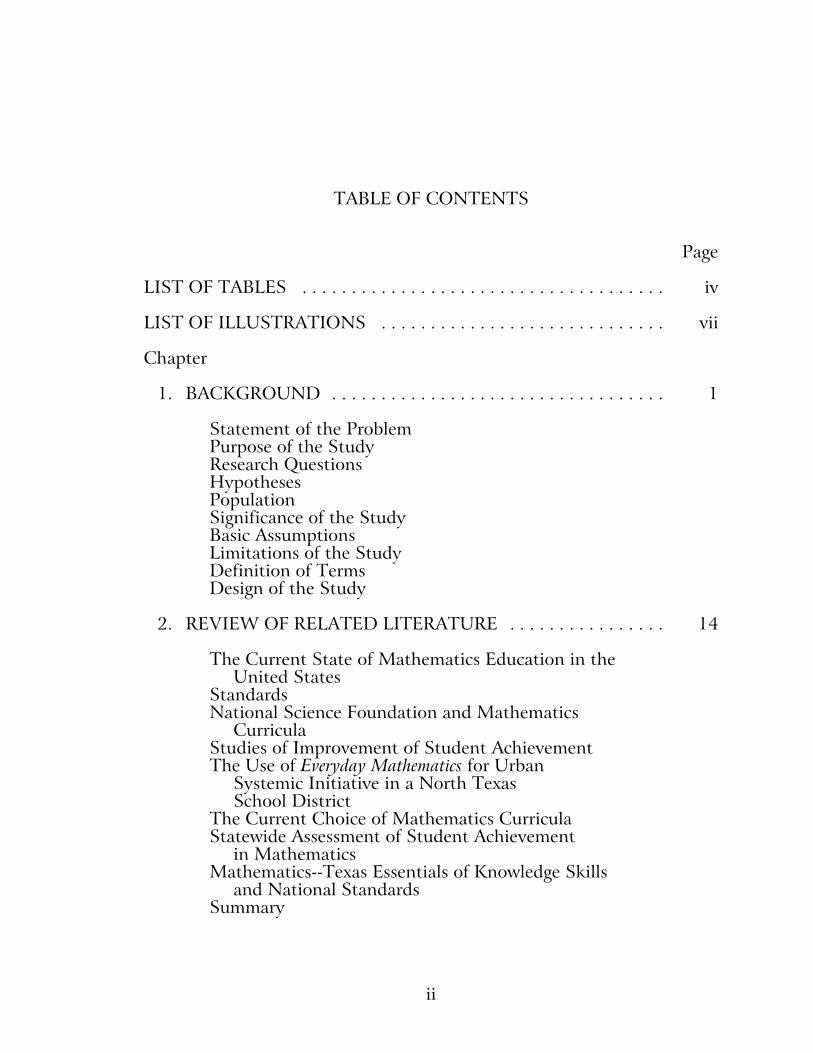
TABLE OF CONTENTS
Page
LIST OF TABLES . . . . . . . . . . . . . . . . . . . . . . . . . . . . . . . . . . . . . iv
LIST OF ILLUSTRATIONS . . . . . . . . . . . . . . . . . . . . . . . . . . . . . vii
Chapter
1. BACKGROUND . . . . . . . . . . . . . . . . . . . . . . . . . . . . . . . . . . 1
Statement of the ProblemPurpose of the StudyResearch QuestionsHypothesesPopulationSignificance of the StudyBasic AssumptionsLimitations of the StudyDefinition of TermsDesign of the Study
2. REVIEW OF RELATED LITERATURE . . . . . . . . . . . . . . . . 14
The Current State of Mathematics Education in the United StatesStandardsNational Science Foundation and Mathematics
CurriculaStudies of Improvement of Student AchievementThe Use of Everyday Mathematics for Urban
Systemic Initiative in a North TexasSchool District
The Current Choice of Mathematics CurriculaStatewide Assessment of Student Achievement
in MathematicsMathematics--Texas Essentials of Knowledge Skills
and National StandardsSummary
iii
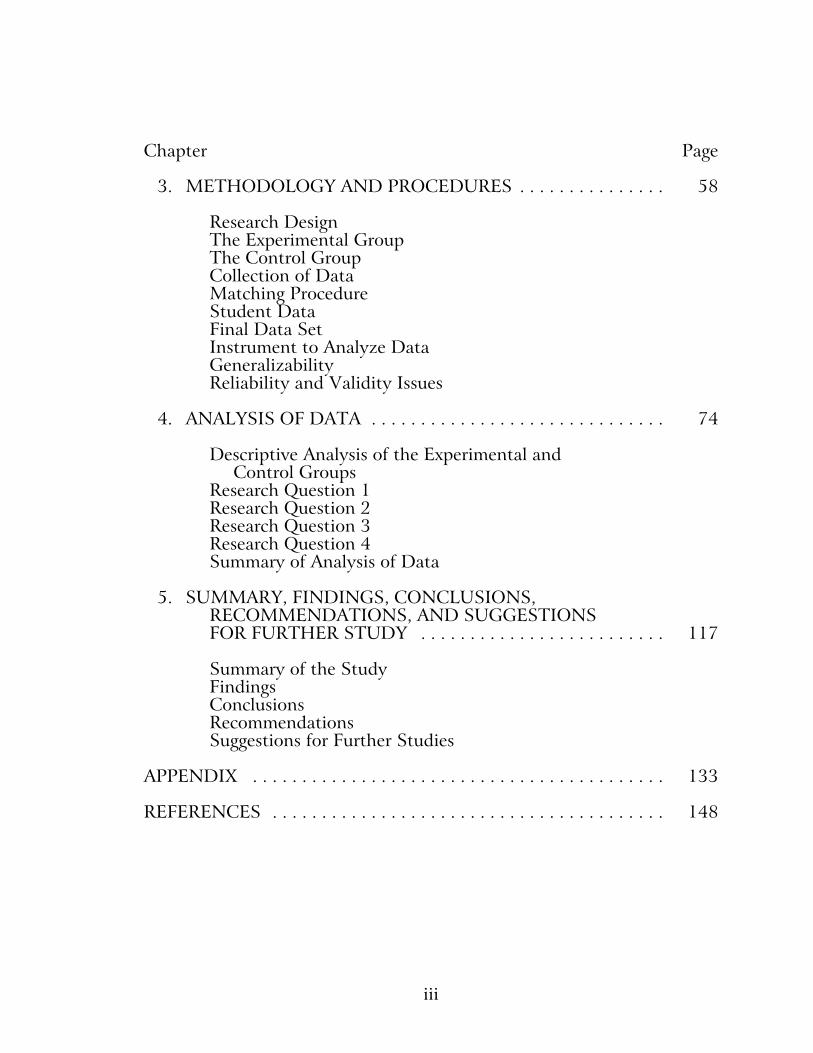
Chapter Page
3. METHODOLOGY AND PROCEDURES . . . . . . . . . . . . . . . 58
Research DesignThe Experimental GroupThe Control GroupCollection of DataMatching ProcedureStudent DataFinal Data SetInstrument to Analyze DataGeneralizabilityReliability and Validity Issues
4. ANALYSIS OF DATA . . . . . . . . . . . . . . . . . . . . . . . . . . . . . . 74
Descriptive Analysis of the Experimental andControl Groups
Research Question 1Research Question 2Research Question 3Research Question 4Summary of Analysis of Data
5. SUMMARY, FINDINGS, CONCLUSIONS, RECOMMENDATIONS, AND SUGGESTIONSFOR FURTHER STUDY . . . . . . . . . . . . . . . . . . . . . . . . . 117
Summary of the StudyFindingsConclusionsRecommendationsSuggestions for Further Studies
APPENDIX . . . . . . . . . . . . . . . . . . . . . . . . . . . . . . . . . . . . . . . . . . 133
REFERENCES . . . . . . . . . . . . . . . . . . . . . . . . . . . . . . . . . . . . . . . . 148
iv
LIST OF TABLES
Table Page
1. The Frequency and Percentage of the Experimentaland Control Groups . . . . . . . . . . . . . . . . . . . . . . . . . . . . . 76
2. The Number and Percentage Makeup of SocioeconomicStatus Among the Everyday Mathematics and Non-Everyday Mathematics Students . . . . . . . . . . . . . . . . . 78
3. The Frequency and Percentage of Gender in Each Group . . . . . . . . . . . . . . . . . . . . . . . . . . . . . . . . . . . . . . . . 80
4. The Frequency and Percentage of Students in Each GradeLevel in the Experimental and Control Groups . . . . . . . . 82
5. Descriptive Statistics of the 1998 Iowa Test of BasicSkills Mathematics Scores for Each Group . . . . . . . . . . . 84
6. Independent Samples Test t-Test for Equality of MeansBetween the 1998 Iowa Test of Basic Skills Mathematics Score for Everyday Mathematics andNon-Everyday Mathematics Students . . . . . . . . . . . . . . . . . 85
7. Group Statistics for the 1999 Texas Assessment of Academic Skills Mathematics Test . . . . . . . . . . . . . . . . . . 87
8. Independent Samples t-Test of 1999 Texas Assessment of Academic Skills Mathematic Scores of EverydayMathematics and Non-Everyday Mathematics Students . . . . 88
9. Group Statistics of Ethnic Designations of EverydayMathematics and Non-Everyday Mathematics Students . . . . 90
10. Results of t-Test of Scores of 1999 Texas Assessmentof Academic Skills Mathematics Test Broken Downby Ethnicity . . . . . . . . . . . . . . . . . . . . . . . . . . . . . . . . . . . 91
11. Group Statistics by Gender of Everyday Mathematics and Non-Everyday Mathematics Students' 1999 TexasAssessment of Academic Skills Mathematic Scores . . . . . 93
v
Table Page
12. Comparison of 1999 Texas Assessment of AcademicSkills Mathematic Scores by Gender . . . . . . . . . . . . . . . . 94
13. Groups Statistics of 1999 Texas Assessment of AcademicSkills Scores in Each Socioeconomic Designation . . . . . . 97
14. Results of t-Test Comparing Within SocioeconomicDesignations . . . . . . . . . . . . . . . . . . . . . . . . . . . . . . . . . . . 97
15. Descriptive Statistics of 1999 Texas Assessment of Academic Skills Mathematics Scores in EachGrade Level . . . . . . . . . . . . . . . . . . . . . . . . . . . . . . . . . . . 100
16. Results of t-Tests (Everyday Mathematics vs. Non-EverydayMathematics) 1999 Texas Assessment of AcademicSkills Mathematics Score by Grade Level . . . . . . . . . . . . 101
17. Descriptive Statistics of 1999 Texas Assessment of Academic Skills Mathematic Scores by Domain . . . . . . . . 104
18. Results of t-Tests Everyday Mathematics Versus Non-Everyday Mathematics of Domain Scores of1999 Texas Assessment of Academic Skills Mathematics Test . . . . . . . . . . . . . . . . . . . . . . . . . . . . . . . 104
19. Summary of the Difference in the Mean DomainScores on 1999 Texas Assessment of AcademicSkills Mathematics Test Between Everyday Mathematicsand Non-Everyday Mathematics Students . . . . . . . . . . . . . 106
20. Third-Grade Level Descriptive Statistics by TexasAssessment of Academic Skills MathematicsDomain . . . . . . . . . . . . . . . . . . . . . . . . . . . . . . . . . . . . . . 108
21. The t-Test Results (Everyday Mathematics vs. Non-EverydayMathematics) of Third Grade 1999 Texas Assessmentof Academic Skills Domain . . . . . . . . . . . . . . . . . . . . . . . 108
22. Fourth-Grade Level Descriptive Statistics by TexasAssessment of Academic Skills Mathematics Domain . . . 109
23. The t-Test Results (Everyday Mathematics vs. Non-EverydayMathematics) of Fourth Grade 1999 Texas Assessmentof Academic Skills Domains . . . . . . . . . . . . . . . . . . . . . . . 109
vi
Table Page
24. Fifth-Grade Level Descriptive Statistics by TexasAssessment of Academic Skills Mathematics Domain . . . 110
25. The t-Test Results (Everyday Mathematics vs. Non-EverydayMathematics) of Fifth Grade 1999 Texas Assessmentof Academic Skills Mathematics Domains . . . . . . . . . . . . 110
26. Model Summary . . . . . . . . . . . . . . . . . . . . . . . . . . . . . . . . . 112
27. F Value of the Regression Model . . . . . . . . . . . . . . . . . . . . . 113
28. B Values for the Predictor Variables . . . . . . . . . . . . . . . . . . . 114
vii
LIST OF ILLUSTRATIONS
Figure Page
1. Comparison of Ethnic Makeup by Percentage of the Experimental Group (Everyday Mathematics) andControl Group (Non-Everyday Mathematics) . . . . . . . . . . . 77
2. Comparison of Socioeconomic Makeup by Percentage ofthe Experimental Group (Everyday Mathematics) andthe Control Group (Non-Everyday Mathematics) . . . . . . . . 79
3. Comparison of Gender Makeup by Percentage of theExperimental (Everyday Mathematics) and the ControlGroup (Non-Everyday Mathematics) . . . . . . . . . . . . . . . . . 81
4. Comparison of Grade Level Makeup by Percentage ofthe Experimental Group (Everyday Mathematics) andthe Control Group (Non-Everyday Mathematics) . . . . . . . . 83
5. Comparison of the Mean 1998 Iowa Test of Basic SkillsMathematics Score (Prior Mathematics Ability) of theExperimental Group (Everyday Mathematics) and theControl Group (Non-Everyday Mathematics) . . . . . . . . . . . 84
6. Comparison of the Mean 1999 Texas Assessment of Academic Skills Mathematics Score (OutcomesMeasurement) of the Experimental Group (EverydayMathematics) and the Control Group (Non-EverydayMathematics) . . . . . . . . . . . . . . . . . . . . . . . . . . . . . . . . . . . 88
7. Comparison of 1999 Texas Assessment of AcademicSkills Mathematics Score Average of ExperimentalGroup (Everyday Mathematics) and the Control Group(Non-Everyday Mathematics) by Ethnicity . . . . . . . . . . . . . 92
8. Comparison of Mean 1999 Texas Assessment of AcademicSkills Mathematic Scores of the Experimental Group(Everyday Mathematics) and the Control Group (Non-Everyday Mathematics) Divided by Gender . . . . . . . 95
viii
Figure Page
9. Comparison of the Mean 1999 Texas Assessment of Academic Skills Mathematics Score Between All Female and All Male Students in This Study . . . . . . . . . . 96
10. Comparison of the Mean 1999 Texas Assessment ofAcademic Skills Mathematics Score of the ExperimentalGroup (Everyday Mathematics) and the Control Group(Non-Everyday Mathematics) Divided by SocioeconomicStatus . . . . . . . . . . . . . . . . . . . . . . . . . . . . . . . . . . . . . . . . 99
11. Comparison of the Mean 1999 Texas Assessment ofAcademic Skills Mathematics Score of the ExperimentalGroup (Everyday Mathematics) and the Control Group(Non-Everyday Mathematics) When Divided by GradeLevel . . . . . . . . . . . . . . . . . . . . . . . . . . . . . . . . . . . . . . . . . 102
12. Comparison of the Mean Scores on the 1999 TexasAssessment of Academic Skills Mathematics TestWhen Divided by Domain Between the ExperimentalGroup (Everyday Mathematics) and the Control Group(Non-Everyday Mathematics) . . . . . . . . . . . . . . . . . . . . . . . 107
13. 1999 Texas Assessment of Academic Skills Mathematicresults--All Everyday Mathematic Students . . . . . . . . . . . . . 137
14. 1999 Texas Assessment of Academic Skills Mathematicresults--All Non-Everyday Mathematic Students . . . . . . . . . 137
15. 1999 Texas Assessment of Academic Skills Mathematicresults--African-American Everyday Mathematic Students . . . . . . . . . . . . . . . . . . . . . . . . . . . . . . . . . . . . . . 138
16. 1999 Texas Assessment of Academic Skills Mathematicresults--African-American Non-Everyday Mathematic Students . . . . . . . . . . . . . . . . . . . . . . . . . . . . . . . . . . . . . . 138
17. 1999 Texas Assessment of Academic Skills Mathematicresults--Anglo Everyday Mathematic Students . . . . . . . . . . 139
18. 1999 Texas Assessment of Academic Skills Mathematicresults--Anglo Non-Everyday Mathematic Students . . . . . . 139
19. 1999 Texas Assessment of Academic Skills Mathematicresults--Hispanic Everyday Mathematic Students . . . . . . . . 140
ix
Figure Page
20. 1999 Texas Assessment of Academic Skills Mathematicresults--Hispanic Non-Everyday Mathematic Students . . . . 140
21. 1999 Texas Assessment of Academic Skills Mathematicresults--Third-Grade Everyday Mathematic Students . . . . . 141
22. 1999 Texas Assessment of Academic Skills Mathematicresults--Third-Grade Non-Everyday Mathematic Students . 141
23. 1999 Texas Assessment of Academic Skills Mathematicresults--Fourth-Grade Everyday Mathematic Students . . . . 142
24. 1999 Texas Assessment of Academic Skills Mathematicresults--Fourth-Grade Non-Everyday Mathematic Students . . . . . . . . . . . . . . . . . . . . . . . . . . . . . . . . . . . . . . 142
25. 1999 Texas Assessment of Academic Skills Mathematicresults--Fifth-Grade Everyday Mathematic Students . . . . . . 143
26. 1999 Texas Assessment of Academic Skills Mathematicresults--Fifth-Grade Non-Everyday Mathematic Students . . . . . . . . . . . . . . . . . . . . . . . . . . . . . . . . . . . . . . 143
27. 1999 Texas Assessment of Academic Skills Mathematicresults--Low Socioeconomic Everyday Mathematic Students . . . . . . . . . . . . . . . . . . . . . . . . . . . . . . . . . . . . . . 144
28. 1999 Texas Assessment of Academic Skills Mathematicresults--Low Socioeconomic Non-Everyday Mathematic Students . . . . . . . . . . . . . . . . . . . . . . . . . . . . . . . . . . . . . . 144
29. 1999 Texas Assessment of Academic Skills Mathematicresults--High Socioeconomic Everyday Mathematic Students . . . . . . . . . . . . . . . . . . . . . . . . . . . . . . . . . . . . . . 145
30. 1999 Texas Assessment of Academic Skills Mathematicresults--High Socioeconomic Non-Everyday Mathematic Students . . . . . . . . . . . . . . . . . . . . . . . . . . . . . 145
31. 1999 Texas Assessment of Academic Skills Mathematicresults--Male Everyday Mathematic Students . . . . . . . . . . . 146
32. 1999 Texas Assessment of Academic Skills Mathematicresults--Male Non-Everyday Mathematic Students . . . . . . . 146
x
Figure Page
33. 1999 Texas Assessment of Academic Skills Mathematicresults--Female Everyday Mathematic Students . . . . . . . . . 147
34. 1999 Texas Assessment of Academic Skills Mathematicresults--Female Non-Everyday Mathematic Students . . . . . 147
1
CHAPTER 1
BACKGROUND
In 1983 the National Commission on Excellence in Education published
a report titled, A Nation at Risk. This document has been cited by many
(Brandt, 2000; Finn, 1989; Ravitch, 1995, National Science Foundation,
1988; National Council of Teachers of Mathematics [NCTM], 1989a) as
being the catalyst for the current reform movement in education. In this report
educators were called upon to strengthen the educational system.
Our Nation is at risk. Our once unchallenged preeminence incommerce, industry, science, and technological innovation is beingovertaken by competitors throughout the world. This report isconcerned with only one of the many causes and dimensions of theproblem, but it is the one that undergirds American prosperity, security,and civility. We report to the American people that while we can takejustifiable pride in what our schools and colleges have historicallyaccomplished and contributed to the United States and the well-beingof its people, the educational foundations of our society are presentlybeing eroded by a rising tide of mediocrity that threatens our veryfuture as a Nation and a people. What was unimaginable a generationago has begun to occur with others matching and surpassing oureducational attainments.
If an unfriendly foreign power had attempted to imposeon America the mediocre educational performance that existstoday, we might well have viewed it as an act of war. As it stands,we have allowed this to happen to ourselves. We have evensquandered the gains in student achievement made in the wake ofthe Sputnik challenge. Moreover, we have dismantled essentialsupport systems which helped make those gains possible. Wehave, in effect, been committing an act of unthinking, unilateraleducational disarmament (National Commission on Excellence inEducation, 1983, p. 5).
2
Following this report, many national organizations began to develop
national standards for education and national organizations of teachers began
to write standards for their respective subject areas. The NCTM was one of the
organizations that participated in this process. Many of these standards were a
direct response to the recommendations found in A Nation at Risk. The
National Commission on Excellence in Education (1983) recommended that
the teaching of mathematics in high school should equip graduates to: (a)understand geometric and algebraic concepts; (b) understandelementary probability and statistics; (c) apply mathematics in everydaysituations; and (d) estimate, approximate, measure, and test theaccuracy of their calculations. In addition to the traditional sequence ofstudies available for college-bound students, new, equally demandingmathematics curricula need to be developed for those who do not planto continue their formal education immediately. (p. 32)
The response of the NCTM was the development of national standards
in mathematics education that implemented these and other
recommendations. The Curriculum and Evaluation Standards for School
Mathematics (NCTM, 1989a), one of the national standards mathematics
documents, began by stating that, "these standards are one facet of the
mathematics education community's response to the call for reform in the
teaching and learning of mathematics. They reflect, and are an extension of,
the community's response to those demands for change" (p. 1).
These national standards in education were not an end in themselves. In
order to impact the achievement of students, these standards needed to be
applied to the development of curricula and classroom practices. Many projects
were proposed to develop curricula that would apply national standards to the
3
classroom. These projects resulted in curricula packages that are marketed to
schools.
Along with the reform efforts of national teacher organizations, the
federal government is also involved in the current reform movement. In 1950,
the United States Congress formed an organization called the National Science
Foundation in order to combat the apparent deficits in the science and
mathematics preparedness of children to meet future needs of the nation.
Although the early programs of the National Science Foundation focused on
research projects, the emphasis changed in the 1990s to promote high-quality
education in the areas of mathematics and science. As a part of that effort, the
National Science Foundation began the Urban Systemic Initiative, a grant
program. These grants allow large city school districts to improve education
with new curricula, additional teacher training, and increased classroom
resources. These two efforts, the government's financial support of reform
efforts through Urban Systemic Initiative grants and the development of
curricula based on established national standards, have come together in
school districts where national grant money is being used to purchase material
and train teachers in curricula that meet national standards.
Through the application process, the Urban Systemic Initiative gave a
large North Texas urban school district over 1 million dollars annually for 5
years. In 1996, as a part of this grant, the North Texas urban school district
began piloting the use of a new mathematics curriculum, Everyday Mathematics,
a project of the University of Chicago. By the summer of 1999 seventeen
4
schools in the district had faculty members trained in the use of Everyday
Mathematics. This study has attempted to quantify the effectiveness of the
Everyday Mathematics program on student achievement in this school district.
Statement of the Problem
The problem of this study was to determine whether or not the
implementation of a standards-based curriculum could be used to predict a
difference in student achievement. This study sought to determine the
effectiveness of Everyday Mathematics curriculum in improving the mathematics
achievement of students in a large urban school district.
Purpose of the Study
This study had a fourfold purpose. One purpose of the study is to
determine whether Everyday Mathematics is more effective in improving student
achievement than the approved curriculum that was being taught in this urban
school district. This study was an attempt to provide those concerned with
educating elementary school children with information about effective
methods and programs for teaching mathematics. The study also provides a
comparison of two types of mathematics curricula; one based on standards and
a more traditional type. This should provide some information concerning the
relationship between student achievement and the application of national
standards to classroom material and practices.
5
Research Questions
The following questions have guided this study:
1. Are there significant differences between the mathematics scores on
the Texas Assessment of Academic Skills of students who have been taught
using the Everyday Mathematics curriculum and those of students taught using
the approved curriculum in this North Texas urban school district?
2. Are there significant differences in the mathematics scores on the
Texas Assessment of Academic Skills mathematics test when groups (Everyday
Mathematics students versus non-Everyday Mathematics students) are looked at
with regard to ethnicity, gender, socioeconomic status, and grade level?
3. Are there significant differences between the mathematics scores in
each domain (concepts, operations, and problem-solving) of the Texas
Assessment of Academic Skills mathematics test of students who have been
taught using the Everyday Mathematics curriculum and those of students taught
using the approved curriculum in this North Texas urban school district?
4. What are the relationships between gender, ethnicity, prior
achievement, socioeconomic status, and the curriculum used and the Texas
Assessment of Academic Skills mathematic scores of third-, fourth-, and fifth-
grade students in this large north Texas urban school district?
6
Hypotheses
1. It is hypothesized that there is no significant difference in the Texas
Assessment of Academic Skills mathematics score of students taught using
Everyday Mathematics and the Texas Assessment of Academic Skills
mathematics score of students taught using the district-approved curriculum
(assuming the null hypothesis for analysis purpose).
2. It is further hypothesized that there is no significant difference
between the Texas Assessment of Academic Skills mathematic scores of those
taught with Everyday Mathematics and those students taught using the
district-approved mathematics curriculum (non-Everyday Mathematics) when
groups are broken down by ethnicity, gender, socioeconomic status and grade
level (null hypothesis).
3. It is further hypothesized that there is no significant difference
between the scores in the three separate domains of the Texas Assessment of
Academic Skills mathematics test (concepts, operations, and problem-solving)
of the students taught using Everyday Mathematics and the students who were
taught using the district-approved curriculum (null hypothesis).
4. It is further hypothesized that Everyday Mathematics, in combination
with ethnicity, socioeconomic status, gender, and grade level will not
contribute significantly to the mathematics achievement of students (null
hypothesis).
7
Population
The population for this study was all third-, fourth-, and fifth-grade
students in a North Texas urban school district. This district has chosen to use
the Everyday Mathematics curriculum with students in kindergarten through the
fifth grade. Although Everyday Mathematics was written for sixth graders, the
district decided to use another Standards-based curriculum, Connected Math, in
the sixth through eighth grades. An application and selection process was
necessary for campuses to participate in a pilot project in the use of Everyday
Mathematics. Some elementary schools were approved to use this
Standards-based curriculum and other schools used the district-approved
mathematics curriculum. The outcomes measurement, the mathematics score
on the Texas Assessment of Academic Skills test, is administered to students in
Texas beginning in the third grade.
Significance of the Study
Every educator has some concern about student achievement. The
successes of curricula are measured by the improvement of student
achievement, or lack thereof, of those taught with them. Although the state of
Texas went through a mathematics textbook adoption process in the 1998-99
school year, it is important to have full information about the relationship
between a curriculum and the achievement of students who are taught using it.
This study should provide information to those who are involved in choosing
curricula that can aid in those decisions. This North Texas urban school
8
district received money from the Urban Systemic Initiative grant for the
improvement of science and mathematics education of children. Part of this
effort has been through the use of the Everyday Mathematics curriculum. One
significance of this study was to provide the Urban Systemic Initiative
department with information concerning the effectiveness of the expenditure
of its money. This study has analyzed some of the factors, including this
curriculum, which may affect student achievement as measured by the TAAS
scores. This study will provide decision makers with information for use in
choosing mathematics programs for elementary school students. This may
provide information on the effectiveness of Everyday Mathematics for various
subpopulations.
Basic Assumptions
The assumptions of this study include the following:
1. Prior mathematics achievement of students can be measured by the
Iowa Test of Basic Skills mathematics total score.
2. The school district database contains accurate information.
3. All classrooms spend about the same amount of time in mathematics
instruction.
4. The Texas Assessment of Academic Skills is an effective measure of
student achievement.
9
5. The school principal accurately reported the mathematics curriculum
used in his or her school.
Limitations of the Study
Limitations of this study include the following:
1. It was limited to one school district in North Texas.
2. It was limited to third-, fourth-, and fifth-grade students.
3. The schools that implemented the Everyday Mathematics curriculum chose
to do so themselves, making this a self-selected study.
4. This study cannot account for the quality of the teacher, which could
have affected the academic gains of the students.
5. The investigator did not monitor any classrooms and relied on teacher
surveys to determine the full implementation of Everyday Mathematics.
Definition of Terms
Everyday Mathematics curriculum--a complete curriculum developed by
the University of Chicago for kindergarten through sixth-grade mathematics
that includes student material, teacher material, and resource kits.
Approved district mathematics curriculum--this is the curriculum that is
presented in the district Curriculum Management System that uses the
Mathematics in Action (Hoffer et al., 1992) textbook as the foundation.
10
Low socioeconomic status--a status describing a student who qualifies to
participate in the federal free or reduced-price lunch program.
Ethnicity--a student’s racial designation as chosen on enrollment forms
and entered into the district database.
Prior mathematics ability level--this is a measurement of the student's
mathematics ability taken at the end of the 1997-98 school year using the
Iowa Test of Basic Skills, mathematics total score.
Design of the Study
This project is an ex post facto study, involving data from the 1998-99
school year. Students were in schools in a large North Texas urban school
district and had to attend the same school for the entire year. The measure of
achievement was the April 1999 Texas Assessment of Academic Skills,
mathematics scores.
Experimental Group
This group was composed of all students in one large North Texas urban
school district who had been in the same school and in a math class in which
the Everyday Mathematics curriculum was fully implemented for the 1998-99
school year. The following were the criteria for the students:
1. They were enrolled in a third-, fourth-, or fifth-grade class.
2. They had an Iowa Test of Basic Skills mathematics score for 1998.
11
3. They attended a classroom in which the teacher was identified as one
who had received the training and had implemented the Everyday Mathematics
curriculum for the 1998-99 school year.
4. They attended the same school for the entire 1998-99 school year.
5. They had a Texas Assessment of Academic Skills score in
mathematics for the 1998-99 school year.
6. They had complete school district data for the 1998-99 school year.
Control Group
This group was composed of students attending the same large North
Texas urban school district as the experimental group. These students attended
a school and were in classrooms where Everyday Mathematics was not used
during the 1998-99 school year. The schools for the control group were
matched to the schools in the experimental group by ethnicity, socioeconomic
status, and prior mathematics ability, according to the 1998-99 Public
Education Information Management System data. Two control schools were
selected for each experimental school to assure a broader sample. The following
were the criteria for the students in this study:
1. They were enrolled in a third-, fourth-, or fifth-grade class.
2. They had an Iowa Test of Basic Skills mathematics score for 1998.
3. They attended a school that used the approved mathematics
curriculum for the 1998-99 school year.
12
4. They attended the same school for the entire 1998-99 school year.
5. They had a Texas Assessment of Academic Skills score in
mathematics for the 1998-99 school year.
6. They had complete school district data for the 1998-99 school year.
Data-Collection Process
Seventeen schools in this large North Texas urban school district were
identified as having teachers who had been trained in the use of the Everyday
Mathematics curriculum. The principals of these schools were contacted to
identify the use of the curriculum and to obtain permission to survey teachers
and examine teachers' lesson plans and class rolls. Teachers who qualified as
having implemented the Everyday Mathematics identified the class sections
taught. These class rolls were obtained, and student identification numbers
were placed in a database.
Following the compilation of the experimental group's student
identification numbers, the data were submitted to the district research and
evaluation department. This department provided data on the identified
students from the district database.
After evaluation of the experimental group student data for ethnic
breakdown, socioeconomic status breakdown, and prior mathematics ability,
control group schools were selected. The research and evaluation department
13
of the school district provided data on the students who met the criteria for
this study.
The data were analyzed to determine whether there was any difference
between the academic achievement through the 1998-99 school year of
students who were taught using Everyday Mathematics and the academic
achievement through the 1998-99 school year of students who were taught
using the district-approved mathematics curriculum. This formed the study to
determine whether Everyday Mathematics had an effect on student achievement
in a large North Texas urban school district.
14
CHAPTER 2
REVIEW OF RELATED LITERATURE
The Current State of MathematicsEducation in the United States
Styles, types, and contents of curricula appear to move in a usually
circular current. In language arts the movement tends to go from a component
approach to a holistic approach and back. There will be some different nuances
or components or activities, but it tends clearly to be circular. Similarly, in
mathematics, although not as pronounced, some similar circular movement
exists. On one side of the circle is the algorithmic, separate component
approach to mathematics. On the other side is the more holistic, practical,
problem-solving approach. This has created some clear choices in curricula and
division among those with an interest in the education of children.
Traditional and Nontraditional Curricula
Mathematics curricula are divided between the traditional type and the
less traditional type. The traditional mathematics curriculum can be
characterized as systematic and based on explanation of an algorithm, the
practice of problems that demonstrate the concept, and the repetition of
problems extended to homework to master the topic. A set of skills is taught at
each grade level that should build on each other. For example, addition of
single digit numbers is taught in the first grade. In the second grade, two-digit
15
number addition is taught. In the third grade, addition of three numbers and
multiple digit numbers makes up the content of the teaching. Problems for
practice and homework are predetermined in traditional mathematics
curricula, and correct answers are important (Heid, 1997; Schoen, Fey, Hirsch,
& Coxford, 1999). The phrase “drill and practice” is often used in traditional
mathematics curricula.
In the current mathematics curriculum published by McGraw-Hill
Publishing Company, Math in My World, the chapter subjects are as follows:
Chapter 1--Addition and SubtractionChapter 2--Place Value and Number SenseChapter 3--Addition of two Digit Numbers and MoneyChapter 4--SubtractionChapter 5--Time, Data, and GraphsChapter 6--Understanding MultiplicationChapter 7--Multiplication FactsChapter 8--DivisionChapter 9--MeasurementChapter 10--GeometryChapter 11--Exploring Fractions and DecimalsChapter 12--Patterns and Predictions. (Clements, Jones, Moseley, &
Schulman, 1999, p. ii)
Each of these chapters has multiple lessons. They all begin with some
explanation of a singular concept, followed by guided practice and independent
practice. Each chapter has a chapter review and projects or activities for
extensions. However, the emphasis of each chapter is on one central topic,
with one or two secondary concepts, such as money in chapter 3 (Clements et
al., 1999).
Similarly, Silver-Burdett-Ginn Publishing Company, which combined
with Scott-Foresman Publisher to provide curriculum or textbook packages for
16
schools, provides a traditional approach to mathematics. With the addition of
teaching specific lessons on time, it is very similar to the Clements et al.
(1999) textbook. While the activities are designed to be diverse and interesting
to students, the cycle of introducing a concept, teaching the algorithm, guided
practice, independent practice, and testing are present in all of the chapters of
the Fennell et al. (1999) Mathematics textbook.
The current Web page for the Mathematics textbook made these points
about the curriculum:
Lessons are written and illustrated to appeal to students at eachgrade level.
A unique lesson helps students learn to read for understanding byfocussing on the information provided and the math skill required tosolve problems.
Lessons help students develop the concepts and learn the skillsnecessary for success in the classroom, on standardized and state tests,and in the real world.
Plenty of practice provided by follow-up exercises andproblem-solving opportunities encourages mastery of skills.
Problem-solving analysis, strategies, and applications are taughtin the context of the students' experience and interests.
A thematic approach is used throughout this K-6 program toteach concepts and sequenced skills as it reveals the connection betweenmathematics, other disciplines, and students' own experiences.(Silver-Burdett-Ginn School Products, 1999, pp. 1-2)
These use the watchwords and phrases that are popular in education
today. Phrases such as, "read for understanding," "problem-solving," and
"student's own experience" are used commonly in educational literature. By
referring to "standardized and state tests," the literature concerning this
curriculum hints that it is aligned with standards or state benchmarks.
However, as reviewers of mathematics curriculum have observed, the standards
17
are correlated to the curriculum, rather than the curriculum being created from
the standards (Colvin, 1999).
Similarly, the more traditional middle school curricula present
mathematics by topics or concepts and follow the cycle of introduction,
teaching the algorithm, having guided practice and independent practice,
assigning homework that includes numerical and word problems, and giving a
test at the end. A single textbook is issued for each grade level. In contrast, the
Connected Mathematics curriculum, a Standards-based project for sixth, seventh,
and eighth grades, does not have a textbook; rather, it has eight or nine
workbooks for each grade level (Lappan, Fey, Fitzgerald, Friel, & Phillips,
1998).
In an article titled “The Mathematical Miseducation of America’s
Youth,” Baptista (1999) asked, “Would parents accept medical treatment for
their child that was 10 to 15 years out of date?” (p. 426). That is how he
typifies a traditional mathematics curriculum. He further described traditional
mathematics as "an endless sequence of memorizing and forgetting facts and
procedures that make little sense to them" (Baptista, 1999, p. 426). Another
author characterized traditional mathematic courses as “elitist, abstract, too
focused on error-free calculation and obsessed with mind-numbing repetition”
(Colvin, 1999, p. 26).
The less traditional or nontraditional curricula that have emerged in
recent years are usually based upon or connected to the National Council of
Mathematics Teachers (NCTM, 1989a) Standards. Three curricula have been
18
identified as having been created from the Standards for elementary school
settings: Everyday Mathematics, a project of the University of Chicago;
Investigations in Number, Data and Space, (Technical Education and Research
Center, 1996); and Math Trailblazers (Bieler & Kelso, 1996), a project of the
University of Illinois. These mathematic programs stress real-world problems
and situations. Students are encouraged to develop and explain algorithms to
solve the problem with teachers acting as guides, introducing new ideas, and
allowing the students to assimilate these in solutions to problems. In the
nontraditional type of mathematics curricula, students are encouraged to work
in groups, reporting solutions to each other and analyzing one another’s
attempts. Many nontraditional mathematics curricula use journals and
encourage writing. The use of calculators is acceptable and even is promoted in
some programs (Colvin, 1999; Heid, 1997).
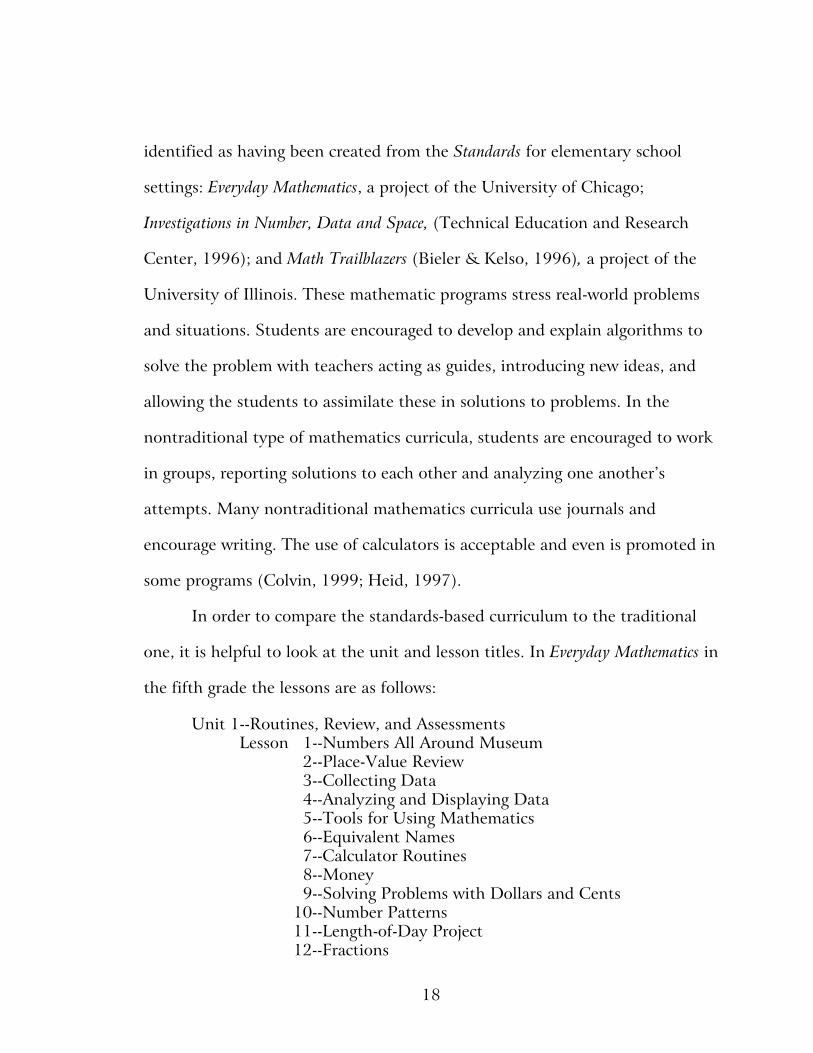
In order to compare the standards-based curriculum to the traditional
one, it is helpful to look at the unit and lesson titles. In Everyday Mathematics in
the fifth grade the lessons are as follows:
Unit 1--Routines, Review, and AssessmentsLesson 1--Numbers All Around Museum
2--Place-Value Review 3--Collecting Data 4--Analyzing and Displaying Data 5--Tools for Using Mathematics 6--Equivalent Names 7--Calculator Routines 8--Money 9--Solving Problems with Dollars and Cents10--Number Patterns11--Length-of-Day Project12--Fractions
19
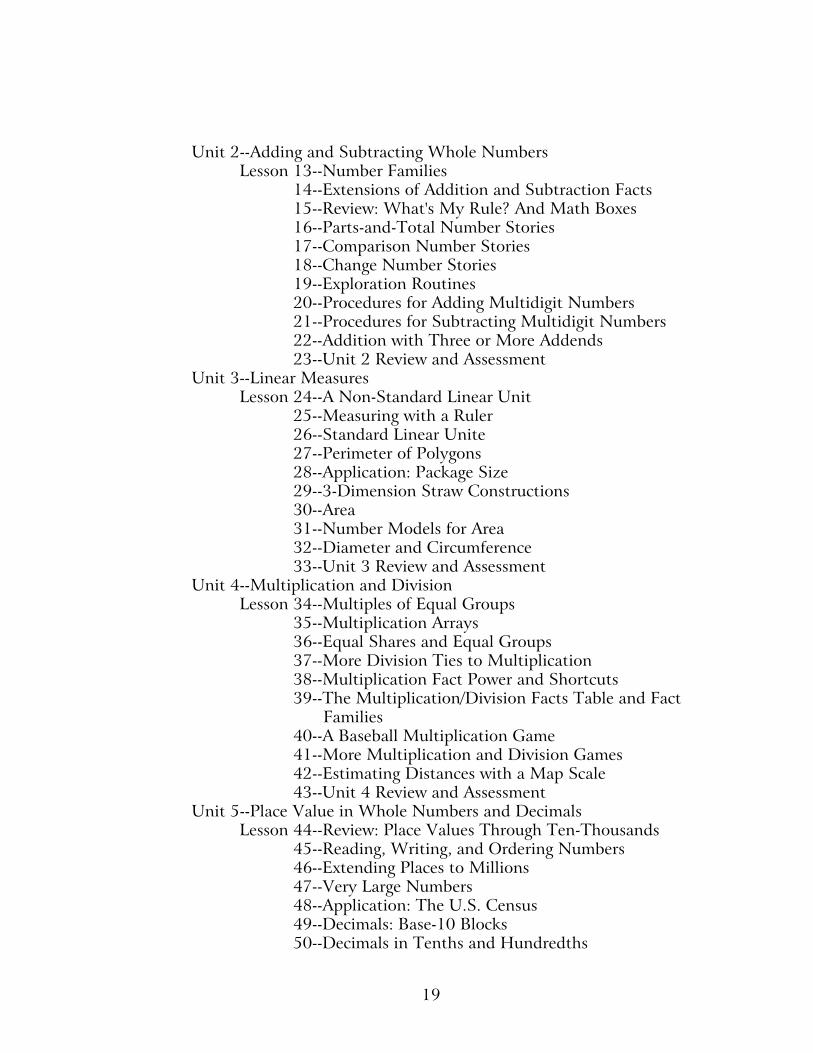
Unit 2--Adding and Subtracting Whole NumbersLesson 13--Number Families
14--Extensions of Addition and Subtraction Facts15--Review: What's My Rule? And Math Boxes16--Parts-and-Total Number Stories17--Comparison Number Stories18--Change Number Stories19--Exploration Routines20--Procedures for Adding Multidigit Numbers21--Procedures for Subtracting Multidigit Numbers22--Addition with Three or More Addends23--Unit 2 Review and Assessment
Unit 3--Linear MeasuresLesson 24--A Non-Standard Linear Unit
25--Measuring with a Ruler26--Standard Linear Unite27--Perimeter of Polygons28--Application: Package Size29--3-Dimension Straw Constructions30--Area31--Number Models for Area32--Diameter and Circumference33--Unit 3 Review and Assessment
Unit 4--Multiplication and DivisionLesson 34--Multiples of Equal Groups
35--Multiplication Arrays36--Equal Shares and Equal Groups37--More Division Ties to Multiplication38--Multiplication Fact Power and Shortcuts39--The Multiplication/Division Facts Table and Fact
Families40--A Baseball Multiplication Game41--More Multiplication and Division Games42--Estimating Distances with a Map Scale43--Unit 4 Review and Assessment
Unit 5--Place Value in Whole Numbers and DecimalsLesson 44--Review: Place Values Through Ten-Thousands
45--Reading, Writing, and Ordering Numbers46--Extending Places to Millions47--Very Large Numbers48--Application: The U.S. Census49--Decimals: Base-10 Blocks50--Decimals in Tenths and Hundredths
20
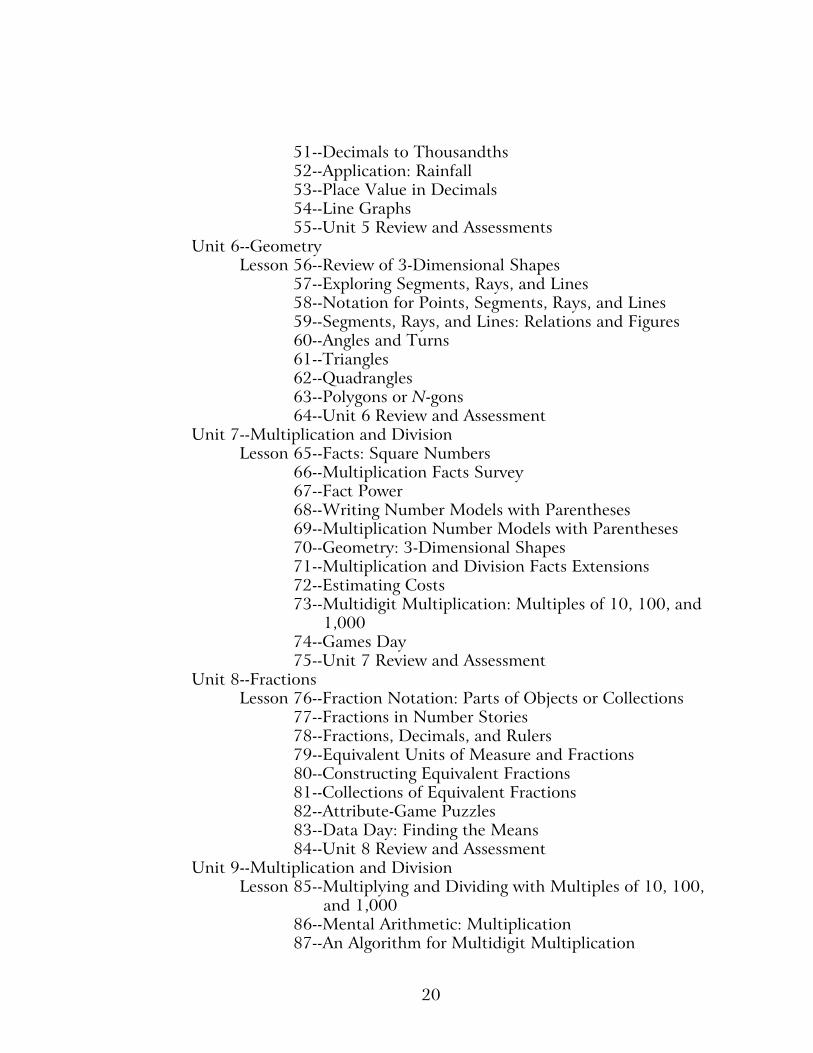
51--Decimals to Thousandths52--Application: Rainfall53--Place Value in Decimals54--Line Graphs55--Unit 5 Review and Assessments
Unit 6--GeometryLesson 56--Review of 3-Dimensional Shapes
57--Exploring Segments, Rays, and Lines58--Notation for Points, Segments, Rays, and Lines59--Segments, Rays, and Lines: Relations and Figures60--Angles and Turns61--Triangles62--Quadrangles63--Polygons or N-gons64--Unit 6 Review and Assessment
Unit 7--Multiplication and DivisionLesson 65--Facts: Square Numbers
66--Multiplication Facts Survey67--Fact Power68--Writing Number Models with Parentheses69--Multiplication Number Models with Parentheses70--Geometry: 3-Dimensional Shapes71--Multiplication and Division Facts Extensions72--Estimating Costs73--Multidigit Multiplication: Multiples of 10, 100, and
1,00074--Games Day75--Unit 7 Review and Assessment
Unit 8--FractionsLesson 76--Fraction Notation: Parts of Objects or Collections
77--Fractions in Number Stories78--Fractions, Decimals, and Rulers79--Equivalent Units of Measure and Fractions80--Constructing Equivalent Fractions81--Collections of Equivalent Fractions82--Attribute-Game Puzzles83--Data Day: Finding the Means84--Unit 8 Review and Assessment
Unit 9--Multiplication and DivisionLesson 85--Multiplying and Dividing with Multiples of 10, 100,
and 1,00086--Mental Arithmetic: Multiplication87--An Algorithm for Multidigit Multiplication
21
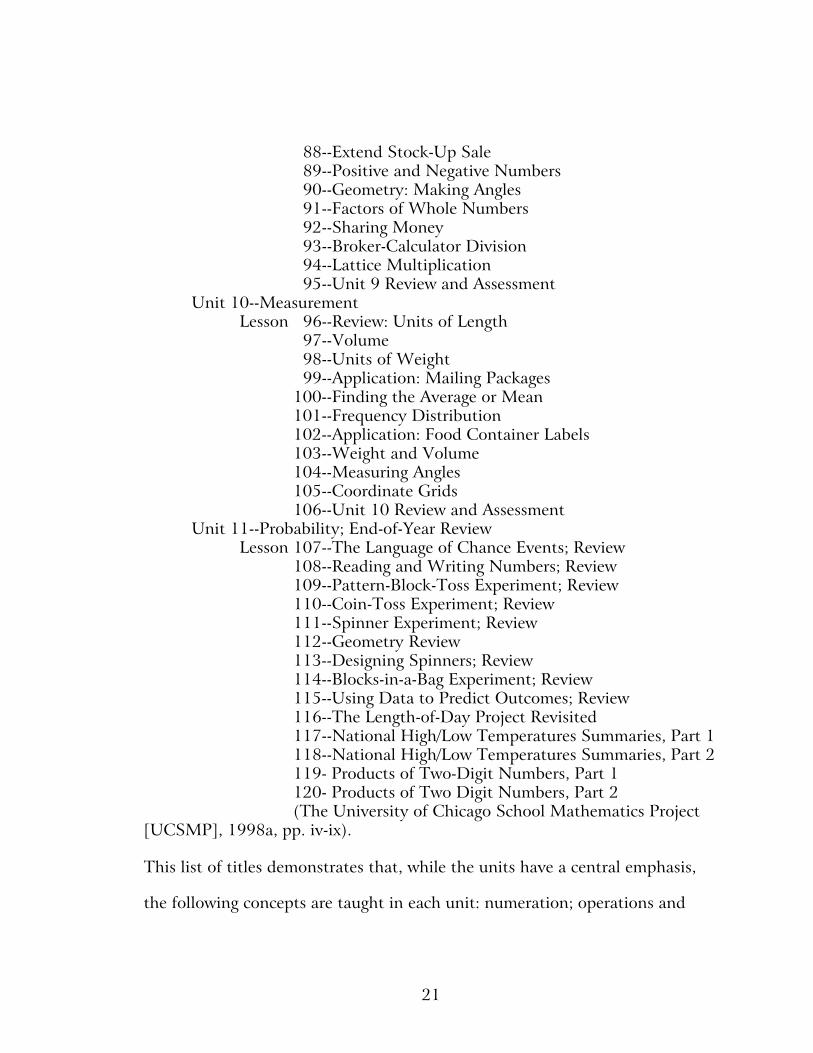
88--Extend Stock-Up Sale 89--Positive and Negative Numbers 90--Geometry: Making Angles 91--Factors of Whole Numbers 92--Sharing Money 93--Broker-Calculator Division 94--Lattice Multiplication 95--Unit 9 Review and Assessment
Unit 10--MeasurementLesson 96--Review: Units of Length
97--Volume 98--Units of Weight 99--Application: Mailing Packages100--Finding the Average or Mean101--Frequency Distribution102--Application: Food Container Labels103--Weight and Volume104--Measuring Angles105--Coordinate Grids106--Unit 10 Review and Assessment
Unit 11--Probability; End-of-Year ReviewLesson 107--The Language of Chance Events; Review
108--Reading and Writing Numbers; Review109--Pattern-Block-Toss Experiment; Review110--Coin-Toss Experiment; Review111--Spinner Experiment; Review112--Geometry Review113--Designing Spinners; Review114--Blocks-in-a-Bag Experiment; Review115--Using Data to Predict Outcomes; Review116--The Length-of-Day Project Revisited117--National High/Low Temperatures Summaries, Part 1118--National High/Low Temperatures Summaries, Part 2119- Products of Two-Digit Numbers, Part 1120- Products of Two Digit Numbers, Part 2(The University of Chicago School Mathematics Project
[UCSMP], 1998a, pp. iv-ix).
This list of titles demonstrates that, while the units have a central emphasis,
the following concepts are taught in each unit: numeration; operations and
22
relations; problem-solving and mental arithmetic; data collection and analysis;
geometry; measure and reference frames; and patterns, rules, and functions.
Another significant difference in traditional and Standards-based
curricula is the pedagogy. "In many traditional classrooms, learning is
conceived of as a process in which students passively absorb information,
storing it in easily retrievable fragments as a result of repeated practice and
reinforcement" (Resnick, 1987, p. 31). Whereas the traditional curricula
suggest that teachers use a variety of teaching strategies, the Standards-based
curricula are designed to implement the principles found in the Standards
documents.
Instruction should vary and include opportunities for appropriateproject work, group and individual assignments, discussion betweenteacher and students and among students, practice on mathematicalmethods, and exposition by the teacher. Our ideas about problemsituations and learning are reflected in the verbs we use to describestudent actions (e.g., to investigate, to formulate, to find, to verify)throughout the Standards. (NCTM, 1989a, p. 10)
Another difference between traditional curricula and Standards-based
curricula is their concepts of homework. The teacher's edition of the current
Fennell et al. (1999) mathematics textbook stated that "homework is an
opportunity for the student to master the concept present in the classroom"
(p. xi). Homework in the traditional textbook contains both number problems
and word problems on which the student works, away from the classroom or
teacher.
In contrast, Standards do not address homework as a mastery
opportunity. Instead, it suggests that the child be enriched by a variety of
23
experiences to practice problem solving. It also encourages the strengthening of
home and school connections. Activities that a student takes home should
involve the participation of family members. The Everyday Mathematics
homework falls into the category of "home and school partnership" (UCSMP,
1998b).
Optimal learning occurs if it is shared by the child, teacher, and familymembers. In Grades 1-3, daily Home Links provide activities in whichmembers of a family can participate in a child's mathematicsexperiences. In Grades 4-6, most lessons have Study Links that providefollow-up and review. Many Study Links should be taken home. At theteacher's discretion, other Study Link activities might be done withpartners or alone during study or game time in school. (UCSMP, 1998c,p. xiii)
The contrasts between traditional and nontraditional mathematics
curricula can be seen in these major areas. Both the content and the
arrangement of content differ in these programs. The methods used in the
classroom distinguish these two types of curricula. Lastly, the philosophy and
practice of homework set apart traditional and Standards-based curricula.
Criticism of Standards-based Curricula
Critics of nontraditional mathematic programs often point out the failed
“new math” programs of the 1960s. Many parent groups express that they
want and expect their children to come home with practice homework from a
textbook or worksheet. Others criticize the nontraditional curricula because it
may leave a student who cannot solve a problem without an algorithm
important for understanding further mathematics. One perspective is that
traditional mathematic curricula start with a concept and expect the child to
24
make applications whereas nontraditional mathematic curricula start with an
application or situation and expect the child to discover the concept (Civil,
1995; Colvin, 1999).
In an online article Clopton, Clopton, McKeown, and McKeown (1998)
reviewed several mathematics curricula. They write the following regarding
Everyday Mathematics:
The (poor) result appears to be related to the overall programphilosophy which chooses to emphasize ideas and calculators and evenmental arithmetic but de-emphasizes matters that require extensivepractice and the use of algorithms. Multiplication, which is in the earlystages in grade 2, is covered well given that the expectations are mostlyconceptual and not intending to lead to mastery (or even close to it) atthis level. Despite good coverage of some topics, it may be difficult toidentify a situation where the use of this program is very appropriate. Ifexpectations are high, then the program seems to be inappropriate dueto the lack of support for the mastery of central. (p. 3)
This criticism was aimed at what the curriculum expresses to be its strength. It
further demonstrates the difference in philosophy between the tradition and
Standards-based curricula.
Hirsch (1996), in the American Federation of Teacher's American
Educator, criticized Everyday Mathematics as having activities that are too
simple, not focused on the topic, and as not having enough homework. In the
1998-99 school year, Texas schools adopted new mathematics textbooks. Two
groups, Texas Public Policies Foundation and Educational Connections of
Texas distributed information to discredit Standards-based curricula. A May,
1999 "Policy Action Update,” touted the fact that only a few districts chose
the "Fuzzy Math" textbooks, referring to Everyday Mathematics, Connected
25
Mathematics, and Mathematic Thematics, all curricula developed according to the
national standards promoted by the National Council of Teachers of
Mathematics (Texas Public Policy Foundations, 1999).
The Mathematically Correct (1998) group reviewed several mathematics
curricula and expressed this about Connected Mathematics,
This book is completely dedicated to a constructivist philosophy oflearning, with heavy emphasis on discovery exercises and rejection ofwhole class teacher directed instruction. The introduction to Part 1 says,"Connected Mathematics was developed with the belief that calculatorsshould be available and that students should decide when to use them."In one of the great understatements, the Guide to the ConnectedMathematics Curriculum states, "Students may not do as well onstandardized tests assessing computational skills as students in classesthat spend" time practicing these skills. (p. 3)
This organization gave the curriculum an overall rating of F, noting that "it is
impossible to recommend a book with as little content as this and an
inefficient, if philosophically attractive, instructional method" (Mathematically
Correct, 1998, p. 4). In reviewing the Everyday Mathematics, the
Mathematically Correct organization gave it an overall rating of C-, because of
lack of mathematical depth, absence of a standard textbook, and limited
quantity and scope of expected student work.
In this debate over mathematics curricula there is a clear choice. There
are supporters and critics for both types of mathematics. The differences are
distinct in content, delivery, and pedagogy.
26
Change Creates Conflict
As mathematics standards are developed and curricula that attempt to
follow these new standards are created, some will object to the changes. These
who oppose using a mathematics curriculum that conforms to the Standards
include mathematics teachers, parents, school boards, and politicians.
The objections to Standards-based mathematics curricula often began
with the absence of the repetitive drill of numerical problems. The back to
basics movement emphasizes an approach that calls for rote memorization and
conflicts with those curricula that exclude worksheets with rows and rows of
numerical problems. Often the phrase “It was good enough for me” points to
the conflict inherent in change (O’Brien, 1999, p. 434).
Colvin (1999) chronicled one debate between traditional and
Standards-based mathematics curricula. In the early 1990s, California
developed a set of educational standards similar to the NCTM Standards and
encouraged school districts to adopt a curriculum that was based on these
standards. However, because of growing controversy, in 1997 the state
adopted a new set of standards that returned to a more traditional approach.
Parent groups and legislators led the fight against reforms, believing that
children were able to learn mathematics better with the traditional approach.
The information used to substantiate the claim that students learn
better with a traditional approach is usually anecdotal and flawed. Some point
to standardized test results that require students to answer many numerical
27
problems in a set length of time. It stands to reason that those students taught
by traditional methods will perform better on these tests because
Standards-based mathematics does not emphasize repetition of numerical
problems, whereas traditional mathematics does. Similarly, large textbooks
publishers, which tend to be more traditional, have a stake in having state and
local school governance adopt more traditional approaches to mathematics
education (Colvin, 1999; O’Brien, 1999). The debate continues on the virtues
and detriments of diverse mathematics curricula.
Standards
Former Assistant Secretary of Education, Ravitch (1995), stated the
following:
Americans . . . expect strict standards to govern construction ofbuildings, bridges, highways, and tunnels; shoddy work would put livesat risk. They expect stringent standards to protect their drinking water,the food they eat, and the air they breathe. . . . Standards are createdbecause they improve the activity of life. (p. 89)
Ravitch believed that national standards in education would improve both the
effectiveness of American education and Americans' daily lives.
Similarly, following the publication of A Nation at Risk, Seldon of the
Council of Chief State School Officers wrote:
There was a feeling of urgency that the education system needed to bestronger, and that in addition to what states and districts and individualschools were doing we needed a stronger presence at the nationallevel. . . . We recognized that we didn't need a national curriculum, sonational goals and voluntary national standards came to be seen as agood mechanism for providing a focus. (as cited in O'Neil, 1995, p. 12)
28
Growing concerns and assertions about the lack of quality in the education
of Americans prompted President George Bush to convene an education summit
in Charlottesville, Virginia in 1989. At this meeting several broad goals were
adopted, including the following:
Goal 3: By the year 2000, American students will leave grades 4,8, and 12 having demonstrated competency in challenging subjectmatter including English, mathematics, science, history, and geography;and every school in America will ensure that all students learn to usetheir minds well, so they may be prepared for responsible citizenship,further learning, and productive employment in our modern economy.
Goal 4: By the year 2000, U. S. students will be first in the worldin science and mathematics achievement. (National Education GoalsPanel, 1991, p. ix)
This opened the floodgate for the development of national education
standards.
In the 1990s, standards were developed in every major content area.
The National Science Foundation sponsored the National Science Teachers
Associations efforts to produce National Science Standards in 1990 (National
Research Council, 1996). The Curriculum Standards for Social Studies were
developed by a Task Force of the National Council for the Social Studies and
approved by the National Council for the Social Studies Board of Directors in
April 1994 (Schneider et al., 1994). The International Reading Association
and the National Council of Teachers of English completed Standards for the
English Language Arts in 1996. However, the first major publication of national
standards for school curriculum was the Curriculum and Evaluation Standards for
School Mathematics by the NCTM (1989a).
29
In order to understand the changes in mathematics curricula, it is
helpful to look at the development of the set of standards created by the
NCTM. In the 1987 and the 1988 annual reports of the NCTM there were
strong calls for changes in the content and pedagogy of mathematics
education. The Board of Directors formed a commission charged with these
tasks:
1. To create a coherent vision of what it means to bemathematically literate both in a world that relies on calculators andcomputers to carry out mathematical procedures and a world wheremathematics is rapidly growing and is extensively being applied indiverse fields.
2. To create a set of standards to guide the revision of theschool mathematics curriculum and it's associated evaluationtoward this vision. (NCTM, 1989a, p. 1)
Several study groups were formed and by the time of the 1989 convention and
publication of the yearbook, the NCTM (1989a) had completed Curriculum
and Evaluation Standards for School Mathematics. In the 1989 yearbook, New
Directions for Elementary School Mathematics, both the rationale and application
of new standards were given. The Standards were to be the foundational
document for reform in mathematics education that continues in the present
(NCTM, 1989b).
Philosophy of Standards
The Curriculum and Evaluation Standards for School Mathematics was
developed because of changes in society and the needs of students.
The objective of mathematics education must be transformed to meetthe critical needs of our society: an informed electorate, mathematicallyliterate workers, opportunity for all students, and problem-solving skills
30
that serve lifelong learners. Both the content that is being taught andthe way it is taught need to be reconsidered and, in many cases,transformed. To ensure quality, to indicate goals, and to promotechange are the three reasons why NCTM issued the Standards.(Suydam, 1990, p. 3)
As education reporter Diegmueller (1995) explained, the NCTM standards
"redefined the study of math so that topics and concepts would be introduced
at an earlier age, and students would view math as a relevant problem-solving
discipline rather than as a set of obscure formulas to be memorized" (p. 5).
With changes in knowledge, technology, and application of mathematics, the
Standards attempt to set the pace for reform in education that prepares the
students for these changes.
The NCTM also recognized the change in thought concerning students.
While the Standards establishes the content and behavior needed by all
students to be mathematically literate, it recognizes that students learn in
uniquely different ways. By suggesting a wide variety of activities and teaching
strategies, the Standards exhibits a philosophy that provides opportunity for
learning to all children (NCTM, 1989a).
The NCTM intended to create standards that would create positive
change based on the results of good research. In “Contributions of Research to
Practice: Applying Findings, Methods, and Perspectives,” there is a clear
connection between the formation of mathematics standards and the current
research in mathematics education. Both the appropriate level of content and
the most effective methods have been researched and were included in the
31
Curriculum and Evaluation Standards for School Mathematics (NCTM, 1989a).
The current standards also encourage ongoing research to insure a high level of
quality and relevancy (Silver, 1990).
Documents of Standards
Three books are the result of the efforts of the NCTM. The first of
these, completed in 1989 and forming the foundation, is Curriculum and
Evaluation Standards for School Mathematics (NCTM, 1989a). The focus of this
work is on the content, connections, methods, and activities of the
mathematics classroom. The second work, Professional Standards for Teaching
Mathematics, was published in 1991 (NCTM, 1991). In this book classroom
resources, functionality, and teacher evaluation are discussed. The last of these
Assessment Standards for School Mathematics was published in 1995 (NCTM,
1995). Whereas student evaluation is part of the first book, the latest work
contains a revision of the process and promotes more diverse and authentic
assessment of students in mathematics. The three works are similar in format,
with overviews of standards, statement and discussion of each standard, and
suggested practices for the classroom.
In the NCTM publications mentioned above, three basic changes have
been suggested for mathematics curricula. One of these revisions is that
content and process should be connected to real-world experiences and should
be integrated into many activities and projects. Another change suggested is
that learning take place from the investigation and discovery of the learner.
The third change discussed is that assessment should be varied and could
32
include classroom observation, written journals, extended projects, portfolios,
and open-ended problems as well as conventional tests (NCTM, 1989a, 1991,
1995). The more traditional classroom relies on teaching a specific content
area such as two digit addition, with the teacher explaining the algorithm,
followed by students working several pencil and paper problems. The new
Standards-based mathematic programs and the traditional mathematic curricula
have created clear and different choices and spawned division among both
educators, parents, and the community (Colvin, 1999; Schoen et al., 1999).
The Mathematics Standards
Curriculum and Evaluation Standards for School Mathematics includes three
divisions, Grades kindergarten through 4, Grades 5 through 8, and Grades 9
through 12 (NCTM, 1989a). In each of these a chart indicates the summary of
changes in content and emphasis (Appendix). Those found on pages 20
through 21, 70 through 71, and 126 through 127 are most helpful in
understanding the shift in philosophy and practice in mathematics education
(NCTM, 1989a).
Buckeye (1999), in a summary article about the national mathematics
Standards, wrote that the NCTM has identified these competencies that
students will need for future success:
1. Problem Solving: Students beginning to solve problems is theprincipal reason for studying mathematics.
2. Communicating Mathematical Ideas: Students should learn thelanguage and notation of mathematics.
3. Mathematical Reasoning: Students should learn to makeindependent investigations of mathematical ideas.
33
4. Applying Mathematics to Everyday Situations: Studentsshould be encouraged to take everyday situations, translate them intomathematical representations (graphs, tables, diagrams, ormathematical expressions), process the mathematics, and interpret theresults.
5. Alertness to the Reasonableness of Results: Students mustdevelop the number sense to determine if results of calculation devicesare reasonable.
6. Estimation: Student should acquire techniques for estimatingmeasurement.
8. Appropriate Computational Skills: Students should gainfacility in using addition, subtraction, multiplication, and divisionwith whole numbers, common fractions, percents, and decimals.
9. Algebraic Thinking: Students should learn to use variables,functions, relations, graphs, equations, formulas, inequalities, positive,and negative numbers.
10. Measurement: Students should be able to measure distance,mass, time, capacity, temperature, area, and volume in metric andstandard measurement systems.
11. Geometry: Students should have knowledge of parallelism,perpendicularity, congruence, similarity, and symmetry.
12. Statistics: Students should plan and carry out collection andorganization of data to answer questions in their everyday lives.
13. Probability: Students should understand elementarynotations of probability to determine the likelihood of future events.(pp. 3-4)
The NCTM (1989a), in Curriculum and Evaluation Standards in School
Mathematics, created 54 standards: 13 for kindergarten through 4th grade; 13
for 5th grade through 8th grade; 14 for 9th grade through 12th grade; 14 for
evaluation. The standards for each of the grade divisions are similar; however,
they are grade-level appropriate. Each standard has a broad topic, a general
statement, and more specific substatements. The following is an example:
Standard 5: EstimationIn grades K-4, the curriculum should include estimation so that
students can--explore estimation strategies; recognize when an estimateis appropriate; determine the reasonableness of results; apply estimation
34
in working with quantities, measurement, computation, and problemsolving. (NCTM, 1989a, p. 36)
An explanation and discussion of the implementation of the standard follow
this statement of a standard. In some cases examples of classroom use are
given.
In the following, Buckeye (1999) compared the previous ways of
mathematics to the new standards in this chart:
Old Standards New StandardsPaper and Pencil Physical MaterialsTeaching by Telling Learning by DoingTopics in Isolation Topic RelationshipTeacher Talks Students Discussing
MathematicsIndividual Responsibility Activity Between StudentsCompetitive Environment Cooperative EnvironmentTechnology Use Not Permitted Technology for Exploration &
ComputationFollow the Rules Justify Thinking & ExploreThe Right Way Alternative ApproachesLook for the Clues Thinking About Problems (p. 2)
Results of Standards
Since the publication of Curriculum and Evaluation Standards for School
Mathematics (NCTM, 1989a), several changes have taken place. One of these is
that state and local educators have used standards to establish new
benchmarks and curriculum guides. California used the National Council of
Mathematics’ standards almost exclusively to write their 1992 state
mathematic standards. Since that time, because of controversy, California has
rewritten its standards, which are now less aligned with the national standards.

35
Many other states have used the Curriculum and Evaluation Standards for School
Mathematics as a blueprint for their own standards (Colvin, 1999).
In a study conducted by the Council of Chief State School Officers
(CCSSO), it was found that all states had used the NCTM Standards in
developing standards for their state. "In the main categories of state standards
which typically cover K-12 or multiple grade levels, state standards have a high
degree of similarity to the NCTM math standards" (CCSSO, 1997 p. 9). The
summary of this report attributes much of the development of the current
state and local content standards to the national standards produced in each
content area by national organizations. According to CCSSO, "the NCTM was
the pioneer of national standards that have been used in virtually every state
to provide educators with direction to educate all children in mathematics"
(p. 27).
In 1996 a North Texas urban school district contracted with the Texas
Association for Supervision and Curriculum Development to pilot a curriculum
guide on a CD-ROM. In this curriculum, all mathematics instruction,
kindergarten through the 12th grade, had the ability to access the NCTM's
Standards. Although the curriculum was not written to the Standards, a teacher
could view the various standards to see how they applied to lessons (Dallas
Public Schools, 1996).
Besides influencing standards and curriculum guides, the Standards have
influenced textbook companies. In the current Prentice-Hall and
Silver-Burdett-Ginn mathematics textbooks, an introductory section lists the
36
national mathematics standards and charts the application of these standards
to the material and lessons. However, as a speaker at the 1998 NCTM
regional convention stated, there is little consistent use of the 1989 Standards
in the offerings of the major textbook companies (Jamison, 1998).
A third result of the NCTM (1989a) Curriculum and Evaluation Standards
for School Mathematics has been the development of curriculum projects
specifically designed to apply these standards to all aspects of a curriculum.
These are the results of universities or educational research institutions
utilizing grants from the National Science Foundation. The Math Curriculum
Center found on the Web page of the Education Development Center (1999)
identifies 13 curricula that are standards-based mathematics instruction. These
are:
Elementary curricula:Everyday MathematicsInvestigation in Number, Data, and SpaceMath Trailblazers
Middle School curricula:Connected MathematicsMathematics in ContextMathScape: Seeing and Thinking Mathematically
MATHThematics Middle-school Mathematics Through Application Project IIHigh School curricula:
Contemporary Mathematics in Context (Core-Plus)Interactive Mathematics ProgramMATH Connections: A Secondary Mathematics Core CurriculumMathematics: Modeling Our WorldSIMMS Integrated Mathematics: A Modeling Approach Using
Technology. (pp. 2-3)
37
These 13 curricula have used the NCTM's Standards to develop the
instructional modules.
These national standards have changed the landscape of mathematics
education in the United States and also in other countries. In Rethinking the
Mathematics Curriculum, the NCTM's Standards was cited as having indirect
influence on the current national curriculum in Great Britain. The Standards
were again directly connected to the mathematics education standards that
have been written in Korea (Hoyles, Morgan, & Woodhouse, 1999).
The Current Debate Over Standards
Although the development and implementation of national curriculum
standards have been at the forefront of education for the past 10 years, some
believe that standards have not produced the hoped-for reform. Diegmueller
(1995) wrote, "Despite the publicity given these national goals (standards), the
federal support for standards, and the enthusiasm of educators from the
various subject areas, critics of the standards movement also caught the
public's attention" (p. 6). The issues are the drain on resources, the potential
for dividing and labeling students, past failures of standards, the lack of real
content, and the shear volume of standards literature. Finn (1995) said in a
speech to national educators concerning standards, "The professional
associations, without exception, lack discipline. They all demonstrated
gluttonous and imperialistic tendencies" (p. 6). He was referring to the massive
number of pages of national standards documents.

38
Mathematically Correct (1998), an organization critical of national
mathematic standards, called for several corrections to the current mathematic
standards, including the following:
1. Demand greater mathematics knowledge for teachers.2. Stress that standards of learning must have yearly benchmarks.3. Admit that weak programs have resulted from following
NCTM guidelines.4. Refrain from promoting any theory of learning or method of
teaching.5. Encourage frequent objective tests to monitor student progress.6. Keep the focus on mathematics.7. Refrain from promoting heterogeneous grouping or repudiating
homogeneous grouping.8. Admit that arithmetic and algebra are the key elements of the
early curriculum.9. Include symbolic skill-building, abstract mathematics, and
repeated practice.10. Reinstate an emphasis on proof and mathematical
justification.11. Emphasize that algorithms should be taught, understood, and
used.12. Delete the list of topics for deemphasis.13. Indicate that calculators and computers should be used
sparingly. (pp. 1-2)
Marzano and Kendall (1996) wrote concerning the current state of
standards in curricula:
We believe that we will not soon have a set of nationally acceptedstandards. However, we do not believe that the standards movement isdead. In fact, we assert that the logic behind organizing schoolingaround standards is so compelling as to make schools and district adoptcommon standards even in the absence of federal mandates orincentives. (p. 7)
Recently, the NCTM began a revision of the Standards, and intend to
present these new standards in the Fall, 2000. These new standards are
preliminarily called Principles and Standards for School Mathematics. These have
39
at this time five content standards and five process standards for each level of
grades. The NCTM Website describes how new standards are written to
"improve and build upon the previous Standards of NCTM" ( NCTM, 1999a).
National Science Foundation andMathematics Curricula
The National Science Foundation is a major organization in the
development of national educational standards and support of curriculum
projects. The United States Congress passed the National Science Foundation
Act almost 50 years ago, forming an independent organization to strengthen
the science, mathematics, and engineering education of United States schools.
For the first 10 years, the foundation funded large science projects and
developed scholarship programs for graduate school science students (National
Science Foundation, 1988).
Not until the Russians successfully launched Sputnik did the National
Science Foundation receive major funding. In the 1980s the National Science
Fund was given greater power and more money through both Title I and Equal
Education legislation. During the 1980s the National Science Fund shifted its
focus from large science projects to education. Initially, the shift led to funding
in colleges and universities, but by the mid-1980s this focus was shared by
kindergarten through 12th grade education. The National Science Foundation
(1999) reported on its Internet home page in December, 1999 that it will
designate $3.3 billion for use in over 200 programs, one-half of which directly
impacts kindergarten through 12th grade classrooms.

40
Improving School Achievement in Mathematics
Through the years the shift in emphasis of the National Science
Foundation has continued from science projects and higher-level science
education to a focus on formal education. Philosophically, National Science
Foundation leaders believe that it should direct all of the funding toward
grants to promote the advancement of science and engineering. In the past 15
years, the National Science Foundation’s (1988) 24-member board of trustees
has determined that a key to providing the science and engineering brain trust
for the future is the preparation of children in both science and mathematics.
To that end, the financial resources of the National Science Foundation have
been directed toward the development of high-quality education for
kindergarten through 12th grade in both science and mathematics.
In 1991 the National Science Foundation began to fund projects to
develop curricula that supported or conformed to the standards developed by
the NCTM and the National Science Teachers Association. In science, the
American Association for the Advancement of Science has been funded in part
by the National Science Foundation to develop Project 2061 and Benchmarks
in Science to evaluate and formulate curricula that conform to national science
standards. Also, the National Science Foundation began funding projects that
would implement national mathematics standards. Although the funds devoted
to the development of curricula constitute a large sum, the National Science
Foundation has funded another area that is connected to national curricula
standards: the Urban Systemic Initiative (Ravitch, 1995).
41
Urban Systemic Initiative
The Urban Systemic Initiative is the largest program of the National
Science Foundation. Williams, director of the National Science Foundation,
introduced the Urban Systemic Initiative in a report Foundations for the Future
(National Science Foundation, 1994). The Urban Systemic Initiative provides
grant money to improve the curriculum, promote community participation,
enhance teacher training, and encourage local projects and research in large
urban school districts with large student populations that are at or below the
poverty level. The Urban Systemic Initiative is referenced in several articles as
a strategic force for reform in mathematics education in America (Briars,
1999; Colvin, 1999; Heid, 1997).
In order to qualify for an Urban Systemic Initiative grant, a school
district must serve at least 25,000 students, kindergarten through 12th grade,
of which at least 50% must be eligible for the free or reduced lunch program.
The district must have a single central leader and an existing infrastructure for
reform. Qualifying districts' current programs should have a level of technology
and current education that would allow for advancement. These eligibility
requirements can be found on the Urban Systemic Program's (1999) Web
page.
Twenty-five cities with the largest number of children living below the
poverty level were targeted in 1994 to participate in this grant program. Seven
school districts had completed the application process and were chosen to
receive funding under this initiative. By the school year 1998-99, 22 school
42
districts had been selected to receive Urban Systemic Initiative funding. The
North Texas school district that is the subject of this dissertation study is one
of those districts initially chosen to participate in the Urban Systemic
Initiative. Now in the 6th year of the grant, the National Science Foundation
(1999) has changed the name and the direction, slightly, of the Urban
Systemic Initiative to the Urban Systemic Program to reflect the need to turn
reform into the norm in these large urban districts.
University of Chicago School Mathematics Project
Shortly after the Curriculum and Evaluation Standards for School
Mathematics (NCTM, 1989a) was published, the National Science Foundation
began a grant program for universities that would develop a curriculum that
applied these standards. The University of Chicago was the first university to
qualify for this grant. In 1990 the university formed a working group of
professors and professional mathematicians to begin working on the project. In
1992 the Everyday Learning Corporation was formed to publish and manage
the distribution of materials. The pilot program was developed and
implemented in the 1992-93 school year, followed by research and evaluation.
The Everyday Mathematics curriculum was introduced for kindergarten through
sixth grade with the first edition published in 1994. After two major revisions,
the program was not changed again until 1999, when minor revisions were
made (Everyday Learning Corporation, 1999b). Everyday Mathematics is a
product of the National Science Foundation’s funding and an application of
43
the Curriculum and Evaluations Standards for School Mathematics from the
NCTM.
"Everyday Mathematics" Program
Everyday Mathematics differs from other textbooks and curricula. It
interweaves concepts in a variety of applications throughout the school year.
More traditional curricula usually teach concepts one at a time, in isolation,
with little emphasis on application. The Everyday Mathematics curriculum
recognizes a set of concepts that are used together in activities and projects
and recorded in student workbooks and journals throughout the academic year
(Everyday Learning Corporation, 1999b).
Effective implementation of the Everyday Mathematics program requires
that teachers and administrators should receive 40 hours of initial training. In
this training, all who will be involved in the educational process are exposed to
the mathematics standards and are prepared for the change in philosophy of
the Everyday Mathematics program (Everyday Learning Corporation, 1999b).
Components of "Everyday Mathematics". Each grade level, from kindergarten
through sixth grade, has several components. According to the Everyday
Learning Corporation (1999b) Web page the
Teacher’s Resource Package contains: Teacher’s Manual and LessonGuide, Resource Book, Creating Home and School Partnerships, Teacher’sReference Manual, Math Minutes, and a copy of all student material.
The student material contains: Everyday Mathematics Journal 1,Everyday Mathematics Journal 2, a student activity book (2 in the fifthand sixth grade), and Homelinks (homework sheets that correspond tothe lessons). (pp. 1-2)
44
The Teacher Resource Package provides the educator with the
information needed to effectively implement the curriculum. The Teacher's
Manual and Lesson Guide provides unit overviews and preparation and specific
plans and guides for the daily lessons. The daily lessons have five divisions:
Introduction (Math Minutes or Math Boxes), Instruction and Discussion,
Teacher-Directed Activities, Independent Activities, and Assessments. This
guide leads the teacher in each daily activity. The Math Minutes are short
activities that can be used to begin mathematics instruction or they can be
used during a transitional time in mathematic activities. In the introduction to
Math Minutes it was noted that, "most of the activities do not require pencil
and paper, chalkboard, measuring tools, or manipulative materials, hence, can
be done anywhere and anytime" (UCSMP, 1998a, p. i). These short activities
can be used for reinforcement, introduction, creating discussion points, quick
problem solving, filler thought time rather than wasted time. The Math
Minutes are divided into Counting, Operations, Geometry, Measure, and
Number Stories (the longest section). In the lesson guides specific Math
Minutes are suggested, however, others may be used during any learning time
(UCSMP, 1998d). To complete the lesson material, a Resource Book is provided
in the Teacher's Resource Package. This book contains all of the sheets to be
reproduced, including are parent letters, home links, daily worksheets,
overheads, teaching Aids, and application sheets called "Math in My World."
These are sheets that will be copied each year to complement the
implementation of Everyday Mathematics.
45
Along with the material necessary for the teacher to plan and implement
the daily lessons, the Teacher's Resource Package contains material to help the
teacher administer the curriculum. These components are informational and
instructional to the educator, but are not necessary for the daily lessons. One,
Towards a Balanced Assessment, guides the educator in grading the student.
Following the NCTM standard of providing varied opportunities for student
assessment, this book, "provides a variety of useful techniques and
opportunities to assess children's progress on skills, concepts, and thinking
processes" (NCTM, 1991 p. 1). It suggests that this take place through
ongoing assessment, product assessment, periodic assessment, and outside test
(such as standardized tests). Another of these aids is Creating Home and School
Partnerships which contains articles, questions, and answers to common
concerns, a literature list, and a glossary of terms that would help parents. The
third title is Teacher's Reference Manual, which was written to help the educator
to understand the connection of topics, themes, tools, pedagogy, and games.
The teacher can gain a greater understanding of classroom activities through
this book. According to the introduction, "This manual contains background
information on the content, curriculum, and pedagogy of Everyday Mathematics
for your grade level as well as some preview of what Everyday Mathematics
students can expect to see in future grades" (UCSMP, 1998d, p. 1). These
titles can be used for group training or the individual growth of a teacher.
Also included is a materials kit that contains all the manipulatives, such
as rulers, dice, shape templates, and the like that are needed for students to
46
complete the lessons. While many of these materials could be purchased at a
retail store, the Everyday Learning Corporation offers them for the
convenience of the teacher (UCSMP, 1997).
The 1999 costs of the Everyday Mathematics material were found in the
catalogue from Everyday Learning Corporation. The Teacher Resource
Packages cost $175.00 each. This is a one-time purchase per teacher. The
student material costs differ by grade level and are: kindergarten, $6.25; first
grade, $15.25; second grade, $15.25; third grade, $15.25; fourth grade,
$17.50; fifth grade, $18.50; and sixth grade, $25. The Manipulative Kits, with
sets for 25 students, range in price from $255 to $530, depending on the grade
level. The costs of the textbooks of the more traditional curricula are $40.20
and $47 each, with a consumable workbook costing approximately $7 (Texas
Educational Agency, 1999d). When compared in the 1999-2000 school year,
the cost of the Everyday Mathematics curriculum is similar to the cost of
traditional curricula.
In the newest catalogue, the Everyday Mathematics curriculum has added
two new components that can be purchased separately. They are Skills Links
which are described as "providing extra cumulative practice on basic facts,
computations, word problems, mental math, and estimation skills" (Everyday
Learning Corporation, 2000, p. 7). The other new title, Operations Handbook, is,
"For teachers and has basic operations used in Everyday Mathematics.
Algorithms are presented with teaching notes and accompanying blackline
47
masters" (Everyday Learning Corporation, 2000, p. 7). It appears that the
authors of Everyday Mathematics have listened to some of their critics.
Lessons. The method of teaching mathematics used in the Everyday
Mathematics program attempts to improve student interest and therefore
student achievement. According to Everyday Learning Corporation (1999a),
“The K-6 Everyday Mathematics curriculum encourages teachers and students to
go beyond arithmetic and to explore more of the mathematics spectrum by
investigating data gathering and analysis, probability, geometry, patterns and
algebra” (p. 2). Everyday Mathematics does not teach topics, strands, or concepts
in isolation. In a typical lesson several concepts are used and taught:
"Numbers, Numeration, and Order Relations, Measurement; Measure, and
Numbers in Reference Frames; Operations, Mental Arithmetic, and Number
Systems; Problem-Solving and Mathematical Modeling; Exploring Data;
Geometry and Spatial Sense; Patterns, Rules, and Formulas; and Algebra and
Uses of Variables" (Everyday Learning Corporation, 1999b, p. 1).
Most lessons in all grade levels contain several components. They
usually begin with a Math Message, which is a focus for the daily lesson.
Hands-on group and individual activities that require investigation and
discovery are called Explorations. Teachers lead discussions and instruction.
Math Boxes are used in the lesson to reinforce mathematical understanding.
Fact practice and games provide skill-based activity for mastering concepts of
the lesson. Math Minutes provides mental practice for transitional times.
48
HomeLinks is the homework component with practical experiences that often
include help from others at home. Journal writing requires that a student write
about the mathematic concepts to increase mathematic understanding and
encourage language arts skills. Throughout the year projects are a part of the
lessons and extend from class period to class period. All of these are explained
in the Everyday Mathematics: Teacher’s Guide and Lesson Plans (UCSMP, 1998c).
The lessons follow a basic lesson cycle of focus, teacher instruction, guided
practice, independent practice, and assessment.
Studies of Improvement of Student Achievement
Several studies have been conducted on student achievement when
Everyday Mathematics has been used. These studies can be found on the
Everyday Learning Corporation (1999b) Internet site. These are a part of the
material used to publicize the Everyday Mathematics curriculum.
One of the studies examined the increase of student achievement on the
standardized test used in Illinois. At Lee Elementary School in Chicago, third-
grade students increased their average score from 180 (on a scale from 0 to
500) to 319. The state average score was 286, and the Chicago Public Schools'
average score was 221 (Everyday Learning Corporation, 1999c).
Another study, at Silver Ridge Elementary School in Silverdale,
Washington, was conducted in 1993-94 as a part of the pilot project of
Everyday Mathematics. This study analyzed the problem-solving ability of third
graders. In this study, students of Silver Ridge School, where Everyday
49
Mathematics was used, showed significant gains on the Test of Problem Solving,
whereas a control group not using the Everyday Mathematics program showed no
significant gain (Everyday Learning Corporation, 1999c).
A third study, conducted in a charter school affiliated with a local
university in Texas, analyzed gains in the achievement scores of students.
These students were taught using the Everyday Mathematics curriculum. The
students increased their scores on the Texas Assessment of Academic Skills by
15% the 1st year and an additional 10% each of the next 2 years (Everyday
Learning Corporation, 1999c).
Everyday Learning Corporation (1999c) chronicled the study of a
Pennsylvania school district that implemented the Everyday Mathematics
curriculum in all seven of its elementary schools. Students showed significant
gains on both the Iowa Test of Basic Skills and the Pennsylvania System of
Schools Assessment. Although these studies lack details and appear to have
flaws in design, they indicate that students have achievement gains
attributable to the use of Everyday Mathematics in the classroom.
The Use of Everyday Mathematics for Urban SystemicInitiative in a North Texas School District
In 1995 a large North Texas urban school district applied for and was
approved as a recipient of Urban Systemic Initiative grant money. New
curricula in both science and mathematics were a part of this district’s plan for
use of the funds. New curricula had to be research based and meet the
standards of the Texas Education Agency. Everyday Mathematics had been
50
introduced in a South Texas urban school district during the 1995-96 school
year and appeared to have a positive effect on student achievement. The
Urban Systemic Initiative director for the North Texas urban school district to
be studied decided to use the Everyday Mathematics curriculum in pilot schools
during the 1996-97 school year. At the beginning of the 1998-99 school year,
17 schools in the district qualified to use the Everyday Mathematics curriculum
in their classrooms (S. Dudley, personal communication, September 20,
1999).
The Current Choice of Mathematics Curricula
The Texas Education Agency followed the new adoption procedure for
mathematics textbooks during the 1998-99 school year. It divided the various
possible adoptions into “Conforming” and “Nonconforming” curricula. Some
of the criteria for a conforming curriculum are that it be aligned with the Texas
Essentials of Knowledge and Skills, it have a singular textbook, and have a set
of standardized assessments. All curricula must cover all of the Texas
Essentials of Knowledge and Skills. The Everyday Mathematics curriculum was
classified as a nonconforming curriculum. It was evaluated as having alignment
with 80% of the Texas Essentials of Knowledge and Skills. Although the Texas
Teachers of Mathematics (1998) listed it as the best it was not selected by any
of the large school districts of Texas as the adopted program.
Statewide Assessment of Student Achievement in Mathematics
51
The State of Texas has a state board of education that oversees the
development of public formal education in the state. The Texas Education
Agency carries out the direction of the state board of education. Both of these
are governed by the state legislature, which adopts educational law that is
formulated into the Texas Educational Code (1995). As a part of that code
(Section 39.021, 39.022, 39.023), the legislature has mandated that a
statewide assessment be developed and implemented.
In the 1980s the Texas Assessment of Basic Skills was used. In 1990 the
state law changed requiring the implementation of a new criterion-referenced
program, the Texas Assessment of Academic Skills. This indicated a shift in
emphasis from basic skills to academic skills. Throughout the 1990s there have
been various changes in the administration and the content and processes, or
benchmarks, have been included in the test. Students are required to
demonstrate satisfactory performance on each section of the test. Exit-level
tests are given in the 10th grade, and a student must pass in order to graduate
(Texas Education Agency, 1999b).
The Texas Education Agency has a student assessment division that is
given the responsibility for planning, scheduling, administrating, and securing
all major assessment activities. Three companies have contracted with the state
to help with the development of the Texas Assessment of Academic Skills.
Since 1981 National Computer Systems has been the primary contractor to
provide the statewide assessment. Harcourt Brace Educational Measurement is
involved in the development of Texas statewide tests. It provides guidance in
52
the item and data review and technical assistance in the testing process, it also
produces the products for the test. Measurement Incorporated conducts the
handscoring of the written compositions and open-ended items on the Texas
Assessment of Academic Skills (Texas Education Agency, 1999c).
The benchmarks or objectives that are required in the education of
Texas students have changed over the years. From 1990 to 1993, the Texas
Education Agency provided benchmarks for education by grade level and
content area to all Texas public schools. These changed in the fall of 1993 to
the essential elements. In 1997, this changed again to the Texas Essentials of
Knowledge and Skills (Texas Education Agency, 1997b).
The Texas Assessment of Academic Skills mathematics section has the
following objectives that fall into three domains:
Domain: ConceptsObjective 1--The student will demonstrate an understanding of
number concepts.Objective 2--The student will demonstrate an understanding of
mathematical relations, functions, and other algebraic thinking.Objective 3--The student will demonstrate an understanding of
geometric properties and relationships.Objective 4--The student will demonstrate an understanding of
measurement concepts using metric and customary units.Objective 5--The student will demonstrate an understanding of
probability and statistics.Domain: Operations
Objective 6--The student will demonstrate an understanding ofaddition to solve problems.
Objective 7--The student will demonstrate an understanding ofsubtraction to solve problems.
Objective 8--The student will demonstrate an understanding ofmultiplication to solve problems.
Objective 9--The student will demonstrate an understanding ofdivision to solve problems.
53
Domain: Problem SolvingObjective 10--The student will estimate solutions to a problem
situation.Objective 11--The student will determine solution strategies and
will analyze or solve problems.Objective 12--The student will express or solve problems using
mathematical representation.Objective 13- The student will evaluate the reasonableness of a
solution to a problem situation. (Texas Education Agency, 1999b,pp. 42-43)
There are different numbers of questions for each grade level in each objective
and domain. The Texas Education Agency sets the level of passing for each
objective and an overall number of correct answers for a passing score for
mathematics. It was necessary for a third-grade student in 1999 to answer
correctly at least 33 of 44 questions to pass the Texas Assessment of Academic
Skills. On the fourth-grade Texas Assessment of Academic Skills mathematics
test in 1999, the student had to answer correctly a minimum of 35 out of 50
questions to pass. The fifth-grade students were required to answer at least 34
of 52 questions correctly to pass the 1999 mathematics Texas Assessment of
Academic Skills (Texas Education Agency, 1999b).
The results of the Texas Assessment of Academic Skills are sent to the
school districts, then forwarded to the schools and the parents of the student.
According to the Texas Education Agency (1999c), the scores are to be used in
at least five ways:
Reporting results to parents of individual students. The test reportscontain information about the student's scores in relation to the passingstandards, the content areas in which the student may need remedialinstruction, the specific skills in which further diagnosis is indicated,and the student's performance in comparison with the performance of
54
his or her peers. This information can help parents more fullyunderstand their child's achievement.
Reporting results to the local school board, school professionals, and thecommunity. Although individual students' scores are confidential by law,reports of group (aggregated) scores are considered public record.However, if the specific group (e.g., limited English proficient students)contains fewer than five students, scores are not included in reports inorder to protect student confidentiality.
Evaluating student scores for use in placement decisions. Remedialinstruction is required by state law for students exhibiting difficultywith skills on the TAAS [Texas Assessment of Academic Skills] tests.Student test scores should also be used in conjunction with otherperformance indicators to assist in making placement decisions, such aswhether a student should take a reading improvement course, be placedin a gifted and talented program, or exit a bilingual program.
Evaluating programs, resources, and staffing patterns. Districts may usecampus and district test scores in evaluating a particular program or aparticular resource or staffing pattern. For example, a campus may useits scores to evaluate its improvement in an at-risk program or to assessthe need to focus resources and staff on a particular group of students.
Evaluating district and campus curriculum and instruction. Since thetests are designed to measure the essential elements for reading, writing,mathematics, science, and social studies, considering performanceresults by subject area and by objective may be helpful when evaluatingcurriculum and instruction. Generalizations from student scores may bemade to the specific content domain represented by the objective or setof objectives being measured on the exam. However, because the testsare measuring a finite set of skills with a limited set of item types,generalizations should be made only to student achievement asmeasured on a particular test. (p. 3)
In this study the use of the Texas Assessment of Academic Skills mathematics
scores are being used to evaluate the Everyday Mathematics curriculum and its
use in schools.
Mathematics--Texas Essentials of Knowledge Skillsand National Standards
Because a curriculum aligned to national standards is implemented in a
system that measures student achievement by state standards, the connection
55
between state and national standards raises concern. Three connections can be
seen between the national standards developed by the NCTM and the Texas
Essentials of Knowledge and Skills. The developers of the Texas Essentials of
Knowledge and Skills considered several documents, including the Standards
documents. L. Wilson, a retired educator in Texas, was on the writing team for
the mathematics portion of the Texas Essentials of Knowledge and Skills test.
She said in an interview that the committee members were given many
documents to evaluate before writing the state norms. The NCTM Standards
documents were distributed to all involved in writing the mathematics portion
of the Texas Essentials of Knowledge and Skills test. When asked if the
Standards were specifically referred to, she replied, "The committee avoided
references to any other document, although individuals were directly
influenced by the Standards" (L. Wilson, personal communication, August 20,
1999).
Secondly, the similarities found in the state and national standards
point to connection between these two documents. The Texas Essentials of
Knowledge and Skills give specific objective that the student in each grade
level and content area should obtain. However they parallel the Standards in
content areas.
The list of Texas standards for the second grade are: "(a) Numbers,
Operations, and Quantitative Reasoning; (b) Patterns, Relationships, and
Algebraic Thinking; (c) Geometry and Spatial Reasoning; (d) Measurement;
(e) Probability and Statistics; and (f) Problem-Solving" (Texas Education
56
Agency, 1998b, p. 3). In close similarity, the NCTM Standards list the
kindergarten through fourth grade standards as: "(a) Numeration, Whole
Number Operations, and Computations; (b) Patterns and Relationships;
(c) Geometry and Spatial Sense; (d) Measurement; (e) Statistics and
Probability; and (f) Mathematics as Problem-Solving" (NCTM, 1989a, p. 15).
Similarly, both documents refer to the use of manipulatives, variety in teaching
methods, and real-world situations and assessments.
Thirdly, connections are evident in the use of curricula that are aligned
with Standards in the State Systemic Initiative. The University of Texas,
Charles Dana Center, leads this effort in Texas education. Among the
programs it has is the Connected Mathematics Project: "This project helps
seven diverse Texas sites implement a complete, standards-based curriculum
for grades 6-8 that has been developed with NSF [National Science
Foundation] funds at Michigan State University" (Texas Education Agency,
2000, p. 1). Resource help is available through the Texas Educational Regional
Service Centers to aid in the implementation of Standards-based mathematics
and science programs. It is evident that Texas students must meet state
standards that are similar to the national standards in mathematics.
Summary
Mathematics education has faced significant change in the last 10 years.
Although a starting point may be remote, the work of the NCTM radically
moved mathematics reform forward. When the NCTM's (1989a) Curriculum
and Evaluation Standards for School Mathematics was published, it established a
57
benchmark for American schools. As the National Science Foundation
attempted to elevate science and mathematics education in kindergarten
through the 12th grade, it encouraged the development of curricula that
applied the standards and the use of these curricula in large urban school
districts. All of this has come together in a large North Texas urban school
district. Through the Urban Systemic Initiative, this district has begun the use
of Everyday Mathematics, a Standards-based curriculum, in several of its
elementary schools. This study has attempted to measure the effects of this
curriculum on student achievement (National Science Foundation, 1994).
58
CHAPTER 3
METHODS AND PROCEDURES
Research Design
The focus of this research concerned the effects of a Standards-based
mathematics curriculum on the achievement of students in a large North Texas
urban school district. The students' mathematic scores on the critical test, the
Texas Assessment of Academic Skills, measures student achievement; this test
is administered at the end of each school year. The subjects for this study were
all drawn from a single school district.
This was an ex post facto study based upon data from the 1998-99
school year. One portion of data, the prior mathematics ability as measured by
the Iowa Test of Basic Skills Mathematics score, came from the April 1998
administration of the test. This was also a self-selected study, with the schools
that comprise the experimental group having chosen to participate in the
Everyday Mathematics program pilot implementation.
The Experimental Group
The experimental group for this study was formed from the schools that
had applied for and been accepted as pilot schools for the implementation of
the Everyday Mathematics curriculum. The principal of each school made the
commitment to use the material. Both the teachers and administrator received
59
40 hours of training in the use of the material and the "Teacher's Resource
Package." By the beginning of the 1998-99 school year, 17 schools had been
trained to use the Everyday Mathematics curriculum.
The principals of these schools were contacted for this study to
determine the level of implementation of the curriculum. Although there was a
required commitment, there were only seven schools using Everyday
Mathematics in the 1998-99 school year. Five of the principals not using the
Everyday Mathematics material said that the cost of the student material was the
reason the program was not used. Four different principals had been appointed
to the schools after the training and were more comfortable with the
traditional curriculum that the district had adopted by the district. The other
principal thought, after the training workshop, that the teachers of the school
were not ready to implement the new curriculum.
This left seven schools in which Everyday Mathematics was implemented
in the 1998-99 school year. Six of the principals agreed to participate in the
study, with the seventh principal stating that he did not have the time to allow
his teachers to complete the interviews and have lesson plans and school rolls
reviewed.
In order to complete this study, it was important that the school district
endorse the project. The assistant superintendent for curriculum was contacted
and showed an interest in the study. A proposal was presented to the research
committee of the district, with both the assistant superintendent for
curriculum and the director of the Urban Systemic Initiative endorsing the
60
study. This proposal was accepted, and the principals of the schools received a
letter approving the interviews of teachers, review of records, and the release of
school student rolls from the 1998-99 school year.
During September and October of 1999, dates were established with the
principals to conduct the initial interviews with teachers in each school. All of
these were conducted at the end of the school day. All teachers who had
taught mathematics during the 1998-99 school year were gathered in a single
place. They were asked to complete a one-page questionnaire. Following this,
an explanation of the study was given to the group. Each teacher was then
briefly interviewed to determine the accuracy of the answers on the
questionnaire.
On the questionnaire (Appendix) teachers identified themselves, the
school, the grade level taught, and the section(s) they had taught during the
1998-99 school year. This was followed by a set of five statements to which
the teachers answered yes or no. Concerning the training and resources
necessary to implement the Everyday Mathematics curriculum. In order to
participate in the study, the teachers had to answer affirmatively. A few
teachers had not attended the official training offered in the summer for
Everyday Mathematics, but they received training in their buildings on the use of
the curriculum.
The second section of the questionnaire had three questions requiring
short answers. The first of these identified the amount of time that a teacher
taught mathematics to each class daily. If the teacher taught multiple classes
61
and the times differed, each classroom was identified as to the time spent
teaching mathematics. The teacher needed to spend at least 1 hour daily in
mathematics instruction to qualify for the study. The next question concerned
the types or methods of assessments used to evaluate students. This question
was used to qualify a class based on the variety of assessments suggested by
the Everyday Mathematics material. The third question in this section concerned
other material used during mathematics instruction. Any class that used the
traditional or the approved mathematics curriculum was eliminated from the
study. Two teachers stated that they used the textbook Mathematics in Action
(Hoffer et al., 1992) for more than 2 hours weekly. They were excluded from
the experimental group. Many teachers identified the Everyday Counts (Clark,
Gilispie, & Kanter, 1998), a calendar mathematics program, as one that they
used as a supplement in the classroom. Other teachers used bell ringers,
material to help students on standardized tests, and a variety of minor items to
supplement mathematics instruction. If a teacher had identified materials that
took a majority of the instructional time, they were eliminated from the study.
One fifth-grade teacher who stated that she used Connected Math (Lappan, Fey,
Fitzgerald, Friel, & Phillips, 1998) at the end of the school year was eliminated
from the study. Connected Math (Lappan et al., 1998) is another of the
National Science Foundation projects for mathematics standards curriculum.
However, it is written for middle school, the sixth through eighth grades.
After reviewing the answers that the teachers gave in the interview and
on the questionnaire, the teachers' lesson plans for 1998-99 school year were
62
examined. These are required to be archived and were provided by the
principal, custodian, or computer records clerk. In order to qualify for the
study, the lesson plans had to reflect that Everyday Mathematics was used daily
and that the student assessments reflected the variety suggested by the
curriculum.
When, through the interview process and the examination of lesson
plans, teachers demonstrated that they had implemented the Everyday
Mathematics curriculum, their class rolls from the 1998-99 school year were
secured and reviewed. Students whose names were present on the class roll for
both the 1st and 6th six weeks were selected for the study. The district student
identification numbers were placed on a database. There were 930 children
identified as students who were in classes for the entire 1998-99 school year,
in which Everyday Mathematics was used. These came from 52 classes of
students taught by 40 teachers in 6 schools.
The Control Group
Following the identification and selection of the experimental group, the
student identification numbers were submitted to the district's student data
department. The student data required for the study included: (a) gender,
(b) ethnicity, (c) grade level, (d) participation on free or reduced lunch
program, (e) 1998 Iowa Test of Basic Skills raw score, (f) 1998 Iowa Test of
Basic Skills percentage rank, (g) individual mathematics objective score on the
1999 Texas Assessment of Academic Skills, and (h) percentage rank on the
63
1999 Texas Assessment of Academic Skills. The data of the students selected
to be in the experimental group for this study were compared with that of all
the students in each school. This was necessary in the selection process of
control schools to ensure that similar students were involved. The ethnic
makeup, the percentage of low to other socioeconomic status, and 1998 Iowa
Test of Basic Skills mathematic scores were identified for students by school
for each of the six schools that comprised the experimental group.
Having profiled the experimental group by schools according to
socioeconomic status, previous mathematics ability, and ethnic diversity, a
search was initiated for schools within the district that were similar to the
experimental group schools. The research and evaluation department of the
school district aided in this search. A compilation of school data, School
Snapshots 1998-99 (Dallas Public Schools, 1999), was used to find similar
schools. In this book, schools are listed and data provided for population
makeup and standardized test scores. Lists of schools were developed for each
experimental school. These were examined for similar data in each of the three
categories used for comparison. The two schools closest to the data of the
experimental school were selected to comprise the control group. Interestingly,
all of these schools were in close proximity to the experimental school to which
they were compared.
For example, School A is an experimental school. The ethnic breakdown
of the school is 60% African-American, 25% Hispanic, 12% Anglo, and 3%
other. The socioeconomic status makeup is 70% low socioeconomic status and
64
30% other socioeconomic status. The mean 1998 Iowa Test of Basic Skills
mathematics score was 50.5. Examination of the data school by school
revealed that the school most similar in data is School Y. The ethnic
breakdown of the school is 58% African-American, 26% Hispanic, 13% Anglo,
and 3% other. The socioeconomic status makeup is 68% low socioeconomic
status and 32% other socioeconomic status. The mean 1998 Iowa Test of Basic
Skills mathematics score is 50.8. School Z is also similar to School A. The
ethnic breakdown of the school is 62% African-American, 25% Hispanic, 11%
Anglo, and 2% other. The socioeconomic status makeup is 71% low
socioeconomic status and 29% other socioeconomic status. The mean 1998
Iowa Test of Basic Skills mathematics score is 49.9. Therefore, School A was
self-selected to be in the experimental group by the choice to use Everyday
Mathematics, and School Y and School Z are control group schools by the
matches in socioeconomic status, ethnic diversity, and prior mathematics
ability of their students.
The schools that were matched and selected to be in the control group
needed to be contacted to ensure that Everyday Mathematics was not used in the
classrooms for mathematics instruction. The principal of each school in the
control group was called and questioned about the mathematics curriculum
that was used for the 1998-99 school year. Three of the principals were new to
their school and consulted with the teachers who were present in the school
during the 1998-99 school year. All of the principals of the control group
65
schools reported that their school had not used Everyday Mathematics as a
mathematics curriculum.
A Texas Education Agency identification number identified each school
in the district. These identification numbers were submitted to the research
department for data on all of the third-, fourth-, and fifth-grade students
enrolled in the school for the entire 1998-99 school year. A total of 3,404
students was identified as third-, fourth-, and fifth-graders having been
enrolled for the entire school year 1998-99 in the 12 schools selected to be the
control group for this study.
Collection of Data
For the sake of this study, the control group was matched to the
experimental group by three items of data. Ethnic makeup, prior mathematics
ability, and socioeconomic status percentages were used to eliminate the
differences of these items as causes for variance in the outcome measure,
increasing the probability of identifying the effect of the Everyday Mathematics.
Matching Procedure
Ethnicity was used as a matching item of data because of differences in
scores on the Texas Assessment of Academic Skills. Anglos, African-Americans,
and Hispanics each have different levels of passing this standardized test
(Texas Education Agency, 1999b) Creating similar ratios of ethnicity in the
experimental and control groups, should limit ethnicity as a major determinate
of difference in the outcomes measure. In this study, using the ethnic
66
designations identified by the school district, five ethnic identities were cited:
Anglo, African-American, Hispanic, Native-American Indian, and Asian.
The second item of matching data was the 1998 Iowa Test of Basic
Skills mathematics score. This standardized test is given the 3rd week of April
to measure student achievement. The score is provided as raw score,
percentage rank, and a scaled score with a school year and month. This test is
used because third graders do not have previous Texas Assessment of Academic
Skills scores. The director of the research and evaluation department of the
district believed that the Iowa Test of Basic Skills is an adequate measure of
prior mathematics ability. By matching schools by these scores, the
experimental and control groups should have similar mathematics achievement
or ability at the beginning of the 1998-99 school year.
The third item of matching data was socioeconomic status. This status
was determined by one's qualification for the federal free or reduced lunch
program. Application to this program is voluntary and is made to the district.
The district, using government guidelines, assesses eligibility to receive either a
free school lunch or one at a reduced price. The factors in making the decision
are number of family members and total household income. For this study, if
student's qualified for the free or reduced-priced lunch program or were
automatically qualified because their parents or guardians receive Aid to
Families with Dependent Children, formerly known as welfare, they were
designated as low socioeconomic status. Otherwise students were designated as
other socioeconomic status. Socioeconomic status is seen as a major
67
determinate of difference in student achievement (Steinberg, 1996). Matching
the percentages of these two groups of students in both the experimental and
control groups, minimized this factor as a cause of any difference in the
outcome measurement in this study.
Student Data
Each school required that students return completed forms at the
beginning of each school year. The child's parent or guardian completed basic
information on an enrollment form and income and family composition
information on an application for participation in the free or reduced-price
lunch program. The school's computer records clerk then entered the
information on the school's database. This was then fed to the district's
database. All students were given a district identification number that
remained with them as long as they were enrolled in a district school.
Students were required to take two different standardized tests during
the school year. In April of each year, the Iowa Test of Basic Skills was
administered in every school in the district. At the end of April or early May of
each year, the state of Texas required that all students in the 3rd through the
10th grades take the Texas Assessment of Academic Skills. The results of these
standardized tests were reported to the district and recorded on the district
database.
By receiving approval to obtain information from the district's student
database, it was possible to retrieve all the necessary information for this
68
study. A request for information was submitted and approved. The list of
information for each student identification number included school code;
grade level; gender; socioeconomic status; the 1998 Iowa Test of Basic Skills
raw mathematics score and percentage rank mathematics score; the 1999 Texas
Assessment of Academic Skills scoring code, score on individual mathematics
objectives (13), and score percentage rank.
Final Data Set
With all of the data accumulated for the students whose identification
numbers were submitted to the district, additional work was necessary for the
final data set. First, the students needed to be designated as Everyday
Mathematics students or non-Everyday Mathematics students. A column of data
was established, and students were coded by the mathematics curriculum with
which they were taught.
Secondly, rather than analyzing the 1999 Texas Assessment of
Academic Skills scores by individual objective, domains that group several
objective were used. Most of the individual objectives contain four items on
the test. Each domain consists of four or five objectives. In order to do this, the
correct objectives were added together into the three domains: concepts,
operations and problem-solving. Three columns of data were established for
this purpose.
After completion of the necessary categories for data, the cases for the
study needed to be examined. Several of the cases, both in the experimental
69
and control group had incomplete data. Primarily, in the test scores, many
cases were missing either the Iowa Test of Basic Skills score or the 1999 Texas
Assessment of Academic Skills score. There were several reasons for missing
test scores. Most missing scores were the result of not having taken the tests.
Cases with incomplete data were eliminated from the study. This left 732 cases
in the experimental group and 2,704 cases in the control group.
Instrument to Analyze Data
All of the cases were imported into the Statistical Package of the Social
Sciences (SPSS) Base 9.0 computer program. According to the application
guide, "SPSS 9.0 is a comprehensive system for analyzing data. SPSS can take
data from almost any type of file and use them to generate tabulated reports,
charts, and plots of distributions and trends, descriptive statistics, and complex
statistical analyses" (SPSS, 1999, p. 3). All statistical analyses and descriptive
statistics were made with this computer program.
Generalizability
As stated previously, this is a self-selected study. All of the schools that
implemented the Everyday Mathematics curriculum did so by their own choice,
which limits the generalizability of this study. Although the schools in this
study compose approximately 15% of the elementary schools in the district
and almost 10% of the third-, fourth-, and fifth-grade students in the district,
they were not randomly selected. Therefore, although it is an important study,
it cannot be statistically generalized to the entire district student population.
70
Reliability and Validity Issues
The measure of outcome for this study is the 1999 Texas Assessment of
Academic Skills, a test designed for all public school students in Texas. This
test is mandated by the Texas legislature and was developed and administered
by the Texas Education Agency. From the beginning, the Texas Assessment of
Academic Skills was designed to assess higher-order thinking skills and
problem solving rather than minimum skills (Texas Education Agency, 1997b).
The Texas Education Agency has suggested at least five uses for the
Texas Assessment of Academic Skills. These are: "reporting results to parents of
an individual student; reporting results to the local school board, school
professionals, and the community; evaluating student scores for placement
decisions; evaluating programs, resources, and staffing patterns; and evaluating
district and campus curriculum and instruction" (Texas Education Agency,
1998a, pp. 36-37). The use of the Texas Assessment of Academic Skills in this
study falls within the suggested uses.
The Texas Education Agency reported that the Texas Assessment of
Academic Skills is a highly reliable test. Using the Kuder-Richardson method
the agency records a reliability range from .88 to .92, which is an indication of
an extremely reliable instrument (Texas Education Agency, 1998a).
The Texas Education Agency (1999c), in the TEA Technical Guide to
TAAS, reported on the validity of the instrument. The test is a
71
criterion-referenced assessment and is developed from the state-mandated
curriculum. This involved a lengthy review and evaluation process. The Texas
Education Agency claimed that the test is highly valid in regards to curriculum
content, essential elements, and subpopulation scoring. In regard to content
validity, the Texas Education Agency (1999c) stated the following:
Criterion-referenced assessments, such as the TAAS [TexasAssessment of Academic Skills] and end-of-course tests, are based on anextensive definition of the content they assess. TAAS and end-of-coursetest validity is, therefore, content-based and tied directly to thestatewide curriculum. As it has since the inception of TAAS and theend-of-course tests, the cycle of educator committee item review anddata review continued on new and field-tested items, respectively. Theitem writers as well as the reviewers for each stage of development verifythe alignment of test items with the objectives and measurementspecifications to ensure that the items measure appropriate content. Thesequential stages of item development and item review provide manyopportunities for Texas educators to offer suggestions for improving oreliminating items and to offer insights into the interpretation of thestatewide curriculum. The nature and specificity of these various reviewprocedures provide additional strong evidence for the content validity ofthe TAAS. Not only do Texas educators provide valued input on thecontent and the match between the items and the statewide curriculum,but many current and former Texas educators and some educators fromother states work as independent contractors to write items specificallyto measure the objectives and specifications. This provides for a systemof checks-and-balances for item development and review that reducessingle source bias. In other words, because test items are written bymany different people with different backgrounds, it is less likely thatitems will suffer from a bias that might occur if items were written by asingle author. The direct input from educators offers additional evidenceregarding the content validity of constructed TAAS. The staff at TEA[Texas Education Agency] as well as professional test developers fromHarcourt Brace Educational Measurement, National Computer Systems,and Measurement Incorporated provide a history of test buildingexperience, including content-related expertise. Each internal review ofan item by these experts increases the probability of the item being anaccurate measure of the intended objective. Hence, these reviews areoffered as additional evidence for the content validity of the TAAS andend-of-course tests. (pp. 62-63).
72
In reference to construct validity the Texas Education Agency (1999c)
noted:
Construct validity is the extent to which a test can be said to measure atheoretical construct or trait. In the case of TAAS [Texas Assessment ofAcademic Skills], the construct tested is the mastery of academiccontent required by the statewide curriculum. With curriculum-basedachievement tests such as the TAAS, both construct and contentvalidity are intertwined. The construct validity is grounded in thecontent validity of the test. (p. 67)
Another area of validity is criterion-related validity, which indicates the
relationship between test performance and performance on some other
measure. The Texas Education Agency (1998a) has correlated different levels
and content area tests with students' end-of-year scores and has an average of
0.52 positive statistic. The most recent study, which appears in 1998 Summary
of Student Performance Results (Texas Education Agency, 1998a), compares
students’ performance on the Grade 3 Texas Assessment of Academic Skills
reading test with their performance (pass/fail) in their Grade 3 reading course.
This study was conducted as a statewide random sample. This analysis showed
a strong correlation of 0.72, which indicates a relationship between the test
and the evaluations of students by their teachers (Texas Education Agency,
1998a). Overall, in content, construct, and criterion-related validity, the Texas
Education Agency has demonstrated an effort to test the ability of students
who have been taught by the statewide objectives, the Texas Essentials of
Knowledge and Skills.
73
This study attempted to identify and collect data on as many students
as possible who were taught by the Everyday Mathematics curriculum. Then a
control group was developed to closely match those students, but who were
taught through the use of the district-approved mathematics curriculum. Data
were gathered that could compare these two groups. The 1999 Texas
Assessment of Academic Skills mathematics score was used as the outcomes
measure. The result was a large set of data to determine whether the students
had different achievement gains.
74
CHAPTER 4
ANALYSIS OF DATA
The problem as previously stated for this study was to analyze the
student data of those children taught using the Everyday Mathematics program
and the data of children taught using the approved mathematics curriculum of
the school district. The problem was to determine whether or not the
implementation of a Standards-based curriculum could be used to predict a
difference in student achievement. The purpose of this study was to determine
the effects that the Everyday Mathematics curriculum had on student
achievement in a large North Texas urban school district.
Descriptive Analysis of the Experimentaland Control Groups
The analysis of these data began with a descriptive analysis of the two
groups. The experimental group was comprised of students who were, for the
entire 1998-99 school year, in classrooms in which the Everyday Mathematics
curriculum was implemented. The control group was comprised of students
who were, for the entire 1998-99 school year, in classrooms in which the
district approved curriculum was used.
The experimental group had 732 students and the control group had
2,704 students. The number of students who were taught using Everyday
Mathematics determined the number of students in the experimental group. A
75
total of 1,160 third-, fourth-, and fifth-grade students in a large North Texas
urban school district were taught using the Everyday Mathematics curriculum in
the 1998-99 school year. Six of seven schools using the curriculum were
included in the study. The seventh school, which did not participate, had 230
students who may have qualified. Students were eliminated because of
incomplete data or because the principal would not approve the study, leaving
a final number of 732 in the experimental group.
The number of students in the control group was determined by the
selection of schools, with similar student composition regarding ethnicity,
socioeconomic status, and prior mathematics ability. Some students were
eliminated from the study either because of incomplete data or because failure
to remain in the school for the entire school year. This left the number of
students at 2,704.
Comparison of Ethnicity
The ethnic designations for this large North Texas urban school district
are African-American, Hispanic, Native-American Indian, Asian, and Anglo.
The number of students in each of these ethnic designations and the
percentage of each group, those taught with Everyday Mathematics and those
taught with the district-approved curriculum (non-Everyday Mathematics) are
seen in Table 1 and Figure 1.
In comparison, the major ethnic groups were similar. The African-
American population made up the majority of both groups, with only a 1%
difference between the experimental and control group. The Anglo population
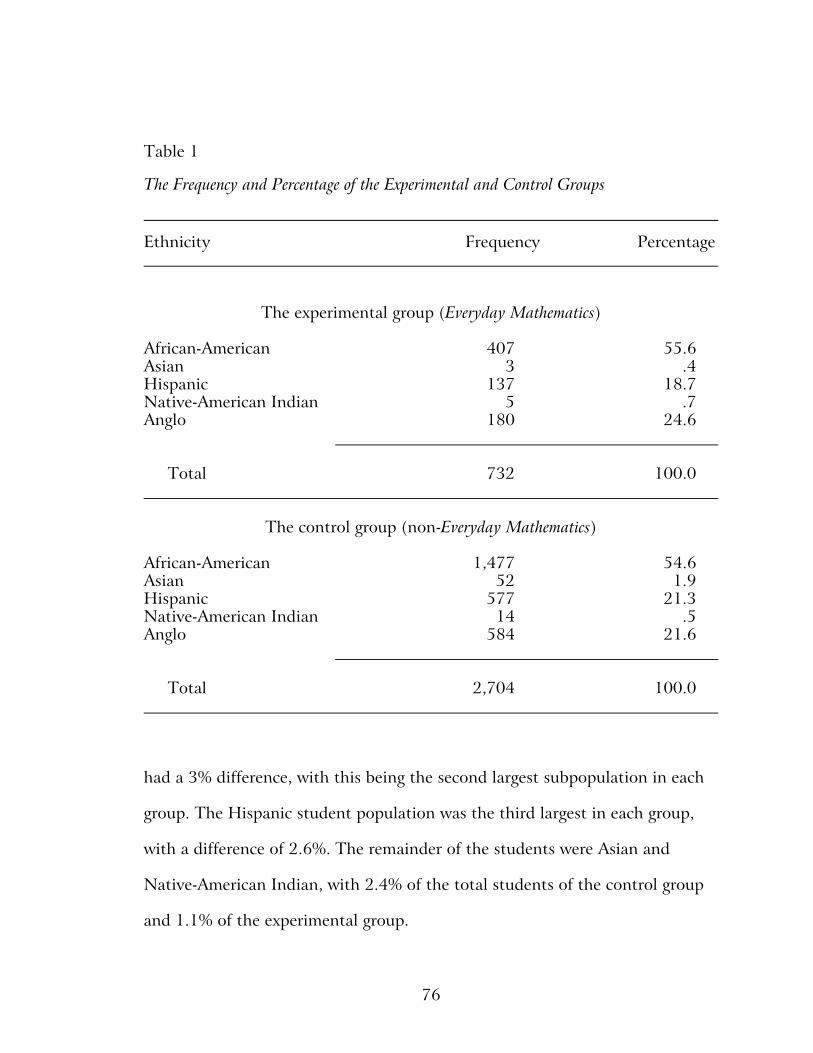
76
Table 1
The Frequency and Percentage of the Experimental and Control Groups
Ethnicity Frequency Percentage
The experimental group (Everyday Mathematics)
African-American 407 55.6Asian 3 .4Hispanic 137 18.7Native-American Indian 5 .7Anglo 180 24.6
Total 732 100.0
The control group (non-Everyday Mathematics)
African-American 1,477 54.6Asian 52 1.9Hispanic 577 21.3Native-American Indian 14 .5Anglo 584 21.6
Total 2,704 100.0
had a 3% difference, with this being the second largest subpopulation in each
group. The Hispanic student population was the third largest in each group,
with a difference of 2.6%. The remainder of the students were Asian and
Native-American Indian, with 2.4% of the total students of the control group
and 1.1% of the experimental group.
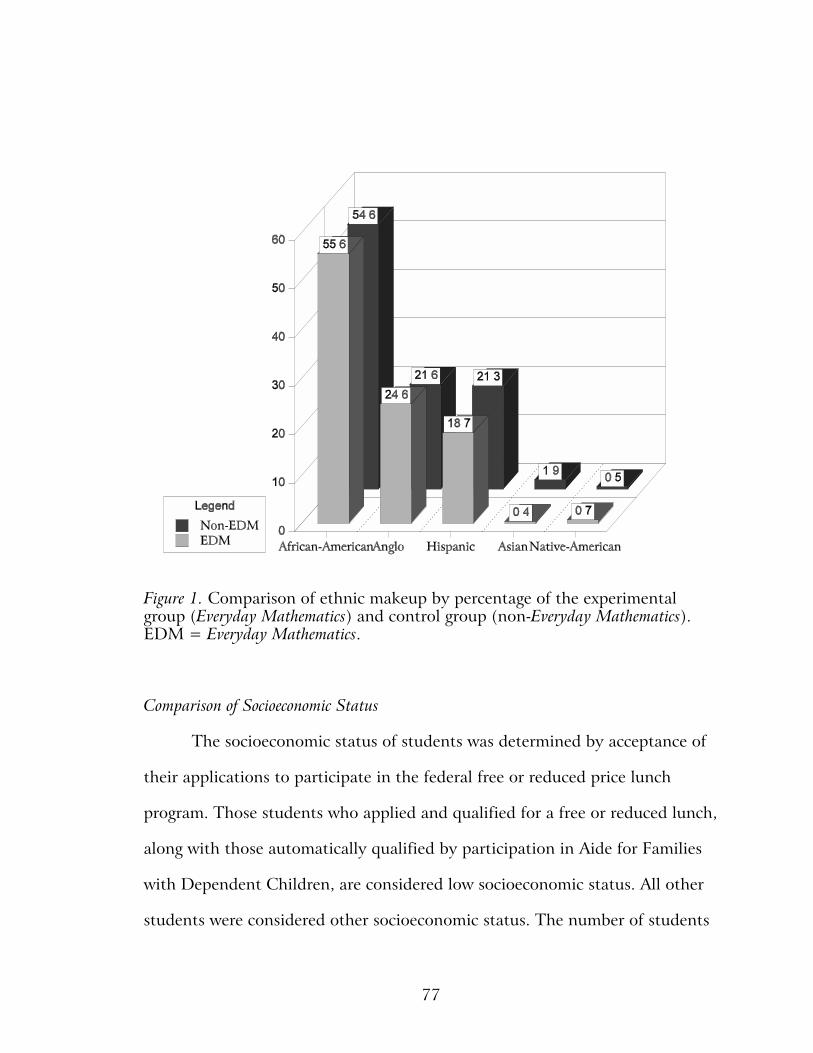
77
Figure 1. Comparison of ethnic makeup by percentage of the experimentalgroup (Everyday Mathematics) and control group (non-Everyday Mathematics).EDM = Everyday Mathematics.
Comparison of Socioeconomic Status
The socioeconomic status of students was determined by acceptance of
their applications to participate in the federal free or reduced price lunch
program. Those students who applied and qualified for a free or reduced lunch,
along with those automatically qualified by participation in Aide for Families
with Dependent Children, are considered low socioeconomic status. All other
students were considered other socioeconomic status. The number of students

78
in the experimental and control groups and percentages of the group by
socioeconomic designation is delineated in Table 2 and Figure 2. The numbers
shown in Table 2 delineate that the differences between the control and
experimental groups were less than 6% with both having about a two-to-one
ratio between the students of low and those of other socioeconomic status.
Table 2
The Number and Percentage Makeup of Socioeconomic Status Among the "EverydayMathematics" and Non-"Everyday Mathematics" Students
Socioeconomic status Frequency Percentage
The experimental group (Everyday Mathematics)
Low 463 63.3Other 269 36.7
Total 732 100.0
The control group (non-Everyday Mathematics)
Low 1,865 69.0Other 839 31.0
Total 2,704 100.0
Comparison of Gender
One might suppose that the gender comparisons would be negligible;
however, because it was a factor in the multiple regression model, it is
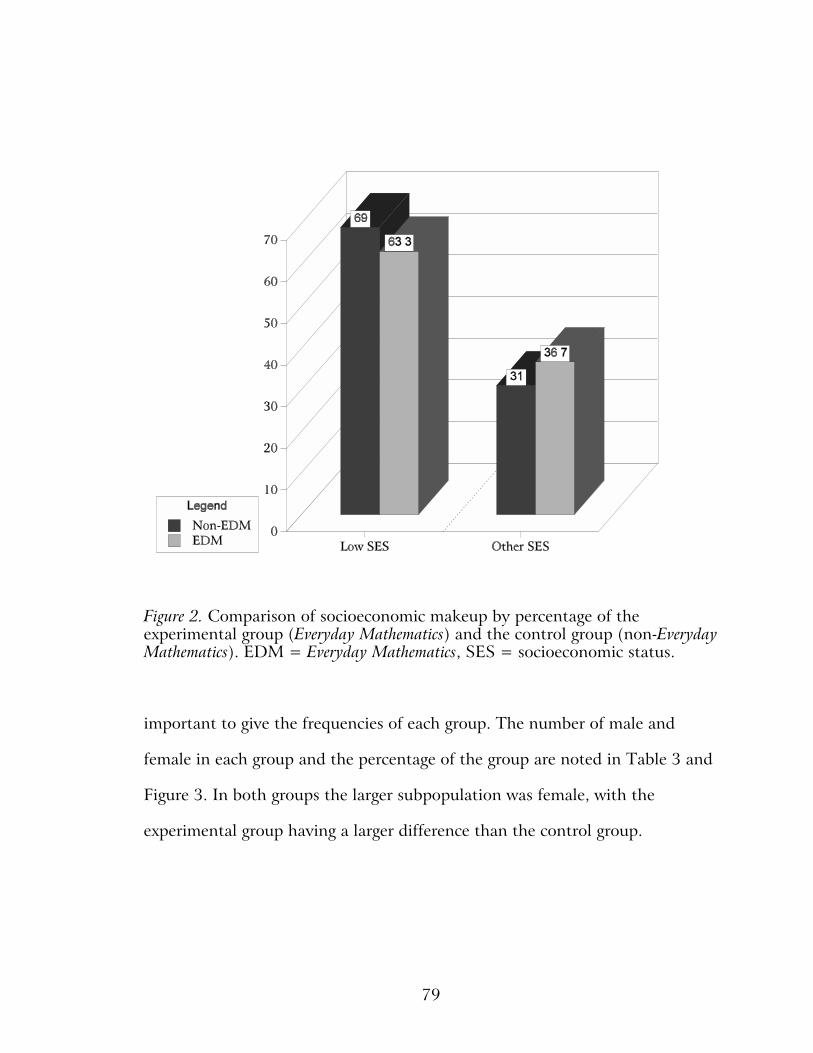
79
Figure 2. Comparison of socioeconomic makeup by percentage of theexperimental group (Everyday Mathematics) and the control group (non-EverydayMathematics). EDM = Everyday Mathematics, SES = socioeconomic status.
important to give the frequencies of each group. The number of male and
female in each group and the percentage of the group are noted in Table 3 and
Figure 3. In both groups the larger subpopulation was female, with the
experimental group having a larger difference than the control group.
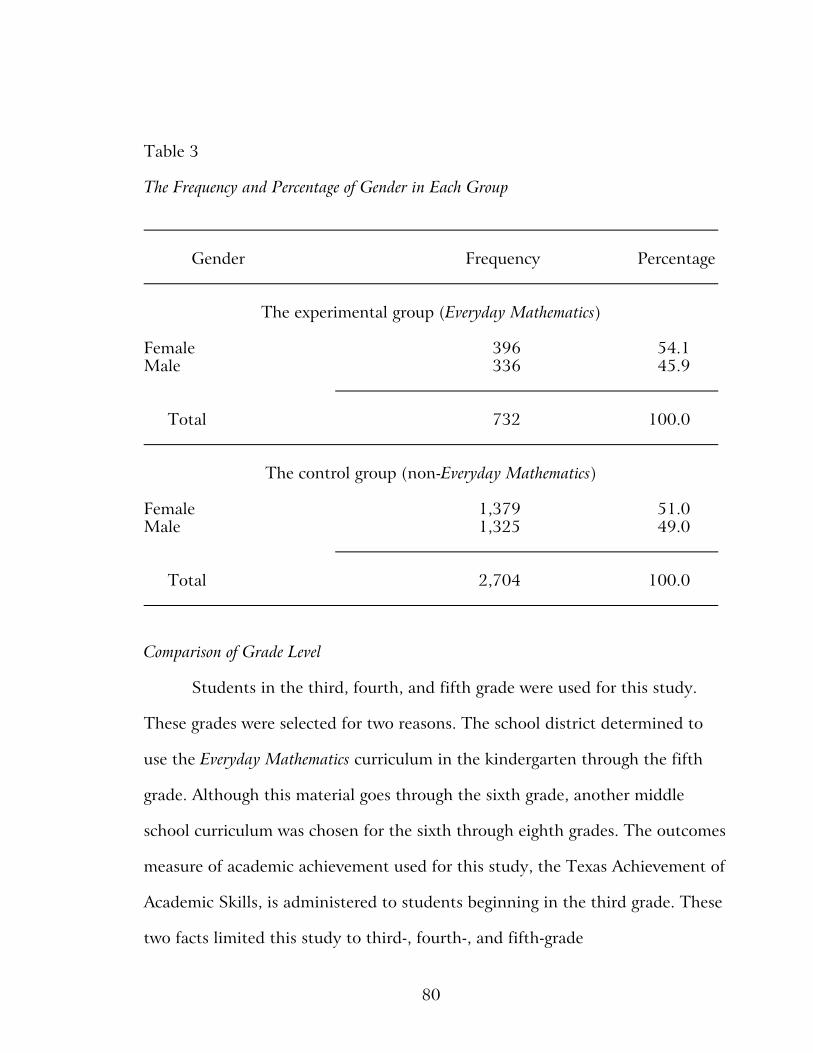
80
Table 3
The Frequency and Percentage of Gender in Each Group
Gender Frequency Percentage
The experimental group (Everyday Mathematics)
Female 396 54.1Male 336 45.9
Total 732 100.0
The control group (non-Everyday Mathematics)
Female 1,379 51.0Male 1,325 49.0
Total 2,704 100.0
Comparison of Grade Level
Students in the third, fourth, and fifth grade were used for this study.
These grades were selected for two reasons. The school district determined to
use the Everyday Mathematics curriculum in the kindergarten through the fifth
grade. Although this material goes through the sixth grade, another middle
school curriculum was chosen for the sixth through eighth grades. The outcomes
measure of academic achievement used for this study, the Texas Achievement of
Academic Skills, is administered to students beginning in the third grade. These
two facts limited this study to third-, fourth-, and fifth-grade

81
Figure 3. Comparison of gender makeup by percentage of the experimental(Everyday Mathematics) and the control group (non-Everyday Mathematics).EDM = Everyday Mathematics.
students. The number and the percentage of students in third, fourth, and fifth
grades in each of the groups is seen in Table 4 and Figure 4.
These numbers indicate some differences in the experimental (Everyday
Mathematics) and the control (non-Everyday Mathematics) groups. The
experimental group had 5.5% more third grade students than the control group.
A similar difference is seen in the fifth graders, with the experimental group
having 6.4% more than the control group. The fourth grade has the greatest
difference, with the control group having 11.9% more students than
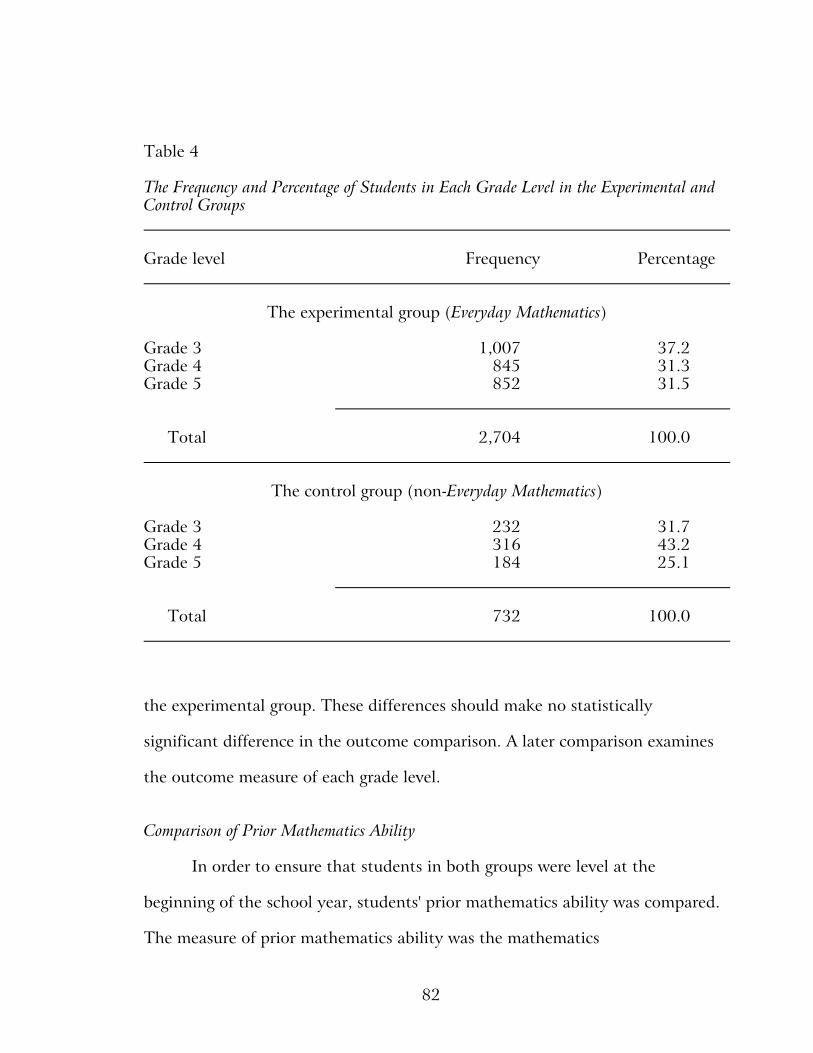
82
Table 4
The Frequency and Percentage of Students in Each Grade Level in the Experimental andControl Groups
Grade level Frequency Percentage
The experimental group (Everyday Mathematics)
Grade 3 1,007 37.2Grade 4 845 31.3Grade 5 852 31.5
Total 2,704 100.0
The control group (non-Everyday Mathematics)
Grade 3 232 31.7Grade 4 316 43.2Grade 5 184 25.1
Total 732 100.0
the experimental group. These differences should make no statistically
significant difference in the outcome comparison. A later comparison examines
the outcome measure of each grade level.
Comparison of Prior Mathematics Ability
In order to ensure that students in both groups were level at the
beginning of the school year, students' prior mathematics ability was compared.
The measure of prior mathematics ability was the mathematics
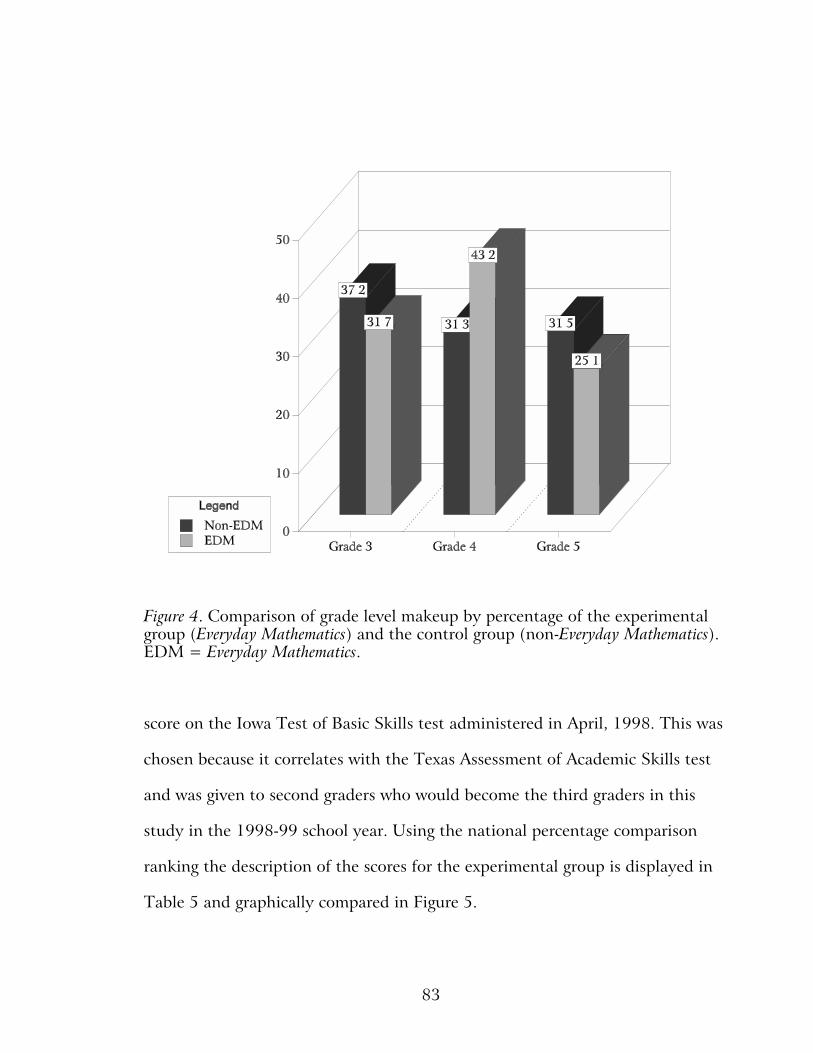
83
Figure 4. Comparison of grade level makeup by percentage of the experimentalgroup (Everyday Mathematics) and the control group (non-Everyday Mathematics).EDM = Everyday Mathematics.
score on the Iowa Test of Basic Skills test administered in April, 1998. This was
chosen because it correlates with the Texas Assessment of Academic Skills test
and was given to second graders who would become the third graders in this
study in the 1998-99 school year. Using the national percentage comparison
ranking the description of the scores for the experimental group is displayed in
Table 5 and graphically compared in Figure 5.
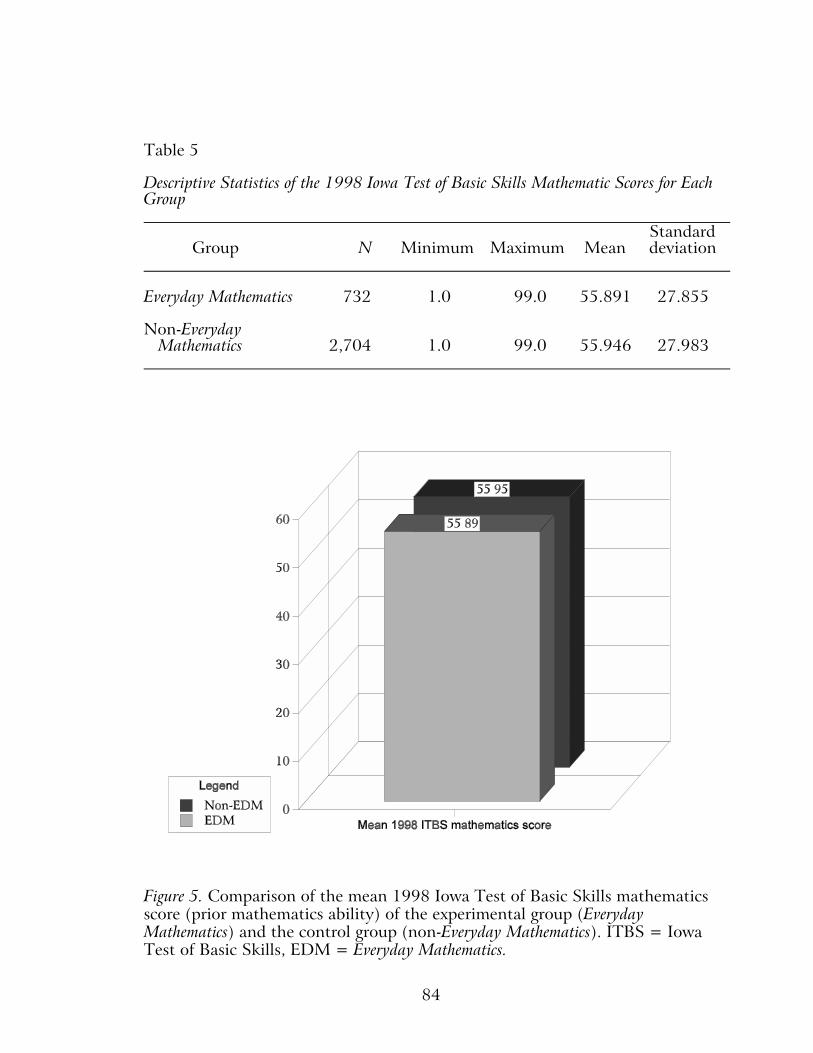
84
Table 5
Descriptive Statistics of the 1998 Iowa Test of Basic Skills Mathematic Scores for EachGroup
StandardGroup N Minimum Maximum Mean deviation
Everyday Mathematics 732 1.0 99.0 55.891 27.855
Non-Everyday Mathematics 2,704 1.0 99.0 55.946 27.983
Figure 5. Comparison of the mean 1998 Iowa Test of Basic Skills mathematicsscore (prior mathematics ability) of the experimental group (EverydayMathematics) and the control group (non-Everyday Mathematics). ITBS = IowaTest of Basic Skills, EDM = Everyday Mathematics.
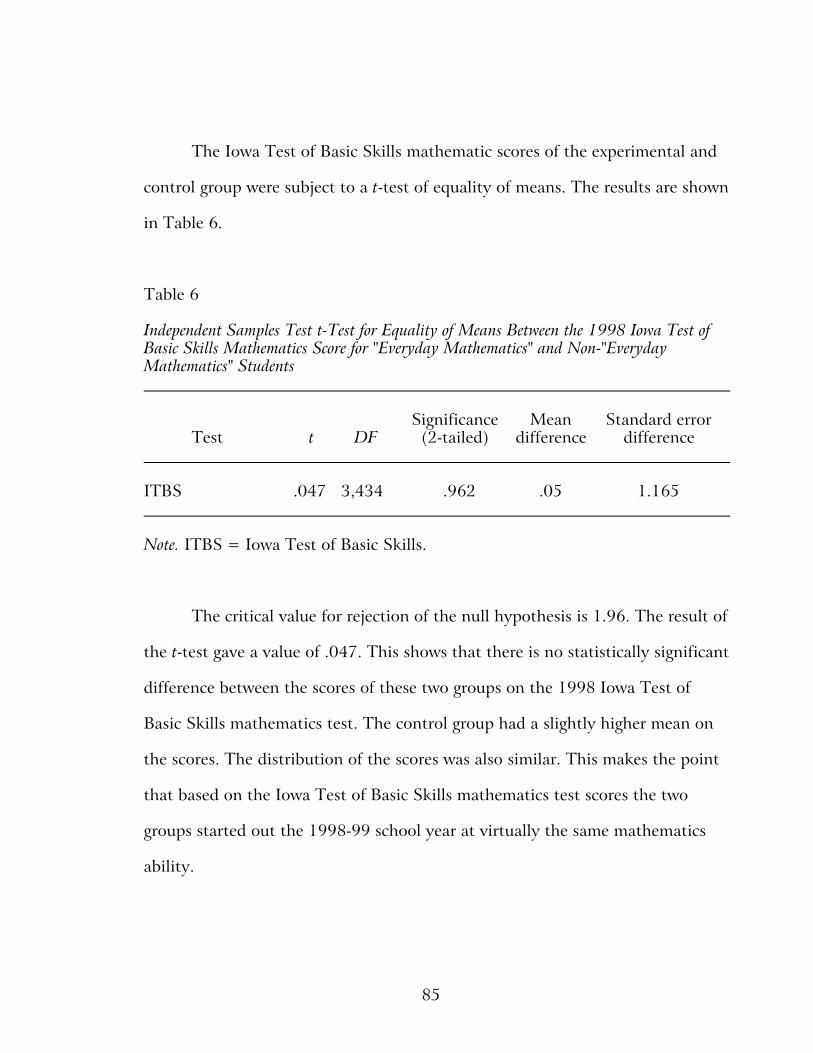
85
The Iowa Test of Basic Skills mathematic scores of the experimental and
control group were subject to a t-test of equality of means. The results are shown
in Table 6.
Table 6
Independent Samples Test t-Test for Equality of Means Between the 1998 Iowa Test ofBasic Skills Mathematics Score for "Everyday Mathematics" and Non-"EverydayMathematics" Students
Significance Mean Standard errorTest t DF (2-tailed) difference difference
ITBS .047 3,434 .962 .05 1.165
Note. ITBS = Iowa Test of Basic Skills.
The critical value for rejection of the null hypothesis is 1.96. The result of
the t-test gave a value of .047. This shows that there is no statistically significant
difference between the scores of these two groups on the 1998 Iowa Test of
Basic Skills mathematics test. The control group had a slightly higher mean on
the scores. The distribution of the scores was also similar. This makes the point
that based on the Iowa Test of Basic Skills mathematics test scores the two
groups started out the 1998-99 school year at virtually the same mathematics
ability.
86
Summary of the Description of the Experimental and Control Groups
The statistical description of the groups in this study shows that they are
similar in every category considered. They are almost identical in prior
mathematics ability, a critical category in comparing the increase in mathematics
achievement.
Research Question 1
The first research question in this study is as follows:
Are there significant differences between the mathematics scores on the
Texas Assessment of Academic Skills of students who have been taught using
the Everyday Mathematics curriculum and those of students taught using the
approved curriculum in this North Texas urban school district?
The hypothesis for this question, as previously stated, is as follows:
There is no significant difference in mathematic scores on the Texas
Assessment of Academic Skills of students taught using Everyday Mathematics and
mathematic scores on the Texas Assessment of Academic Skills of students
taught using the district-approved mathematics curriculum.
This requires a two-tailed t-test. The critical value for t at the .05 level of
significance is 1.960, and at the highest or most conservative level of
significance, the .001 level, the critical value for t is 3.291. The hypothesis is:
Ho: t < 1.960, !.05, Ho: t < 3.291, !.001. In other words, in order to accept the
null hypothesis that the 1999 Texas Assessment of Academic Skills mathematic
test scores of Everyday Mathematics students will not be significantly different
from the non-Everyday Mathematics students is a result of something other than
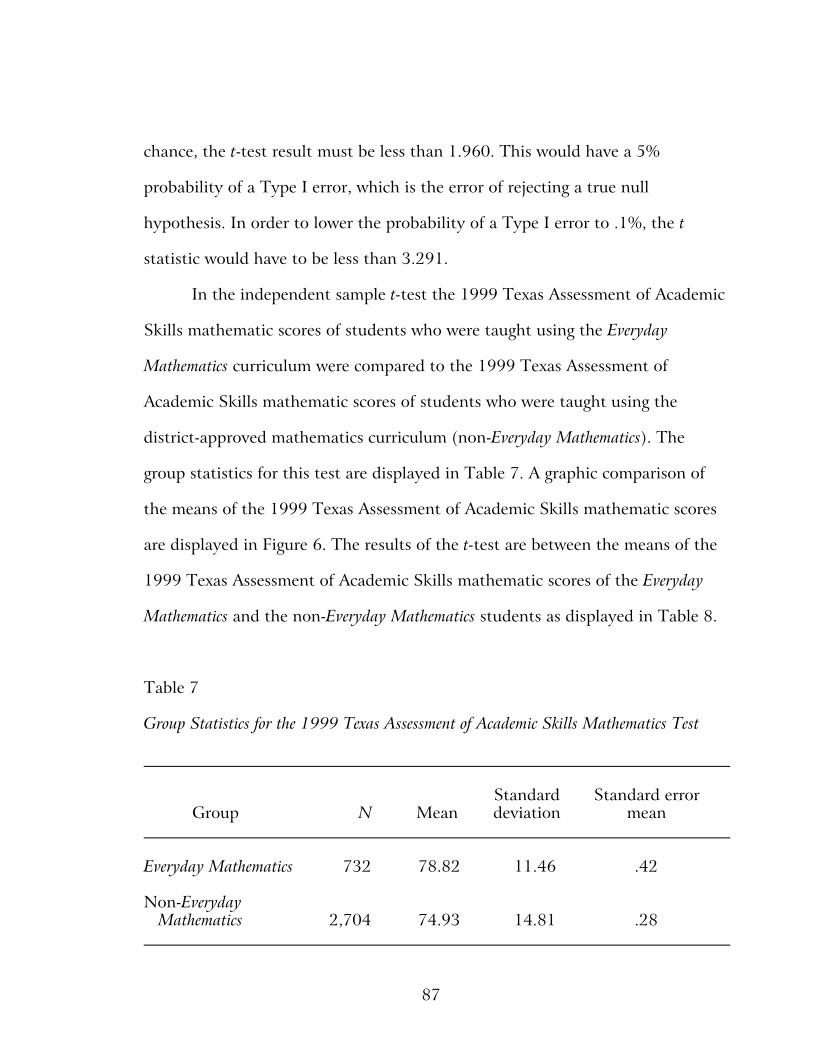
87
chance, the t-test result must be less than 1.960. This would have a 5%
probability of a Type I error, which is the error of rejecting a true null
hypothesis. In order to lower the probability of a Type I error to .1%, the t
statistic would have to be less than 3.291.
In the independent sample t-test the 1999 Texas Assessment of Academic
Skills mathematic scores of students who were taught using the Everyday
Mathematics curriculum were compared to the 1999 Texas Assessment of
Academic Skills mathematic scores of students who were taught using the
district-approved mathematics curriculum (non-Everyday Mathematics). The
group statistics for this test are displayed in Table 7. A graphic comparison of
the means of the 1999 Texas Assessment of Academic Skills mathematic scores
are displayed in Figure 6. The results of the t-test are between the means of the
1999 Texas Assessment of Academic Skills mathematic scores of the Everyday
Mathematics and the non-Everyday Mathematics students as displayed in Table 8.
Table 7
Group Statistics for the 1999 Texas Assessment of Academic Skills Mathematics Test
Standard Standard errorGroup N Mean deviation mean
Everyday Mathematics 732 78.82 11.46 .42
Non-Everyday Mathematics 2,704 74.93 14.81 .28
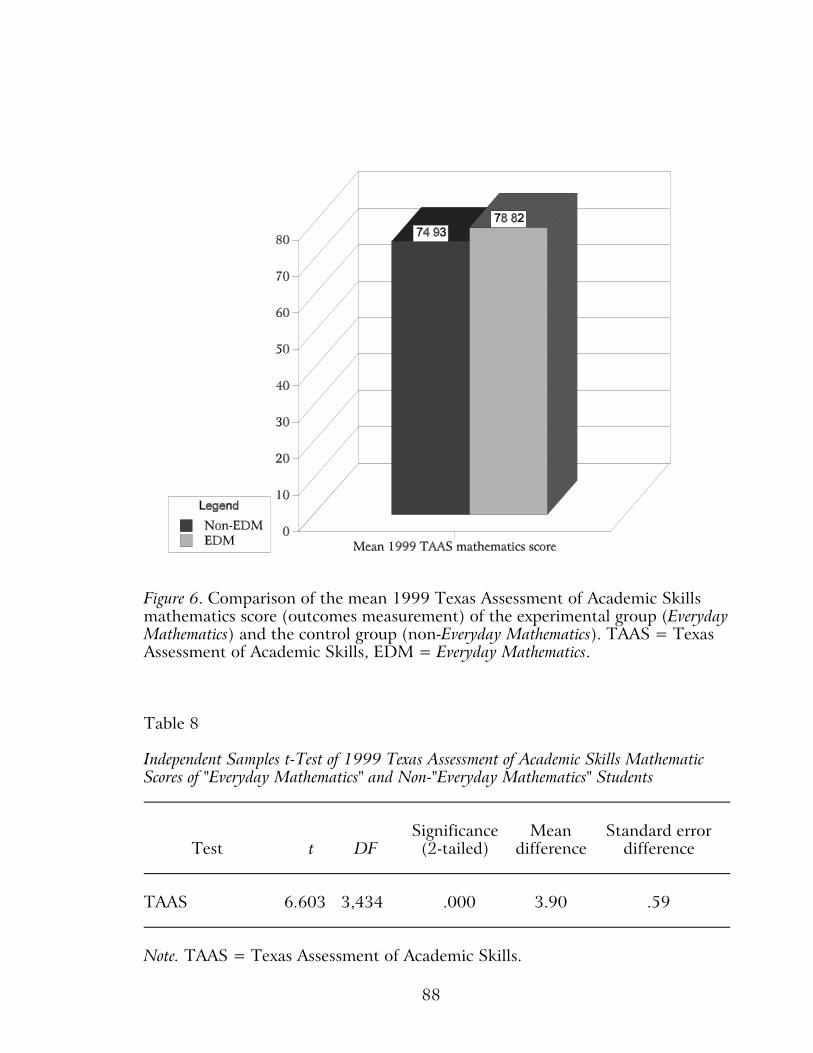
88
Figure 6. Comparison of the mean 1999 Texas Assessment of Academic Skillsmathematics score (outcomes measurement) of the experimental group (EverydayMathematics) and the control group (non-Everyday Mathematics). TAAS = TexasAssessment of Academic Skills, EDM = Everyday Mathematics.
Table 8
Independent Samples t-Test of 1999 Texas Assessment of Academic Skills MathematicScores of "Everyday Mathematics" and Non-"Everyday Mathematics" Students
Significance Mean Standard errorTest t DF (2-tailed) difference difference
TAAS 6.603 3,434 .000 3.90 .59
Note. TAAS = Texas Assessment of Academic Skills.
89
According to this test the hypothesis H0 is rejected and at the most
conservative level of significance. There are statistically significant differences in
the Texas Assessment of Academic Skills mathematic scores of the two groups
that are attributable to something other than chance.
Research Question 2
The second research question is as follows:
Are there significant differences in the mathematics scores on the Texas
Assessment of Academic Skills when groups (Everyday Mathematics students vs.
non-Everyday Mathematics students) are examined with regard to ethnicity,
gender, socioeconomic status, and grade level?
The proposed hypothesis for this question is as follows:
There will be no significant difference between the 1999 Texas
Assessment of Academic Skills mathematic scores of students taught with the
Everyday Mathematics curriculum and the 1999 Texas Assessment of Academic
Skills mathematic scores of students taught using the district-approved
mathematics curriculum when groups are broken down by ethnicity, gender,
socioeconomic status, and grade level.
In order to test for this hypothesis, several two-tailed t-tests were
conducted. The first of these was a t-test of equality of means, an independent
sample test of the means of the Texas Assessment of Academic Skills
mathematic scores between ethnically similar students in Everyday Mathematics
classes and ethnically similar students in classes taught by the district-approved
mathematics curriculum (non-Everyday Mathematics).
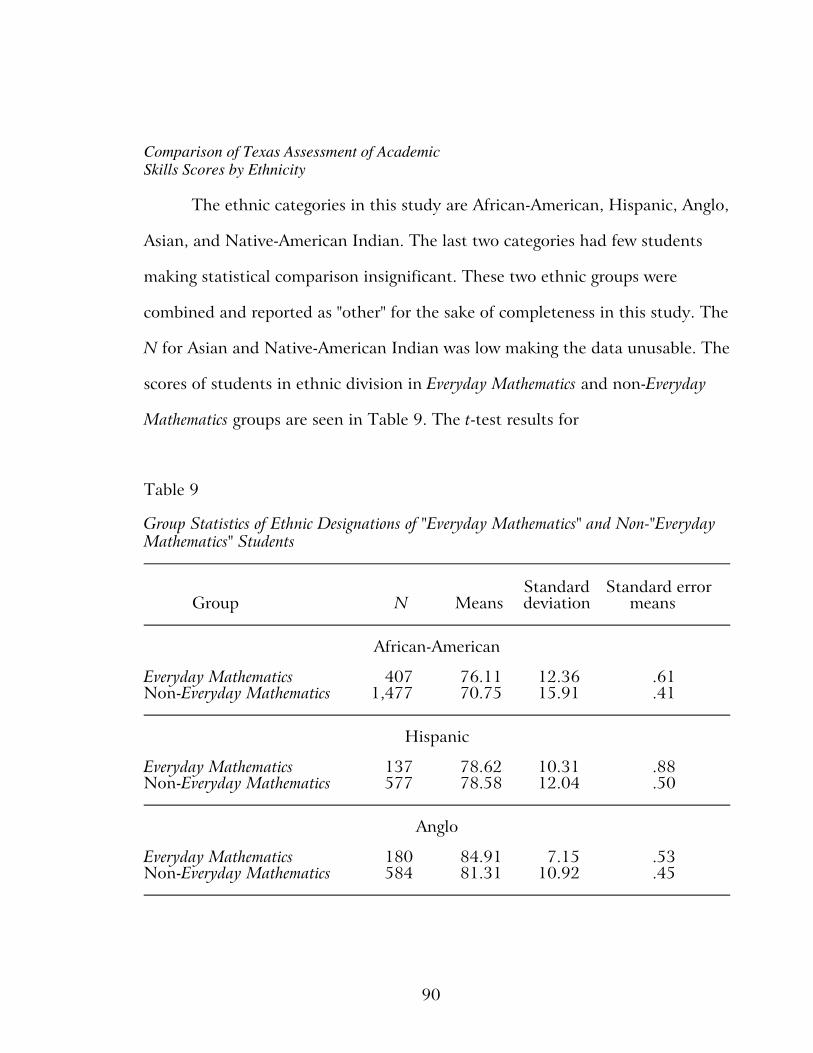
90
Comparison of Texas Assessment of Academic Skills Scores by Ethnicity
The ethnic categories in this study are African-American, Hispanic, Anglo,
Asian, and Native-American Indian. The last two categories had few students
making statistical comparison insignificant. These two ethnic groups were
combined and reported as "other" for the sake of completeness in this study. The
N for Asian and Native-American Indian was low making the data unusable. The
scores of students in ethnic division in Everyday Mathematics and non-Everyday
Mathematics groups are seen in Table 9. The t-test results for
Table 9
Group Statistics of Ethnic Designations of "Everyday Mathematics" and Non-"EverydayMathematics" Students
Standard Standard errorGroup N Means deviation means
African-American
Everyday Mathematics 407 76.11 12.36 .61Non-Everyday Mathematics 1,477 70.75 15.91 .41
Hispanic
Everyday Mathematics 137 78.62 10.31 .88Non-Everyday Mathematics 577 78.58 12.04 .50
Anglo
Everyday Mathematics 180 84.91 7.15 .53Non-Everyday Mathematics 584 81.31 10.92 .45
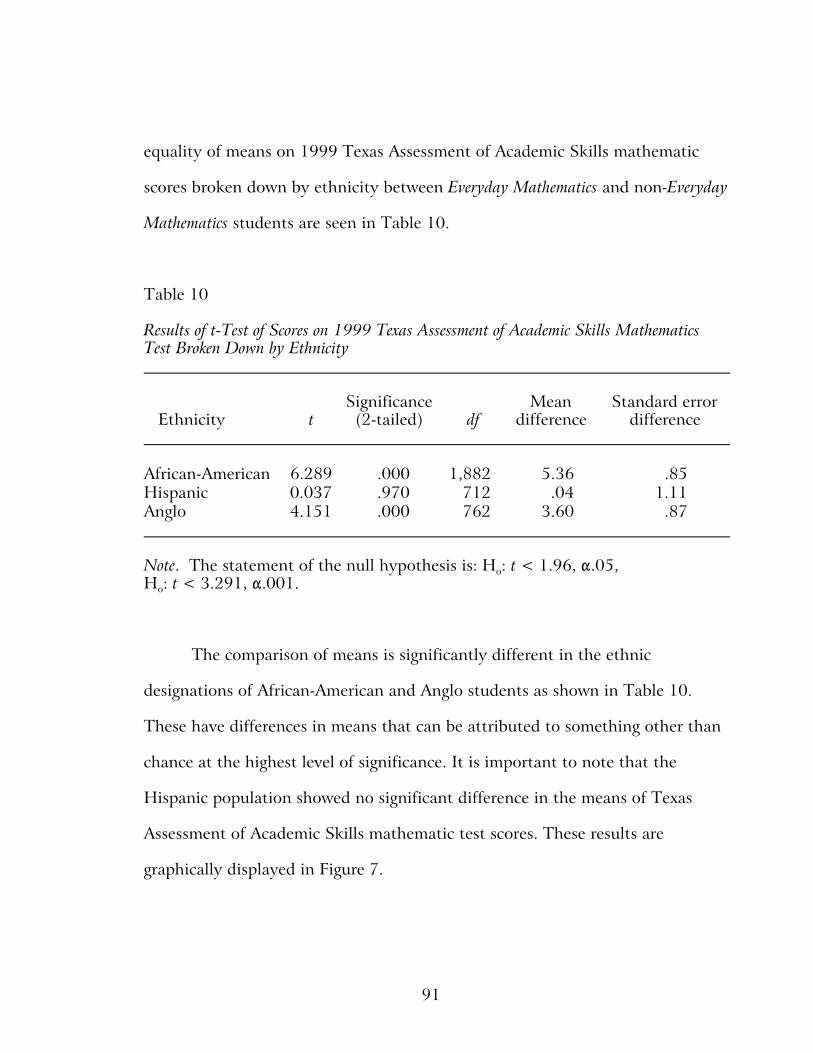
91
equality of means on 1999 Texas Assessment of Academic Skills mathematic
scores broken down by ethnicity between Everyday Mathematics and non-Everyday
Mathematics students are seen in Table 10.
Table 10
Results of t-Test of Scores on 1999 Texas Assessment of Academic Skills MathematicsTest Broken Down by Ethnicity
Significance Mean Standard errorEthnicity t (2-tailed) df difference difference
African-American 6.289 .000 1,882 5.36 .85Hispanic 0.037 .970 712 .04 1.11Anglo 4.151 .000 762 3.60 .87
Note. The statement of the null hypothesis is: Ho: t < 1.96, !.05, Ho: t < 3.291, !.001.
The comparison of means is significantly different in the ethnic
designations of African-American and Anglo students as shown in Table 10.
These have differences in means that can be attributed to something other than
chance at the highest level of significance. It is important to note that the
Hispanic population showed no significant difference in the means of Texas
Assessment of Academic Skills mathematic test scores. These results are
graphically displayed in Figure 7.
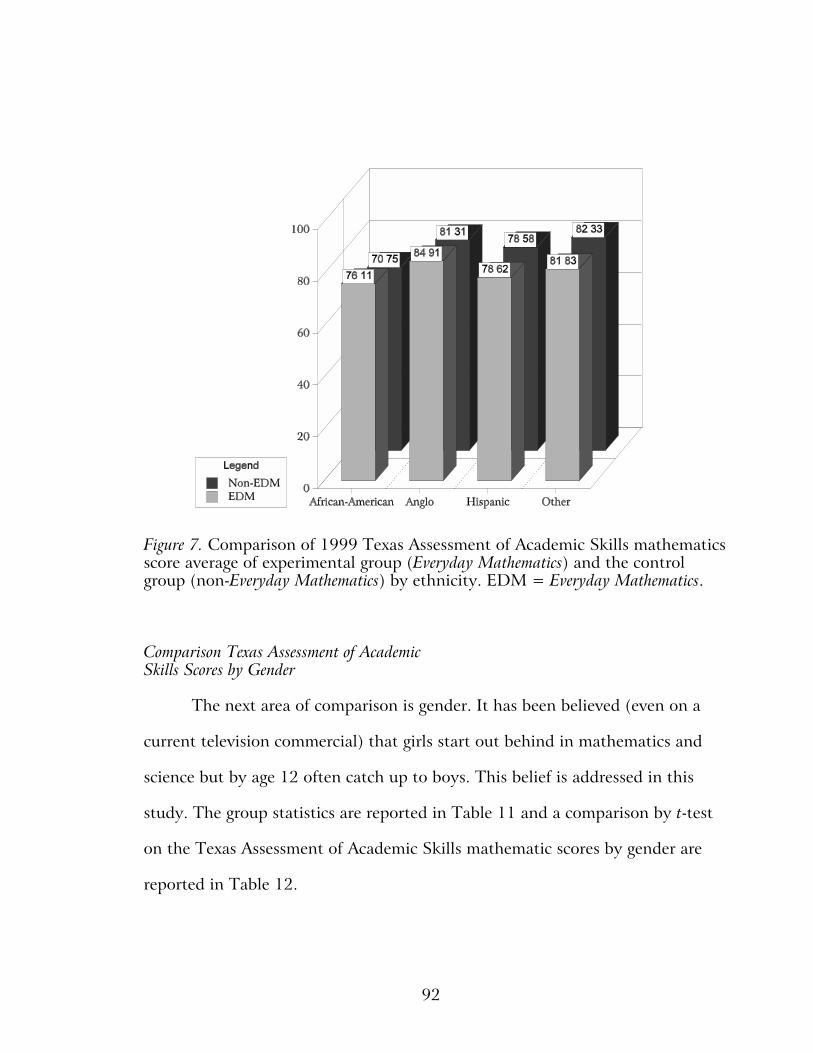
92
Figure 7. Comparison of 1999 Texas Assessment of Academic Skills mathematicsscore average of experimental group (Everyday Mathematics) and the controlgroup (non-Everyday Mathematics) by ethnicity. EDM = Everyday Mathematics.
Comparison Texas Assessment of Academic Skills Scores by Gender
The next area of comparison is gender. It has been believed (even on a
current television commercial) that girls start out behind in mathematics and
science but by age 12 often catch up to boys. This belief is addressed in this
study. The group statistics are reported in Table 11 and a comparison by t-test
on the Texas Assessment of Academic Skills mathematic scores by gender are
reported in Table 12.

93
Table 11
Group Statistics by Gender of "Everyday Mathematics" and Non-"EverydayMathematics" Students’ 1999 Texas Assessment of Academic Skills Mathematic Scores
Standard Standard errorGroup N Means deviation means
Females
Everyday Mathematics 396 78.92 11.11 .56Non-Everyday Mathematics 1,379 75.57 14.14 .38
Total 1,775 76.32 13.59 .32
Males
Everyday Mathematics 336 78.71 11.88 .65Non-Everyday Mathematics 1,325 74.26 15.47 .42
Total 1,661 75.16 14.91 .37
Three t-tests were conducted to determine if there were any significant
differences. One was run between scores of the Everyday Mathematics and
non-Everyday Mathematics female students. A second was run between the scores
of the Everyday Mathematics and non-Everyday Mathematics male students. A third
was run between the scores of all female students (both Everyday Mathematics
and non-Everyday Mathematics) and all male students. The results of these t-tests
are detailed in Table 12.
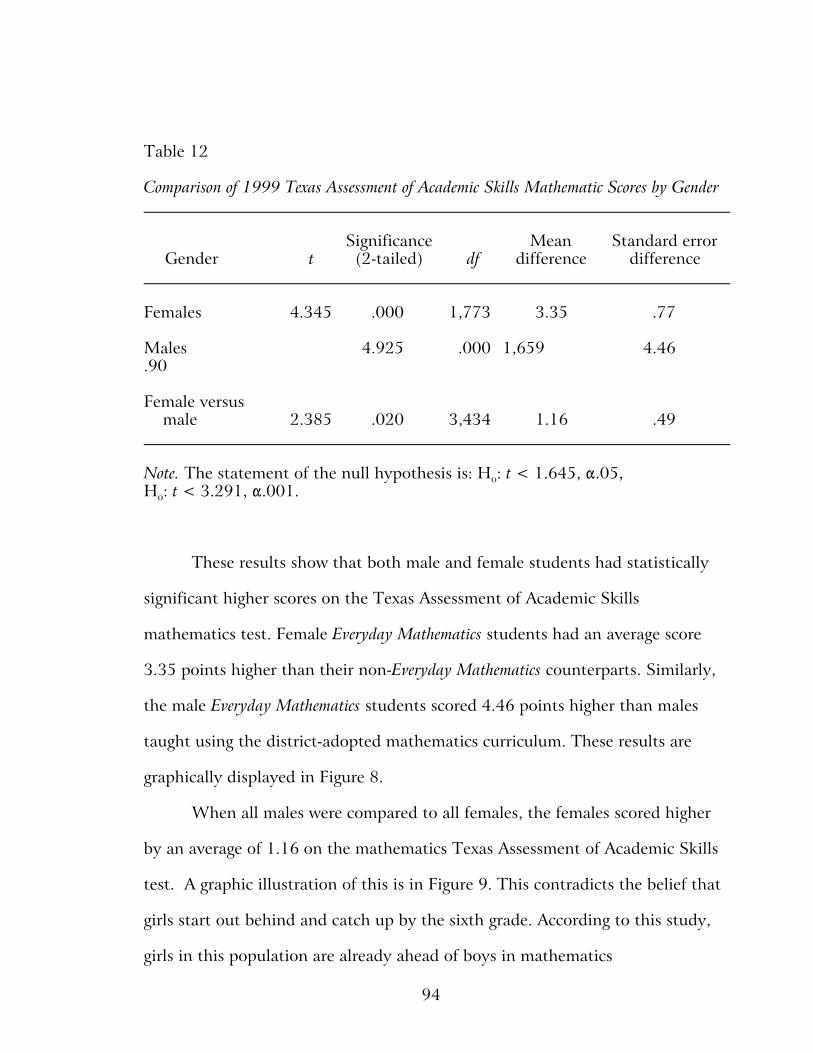
94
Table 12
Comparison of 1999 Texas Assessment of Academic Skills Mathematic Scores by Gender
Significance Mean Standard errorGender t (2-tailed) df difference difference
Females 4.345 .000 1,773 3.35 .77
Males 4.925 .000 1,659 4.46.90
Female versus male 2.385 .020 3,434 1.16 .49
Note. The statement of the null hypothesis is: Ho: t < 1.645, !.05, Ho: t < 3.291, !.001.
These results show that both male and female students had statistically
significant higher scores on the Texas Assessment of Academic Skills
mathematics test. Female Everyday Mathematics students had an average score
3.35 points higher than their non-Everyday Mathematics counterparts. Similarly,
the male Everyday Mathematics students scored 4.46 points higher than males
taught using the district-adopted mathematics curriculum. These results are
graphically displayed in Figure 8.
When all males were compared to all females, the females scored higher
by an average of 1.16 on the mathematics Texas Assessment of Academic Skills
test. A graphic illustration of this is in Figure 9. This contradicts the belief that
girls start out behind and catch up by the sixth grade. According to this study,
girls in this population are already ahead of boys in mathematics
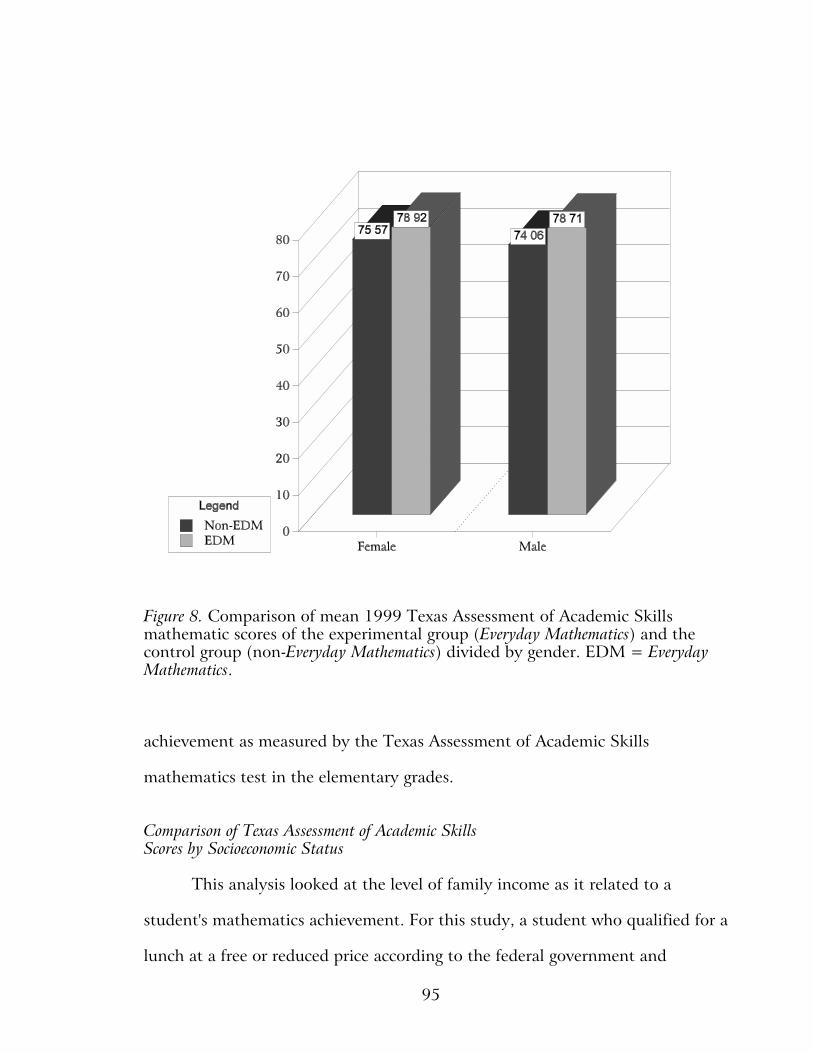
95
Figure 8. Comparison of mean 1999 Texas Assessment of Academic Skillsmathematic scores of the experimental group (Everyday Mathematics) and thecontrol group (non-Everyday Mathematics) divided by gender. EDM = EverydayMathematics.
achievement as measured by the Texas Assessment of Academic Skills
mathematics test in the elementary grades.
Comparison of Texas Assessment of Academic Skills Scores by Socioeconomic Status
This analysis looked at the level of family income as it related to a
student's mathematics achievement. For this study, a student who qualified for a
lunch at a free or reduced price according to the federal government and
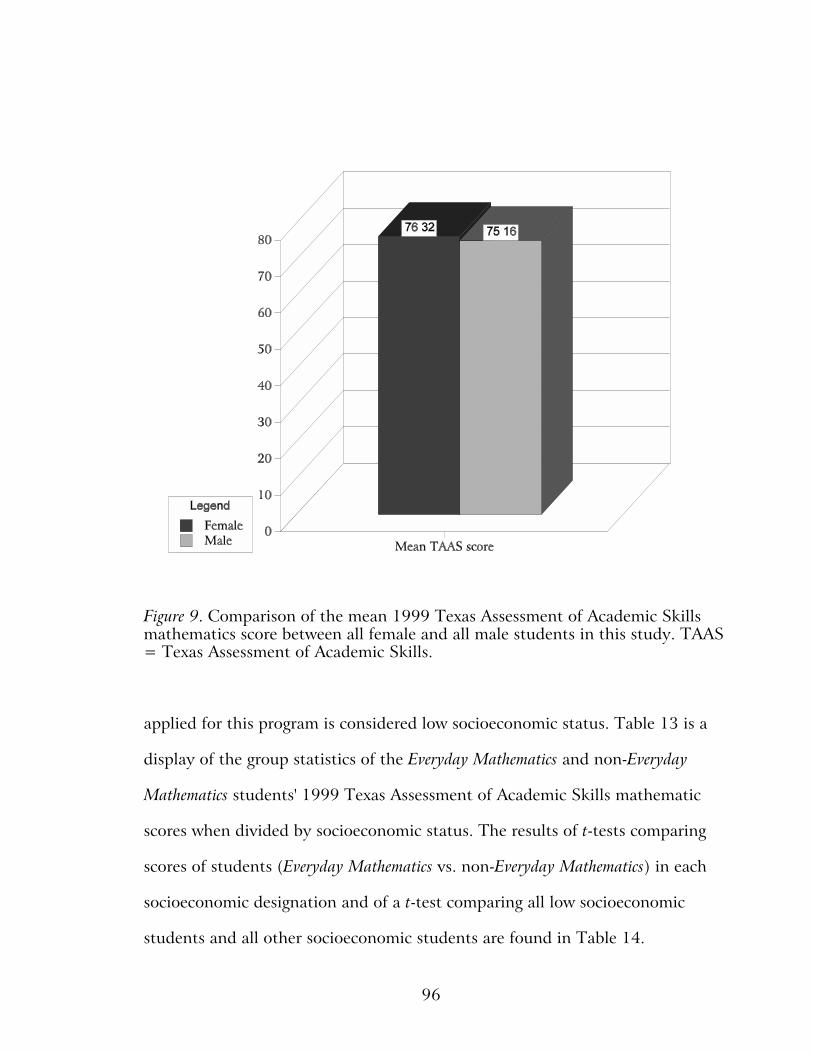
96
Figure 9. Comparison of the mean 1999 Texas Assessment of Academic Skillsmathematics score between all female and all male students in this study. TAAS= Texas Assessment of Academic Skills.
applied for this program is considered low socioeconomic status. Table 13 is a
display of the group statistics of the Everyday Mathematics and non-Everyday
Mathematics students' 1999 Texas Assessment of Academic Skills mathematic
scores when divided by socioeconomic status. The results of t-tests comparing
scores of students (Everyday Mathematics vs. non-Everyday Mathematics) in each
socioeconomic designation and of a t-test comparing all low socioeconomic
students and all other socioeconomic students are found in Table 14.
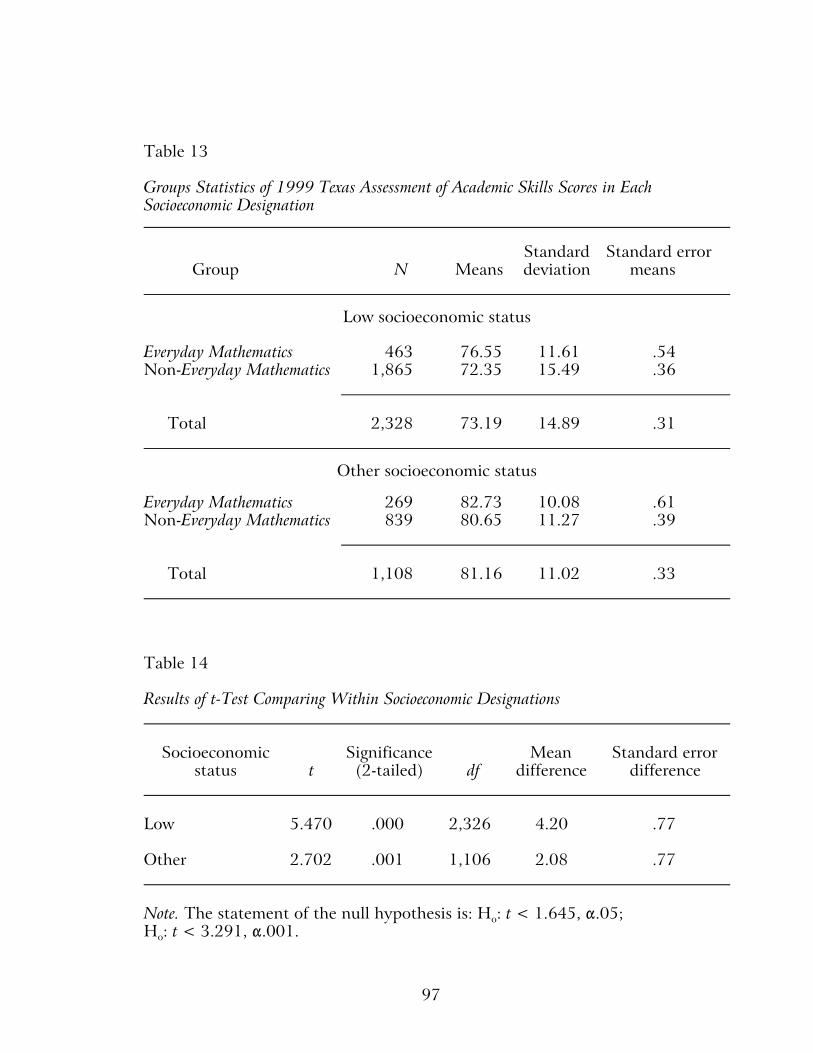
97
Table 13
Groups Statistics of 1999 Texas Assessment of Academic Skills Scores in EachSocioeconomic Designation
Standard Standard errorGroup N Means deviation means
Low socioeconomic status
Everyday Mathematics 463 76.55 11.61 .54Non-Everyday Mathematics 1,865 72.35 15.49 .36
Total 2,328 73.19 14.89 .31
Other socioeconomic status
Everyday Mathematics 269 82.73 10.08 .61Non-Everyday Mathematics 839 80.65 11.27 .39
Total 1,108 81.16 11.02 .33
Table 14
Results of t-Test Comparing Within Socioeconomic Designations
Socioeconomic Significance Mean Standard errorstatus t (2-tailed) df difference difference
Low 5.470 .000 2,326 4.20 .77
Other 2.702 .001 1,106 2.08 .77
Note. The statement of the null hypothesis is: Ho: t < 1.645, !.05; Ho: t < 3.291, !.001.
98
These results show that the differences in the scores on the mathematics
test of the Texas Assessment of Academic Skills of low socioeconomic students
who were taught using the Everyday Mathematics program were significantly
higher, in statistical terms, than those of students of similar economic status but
who were taught using the district-approved mathematics curriculum. The
difference in the average in the Texas Assessment of Academic Skills mathematic
scores of these two groups was 4.2 points. Also, a difference existed in the
experimental group and the control group of other socioeconomic status
students. The difference in their mean scores was 2.08 points. A graphic
illustration of this is seen in Figure 10.
Comparison of Texas Assessment of Academic Skills Scores by Grade Level
The two groups, Everyday Mathematics and non-Everyday Mathematics, were
divided into the third-, fourth-, and fifth-grade students. A two-tailed t-test was
run on the Texas Assessment of Academic Skills mathematic scores between
experimental and control groups in each grade level. The descriptive statistics of
the scores on the 1999 Texas Assessment of Academic Skills mathematics test
when examined by grade level are found in Table 15. The
results of the t-tests comparing the Everyday Mathematics students and the
non-Everyday Mathematics students in each grade level are found in Table 16.
The results of this analysis show that in each level (third, fourth, and fifth
grade) there were statistically significant differences in the average Texas
Assessment of Academic Skills mathematic scores of the Everyday Mathematics
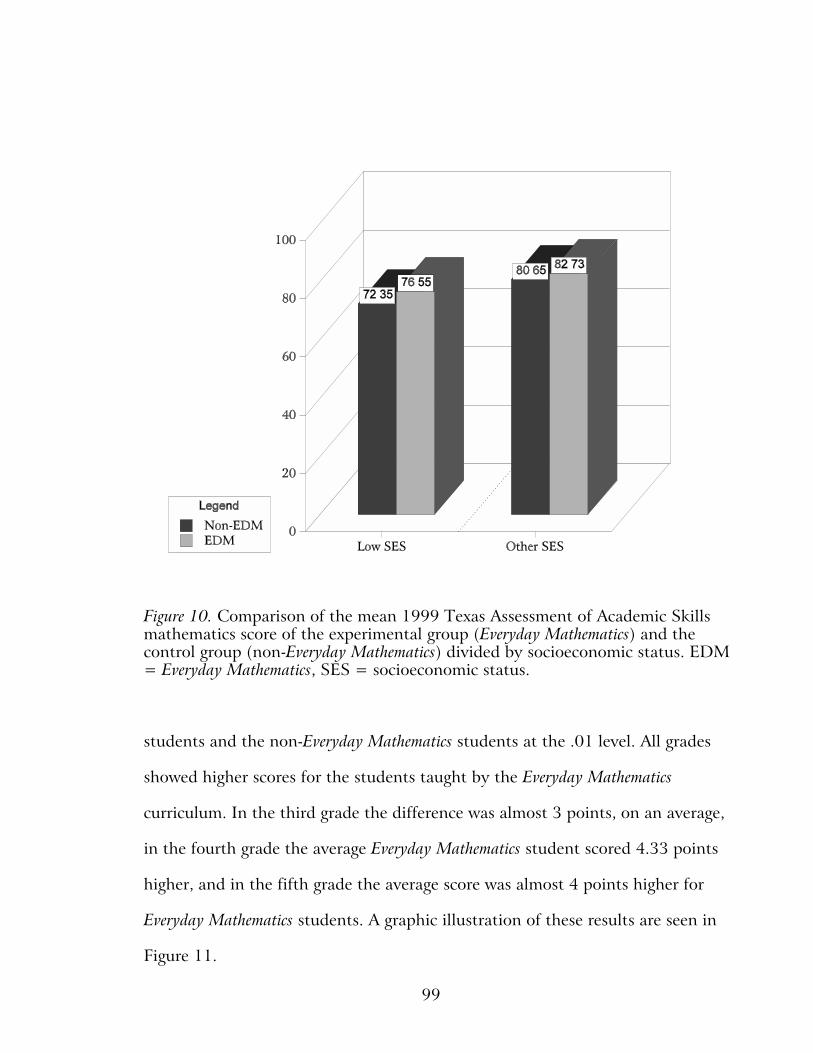
99
Figure 10. Comparison of the mean 1999 Texas Assessment of Academic Skillsmathematics score of the experimental group (Everyday Mathematics) and thecontrol group (non-Everyday Mathematics) divided by socioeconomic status. EDM= Everyday Mathematics, SES = socioeconomic status.
students and the non-Everyday Mathematics students at the .01 level. All grades
showed higher scores for the students taught by the Everyday Mathematics
curriculum. In the third grade the difference was almost 3 points, on an average,
in the fourth grade the average Everyday Mathematics student scored 4.33 points
higher, and in the fifth grade the average score was almost 4 points higher for
Everyday Mathematics students. A graphic illustration of these results are seen in
Figure 11.
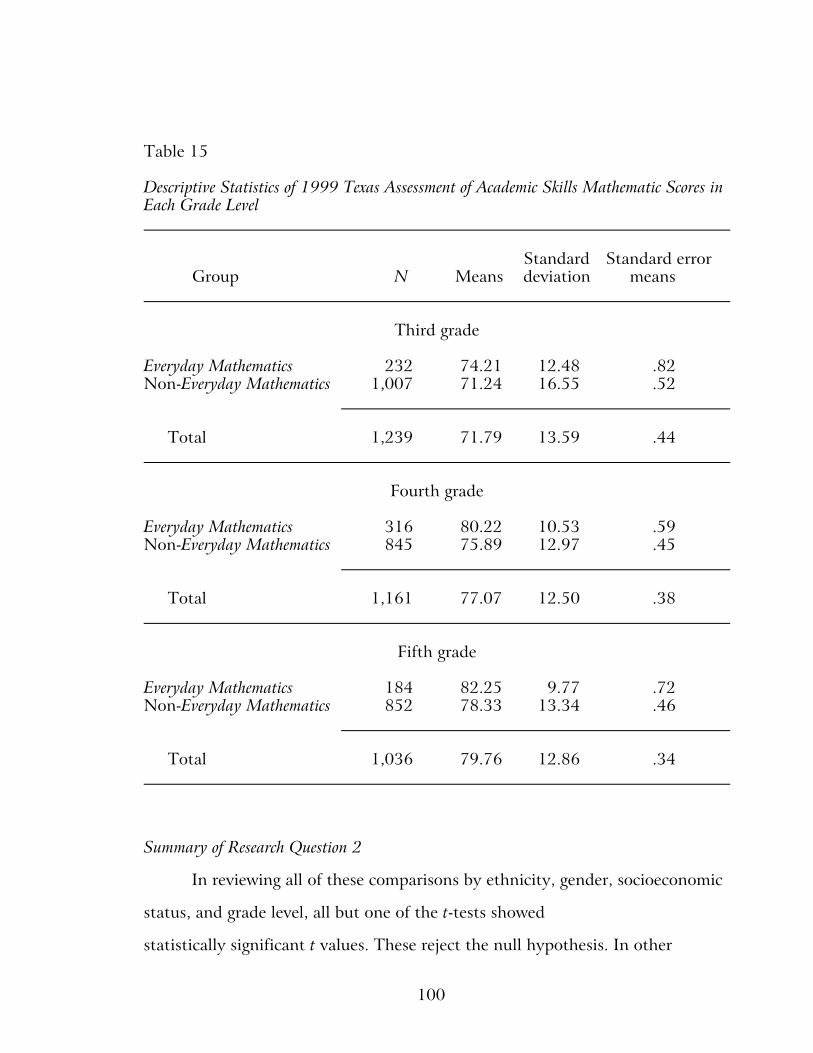
100
Table 15
Descriptive Statistics of 1999 Texas Assessment of Academic Skills Mathematic Scores inEach Grade Level
Standard Standard errorGroup N Means deviation means
Third grade
Everyday Mathematics 232 74.21 12.48 .82Non-Everyday Mathematics 1,007 71.24 16.55 .52
Total 1,239 71.79 13.59 .44
Fourth grade
Everyday Mathematics 316 80.22 10.53 .59Non-Everyday Mathematics 845 75.89 12.97 .45
Total 1,161 77.07 12.50 .38
Fifth grade
Everyday Mathematics 184 82.25 9.77 .72Non-Everyday Mathematics 852 78.33 13.34 .46
Total 1,036 79.76 12.86 .34
Summary of Research Question 2
In reviewing all of these comparisons by ethnicity, gender, socioeconomic
status, and grade level, all but one of the t-tests showed
statistically significant t values. These reject the null hypothesis. In other
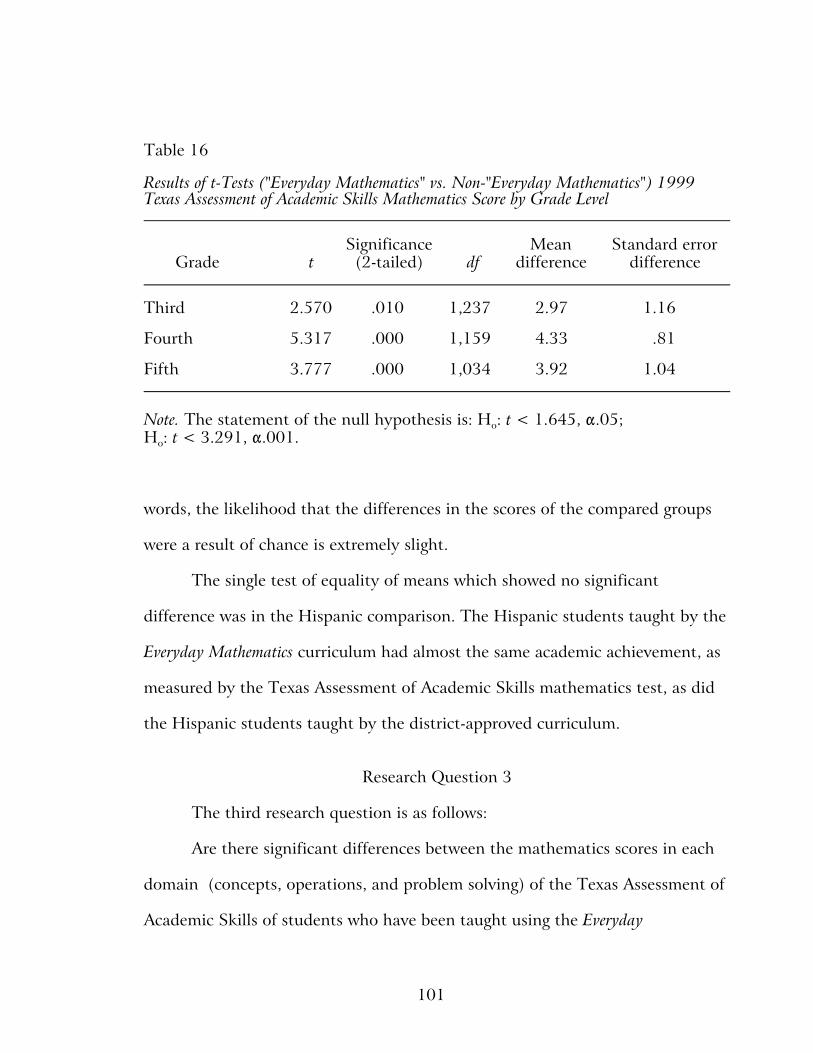
101
Table 16
Results of t-Tests ("Everyday Mathematics" vs. Non-"Everyday Mathematics") 1999Texas Assessment of Academic Skills Mathematics Score by Grade Level
Significance Mean Standard errorGrade t (2-tailed) df difference difference
Third 2.570 .010 1,237 2.97 1.16
Fourth 5.317 .000 1,159 4.33 .81
Fifth 3.777 .000 1,034 3.92 1.04
Note. The statement of the null hypothesis is: Ho: t < 1.645, !.05; Ho: t < 3.291, !.001.
words, the likelihood that the differences in the scores of the compared groups
were a result of chance is extremely slight.
The single test of equality of means which showed no significant
difference was in the Hispanic comparison. The Hispanic students taught by the
Everyday Mathematics curriculum had almost the same academic achievement, as
measured by the Texas Assessment of Academic Skills mathematics test, as did
the Hispanic students taught by the district-approved curriculum.
Research Question 3
The third research question is as follows:
Are there significant differences between the mathematics scores in each
domain (concepts, operations, and problem solving) of the Texas Assessment of
Academic Skills of students who have been taught using the Everyday
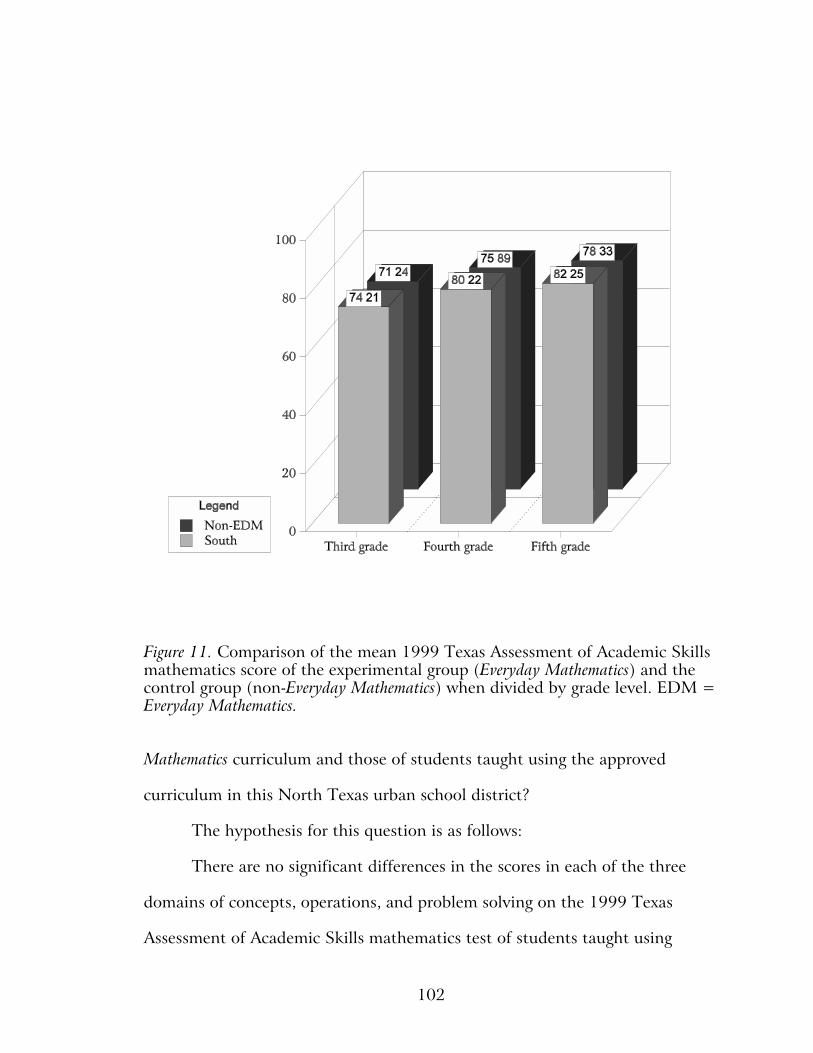
102
Figure 11. Comparison of the mean 1999 Texas Assessment of Academic Skillsmathematics score of the experimental group (Everyday Mathematics) and thecontrol group (non-Everyday Mathematics) when divided by grade level. EDM =Everyday Mathematics.
Mathematics curriculum and those of students taught using the approved
curriculum in this North Texas urban school district?
The hypothesis for this question is as follows:
There are no significant differences in the scores in each of the three
domains of concepts, operations, and problem solving on the 1999 Texas
Assessment of Academic Skills mathematics test of students taught using
103
Everyday Mathematics and students who were taught using the district-approved
curriculum.
This is the null hypothesis and in order to test this the scores on each
domain of the Texas Assessment of Academic Skills mathematics test of students
taught using the Everyday Mathematics curriculum are compared to the scores on
each domain of the Texas Assessment of Academic Skills mathematics test of
students taught using the district approved curriculum. In order to accomplish
this comparison a t-test of equality of means was done on the scores of each
domain. The data were formed into three additional columns. The first column
is the domain "concepts" and is the sum of the scores on objectives 1 through 5
of the Texas Assessment of Academic Skills test. The next column is the domain
"operations" and is the sum of the scores on objectives 6 through 9. The third
additional column is the domain "problem solving" and is the sum of objectives
10 through 13.
Comparison of All "Everyday Mathematics" Students With All Non-"Everyday Mathematics" Students
The first comparison on scores in each domain of the 1999 Texas
Assessment of Academic Skills mathematics test was done with all students in
the study. The descriptive statistics are seen in Table 17 and t-test results are
found in Table 18.
The first t-test rejected the null hypothesis. The difference in the scores in
the domain of concepts in this study is attributable to something other than
chance. The students who were taught by Everyday Mathematics curriculum

104
Table 17
Descriptive Statistics of 1999 Texas Assessment of Academic Skills Mathematic Scores byDomain
Standard Standard errorGroup N Means deviation means
Concepts
Everyday Mathematics 732 17.51 2.55 .09Non-Everyday Mathematics 2,704 16.75 3.11 .06
Operations
Everyday Mathematics 732 13.08 2.93 .11Non-Everyday Mathematics 2,704 12.20 3.53 .07
Problem-solving
Everyday Mathematics 732 9.73 3.59 .13Non-Everyday Mathematics 2,704 8.63 3.60 .07
Table 18
Results of t-Tests "Everyday Mathematics" Versus Non-"Everyday Mathematics" ofDomain Scores of 1999 Texas Assessment of Academic Skills Mathematics Test
Significance Mean Standard errorDomain t (2-tailed) df difference difference
Concepts 6.056 .000 3,434 .76 .12
Operations 6.283 .000 3,434 .89 .14
Problem solving 7.349 .000 3,434 1.10 .15
Note. The statement of the null hypothesis is: Ho: t < 1.96, !.05; Ho: t < 3.291,!.001.
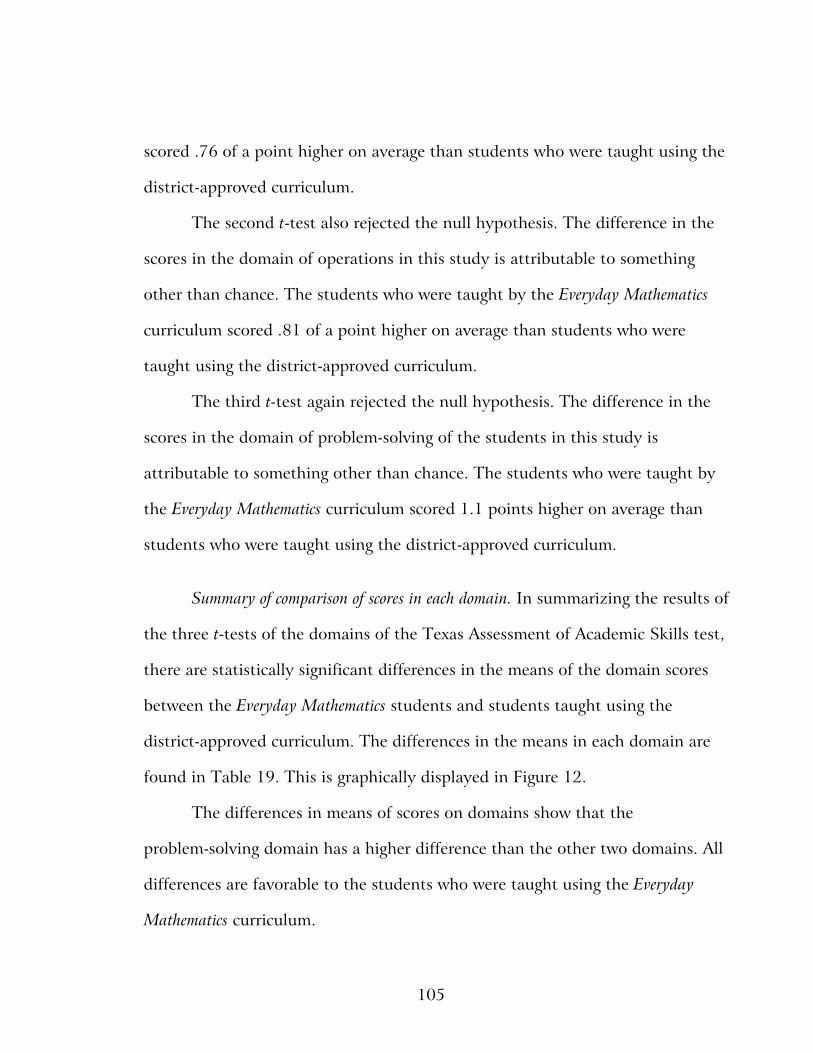
105
scored .76 of a point higher on average than students who were taught using the
district-approved curriculum.
The second t-test also rejected the null hypothesis. The difference in the
scores in the domain of operations in this study is attributable to something
other than chance. The students who were taught by the Everyday Mathematics
curriculum scored .81 of a point higher on average than students who were
taught using the district-approved curriculum.
The third t-test again rejected the null hypothesis. The difference in the
scores in the domain of problem-solving of the students in this study is
attributable to something other than chance. The students who were taught by
the Everyday Mathematics curriculum scored 1.1 points higher on average than
students who were taught using the district-approved curriculum.
Summary of comparison of scores in each domain. In summarizing the results of
the three t-tests of the domains of the Texas Assessment of Academic Skills test,
there are statistically significant differences in the means of the domain scores
between the Everyday Mathematics students and students taught using the
district-approved curriculum. The differences in the means in each domain are
found in Table 19. This is graphically displayed in Figure 12.
The differences in means of scores on domains show that the
problem-solving domain has a higher difference than the other two domains. All
differences are favorable to the students who were taught using the Everyday
Mathematics curriculum.
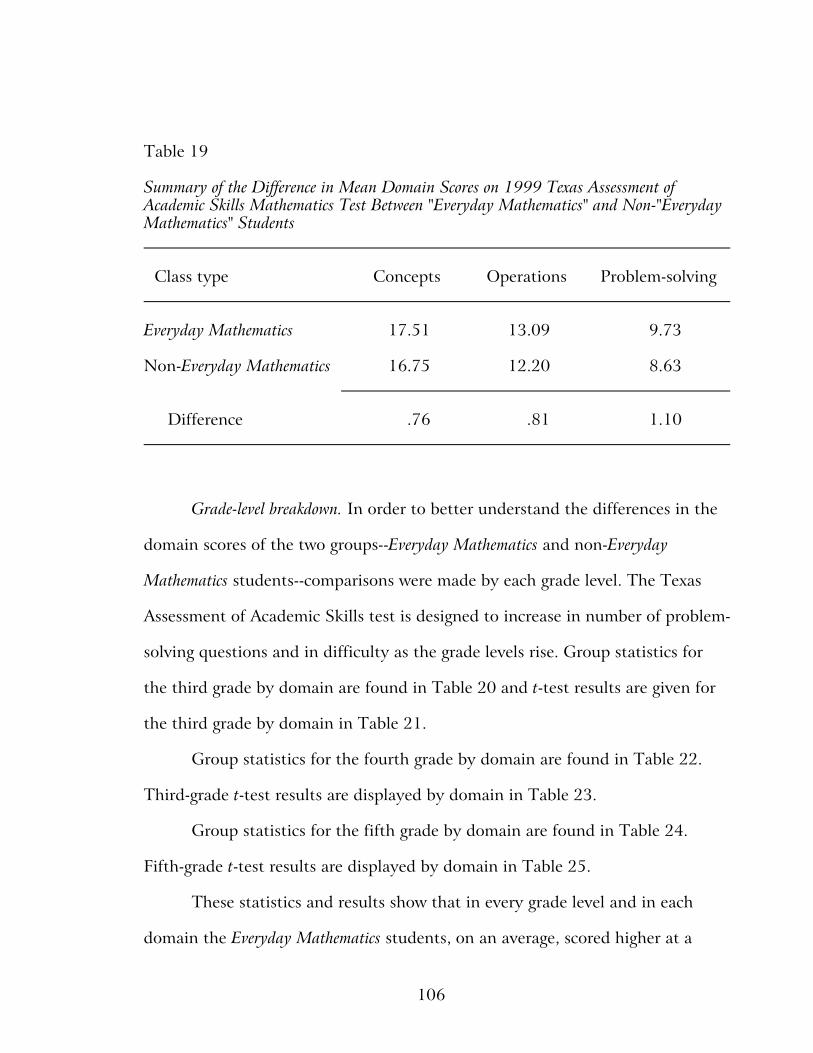
106
Table 19
Summary of the Difference in Mean Domain Scores on 1999 Texas Assessment ofAcademic Skills Mathematics Test Between "Everyday Mathematics" and Non-"EverydayMathematics" Students
Class type Concepts Operations Problem-solving
Everyday Mathematics 17.51 13.09 9.73
Non-Everyday Mathematics 16.75 12.20 8.63
Difference .76 .81 1.10
Grade-level breakdown. In order to better understand the differences in the
domain scores of the two groups--Everyday Mathematics and non-Everyday
Mathematics students--comparisons were made by each grade level. The Texas
Assessment of Academic Skills test is designed to increase in number of problem-
solving questions and in difficulty as the grade levels rise. Group statistics for
the third grade by domain are found in Table 20 and t-test results are given for
the third grade by domain in Table 21.
Group statistics for the fourth grade by domain are found in Table 22.
Third-grade t-test results are displayed by domain in Table 23.
Group statistics for the fifth grade by domain are found in Table 24.
Fifth-grade t-test results are displayed by domain in Table 25.
These statistics and results show that in every grade level and in each
domain the Everyday Mathematics students, on an average, scored higher at a
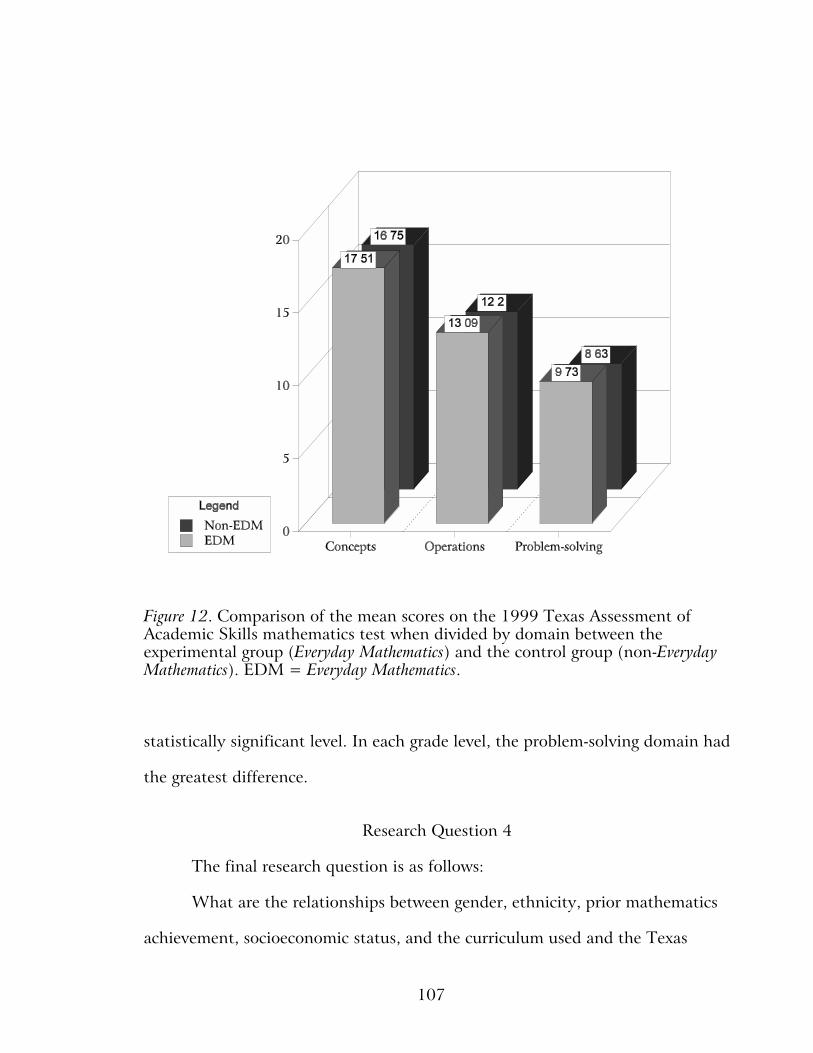
107
Figure 12. Comparison of the mean scores on the 1999 Texas Assessment ofAcademic Skills mathematics test when divided by domain between theexperimental group (Everyday Mathematics) and the control group (non-EverydayMathematics). EDM = Everyday Mathematics.
statistically significant level. In each grade level, the problem-solving domain had
the greatest difference.
Research Question 4
The final research question is as follows:
What are the relationships between gender, ethnicity, prior mathematics
achievement, socioeconomic status, and the curriculum used and the Texas
108
Table 20
Third-Grade Level Descriptive Statistics by Texas Assessment of Academic SkillsMathematics Domain
Third grade
Standard Standard errorGroup N Means deviation means
Concepts
Everyday Mathematics 232 16.97 2.45 .16Non-Everyday Mathematics 1,007 16.47 3.22 .10
Operations
Everyday Mathematics 232 12.16 2.86 .19Non-Everyday Mathematics 1,007 11.71 3.41 .11
Problem-solving
Everyday Mathematics 232 6.18 1.48 .13Non-Everyday Mathematics 1,007 5.76 1.83 .11
Table 21
The t-Test Results ("Everyday Mathematics" vs. Non-"Everyday Mathematics") of Thirdgrade 1999 Texas Assessment of Academic Skills Domains
Significance Mean Standard errorDomain t (2-tailed) df difference difference
Concepts 2.209 .020 1,237 .50 .23
Operations 1.879 .060 1,237 .45 .24
Problem-solving 3.259 .001 1,237 .42 .13
Note. The statement of the null hypothesis is: Ho: t < 1.645, !.05; Ho: t < 3.291, !.001.

109
Table 22
Fourth-Grade Level Descriptive Statistics by Texas Assessment of Academic SkillsMathematics Domain
Fourth grade
Standard Standard errorGroup N Means deviation means
Concepts
Everyday Mathematics 316 17.88 2.52 .14Non-Everyday Mathematics 845 17.06 3.00 .12
Operations
Everyday Mathematics 316 13.42 3.05 .17Non-Everyday Mathematics 845 12.37 3.67 .13
Problem-solving
Everyday Mathematics 316 10.88 2.86 .16Non-Everyday Mathematics 845 9.90 3.14 .11
Table 23
The t-Test Results ("Everyday Mathematics" vs. Non-"Everyday Mathematics") of FourthGrade 1999 Texas Assessment of Academic Skills Domains
Significance Mean Standard errorDomain t (2-tailed) df difference difference
Concepts 4.306 .000 1,237 .82 .19
Operations 4.563 .000 1,237 1.06 .23
Problem-solving 4.851 .000 1,237 .98 .20
Note. The statement of the null hypothesis is: Ho: t < 1.645, !.05; Ho: t < 3.291, !.001.
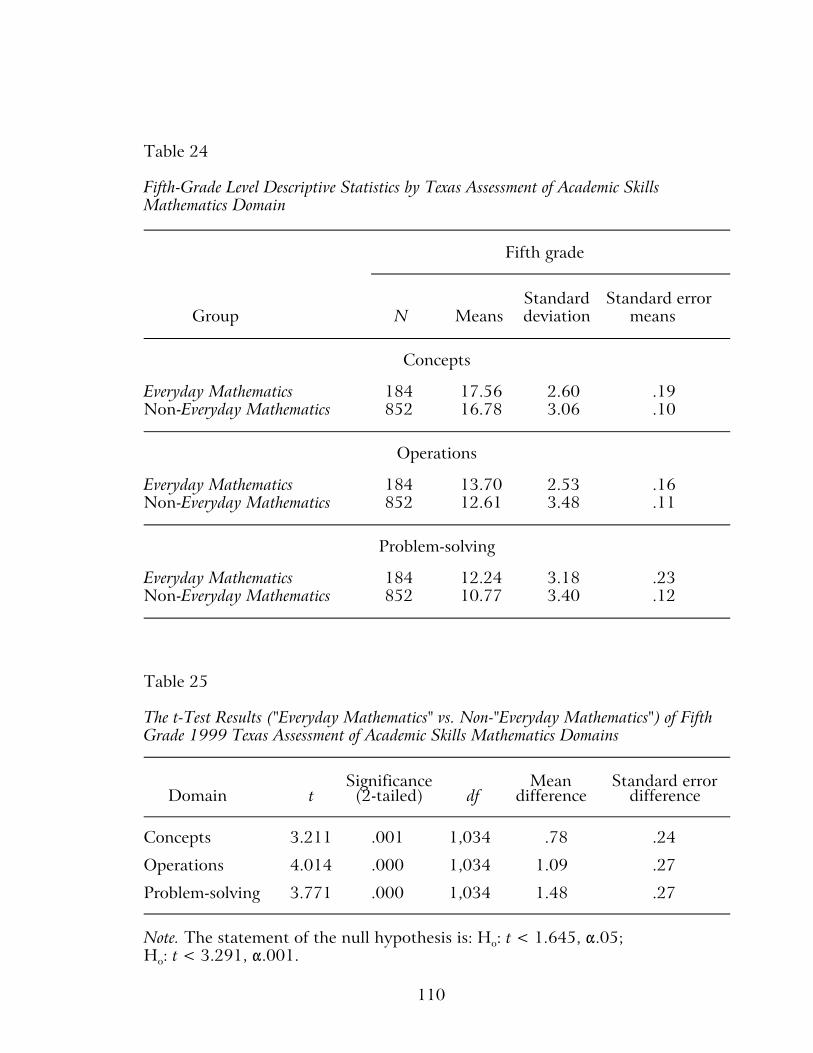
110
Table 24
Fifth-Grade Level Descriptive Statistics by Texas Assessment of Academic SkillsMathematics Domain
Fifth grade
Standard Standard errorGroup N Means deviation means
Concepts
Everyday Mathematics 184 17.56 2.60 .19Non-Everyday Mathematics 852 16.78 3.06 .10
Operations
Everyday Mathematics 184 13.70 2.53 .16Non-Everyday Mathematics 852 12.61 3.48 .11
Problem-solving
Everyday Mathematics 184 12.24 3.18 .23Non-Everyday Mathematics 852 10.77 3.40 .12
Table 25
The t-Test Results ("Everyday Mathematics" vs. Non-"Everyday Mathematics") of FifthGrade 1999 Texas Assessment of Academic Skills Mathematics Domains
Significance Mean Standard errorDomain t (2-tailed) df difference difference
Concepts 3.211 .001 1,034 .78 .24
Operations 4.014 .000 1,034 1.09 .27
Problem-solving 3.771 .000 1,034 1.48 .27
Note. The statement of the null hypothesis is: Ho: t < 1.645, !.05; Ho: t < 3.291, !.001.
111
Achievement of Academic Skills mathematic scores of third-, fourth-, and fifth-
grade students in a large North Texas urban school district?
The previously stated hypothesis was as follows:
There is no statistically significant correlation between the type of
mathematics curriculum used in the classroom in combination with ethnicity,
socioeconomic status, gender, and prior mathematics ability and the Texas
Assessment of Academic Skills mathematic scores of students in a large North
Texas urban school district.
In order to test this hypothesis, a multiple regression model was
developed. This question was posed to analyze the relationship in the variables
that tend to make a difference in student achievement. The variables of
ethnicity, socioeconomic status, gender, and prior mathematics ability were
unchangeable. The changeable variable was the type of curriculum by which the
student was taught.
Multiple Linear Regression Model
The multiple linear regression model outcomes on a criterion variable are
predicted using multiple predictor variables. For this study the model has
mathematics score on the Texas Assessment of Academic Skills as the outcome
or criterion variable. The predictor variables are the type of mathematics
curriculum that was taught, prior mathematics ability, gender, ethnicity, and
socioeconomic status. The equation for this is: Y = B1X1 + B2X2 + B3X3 + B4X4
+ B5X5 + a, with Y being the predicted Texas Assessment of Academic Skills
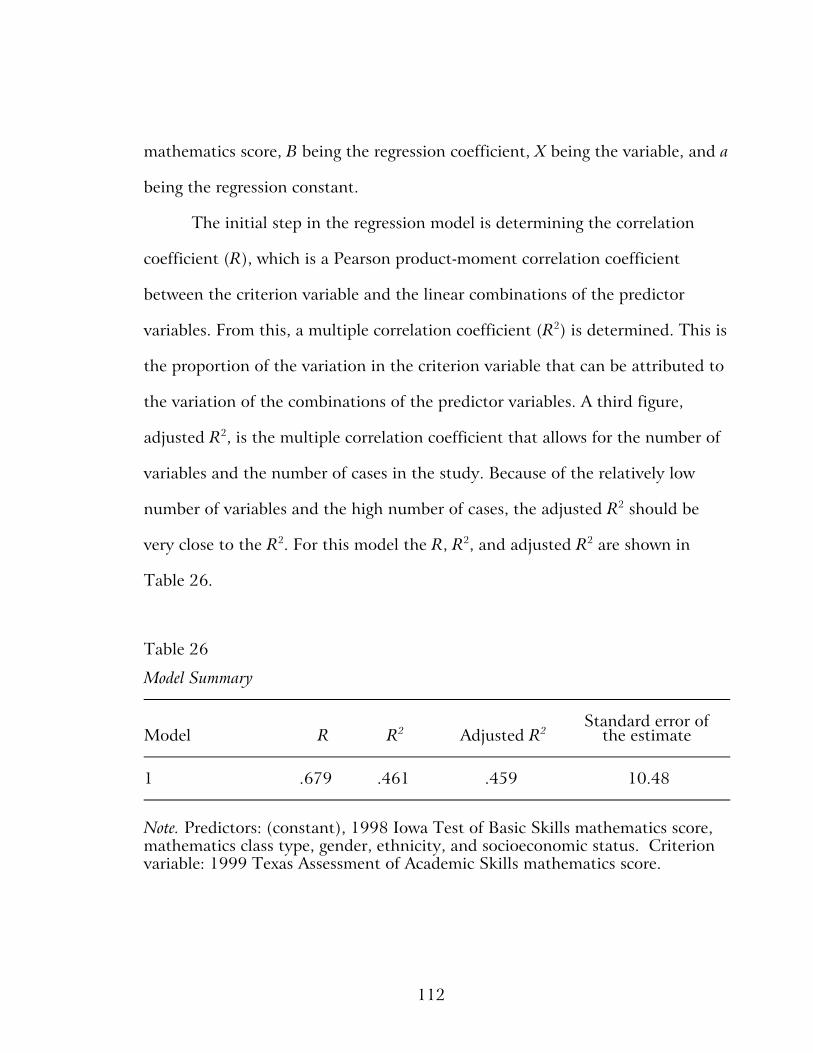
112
mathematics score, B being the regression coefficient, X being the variable, and a
being the regression constant.
The initial step in the regression model is determining the correlation
coefficient (R), which is a Pearson product-moment correlation coefficient
between the criterion variable and the linear combinations of the predictor
variables. From this, a multiple correlation coefficient (R2) is determined. This is
the proportion of the variation in the criterion variable that can be attributed to
the variation of the combinations of the predictor variables. A third figure,
adjusted R2, is the multiple correlation coefficient that allows for the number of
variables and the number of cases in the study. Because of the relatively low
number of variables and the high number of cases, the adjusted R2 should be
very close to the R2. For this model the R, R2, and adjusted R2 are shown in
Table 26.
Table 26
Model Summary
Standard error ofModel R R2 Adjusted R2 the estimate
1 .679 .461 .459 10.48
Note. Predictors: (constant), 1998 Iowa Test of Basic Skills mathematics score,mathematics class type, gender, ethnicity, and socioeconomic status. Criterionvariable: 1999 Texas Assessment of Academic Skills mathematics score.
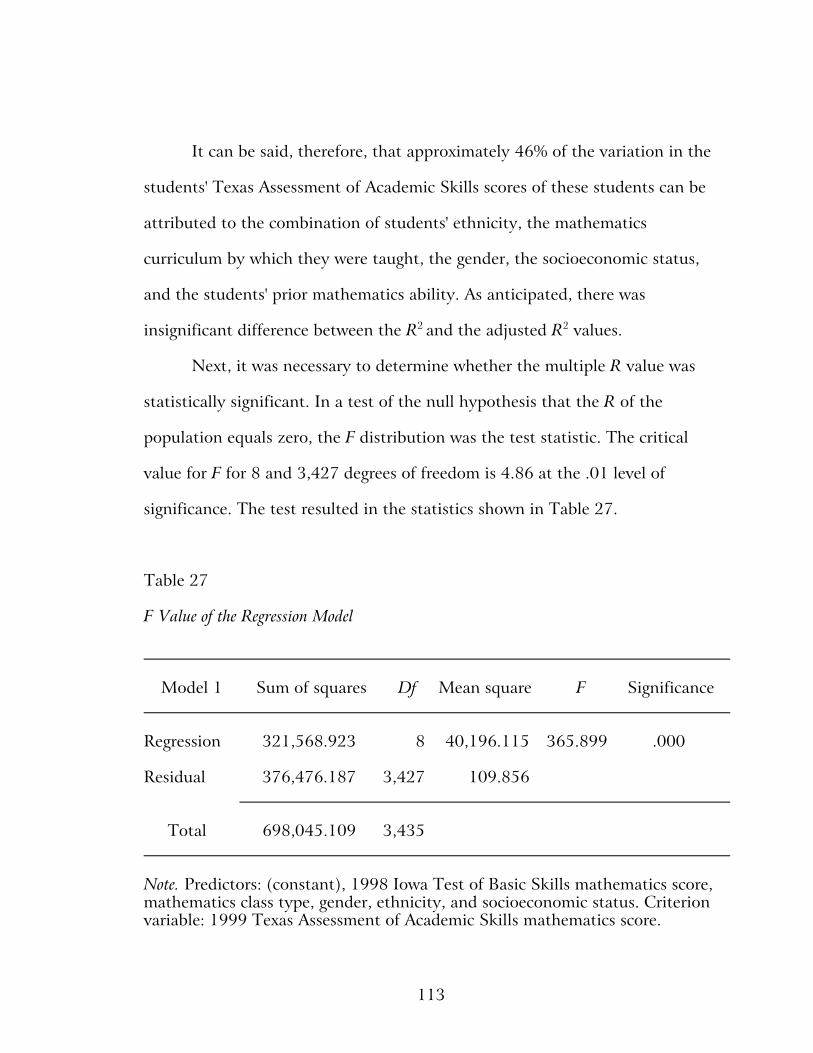
113
It can be said, therefore, that approximately 46% of the variation in the
students' Texas Assessment of Academic Skills scores of these students can be
attributed to the combination of students' ethnicity, the mathematics
curriculum by which they were taught, the gender, the socioeconomic status,
and the students' prior mathematics ability. As anticipated, there was
insignificant difference between the R2 and the adjusted R2 values.
Next, it was necessary to determine whether the multiple R value was
statistically significant. In a test of the null hypothesis that the R of the
population equals zero, the F distribution was the test statistic. The critical
value for F for 8 and 3,427 degrees of freedom is 4.86 at the .01 level of
significance. The test resulted in the statistics shown in Table 27.
Table 27
F Value of the Regression Model
Model 1 Sum of squares Df Mean square F Significance
Regression 321,568.923 8 40,196.115 365.899 .000
Residual 376,476.187 3,427 109.856
Total 698,045.109 3,435
Note. Predictors: (constant), 1998 Iowa Test of Basic Skills mathematics score,mathematics class type, gender, ethnicity, and socioeconomic status. Criterionvariable: 1999 Texas Assessment of Academic Skills mathematics score.
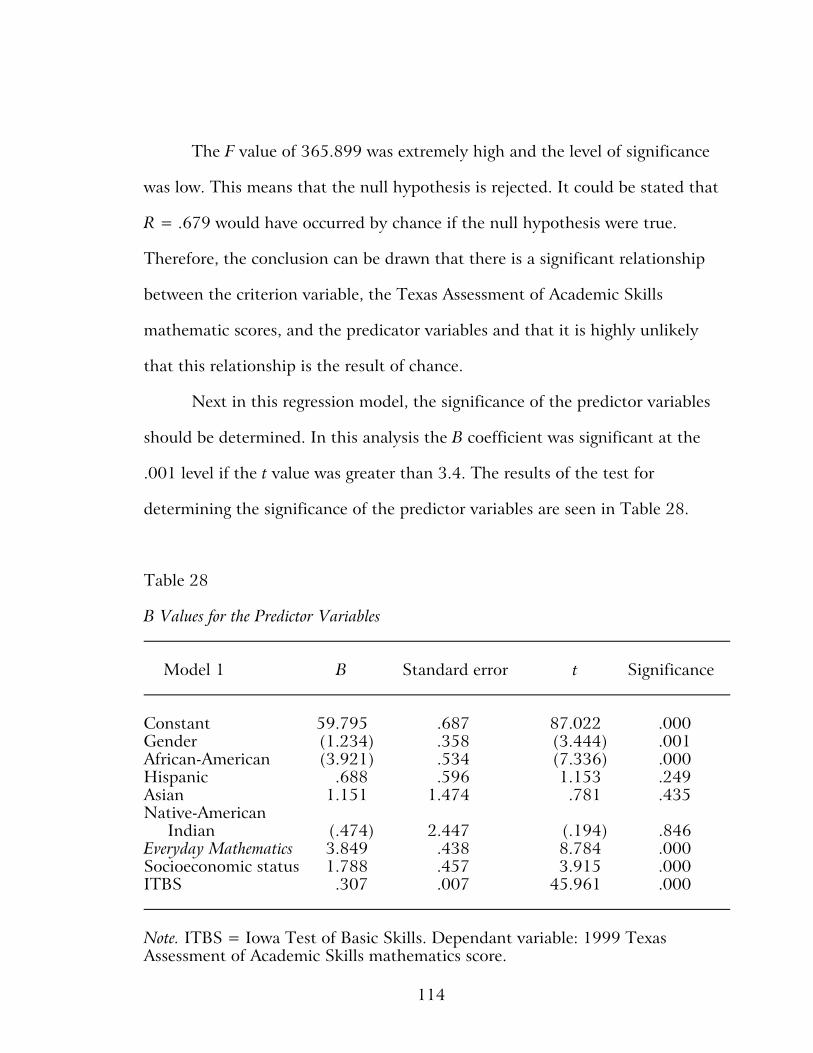
114
The F value of 365.899 was extremely high and the level of significance
was low. This means that the null hypothesis is rejected. It could be stated that
R = .679 would have occurred by chance if the null hypothesis were true.
Therefore, the conclusion can be drawn that there is a significant relationship
between the criterion variable, the Texas Assessment of Academic Skills
mathematic scores, and the predicator variables and that it is highly unlikely
that this relationship is the result of chance.
Next in this regression model, the significance of the predictor variables
should be determined. In this analysis the B coefficient was significant at the
.001 level if the t value was greater than 3.4. The results of the test for
determining the significance of the predictor variables are seen in Table 28.
Table 28
B Values for the Predictor Variables
Model 1 B Standard error t Significance
Constant 59.795 .687 87.022 .000Gender (1.234) .358 (3.444) .001African-American (3.921) .534 (7.336) .000Hispanic .688 .596 1.153 .249Asian 1.151 1.474 .781 .435Native-American Indian (.474) 2.447 (.194) .846Everyday Mathematics 3.849 .438 8.784 .000Socioeconomic status 1.788 .457 3.915 .000ITBS .307 .007 45.961 .000
Note. ITBS = Iowa Test of Basic Skills. Dependant variable: 1999 TexasAssessment of Academic Skills mathematics score.
115
As shown in Table 28, it can be said that gender, African-American
ethnicity, mathematics curriculum (Everyday Mathematics), socioeconomic status,
and prior mathematics ability (as measured by the Iowa Test of Basic Skills) are
statistically significant contributors to the 1999 Texas Assessment of Academic
Skills mathematic scores. The ethnic designations of Hispanic, Asian, and
Native-American Indian do not have significant differences, which cannot be
attributed to chance. Thus, it can be said that in the population, the correlation
between the criterion variable, the 1999 Texas Assessment of Academic Skills
mathematics score, and each of the predictor variables of gender,
African-American ethnicity, mathematics curriculum (Everyday Mathematics),
socioeconomic status, and prior mathematics ability (1998 Iowa Test of Basic
Skills mathematics score) was different from zero.
The constant is an Anglo female of low socioeconomic status. In order to
predict a score on the Texas Assessment of Academic Skills test, one could use
the formula: Y = -(1.234)(Gender, 1 for male, 0 for female) + -(3.921)(1 for
African-American, 0 for all others) + 3.849 (1 for an Everyday Mathematics
student, 0 for a non-Everyday Mathematics student) + 1.788 (1 for other
socioeconomic status, 0 for low socioeconomic status) + .307 (the 1998 Iowa
Test of Basic Skills mathematics score) + 59.795 (which is the constant), Y
would then be the predicted score of the person.
This regression model can be used to predict future performance on the
Texas Assessment of Academic Skills mathematics test. However, it is also useful
to determine the difference that some factors would make in the performance of
116
the Texas Assessment of Academic Skills mathematics test. Being of
African-American ethnicity in this model has a significant impact on the
achievement of students. Second only to that, the mathematics curriculum used
is correlated to student achievement as measured by the Texas Assessment of
Academic Skills mathematics test. Socioeconomic status and gender make a
difference, with low socioeconomic status students having lower achievement
than other socioeconomic status students and males doing poorer than females.
The regression model can also help in understanding the students who
can be helped by the use of different mathematics curricula. It is shown in this
analysis that the effect of the use of the Everyday Mathematics curriculum can
almost overcome the deficit with which African-American students begin,
compared to students of other ethnic designation. It more than makes up for the
difference in mathematic scores of low socioeconomic students when compared
to those of other students.
Summary of Analysis of Data
With the amount of data accumulated, there was the possibility of
overanalyzing. However, the tests of data conducted were in line with the
research questions and hypotheses presented. This analysis viewed the data as a
whole in the multiple regression model and examined the difference in the
students through the various t-tests.
117
CHAPTER 5
SUMMARY, FINDINGS, CONCLUSIONS, RECCOMENDATIONS,
AND SUGGESTIONS FOR FURTHER STUDIES
The purpose of this study was to examine the use of a Standards-based
mathematics curriculum and its effects on student achievement. It attempted
to determine whether or not Everyday Mathematics is more effective in
improving student achievement than the approved curriculum that was being
taught in a large North Texas urban school district. This study attempted to
gather information about effective methods and programs for teaching
mathematics. It also compared the two types of mathematics curricula--one
based on national mathematics standards and one based on a traditional
method of teaching mathematics. This should provide information about the
relationship between student achievement and the application of national
standards to classroom material and practices for mathematics.
Summary of the Study
The process of this study began with the identification of students in
the third, fourth, and fifth grades in a large North Texas urban school district
who had been taught during the 1998-99 school year using the Everyday
Mathematics curriculum. A group of comparison students was also formed who
were similar to the Everyday Mathematics students in grade level, ethnicity,
118
socioeconomic status, and prior mathematics ability. These students were
taught during the 1998-99 school year using the district-approved curriculum.
Prior mathematics ability was measured by the mathematics score on the April
1998 administration of the Iowa Test of Basic Skills.
The mathematic scores on the April 1998 Iowa Test of Basic Skills were
compared between the two groups. This was important to establish that the
two groups were fairly equal in mathematics ability at the beginning of the
1998-99 school year. The mean score on the Iowa Test of Basic Skills
mathematics section for Everyday Mathematics students was 55.89, and the
mean score for students who were taught with the district-approved curriculum
was 55.94. These are almost identical, and when a test of equality of means
was conducted, there was no statistically significant difference. By this
measure, these two groups began the 1998-99 school year with an equal
mathematical ability.
Data were gathered on the students from the school district's central
database. The information included grade level, gender, ethnicity,
socioeconomic status, school identification number, 1998 Iowa Test of Basic
Skills score in mathematics, and 1999 Texas Assessment of Academic Skills
mathematics score (broken down by the 13 objectives and the total
mathematics score).
The 1999 Texas Assessment of Academic Skills matheamtics score was
the outcome measurement. This test is a criterion-referenced test that
measures a student's mastery of the expected learning during the school year.

119
The Texas Assessment of Academic Skills test is aligned with the Texas
Essentials of Knowledge and Skills, a set of learning objectives developed by
the Texas Education Agency for each grade level and subject area.
The analysis of data centered on a comparison of the1999 Texas
Assessment of Academic Skills mathematic scores of students taught using the
Everyday Mathematics program to the 1999 Texas Assessment of Academic
mathematic scores of students taught using the district-approved curriculum. A
multiple regression model was formed, with ethnicity, gender, socioeconomic
status, prior mathematics ability, and type of mathematics curriculum used as
the predictor variables. The 1999 total mathematics score on the 1999 Texas
Assessment of Academic Skills test was the criterion variable. Comparisons
were made between groups of students in relationship to the three domains of
the Texas Assessment of Academic Skills test, grade level, gender, ethnicity,
and socioeconomic status.
Findings
The findings of this study are presented by the research questions. The
statistical tests used were matched to the question and the data used in each of
the test from the same data set for this study.
Research Question 1
Are there significant differences between the mathematics scores on the
Texas Assessment of Academic Skills test of students who have been taught
120
using the Everyday Mathematics curriculum and those of students taught using
the approved curriculum in a North Texas urban school district?
A t-test of equality of means, an independent sample comparison of
means, was conducted using the 1999 Texas Assessment of Academic Skills
scores as the test variable and the class type, Everyday Mathematics or non-
Everyday Mathematics, as the grouping variable. The result rejected the null
hypothesis. Therefore, there is a significant difference between the scores on
the 1999 Texas Assessment of Academic Skills matheamtics scores of students
taught using the Everyday Mathematics curriculum and the 1999 Texas
Assessment of Academic Skills mathematics score of students taught using the
district-approved curriculum. The students in the Everyday Mathematics classes
scored an average of 3.9 points higher on the Texas Assessment of Academic
Skills mathematics test.
When the data are viewed by percentage of students who passed the
test, the figures are more impressive. Students in this study who were taught
using the district-approved curriculum passed the Texas Assessment of
Academic Skills mathematics test at the rate of 72.3%, whereas 81.4% of
Everyday Mathematics students passed the Texas Assessment of Academic Skills
mathematics test. This means that, in this study, over 9% more students
passed the state's high-stakes test when in classes taught by the Standards-
based curriculum.
121
In 1999 schools were deemed low performing if 50% of the student
population failed any portion of the Texas Assessment of Academic Skills test.
Thus, to have an increase of 9% on a section of the test is highly significant.
Research Question 2
Are there significant differences in the mathematic scores on the Texas
Assessment of Academic Skills when groups (Everyday Mathematics students vs.
non-Everyday Mathematics students) are examined with regard to ethnicity,
gender, socioeconomic status, and grade level?
To answer this question, a series of t-tests were conducted. The 1999
Texas Assessment of Academic Skills mathematic scores of African-American
Everyday Mathematics students were compared to the scores of
African-American students who were taught using the district-approved
mathematics curriculum. Everyday Mathematics Anglo students were compared
to non-Everyday Mathematics Anglo students, Hispanics to Hispanics, males to
males, and females to females. Comparisons were made among high
socioeconomic students, low socioeconomic students, third graders, fourth
graders, and fifth graders.
The first comparison for examinination was between African-American
students who were taught with the Everyday Mathematics program and African-
American students taught by the district-approved curriculum. There was a
statistically significant difference between the Texas Assessment of Academic
Skills scores of these two groups. The Everyday Mathematics students had an
122
average score of 76.11, whereas the non-Everyday Mathematics students had an
average score of 70.75.
Although the difference in average score of 5.36 is significant, when
viewed in terms of the percentage of students who passed the mathematics
section of the Texas Assessment of Academic Skills test, the results are more
impressive. The African-American students in this study who were taught using
Everyday Mathematics passed at the rate of 74.7%. The African-American
students in this study who were taught using the district approved curriculum
passed at a rate of 62.2%. This is a difference of 12.5%. Again, with the
knowledge that this Texas high-stakes test determines the ranking among
Texas public schools, this increase is important.
The second comparison in this study was between Anglo students.
There was a statistically significant difference between the Texas Assessment of
Academic Skills mathematic scores of Anglo students who were taught with
the Everyday Mathematics program and the Texas Assessment of Academic Skills
mathematic scores of Anglo students taught by the district-approved
curriculum. The Everyday Mathematics students had an average score of 84.91,
whereas the non-Everyday Mathematics students had an average score of 81.31.
When converted into the percentage of students that passed the Texas
Assessment of Academic Skills test, 96.2% of students taught with the
Standards-based mathematics passed, and 86.3% of students taught with the
more traditional math passed. This is an difference of 9.9% of students who
123
passed the Texas Assessment of Academic Skills mathematics test when taught
using Everyday Mathematics.
The next comparison of Texas Assessment of Academic Skills
mathematic scores was between Hispanic students in the study. This t-test of
equality of means showed no statistically significant difference between
Hispanic students taught by teachers using Everyday Mathematics and Hispanic
students taught by the district-approved curriculum. In this study only a 0.1%
difference existed between the Hispanic students who passed the mathematics
section of the Texas Assessment of Academic Skills test, with 81.3% of
Everyday Mathematics students and 81.2% of non-Everyday Mathematics students
obtaining passing scores.
The two other ethnic groups, Native-American Indians and Asians, had
numbers of students that were too small to compare. These two groups have
small representations in the district.
The scores of students divided by gender were also compared. The Texas
Assessment of Academic Skills mathematic scores of girls in this study taught
with Everyday Mathematics were compared to the scores of girls taught with the
district-approved curriculum. The differences in the scores using a t-test were
statistically significant. The Everyday Mathematics female students averaged
78.92, and the non-Everyday Mathematics students averaged 75.57, a difference
of 3.35 points. The percentage of Everyday Mathematics female students who
passed the 1999 Texas Assessment of Academic Skills mathematics test was
124
81%. Females who were taught with the district-approved curriculum passed at
a rate of 73.5%. This is a difference of 7.5%.
Similarly, the scores of male students in this study were compared. A
statistically significant difference existed between the means of the 1999
mathematic scores of males who were taught using the Everyday Mathematics
curriculum and males taught with the district approved curriculum. The
Everyday Mathematics male students averaged 78.71, and the non-Everyday
Mathematics male students averaged 74.26, with a difference of 3.45 points.
When converted into the percentage of students who passed the Texas
Assessment of Academic Skills test, 81.8% of the males in this study taught
with the Standards-based mathematics passed, and 71.0% of the males taught
with the more traditional mathematics passed. This is a difference of 10.8%.
Next compared were the scores of students divided into groups by
socioeconomic status. The Texas Assessment of Academic Skills mathematic
scores of students of low socioeconomic status taught with Everyday
Mathematics were compared with the scores of students of low socioeconomic
status taught with the district-approved curriculum. The differences in the
scores using a t-test were statistically significant. The Everyday Mathematics
students averaged 76.55, and the non-Everyday Mathematics students averaged
72.35, a difference of 4.2 points.
The percentage of Everyday Mathematics students of low socioeconomic
status who passed the 1999 Texas Assessment of Academic Skills mathematics
test was 75.8%. Students of low socioeconomic status who were taught with
125
the district-approved curriculum passed at a rate of 66.2%. In the low
socioeconomic group who were taught with the Standards-based curriculum,
9.6% more students passed the Texas Assessment of Academic Skills
mathematics test in 1999.
Similarly, the scores of students of other socioeconomic status (those
not qualified for free or reduced-price lunch) were compared. A statistically
significant difference was found between the means of the 1999 mathematic
scores of other socioeconomic students who were taught using the Everyday
Mathematics curriculum and those taught with the district-approved
curriculum. The Everyday Mathematics students averaged 82.73, and the non-
Everyday Mathematics students averaged 80.65, with a difference of 2.08.
The percentage of Everyday Mathematics students of other socioeconomic
status who passed the 1999 Texas Assessment of Academic Skills mathematics
test was 91.1%. Students of other socioeconomic status who were taught with
the district-approved curriculum passed at a rate of 85.8%, with 5.3% more
students passing.
When scores were compared by grade levels, Everyday Mathematics
students versus non-Everyday Mathematics students, statistically significant
differences were found in the third, fourth, and fifth grades. When the
differences are viewed in terms of the percentage of students who passed the
Texas Assessment of Academic Skills mathematics test, the results revealed the
following: in the third grade, 70.7% of the Everyday Mathematics students
passed, whereas 65.1% of the non-Everyday Mathematics students passed, a
126
difference of 5.6%, in the fourth grade. There was a 9.7% difference in the
number of Everyday Mathematics students passing the 1999 mathematics
portion of the Texas Assessment of Academic Skills test. Everyday Mathematics
students passed at a rate of 85.4%, whereas non-Everyday Mathematics students
passed at a rate of 74.7%. The percentage of fifth-grade Everyday Mathematics
students who passed the test was 88.0%, and the percentage of non-Everyday
Mathematics students who passed the test was 78.4%. Students in this study
taught with Everyday Mathematics had a 9.6% higher passing rate.
Research Question 3
Are there significant differences between the mathematics scores in each
domain (concepts, operations, and problem-solving) of the Texas Assessment
of Academic Skills of students who have been taught using the Everyday
Mathematics curriculum and those of students taught using the approved
curriculum in a North Texas urban school district?
In order to answer this question, the data had to first to be arranged
into the domains of the Texas Assessment of Academic Skills test. The results
of the Texas Assessment of Academic Skills test are reported by individual
objectives and by a total score. The 13 individual objectives are grouped into
three domains--concepts, operations, and problem-solving. The scores of the
two groups in these domains were compared using an independent sample t-
test of equality of means.
The results of the comparison of means showed that there were
statistically significant differences in the two sets of scores. The students in
127
this study who were taught using the Everyday Mathematics curriculum had
higher scores in all three domains. Each grade level had a different number of
questions and levels of mastery in the three domains of the Texas Assessment
of Academic Skills mathematics test. This was a factor that needed to be
considered. To do this, the groups were divided by grade level, which were
then subjected to analysis by t-tests. The results of these tests showed
significant differences in all grade levels and in all domains. Only the third-
grade comparison in the domain of operations was not significant at the .05
level.
In all of the domains for all grade levels, the students in this study who
were taught using the Standards-based mathematics curriculum scored higher
than those students who were taught using the district-approved mathematics
curriculum. The differences between third-grader scores in the domains were
not as great as the differences in the fourth- and fifth-grader scores.
Research Question 4
What are the relationships between gender, ethnicity, prior
achievement, socioeconomic status, and the curriculum used and the Texas
Assessment of Academic Skills mathematic scores of third-, fourth-, and fifth-
grade students in this large North Texas urban school district?
This question was answered by creating a multiple regression model
with the data. The predictor variables were--the different ethnic designations
represented in the district, gender, socioeconomic status, the type of class
(Everyday Mathematics or the district-approved curriculum), and prior
128
mathematics ability. The criterion variable was the total Texas Assessment of
Academic Skills mathematics test score.
This model revealed that the predictor variable accounted for 46% of
the variance in the Texas Assessment of Academic Skills mathematics test
scores. Although prior mathematics ability was an important factor, the factors
of African-American ethnicity and type of classroom were significant factors in
the Texas Assessment of Academic Skills mathematic scores. Socioeconomic
status and gender were statistically significant factors but to a lesser extent
than the previous two predictor variables.
Three variables showed little significance as predictor variables. The two
groups of Native-American Indians and Asians had an insufficient number of
cases to be measured. The Hispanic ethnicity had no difference in the mean
scores on the Texas Assessment of Academic Skills test to be a significant
enough factor in the multiple regression model.
This analysis of data shows that there is a significant relationship
between the 1999 Texas Assessment of Academic Skills mathematic scores of
the students in this study and the type of mathematics curriculum used,
regardless of whether the student was African-American or not, and regardless
of gender, socioeconomic status, and prior mathematics ability. These factors,
when combined, account for about half of the variance in the Texas
Assessment of Academic Skills mathematic scores.
129
Conclusions
The analysis of the data gathered in this study shows that the use of
Everyday Mathematics by the third-, fourth-, and fifth-grade students in a large
North Texas urban school district can produce a higher level of student
mathematics achievement as measured by the state high-stakes test of student
mastery of academic skills and knowledge. In all student categories of Anglo,
African-American, male, female, low socioeconomic status, high socioeconomic
status, third grade, fourth grade, and fifth grade, there is a difference in
student achievement as measured by the 1999 Texas Assessment of Academic
Skills mathematics test. The single group that did not show a significant
difference was Hispanic students.
It is significant that this study found no difference in the Texas
Assessment of Academic Skills mathematic scores of Hispanic students.
Hispanic students make up approximately 50% of the students in this large
North Texas urban school district. Over one-half of these students are
identified as speakers of other languages (Dallas Public Schools, 1999).
Because the Standards-based mathematics curriculum is word rich, it is possible
that language barriers slow student progress in achievement when Everyday
Mathematics is used. It is important to recognize that while Everyday
Mathematics did not help Hispanic students, it did not decrease student
achievement in this ethnic group.
130
Recommendations
This study examined students that were in a pilot program of the Urban
Systemic Initiative in a large North Texas urban school district. A
recommendation based on this study is that the Everyday Mathematics program
be extended to other schools. The significant positive differences in the Texas
Assessment of Academic Skills mathematic scores should lead the district to
widely expand the use of this Standards-based curriculum to many other
elementary schools.
The positive significant differences in student achievement seen in the
African-American students and low socioeconomic students should further
encourage schools that have a large segment of student population of these
students to immediately implement Everyday Mathematics. Both
African-American students and low socioeconomic students tend to have lower
scores on standardized achievement tests. The use of Everyday Mathematics in
this study brings both of these student populations greater gains in student
achievement than other specific groups. The use of Title 1 funds can easily be
justified in the use of a curriculum that is shown to help minority and
socioeconomic disadvantaged students gain ground in student achievement.
It is recommended that the information from this study should be
distributed district wide. Principals who choose to initiate the Everyday
Mathematics program in their schools need to budget in the spring for the
training and materials necessary for the coming school year. Principals also
need information workshops that could include advice from principals who
131
have already initiated the use of this Standards-based mathematics curriculum
in their school.
Suggestions for Further Studies
Following the recommendations of this study, further studies are needed
to demonstrate the effectiveness of Everyday Mathematics in increasing student
mathematic achievement. One of the suggested studies would be a comparison
of randomly selected schools that would implement the Standards-based
mathematics curriculum. This future study would add generalizability to the
district and add power in terms of statistics. A study of this kind could clarify
the deficiencies of this study, overcoming its limitations.
It is also suggested that a study of Hispanic students be conducted to
understand what would be effective in improving student achievement. A
study of different mathematics curricula, different classroom pedagogues, or
staffing patterns might help to explain the findings of this study. It is also
recommended that teachers of students who are identified as speakers of other
languages be provided with training in implementing English as a second
language strategies for mathematics.
The students in this study who have been identified as Everyday
Mathematics students and non-Everyday Mathematics students can be involved in
a longitudinal study. It is now possible to study the further progress of these
students through future years. It is possible that students could move from
school to school, in and out of Standards-based programs. The further effects of
132
mathematical programs on the achievement of these students can increase our
understanding of mathematics learning.
Everyday Mathematics is only 1 of 13 different curricula that have been
developed from the National Council of Teachers of Mathematics Standards. It
is recommended that the other Standards-based curricula be piloted in the
district. These researched-based, targeted programs are created from the same
set of objectives upon which Everyday Mathematics was founded.
This study of the effects of Everyday Mathematics on student achievement
in a large North Texas urban school district has shown that this Standards-
based curriculum can improve learning. It is only the beginning of a process
that, in the end, should result in helping students better know mathematics.

133
APPENDIX
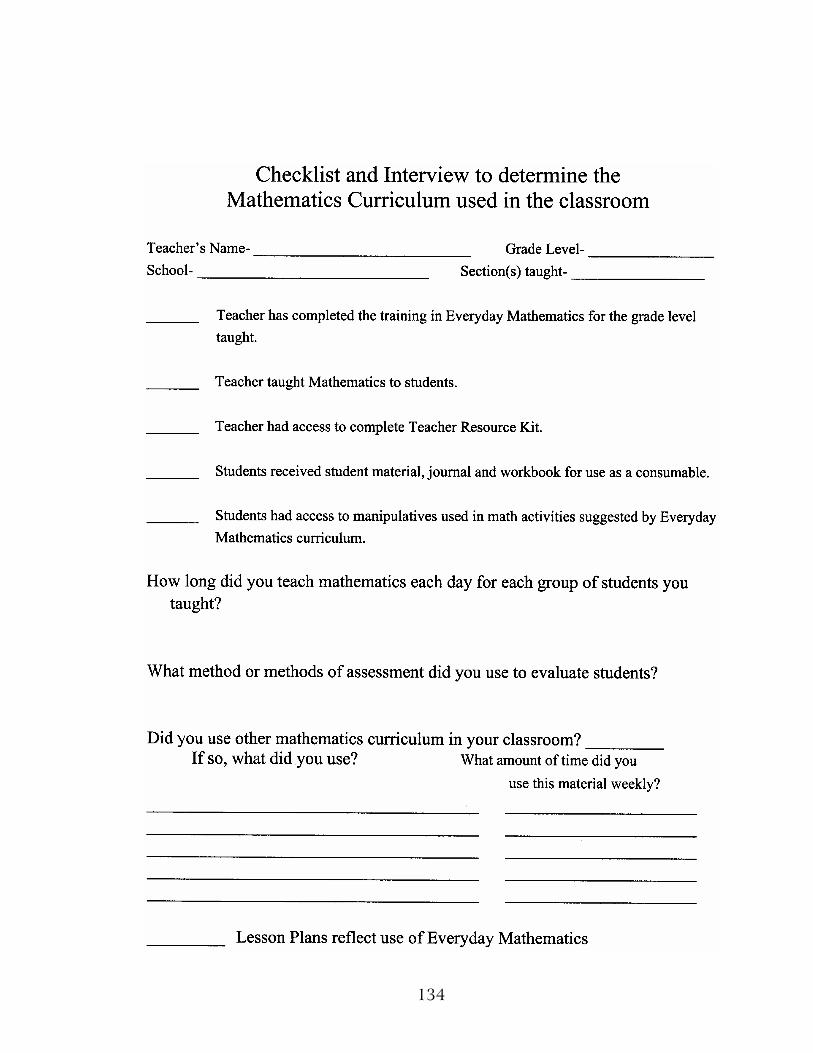
134
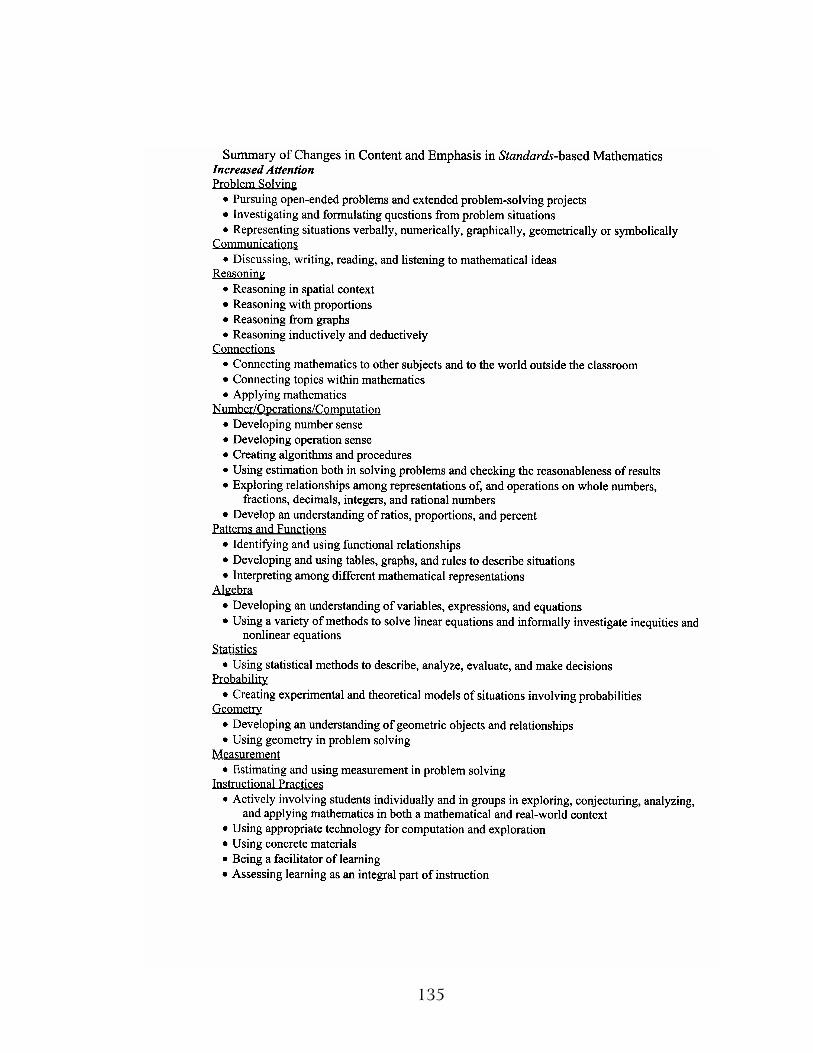
135

136
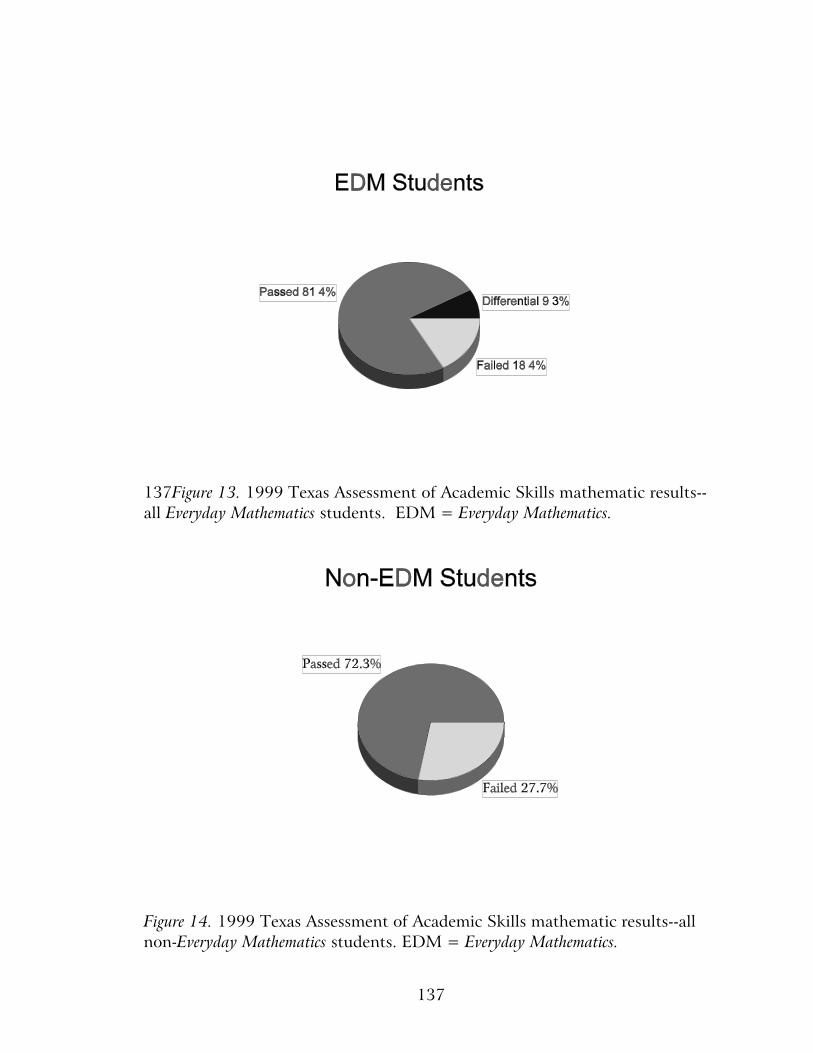
137
137Figure 13. 1999 Texas Assessment of Academic Skills mathematic results--all Everyday Mathematics students. EDM = Everyday Mathematics.
Figure 14. 1999 Texas Assessment of Academic Skills mathematic results--allnon-Everyday Mathematics students. EDM = Everyday Mathematics.

138
Figure 15. 1999 Texas Assessment of Academic Skills mathematics results--African-American Everyday Mathematics students. EDM = EverydayMathematics.
Figure 16. 1999 Texas Assessment of Academic Skills mathematic results--African-American non-Everyday Mathematics. EDM = Everyday Mathematics.
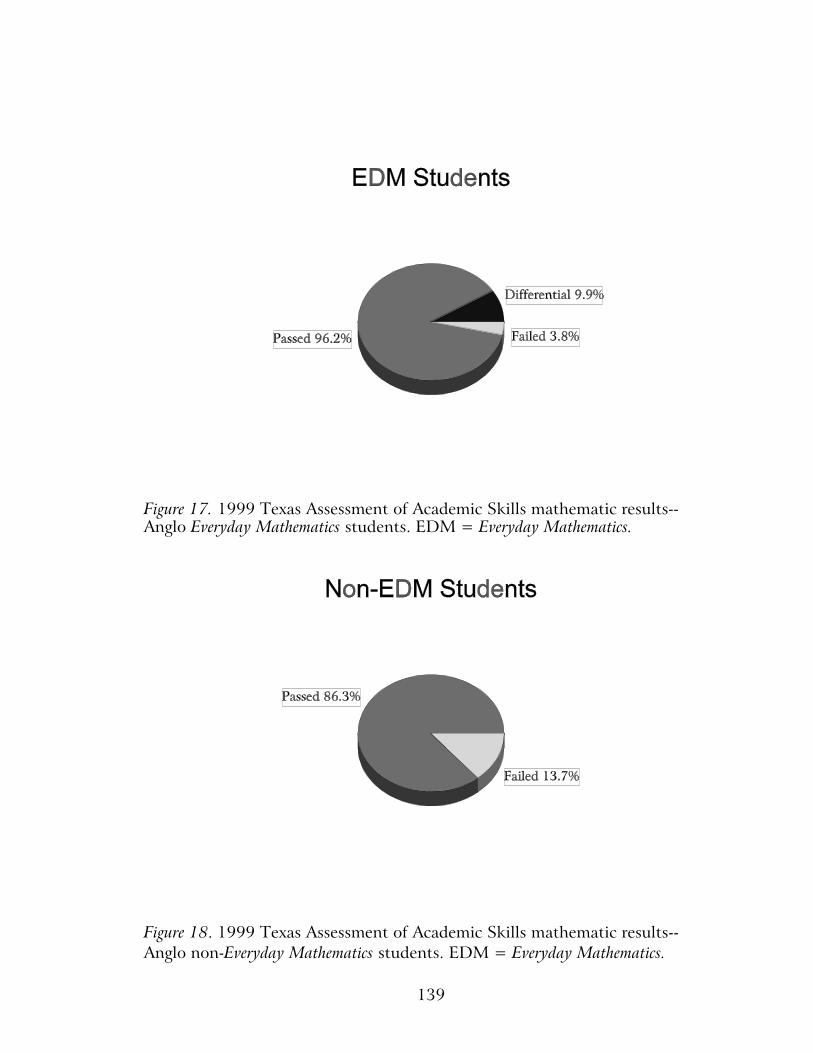
139
Figure 17. 1999 Texas Assessment of Academic Skills mathematic results--Anglo Everyday Mathematics students. EDM = Everyday Mathematics.
Figure 18. 1999 Texas Assessment of Academic Skills mathematic results--Anglo non-Everyday Mathematics students. EDM = Everyday Mathematics.
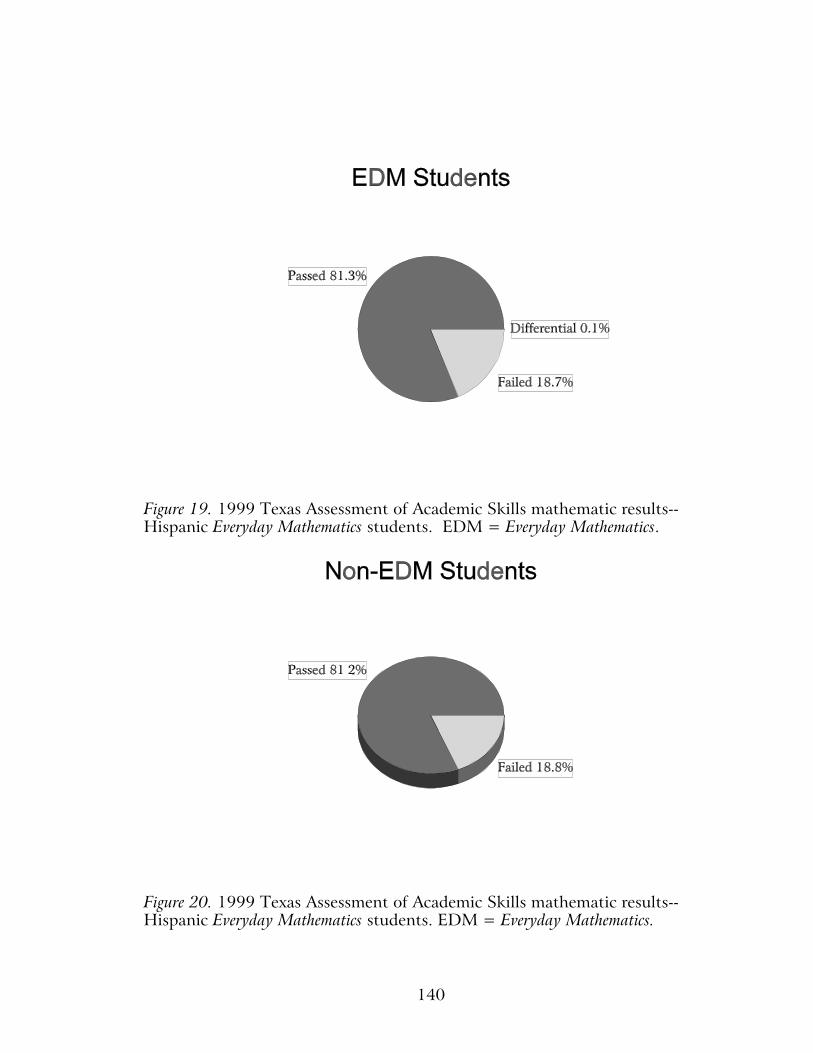
140
Figure 19. 1999 Texas Assessment of Academic Skills mathematic results--Hispanic Everyday Mathematics students. EDM = Everyday Mathematics.
Figure 20. 1999 Texas Assessment of Academic Skills mathematic results--Hispanic Everyday Mathematics students. EDM = Everyday Mathematics.
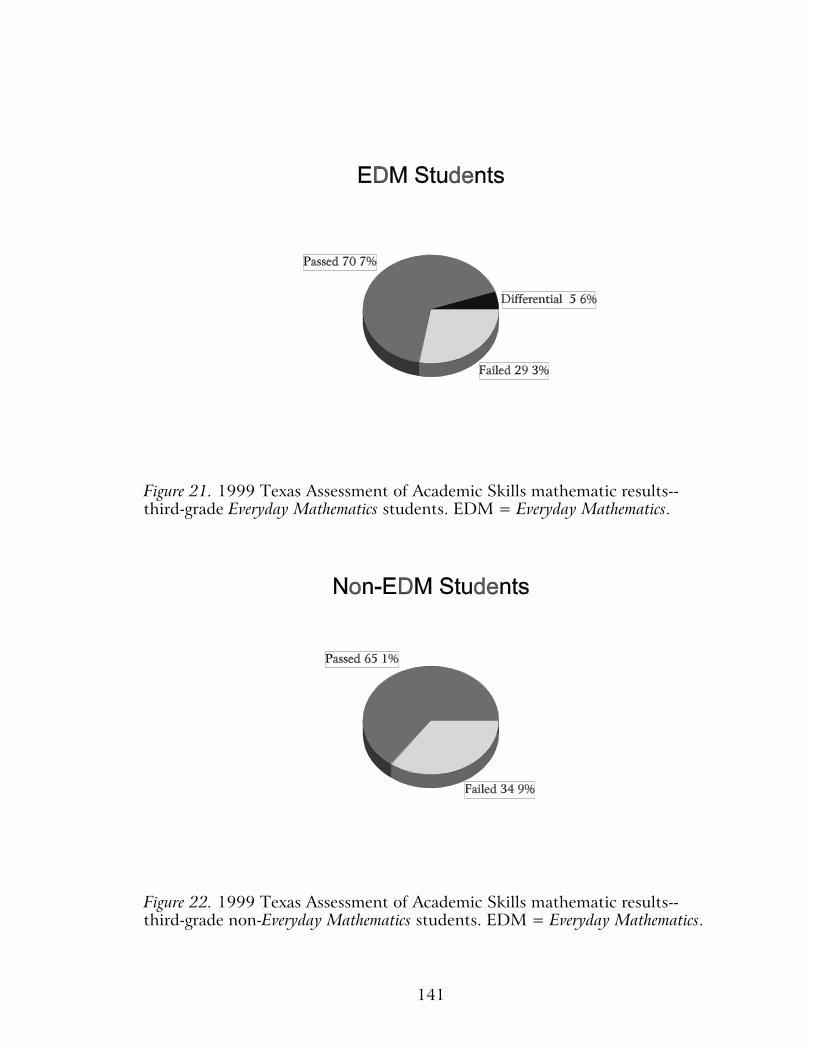
141
Figure 21. 1999 Texas Assessment of Academic Skills mathematic results--third-grade Everyday Mathematics students. EDM = Everyday Mathematics.
Figure 22. 1999 Texas Assessment of Academic Skills mathematic results--third-grade non-Everyday Mathematics students. EDM = Everyday Mathematics.
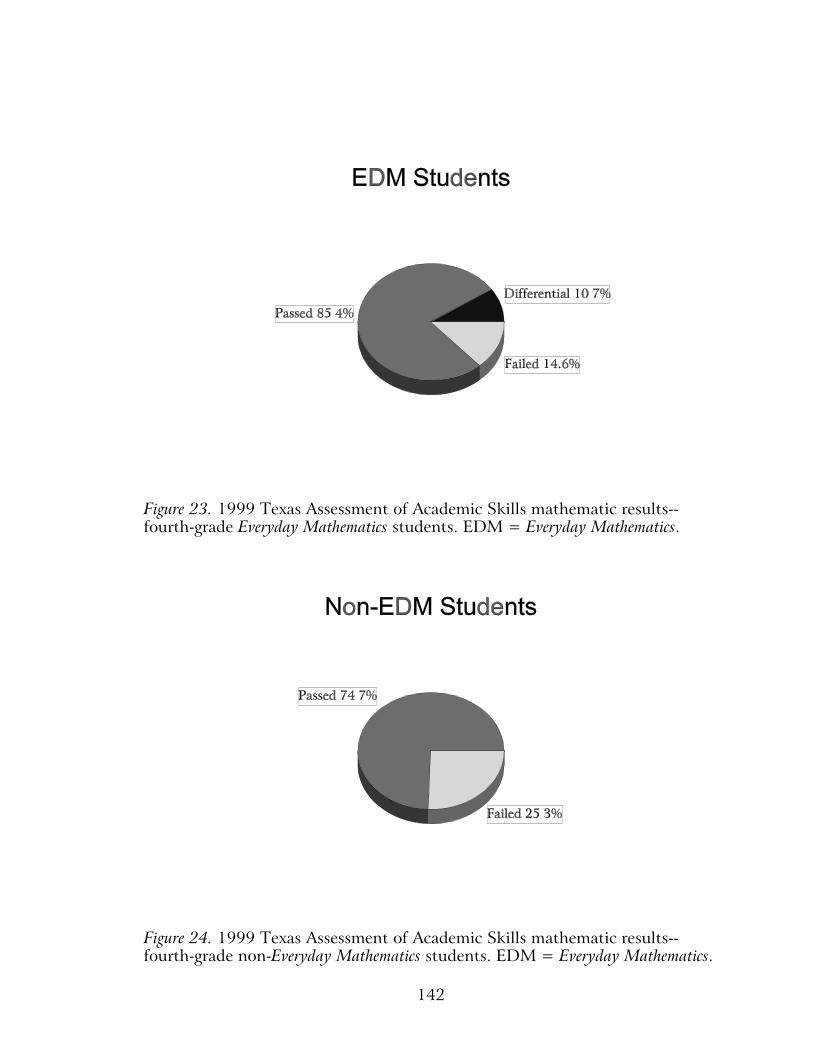
142
Figure 23. 1999 Texas Assessment of Academic Skills mathematic results--fourth-grade Everyday Mathematics students. EDM = Everyday Mathematics.
Figure 24. 1999 Texas Assessment of Academic Skills mathematic results--fourth-grade non-Everyday Mathematics students. EDM = Everyday Mathematics.

143
Figure 25. 1999 Texas Assessment of Academic Skills mathematic results--fifth-grade Everyday Mathematics students. EDM = Everyday Mathematics.
Figure 26. 1999 Texas Assessment of Academic Skills mathematic results--fifth-grade non-Everyday Mathematics students. EDM = Everyday Mathematics.
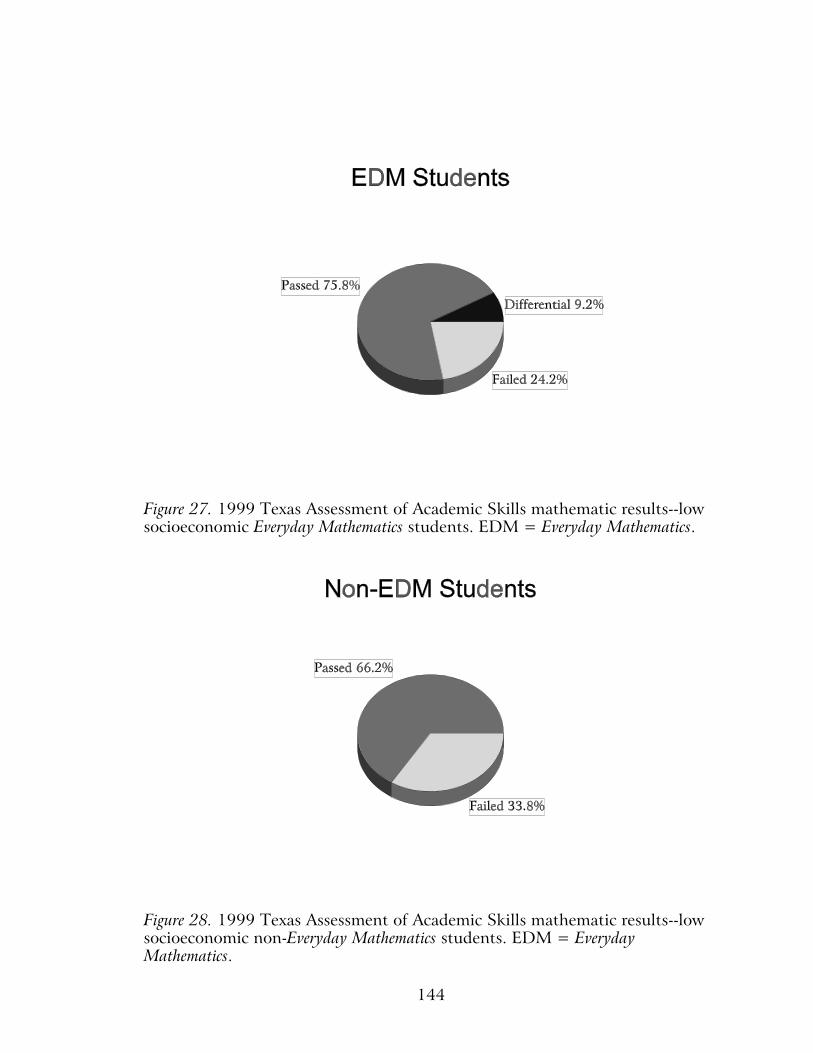
144
Figure 27. 1999 Texas Assessment of Academic Skills mathematic results--lowsocioeconomic Everyday Mathematics students. EDM = Everyday Mathematics.
Figure 28. 1999 Texas Assessment of Academic Skills mathematic results--lowsocioeconomic non-Everyday Mathematics students. EDM = EverydayMathematics.

145
Figure 29. 1999 Texas Assessment of Academic Skills mathematic results--highsocioeconomic Everyday Mathematics students. EDM = Everyday Mathematics.
Figure 30. 1999 Texas Assessment of Academic Skills mathematic results--highsocioeconomic non-Everyday Mathematics students. EDM = EverydayMathematics.

146
Figure 31. 1999 Texas Assessment of Academic Skills mathematic results--maleEveryday Mathematics students. EDM = Everyday Mathematics.
Figure 32. 1999 Texas Assessment of Academic Skills mathematic results--malenon-Everyday Mathematics students. EDM = Everyday Mathematics.

147
Figure 33. 1999 Texas Assessment of Academic Skills mathematic results--female Everyday Mathematics students. EDM = Everyday Mathematics.
Figure 34. 1999 Texas Assessment of Academic Skills mathematic results--female non-Everyday Mathematics students. EDM = Everyday Mathematics.
148
REFERENCES
Baptista, M. T. (1999). The mathematical miseducation of America'syouth. Phi Delta Kappan, 80(6), 425-433.
Bishop, W. (1999). The California mathematics standards, they're notonly right; they're the law. Phi Delta Kappan, 80(6), 439-440.
Brandt, R. (2000). Education in a new era. Alexandria, VA: Associationfor Supervision and Curriculum Development.
Briars, D. J. (1999, January). Square one: Promoting systemic mathreform. The School Administrator, 59(1), 32-36.
Buckeye, D. (1999). NCTM standards for school mathematics. RetrievedDecember 12, 1999 from the World Wide Web:http://www.explorer.scrtec.org/standards.htm
Carroll, W. M. (1996, April). Mental computational skills of students in areform mathematics curriculum. Paper presented at the Annual Meeting of theAmerican Educational Research Association, New York.
Civil, M. (1995, April). Everyday mathematics, "mathematician's"mathematics, and school mathematics: Can we bring these three together? Paperpresented at the Annual Meeting of the American Educational ResearchAssociation, San Francisco.
Clark, A., Gilespie, J., & Kanter, P. (1998). Everyday counts. Willington,MA: Houghton Mifflin.
Clements, D. H., Jones, K. W., Moseley, L. G., & Schulman, L. (1999).Math in my world. New York: McGraw-Hill.
Clopton, P., Clopton, J., McKeown, E., & McKeown, M. (1998). Reviewof mathematics textbooks for Texas adoption. Education Connection of Texas, SanAntonio. Retrieved December 11, 1999 from the World Wide Web:http://www.fastlane.net/-eca/mathreview.html
149
Colvin, R. L. (1999). Math wars: Traditional versus real-worldapplications. The School Administrator, 59(1), 26-30.
Council of Chief State School Officers. (1997). Mathematics and sciencecontent standards and curriculum framework. Alexandria, VA: Author.
Dallas Public Schools. (1996). Core curriculum 1996-97. A CD-ROMcomponent of district curriculum, K-12. Dallas: Dallas Public Schools, Officeof Curriculum and Instruction.
Dallas Public Schools. (1999). School snapshots 1998-99. Dallas, TX:Dallas Public Schools, Office of Institutional Research.
Diegmueller, K. (1995). Goals 2000, standard-based reform. RetrievedJanuary 2, 2000 from the World Wide Web:http://www.ed.gov/updates/g2k.html
Education Development Center. (1999). Retrieved August, 24, 1999from the World Wide Web: http://www.edc.org/mcc/curricula.htm
Everyday Learning Corporation. (1999a). Engaging lessons and expandinglearning. Retrieved December 29, 1999 from the World Wide Web:http://www.everydaylearning.com/Pages/lessons.html
Everyday Learning Corporation. (1999b). Everyday mathematics.Retrieved December 29, 1999 from the World Wide Web:http://www.everydaylearning.com
Everyday Learning Corporation. (1999c). High expectations and enrichedcontent. Retrieved December 29, 1999 from the World Wide Web:http://www.everydaylearning.com/Pages/content.html
Everyday Learning Corporation. (1999d). Results of studies of EverydayMathematics. Retrieved August 15, 1999 from the World Wide Web:http://www.everydaylearning.com/Pages/results.html
Everyday Learning Corporation. (2000). Everyday learning 2000.Chicago: Author.
150
Fennell, F., Ferrini-Mundy, J., Ginsburg, H., Greenes, C., Murphy, S., &Tate, W. (1999). Mathematics: Teacher's edition. Reading, MA: Silver BurdettGinn.
Finn, C. (1989, April). Real reform in education. A speech given before theUnited States Congress Joint Committee on Education. Washington, DC:Government Printing Office.
Heid, M. K. (1997). The technological revolution and the reform ofschool mathematics. American Journal of Education, 106, 5-61.
Hiebert, J. (1999). Relationships between research and the NCTMstandards. Journal for Research in Mathematics, 30(1), 3-19.
Hirsch, E. D., Jr. (1996). Disturbing trends in education. AmericanEducator, 53(3), 45-47.
Hoffer, A., Johnson, M., Leinward, S., Lodholz, R., Musser, G., &Thoburn, T. (1992). Mathematics in action. New York: Macmillan/McGraw-HillSchool Publishing.
Hoyles, C., Morgan, C., & Woodhouse, G. (1999). Rethinking themathematics curriculum. London: Falmer Press.
Jamison, A. (1998). Applying standards to classroom practices. Paperpresented at the meeting of the National Council of Teachers of Mathematics,Dallas, TX.
Lappan, G., Fey, J., Fitzgerald, W., Friel, S., & Phillips, E. (1998).Connected mathematics. White Plains, NY: Dale Seymour Publications.
Marzano, R. J., & Kendall, J. S. (1996). The fall and rise of standards-basededucation. A National Association of State Boards of Education issues in brief.Washington, DC: National Association of State Boards of Education.
Masingila, J. O. (1995, April). Examining students' perceptions of everydaymathematics practice. Paper presented at the Annual Meeting of the AmericanEducational Research Association, San Francisco.
151
Mathematically Correct. (1998, April). Toward a cease-fire in the mathwars. Retrieved January 2, 2000 from the World Wide Web:http://www.mathematicallycorrect.com/cease.htm
National Commission on Excellence in Education. (1983). A nation atrisk: An imperative for educational reform. Washington, DC: National ScienceFoundation, Directorate for Education and Human Resources.
National Council of Teachers of Mathematics. (1989a). Curriculum andevaluation standards for school mathematics. Reston, VA: Author.
National Council of Teachers of Mathematics. (1989b). New directionsfor elementary school mathematics. Reston, VA: Author.
National Council of Teachers of Mathematics. (1990). Teaching andlearning mathematics in the 1990s. Washington, DC: U. S. Government PrintingOffice.
National Council of Teachers of Mathematics. (1991). Professionalstandards for teaching mathematics. Reston, VA: Author.
National Council of Teachers of Mathematics. (1995). Assessmentstandards for school mathematics. Reston, VA: Author.
National Council of Teachers of Mathematics. (1999a). RetrievedNovember 20, 1999 from the World Wide Web: http://www.nctm.org
National Council of Teachers of Mathematics. (1999b). Missions andgoals. Retrieved December 11, 1999 from the World Wide Web:http://www.nctm.org/about/general.information/Mission.and.Goals.htm
National Education Goals Panel. (1991). Goals 2000. National Councilon Excellence in Education. Washington, DC: U. S. Government PrintingOffice.
National Research Council. (1996). National science education standards.Washington, DC: National Academy Press.
152
National Science Foundation. (1988). The NSF: A brief history.Washington, DC: National Science Foundation, Directorate for Education andHuman Resources.
National Science Foundation. (1994). Foundations for the future.Washington, DC: National Science Foundation, Directorate for Education andHuman Resources.
National Science Foundation. (1999). Retrieved December, 1999 fromthe World Wide Web: http://www.nsf.gov
Noddlings, N. (1997). Thinking about standards. Phi Delta Kappan,79(3), 184-189.
Norman, J., Stein, M., Moussiaux, S., & Clay-Chambers, J. (1998). Theeffect of the Detroit Urban Systemic Initiative on perceived instructional practices andcurriculum adequacy. Paper presented at the Annual Conference of the NationalAssociation for Research in Science Teaching, San Diego, CA.
O'Brien, T. C. (1999). Parrot math. Phi Delta Kappan, 80(6), 434-438.
O'Neil, W. (1995). The role of standards in educational reform.Rethinking Schools, An Urban Education Journal, 14(8), 8-18.
Perry, P. J. (1997). Guide to math materials resources to support the NCTMstandards. Englewood, CO: Teacher Idea Press.
Quirk, W. G. (1998). The truth about the NCTM standards. RetrievedDecember 18, 1999 from the World Wide Web:http://www.wgquirk.com/Genmath.html
Ravitch, D. (1995). National standards in American education: A citizen'sguide. Washington, DC: Brookings.
Resnick, L. B. (1987). Education and learning to think. Washington, DC:National Academy Press, National Research Center.
Romberg, T. A. (1995). Reform in school mathematics and authenticassessment. Albany: State University of New York Press.
153
Schneider, D., Adler, S., Beery, R., Ladson-Billings, G., Frenekes, W.,McFarland, M., Marker, G., Montgomery, M., Nickell, P., & Travis, C.(1994). Expectations of excellence: Curriculum standards for social studies.Washington, DC: National Council for the social studies.
Schoen, H. L., Fey, J. T., Hirsch, C. R., & Coxford, A. F. (1999). Issuesand options in the math wars. Phi Delta Kappan, 80(6), 444-453.
Silver, J. (1990). Contributions of research to practice: Applying findings,methods, and perspectives. Washington, DC: Office of Educational Research andImprovement.
Silver-Burdett-Ginn School Products. (1999). Retrieved December 15, 1999from the World Wide Web: www.sbgschool.com/products/math.html
SPSS. (1999). SPSS Base 9.0 application guide. Chicago: Author.
Steinberg, L. (1996). Beyond the classroom. New York: Simon andSchuster.
Stepanek, J. (1997). Science and mathematics standards in the classroom.Seattle, WA: Northwest Research and Evaluational Laboratory.
Suydam, M. N. (1990). Curriculum and evaluation standards formathematics. ERIC/SNEAC Mathematics Education Digest. Washington, DC:Office of Educational Research and Improvement.
Texas Education Agency. (1997a). TAAS technical digest. Austin: Author.
Texas Education Agency. (1997b). Texas essentials of knowledge and skills:Learning standards for children. Austin: Author.
Texas Education Agency. (1998a). 1998 summary of student performanceresults. Austin: Author.
Texas Education Agency. (1998b). TEKS: Learning standards for Texasstudents. Austin: Author.
154
Texas Education Agency. (1999a). About the student assessment program. Retrieved December 15, 1999 from the World Wide Web:http://www.tea.state.us/student.assessment/about/overview.htm
Texas Education Agency. (1999b). 1999-2000 educator's guide toTEKS-based assessment. Austin: Author.
Texas Education Agency. (1999c). TEA technical guide to TAAS. Austin:Author.
Texas Education Agency. (1999d). Textbook inventory. Austin: Author.
Texas Education Agency. (2000). State systemic initiative. RetrievedMarch 30, 2000 from the World Wide Web: http://www.tea.texas.gov/ssi.html
Texas Education Code. §§ 39.021-39.023 (1995).
Texas Public Policy Foundation. (1999). Texas school districts reject"fuzzy math" textbooks--major defeat for statewide systemic initiative. TexasPublic Policy Update, 3(24), 1-14.
Texas Teachers of Mathematics. (1998). Review of math textbooks for thenext Texas adoption. Austin: Author.
The University of Chicago School Mathematics Project. (1997). Towardsa balanced assessment for Everyday Mathematics. Chicago: Everyday LearningCorporation.
The University of Chicago School Mathematics Project. (1998a).Everyday mathematics: Math minutes. Chicago: Everyday Learning Corporation.
The University of Chicago School Mathematics Project. (1998b).Everyday mathematics: Resource book. Chicago: Everyday Learning Corporation.
The University of Chicago School Mathematics Project. (1998c).Everyday mathematics: Teacher's guide and lesson plans. Chicago: Everyday LearningCorporation.

155
The University of Chicago School Mathematics Project. (1998d).Everyday mathematics: Teacher's reference manual. Chicago: Everyday LearningCorporation.
The University of Chicago School Mathematics Project. (1998e, Fall).Looking back at Everyday Mathematics, Teacher Links, 8(3). Chicago: EverydayLearning Corporation.
Urban Systemic Program. (1999). Retrieved November 20, 1999 fromthe World Wide Web: http://www.ehr.nsf.gov/EHR/ESR/usp.asp