Embed Size (px)
Citation preview

A Study of the Validity of the Eating Disorder Examination
A DISSERTATION SUBMITTED TO THE FACULTY OF THE GRADUATE
SCHOOL OF THE UNIVERSITY OF MINNESOTA BY
Kelly Christina Berg
IN PARTIAL FULFILLMENT OF THE REQUIREMENTS FOR THE DEGREE OF
DOCTOR OF PHILOSOPHY
Professor Patricia Frazier
June, 2010

© Kelly Christina Berg 2010

i
Acknowledgements
I would like to give a special thank you to my advisor, Patricia Frazier, Ph.D.,
who has challenged and supported me throughout my graduate school career. It is her
expectation of excellence that has propelled me to reach my potential. I want to also
thank Jo-Ida Hansen, Ph.D., for chairing my dissertation committee and instilling in me a
great sense of pride for the University of Minnesota’s Counseling Psychology program. I
am grateful to Scott Crow, M.D., for recognizing my passion for psychology and giving
me the opportunity to explore the field of eating disorders in the University of
Minnesota’s Department of Psychiatry. Last, but not least, I want to extend my
appreciation to Carol Peterson, Ph.D., who introduced me to the Eating Disorder
Examination. Her fascination with assessment and compassion for her students has had
an indelible impact on my training. These four mentors all generously volunteered their
time and patience as members of my dissertation committee. Under their tutelage, I
always felt that my training was a priority and that my contributions had value. For this, I
am forever grateful.
I would like to express my sincere gratitude to Carol Peterson, Ph.D., Jim
Mitchell, M.D., Scott Crow, M.D., Ross Crosby, Ph.D., and Steve Wonderlich, Ph.D. for
granting me permission to use data from their treatment-outcome study for Binge Eating
Disorder. I would also like to thank Carol Peterson, Ph.D. for volunteering her time and
expertise to coding food logs so that I could run interrater agreement statistics for the
second study described in this manuscript. Thank you to Doug Hawkins, Ph.D. and Ross
Crosby, Ph.D. for their patience in answering even the most mundane statistics questions.

ii
I am indebted to Daniel le Grange, Ph.D. for introducing me to treatment-outcome
research while I was an undergraduate student at Northwestern University and for serving
as my mentor during my pre-doctoral internship at the University of Chicago Medical
Center. His good humor and sage advice has always been appreciated. A special thank
you goes to Sue Christiansen, MSW, for introducing me to the field of mental health
when I was a high school student. The benevolence and encouragement she has given me
during this journey is something I hope to give my own trainees in the future.
I would like to thank my outstanding clinical supervisors, especially Angela
Doyle, Ph.D., Chris Donahue, Ph.D., Karen Kattar, Psy.D., Matt Kushner, Ph.D., Lisa
Rogers, Ph.D., Lisa Sanchez-Johnsen, Ph.D., Shona Vas, Ph.D., who have guided my
development as a clinician with steadfast support and encouragement.
I have been lucky enough to find myself on this journey with incredible peers. A
special thank you to Aimee Arikian, M.A., Stephanie Assuras, M.Phil., Nazneen
Bahrassa, Peter Doyle, Ph.D., Nora Durkin, Vanessa Lee, Ph.D., Melanie Leuty, Matthew
Thornton, M.A., and Sue Song, Ph.D., all of whom I could turn to for empathy,
validation, or a good laugh when I needed it. Thank you also to the countless friends and
family who have encouraged my progress in graduate school and who have humored me
with questions about this dissertation and endured the elaborate response that followed.
I have been blessed with wonderful parents, Don and Mary Berg, who instilled in
me the value of education and hard work. Because of them, I grew up believing I could
be whatever I wanted to be. I am grateful for their unconditional love, which gave me the
iii
courage to chase my dreams. Thank you also to my sisters, Jessica and Jennifer; their
support and quick wit always provided me with great relief.
Finally, words cannot describe my gratitude to my husband, Douglas Bowles,
who has always pushed me to be the best version of myself. He has seen me through the
entire process of graduate school and has shared in my successes as well as my
disappointments. He has shown me endless patience and unwavering devotion, even in
my worst moments of self-doubt and despair. This dissertation is as much a testament to
his tenacity as it is to mine and as such, it is dedicated to him.

iv
Abstract
The Eating Disorder Examination (EDE), an investigator-based interview, and the
questionnaire version of the EDE (EDE-Q) are considered the preeminent assessments of
eating disorder symptoms. Despite their status as gold-standard eating disorder
assessments, research on the psychometric properties of these measures is limited. The
current studies aimed to enhance these data, specifically with regard to the convergence
of the EDE and EDE-Q and the validity of the EDE in the assessment of binge eating. For
the first study, a meta-analysis of 15 studies on the convergent validity of the EDE and
EDE-Q using correlation coefficients and Cohen’s d was conducted. The results
demonstrated convergence between the EDE and EDE-Q for the assessment of cognitive
symptoms and compensatory behaviors, but limited convergence for the assessment of
binge eating. A second study compared the frequency of binge eating recalled on the
EDE to that reported in Daily Food Records (DFRs) by 34 participants. The results
demonstrated convergence between the EDE and DFRs for the assessment of Objective
Bulimic Episodes and Total binge frequency in Month 1. These studies suggest that the
EDE and EDE-Q assess similar constructs, but indicate that they should not be used
interchangeably. Additionally, the data provide preliminary support for the use of the
EDE in the assessment of binge eating during the past month.

v
Table of Contents
LIST OF TABLES……………………………………………………………………….vii
LIST OF FIGURES..……………………………………………………………………..ix
OVERVIEW OF THE DISSERTATION AND LITERATURE REVIEW………………1
Brief Review of the Pathology of Eating Disorders………………………………2
Description of the Eating Disorder Examination………………………………….4
Diagnostic Importance of the Eating Disorder Examination ……...……………...8
VALIDATION OF THE EATING DISORDER EXAMINATION……………………...9
Study 1: Examination of the Convergent Validity of the EDE and EDE-Q using Meta-analysis
Literature Review...………………………………………….………….....9
Method and Data Analysis Plan……..…………………………………...14
Results……………………………………………………….…………...20
Discussion……………………………………………………….……….25
Study 2: Convergent and Discriminant Validity of the EDE with Regard to the Assessment of Binge Eating
Literature Review...………………………………………….…………...31
Method and Data Analysis Plan..………………………………………...39
Results……………………………………………………….…………...54
Discussion……………………………………………………….……….62
REFERENCES…………………………………………………………………………106
APPENDIX A: Empirical Findings on the Reliability of the EDE……..……………...118
APPENDIX B: Empirical Findings on the Reliability of the EDE-Q…..……………...124

vi
APPENDIX C: Theoretical Perspectives on Validity..….……………………………...128
APPENDIX D: Empirical Findings on the Validity of the EDE………….……………133
APPENDIX E: Empirical Findings on the Validity of the EDE-Q……….……………137
APPENDIX F: Empirical Findings on the Convergent Validity between the EDE and the
EDE-Q..…………………………………………………………………………………142
vii
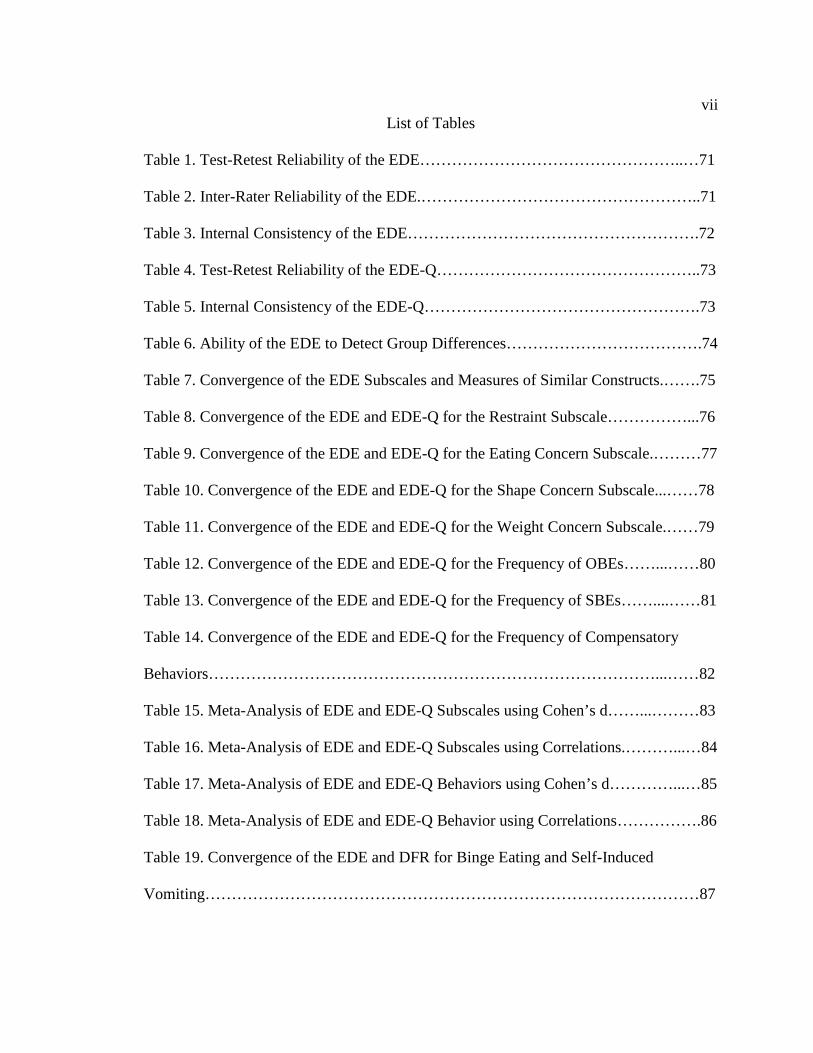
List of Tables
Table 1. Test-Retest Reliability of the EDE…………………………………………..…71
Table 2. Inter-Rater Reliability of the EDE.……………………………………………..71
Table 3. Internal Consistency of the EDE……………………………………………….72
Table 4. Test-Retest Reliability of the EDE-Q…………………………………………..73
Table 5. Internal Consistency of the EDE-Q…………………………………………….73
Table 6. Ability of the EDE to Detect Group Differences……………………………….74
Table 7. Convergence of the EDE Subscales and Measures of Similar Constructs.…….75
Table 8. Convergence of the EDE and EDE-Q for the Restraint Subscale……………...76
Table 9. Convergence of the EDE and EDE-Q for the Eating Concern Subscale.………77
Table 10. Convergence of the EDE and EDE-Q for the Shape Concern Subscale...……78
Table 11. Convergence of the EDE and EDE-Q for the Weight Concern Subscale.……79
Table 12. Convergence of the EDE and EDE-Q for the Frequency of OBEs……...……80
Table 13. Convergence of the EDE and EDE-Q for the Frequency of SBEs……....……81
Table 14. Convergence of the EDE and EDE-Q for the Frequency of Compensatory
Behaviors…………………………………………………………………………...……82
Table 15. Meta-Analysis of EDE and EDE-Q Subscales using Cohen’s d……...………83
Table 16. Meta-Analysis of EDE and EDE-Q Subscales using Correlations.………...…84
Table 17. Meta-Analysis of EDE and EDE-Q Behaviors using Cohen’s d…………...…85
Table 18. Meta-Analysis of EDE and EDE-Q Behavior using Correlations…………….86
Table 19. Convergence of the EDE and DFR for Binge Eating and Self-Induced
Vomiting…………………………………………………………………………………87

viii
Table 20. Comparison of the EDE and DFR in the Full Sample………………………...88
Table 21. Significance Testing: OBEs Across Months………………………………….89
Table 22. Comparison of the EDE and DFR when Zero-Pairs are Excluded…………....90
Table 23. Significance Testing: Full Sample versus Exclusion of Zero-Pairs…………..91
Table 24. Significance Testing: Days versus Episodes………………………………….92
Table 25. Significance Testing: OBEs versus SBEs versus Total Binges Reported in
Month 1…………………………………………………………………………………..93
Table 26. Correlation Matrix for the EDE and Related Constructs in Month 1…………94
Table 27. Discriminant Validity of the EDE…………………………………………….95
Table 28. Analysis of Contamination……………………………………………………96

ix
List of Figures
Figure 1. Comparison of EDE and DFR..……………………………………………….97
Figure 2. Significance Testing: Days versus Episodes.………………………………….97
Figure 3. Significance Testing: OBE Days versus SBE Days versus Total Days……….98
Figure 4. Significance Testing: OBE Episodes versus SBE Episodes versus Total
Episodes………………………………………………………………………………….98
Figure 5. Construct Validity Correlation Matrix………………………………..……….99
Figure 6. Dscriminant Validity………………...………………………………..……….99
Figure 7. Analysis of Contamination…………..………………………………..……...100
Figure 8. Individual Differences: OBEs, SBEs, and Total Binges in Month 1………...101
Figure 9. Individual Differences: OBEs in Months 1-3………………………………..102
Figure 10. Analysis of Sensitivity, Specificity, PPV, and NPV for Month 1: OBEs
Only……………………………………………………………………………………..103
Figure 11. Analysis of Sensitivity, Specificity, PPV, and NPV for Month 1: Total
Episodes………………………………………………………………………………...104
Figure 12. Analysis of Sensitivity, Specificity, PPV, and NPV for Months 1-3: OBEs
Only……………………………………………………………………………………..105

1
OVERVIEW OF THE DISSERTATION AND LITERATURE REVIEW
Introduction
Eating disorders are serious mental illnesses that are difficult to treat, and
reportedly have the highest mortality rates of any mental illness (Hoek, 2006). Three
eating disorders currently are included in the Diagnostic and Statistical Manual for
Mental Disorders (DSM), 4th edition, Text Revision (DSM-IV-TR; American Psychiatric
Association, 1994): Anorexia Nervosa (AN), Bulimia Nervosa (BN), and Eating Disorder
Not Otherwise Specified (EDNOS). However, with the 5th edition of the DSM on the
horizon, the validity of these diagnoses is being questioned. As the issue of diagnostic
validity takes center stage, the issue of the validity of eating disorder assessment is of
increased importance. Without valid assessments of the symptomatology associated with
eating disorders, diagnostic criteria cannot be implemented.
The Eating Disorder Examination (EDE) is a semi-structured interview that
assesses the cognitive and behavioral symptoms associated with eating disorders
(Fairburn & Cooper, 1993). The EDE is widely considered the preeminent eating disorder
assessment (Wilson, 1993). Researchers and clinicians alike use the EDE to obtain
descriptive information, to assess dependent variables in studies, and as a diagnostic tool.
Its status as the gold standard of eating disorder assessment has also given the EDE the
weighty responsibility of serving to validate other assessments (e.g., Grilo, Masheb, &
Wilson, 2001a; Reas, Grilo, & Masheb, 2006).
Organization of the Dissertation

2
This dissertation is organized as follows. First, I briefly review the pathology of
eating disorders, placing emphasis on the diagnostic criteria outlined by the DSM-IV-TR.
I then introduce the EDE and discuss its diagnostic importance, specifically with regard
to the assessment of binge eating. Next, I describe two studies designed to examine the
validity of the EDE. The first is a quantitative review of the extant research on the
convergent validity of the EDE and EDE-Q using meta-analysis. The second study
examines the convergent and discriminant validity of the EDE with regard to the
assessment of binge eating. The description of each study includes a literature review on
the psychometric properties of the EDE most relevant to that particular study as well as
details regarding the method, results, implications, and limitations of the study.
Brief Review of the Pathology of Eating Disorders
The DSM-IV-TR (APA, 1994) acknowledges three types of eating disorders:
Anorexia Nervosa (AN), Bulimia Nervosa (BN), and Eating Disorder Not Otherwise
Specified (EDNOS). AN is characterized by refusal to maintain a body weight of at least
85% of the ideal body weight for age and height, an intense fear of becoming fat or
overweight even when underweight, body image distortions, overvaluation of shape and
weight, denial of illness, and amenorrhea (in postmenarcheal females). BN is also
characterized by an overvaluation of shape and weight, but the primary criteria are
discrete episodes of overeating and compensatory behavior (e.g., self-induced vomiting,
laxative or diuretic use, fasting, excessive exercise) that must occur at least twice per
week for three months. Any other symptom pattern that represents clinically significant
disordered eating is diagnosed as EDNOS. One example of EDNOS outlined in the

3
DSM-IV-TR is Binge Eating Disorder (BED) which is characterized primarily by eating
unusually large amounts of food in a discrete period of time with feelings of loss of
control over eating that are not followed by any compensatory behavior. The overeating
episodes must occur at least twice a week for 6 months and are characterized by eating
more rapidly than normal, eating large amounts of food when not physically hungry,
eating until feeling uncomfortably full, eating alone because of embarrassment, and
feeling disgusted with oneself, depressed, or very guilty after the episodes (APA, 1994).
Although BED is not recognized as a separate diagnosis in the DSM-IV-TR (1994), there
is strong support for its validity as a separate diagnosis (Wilfley, Bishop, Wilson, &
Agras, 2007).
A review of epidemiologic research has found prevalence rates ranging from 0%
to 0.9% for AN in women ages 12 to 22 and from 0.0% to 4.5% for BN in women ages
12 to 44 (Hoek & van Hoeken, 2003). The average prevalence rates in women are 0.3%
and 1.0% for AN and BN, respectively. EDNOS is the most common eating disorder,
accounting for approximately 60% of eating disorder cases (Hoek, 2006). One study
found the prevalence rate of EDNOS to be 2.4% among females (Machado, Machado,
Gonçalves, & Hoek, 2007). Additionally, studies using community samples have found
high rates of binge eating and compensatory behaviors in adolescents and college
students (e.g., Katzman, Wolchik, & Braver, 1984; le Grange, Lock, & Dymeck, 2003).
Although not as common as some psychiatric disorders, both AN and BN can
cause serious medical complications such as amenorrhea, anemia, bradycardia, high
cholesterol, fluid and electrolyte imbalance, hypokalemia, cardiac murmur, dull or

4
thinning hair, lanugo, and exhaustion (American Academy of Pediatrics, 2003). Although
many of these physical complications are reversible, some are not. For example, bone
density loss is associated with eating disorders and can lead to increased rates of
osteopenia, osteoporosis, and fractures (Crow, 2005). Bone matter can start to decline as
early as age 30; thus, bone loss density loss can be difficult if not impossible to correct
(Crow, 2005). Additionally, AN is commonly cited as having the highest mortality rate of
any mental illness, with mortality rates ranging from 3.3% to 18% (Hoek, 2006). The
most common causes of mortality in AN are suicide and complications from the eating
disorder such as cardiac failure (Hoek, 2006).
The number and severity of the medical complications associated with eating
disorders make it imperative that effective treatments are identified. The efficacy of
Cognitive Behavioral Therapy (CBT) for treating adult BN and Family Based Therapy
(FBT) for treating adolescent AN is well-documented (le Grange & Lock, 2005). There is
also preliminary research supporting the efficacy of Interpersonal Therapy (IPT) in the
treatment of adult BN and FBT in the treatment of adolescents with BN (Wilson, Grilo,
& Vitousek, 2007). Unfortunately, no empirically-supported treatment for adult AN has
been identified (le Grange & Lock, 2005). Because research has found that AN and BN
do not necessarily respond to the same treatments, it is important to find reliable, valid
assessments of diagnostic status so that clients receive the best care possible.
Description of the Eating Disorder Examination
The EDE (Fairburn & Cooper, 1993) is a semi-structured interview as it includes
required questions that must be asked, but allows the interviewer to ask individually-

5
tailored follow-up questions that may be necessary to rate an item. The EDE has four
subscales that focus primarily on cognitive symptoms: Restraint, Eating Concern, Shape
Concern, and Weight Concern. The EDE also includes a section that asks respondents
about behavioral symptoms, specifically, the frequency of binge eating and compensatory
behaviors. Most of the questions are based on the 28 day time period prior to the day of
assessment. However, respondents are asked to report the frequency of binge eating and
compensatory behaviors for up to the past 6 months as well. This time frame allows the
EDE to be used as a diagnostic instrument.
The EDE is comprised of approximately 46 items. Most of the questions are rated
on a 7-point Likert scale, ranging from 0 (asymptomatic) to 6 (severe); the exceptions are
those questions that ask for specific numerical responses (e.g., frequency of binge eating
and compensatory behaviors, frequency of self-weighing, ideal weight). Many of the
Likert-scaled items are combined to form the following 4 subscales: Restraint, Eating
Concern, Shape Concern, and Weight Concern. The Restraint subscale, which assesses
the extent to which the person is restrictive in the amount or types of food eaten has 5
items (e.g., “Over the past four weeks, have you been consciously trying to restrict the
overall amount that you eat, whether or not you have succeeded?”) The Eating Concern
subscale, which asks respondents the extent to which they feel preoccupied and distressed
about eating and whether they have avoided eating with others, also has 5 items (e.g., .
“Over the past four weeks, have you been afraid of losing control over eating?”) The
Shape Concern subscale includes 8 questions that address the level of importance
respondents place on their shape and how they feel about their own shape (e.g., “Over the

6
past four weeks have you been dissatisfied with your overall shape?”) Finally, the Weight
Concern subscale is comprised of 5 items that provide information on the level of
importance respondents place on their weight and how they feel about their weight (e.g., .
“Over the past four weeks, have you wanted to weigh less?”)
The EDE begins by orienting the respondent to the time frame. A calendar for the
past 28 days is provided and respondents are asked to describe any events during that
month that would help them remember the time period (e.g., days off of work or school,
holidays, vacations, celebrations, major life events). Research in alcohol dependence has
found that orienting participants to the time period relevant to the assessment is
associated with higher test-retest reliability (e.g., Sobell, Maisto, Sobell, & Cooper, 1979;
Sobell, Sobell, Klajner, Pavan & Basian, 1986). The first section of the EDE focuses on
questions related to food and eating. Respondents are asked to describe their general
pattern of eating during the past 28 days, specifically whether their pattern varied much
day to day, whether their pattern varied on the weekend, and if there were any days when
they ate nothing at all. The respondents are then asked to quantify exactly how many days
of the past 28 days they ate the following meals or snacks: breakfast, mid-morning snack,
lunch, mid-afternoon snack, dinner, evening snack, and nocturnal snack. Questions that
comprise the Restraint and Eating Concern subscales conclude the first section of the
EDE.
The second section of the EDE focuses on assessing the frequency of binge eating
and compensatory behaviors. The EDE assesses only those eating episodes in which the
respondent believes they have eaten too much food. Respondents are first asked: “I would

7
like to ask you about any episodes of overeating, or loss of control over eating, that you
might have had over the past four weeks. Different people mean different things by
overeating. I would like you to describe any times when you have felt that you have eaten
too much in one go (at one time).” Additional probes include: “And any times you have
felt you have lost control over eating?,” “Have there been any times when you have felt
that you have eaten too much, but others might not agree?,” and “Have there been any
times when you have felt that you have eaten an ordinary amount of food but others
might have regarded you as having overeaten?”
These eating episodes are classified regarding whether the eating episode was
objectively large and whether the respondents felt a sense of loss of control during the
episode. Objective Bulimic Episodes (OBEs) are episodes in which the respondent has
eaten an objectively large amount of food and felt a loss of control during the episode and
correspond to the definition of binge eating episodes in the DSM-IV-TR. When
respondents have eaten an amount of food that would not be considered objectively large,
but still feel a sense of loss of control, the episode is classified as a Subjective Bulimic
Episode (SBE). If a respondent has an eating episode in which they ate an objectively
large amount of food, but has not felt a sense of loss of control, the episode is classified
as an Objective Overeating Episode (OOE). Eating episodes in which the respondent
does not eat an objectively large amount of food and has not felt a sense of loss of control
are defined as Subjective Overeating Episodes (SOEs). During SOEs, although the
respondent has not eaten an objectively large amount of food, the respondent believes
that s/he has overeaten. The EDE assesses the frequency of OBEs, SBEs, and OOEs; the

8
frequency of SOEs is not assessed because these types of episodes are not considered
pathological. Respondents are asked to report the number of days on which each of these
types of eating episodes occurred as well as the total number of each episode that
occurred during the 28 days. Additionally, the frequency of self-induced vomiting,
laxative misuse, diuretic misuse, and driven exercise during the past 28 days are also
assessed. As stated previously, the frequency of some items (e.g., OBEs, self-induced
vomiting, etc.) may be estimated for a longer duration (e.g., 3 months, 6 months) to
facilitate the diagnosis of an eating disorder.
The final section of the EDE includes items on the Shape Concern and Weight
Concern subscales and focuses on assessing cognitive symptoms of eating disorders
related to shape and weight. The EDE distinguishes between shape, which is thought of
as a person’s figure, and weight, which is the number a person sees on a scale. For many
people with eating disorders, shape and weight are interchangeable. However, anecdotal
evidence suggests that for some people with eating disorders, the focus is on shape
whereas for others, the focus is on weight. Respondents are asked to rate their level of
dissatisfaction with their shape/weight, the importance of their shape/weight in terms of
their evaluation of themselves, fear of weight gain, how uncomfortable they feel seeing
their body or others seeing their body, etc. These questions are necessary to establish
diagnostic status, but to also determine the severity of the respondent’s symptoms.
Diagnostic Importance of the Eating Disorder Examination
The DSM-IV-TR (APA, 1994) criteria for diagnoses of Bulimia Nervosa (BN)
and Binge Eating Disorder (BED) both require the presence of binge-eating episodes. In

9
contrast to the many cognitive variables that characterize eating disorders, binge eating is
one of the few behavioral markers of BN and BED. Thus, the frequency of binge eating
gives researchers and clinicians an important objective measure of disordered eating
behavior that can be used to supplement information regarding a client’s subjective
experience. In addition to its use in diagnosis, the frequency of binge eating has been
used to assess severity of symptoms, to define treatment goals, and as a dependent
variable in treatment studies. Its necessity to both research and clinical practice makes it
imperative to identify ways of measuring binge eating in a reliable and valid manner.
The DSM-IV-TR defines binge eating as “eating, in a discrete period of time, an
amount of food that is definitely larger than most people would eat during a similar
period of time and under similar circumstances” (APA,1994). Due to the ambiguity of
this definition, the EDE attempts to clarify the definition of binge eating (Fairburn &
Cooper, 1993). In addition to distinguishing between OBEs, SBEs, and OOEs, the EDE
includes guidelines for determining whether an eating episode is objectively large. The
general guideline is that if the person consumed two full meals, each of which included
two courses, or if the person consumed three entrees, that episode should be considered
large. Also included in the EDE are guidelines for the amount of specific foods that
would need to be consumed to rate an episode “large” (e.g., four conventional slices of
cake, six cups of dry cereal). Although the EDE contains specific guidelines, the
interviewer is allowed to take the circumstances surrounding the eating episode into
account when determining whether an episode is large (e.g., Thanksgiving Day). The
10
primary purpose of these guidelines is to increase the reliability and validity of the
assessment of binge eating.
VALIDATION OF THE EATING DISORDER EXAMINATION
Study 1: Examination of the Convergent Validity of the EDE and EDE-Q using Meta-
analysis
Literature Review
Due in part to its specificity in defining binge eating, the EDE has been described
as the most accurate assessment of eating disorders (Wilson, 1993). Unfortunately, the
EDE is lengthy to administer and requires significant amounts of assessor training. A
questionnaire version of the EDE (EDE-Q) was developed to address these limitations by
assessing the same constructs as the EDE in a self-report measure. The EDE-Q includes
the same items used to generate the Restraint, Eating Concern, Shape Concern, and
Weight Concern subscales as well as items used to determine the frequency of OBEs,
SBEs, and compensatory behaviors. Additionally, the EDE-Q items are worded almost
identically to those in the EDE. The primary difference between the EDE and EDE-Q is
that the EDE allows a trained assessor to clarify concepts and ask additional questions.
The psychometric properties of the EDE and EDE-Q have been examined in depth. The
following review will describe the reliability of the EDE and EDE-Q, the validity of the
EDE and EDE-Q, and the convergent validity of the EDE and EDE-Q.
Both instruments have demonstrated test-retest reliability (e.g., Grilo, Masheb,
Lozano-Blanco, & Barry, 2003; Reas, Grilo, & Masheb, 2006) and acceptable internal
consistency (e.g., Grilo, Crosby, Peterson, Masheb, White, Crow, et al., in press;

11
Peterson, Crosby, Wonderlich, Joiner, Crow, & Mitchell, 2007) for the four subscales
(i.e., Restraint, Eating Concern, Shape Concern, and Weight Concern). Additionally,
research supports the interrater reliability of the EDE (Grilo et al., 2003). For a more
detailed description of the reliability of the EDE and EDE-Q, please refer to Appendices
A and B respectively. The validity of these instruments has also been assessed. For a
complete discussion of the process of validation, please refer to Appendix C. Both the
EDE and EDE-Q have demonstrated an ability to distinguish between eating disorder and
non-eating disorder cases (e.g., Cooper, Cooper, & Fairburn, 1989; Mond, Hay, Rodgers,
Owen, & Beumont, 2004b) and the data indicate that the subscales of these assessments
are significantly related to measures of similar constructs (e.g., Loeb, Pike, Walsh, &
Wilson, 1994; Grilo, Masheb, & Wilson, 2001a). Factor analyses of the EDE and EDE-Q
provide limited support for the presence of four subscales (e.g., Byrne, Allen, Lampard,
Dove, & Fursland, in press; Hrbabosky, White, Masheb, Rothschild, Burke-Martindale,
& Grilo, 2008). For a more detailed description of the validity research on the EDE and
EDE-Q, please refer to Appendices D and E respectively.
As stated earlier, the EDE and EDE-Q include the same items used to generate the
Restraint, Eating Concern, Shape Concern, and Weight Concern subscales as well as to
determine the frequency of OBEs, SBEs, and compensatory behaviors. Given that the
EDE and EDE-Q purport to assess the same constructs with the only difference being the
modality of the assessment, the relationship between the two instruments should be
strong. Based on the theory outlined by the Multitrait-Multimethod (MTMM) matrix
(Campbell & Fiske, 1959), the relationship between the EDE and EDE-Q should be

12
stronger than the relationship between the EDE and an interview-based assessment of
another construct. Similarly, the relationship between the EDE and EDE-Q should be
stronger than the relationship between the EDE-Q and a self-report assessment of another
trait. Although no published study has examined the relative convergent validity of the
EDE or EDE-Q using a MTMM matrix, several studies have assessed the absolute
convergent validity of the EDE and EDE-Q.
Overall, 15 studies have reported statistics related to the convergent validity of the
EDE and EDE-Q (Binford, le Grange, & Jellar, 2005; Black & Wilson, 1996; Carter,
Aimé, & Mills, 2001; de Zwaan et al., 2004; Fairburn & Beglin, 1994; Goldfein, Devlin,
& Kamenetz, 2005; Grilo et al., 2001a; Grilo, Masheb, & Wilson, 2001b; Kalarchian,
Wilson, Brolin, & Bradley, 2000; Mond et al., 2004b; Passi, Bryson, & Lock, 2003;
Sysko, Walsh, & Fairburn, 2005; Sysko, Walsh, Schebendach, & Wilson, 2005; Wilfley,
Schwartz, Spurrell, & Fairburn, 1997; Wolk, Loeb, & Walsh, 2005). Two of these studies
reported statistics for more than one sample (Binford et al, 2005; Fairburn & Beglin,
1994); thus, there were 18 possible comparisons between the EDE and EDE-Q1. The
results of these analyses indicate significant positive correlations between scores on the
EDE and scores on the EDE-Q for all four subscales. However, the vast majority of
analyses found significant differences between scores on the EDE and scores on the
EDE-Q, with participants scoring higher on the EDE-Q than the EDE. These results
suggest that subscale scores on the EDE and EDE-Q increase and decrease together, but
1 Two studies reported scores on the EDE and EDE-Q for the same sample at two different time points, specifically pre- and post-treatment (Sysko, Walsh, & Fairburn, 2005; Sysko, Walsh, Schebendach, et al., 2005). It is unclear whether participation in a treatment study may influence the correspondence of the EDE and EDE-Q; therefore, only pre-treatment scores are discussed in this review.

13
that there is a significant difference in severity level reported on the two instruments.
Comprehensive summaries of the convergent validity of the EDE and EDE-Q for the four
subscales are provided in Table 8-11.
With regard to the assessment of binge eating, the convergent validity of the EDE
and EDE-Q is less consistent. The correlations between the frequency of OBEs reported
on the EDE and EDE-Q were low, with 12 of the 14 correlations ranging from .20 to .63
and two not reaching significance. Seven of the 14 studies found significant differences
between the frequency of OBEs reported on the EDE and EDE-Q, with about half of
those finding that participants reported more OBEs on the EDE than the EDE-Q and half
finding the opposite. With regard to the frequency of SBEs, five of the eight studies
found significant positive correlations between the EDE and EDE-Q and two of the eight
studies found significant differences between the two instruments.
With regard to the frequency of self-induced vomiting, all studies found
significant positive correlations between the EDE and EDE-Q ranging from .72 to 1.00.
Two of the seven studies that calculated mean differences between the EDE and EDE-Q
for the frequency of self-induced vomiting found significant differences between the two
measures. Likewise, all seven studies found significant positive correlations between the
EDE and EDE-Q for the frequency of laxative misuse, with correlations ranging from .60
to .99. Only one of seven studies found a significant difference between the two measures
for the frequency of laxative misuse. Overall there is a dearth of research on the
convergent validity of the EDE and EDE-Q with regard to the assessment of other
compensatory behaviors such as fasting, excessive exercise, and diuretic misuse. Please

14
refer to Tables 12-14 for detailed summaries of the convergent validity of the EDE and
EDE-Q with regard to the assessment of OBEs, SBEs, and compensatory behaviors. For a
more complete discussion of the empirical findings on the convergent validity of the EDE
and EDE-Q, please refer to Appendix F.
Limitations of Studies Assessing the Convergent validity of the EDE and EDE-Q
Despite that more than one dozen studies have assessed the convergent validity of
the EDE and EDE-Q, there are important limitations to this body of research. First, most
of this research has used correlations and significance testing to assess convergent
validity. Unfortunately, correlations can only tell us whether there is a relationship
between scores on two measures. These relationships may exist in the presence or
absence of significant differences between mean scores on the two measures. Likewise,
significance testing is limited because it is based on both the size of the effect and the
sample size and it is difficult to separate the two. Without an understanding of the size of
the difference between the EDE and EDE-Q, it is impossible to know whether the EDE
and EDE-Q arrive at similar conclusions regarding symptom presentation. Second, due to
the small sample sizes used in the convergent validity studies of the EDE and EDE-Q, it
is difficult to generalize the findings. Thus, meta-analyses using both correlation
coefficients and Cohen’s d are needed to better understand the extent to which the EDE
and EDE-Q converge. Both types of meta-analyses are needed as one provides
information regarding the strength of the relationship between the two instruments and
one provides information regarding the size of difference between the two instruments.
15
The purpose of this study was to address the two main limitations described above
by analyzing the convergent validity of the EDE and EDE-Q using effect sizes and a
meta-analytic strategy. Effect sizes calculated using Cohen’s d have the advantage of
giving information about the size of the effect without being confounded by sample size2.
A second advantage of using effect sizes is that they are standardized, which allows
researchers to compare effects across studies or for researchers to combine effect sizes
from different studies to determine the overall effect. In addition to assessing the size of
the difference between the two studies using a meta-analysis of Cohen’s d effect sizes, a
meta-analysis using correlation coefficients was conducted to determine the overall
strength of the relationship between EDE and EDE-Q scores.
Method
Procedure
A literature search was conducted for studies that assessed the convergent validity
of the EDE and EDE-Q using a major computer database (i.e., PsycINFO) and reviewing
reference lists from published journal articles and books. Search terms used in PsycINFO
included “Eating Disorder Examination” and “Eating Disorder Examination-
Questionnaire.” Studies were included that assessed the convergent validity of the EDE
and EDE-Q using correlation coefficients and/or a comparison of means. The literature
search was inclusive of studies that assessed the convergent validity of the Restraint
subscale, the Eating Concern subscale, the Shape Concern subscale, the Weight Concern
2 An effect size provides information about the overlap of two samples and is equivalent to a Z-score statistic. Essentially, an effect size of 1.0 means that the average score in one sample exceeds the scores of 84% of the scores in the second sample or that the average score of one sample is 1 standard deviation larger than the mean score of the second group. A d = .2 is considered a small effect size, d = .5 is considered a medium effect size, and d = .8 is considered a large effect.

16
subscale, OBEs, SBEs, self-induced vomiting, laxative misuse, diuretic misuse, excessive
exercise, or fasting. If a study did not include means and standard deviations for the EDE
and EDE-Q, or correlations between the EDE and EDE-Q, the investigator attempted to
contact the primary author to obtain these statistics. Of the three authors contacted, all
three responded and provided data for three of the four studies that had missing data. A
study was excluded from the meta-analysis only if the statistics necessary to conduct the
meta-analysis (e.g., means, standard deviations, correlation coefficients) were not
reported. It should be noted that if a particular study was excluded from the meta-analysis
using Cohen’s d, it could have been used for the meta-analysis using correlation
coefficients and vice versa.
Data Analysis Plan
The data analysis plan included three parts. There were four steps for the meta-
analysis using Cohen’s d (Lipsey & Wilson, 2001). The first step was to calculate effect
sizes, based on Cohen’s d, for all comparisons of the EDE and EDE-Q. Cohen’s d was
calculated by subtracting the mean EDE from the mean EDE-Q score such that positive
numbers indicate higher scores on the EDE-Q and then dividing the result by the pooled
standard deviation of the EDE and EDE-Q scores. Separate effect sizes were calculated in
each study for each eating disorder behavior in each applicable subsample. For example,
if a study examined the convergent validity of the EDE and EDE-Q for OBEs and self-
induced vomiting in a BN sample and a community sample, separate effect sizes were
calculated for the frequency of OBEs reported in the BN sample, the frequency of OBEs
reported in the community sample, the frequency of self-induced vomiting reported in the

17
BN sample, and the frequency of self-induced vomiting reported in the community
sample.
The second step was to adjust each effect size for the size of the sample used to
calculate the effect size. Although effect sizes are not confounded by sample size, they
only represent estimates of the true effect size. Essentially, effect sizes can be thought of
as the true effect size plus error. Effect sizes based on larger samples have smaller
standard errors; thus, they are considered more accurate estimates of the true effect size.
To adjust effect sizes for the size of the sample, each effect size was weighted by its
inverse variance weight. The inverse variance weight (w) was calculated by dividing 1 by
the squared standard error of the effect size (i.e., w = 1 / SE2 ). Each effect size was then
multiplied by its respective inverse variance weight.
The third step was to calculate the mean weighted effect sizes (MWESd) by
averaging the effect sizes that have been weighted using the inverse variance weight. The
MWESd is calculated by dividing the sum of the weighted effect sizes by the sum of the
inverse variance weights (i.e., MWESd = Σ(w*ES) / Σw ). The MWESd was calculated
for each eating disorder behavior in each subsample (e.g., MWESd of all studies that
assessed the frequency of OBEs in participants with BN using the EDE and EDE-Q) as
well as the total MWESd for each eating disorder behavior (e.g., MWESd for all studies
that assessed the frequency of OBEs using the EDE and EDE-Q).
The final step was to calculate the Confidence Interval (CId) around each
MWESd. To determine the upper and lower limits of CId, one needs to first calculate the
standard error of the MWESd (SEMWESd), which can be found by taking the square root of

18
1 divided by the sum of the inverse variance weights (i.e., SEMWES = √ (1 / (Σw)) ). The
final calculation for the CId is as follows: CId = MWESd ± (1.96 * SEMWESd).
In this study, small effect sizes (Cohen’s d) represent small differences between
the EDE and EDE-Q and thus higher convergent validity between the two instruments. It
was hypothesized that the mean weighted effect size for each of the four subscales would
be smaller than the mean weighted effect size for the frequency of OBEs, SBEs, and
compensatory behaviors.
With regard to the meta-analysis using correlation coefficients, there were 7 steps
(Lipsey & Wilson, 2001). The first step was to identify all correlation coefficients
between the EDE and EDE-Q for all eating disorder behaviors in all applicable samples.
The second step was to standardize each correlation coefficient using Fisher’s z’
transformation, which is calculated using the following formula: z’ = .5 * ln ((1+r) / (1-
r)).
The third step was to adjust each transformed correlation coefficient (z’) for the
sample size as was done for each Cohen’s d. To adjust z’ for the size of the sample, each
z’ was weighted by its inverse variance weight. The inverse variance weight (w) for
correlation coefficients is calculated by subtracting 3 from the sample size (i.e., w = n –
3). Each z’ is then multiplied by its respective inverse variance weight.
The fourth step was to calculate the mean weighted effect sizes using the
correlation coefficients (MWESr) by averaging the correlation coefficients that have been
weighted using the inverse variance weights. The MWESr was calculated by dividing the
sum of the weighted effect sizes by the sum of the inverse variance weights (i.e., MWESr

19
= Σ(w*z’) / Σw ). The MWESr was calculated for each eating disorder behavior in each
subsample (e.g., MWESr of all studies that assessed the frequency of OBEs in
participants with BN using the EDE and EDE-Q) as well as the total MWESr for each
eating disorder behavior (e.g., MWESr for all studies that assessed the frequency of OBEs
using the EDE and EDE-Q). The fifth step was to reverse transform the MWESr back
from z’ to r using the following formula: r = (e ^ (2* MWESr ) – 1) / (e ^ 2* MWESr ) +
1 ).
The sixth step was to calculate the Confidence Interval (CIr) around each MWESr.
To determine the upper and lower limits of the CIr, one needs to first calculate the
standard error of the MWESr (SEMWESr) by dividing 1 by the square root of n minus 3
(i.e., SEMWESr = 1 / √ (n-3) ). The final calculation for the CIr is as follows: CIr = MWESr
± (MWESr * SEMWESr). The final step was to back transform the upper and lower limits
of the CI from z’ to r using the formula described in step 5 above.
Finally, a homogeneity analysis was conducted for both types of meta-analyses.
Meta-analytic techniques assume that all effect sizes used in the meta-analysis are
estimating the same population mean. A homogeneity analysis tests whether this
assumption holds true. If the homogeneity assumption is rejected, the effect sizes are
estimates of at least two populations that have different mean scores. This type of
analysis is of particular importance to this study as this meta-analysis purposefully
includes studies that sampled different populations (e.g., AN sample, BN sample,
EDNOS sample, BED sample, community sample, bariatric surgery patients). Thus, it is

20
important to test the homogeneity assumption and determine whether these populations
have similar means on the EDE and EDE-Q, respectively.
The homogeneity assumption is tested using the Q statistic which is calculated as
follows: Q = ∑ (w * ES2) – ( ( ∑ (w * ES) ) 2) / ∑ (w). The Q statistic is distributed as a
chi-square statistic and is interpreted in a similar fashion. The critical value for the Q
statistic is the same as the critical value for a chi-square statistic, with the degrees of
freedom for the Q statistic equaling the number of effect sizes used minus 1. The
homogeneity assumption is upheld if the Q statistic is less than the critical value.
If the homogeneity assumption is rejected, an additional heterogeneity analysis
can be done to determine what is responsible for the heterogeneity of effect sizes.
Because the meta-analysis included studies that used different samples, it is important to
determine whether the heterogeneity of effect sizes is due to differences in mean effect
sizes between populations. Thus, if the homogeneity assumption was rejected, the studies
were divided categorically based on the study sample used. Heterogeneity among
categorical variables can be tested using the meta-analytic analog to the ANOVA. In this
analysis, a Q statistic is computed for each categorical group using the formula described
above. Then a within-group Q (Qw) is calculated using the following formula: Qw =
QGroup1 + QGroup2 + … + QGroupN with the degrees of freedom (df) equaling k – j, where k
is the number of effect sizes and j is the number of groups. Next a between group Q (QB)
is calculated by subtracting Qw from the total Q, where df = j-1. A significant Qw would
indicate that differences among effect sizes are due to error whereas a significant QB

21
would indicate that differences among effect sizes are due to true differences between
groups.
Results
Restraint
The results of the meta-analysis demonstrate support for the convergent validity
of the Restraint subscale of the EDE and EDE-Q. With regard to the meta-analysis using
Cohen’s d, effect sizes for the 15 individual samples ranged from -0.09 to 0.73 with a
mean effect size of 0.31 (95% CI: 0.22 – 0.40) with participants scoring higher on the
EDE-Q than the EDE. The homogeneity analysis failed to reject the null hypothesis of
homogeneity which indicates that there are not differences in the mean effect sizes across
studies, Q(13) = 16.27, p > .05. With regard to the meta-analysis using correlation
coefficients, the effect sizes for the individual studies ranged from .49 to .85, with a mean
effect size of .72 (95% CI: .65 - .78). Again, the homogeneity analysis failed to reject the
null hypothesis of homogeneity; therefore, the variability across effect sizes does not
exceed what would be expected given errors in sampling Q(13) = 9.04, p >.05. These
statistics can be found in Tables 15 and 16.
Eating Concern
The results of the meta-analysis demonstrate moderate support for the convergent
validity of the Eating Concern subscale of the EDE and EDE-Q. With regard to the meta-
analysis using Cohen’s d, effect sizes for the individual studies ranged from 0.11 to 1.76
with a mean effect size of 0.58 (95% CI: 0.49 – 0.67) with participants scoring higher on
the EDE-Q than the EDE. The homogeneity analysis did reject the null hypothesis of

22
homogeneity which indicates that there are significant differences in the mean effect sizes
across studies Q(13) = 48.02, p < .001. Results from the heterogeneity analysis indicated
that both QB and Qw were significant (QB(6) = 19.71, p < .01; Qw(7) = 28.38, p <.001)
suggesting that the between-group variability was not sufficient to explain the variance
among mean effect sizes. With regard to the meta-analysis using correlation coefficients,
the effect sizes for the individual studies ranged from .33 to .94, with a mean effect size
of .65 (95% CI: .57 - .73). The homogeneity analysis failed to reject the null hypothesis
of homogeneity; therefore, the variability across effect sizes does not exceed what would
be expected given errors in sampling, Q(10) = 13.91, p > .05. These statistics can be
found in Tables 15 and 16.
Shape Concern
The results of the meta-analysis demonstrated moderate support for the
convergent validity of the Shape Concern subscale of the EDE and EDE-Q. With regard
to the meta-analysis using Cohen’s d, effect sizes for the individual studies ranged from -
0.06 to 1.72 with a mean effect size of 0.56 (95% CI: 0.47 – 0.65) with participants again
scoring higher on the EDE-Q. The homogeneity analysis did reject the null hypothesis of
homogeneity which indicates that there are significant differences in the mean effect sizes
across studies Q(14) = 77.42, p < .001. Results from the heterogeneity analysis indicate
that both QB and Qw were significant (QB(6) = 58.69, p < .001; Qw(8) = 18.73, p <.05)
suggesting that the between-group variability is not sufficient to explain the variance
among mean effect sizes. With regard to the meta-analysis using correlation coefficients,
the effect sizes for the individual studies ranged from .42 to .91 with a mean effect size of

23
.76 (95% CI: .70 - .83). The homogeneity analysis failed to reject the null hypothesis of
homogeneity; therefore, the variability across effect sizes does not exceed what would be
expected given errors in sampling, Q(14) = 16.50, p > .05. These statistics can be found
in Tables 15 and 16.
Weight Concern
The results of the meta-analysis demonstrate support for the convergent validity
of the Weight Concern subscale of the EDE and EDE-Q. With regard to the meta-
analysis using Cohen’s d, effect sizes for the individual studies ranged from -0.25 to 0.73
with a mean effect size of 0.39 (95% CI: 0.31 – 0.48) with participants scoring higher on
the EDE-Q than the EDE. The homogeneity analysis did reject the null hypothesis of
homogeneity which indicates that there are significant differences in the mean effect sizes
across studies Q(14) = 29.30, p < .01. Results from the heterogeneity analysis indicate
that only QB was significant (QB(6) = 18.99, p < .01; Qw(8) = 10.31, p > .05) suggesting
that the between-group variability is sufficient to explain the variance among mean effect
sizes. With regard to the Weight Concern subscale, the difference between the EDE and
EDE-Q appeared to be higher for the BED samples (d=.69) than the other eating disorder
or community-based samples (d=-.11 to .44). With regard to the meta-analysis using
correlation coefficients, the effect sizes for the individual studies ranged from .54 to .88
with a mean effect size of .75 (95% CI: .69 - .81). The homogeneity analysis failed to
reject the null hypothesis of homogeneity; therefore, the variability across effect sizes
does not exceed what would be expected given errors in sampling, Q(14) = 7.73, p > .05.
These statistics can be found in Tables 15 and 16.

24
Objective Bulimic Episodes
The results of the meta-analysis demonstrate support for the convergent validity
of the assessment of OBEs using the EDE and EDE-Q. With regard to the meta-analysis
using Cohen’s d, effect sizes for the individual studies ranged from -0.58 to 0.26 with a
mean effect size of -0.12 (95% CI: -0.21 to -0.03). The homogeneity analysis did reject
the null hypothesis of homogeneity which indicates that there are significant differences
in the mean effect sizes across studies, Q(12) = 48.09, p < .001. Results from the
heterogeneity analysis indicate that only QW was significant (QB(6) = 9.28, p > .05; Qw(7)
= 38.80, p < .001) suggesting that the variance among mean effect sizes is due to within-
group variability or error. With regard to the meta-analysis using correlation coefficients,
the effect sizes for the individual studies ranged from .20 to .92 with a mean effect size of
.64 (95% CI: .58 - .70). The homogeneity analysis rejected the null hypothesis of
homogeneity which indicates that there are significant differences in the mean effect sizes
across studies Q(13) = 58.40, p < .001. Results from the heterogeneity analysis indicate
that both QB and Qw were significant (QB(5) = 33.52, p < .001; Qw(8) = 25.27, p <.01)
suggesting that the between-group variability is not sufficient to explain the variance
among mean effect sizes. These statistics can be found in Tables 17 and 18.
Subjective Bulimic Episodes
The results of the meta-analysis demonstrate moderate support for the convergent
validity of the assessment of SBEs using the EDE and EDE-Q. With regard to the meta-
analysis using Cohen’s d, effect sizes for the individual studies ranged from -0.57 to 0.17
with a mean effect size of -0.21 (95% CI: -0.33 to -0.09). The homogeneity analysis

25
failed to reject the null hypothesis of homogeneity which indicates that there are not
differences in the mean effect sizes across studies, Q(7) = 11.78, p > .05. With regard to
the meta-analysis using correlation coefficients, the effect sizes for the individual studies
ranged from -.09 to .78 with a mean effect size of .52 (95% CI: .43 - .60). The
homogeneity analysis did reject the null hypothesis of homogeneity which indicates that
there are significant differences in the mean effect sizes across studies Q(7) = 56.37, p <
.001. Results from the heterogeneity analysis indicate that only QB was significant (QB(4)
= 54.45, p < .001; Qw(3) = 1.92, p > .05) suggesting that the between-group variability is
sufficient to explain the variance among mean effect sizes. The correlation between the
EDE and EDE-Q appears significantly lower for the BED sample (r=-.07) than for the
other samples. These statistics can be found in Tables 17 and 18.
Self-Induced Vomiting
The results of the meta-analysis demonstrate strong support for the convergent
validity of the assessment of self-induced vomiting using the EDE and EDE-Q. With
regard to the meta-analysis using correlation coefficients, the effect sizes for the
individual studies ranged from .72 to .99 with a mean effect size of .89 (95% CI: .81 -
.98). The homogeneity analysis failed to reject the null hypothesis of homogeneity which
indicates that there are not differences in the mean effect sizes across studies, Q(7) =
2.38, p > .05. Only two studies reported the means and standard deviations of the
frequency of self-induced vomiting as assessed by the EDE and EDE-Q (Carter et al.,
2001; Wolk et al., 2005). Due to the limited amount of data, a meta-analysis using
Cohen’s d is inappropriate. These statistics can be found in Tables 17 and 18.

26
Laxative Misuse
The results of the meta-analysis demonstrate strong support for the convergent
validity of the assessment of laxative misuse using the EDE and EDE-Q. With regard to
the meta-analysis using correlation coefficients, the effect sizes for the individual studies
ranged from .60 to .99 with a mean effect size of .84 (95% CI: .75 - .93). The
homogeneity analysis did reject the null hypothesis of homogeneity which indicates that
there are significant differences in the mean effect sizes across studies Q(5) = 12.35, p <
.05. Results from the heterogeneity analysis indicate that only QB was significant (QB(4)
= 12.04, p < .05; Qw(1) = 0.30, p > .05) suggesting that the between-group variability is
sufficient to explain the variance among mean effect sizes. In this case, the correlations
between the EDE and EDE-Q appear lower for the AN and community-based samples
than for the participants with BN, the combined AN and BN sample, and the participants
with primary substance use. As is the case for self-induced vomiting, only two studies
reported the means and standard deviations of the frequency of laxative misuse as
assessed by the EDE and EDE-Q (Carter et al., 2001; Wolk et al., 2005). Due to the
limited amount of data, a meta-analysis using Cohen’s d would be inappropriate at this
time. These statistics can be found in Tables 17 and 18.
Other Compensatory Behaviors
Only two studies reported data on compensatory behaviors other than self-induced
vomiting and laxative misuse (Carter et al., 2001; Wolk et al., 2005). Of these, one
compared the frequency of diuretic misuse reported on the EDE and EDE-Q and the other
compared the frequency of excessive exercise reported on the two instruments (Wolk et

27
al., 2005). The dearth of research on compensatory behaviors other than self-induced
vomiting and laxative misuse precludes the use of meta-analysis to examine the
convergent validity of the EDE and EDE-Q with regard to these constructs.
Discussion
The data from the meta-analyses provide support for the convergent validity of
the EDE and EDE-Q. The results from the meta-analyses using correlation coefficients
indicate that there is a strong positive relationship between EDE and EDE-Q scores for
all four subscales, OBEs, SBEs, self-induced vomiting, and laxative misuse. The results
of the homogeneity analyses indicate that these correlations do not vary among different
samples for the four subscales or self-induced vomiting, but that they do vary for the
assessment of OBEs, SBEs, and laxative misuse. The results from the meta-analysis
using Cohen’s d show that there are small to moderate defect sizes for the differences
between the EDE and EDE-Q for the Restraint subscale, Weight Concern subscale,
OBEs, and SBEs and moderate to large effect sizes for the differences between the EDE
and EDE-Q for the Eating Concern and Shape Concern subscales. The results of the
homogeneity analysis indicate that the size of the effect varies among different samples
for the Eating Concern, Shape Concern, and Weight Concern subscales as well as for the
assessment of OBEs. These findings have important clinical implications for the
assessment of eating disorder symptoms.
With regard to the four subscales of the EDE and EDE-Q, the results of the meta-
analysis indicate that participants who score high on one of the two instruments also
score high on the other. However, these results also demonstrate that participants score

28
consistently higher on the EDE-Q than on the EDE. These results seem to indicate that
participants either over-report their symptoms on the EDE-Q or under-report their
symptoms on the EDE. Researchers have suggested that people may under-report their
symptoms during interviews because of feelings of shame elicited by the loss of
anonymity during face-to-face interviews. This hypothesis has been supported by the
finding that EDE-Q scores were more similar to EDE scores when the EDE was
conducted via telephone rather than in person (Keel, Crow, Davis, & Mitchell, 2002).
However, other researchers have purported the opposite: that respondents may under-
report their symptoms during interviews because their symptoms do not cause them
distress and are not perceived as problematic. Therefore, these symptoms are not reported
during interviews because the participants do not want treatment. There is empirical
support for this theory as one study found that women who endorsed purging behavior on
the EDE-Q and subsequently denied this behavior during the EDE were significantly less
functionally impaired and distressed than women who endorsed purging behavior on both
instruments (Mond, Hay, Rodgers, & Owen, 2007). Finally, research from the Minnesota
Multiphasic Personality Inventory-2 (MMPI-2; Butcher, Dahlstrom, Graham, Tellegen, &
Kaemmer, 1989), a self-report questionnaire, has demonstrated that demoralization or
distress can elevate scores on the Clinical Scales and the Infrequency Scale (F) over and
above those typically observed in psychiatric samples (Arbisi & Ben-Porath, 1995;
Sellbom, Ben-Porath, McNulty, Arbisi, & Graham, 2006). Although one might argue that
distress would also inflate participants’ scores on structured interviews, structured
interviews such as the EDE provide anchors that assessors can use to make ratings,

29
thereby decreasing the bias caused by participant distress (Wilson, 1993). Although
scores were higher on the EDE-Q for all subscales, it is notable that the difference
between the two measures was greater for the Eating Concern and Shape Concern
subscales. It is possible that the variable responsible for higher scores on the EDE-Q
(e.g., shame, distress, etc.) is more associated with the Eating Concern and Shape
Concern subscales than with the Restraint or Weight Concern scales; however, there are
no data to support this assertion currently.
In addition to the finding that participants scored higher on the EDE-Q subscales
than the EDE subscales, the results of the meta-analysis indicate that the size of these
differences varies among various samples. One interesting finding from this meta-
analysis is that a smaller difference between the EDE and EDE-Q was found for patients
with AN than patients with BED. In fact, the size of the effect for the AN samples
approximated the size of the effect for the community samples for all subscales except
Shape Concern. These findings may be due to the ego-syntonic nature of AN, which
could decrease both the level of shame and distress these participants feel. Regardless of
whether participants over-report their symptoms on the EDE-Q or under-report their
symptoms on the EDE, the data from this meta-analysis indicate that there are small- to
medium-sized effects for the differences between the two instruments with regard to the
severity of symptoms reported with participants consistently scoring higher on the EDE-
Q than the EDE.
With regard to the assessment of eating disorder behaviors, the correlations
between the EDE and EDE-Q for compensatory behaviors ranged from .87 to .90

30
whereas the correlation between the two instruments for OBEs and SBEs ranged from .55
to .64. These data suggest that there is a stronger relationship between the two
instruments with regard to the assessment of compensatory behaviors than for the
assessment of binge eating. Although there were small effect sizes for the differences
between the EDE and EDE-Q with regard to the assessment of OBEs and SBEs, these
data do not necessarily support the convergent validity of the EDE and EDE-Q for the
assessment of binge eating. As stated previously, the correlations between the two
instruments for the assessment of binge eating were lower than for the assessment of
compensatory behaviors as well as the four subscales. Additionally, the range of effect
sizes was large, ranging from -.26 to .58 for OBEs and -.17 to .57 for SBEs. There were
significant differences between the size of the effects amongst the various studies, which
was explained by within-group differences or error. Finally, it should be noted that
participants did not consistently score higher on one instrument than the other in contrast
to the pattern observed for the four subscales. These data indicate that there are
inconsistencies between the EDE and EDE-Q for the assessment of binge eating that may
not be due to the method of administration.
It has been suggested that the inconsistencies between self-report questionnaires
and interview-based assessments may be due to the vague, ambiguous definition of binge
eating and that giving participants more information regarding the definitions of binge
eating may increase the accuracy with which participants report these behaviors on self-
report questionnaires such as the EDE-Q (Wilfley et al., 1997). Several studies have
found that administering the EDE-Q after the EDE results in higher correspondence
31
between the two instruments than administering the EDE after the EDE-Q (Passi et al.,
2003; Carter et al., 2001). Because participants who completed the EDE-Q after the EDE
would have received more comprehensive explanations of “binge eating” and “loss of
control,” these data support the hypothesis that giving respondents additional information
regarding the definitions of key terminology may enhance the correspondence between
the EDE and EDE-Q. Based on these data, Goldfein et al. (2005) created the Eating
Disorder Examination–Questionnaire with Instructions (EDE-Q-I) which provides
participants with definitions for a “large amount of food” and “loss of control.” The
limited amount of research on the EDE-Q-I has found that the EDE-Q-I has higher
convergent validity than the original EDE-Q in assessing OBE frequency in participants
with BED (Celio, Wilfley, Crow, Mitchell, & Walsh, 2004; Goldfein et al., 2005).
In sum, the results from these meta-analyses generally support the convergent
validity of the EDE and EDE-Q. The support for the convergent validity of the two
instruments is strongest for the Restraint, Eating Concern, Shape Concern, and Weight
Concern subscales as well as for the assessment of self-induced vomiting and laxative
misuse. These data provide more limited support for the assessment of OBEs and SBEs.
These results suggest that both instruments can be used to validly assess constructs
associated with eating disorder symptoms. However, these data do not support using the
two instruments interchangeably as differences in symptom levels due to the differences
in administration may be erroneously attributed to other factors (e.g., time, treatment
condition).

32
This study has several strengths. First, this is the only study to examine the
convergent validity of the EDE and EDE-Q using meta-analysis. Given the small sample
sizes used in most previous research in this area, meta-analysis is essential to
understanding the generalizability of the results. Second, both meta-analysis using
correlation coefficients and Cohen’s d were used which allows for interpretation of both
the relationship between the two instruments and the size of the difference between the
two instruments. Third, individual meta-analyses were conducted to examine the
convergent validity between the EDE and EDE-Q for the assessment of Restraint, Eating
Concern, Shape Concern, Weight Concern, OBEs, SBEs, self-induced vomiting, and
laxative misuse. Finally, a homogeneity analysis was used to examine whether the
relationship between the EDE and EDE-Q is consistent across different types of samples.
This study also had several limitations. Most notable is the lack of research on the
relationship between the EDE and EDE-Q for participants with BN and EDNOS as well
as for the assessment of compensatory behaviors. Additionally, this study does not
provide information regarding the convergence of individual symptom profiles between
the EDE and EDE-Q. Finally, the results from the meta-analysis can only be used to
describe the relationship between the two instruments. These data do not provide
evidence with regard to the cause of the differences between the EDE and EDE-Q. Thus,
suggestions for improving the correspondence between the two instruments can only be
made pending additional research.
These findings suggest several directions for future research. First, additional
research is needed on the convergent validity of the EDE and EDE-Q for patients with

33
BN and EDNOS and for the assessment of compensatory behaviors. Second, researchers
should continue to explore whether self-report questionnaires over-estimate symptom
levels or whether interview-based assessments under-estimate symptom levels. Third, it
would be interesting to examine whether individual symptom profiles differ between the
EDE and EDE-Q. Finally, additional research is needed to examine the inconsistencies in
the assessment of binge eating.
Study 2: Convergent and Discriminant Validity of the EDE with Regard to the
Assessment of Binge Eating
Literature Review
The Eating Disorder Examination (EDE; Fairburn & Cooper, 1993) is commonly
referred to as the “gold standard” in the assessment of eating disorder symptoms and
research has provided strong evidence for the validity of the EDE with regard to the
assessment of eating disorder cognitions and compensatory behaviors. However, there is
limited support for the validity of the EDE with regard to the assessment of binge eating.
For example, the differences between the EDE and EDE-Q for the assessment of
cognitive symptoms of eating disorders are in a consistent, predictable direction
regardless of the sample. These results suggest that the instruments are assessing similar
constructs and that the differences between the subscale scores reported on the two
instruments are likely due to the fact that one is a self-report questionnaire whereas the
other is a semi-structured interview. There are also differences between the EDE and
EDE-Q with regard to the assessment of binge eating. However, in contrast to the

34
assessment of cognitive symptoms, the differences between the EDE and EDE-Q for the
assessment of binge eating are inconsistent. In other words, some studies found that
participants report more episodes of binge eating on the EDE whereas others found that
participants report more episodes on binge eating on the EDE-Q. These inconsistencies
suggest that the differences between the two instruments may not be due to the method of
administration; rather, there may be a problem inherent in the operationalization of binge
eating. In addition to the inconsistencies between the EDE and EDE-Q, and perhaps more
disconcerting, is the observation that some participants who explicitly deny binge eating
during the EDE or the Structured Clinical Interview for the DSM-IV (SCID; First,
Spitzer, Gibbon, & Williams, 1995) endorse subsequent binge eating when using
Ecological Momentary Assessment (EMA; Greeno, Wing, & Shiffman, 2000; le Grange,
Gorin, Catley, & Stone, 2001).
To further examine the validity of the EDE with regard to the assessment of binge
eating, three studies have assessed the convergent validity of the binge eating section of
the EDE through comparison to daily food records (Farchaus Stein & Corte, 2003; Loeb
et al., 1994; Rosen et al., 1990). A complete summary of these findings can be found in
Table 19. In the first of these studies (Rosen et al., 1990), a community sample of 106
women recorded their daily food and drink consumption for 7 days, and were asked to
indicate whether they believed each episode of eating was a binge episode. At the end of
the 7-day monitoring period, each participant was assessed using the EDE. A second
study examined the convergent validity of the EDE’s overeating section for both a 7-day
and 28-day time period in a sample of women seeking treatment for BN (Loeb et al.,

35
1994). Prior to entering treatment, 82 women kept daily records of binge eating and self-
induced vomiting for 7 days. After 7 days, they completed an EDE that assessed binge
eating for both the past 7 days and the past 28 days. Participants in this study continued
keeping daily records of binge eating and purging during a 20-session weekly therapy. At
the end of treatment, participants were assessed again using the EDE. The end-of-
treatment EDE was then compared to the daily records of binge eating and purging for
both 7-day and 28-day time periods. Of the 82 original participants, 50-69 were used in
the analysis of convergent validity due to missing data. The purpose of the third study
was not to test the convergent validity of the EDE, but to test the feasibility of using
EMA to assess disordered eating behavior (Farchaus Stein et al., 2003). Sixteen women
diagnosed with either BN or subthreshold AN binge/purge subtype kept daily records of
binge eating and purging behaviors for 28 days using handheld computers. Participants
also completed an EDE after the 28 days were completed. Of the original 16 participants,
only data from 13 were used in the analyses.
These three studies all found a significant positive relationship between the
frequency of binge episodes reported on the EDE and the daily food records, with
correlations ranging from .56 to .93. However, the correlations in the Loeb et al. study (rs
= .80 to .93) were stronger than the in Farchaus Stein et al. study (r = .60) or the Rosen et
al. study (r = .56). Only one study reported the means and standard deviations of the
frequency of binge eating reported on the EDE and in daily food records (Farchaus Stein
et al., 2003). In this study, participants reported significantly higher rates of binge eating

36
on the EDE (M = 14.23, SD = 18.77) than when using the EMA methodology (M = 7.62,
SD = 11.51) (p <.05; Cohen’s d =.42).
In comparison, the three studies also examined the convergent validity of the
EDE’s assessment of compensatory behaviors using daily recordings (Farchaus Stein et
al., 2003; Loeb et al., 1994; Rosen et al., 1990). All three studies found significant
correlations between the frequency of vomiting episodes reported on the EDE and the
frequency reported on daily recordings. These correlations ranged from .75 to .99, with
the highest correlations found in the posttreatment phase of the Loeb et al. study. Only
one study assessed the convergent validity of the EDE to assess laxative use, diuretic use,
or excessive exercise (Farchaus Stein et al., 2003). There were significant correlations
ranging from .62 to 1.00 between the EDE and EMA for these behaviors. As was the case
for binge eating, the Farchaus Stein et al. study was the only one to report means and
standard deviations for the frequency of compensatory behaviors reported on the EDE
and daily logs. There were no significant differences between the EDE and daily
recordings for self-induced vomiting, laxative use, or diuretic use with Cohen’s d ranging
from .13 to .24. Participants did report significantly higher frequencies of excessive
exercise on the EDE (Cohen’s d = .78).
Limitations of Research on the Convergent validity of the EDE and Daily Food Records
Although the convergent validity of the EDE’s assessment of binge eating has
been examined, there are important limitations to these studies. First, there is an overall
dearth of research in this area, with only three studies examining the validity of the EDE

37
with regard to the assessment of binge eating. This is surprising given the importance of
the assessment of binge eating to the diagnosis of BN and BED.
Second, only two of the three studies examined the convergent validity of the
EDE and food logs in clinical samples (Loeb et al., 1994; Farchaus Stein et al., 2003); the
third study used a community sample (Rosen et al., 1990). One of the two studies that
used eating disorder samples conducted most of the analyses on the participants after they
had completed the active phase of a treatment study (Loeb et al., 1994). It is important to
note that there may have been participants in both the community sample (Rosen et al.,
1990) and the posttreatment sample (Loeb et al., 1994) who were abstinent from
bingeing. If participants were abstinent from binge eating and therefore reported zero
binge episodes on both the EDE and food logs, the correlations between the EDE and
food records would be artificially inflated. However, neither the Rosen et al. (1990) study
nor the Loeb et al. (1994) study examined whether the correlations between the EDE and
food logs remained the same when participants abstinent from binge eating were removed
from the dataset. Finally, the one clinical study that used a baseline eating disorder
sample was very small (n = 16).
Third, only one study reported means and standard deviations for the frequency of
binge eating reported on the EDE and in daily food records. The other two studies only
reported correlations. Significant correlations between two variables can exist even when
there are significant mean differences between the two variables. Because the EDE is
used diagnostically and the diagnoses for BN and BED are based primarily on the
frequency of binge episodes, significant mean differences between the EDE and daily
38
food records could result in these instruments arriving at different diagnostic conclusions.
Fourth, no studies have assessed the sensitivity and specificity of the EDE. Because the
EDE is often used as a diagnostic instrument, it is important to know the extent to which
the EDE assigns people to the correct diagnostic categories
A fifth limitation is that, although the EDE can be used to assess binge eating and
purging frequency for up to the past 6 months, no study has assessed the validity of the
EDE for this time period. Two studies have assessed the validity of the EDE’s overeating
section using a 28-day time period (Farchaus Stein et al., 2003; Loeb et al., 1994) and one
study assessed the validity of EDE’s assessment of binge eating for a 7-day time period
(Rosen et al., 1990). The majority of questions on the EDE assess eating disorder
symptomatology during the past 28 days. However, as stated before, the EDE is also used
to determine diagnostic status and the diagnoses of BN and BED are based in part on the
frequency of binge eating during the past 3 and 6 months respectively. Unfortunately, no
study has assessed the validity of the EDE’s assessment of binge eating for either of these
time periods.
Sixth, none of the validity studies of the EDE indicated whether the researchers
differentiated between OBE’s and SBE’s in their analyses. Assuming that “binge eating”
refers to OBE’s, there is no published research on the concurrent validity of the EDE to
assess SBE’s. Consequently, there has been no research that has studied the ability of the
EDE to differentiate between OBE’s and SBE’s. This is important because diagnostic
status depends on the frequency of OBEs, not SBEs. However, some research has found
that the presence of loss of control is more important than the quantity of food consumed

39
in laypersons’ definitions of a “binge” (Beglin & Fairburn, 1992). Research has found
that SBE’s are significantly correlated with indicators of eating disorder symptoms such
as self-induced vomiting, diuretic misuse, overevaluation of shape and weight, and drive
for thinness. Additionally, SBEs may be as strong a predictor of eating disorder
pathology as are OBEs (Latner, Hildebrandt, Rosewall, Chisholm, & Hayashi, 2007).
Thus, it may be difficult for participants to distinguish between OBEs and SBEs, but
given the importance of the difference between the two types of episodes with regard to
diagnostic status, it is important for the EDE to distinguish between OBEs and SBEs.
Finally, the validity studies of the EDE have primarily used women who were
both binge eating and purging, which may limit the generalizability of the results to
participants who have other disordered eating symptoms (e.g., only binge eating). The
restricted range of disordered eating in these study’s samples is important for another
reason as well. Several studies have found that instruments that measure disordered
eating behaviors, including the EDE, appear to have better convergent validity for the
assessment of self-induced vomiting than binge eating. This suggests that binge eating,
whether it is assessed by the EDE or an alternative measure, may be a more difficult
construct to assess than self-induced vomiting. Women who both binge and purge often
engage in these behaviors consecutively. Thus, validity studies of the EDE that only
include women who binge and purge may overestimate the concurrent validity of the
EDE in assessing binge eating because the participants may be using their recall of
vomiting episodes to help them recall the frequency of their binge eating episodes.

40
The purpose of this study was to examine the convergent validity of the EDE’s
assessment of binge eating, addressing the limitations described above. First, this study
examined the validity of the EDE and daily food records in a sample of adults with BED.
Participants in this study did not regularly use compensatory behaviors and thus would
not be able to use their recall of compensatory behaviors to enhance their recall of binge
eating. Second, because a posttreatment sample was used, analyses were conducted on
the full sample as well as a partial sample in which participants who denied binge eating
on both the EDE and DFRs were removed. This insured that the relationship between the
EDE and daily food records was not artificially inflated due to abstinence of symptoms.
Third, analyses were conducted for a 3-month time period, which better approximates the
time period needed to make diagnoses of eating disorders. Fourth, this study also
differentiated between OBEs and SBEs and ran separate analyses for the two types of
eating episodes. Fifth, separate convergent validity analyses were conducted for the
assessment of binge days and binge episodes. They were then compared to determine
whether one demonstrated greater convergent validity than the other. Sixth, the validity
of the EDE was examined using Pearson product-moment correlations, mean differences,
effect sizes, and analyses of sensitivity and specificity. Seventh, an analysis of
disciminant validity was conducted to determine whether the EDE is able to discriminate
binge eating from similar constructs: namely depression, body dissatisfaction, and self-
esteem. Finally, an analysis of contamination was conducted to determine whether these
same constructs contaminate the assessment of binge eating using the EDE more than the
DFRs.
41
Method
Participants
The sample included 26 adult women and 8 adult men participating in a treatment
outcome study for BED (Peterson, Mitchell, Crow, Crosby, & Wonderlich, 2009) who
completed daily food records and an end-of-treatment EDE. The age range for
participants in this study was 37-63 years with a mean age of 51 years. All but one of the
participants identified themselves as Caucasian (97%) with one participant identifying as
African American. The majority of the participants indicated that they were full-time
wage earners (59%), 5 participants identified as part-time wage earners (15%), 3
identified as homemakers (9%), 1 participant was unemployed (3%), and 5 participants
identified themselves as “other” (e.g., retired, disabled, etc.).
At baseline, all participants met criteria for Binge Eating Disorder as defined by
the following criteria: binge eating occurring on average twice per week for the past six
months, overevaluation of shape and weight, and a BMI ≥ 25. The BMI of participants at
baseline ranged from 24.87 to 62.02 with a mean BMI of 39.41 whereas at posttreatment,
the participants’ BMIs ranged from 24.02 to 63.74 with a mean BMI of 39.24. There
were no significant differences between participants’ BMIs at baseline and posttreatment.
Procedure
Participants who met criteria for the study were randomized to one of three
treatment groups or to a waitlist control group. The three treatment groups were identical
except for the amount of therapist contact. Each treatment group met 15 times for 80
minutes over a 20-week period, once weekly for the first 10 weeks and biweekly for the

42
remaining 10 weeks. In the therapist-led group, a doctoral-level therapist provided the
participants with 40 minutes of psychoeducation and then led a discussion for 40 minutes.
In the therapist-assisted group, participants watched a video of a doctoral-level therapist
providing psychoeducation and then a therapist led a 40-minute discussion in person. In
the self-help group, participants watched the same video as in the therapist-assisted group
and then the participants took turns leading the 40-minute discussion. Participants
randomized to the waitlist group took part in the therapist-led group at the end of the 20-
week waiting period.
All participants, regardless of treatment group, were asked to complete food
records each day during the treatment phase of the study and to bring the food records to
their treatment group each week. The food logs were collected at the beginning of each
therapy session by a research assistant, who copied these forms and then returned them to
the participants for use in the treatment sessions. Eating disorder symptoms, including
frequency of binge eating, were assessed at baseline and posttreatment using the EDE.
All assessors were blind to the participants’ treatment group. Participants also completed
a battery of self-report questionnaires at baseline and posttreatment.
Measures
Eating Disorder Examination. The Eating Disorder Examination (EDE; Fairburn
& Cooper, 1993) is a semi-structured interview that assesses eating disordered behaviors
and cognitions during the past 6 months, giving the most attention to the past 28 days.
The EDE assesses the number of objective and subjective binge days and total number of
objective and subjective binge episodes for each of the past 6 months. The EDE allows
43
the assessor to help guide the participant in identifying binge episodes and discriminating
between OBEs and SBEs. The reliability and validity research was reviewed in Study 1.
The EDE was used in this study to assess the frequency of OBE days and OBE episodes
for the past 6 months. The frequency of SBE days and SBE episodes was only calculated
for the past 28 days.
Daily food records. During the 20-week treatment phase of the study, participants
were asked to keep daily food records on sheets provided by the researchers. Every time
the participants ate, they were to write in the type of food consumed, the amount
consumed, the time and place it was consumed, and the context in which it was
consumed. Participants were instructed to identify episodes of eating as “binges” when
“[they] consumed an excessive amount, and/or you experienced a sense of loss of
control.” The food records are blank sheets of paper with columns for time/place,
type/amount of food consumed, context, and whether it was a binge.
Two experienced assessors were who blind to *** individually reviewed the daily
food records and coded each episode of eating as an OBE, SBE, or normative eating
based on the quantity of food consumed and whether loss of control was present. The
assessors calculated the number of OBE days, OBE episodes, SBE days, and SBE
episodes for each participant included in the study. The assessors determined whether
each eating episode was objectively large using the criteria outlined in the EDE. Loss of
control was based on whether the participant identified the eating episode as a “binge.”
Few OOEs (objectively large episodes without loss of control) were reported; thus, the
assessors assumed that when participants indicated an episode of eating was a “binge,” it

44
included loss of control. This is also supported by data indicating that loss of control is
more important to a layperson’s definition of binge eating than is the quantity of food
consumed (Beglin & Fairburn, 1992).
One of the assessors was the author of the study, who has had training and 6+
years experience administering the EDE. The other assessor was originally trained by one
of the developers of the EDE, C. Fairburn, Ph.D., and has had 15+ years administering
the EDE. Twenty percent of the ratings were compared between raters to assess interrater
agreement (see Preliminary Analyses section below).
Inventory for Depressive Symptomatology-Self-Report. The Inventory for
Depressive Symptomatology-Self-Report (IDS-SR; Rush, Giles, Schlesser, Fulton,
Weissenburger, & Burns, 1986) is a self-report questionnaire that assesses symptoms
associated with Major Depressive Disorder. Respondents are asked to rate the severity of
28 symptoms on a 4-point Likert scale ranging from 0 (no symptoms) to 3 (severe
symptoms). The IDS-SR has demonstrated good test-retest reliability (α = .85) and is
significantly correlated with both the Hamilton Rating Scale for Depression (r = .67) and
the Beck Depression Inventory (r = .78). The internal consistency for the current sample
was α=.88.
Rosenberg Self-Esteem Scale. The Rosenberg Self-Esteem Scale (RSE;
Rosenberg, 1965) is a self-report measure of general self esteem. Participants are asked to
assess the extent to which 10 statements are true for themselves. Participants rate
statements such as such as "I have a positive attitude about myself" and “I feel that I do
not have much to be proud of” on a 7-point Likert scale that ranges from “strongly agree”
45
to “strongly disagree.” The internal reliability for the Rosenberg Self-Esteem Scale has
been found to be approximately .75 (Rosenberg, 1965). The internal consistency for the
current sample was α=.93.
Body Shape Questionnaire. The Body Shape Questionnaire (BSQ; Cooper et al.,
1987) is a self-report questionnaire that assesses the extent to which individuals are
concerned with their body shape or figure. The BSQ asks participants to rate their
concern with their shape on a 6-point Likert scale, ranging from 1 (Never) to 6 (Always).
Sample items include “Have you felt so bad about your shape that you have cried?” and
“Have you avoided wearing clothes which make you particularly aware of the shape of
your body?” The BSQ has demonstrated good concurrent validity with the Eating
Attitudes Test (EAT; Garner & Garfinkel, 1979) and the Body Dissatisfaction subscale of
the Eating Disorder Inventory (EDI; Garner, Olmstead, & Polivy, 1983). Additionally,
the BSQ is able to differentiate between patients and non-patients, such that women with
BN scored significantly higher than a community sample. Finally, the BSQ has
demonstrated good test-retest reliability (α = .88) (Rosen, Jones, Ramirez, & Waxman,
1996). The internal consistency for the current sample was α=.97.
Data Analysis Plan
Comparison of the EDE and Daily Food Records. To examine the convergent
validity of the EDE and Daily Food Records, three types of analyses were conducted.
First, pearson product-moment correlations were conducted between the frequency of
OBE days reported on the EDE and the frequency of OBE days reported on the Daily
Food Records. Similar correlations were calculated for OBE episodes, SBE days, SBE

46
episodes, Total days (OBE days + SBE days), and Total episodes (OBE episodes + SBE
episodes). Analyses comparing the frequency of OBEs on the EDE and Daily Food
Records were conducted for the past 3 months whereas analyses comparing the frequency
of SBE days, SBE episodes, Total days, and Total episodes were conducted for the past
28 days only. See Figure 1 for a graphical representation of these analyses. Second,
paired-sample t-tests will be conducted to examine whether there are significant
differences between the frequency of OBE days reported on the EDE and the frequency
of OBE days recorded in the Daily Food Records. Similar paired-sample t-tests were
conducted for OBE episodes, SBE days, SBE episodes, Total days, and Total episodes.
Finally, effect sizes were calculated to examine the effect size of the difference between
OBE days reported on the EDE and the frequency of OBE days recorded in the Daily
Food Records. Similar effect sizes were calculated for OBE episodes, SBE days, SBE
episodes, Total days, and Total episodes.
Exclusion of zero-pairs. As stated above, past research on the convergence
between the EDE and Daily Food Records with regard to the assessment of binge eating
has not accounted for participants who were not binge eating at the time of the
assessment. Inclusion of such participants has the potential to artificially inflate the
convergence of the two instruments. To test whether the convergent validity of the EDE
and Daily Food Records is supported for those participants who have not reached
abstinence of symptoms during treatment, the analyses described above were re-run
excluding all participants who scored “0” on both the food logs and the EDE. The
exclusion of such “zero-pairs” has been used previously in the alcohol dependence

47
research to account for artificial inflation of correlations (Sobell et al., 1986).
Specifically, if a participant did not report any OBE episodes on the EDE or in the daily
food records in Month 1, that person was taken out of the analyses relevant to OBE
episodes in Month 1. Likewise, if a participant did not report any SBE episodes on the
EDE or in the daily food records in Month 1, that person would be taken out of this
portion of the data analysis and so on for all pairs of analyses. However, if a participant
denied OBE episodes for Month 1 during the EDE, but reported OBE episodes for Month
1 in their daily food records or vice versa, that person was still included in this portion of
the analyses. Likewise, if a participant denied SBE episodes during the EDE, but reported
SBE episodes in their daily food records or vice versa, that person was still included in
this portion of the analyses and so on for all pairs of analyses.
Comparison of days and episodes. The EDE requires respondents to report the
total number of eating disorder episodes (e.g., OBE episodes) they had during the past 28
days as well as the number of days on which these episodes occurred (OBE days). The
rationale for this is that, because some respondents may have more than one episode per
day, the frequency of OBE episodes may not be equivalent to the frequency of OBE days.
Currently there is no research on the use of days versus episodes. Within the eating
disorder literature, the frequency of days and the frequency of episodes are often used
interchangeably. In fact, in one study on the convergent validity of the EDE, the
frequency of vomiting episodes reported on the EDE was correlated with the frequency
of vomiting days reported on the EDE-Q (Binford et al., 2005). To determine whether
there is greater consistency between the EDE and Daily Food Records for days or

48
episodes, the correlation between the frequency of OBE days reported on the EDE and
Daily Food Records was compared to the correlation between the frequency of OBE
episodes on the EDE and Daily Food Records. Similar comparisons were made for SBE
days and episodes as well as Total days and episodes. See Figure 2 for a graphical
representation of these analyses. Prior to testing the null hypothesis that p1 – p2 = 0, r was
transformed using Fisher’s transformation to correct for non-normality. Once r was
transformed to z, the following calculation was used to test the null hypothesis: (z1 – z2)
/ √ ((1/(N1 – 3)) + (1/(N2 – 3))). The null hypothesis was supported if this statistic was
less than 1.96 (for a two-tailed test at α= 0.05).
Comparison of OBEs, SBEs, and Total (OBEs + SBEs) for Days and Episodes
Respectively. Although a handful of researchers have reported on the psychometric
properties of the EDE in assessing both OBEs and SBEs, there has been no statistical
comparison of these data. Additionally, there has been no research comparing the
psychometric properties of individual reports of OBEs or SBEs to a combined report of
OBEs + SBES (Total).
I hypothesized that the correlation between the EDE and Daily Food Records
would be stronger for the assessment of OBE days than SBE days. I also hypothesized
that the correlation between the EDE and Daily Food Records would be stronger for the
assessment of OBE days than Total (OBE + SBE) days, but that the correlation between
the EDE and Daily Food Records would be stronger for the assessment of Total (OBE +
SBE) days than for SBE days.

49
Likewise, I hypothesized that the correlation between the EDE and Daily Food
Records would be stronger for the assessment of OBE episodes than SBE episodes.
Additionally, I hypothesized that the correlation between the EDE and Daily Food
Records would be stronger for the assessment of OBE episodes than Total (OBE + SBE)
episodes, but that the correlation between the EDE and Daily Food Records would be
stronger for the assessment of Total (OBE + SBE) episodes than SBE episodes.
As stated above, Pearson product-moment correlations were conducted between
the frequency of OBE days reported on the EDE and the frequency of OBE days reported
on the Daily Food Records. Similar correlations were calculated for OBE episodes, SBE
days, SBE episodes, Total days, and Total episodes. See Figure 1 for a graphical
representation of these analyses.
These correlations were then compared as follows. First, the correlation between
the EDE and Daily Food Records for the assessment of OBE days was compared to the
correlation between the EDE and Daily Food Records for the assessment of SBE days.
Second, the correlation between the EDE and Daily Food Records for the assessment of
OBE days was compared to the correlation between the EDE and Daily Food Records for
the assessment of Total days. Third, the correlation between the EDE and Daily Food
Records for the assessment of SBE days was compared to the correlation between the
EDE and Daily Food Records for the assessment of Total days. See Figure 3 for a
graphical representation of these analyses. Fourth, the correlation between the EDE and
Daily Food Records for the assessment of OBE episodes was compared to the correlation
between the EDE and Daily Food Records for the assessment of SBE episodes. Fifth, the
50
correlation between the EDE and Daily Food Records for the assessment of OBE
episodes was compared to the correlation between the EDE and Daily Food Records for
the assessment of Total episodes. Sixth, the correlation between the EDE and Daily Food
Records for the assessment of SBE episodes was compared to the correlation between the
EDE and Daily Food Records for the assessment of Total episodes. See Figure 4 for a
graphical representation of these analyses.
Individual Differences between the EDE and Daily Food Records. Along with
correlations, the frequency of binge eating reported on the EDE and Daily Food Records
was compared using paired sample t-tests. However, mean scores obscure the fact that
some respondents may report a higher frequency of binge eating on the EDE whereas
others may report a higher frequency on Daily Food Records. Thus, analyses that
compare means do not provide information about individual differences in scores. This
limitation is particularly important to determining the correspondence between the EDE
and Daily Food Records. For example, if there is no significant difference between the
frequency of OBE days reported on the EDE and the frequency of OBE days reported on
Daily Food Records, this could either mean that respondents reported similar frequencies
of this behavior on both instruments or that some respondents reported a higher
frequency on the EDE and others reported a higher frequency on Daily Food Records.
The former would support the correspondence of the EDE and Daily Food Records
whereas the latter would not.
To examine individual differences between the frequency of binge eating reported
on the EDE and in Daily Food Records, the difference between the EDE and Daily Food

51
Records was calculated for each of the following: OBE days, OBE episodes, SBE days,
SBE episodes, Total days, and Total episodes using the following equation: Difference =
EDE frequency – Daily Food Record frequency. Thus, positive values reflect higher
frequencies on the EDE whereas negative values reflect higher frequencies on the Daily
Food Records. Frequency tables of difference scores were calculated for each of the
following: OBE days, OBE episodes, SBE days, SBE episodes, Total days, and Total
episodes.
Analysis of Sensitivity, Specificity, Positive Predictive Value, and Negative
Predictive Value. Sensitivity and specificity were calculated using equations based on the
number of True Positives, True Negatives, False Positives, and False Negatives. A True
Positive occurs when a person does have a disorder and the instrument correctly
identifies that the person does have that disorder. A True Negative occurs when a person
does not have a disorder and the instrument correctly identifies that person as not having
the disorder. A False Positive occurs when a person does not have the disorder, but the
instrument incorrectly identifies that the person does have the disorder. Finally, a False
Negative occurs when a person does have the disorder, but the instrument incorrectly
identifies that person as not having the disorder. Sensitivity is calculated by dividing the
number of True Positives by the sum of True Positives and False Negatives. In other
words, Sensitivity is the probability that, if the person has the disorder, the instrument
will correctly identify the person as having the disorder. Specificity is calculated by
dividing the number of True Negatives by the sum of True Negatives and False Positives.

52
Specificity is the probability that, if a person does not have the disorder, the instrument
will correctly identify that person as not having the disorder.
Positive Predictive Value (PPV) is the probability that, if the instrument identifies
the person as having the disorder, the person does in fact have the disorder. It is
calculated by dividing the number of True Positives by the sum of True Positives and
False Positives. Negative Predictive Value (NPV) is the probability that, if the instrument
identifies the person as not having the disorder, the person does not actually have the
disorder. It is calculated by dividing the number of True Negatives by the sum of True
Negatives and False Negatives.
In this study, the diagnostic status of each participant was determined twice, first
using the DFRs and then using the EDE. The EDE diagnosis was then compared to the
DFR diagnosis. In other words, the DFR diagnosis was used as the criterion and the
instrument in question was the EDE. Currently, BED is classified in the DSM-IV-TR
(American Psychiatric Association, 1994) as Eating Disorder Not Otherwise Specified
and does not have its own set of criteria. However, research criteria for BED are included
in Appendix B of the DSM-IV-TR (APA, 1994). These criteria include the presence of
binge eating two days per week for the past six months and the absence of regular
compensatory behaviors. Episodes of binge eating are defined as “eating, in a discrete
period of time, an amount of food that is definitely larger than most people would eat in a
similar period of time under similar circumstances” and must include “a sense of loss of
control over eating during the episode” (p. 787). The binge eating must also be
characterized by at least three of the following: eating more rapidly than normal, eating

53
until feeling uncomfortably full, eating large amounts of food when not physically
hungry, eating alone because of being embarrassed by how much one is eating, and
feeling disgusted with oneself, depressed or very guilty after overeating.
Currently, the eating disorder workgroup for DSM-V is considering changing the
criteria for BED. One possible change is to decrease the frequency criteria for binge
eating to once per week. A second change being considered is to eliminate the “large
amount of food” criterion for a binge episode. This would mean that both OBEs and
SBEs would be considered “binges.” Thus, four analyses were conducted that allowed for
the comparison of the sensitivity, specificity, PPV, and NPV of the EDE across these
various criteria sets: OBEs twice per week in Month 1, OBEs once per week in Month 1,
Total episodes (OBEs + SBEs) twice per week in Month 1, and Total episodes once per
week in Month 1. Given that the duration criteria for BED are likely to change to 3
months, two additional analyses were conducted: OBEs twice per week in Months 1-3
and OBEs once per week in Months 1-3. The sensitivity, specificity, PPV, and NPV of
the EDE could not be conducted for the past three months for the frequency of Total
episodes because the frequency of SBEs was not assessed in Months 2 or 3 by the EDE.
Distress was not used as a criterion for BED because this variable was not captured on
the daily food records; thus, there is no comparison for distress reported on the EDE.
Discriminant validity. To date, there is no research on whether the EDE
demonstrates discriminant validity with regard to the assessment of binge eating. Thus,
this study tested whether the EDE correlated more strongly with another measure of

54
binge eating than it did with assessments of other constructs, specifically depression, self-
esteem, and shape concern.
I hypothesized that both the EDE and Daily Food Records would demonstrate
discriminant validity when compared to measures of depression, self-esteem, and shape
concern. The discriminant validity of the EDE was supported if the correlation between
the frequency of OBE days reported on the EDE and Daily Food Records was stronger
than each of the following: the correlation between the frequency of OBEs reported on
the EDE and scores on measures of depression (IDS-SR), self-esteem (RSE), and body
dissatisfaction (BSQ). Similar analyses were performed in which the frequency of OBE
days was replaced in the above by the following variables: the frequency of OBE
episodes, SBE days, SBE episodes, Total days, or Total episodes.
First, the number of OBE days reported on the EDE was correlated with the
following variables: the number of OBE days reported on Daily Food Records,
depression scores (IDS-SR), self-esteem scores (RSE), and body dissatisfaction scores
(BSQ). Likewise, the number of OBE days reported on Daily Food Records was
correlated with the following variables: the number of OBE days reported on the EDE,
depression scores (IDS-SR), self-esteem scores (RSE), and body dissatisfaction scores
(BSQ). This correlation matrix was repeated five times, replacing OBE days with each of
the following: OBE episodes, SBE days, SBE episodes, Total days, and Total episodes.
See Figure 5 for a graph of the proposed correlation matrix.
To test the hypothesis that the EDE demonstrated discriminant validity, the
correlation between the frequency of OBE days reported on the EDE and Daily Food

55
Records was compared to the correlation between the frequency of OBEs reported on the
EDE and measures of depression (IDS-SR), self-esteem (RSE), and body dissatisfaction
scores (BSQ). These correlations were compared using the method described above. This
analysis was replicated for the assessment of OBE episodes, SBE days, SBE episodes,
Total days, and Total episodes. See Figure 6 for a graphical representation of these
analyses.
Analysis of contamination. Although comparing the frequency of binge eating
reported on the EDE and Daily Food Records gives information with regard to the
correspondence of the two measures, it does not provide information on which instrument
is a more accurate assessment of the construct of binge eating. As there is no completely
accurate measure of binge eating with which to compare these two instruments, the
validity of these measures will be tested by assessing their relationships to measures of
theoretically-related constructs.
I hypothesized that Daily Food Records would provide a more accurate
assessment of binge eating. The EDE is hypothesized to be less accurate because it relies
on recall, which can be contaminated by mood states. To test this hypothesis, the
correlation between the number of OBE days reported on the EDE and scores on the
measure of depression (IDS-SR) was compared to the correlation between the number of
OBE days reported on the Daily Food Records and the measure of depression (IDS-SR).
If the EDE was more contaminated by mood than the Daily Food Records, the correlation
between the EDE and the measure of depression (IDS-SR) would be significantly higher
than the correlation between the Daily Food Records and the measure of depression

56
(IDS-SR). This comparison was replicated for each of the following: OBE episodes, SBE
days, SBE episodes, Total days, and Total episodes. Likewise, the correlation between
the EDE and self-esteem (RSE) was compared to the correlation between Daily Food
Records and self-esteem (RSE) and the correlation between the EDE and body
dissatisfaction (BSQ) was compared to the correlation between the Daily Food Records
and body dissatisfaction (BSQ). See Figure 7 for a graphical representation of these
analyses.
Results
Preliminary Analyses
The data first were checked for outliers. Data points that were more than 5
standard deviations from the mean were to be omitted (Howell, 2002); however, no data
points fit this description. The primary analysis of this study was to examine whether
there was a significant difference between the frequency of OBE episodes reported on the
EDE and in the DFRs over the entire three-month time period. A posthoc analysis was
conducted to determine whether there was sufficient power to detect a significant
difference between the frequency of OBE episodes reported on these two instruments
using a matched pairs t-test. Sample size was 34 participants and the data provided a
standard deviation of 11.09. Power for possible mean differences was calculated at the
significance level of .05, double sided, using MacAnova (Oehlert & Bingham, 2006).
These calculations indicated that there was 80% power to detect a mean difference of 5.5
episodes, which represents an effect size of .50. The size of the effect for the difference
between frequency of OBE episodes was only available from one study and was found to

57
be .42 (Farchaus Stein et al., 2003). Thus, a sample size of 34 appears to provide
adequate power to detect a difference between the frequency of OBE episodes reported
during the EDE and in the DFRs.
Interrater agreement was calculated for the coding of OBE days, OBE episodes,
SBE days, and SBE episodes in 20% of the sample. Determining the interrater agreement
by calculating the proportion of agreement among raters does not take into account that
agreement may occur by chance. Thus, Tinsley and Weiss (1975) recommended the
equation presented by Lawlis and Lu (1972) to determine whether there is interrater
agreement that is significantly different than interrater agreement due to chance. Tinsley
and Weiss also recommended calculating a T statistic, which indicates the extent of the
interrater agreement and is interpreted on the same scale as Cohen’s kappa. The coding
for OBE days and SBE days was categorical, either a binge occurred on that day or not;
thus, the proportion of agreement based on chance alone is 50%. Based on a chance
agreement of 50%, there was almost perfect agreement for the coding of OBE days, χ2(1,
N=433) = 382.56, p<.001; T = 93.8, and SBE days, χ2(1, N=433) = 363.99, p<.001; T =
91.7.
The coding of OBE episodes and SBE episodes was continuous because a
participant could have x number of episodes on a particular day. There are no current data
on the maximum number of episodes people with BED experience per day; thus, there
was no a priori range for x. Because the proportion of agreements due to chance is
needed to determine interrater agreement and is based on the range of responses, a range
for the daily frequency of OBE and SBE episodes was determined post hoc. The

58
observed range for OBE episodes was 0-2, representing a 3-point scale, whereas the
observed range for SBE episodes was 0-3, representing a 4-point scale. Although a higher
frequency of episodes could have been observed, using the smallest possible range is the
most conservative approach as it undervalues each observed agreement. Using a 3-point
scale, the proportion of agreement based on chance alone is .33. Thus, based on a chance
agreement of 33.3%, there was there was almost perfect agreement for the coding of OBE
episodes, χ2(1, N=433) = 776.84, p<.001; T = 94.1. Based on a chance agreement of 25%,
there was there was almost perfect agreement for the coding of SBE episodes, χ2(1,
N=433) = 1127.10, p<.001; T = 93.2.
Comparison of the EDE and Daily Food Records
The results show positive correlations between the EDE and DFRs for all analyses
(see Table 20). The correlations between the EDE and DFRs in Month 1 were significant
for OBE days, OBE episodes, Total days, and Total episodes. The effect sizes for these
correlations were medium to large, ranging from .44 to .54. There were medium-sized
correlations between the EDE and DFRs in Month 1 for SBE days or SBE episodes (rs
=.25 to .31), but these correlations did not reach significance. Likewise, there were small
to medium sized correlations between the EDE and DFRs for OBE days and OBE
episodes in Months 2 and 3 (rs =.17 to .32), but these did not reach significance. The
correlation between the EDE and DFRs for the total time period (Months 1-3) was
significant for OBE days (r = .41), but not for OBE episodes (r = .32). Although the
correlations between the EDE and DFRs weakened from Month 1 to Month 3 for both
OBE days and OBE episodes, there were no significant differences between the

59
correlations in Month 1 and Month 2, Month 1 and Month 3, or Month 1 and the Total
time period.
Overall, participants reported a higher frequency of binge eating on the EDE than
were recorded in the DFRs. This difference was significant for OBE days and episodes in
Month 1, OBE days and episodes in Month 2, OBE days and episodes in Month 3, and
OBE days and episodes for the Total time period. Effect sizes for these differences
ranged from .37 to .67. Although participants reported more SBE days and episodes on
the EDE than the DFRs for Month 1, these differences were not significant (ds =.07 to
.10). Likewise, the differences between the EDE and DFRs for Total days and episodes
(OBEs + SBEs) in Month 1 were not significant (ds =.21 to .24). These results are
summarized in Tables 20 and 21.
Exclusion of Zero-Pairs
Preliminary analyses indicated that there were several zero-pairs present.
Specifically, with regard to the analyses of OBE days and episodes, 13 participants were
removed from the analyses for Month 1, 14 for Month 2, five for Month 3, and three for
the Total time period. With regard to the analyses of SBE days and episodes in Month 1,
five participants were removed from the analyses. Finally, with regard to the Total days
and episodes for Month 1, five participants were removed from the analyses.
When the zero-pairs were removed from the analyses, the correlations between
the EDE and DFRs remained positive but only two remained significant (see Table 22).
Specifically, the correlation between the EDE and DFR for Total episodes in Month 1 (r
= .38) and the correlation between the EDE and DFRs for OBE days during the Total

60
time period (r = .38) remained significant. Overall, the correlations between the EDE and
DFR weakened when the zero-pairs were removed. The effect size for the correlations
between the EDE and EDE-Q for OBE days and episodes and Total days and episodes in
Month 1 and OBE days and episodes in Months 1-3 were medium (as opposed to large in
the full sample), ranging from .34 to .41. The effect sizes for the correlations between the
EDE and EDE-Q for SBE days and episodes in Month 1 were small (as opposed to
medium in the full sample), ranging from .15 to .23. Finally, the effect size for the
correlations between the EDE and EDE-Q for OBE days and episodes in Months 2 and 3
were small (as opposed to medium in the full sample), ranging from .10 to .17. However,
the differences between the correlations in the full and partial samples did not reach
significance.
When the zero-pairs were removed from the analyses, the differences between the
frequency of binge eating reported on the EDE and the DFRs retained the same pattern.
Specifically, participants reported significantly more OBE days and episodes on the EDE
at all time points, but there were no significant differences between the EDE and DFRs
for SBE days in Month 1, SBE episodes in Month 1, Total days in Month 1, or Total
episodes in Month 1. It should be noted that the effect sizes for the difference between
the frequency of OBE days and episodes reported on the EDE and in the DFRs increased
when zero-pairs were removed, ranging from .53 to .79 as opposed to .37 to .67 for the
full sample. The effect sizes for the frequency of SBE days, SBE episodes, Total days,
and Total episodes remained approximately the same when the zero-pairs were removed.
The results are summarized in Tables 22 and 23.
61
Comparison of Days and Episodes
The correlation between the EDE and DFR for the frequency of OBE days Month
1 was compared to the correlation between the EDE and DFR for the frequency of OBE
episodes in Month 1 and there were no significant differences between these correlations.
Similar comparisons were made for the assessment of SBE days and episodes in Month
1, Total days and episodes in Month 1, OBE days and episodes in Month 2, OBE days
and episodes in Month 3, and OBE days and episodes during the Total time period and
none of these differences reached significance. These analyses were repeated when the
zero-pairs were removed and, likewise, there were no significant differences between the
correlations between the EDE and DFRs for days versus episodes. Please refer to Table
24 for details.
Comparison of OBEs, SBEs, and Total (OBEs + SBEs) for Days and Episodes
Respectively
The correlation between the frequency of OBE days reported on the EDE in
Month 1 and in the DFRs in Month 1 was compared to the correlation between the
frequency of SBE days reported on the EDE in Month 1 and in the DFRs in Month 1.
Likewise, the correlation between the frequency of OBE days reported on the EDE and in
the DFRs in Month 1 was compared to the correlation between the frequency of Total
days reported on the EDE and in the DFRs in Month 1. Finally, the correlation between
the frequency of SBE days reported on the EDE and in the DFRs in Month 1 was
compared to the correlation between the frequency of Total days reported on the EDE
and in the DFRs in Month 1. There were no significant differences between any of these

62
correlations. Likewise, there were no significant differences between the correlations
when the zero-pairs were removed.
Similarly, the correlation between the frequency of OBE episodes reported on the
EDE in Month 1 and in the DFRs in Month 1 was compared to the correlation between
the frequency of SBE episodes reported on the EDE in Month 1 and in the DFRs in
Month 1. The correlation between the frequency of OBE episodes reported on the EDE
and in the DFRs in Month 1 was also compared to the correlation between the frequency
of Total episodes reported on the EDE and in the DFRs in Month 1. Finally, the
correlation between the frequency of SBE episodes reported on the EDE and in the DFRs
in Month 1 was compared to the correlation between the frequency of Total episodes
reported on the EDE and in the DFRs in Month 1. Again, there were no significant
differences between any of these correlations in the full sample or when the zero-pairs
were removed. Thus, the inclusion of zero-pairs did not significantly inflate the
convergent validity between the EDE and EDE-Q in this sample. Refer to Table 25 for
details.
Individual Differences between the EDE and Daily Food Records
An analysis of individual differences suggests that approximately twice as many
participants reported a higher frequency of objective binge eating on the EDE as in the
DFRs for all time points. This was in contrast to the finding that approximately the same
number of participants reported subjective binge eating on the EDE as in the DFRs. In
addition, approximately twice as many participants reported the same frequency of OBEs
on the EDE and DFR as reported the same frequency of SBEs on the EDE and DFR. This

63
finding may be due to the higher number of participants who reported zero OBEs on both
instruments in Month 1 than reported zero SBEs on both instruments in Month 1. See
Figure 9.
Analysis of Sensitivity, Specificity, Positive Predictive Value, and Negative Predictive
Value
The sensitivity, specificity, PPV, and NPV of the EDE, using DFR diagnoses as
the criterion, were calculated to determine the probability that the participants with and
without BED were correctly categorized by the EDE. These analyses were calculated
using different diagnostic criteria for BED. When BED was defined as having OBEs
twice per week in Month 1 the sensitivity, specificity, and NPV of the EDE ranged from
88% to 100%, but the PPV was only 20%. When BED was defined as having OBEs once
per week in Month 1, the sensitivity, specificity, and NPV of the EDE all decreased,
ranging from 60% to 92% whereas the PPV increased slightly to 30%. When BED was
defined as Total episodes (OBEs + SBEs) twice per week in Month 1, the sensitivity,
specificity, PPV, and NPV of the EDE were all moderate, ranging from 57% to 80%.
Finally, when BED was defined as Total episodes once per week in Month 1, the
sensitivity, specificity, PPV, and NPV of the EDE ranged from 67% to 94%. Although
defining BED as OBEs twice per week in Month 1 resulted in the highest sensitivity and
specificity, the PPV of the EDE was sacrificed. Defining BED as total binges at a
frequency of once per week during Month 1 resulted in acceptable sensitivity and
specificity of the EDE without sacrificing the PPV or NPV of the EDE.

64
When BED was defined as reporting two OBEs per week for three months on the
DFRs, the sensitivity, specificity, PPV, and NPV of the EDE ranged from 50% to 94%.
When the frequency criterion was changed to an average of one OBE per week for three
months, the sensitivity, specificity, PPV, and NPV of the EDE decreased to 33% to 90%.
Thus, when using data from all three months, defining BED as OBEs twice per week
resulted in higher sensitivity, specificity, PPV, and NPV for the EDE than defining BED
as OBEs once per week. See Figures 10-12.
Discriminant Validity
The discriminant validity of the EDE was examined to determine whether the
EDE was able to distinguish between the construct of binge eating and related constructs
such as body dissatisfaction, depression, and self-esteem. The relationship between the
EDE and DFRs was not significantly stronger than the relationship between the EDE and
a measure of body dissatisfaction for any type of binge eating (e.g., OBE, SBE).
Likewise, the relationship between the EDE and DFRs was not significantly stronger than
the relationship between the EDE and a measure of depression for any of the binge eating
comparisons. Finally, the relationship between the EDE and DFRs was not significantly
stronger than the relationship between the EDE and a measure of self-esteem for any type
of binge eating. See Table 26 for the correlation matrix and Table 27 for the comparison
of correlations.
Analysis of Contamination
An analysis of contamination was conducted to determine whether the assessment
of binge eating using one of the two instruments, the EDE or DFRs, was less influenced

65
by related constructs such as body dissatisfaction, depression, and self-esteem. Body
dissatisfaction did not correlate more strongly with the EDE than with the DFRs in any of
the binge eating comparisons. Likewise, depression did not correlate more strongly with
the EDE than with the DFRs for any type of binge eating. Finally, self-esteem did not
correlate more strongly with the EDE than with the DFRs in any of the binge eating
comparisons either. See Table 26 for the correlation matrix and Table 28 for the
comparison of correlations.
Discussion
The purpose of the current study was to expand on previous research on the
convergent validity of the EDE and DFRs by (1) using a BED sample who could not use
their recollection of compensatory behaviors to enhance their recollection of binge eating,
(2) analyzing the results in a full sample as well as a partial sample in which zero-pairs
are removed, (3) examining the convergence between the EDE and DFRs over three
months, (4) distinguishing between OBEs and SBEs, (5) examining the convergence of
the two instruments with regard to diagnostic status, (6) determining whether the two
instruments can distinguish between binge eating and similar constructs (e.g.,
depression), and (7) whether similar constructs contaminate one instrument more than the
other.
The primary purpose of this study was to examine the convergence of the EDE
and DFRs. The results demonstrated a positive relationship between the EDE and DFRs
suggesting that people who report more binge eating on one instrument also report more
binge eating on the other instrument. However, this relationship only reached

66
significance for the assessment of objectively large binges and total binges during Month
1 and objectively large binges during the total three-month time period. There were
significant differences between the frequency of binge eating reported on the EDE and
DFRs for objectively large binge eating only, with participants reporting significantly
more objectively large binges on the EDE than in the DFRs during every time period.
In contrast, the correlation between the EDE and DFRs for subjective binge eating
did not reach significance and there were no significant differences in the frequency of
binge eating reported on the EDE and DFRs for subjective binge eating. These findings
indicate that there was essentially no relationship between the two assessments;
participants who reported higher frequencies of subjective binge eating on one instrument
did not report higher frequencies of subjective binge eating on the other instrument. The
non-significant comparison of means analysis typically implies that there was not a
significant difference between the frequency of subjective binge eating reported on the
EDE as compared to the DFRs. However, it is important to remember that comparison of
means analyses can obscure the fact that some participants may be reporting significantly
more binge eating on one instrument than the other and vice versa. The analysis of
individual differences supports the latter assertion in this sample. Approximately the
same percentage of patients reported more subjective binge eating on the EDE than the
DFRs as reported more subjective binge eating on the DFRs than the EDE. Given these
findings and the high variance with regard to the assessment of subjective binge eating, it
is likely that the non-significant difference between the EDE and DFRs for the

67
assessment of subjective binge eating obscures significant differences in individual
scores.
The exclusion of these zero-pairs did not change the results of the comparison of
means analysis. Although the exclusion of zero-pairs weakened the correlations between
the EDE and DFRs so that most were no longer significant, these changes in the
correlations were not significant. It should be noted that this may be due to lower power
with smaller samples. In fact, there were changes in the size of the effects when the zero-
pairs were removed. With regard to the correlations between the EDE and DFRs, large
effects in the full sample were reduced to medium effects in the partial sample and
medium effects were reduced to small effects. Likewise, with regard to the mean
differences between EDE and DFRs for the assessment of OBE days and episodes in
Months 1, 2, and 3, small and medium effects in the full sample increased to medium and
large effects in the partial sample respectively. Thus, the convergent validity between the
EDE and the DFRs was lower when zero-pairs were removed from the analyses.
Secondary analyses examined whether there were differences in the convergence
between the EDE and DFRs (1) across time, (2) for the assessment of binge days versus
binge episodes, and (3) for the assessment of objective versus subjective versus total
binge eating. The results indicated that there were no significant differences in the
relationship between the EDE and DFRs over time. However, this finding may be due to
insufficient power. The convergence between the EDE and the DFRs was not
significantly stronger for binge days or binge episodes for any type of binge eating or
during any time period. Finally, there were no significant differences in the relationships

68
between the EDE and DFR for the assessment of OBEs, SBEs, or Total episodes. The
results from these secondary analyses were replicated when the zero-pairs were excluded
from the analyses. Thus, the evidence suggested that there was no significant difference
in the validity of assessing objectively large binge episodes across time, assessing days
versus episodes, or assessing objective versus subjective versus total binge eating.
Analyses of sensitivity and specificity indicate that the sensitivity and specificity
of the EDE vary as the criterion set for BED varies. Specifically, as the criteria for BED
became less stringent, the sensitivity of the EDE increased and the specificity of the EDE
decreased. In other words, as the criteria became less stringent, the probability of
obtaining a false positive increases and the probability of obtaining a false negative
decreases. This may be considered an advantageous exchange as incorrectly identifying a
person as not having BED may prevent treatment of the disorder. Additionally, when the
criteria for BED became less stringent, the PPV of the EDE also increased (i.e., the
probability that a person identified by the EDE as having BED actually has BED
increases). This has important implications for research studies in particular as the EDE is
often used as a diagnostic assessment in research.
Importantly, the proposed criteria for DSM-V define BED as OBEs occurring on
average twice per week for three months (APA, 2010). Thus, these data provide an
approximate comparison of the sensitivity, specificity, PPV, and NPV of the EDE when
using the DSM-IV-TR versus the DSM-V criteria for BED. These data suggest that the
sensitivity, PPV, and NPV of the EDE are all higher using the DSM-IV-TR criteria
whereas the specificity of the EDE is higher using the DSM-V criteria. However, the

69
specificity of the EDE only decreased slightly, from 73% to 67%, when using DSM-IV-
TR criteria rather than DSM-V criteria. These data suggest that the DSM-V criteria do
not provide an improvement in the criteria for BED with regard to accuracy of symptom
assessment.
The EDE did not demonstrate disciminant validity from measures of related
constructs as the correlations between the EDE and the DFR were not significantly
stronger than the correlations between the EDE and measures of body dissatisfaction,
depression, or self-esteem. These findings indicate that the EDE was not able to
distinguish between binge eating and body dissatisfaction, depression, or self-esteem.
However, it should be noted that the relationship between the EDE and measures of body
dissatisfaction, depression, and self-esteem were not significantly stronger than the
relationships between the DFRs and measures of body dissatisfaction, depression, and
self-esteem. Thus, the EDE was not significantly more contaminated by body
dissatisfaction, depression, and self-esteem than were the DFRs.
Overall, these data provide support for the validity of the EDE to estimate the
frequency of objective binge eating and total binge frequency recorded on the DFRs in
Month 1. The data provide limited support for the validity of the EDE with regard to the
assessment of subjective binge eating in Month 1 or objective binge eating in Months 2
or 3. The results do not support the ability of the EDE to discriminate between the
assessment of binge eating as measured by DFRs and the assessment of related constructs
such as body dissatisfaction, depression, and self-esteem. However, the results suggest

70
that the EDE and DFRs were equally contaminated by body dissatisfaction, depression,
and self-esteem.
Although the EDE demonstrated convergent validity with the DFRs for the
assessment of objective binge eating and total bingeing, the inconsistencies between these
instruments had a significant impact on the sensitivity, specificity, PPV, and NPV of the
EDE. Unfortunately, these data do not indicate whether the inconsistencies between the
EDE and DFRs are due to a limitation of the EDE, a limitation of the DFRs, or a problem
related to the construct of binge eating itself.
Two other studies have compared assessments of binge eating to food records. In
the first (Ortega, Waranch, Maldonado, & Hubbard, 1987), eight women with BN
reported significantly more binge episodes on weekly recall sheets than in daily food
records, with large effect sizes. In the second study (Bardone, Krahn, Goodman, &
Searles, 2000), 45 undergraduate women were asked to call an interactive voice response
(IVR) system daily to report the number of binge eating episodes they had on the
previous day. At the end of 12 weeks, the researchers assessed participants’ binge eating
and binge drinking during the previous 12 weeks using a time-line follow-back (TLFB)
assessment. The TLFB procedure is a structured interview that orients participants to the
past 12 weeks and then asks participants to recall the frequency of behaviors during that
period. The TLFB was originally designed to assess alcohol consumption (Sobell et al.,
1986). The results indicated that participants were 2.2 times more likely to report regular
binge eating during the past 12 weeks when reporting their behaviors using the IVR
compared to the TLFB.
71
These findings suggest that other assessments of retrospective binge eating also
perform poorly when compared to daily recordings of binge eating. Based on these data,
one might wonder whether the inconsistencies between the EDE and DFRs are simply
because the EDE is based on recall. However, it should be noted that in the Ortega et al.
(1987) study, there was no significant difference between the frequency of purging
recorded in the daily diaries and the frequency recalled at the end of the week at either
baseline (Cohen’s d = .16) or post-treatment (Cohen’s d = .21). These findings have been
replicated with the EDE (Farchaus Stein et al., 2003; Loeb et al., 1994; Rosen et al.,
1990). Thus, the inconsistencies present in the assessment of binge eating do not appear
to be present for the assessment of compensatory behaviors. This suggests that the
inconsistencies in the assessment in binge eating are not due to problems inherent in the
retrospective recall of behaviors nor are they due to limitations of the EDE specifically.
Rather, the consistency with which assessments of binge eating differ in their estimates of
binge eating frequency suggest that there may be important limitations with regard to the
construct of binge eating.
This study had several strengths. Most notably, this was the first study to
compare: (1) the EDE to Daily Food Records for a 3-month time period, (2) the validity
of assessing binge days versus binge episodes, (3) the validity of assessing OBEs versus
SBEs versus Total binge eating, and (4) the validity of assessing OBEs in Month 1, 2, 3,
and Months 1-3. It was also the first study to examine the sensitivity, specificity, PPV,
and NPV of the EDE; the discriminant validity of the EDE; and whether the EDE or

72
DFRs are more contaminated by related constructs (e.g., depression). Finally, this is the
only study to identify zero-pairs and re-examine the data after removing such pairs.
Unfortunately, this study also had several limitations, of which the small sample
size is arguably the most important. Of the 91 participants that completed an end-of-
treatment EDE, only 34 (37%) completed a daily food record within 28 days of the end-
of-treatment EDE. Additionally, of the 2,856 data points for the DFRs (84 days x 34
participants), 577 (20.2%) were missing. Although this is a significant amount of missing
data, the only other study to ask participants to use daily recordings of binge eating
reported a comparable percentage of missing data (17.6%; Bardone et al., 2000).
Unfortunately, it is impossible to know whether the DFRs were missing because
participants did not record or because they were not in therapy or were not asked to turn
in the records.
Given the importance of making correct diagnoses prior to beginning treatment,
future studies should examine the 3-month convergent validity of the EDE and DFRs in a
sample of non-treatment-seeking eating disorder patients or in a sample of treatment-
seeking patients prior to starting treatment as these participants likely experience higher
rates of binge eating. Additionally, comparing the convergent validity of the EDE and
DFRs to the convergent validity of the EDE-Q and DFRs may provide important
information regarding the comparative validity of self-report versus interview-based
assessments of binge eating. Finally, with DSM-V on the horizon, it is important to
remember that the criteria for eating disorders may change soon. Given that the EDE is
one of the most widely used diagnostic instruments, it may be beneficial to examine the
73
criterion-oriented validity of the EDE with regard to possible criteria sets. Comparing the
criterion-oriented validity of the EDE for different criteria sets could provide useful
information not only for the validity of the EDE, but also the validity of the criteria sets.

74
Table 1. Test-Retest Reliability of EDE
Grilo et al. (2003)§ 18 .88** .51* .50* .52* .71** .70** .17 .17 - -Rizvi et al. (2000)± 20 .76** .74** .76** .71** .83** .85** .40 .34 .97** .97***p <.05; **p<.001±Spearman's rho§Pearson Product Moment Correlation EDE: Eating Disorder Examination
N RestraintEating
Concern Shape
ConcernVomiting
DaysVomiting Episodes
Weight Concern
Objective Bulimic Days
Objective Bulimic
Episodes
Subjective Bulimic Days
Subjective Bulimic
Episodes
Table 2. Inter-Rater Reliability of the EDE
Grilo et al. (2003)§ 18 .96* .90* .84* .65* .99* .98* .91* .91* - -Rizvi et al. (2000)± 20 .95* .94* .90* .99* .99* .99* .99* .91* 1.0* 1.0*Rosen et al. (1990)¥ 106 .92 .98 .99 .95 - - - - - -*p <.001; ¥Significance levels were not provided§Pearson Product Moment Correlation ±Spearman's rhoEDE: Eating Disorder Examination
Objective Bulimic Days
Objective Bulimic
Episodes
Subjective Bulimic Days
Subjective Bulimic
EpisodesVomiting
DaysVomiting EpisodesN Restraint
Eating Concern
Shape Concern
Weight Concern

75
Table 3. Internal Consistency of the EDE
N Restraint Eating
Concern Shape
Concern Weight
Concern Beumont et al. (2003) 116 .78 .68 .70 .70 Byrne et al. (in press)a 158 .64 .68 .85 .76 Byrne et al. (in press)b 317 .65 .44 .77 .69 Byrne et al. (in press)c 170 .58 .69 .79 .67 Cooper et al. (1989) 142 .75 .78 .79 .67 Grilo et al. (in press) 688 .63 .60 .68 .51 EDE: Eating Disorder Examination aEating disorder sample bCommunity sample cObese sample

76
Table 4. Test-Retest Reliability of the EDE-Q
N Restraint Vomiting
Reas et al. (2006)± 86 .77** .72** .66** .71** .84** .51** .39** - - -
N Restraint ExerciseMond et al. (2004)a 196 .57** .77** .75** .73** .44* .28* .31** p<=.01, ** p<=.001±Spearman's rho§Pearson Product Moment Correlation EDE-Q: Eating Disorder Examination-Questionnaire
139Luce & Crowther
(1999)§
EDE-Q: LONG-TERM TEST-RETEST RELIABILITY
Eating Concern
Objective Bulimic
Episodes
Subjective Bulimic
Episodes
.94**.87**.81**
Eating Concern
Shape Concern
Weight Concern
.92**
SHORT-TERM TEST-RETEST RELIABILITY
.54**.65**.92**--
Objective Overeating Episodes
Laxative Use
Diuretic Use
Shape Concern
Weight Concern
Objective Bulimic
Episodes
Subjective Bulimic
Episodes
.68**

77
Table 5. Internal Consistency of the EDE-Q
Luce & Crowther, 1999* 203 .84 .78 .93 .89Luce & Crowther, 1999^ 139 .85 .81 .92 .89Mond et al., 2004a 208 - .73 .87 -Peterson et al., 2007 203 .70 .73 .83 .72*Time 1^Time 2EDE-Q: Eating Disorder Examination-Questionnaire
NWeight
ConcernShape
ConcernEating
Concern Restraint

78
Table 6. Ability of the EDE to Detect Group Differe nces
Cohen's dN Mean SD AN/NW BN/NW AN/BN N Mean SD BN/ NW N Mean SD BED/NW BED/OW
AN 47 3.17 1.47 - - - - - -BN 53 3.14 1.22 15 3.27 0.26 - - -
BED - - - - - - 105 1.90 1.20NW 42 0.91 0.91 15 3.15 0.33 42 0.90 0.90OW - - - - - - 15 1.70 1.30AN 47 2.17 1.62 - - - - - -BN 53 2.43 1.30 15 2.4 0.34 - - -
BED - - - - - - 105 1.80 2.10NW 42 0.22 0.33 15 1.25 0.23 42 0.20 0.30OW - - - - - - 15 0.60 0.90AN 47 2.85 1.22 - - - - - -BN 53 3.55 1.35 15 3.82 0.31 - - -
BED - - - - - - 105 3.40 1.00NW 42 0.64 0.75 15 2.55 0.20 42 0.50 .60OW - - - - - - 15 1.90 1.20AN 47 2.40 1.48 - - - - - -BN 53 3.14 1.44 15 3.96 0.34 - - -
BED - - - - - - 105 3.90 0.90NW 42 0.52 0.62 15 2.12 0.19 42 0.60 0.80OW - - - - - - 15 2.00 1.30AN 47 10.40 23.60 - - - - - -BN 53 26.50 27.80 - - - - - -
BED - - - - - - 105 20.10 11.10NW 42 0.00 0.00 - - - 42 0.00 0.00OW - - - - - - 15 0.00 0.00AN 47 18.00 40.80 - - - - - -BN 53 30.80 35.50 - - - - - -
BED - - - - - - 105 0.04 0.03NW 42 0.00 0.00 - - - 42 0.00 0.00OW - - - - - - 15 0.00 0.00
EDE: Eating Disorder Examination; NW: Normal Weight Control, OW: Overweight Control
Self-Induced Vomiting
OBEs
Restraint
-
-
1.64 2.34 0.50 6.68
0.40
2.54
1.86 1.87
0.62 1.34 0.62
0.62 1.22 0.33
2.55
3.86 1.69
2.16 2.64 0.54 4.87 3.5 1.35
3.96
0.94 .16
1.06 .74
0.02
1.65 2.31 0.18
Weight Concern
Shape Concern
Eating Concern
Wilfley et al. (2000)Cohen's d
Cooper et al. (1989) Wilson & Smith (1989)Cohen's d
1.83 2.06

79
Restraint NNon-vomited Caloric Intake
Frequency of Regular Meals
Frequency of Snack Foods
EAT Dieting Subscale
EAT Oral Control Subscale
TFEQ Restraint Scale
Loeb et al. (1994) 82 - - - .54* .22*** .48*Rosen et al. (1990) 106 -.39*** -.37*** -.22** - - -
Eating Concern NLoeb et al. (1994) 82 - - .37* .35**Rosen et al. (1990) 106 .50*** .52*** - -
Shape Concern N BSQEAT Dieting
SubscaleLoeb et al. (1994) 82 .76* .36*Rosen et al. (1990) 106 .82*** -
Weight Concern N BSQEAT Dieting
SubscaleLoeb et al. (1994) 82 .61* .35**Rosen et al. (1990) 106 .78*** -*p <.05, **p ≤.01, ***p <.001
Table 7. Convergence of the EDE Subscales and Measu res of Similar Constructs
EDE: Eating Disorder Examination; EAT: Eating Attitudes Test; TFEQ: Three Factor Eating Questionnaire; BSQ: Body Shape Questionnaire
Frequency of Binge Eating
Caloric Size of Binge Episodes
EAT Dieting Subscale
EAT Bulimia & Food Preoccupation
Subscale

80
Table 8. Convergence of the EDE and EDE-Q for the R estraint Subscale
NBinford et al. (2005) 24 1.87 (1.63) 1.70 (1.98) -0.17 ( -- ) .71** -0.57 75%Passi et al. (2003) 28 2.59 (2.01) 3.08 (1.94) 0.49 ( -- ) .71*** 1.67 54%Sysko, Walsh, Schebendach, et al. (2005)
12 4.40 (1.24) 5.07 (0.99) - - - -
Wolk et al. (2005) 60 4.30 (1.40) 4.70 (1.60) 0.34 (1.50) .49**** 1.70 65%BN Binford et al. (2005) 21 4.12 (1.00) 4.50 (1.16) 0.38 ( -- ) .79** 2.43* 81%
EDNOS Binford et al. (2005) 25 3.68 (1.72) 3.76 (1.73) 0.08 ( -- ) .85** 0.40 76%Grilo et al. (2001)a 82 1.84 (1.14) 2.74 (1.54) 0.90 ( -- ) .69*** 7.27*** -Grilo et al. (2001)b 47 1.56 (0.92) 2.12 (1.44) 0.56 ( -- ) .59*** 3.35** -Wilfley et al. (1997) 52 2.00 (1.20) 2.50 (1.50) 0.50 (1.10) .66**** 3.03** 62%Fairburn & Beglin (1994) 243 0.94 (1.09) 1.25 (1.32) 0.30 (0.80) .81*** 6.26*** 79%Mond et al. (2004)b 195 1.04 (1.33) 1.29 (1.27) 0.25 ( -- ) .71*** 3.51*** -Kalarchian et al. (2000) 98 1.60 (1.50) 2.09 (1.50) 0.49 (1.30) .60**** 3.70*** 60%de Zwaan et al. (2004) 45 0.56 (0.90) 1.38 (1.30) 0.82 (1.10) .54*** 4.93*** 62%
§EDE-Q rating minus EDE ratingEDE: Eating Disorder Examination; EDE-Q: Eating Disorder Examination Questionnaire
1.63 (1.80) 0.33 (1.20) .75****
AN
BED
Community Sample
AN & BN Combined
Bariatric Surgery
Substance Abusers
1.88 75%
Fairburn & Beglin (1994) 75%1.50 .78*** ---36
*p<=.05, **p<=.01, ***p<=.001, ****p<=.0001
Paired t-test / Wilcoxon matched
% within 1 point
Mean (SD)
Difference§EDE
Mean (SD)EDE-Q
Mean (SD) r / tau b
Black & Wilson (1996) 48 1.29 (1.67)

81
Table 9. Convergence of the EDE and EDE-Q for the E ating Concern Subscale
NBinford et al. (2005) 24 1.15 (1.25) 1.39 (1.43) 0.24 ( -- ) .90** 1.91 96%Passi et al. (2003) 28 1.21 (1.32) 2.23 (1.68) 1.02 ( -- ) .67*** 4.23*** 50%Sysko, Walsh, Schebendach, et al. (2005)
12 4.33 (1.01) 4.67 (1.29) - - - -
Wolk et al. (2005) 60 3.30 (1.50) 4.00 (1.30) 0.64 (1.40) .51*** 3.50*** 62%BN Binford et al. (2005) 21 3.43 (1.08) 4.40 (1.16) 0.97 ( -- ) .75** 5.56*** 57%
EDNOS Binford et al. (2005) 25 2.60 (1.51) 2.78 (1.69) 0.18 ( -- ) .94** 1.51 96%Grilo et al. (2001)a 82 2.62 (3.74) 3.90 (1.26) 1.28 (3.52) .33** 3.33*** -Grilo et al. (2001)b 47 1.64 (1.02) 3.54 (1.14) 1.92 (1.04) .55*** 12.53*** -Wilfley et al. (1997) 52 1.70 (1.10) 3.40 (1.40) 1.70 (1.00) .59**** 11.14*** 30%Fairburn & Beglin (1994) 243 0.27 (0.59) 0.62 (0.86) 0.35 ( -- ) - - -Mond et al. (2004)b 195 0.22 (0.52) 0.59 (0.84) 0.37 ( -- ) .68*** 8.26**** -Kalarchian et al. (2000) 98 1.34 (1.40) 2.43 (1.50) 1.09 (1.30) .62**** 8.41**** 50%de Zwaan et al. (2004) 45 0.53 (0.80) 0.79 (0.80) 0.25 (0.50) .80*** 3.21** 93%
§EDE-Q rating minus EDE ratingEDE: Eating Disorder Examination; EDE-Q: Eating Disorder Examination Questionnaire
% within 1 point
Mean (SD)
Difference§EDE
Mean (SD)EDE-Q
Mean (SD) r / tau b
Black & Wilson (1996) 48 --0.78 (1.19)
BED
Community SampleBariatric Surgery
Substance Abusers
*p<=.05, **p<=.01, ***p<=.001, ****p<=.0001
Paired t-test / Wilcoxon matched
AN
1.26 (1.47) - -

82
Table 10. Convergence of the EDE and EDE-Q for the Shape Concern Subscale
NBinford et al. (2005) 24 1.93 (1.60) 2.21 (1.95) 0.28 ( -- ) .89** 1.54 75%Passi et al. (2003) 28 2.76 (1.66) 3.40 (1.89) 0.64 ( -- ) .91*** 4.29**** 64%Sysko, Walsh, Schebendach, et al. (2005)
12 4.86 (0.99) 5.40 (0.76) - - - -
Wolk et al. (2005) 60 4.40 (1.30) 4.80 (1.20) 0.46 (0.74) .83**** 4.80**** 78%Binford et al. (2005) 21 4.42 (1.20) 4.95 (1.19) 0.53 ( -- ) .85** 3.67** 71%Carter et al. (2001) 57 5.30 (1.20) 5.00 (1.60) -0.30 ( -- ) .43** -0.88 -
EDNOS Binford et al. (2005) 25 3.86 (1.77) 4.28 (1.81) 0.42 ( -- ) .82** 1.92 60%Grilo et al. (2001)a 82 3.63 (1.39) 4.94 (1.06) 1.31 ( -- ) .56*** 10.03*** -Grilo et al. (2001)b 47 3.24 (0.81) 4.70 (0.89) 1.46 ( -- ) .42** 13.71*** -Wilfley et al. (1997) 52 3.80 (0.90) 4.80 (1.10) 1.00 (0.80) .69**** 8.52**** 49%Fairburn & Beglin (1994) 243 1.34 (1.09) 2.15 (1.60) 0.80 (1.00) .80*** 12.88*** 64%Mond et al. (2004)b 195 1.31 (1.17) 2.16 (1.44) 0.85 ( -- ) .78*** 12.07*** -Kalarchian et al. (2000) 98 3.28 (1.40) 4.28 (1.30) 1.00 (1.30) .77**** 10.96**** 56%de Zwaan et al. (2004) 45 1.71 (1.10) 1.71 (1.30) 0.01 (0.80) .80*** 0.05 91%
§EDE-Q rating minus EDE ratingEDE: Eating Disorder Examination; EDE-Q: Eating Disorder Examination Questionnaire
AN
2.22 (1.51) 0.63 (1.00) .84****
BN
2.31 (1.69) 4.28****
BED
Community Sample
AN & BN Combined
Bariatric Surgery
Substance Abusers
Fairburn & Beglin (1994) 36 67%5.18*** .83*** ---
*p<=.05, **p<=.01, ***p<=.001, ****p<=.0001
Paired t-test / Wilcoxon matched
% within 1 point
Mean (SD)
Difference§EDE
Mean (SD)EDE-Q
Mean (SD) r / tau b
Black & Wilson (1996) 48 67%

83
Table 11. Convergence of the EDE and EDE-Q for the Weight Concern Subscale
NBinford et al. (2005) 24 1.65 (1.49) 1.88 (1.84) 0.23 ( -- ) .83** 1.10 71%Passi et al. (2003) 28 2.18 (1.60) 2.59 (1.68) 0.41 ( -- ) .82*** 2.12* 71%Sysko, Walsh, Schebendach, et al. (2005)
12 4.32 (1.21) 5.07 (1.20) - - - -
Wolk et al. (2005) 60 3.90 (1.70) 4.60 (1.40) 0.68 (1.40) .61*** 3.90*** 62%Binford et al. (2005) 21 4.45 (1.40) 4.81 (1.39) 0.36 ( -- ) .87** 2.33* 71%Carter et al. (2001) 57 5.10 (1.20) 4.70 (1.90) -0.40 ( -- ) .54** -1.65 -
EDNOS Binford et al. (2005) 25 3.53 (1.67) 3.92 (1.71) 0.39 ( -- ) .88** 2.40* 80%Grilo et al. (2001)a 82 3.36 (1.26) 4.22 (1.08) 0.86 ( -- ) .66*** 8.05*** -Grilo et al. (2001)b 47 3.30 (0.72) 3.82 (0.86) 0.52 ( -- ) .63*** 4.24*** -Wilfley et al. (1997) 52 3.40 (1.00) 4.10 (1.10) 0.70 (0.90) .63**** 5.37**** 64%Fairburn & Beglin (1994) 243 1.18 (0.93) 1.59 (1.37) 0.40 (0.90) .79*** 7.40*** 74%Mond et al. (2004)b 195 1.12 (1.06) 1.64 (1.31) 0.52 ( -- ) .77*** 8.53*** -Kalarchian et al. (2000) 98 3.30 (1.10) 4.05 (1.20) 0.75 (0.90) .71**** 8.52**** 67%de Zwaan et al. (2004) 45 1.46 (1.10) 1.46 (1.10) 0.00 (0.70) .79*** 0.00 91%
§EDE-Q rating minus EDE ratingEDE: Eating Disorder Examination; EDE-Q: Eating Disorder Examination Questionnaire
AN
Substance Abusers
*p<=.05, **p<=.01, ***p<=.001, ****p<=.0001
Paired t-test / Wilcoxon matched
Black & Wilson (1996) 48 2.23 (1.66) 0.35 (0.90) .85****
BN
---36
1.88 (1.67)
% within 1 point
Mean (SD)
Difference§EDE
Mean (SD)EDE-Q
Mean (SD) r / tau b
2.72****
BED
Community Sample
AN & BN Combined
Bariatric Surgery
81%
Fairburn & Beglin (1994) 56%3.20*** .85***
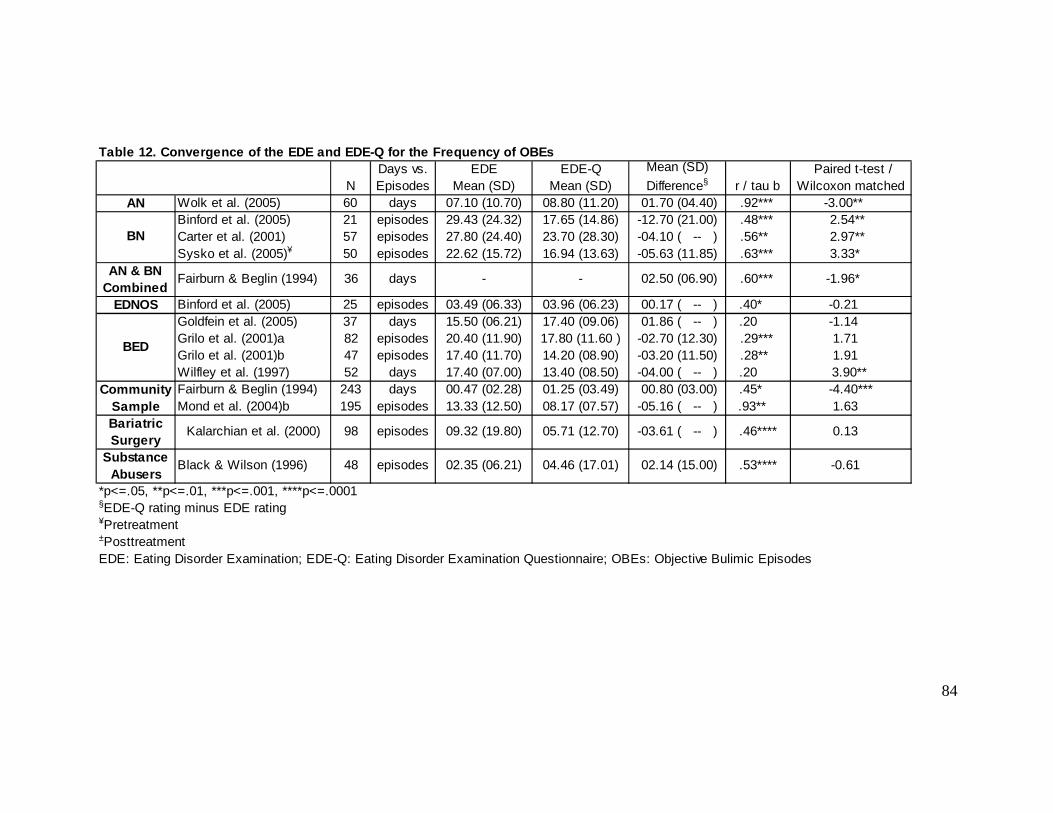
84
Table 12. Convergence of the EDE and EDE-Q for the Frequency of OBEs
NAN Wolk et al. (2005) 60 days 07.10 (10.70) 08.80 (11.20) 01.70 (04.40) .92*** -3.00**
Binford et al. (2005) 21 episodes 29.43 (24.32) 17.65 (14.86) -12.70 (21.00) .48*** 2.54** Carter et al. (2001) 57 episodes 27.80 (24.40) 23.70 (28.30) -04.10 ( -- ) .56** 2.97** Sysko et al. (2005)¥ 50 episodes 22.62 (15.72) 16.94 (13.63) -05.63 (11.85) .63*** 3.33*
EDNOS Binford et al. (2005) 25 episodes 03.49 (06.33) 03.96 (06.23) 00.17 ( -- ) .40* -0.21 Goldfein et al. (2005) 37 days 15.50 (06.21) 17.40 (09.06) 01.86 ( -- ) .20 -1.14 Grilo et al. (2001)a 82 episodes 20.40 (11.90) 17.80 (11.60 ) -02.70 (12.30) .29*** 1.71 Grilo et al. (2001)b 47 episodes 17.40 (11.70) 14.20 (08.90) -03.20 (11.50) .28** 1.91 Wilfley et al. (1997) 52 days 17.40 (07.00) 13.40 (08.50) -04.00 ( -- ) .20 3.90** Fairburn & Beglin (1994) 243 days 00.47 (02.28) 01.25 (03.49) 00.80 (03.00) .45* -4.40***Mond et al. (2004)b 195 episodes 13.33 (12.50) 08.17 (07.57) -05.16 ( -- ) .93** 1.63
§EDE-Q rating minus EDE rating¥Pretreatment±PosttreatmentEDE: Eating Disorder Examination; EDE-Q: Eating Disorder Examination Questionnaire; OBEs: Objective Bulimic Episodes
02.14 (15.00)
Fairburn & Beglin (1994) -1.96* .60*** 02.50 (06.90)--
*p<=.05, **p<=.01, ***p<=.001, ****p<=.0001
Paired t-test / Wilcoxon matched
Mean (SD)
Difference§EDE
Mean (SD)EDE-Q
Mean (SD) r / tau b
0.13 .46****-03.61 ( -- )
48
05.71 (12.70)09.32 (19.80)
Substance Abusers
-0.61
Bariatric Surgery
98Kalarchian et al. (2000)
.53****02.35 (06.21) 04.46 (17.01)
Days vs. Episodes
BED
days
episodes
Community Sample
AN & BN Combined
BN
36
episodes
Black & Wilson (1996)
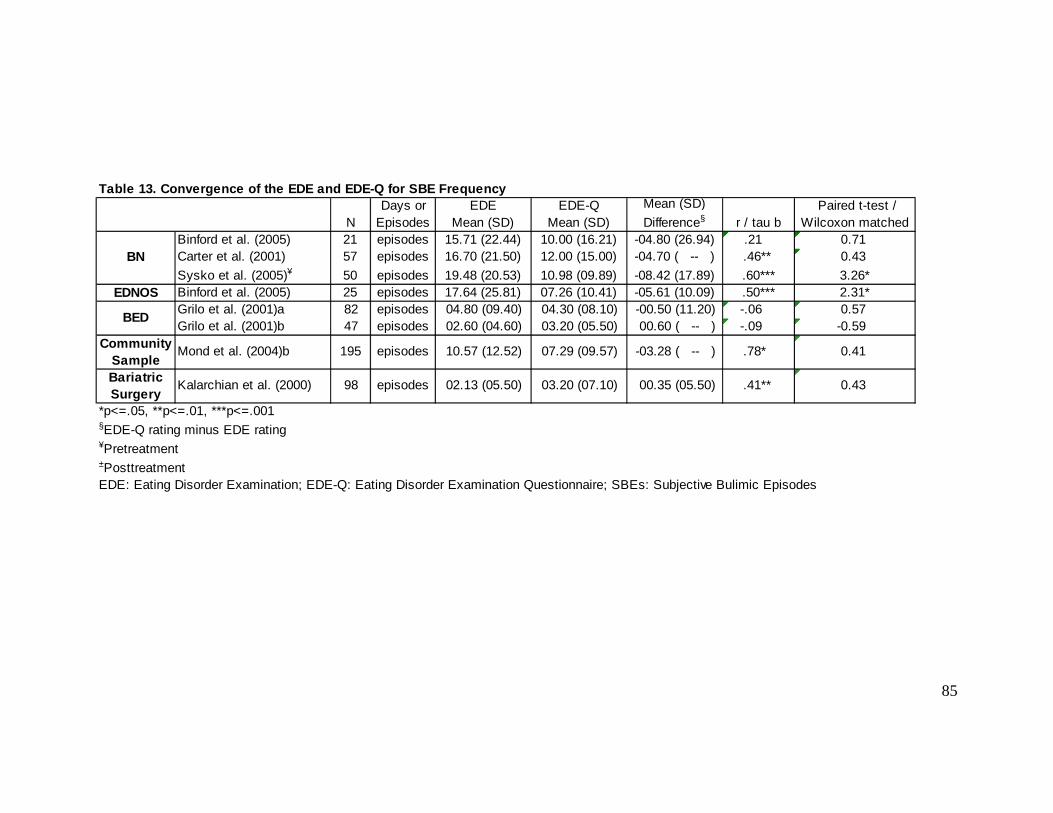
85
Table 13. Convergence of the EDE and EDE-Q for SBE Frequency
NBinford et al. (2005) 21 episodes 15.71 (22.44) 10.00 (16.21) -04.80 (26.94) .21 0.71 Carter et al. (2001) 57 episodes 16.70 (21.50) 12.00 (15.00) -04.70 ( -- ) .46** 0.43
Sysko et al. (2005)¥ 50 episodes 19.48 (20.53) 10.98 (09.89) -08.42 (17.89) .60*** 3.26*EDNOS Binford et al. (2005) 25 episodes 17.64 (25.81) 07.26 (10.41) -05.61 (10.09) .50*** 2.31*
Grilo et al. (2001)a 82 episodes 04.80 (09.40) 04.30 (08.10) -00.50 (11.20) -.06 0.57 Grilo et al. (2001)b 47 episodes 02.60 (04.60) 03.20 (05.50) 00.60 ( -- ) -.09 -0.59
§EDE-Q rating minus EDE rating¥Pretreatment±PosttreatmentEDE: Eating Disorder Examination; EDE-Q: Eating Disorder Examination Questionnaire; SBEs: Subjective Bulimic Episodes
Mond et al. (2004)b
Bariatric Surgery
00.35 (05.50)episodes98Kalarchian et al. (2000)
episodes
*p<=.05, **p<=.01, ***p<=.001
Paired t-test / Wilcoxon matched
Mean (SD)
Difference§EDE
Mean (SD)EDE-Q
Mean (SD) r / tau b
BED
Community Sample
Days or Episodes
.41**
BN
02.13 (05.50)
0.41 .78* -03.28 ( -- )07.29 (09.57)10.57 (12.52)
0.43 03.20 (07.10)
195

86
AN Wolk et al. (2005) 60 00.73 ( -- ) .88*** -1.00 -00.13 (06.30) .70*** 0.16Binford et al. (2005) 21 - .73a - - - -Carter et al. (2001) 57 -13.60 ( -- ) .72** 3.08** -01.10 ( -- ) .88** 1.65Sysko et al. (2005)¥ 50 00.52 (02.96) .88*** -1.24 00.20 (01.27) .99*** -1.12 Sysko et al. (2005)± 50 -00.10 (03.27) .95*** 0.22 09.00 (12.78) .99*** -4.98*
EDNOS Binford et al. (2005) 25 - .93± - - - -
aSignificance level not reported§EDE-Q rating minus EDE rating¥Pretreatment±PosttreatmentEDE: Eating Disorder Examination; EDE-Q: Eating Disorder Examination Questionnaire
*p<=.05, **p<=.01, ***p<=.001, ****p<=.0001
Community Sample
AN & BN Combined
Table 14. Convergence of the EDE and EDE-Q for Freq uency of Compensatory Behaviors
Mean (SD)
Difference§ r / tau b
Black & Wilson (1996) 48
Fairburn & Beglin (1994) -2.02* .88*** 00.10 (00.60)243
.91*** 0.73 -00.40 (03.00)36
Laxative MisuseMean (SD)
Difference§ r / tau b Paired t-test /
Wilcoxon matched
BN
Fairburn & Beglin (1994)
Self-Induced Vomiting
N Paired t-test /
Wilcoxon matched
Substance Abusers
0.01 .99**** 0.01 -00.06 (00.60) 1.00**** -00.47 (03.40)
-1.27 .60*** 00.10 (00.70)
-00.50 (03.50) .89*** 0.00

87
Table 15. Meta-Analysis of EDE and EDE-Q Subscales using Cohen's d
dLower
CIUpper
CI Q dLower
CIUpper
CI Q dLower
CIUpper
CI Q dLower
CIUpper
CI QBinford et al. (2005) -0.09 0.18 0.16 0.14Passi et al. (2003) 0.25 0.68 0.36 0.25Sysko, Walsh, Schebendach, et al. (2005)
0.60 0.29 0.61 0.62
Wolk et al. (2005) 0.27 0.50 0.32 0.45Meta-Analysis 0.22 -0.02 0.47 2.08 0.45 0.20 0.71 1.77 0.32 0 .07 0.58 0.83 0.36 0.11 0.61 1.39Binford et al. (2005) 0.35 0.87 0.44 0.26Carter et al. (2001) - - -0.21 -0.25Meta-Analysis 0.35 -0.26 0.96 0.00 0.87 0.23 1.50 0.00 -0.04 -0.35 0.28 3.24 -0.11 -0.43 0.20 1.98Binford et al. (2005) 0.05 0.11 0.23 0.23Meta-Analysis 0.05 -0.51 0.60 0.00 0.11 -0.44 0.67 0.00 0.23 -0.32 0.79 0.00 0.23 -0.33 0.79 0.00Grilo et al. (2001)a 0.66 0.51 1.06 0.73Grilo et al. (2001)b 0.46 1.76 1.72 0.66Wilfley et al. (1997) 0.37 1.35 1.00 0.67Meta-Analysis 0.52 0.32 0.73 1.47 0.98 0.76 1.20 23.99 1.19 0 .96 1.41 6.24 0.69 0.48 0.91 0.11Fairburn & Beglin (1994) 0.26 0.47 0.59 0.35Mond et al. (2004)b 0.19 0.53 0.65 0.44Meta-Analysis 0.23 0.09 0.36 0.22 0.50 0.36 0.63 0.16 0.62 0. 48 0.75 0.16 0.39 0.25 0.52 0.39Kalarchian et al. (2000) 0.33 0.75 0.74 0.65de Zwaan et al. (2004) 0.73 0.33 0.00 0.00Meta-Analysis 0.45 0.24 0.71 3.48 0.61 0.36 0.84 2.46 0.50 0. 26 0.73 8.27 0.44 0.20 0.68 6.44Black & Wilson (1996) 0.20 0.36 -0.06 0.21Meta-Analysis 0.20 -0.21 0.60 0.00 0.36 -0.05 0.76 0.00 -0.06 -0.46 0.34 0.00 0.21 -0.19 0.61 0.00
TOTAL Meta-Analysis 0.31 0.22 0.40 16.27 0.58 0.49 0.67 48.0 9* 0.56 .47 .65 77.42* 0.39 .31 .48 29.30±
± p < .01; * p < .001EDE: Eating Disorder Examination; EDE-Q: Eating Disorder Examination-Questionnaire
RESTRAINT EATING CONCERN SHAPE CONCERN WEIGHT CONCERN
Substance Abusers
AN
BED
Community Sample
Bariatric Surgery Patients
EDNOS
BN

88
Table 16. Meta-Analysis of EDE and EDE-Q Subscales using Correlations
Q Q Q QBinford et al. (2005) .71 .90 .89 .83Passi et al. (2003) .71 .67 .91 .82Wolk et al. (2005) .49 .51 .83 .61Meta-Analysis .60 .41 .79 1.23 .67 .48 .86 2.39 .87 .67 1.06 0. 13 .72 .53 .92 1.17Binford et al. (2005) .79 .75 .85 .87Carter et al. (2001) - - .43 .54Meta-Analysis .79 .33 1.25 0.00 .75 .29 1.21 0.00 .58 .35 .81 2 .38 .66 .43 .89 1.47Fairburn & Beglin (1994) .78 - - - .83 .85Meta-Analysis .78 .44 1.12 0.00 - - - .83 .49 1.17 0.00 .85 .51 1 .19 0.00Binford et al. (2005) .85 .94 .82 .88Meta-Analysis .85 .43 1.27 0.00 .94 .52 1.36 0.00 .82 .40 1.24 0.00 .88 .46 1.30 0.00Grilo et al. (2001)a .69 .33 .56 .66Grilo et al. (2001)b .59 .55 .42 .63Wilfley et al. (1997) .66 .59 .69 .63Meta-Analysis .66 .51 .81 0.28 .47 .32 .62 2.52 .57 .42 .72 1.6 9 .64 .49 .79 0.04Fairburn & Beglin (1994) .81 - .80 .79Mond et al. (2004)b .71 .68 .78 .77Meta-Analysis .77 .68 .86 1.07 .68 .54 .82 0.00 .79 .70 .89 0.0 4 .78 .69 .88 0.04Kalarchian et al. (2000) .60 .62 .77 .71de Zwaan et al. (2004) .54 .80 .80 .79Meta-Analysis .58 .41 .75 .10 .69 .52 .85 0.94 .78 .61 .95 0.02 .74 .57 .90 0.19Black & Wilson (1996) .75 - - - .84 .85Meta-Analysis .75 .46 1.05 0.00 - - - .84 .55 1.13 0.00 .85 .56 1.14 0.00
TOTAL Meta-Analysis .72 .65 .78 9.04 .65 .57 .73 13.91 .76 .70 .83 16.50 .75 .69 .81 7.73EDE: Eating Disorder Examination; EDE-Q: Eating Disorder Examination-Questionnaire
Upper CI
WEIGHT CONCERNRESTRAINT EATING CONCERN SHAPE CONCERN
r / tau b
Lower CI
Upper CI
Lower CI
Upper CI
Community Sample
Upper CI
Bariatric Surgery Patients
Substance Abusers
AN
AN & BN Combined
EDNOS
BED
Lower CI
BN
r / tau b
r / tau b
r / tau b
Lower CI

89
Table 17. Meta-Analysis of EDE and EDE-Q Behaviors using Cohen's d
dLower
CIUpper
CI Q dLower
CIUpper
CI QWolk et al. (2005) 0.16 -Meta-Analysis 0.16 -0.20 0.51 0.00 - - - -Binford et al. (2005) -0.58 -0.25Carter et al. (2001) -0.16 -0.26Sysko et al. (2005) -0.39 -0.53Meta-Analysis -0.31 -0.56 -0.07 1.58 -0.36 -0.61 -0.12 1.13Binford et al. (2005) 0.07 -0.57Meta-Analysis 0.07 -0.48 0.63 0.00 -0.57 -1.13 -0.01 0.00Goldfein et al. (2005) 0.24 -Grilo et al. (2001)a -0.22 -0.06Grilo et al. (2001)b -0.31 0.12Wilfley et al. (1997) -0.51 -Meta-Analysis -0.23 -0.42 -0.04 6.31 0.01 -0.24 0.25 0.48Fairburn & Beglin (1994) 0.26 -Mond et al. (2004)b -0.50 -0.30Meta-Analysis -0.07 -0.21 0.06 30.96 -0.30 -0.50 -0.10 0.00Kalarchian et al. (2000) -0.22 0.17Meta-Analysis -0.22 -0.50 0.06 0.00 0.17 -0.24 0.58 0.00Black & Wilson (1996) 0.16 -Meta-Analysis 0.16 -0.24 0.57 0.00 - - - -
TOTAL Meta-Analysis -0.12 -0.21 -0.03 48.09* -0.21 -0.33 -0 .09 11.78* p < .001
BN
Substance Abusers
BED
Community Sample
EDE: Eating Disorder Examination; EDE-Q: Eating Disorder Examination-Questionnaire; OBEs: Objective Bulimic Episodes; SBEs: Subjective Bulimic Episodes
SBEsOBEs
EDNOS
Bariatric Surgery
AN

90
Table 18. Meta-Analysis of EDE and EDE-Q Behaviors using Correlations
r / tau b
Lower CI
Upper CI Q
r / tau b
Lower CI
Upper CI Q
r / tau b
Lower CI
Upper CI Q
r / tau b
Lower CI
Upper CI Q
Wolk et al. (2005) .92 - .88 .70Meta-Analysis .92 .66 1.18 0.00 - - - - .88 .62 1.14 0.00 .70 .44 .96 0.00Binford et al. (2005) .48 .21 .73 -Carter et al. (2001) .56 .46 .72 .88Sysko et al. (2005) .63 .60 .88 .99Meta-Analysis .58 .40 .76 0.32 .48 .30 .66 1.90 .80 .61 .98 0.7 1 .96 .77 1.16 0.30Fairburn & Beglin (1994) .60 - .91 .89Meta-Analysis .60 .26 .94 0.00 - - - - .91 .57 1.25 0.00 .89 .55 1 .23 0.00Binford et al. (2005) .40 .50 .93 -Meta-Analysis .40 -.02 .82 0.00 .50 .08 .92 0.00 .93 .51 1.35 0 .00 - - - -Goldfein et al. (2005) .20 - - -Grilo et al. (2001)a .29 -.06 - -Grilo et al. (2001)b .28 -.09 - -Wilfley et al. (1997) .20 - - -Meta-Analysis .25 .12 .39 0.37 -.07 -.25 .11 0.03 - - - - - - - -Fairburn & Beglin (1994) .45 - .88 .60Mond et al. (2004)b .93 .78 - -Meta-Analysis .76 .67 .86 24.58 .78 .64 .92 0.00 .88 .75 1.00 0 .00 .60 .47 .73 0.00Kalarchian et al. (2000) .46 - - -de Zwaan et al. (2004) - .41 - -Meta-Analysis .46 .26 .66 0.00 .41 .11 .71 0.00 - - - - - - - -Black & Wilson (1996) .53 - .99 .99Meta-Analysis .53 .24 .82 0.00 - - - - .99 .70 1.28 0.00 .99 .70 1.28 0.00
TOTAL Meta-Analysis .64 .58 .70 58.40* .52 .43 .61 56.37* .89 .81 .98 2.38 .84 .75 .93 12.35^ ̂p < .05; * p < .001
EDE: Eating Disorder Examination; EDE-Q: Eating Disorder Examination-Questionnaire; OBEs: Objective Bulimic Episodes; SBEs: Subjective Bulimic Episodes
OBEs SBEs Self-Induced Vomiting Laxative Misuse
AN & BN Combined
Substance Abusers
BED
Community Sample
Bariatric Surgery Patients
AN
EDNOS
BN
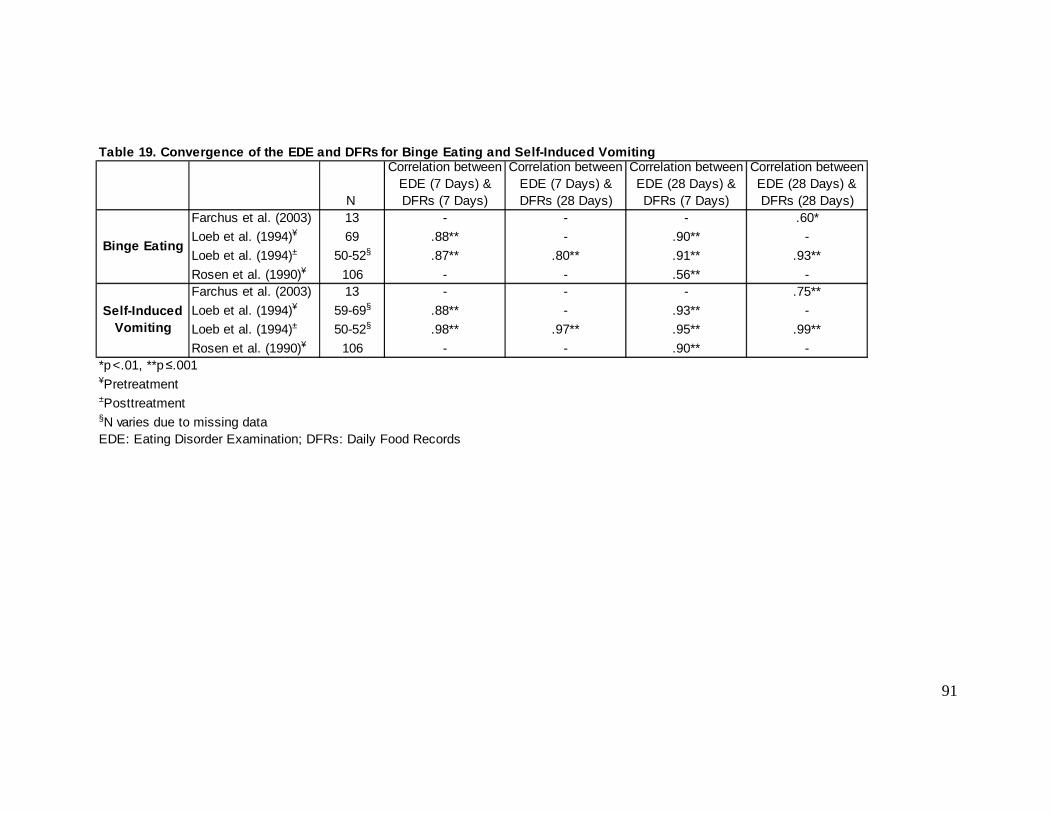
91
Table 19. Convergence of the EDE and DFRs for Binge Eating and Self-Induced Vomiting
Farchus et al. (2003) 13 - - - .60*
Loeb et al. (1994)¥ 69 .88** - .90** -
Loeb et al. (1994)± 50-52§ .87** .80** .91** .93**
Rosen et al. (1990)¥ 106 - - .56** -Farchus et al. (2003) 13 - - - .75**
Loeb et al. (1994)¥ 59-69§ .88** - .93** -
Loeb et al. (1994)± 50-52§ .98** .97** .95** .99**
Rosen et al. (1990)¥ 106 - - .90** -*p<.01, **p≤.001¥Pretreatment±Posttreatment§N varies due to missing dataEDE: Eating Disorder Examination; DFRs: Daily Food Records
Binge Eating
Self-Induced Vomiting
Correlation between EDE (28 Days) & DFRs (28 Days) N
Correlation between EDE (7 Days) & DFRs (7 Days)
Correlation between EDE (28 Days) & DFRs (7 Days)
Correlation between EDE (7 Days) & DFRs (28 Days)

92
Table 20. Comparison of EDE and DFR in the Full Sam pleMONTH 1 N Mean (EDE) SD (EDE) Mean (DFR) SD (DFR) r t p dOBE days 34 2.44 3.61 1.29 2.52 .54** 2.16 0.038 0.37OBE episodes 34 2.62 4.11 1.35 2.58 .49** 2.03 0.051 0.37SBE days 34 4.79 6.09 4.24 4.99 .25 0.48 0.636 0.10SBE episodes 34 5.94 8.26 5.41 6.50 .31 0.35 0.728 0.07Total days 34 7.24 7.58 5.53 6.34 .44** 1.34 0.191 0.24Total episodes 34 8.56 9.48 6.76 7.81 .47** 1.16 0.256 0.21
MONTH 2 N Mean (EDE) SD (EDE) Mean (DFR) SD (DFR) r t p dOBE days 33 2.79 4.11 1.00 2.32 .32 2.55 0.016 0.54OBE episodes 33 2.91 4.39 1.12 2.67 .26 2.28 0.029 0.49
MONTH 3 N Mean (EDE) SD (EDE) Mean (DFR) SD (DFR) r t p dOBE days 34 4.03 4.71 1.47 2.69 .23 3.08 0.004 0.67OBE episodes 34 4.09 4.72 1.82 3.89 .17 2.37 0.024 0.53
TOTAL MONTHS N Mean (EDE) SD (EDE) Mean (DFR) SD (DFR) r t p dOBE days 34 9.38 10.59 3.74 6.50 .41* 3.32 0.002 0.64OBE episodes 34 9.74 10.72 4.26 7.87 .32 2.88 0.007 0.58*p<.05, **p<.01EDE: Eating Disorder Examination; DFR: Daily Food Records; OBE: Objective Bulimic Episode; SBE: Subjective Bulimic Episode

93
Table 21. Significance Testing: OBEs Across MonthsDAYS N r Fisher's z z pMonth 1 34 .54** 0.60Month 2 33 .32 0.33Month 1 34 .54** 0.60Month 3 34 .23 0.23Month 1 34 .54** 0.60Total Months 34 .41* 0.44
EPISODES N r Fisher's z z pMonth 1 34 .49** 0.54Month 2 33 .26 0.27Month 1 34 .49** 0.54Month 3 34 .17 0.17Month 1 34 .49** 0.54Total Months 34 .32 0.33*p<.05, **p<.01OBE: Objective Bulimic Episode
0.145
0.287
0.421
0.151
0.292
0.507
1.43
0.81
1.06
1.46
0.66
1.05

94
Table 22. Comparison of EDE and DFR when Zero-Pairs are ExcludedMONTH 1 N Mean (EDE) SD (EDE) Mean (DFR) SD (DFR) r t p dOBE days 21 3.95 3.91 2.10 2.95 .41 2.24 0.037 0.53OBE episodes 21 4.24 4.54 2.19 3.01 .34 2.09 0.050 0.53SBE days 29 5.62 6.24 4.97 5.06 .15 0.48 0.638 0.11SBE episodes 29 6.97 8.54 6.34 6.60 .23 0.35 0.729 0.08Total days 29 8.48 7.52 6.48 6.40 .34 1.34 0.192 0.29Total episodes 29 10.03 9.52 7.93 7.90 .38* 1.16 0.257 0.24
MONTH 2 N Mean (EDE) SD (EDE) Mean (DFR) SD (DFR) r t p dOBE days 20 4.6 4.44 1.65 2.82 .16 2.71 0.014 0.79OBE episodes 20 4.8 4.79 1.85 3.25 .10 2.39 0.027 0.72
MONTH 3 N Mean (EDE) SD (EDE) Mean (DFR) SD (DFR) r t p dOBE days 29 4.72 4.77 1.72 2.84 .17 3.15 0.004 0.76OBE episodes 29 4.79 4.77 2.14 4.14 .11 2.40 0.023 0.59
TOTAL MONTHS N Mean (EDE) SD (EDE) Mean (DFR) SD (DFR) r t p dOBE days 31 10.29 10.66 4.10 6.71 .38* 3.37 0.002 0.69OBE episodes 31 10.31 10.78 4.68 8.13 .29 2.91 0.007 0.59*p<.05, **p<.01EDE: Eating Disorder Examination; DFR: Daily Food Records; OBE: Objective Bulimic Episode; SBE: Subjective Bulimic Episode

95
Table 23. Significance Testing: Full Sample versus Exclusion of Zero-PairsMONTH 1 Sample N r Fisher's z z p
Full Sample 34 .54** 0.60Zero-Pairs Removed 21 .41 0.44Full Sample 34 .49** 0.54Zero-Pairs Removed 21 .35 0.37Full Sample 34 .25 0.26Zero-Pairs Removed 29 .15 0.15Full Sample 34 .31 0.32Zero-Pairs Removed 29 .23 0.23Full Sample 34 .44** 0.47Zero-Pairs Removed 29 .34 0.35Full Sample 34 .47** 0.51Zero-Pairs Removed 29 .38* 0.40
MONTH 2 Sample N r Fisher's z z pFull Sample 33 .32 0.33Zero-Pairs Removed 20 .16 0.16Full Sample 33 .26 0.27Zero-Pairs Removed 20 .10 0.10
MONTH 3 Sample N r Fisher's z z pFull Sample 34 .23 0.23Zero-Pairs Removed 29 .17 0.17Full Sample 34 .17 0.17Zero-Pairs Removed 29 .11 0.11
TOTAL MONTHS Sample N r Fisher's z z pFull Sample 34 .41* 0.44Zero-Pairs Removed 31 .38* 0.39Full Sample 34 .32 0.33Zero-Pairs Removed 31 .29 0.30
*p<.05, **p<.01OBE: Objective Bulimic Episode; SBE: Subjective Bulimic Episode
OBE days
OBE episodes
SBE days
SBE episodes
OBE episodes
OBE days
OBE days
OBE episodes
OBE days
OBE episodes
0.18
0.13
Total days
Total episodes
0.56
0.55
0.44
0.41
0.814
0.818
0.57
0.58
0.39
0.32
0.24
0.23
0.892
0.899
0.570
0.565
0.679
0.657
0.745
0.695
0.585
0.575

96
Table 24. Significance Testing: Days versus Episode s
MONTH 1 N r Fisher's z z p MONTH 1 N r Fisher's z z pOBE days 34 .54** 0.60 OBE days 21 .41 0.44OBE episodes 34 .49** 0.54 OBE episodes 21 .34 0.37SBE days 34 .25 0.26 SBE days 29 .15 0.15SBE episodes 34 .31 0.32 SBE episodes 29 .23 0.23Total days 34 .44** 0.47 Total days 29 .34 0.35Total episodes 34 .47** 0.51 Total episodes 29 .38* 0.40
MONTH 2 N r Fisher's z z p MONTH 2 N r Fisher's z z pOBE days 33 .32 0.33 OBE days 20 .16 0.16OBE episodes 33 .26 0.27 OBE episodes 20 .10 0.10
MONTH 3 N r Fisher's z z p MONTH 3 N r Fisher's z z pOBE days 34 .23 0.23 OBE days 29 .17 0.17OBE episodes 34 .17 0.17 OBE episodes 29 .11 0.11
TOTAL MONTHS N r Fisher's z z p TOTAL MONTHS N r Fisher's z z pOBE days 34 .41* 0.44 OBE days 31 .38* 0.39OBE episodes 34 .32 0.33 OBE episodes 31 .29 0.30*p<.05, **p<.01OBE: Objective Bulimic Episode; SBE: Subjective Bulimic Episode
FULL SAMPLE
0.807
0.765
0.704
0.825
0.859
0.841
0.806
0.682
0.789
0.207
0.882
0.800
0.27
-0.26
-0.15
0.25
ZERO-PAIRS EXCLUDED
0.22
0.34
0.21
-0.30
-0.17
0.18
0.25
0.41
FULL SAMPLE ZERO-PAIRS EXCLUDED
FULL SAMPLE ZERO-PAIRS EXCLUDED
FULL SAMPLE ZERO-PAIRS EXCLUDED

97
Table 25. Significance Testing: OBEs versus SBEs ve rsus Total Binges Reported in Month 1
Days N r Fisher's z z p Days N r Fisher's z z pOBE days 34 .54** 0.60 OBE days 21 .41 0.44SBE days 34 .25 0.26 SBE days 29 .15 0.15OBE days 34 .54** 0.60 OBE days 21 .41 0.44Total days 34 .44** 0.47 Total days 29 .34 0.35SBE days 34 .25 0.26 SBE days 29 .15 0.15Total days 34 .44** 0.47 Total days 29 .34 0.35
Episodes N r Fisher's z z p Episodes N r Fisher's z z pOBE episodes 34 .49** 0.54 OBE episodes 21 .35 0.37SBE episodes 34 .31 0.32 SBE episodes 29 .23 0.23OBE episodes 34 .49** 0.54 OBE episodes 21 .35 0.37Total episodes 34 .47** 0.51 Total episodes 29 .38* 0.40SBE episodes 34 .31 0.32 SBE episodes 29 .23 0.23Total episodes 34 .47** 0.51 Total episodes 29 .38* 0.40*p<.05, **p<.01OBE: Objective Bulimic Episode; SBE: Subjective Bulimic Episode
0.396
ZERO-PAIRS EXCLUDEDFULL SAMPLE
0.3540.1701.37
-0.85
0.93
0.85
0.10
0.456 0.550
0.910
-0.75
0.919
0.669
0.464
0.790
-0.60
-0.11
0.43
FULL SAMPLE ZERO-PAIRS EXCLUDED
0.52
-0.73
0.270.603
0.393

98
Table 26. Correlation Matrix for the EDE and Relate d Constructs in Month 1
EDE DFR BSQ IDS-SR RSE EDE DFR BSQ IDS-SR RSEEDE 1.00 .54** .17 .28 .19 EDE 1.00 .49** .19 .27 .22DFR .54* 1.00 -.05 .04 .09 DFR .49* 1.00 -.08 .01 .08
EDE DFR BSQ IDS-SR RSE EDE DFR BSQ IDS-SR RSEEDE 1.00 .25 .05 .31 .29 EDE 1.00 .31 .07 .32 .28DFR .25 1.00 .24 .09 .05 DFR .31 1.00 .33 .18 .15
EDE DFR BSQ IDS-SR RSE EDE DFR BSQ IDS-SR RSEEDE 1.00 .44** .12 .38* .33 EDE 1.00 .47** .14 .40* .34DFR .44** 1.00 .17 .09 .07 DFR .47** 1.00 .25 .15 .15*p<.05, **p<.01EDE: Eating Disorder Examination; DFR: Daily Food Record; OBE: Objective Bulimic Episode; SBE: Subjective Bulimic Episode; BSQ: Body Shape Questionnaire; IDS-SR: Inventory for Depressive Symptomatology-Self-Report ; RSE: Rosenberg Self-Esteem Scale
TOTAL DAYS TOTAL EPISODES
OBE DAYS OBE EPISODES
SBE DAYS SBE EPISODES

99
Table 27. Discriminant Validity of the EDE
Month 1 N r Fisher's z z p Month 1 N r Fisher's z z pEDE & DFR 34 .54 0.60 EDE & DFR 34 .49 0.54EDE & BSQ 34 .17 0.17 EDE & BSQ 34 .19 0.19EDE & DFR 34 .54 0.60 EDE & DFR 34 .49 0.54EDE & IDS-SR 34 .28 0.29 EDE & IDS-SR 34 .27 0.28EDE & DFR 34 .54 0.60 EDE & DFR 34 .49 0.54EDE & RSE 34 .19 0.19 EDE & RSE 34 .22 0.22
Month 1 N r Fisher's z z p Month 1 N r Fisher's z z pEDE & DFR 34 .25 0.26 EDE & DFR 34 .31 0.32EDE & BSQ 34 .05 0.0500 EDE & BSQ 34 .07 0.07EDE & DFR 34 .25 0.26 EDE & DFR 34 .31 0.32EDE & IDS-SR 34 .31 0.32 EDE & IDS-SR 34 .32 0.33EDE & DFR 34 .25 0.26 EDE & DFR 34 .31 0.32EDE & RSE 34 .29 0.30 EDE & RSE 34 .28 0.29
Month 1 N r Fisher's z z p Month 1 N r Fisher's z z pEDE & DFR 34 .44 0.47 EDE & DFR 34 .47 0.51EDE & BSQ 34 .12 0.12 EDE & BSQ 34 .14 0.14EDE & DFR 34 .44 0.47 EDE & DFR 34 .47 0.51EDE & IDS-SR 34 .38 0.40 EDE & IDS-SR 34 .40 0.42EDE & DFR 34 .44 0.47 EDE & DFR 34 .47 0.51EDE & RSE 34 .33 0.34 EDE & RSE 34 .34 0.40
0.948
1.23
0.746
0.547
SBE DAYS SBE EPISODES
Total DAYS Total EPISODES
0.173
0.784
0.614
0.99
0.901
0.158
0.091
0.210
0.13
0.184
0.322
0.225
0.333
OBE EPISODES
1.70 1.35
1.25 1.02
0.51
0.109
0.407
0.821
0.868
1.62
0.81
EDE: Eating Disorder Examination; DFR: Daily Food Record; OBE: Objective Bulimic Episode; SBE: Subjective Bulimic Episode; BSQ: Body Shape Questionnaire; IDS-SR: Inventory for Depressive Symptomatology-Self-Report ; RSE: Rosenberg Self-Esteem Scale
OBE DAYS
0.43
1.38 1.45
0.28 0.34
-0.26 -0.04
-0.17
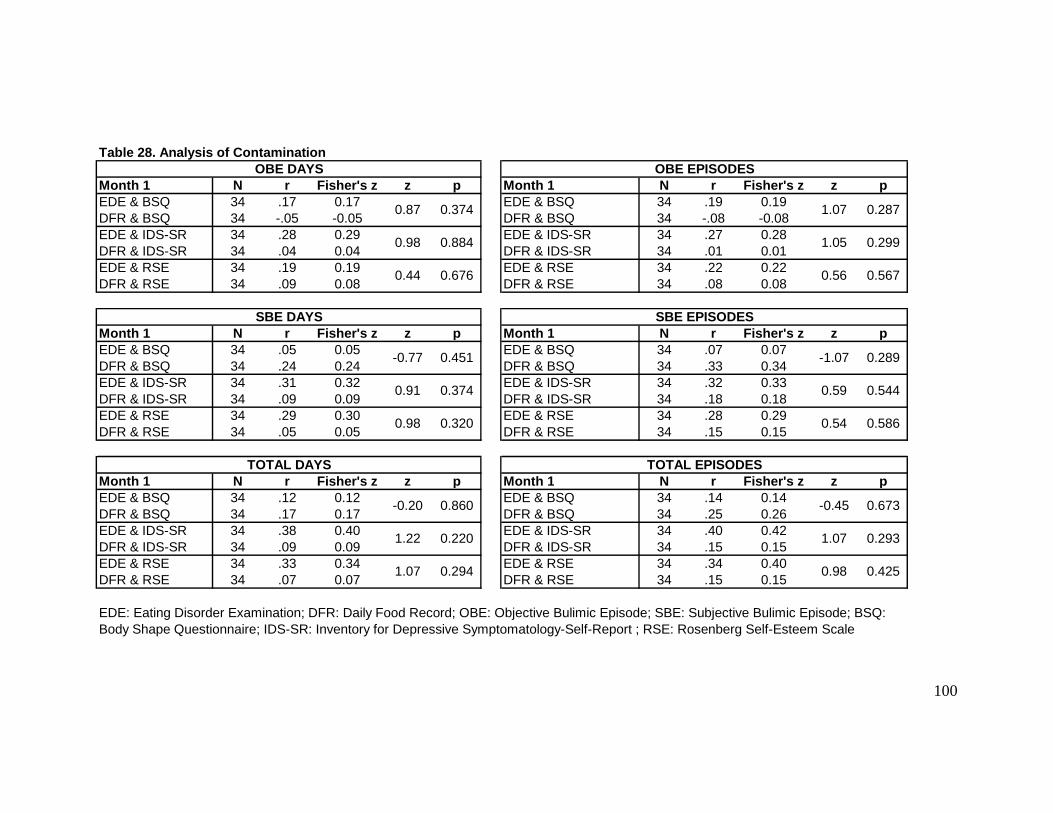
100
Table 28. Analysis of Contamination
Month 1 N r Fisher's z z p Month 1 N r Fisher's z z pEDE & BSQ 34 .17 0.17 EDE & BSQ 34 .19 0.19DFR & BSQ 34 -.05 -0.05 DFR & BSQ 34 -.08 -0.08EDE & IDS-SR 34 .28 0.29 EDE & IDS-SR 34 .27 0.28DFR & IDS-SR 34 .04 0.04 DFR & IDS-SR 34 .01 0.01EDE & RSE 34 .19 0.19 EDE & RSE 34 .22 0.22DFR & RSE 34 .09 0.08 DFR & RSE 34 .08 0.08
Month 1 N r Fisher's z z p Month 1 N r Fisher's z z pEDE & BSQ 34 .05 0.05 EDE & BSQ 34 .07 0.07DFR & BSQ 34 .24 0.24 DFR & BSQ 34 .33 0.34EDE & IDS-SR 34 .31 0.32 EDE & IDS-SR 34 .32 0.33DFR & IDS-SR 34 .09 0.09 DFR & IDS-SR 34 .18 0.18EDE & RSE 34 .29 0.30 EDE & RSE 34 .28 0.29DFR & RSE 34 .05 0.05 DFR & RSE 34 .15 0.15
Month 1 N r Fisher's z z p Month 1 N r Fisher's z z pEDE & BSQ 34 .12 0.12 EDE & BSQ 34 .14 0.14DFR & BSQ 34 .17 0.17 DFR & BSQ 34 .25 0.26EDE & IDS-SR 34 .38 0.40 EDE & IDS-SR 34 .40 0.42DFR & IDS-SR 34 .09 0.09 DFR & IDS-SR 34 .15 0.15EDE & RSE 34 .33 0.34 EDE & RSE 34 .34 0.40DFR & RSE 34 .07 0.07 DFR & RSE 34 .15 0.15
OBE DAYS OBE EPISODES
0.374
0.884
0.87
0.98
1.07
0.299
0.287
1.05
0.425
0.289
0.586
0.544
TOTAL DAYS TOTAL EPISODES
0.676
0.451-0.77
SBE DAYS
0.44
SBE EPISODES
0.5670.56
1.07 0.98
-0.20 -0.45
1.22 1.07
0.860
0.220
0.294
EDE: Eating Disorder Examination; DFR: Daily Food Record; OBE: Objective Bulimic Episode; SBE: Subjective Bulimic Episode; BSQ: Body Shape Questionnaire; IDS-SR: Inventory for Depressive Symptomatology-Self-Report ; RSE: Rosenberg Self-Esteem Scale
-1.07
0.91 0.59
0.98 0.54
0.374
0.320
0.673
0.293

101
EDE DFR
OBE
SBE
TOTAL
Days
Episodes
Days
Episodes
Days
Episodes
Days
Episodes
Days
Episodes
Days
Episodes
EDE: Eating Disorder Examination; DFR: Daily Food Records; OBE: Objective Bulimic Episodes; SBE: Subjective Bulimic Episodes
Figure 1. Comparison of EDE and DFR
EDE DFR
OBE
SBE
TOTAL
Days
Episodes
Days
Episodes
Days
Episodes
Days
Episodes
Days
Episodes
Days
Episodes
EDE: Eating Disorder Examination; DFR: Daily Food Records; OBE: Objective Bulimic Episodes; SBE: Subjective Bulimic Episodes
Figure 2. Significance Testing: Days versus Episodes

102
EDE DFR
OBE
SBE
TOTAL
Days
Episodes
Days
Episodes
Days
Episodes
Days
Episodes
Days
Episodes
Days
Episodes
EDE: Eating Disorder Examination; DFR: Daily Food Records; OBE: Objective Bulimic Episodes; SBE: Subjective Bulimic Episodes
Figure 3. Significance Testing: OBE Days versus SBE Days versus Total Days
EDE DFR
OBE
SBE
TOTAL
Days
Episodes
Days
Episodes
Days
Episodes
Days
Episodes
Days
Episodes
Days
Episodes
EDE: Eating Disorder Examination; DFR: Daily Food Records; OBE: Objective Bulimic Episodes; SBE: Subjective Bulimic Episodes
Figure 4. Significance Testing: OBE Episodes versus SBE Episodes versus Total Episodes
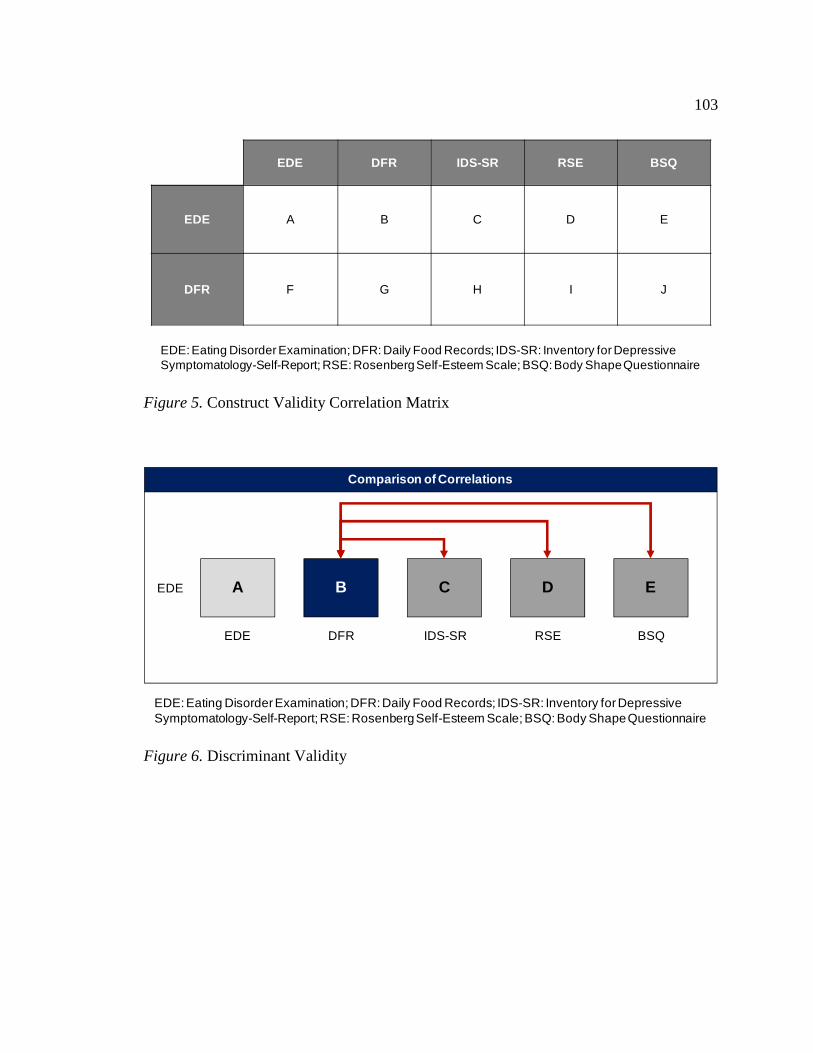
103
EDE DFR IDS-SR RSE BSQ
EDE A B C D E
DFR F G H I J
EDE: Eating Disorder Examination; DFR: Daily Food Records; IDS-SR: Inventory for Depressive Symptomatology-Self-Report; RSE: Rosenberg Self-Esteem Scale; BSQ: Body Shape Questionnaire
Figure 5. Construct Validity Correlation Matrix
A B C D EEDE
EDE DFR IDS-SR RSE BSQ
Comparison of Correlations
EDE: Eating Disorder Examination; DFR: Daily Food Records; IDS-SR: Inventory for Depressive Symptomatology-Self-Report; RSE: Rosenberg Self-Esteem Scale; BSQ: Body Shape Questionnaire
Figure 6. Discriminant Validity

104
EDE C
IDS-SR
HDFR
D
RSE
I
E
BSQ
J
EDE: Eating Disorder Examination; DFR: Daily Food Records; IDS-SR: Inventory for Depressive Symptomatology-Self-Report; RSE: Rosenberg Self-Esteem Scale; BSQ: Body Shape Questionnaire
Figure 7. Analysis of Contamination

105
OBE days OBE episodes SBE days SBE episodes Total daysTotal
episodes
EDE > DFR 38.2 35.3 43.1 44.1 47.1 50
EDE = DFR 41.2 44.1 17.6 20.6 23.5 20.6
EDE < DFR 20.6 20.6 35.3 35.3 29.4 29.4
0%
10%
20%
30%
40%
50%
60%
70%
80%
90%
100%
EDE: Eating Disorder Examination; DFR: Daily Food Records; OBE: Objective Bulimic Episodes; SBE: Subjective Bulimic Episodes Figure 8. Individual Differences: OBEs, SBEs, and Total Binges in Month 1
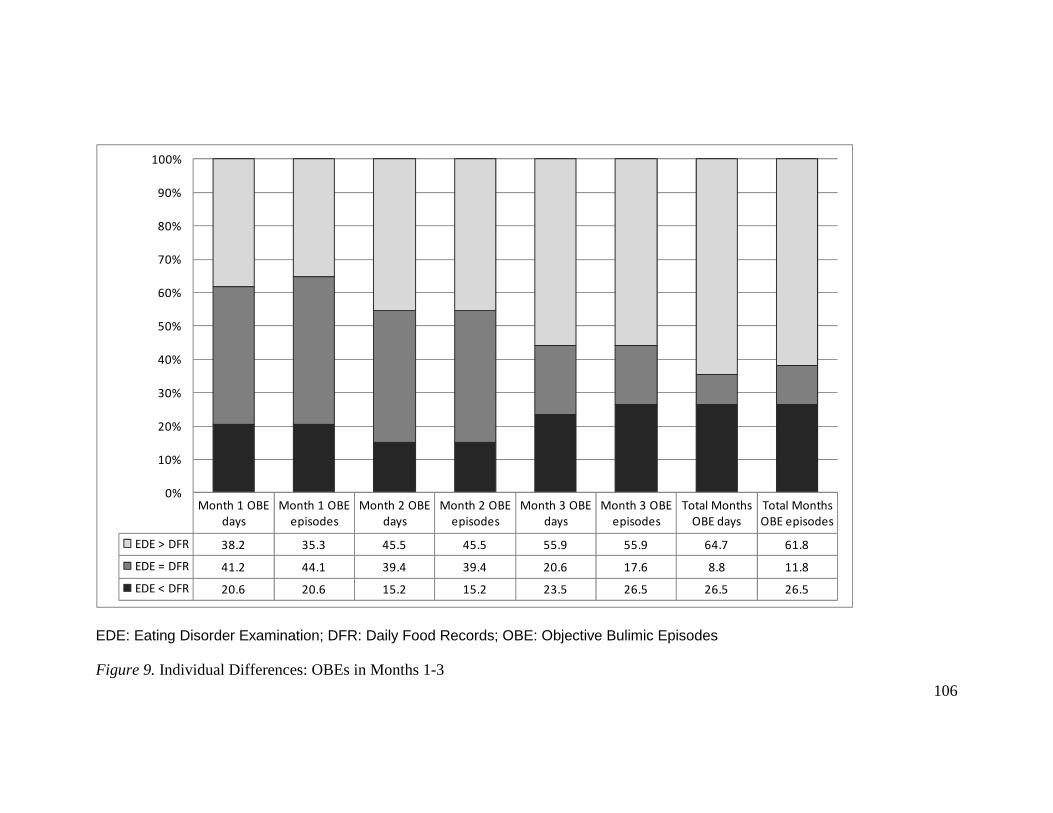
106
Month 1 OBE
days
Month 1 OBE
episodes
Month 2 OBE
days
Month 2 OBE
episodes
Month 3 OBE
days
Month 3 OBE
episodes
Total Months
OBE days
Total Months
OBE episodes
EDE > DFR 38.2 35.3 45.5 45.5 55.9 55.9 64.7 61.8
EDE = DFR 41.2 44.1 39.4 39.4 20.6 17.6 8.8 11.8
EDE < DFR 20.6 20.6 15.2 15.2 23.5 26.5 26.5 26.5
0%
10%
20%
30%
40%
50%
60%
70%
80%
90%
100%
EDE: Eating Disorder Examination; DFR: Daily Food Records; OBE: Objective Bulimic Episodes Figure 9. Individual Differences: OBEs in Months 1-3

107
DFR
OBEs ≥ Twice per
Week
OBEs < Twice per
Week
OBEs < Twice per
Week
OBEs ≥ Twice per
WeekEDE
1 4
0 29
DFR
OBEs ≥ Once per
Week
OBEs < Once per
Week
OBEs < Once per
Week
OBEs ≥ Once per
WeekEDE
3 7
2 22
Sensitivity = 100.0%; Specificity = 87.9%PPV = 20.0%; NPV = 100.0%
Sensitivity = 60.0%; Specificity = 76.9%PPV = 30.0%; NPV = 91.7%
EDE: Eating Disorder Examination; DFR: Daily Food Records; OBE: Objective Bulimic Episodes; PPV: Positive Predictive Value; NPV: Negative Predictive Value Figure 10. Analysis of Sensitivity, Specificity, PPV, and NPV for Month 1: OBEs Only
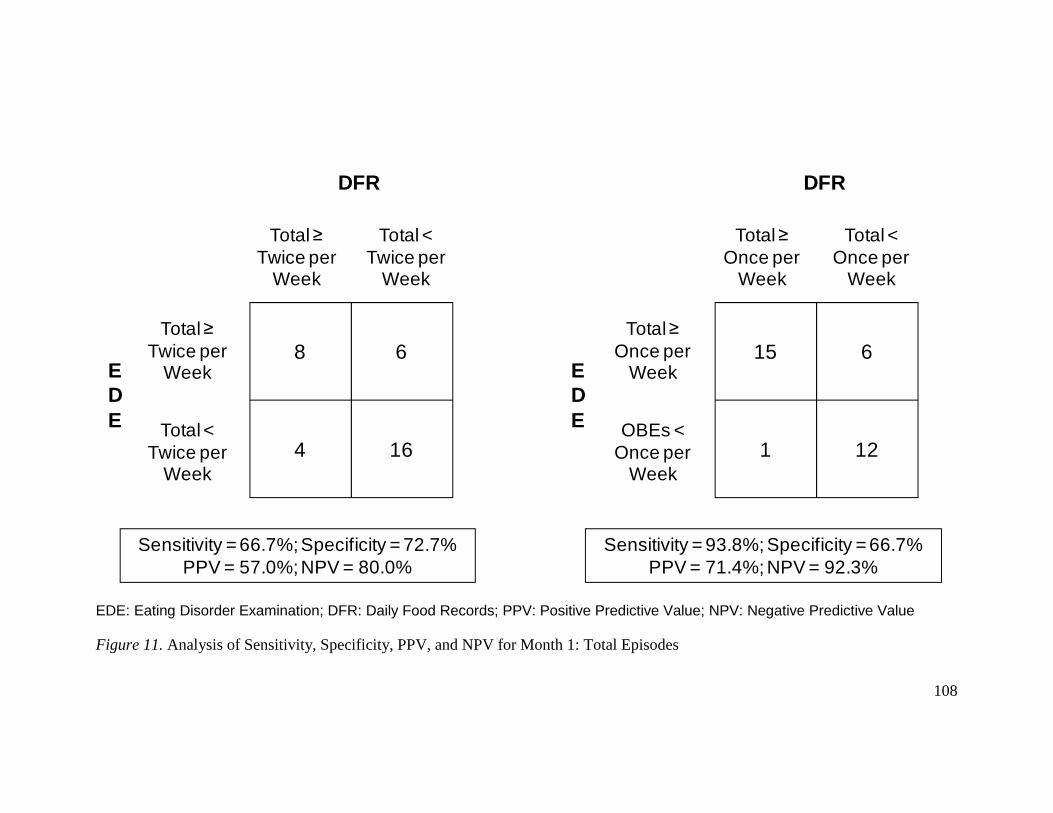
108
DFR
Total ≥ Twice per
Week
Total < Twice per
Week
Total < Twice per
Week
Total ≥ Twice per
WeekEDE
8 6
4 16
DFR
Total ≥ Once per
Week
OBEs < Once per
Week
Total < Once per
Week
Total ≥ Once per
WeekEDE
15 6
1 12
Sensitivity = 66.7%; Specificity = 72.7%PPV = 57.0%; NPV = 80.0%
Sensitivity = 93.8%; Specificity = 66.7%PPV = 71.4%; NPV = 92.3%
EDE: Eating Disorder Examination; DFR: Daily Food Records; PPV: Positive Predictive Value; NPV: Negative Predictive Value Figure 11. Analysis of Sensitivity, Specificity, PPV, and NPV for Month 1: Total Episodes

109
DFR
OBEs ≥ Twice per
Week
OBEs < Twice per
Week
OBEs < Twice per
Week
OBEs ≥ Twice per
WeekEDE
1 2
1 30
DFR
OBEs ≥ Once per
Week
OBEs < Once per
Week
OBEs < Once per
Week
OBEs ≥ Once per
WeekEDE
1 13
2 18
Sensitivity = 50.0%; Specificity = 93.8%PPV = 66.7%; NPV = 96.7%
Sensitivity = 33.3%; Specificity = 58.1%PPV = 7.1%; NPV = 90.0%
EDE: Eating Disorder Examination; DFR: Daily Food Records; OBE: Objective Bulimic Episodes; PPV: Positive Predictive Value; NPV: Negative Predictive Value Figure 12. Analysis of Sensitivity, Specificity, PPV, and NPV for Months 1-3: OBEs Only

110
References
American Academy of Pediatrics. (2003). Identifying and Treating Eating Disorders,
Policy Statement, 11(1), 204-2111.
American Psychiatric Association. (1994). Diagnostic and Statistical Manual of Mental
Disorders, Fourth edition, Text Revision (DSM-IV-TR). Washington D.C.: APA.
American Psychiatric Association. (2010). DSM-5 Proposed Diagnostic Criteria for
Binge Eating Disorder. Retrieved from http://www.dsm5.org/ProposedRevisions
/Pages/proposedrevision.aspx?rid=372
Arbisi, P. A., & Ben-Porath, Y. S. (1995). An MMPI-2 infrequent response scale for use
with psychopathological populations: The Infrequency-Psychopathology Scale,
F(p). Psychological Assessment, 7, 424-431.
Bardone, A. M., Krahn, D. D., Goodman, B. M., & Searles, J. S. (2000). Using
interactive voice response technology and timeline follow-back methodology in
studying binge eating and drinking behavior: different answers to different forms
of the same question? Addictive Behaviors, 25, 1-11.
Beglin, S. J. & Fairburn, C. G. (1992). What is meant by the term “binge”? American
Journal of Psychiatry, 149, 123-124.
Beumont, P. J. V., Kopec-Schrader, E. M., Talbot, P., & Touyz, S. W. (1993). Measuring
the specific psychopathology of eating disorder patients. Australian and New
Zealand Journal of Psychiatry, 27, 506-511.
Binford, R. B., le Grange, D., Jellar, C. C. (2005). Eating Disorders Examination versus
Eating Disorders Examination-Questionnaire in adolescents with full and partial

111
syndrome bulimia nervosa and anorexia nervosa. International Journal of Eating
Disorders, 37, 44-49.
Black, C. M. D. & Wilson, G. T. (1996). Assessment of eating disorders: Interview
versus questionnaire. International Journal of Eating Disorders, 20, 43-50.
Butcher, J. N., Dahlstrom, W. G., Graham, J. R., Tellegen, A., & Kaemmer, B. (1989).
MMPI-2: Manual for administration and scoring. Minneapolis, MN: University of
Minnesota Press.
Byrne, S. M., Allen, K. L., Lampard, A. M., Dove, E. R., & Fursland, A. (in press). The
factor structure of the eating disorder examination in clinical and community
samples. International Journal of Eating Disorders.
Campbell, D. T., & Fiske, D. W. (1959). Convergent and discriminant validation by the
multitrait-multimethod matrix. Psychological Bulletin, 56, 81–105.
Carter, J. C., Aimé, A. A., & Mills, J. S. (2001). Assessment of bulimia nervosa: A
comparison of interview and self-report questionnaire methods. International
Journal of Eating Disorders, 30, 187-192.
Celio, A. A., Wilfley, D. E., Crow, S. J., Mitchell, J., & Walsh, B. T. (2004). A
comparison of the Binge Eating Scale, Questionnaire for Eating and Weight
Patterns-Revised, and Eating Disorder Examination Questionnaire with
Instructions, with the Eating Disorder Examination in the assessment of binge
eating disorder and its symptoms. International Journal of Eating Disorders, 36,
434-444.

112
Cooper, Z., Cooper, P. J., & Fairburn, C. G. (1989). The validity of the Eating Disorder
Examination and its subscales. British Journal of Psychiatry, 154, 807-812.
Cooper, Z. & Fairburn, C. (1987). The Eating Disorder Examination: A semi-structured
interview for the assessment of the specific psychopathology of eating disorders.
International Journal of Eating Disorders, 6, 1-8.
Cooper, P. J., Taylor, M. J., Cooper, Z., Fairburn, C. G. (1987). The development and
validation of the Body Shape Questionnaire. International Journal of Eating
Disorders, 6, 485-494.
Cronbach, L. J. & Meehl, P. E. (1955). Construct validity in psychological tests.
Psychological Bulletin, 52, 281-302.
Crow, S. (2005). Medical complications of eating disorders. In S. Wonderlich, J.
Mitchell, M. de Zwaan, & H. Steiger (eds.), Eating Disorders Review: Part 1
(127-136). Oxford: Radcliffe.
Develiss, R. F. (1991). Scale development: Theory and applications. Newbury Park: Sage
Publications.
de Zwaan, M., Mitchell, J. E., Swan-Kremeier, L., McGregor, T., Howell, M. L., Roerig,
J. L., Crosby, R. D. (2004). A comparison of different methods of assessing the
features of eating disorders in post-gastric bypass patients: A pilot study.
European Eating Disorders Review, 12, 380-386.
Elder, K. A., Grilo, C. M., Masheb, R. M., Rothschild, B. S., Burke-Martindale, C. H., &
Brody, M. L. (2006). Comparison of two self-report instruments for assessing

113
binge eating in bariatric surgery candidates. Behaviour Research and Therapy, 44,
545-560.
Engelsen, B. K. & Laberg, J. C. (2000). A comparison of three questionnaires (EAT-12,
EDI, and EDE-Q) for assessment of eating problems in healthy female
adolescents. Nordic Journal of Psychiatry, 55, 129-135.
Fairburn, C. G. & Beglin, S. J. (1994). Assessment of eating disorders: Interview or self-
report questionnaire? International Journal of Eating Disorders, 16, 363-370.
Fairburn, C. G. & Cooper, Z. (1993). The Eating Disorder Examination. In C. G.
Fairburn & G. T. Wilson (eds.), Binge Eating: nature, assessment, and treatment
(12e.), (317-360). New York: Guilford.
Farchaus Stein Stein, K. & Corte, C. M. (2003). Ecological momentary assessment of
eating-disordered behaviors. International Journal of Eating Disorders, 34, 349-
360.
First, M. B., Spitzer, R. L., Gibbon, M. & Williams, J. B. (1995). Structured Clinical
Interview for the DSM-IV Axis I Disorders – Patient Edition (SCID-I/P, Version
2). New York State Psychiatric Institute; Biometrics Research Department: New
York.
Garner, D. M. & Garfinkel, P. E. (1979). Body image in anorexia nervosa: Measurement,
theory, and clinical implications. Psychological Medicine, 9, 273-279.
Garner, D. M., Olmstead, M. P., Polivy, J. (1983). Development and validation of a
multidimensional Eating Disorder Inventory for anorexia nervosa and bulimia.
International Journal of Eating Disorders, 2, 15-34.

114
Garner, D. M., Olmstead, M. P., Bohr, Y., & Garfinkel, P. E. (1982). The Eating
Attitudes Test: Psychometric features and clinical correlates. Psychological
Medicine, 12, 871-878.
Goldfein, J. A., Devlin, M. J., & Kamenetz, C. (2005). Eating Disorder Examination-
Questionnaire with and without instruction to assess binge eating in patients with
binge eating disorder. International Journal of Eating Disorders, 37, 107-111.
Greeno, C. G., Marcus, M. D., & Wing, R. R. (1995). Diagnosis of binge eating disorder:
Discrepancies between a questionnaire and clinical interview. International
Journal of Eating Disorders, 17, 153-160.
Greeno, C. G., Wing, R. R., & Shiffman, S. (2000). Binge antecedents in obese women
with and without binge eating disorder. Journal of Consulting and Clinical
Psychology, 68, 95-102.
Grilo, C. M. (2005). Structured instruments. In J. E. Mitchell & C. B. Peterson (eds.),
Assessment of Eating Disorders, (79-97). New York: Guilford.
Grilo, C. M., Crosby, R. D., Peterson, C. B., Masheb, R. M., White, M. A., Crow, S. J., et
al. (in press). Factor structure of the Eating Disorder Examination interview in
patients with binge-eating disorder. Obesity.
Grilo, C. M., Masheb, R. M., Wilson, G. T. (2001)a. A comparison of different methods
for assessing the features of eating disorders in patients with binge eating
disorder. Journal of Consulting and Clinical Psychology, 69, 317-322.

115
Grilo, C. M., Masheb, R. M., Wilson, G. T. (2001)b. Different methods for assessing the
features of eating disorders in patients with binge eating disorder: A replication.
Obesity Research, 9, 418-422.
Grilo, C. M., Masheb, R. M., Lozano-Blanco, C., & Barry, D. T. (2003). Reliability of
the Eating Disorder Examination in patients with binge eating disorder.
International Journal of Eating Disorders, 25, 80-85.
Hoek, H. W. (2006). Incidence, prevalence, and mortality of anorexia nervosa and other
eating disorders. Current Opinion in Psychiatry, 19, 389-394.
Hoek, H. W. & van Hoeken, D. (2003). Review of the prevalence and incidence of eating
disorders. International Journal of Eating Disorders, 34, 383-396.
Howell, D. C. (2002). Statistical Methods for Psychology, Fifth Edition. Pacific Grove,
CA: Duxbury.
Hrabosky, J. I., White, M. A., Masheb, R. M., Rothschild, B. S., Burke-Martindale, C. H.,
Grilo, C. M. (2008). Psychometric evaluation of the Eating Disorder
Examination-Questionnaire for bariatric surgery candidates. Obesity, 16, 763-769.
Kalarchian, M. A., Wilson, G. T., Brolin, R. E., & Bradley, L. (2000). Assessment of
eating disorders in bariatric surgery candidates: Self-report questionnaire versus
interview. International Journal of Eating Disorders, 28, 465-469.
Katzman, M. A., Wolchik, S. A., & Braver, S. L. (1984). The prevalence of frequent
binge eating and bulimia in a nonclinical college sample. International Journal of
Eating Disorders, 3, 53-62.
116
Keel, P. K., Crow, S., Davis, T. L., & Mitchell, J. E. (2002). Assessment of eating
disorders: Comparison of interview and questionnaire data from a long-term
follow-up study of bulimia nervosa. Journal of Psychosomatic Research, 53,
1043-1047.
Latner, J. D., Hildebrandt, T., Rosewall, J. K., Chisholm, A. M., & Hayashi, K. (2007).
Loss of control over eating reflects eating disturbances and general
psychopathology. Behaviour Research and Therapy, 45, 2203-2211.
Lawlis, G. F., & Lu, E. (1972). Judgment of counseling process: Reliability, agreement,
and error. Psychological Bulletin, 78, 17-20.
Lawshe, C. H. (1975). A quantitative approach to content validity. Personnel Psychology,
28, 563-575.
le Grange, D., Gorin, A., Catley, D., & Stone, A. A. (2001). Does momentary assessment
detect binge eating in overweight women that is denied at interview? European
Eating Disorders Review, 9, 309-324.
le Grange, D. & Lock, J. (2005). The dearth of psychological treatment studies for
Anorexia Nervosa. International Journal of Eating Disorders, 37, 79-91.
le Grange, D., Gorin, A., Catley, D., & Stone, A. A. (2001). Does momentary assessment
detect binge eating in overweight women that is denied at interview? European
Eating Disorders Review, 9, 309-324.
le Grange, D., Lock, J., & Dymeck, M. (2003). Family Based Therapy for Adolescents
with Bulimia Nervosa. American Journal of Psychotherapy, 57, 237-251.
Lipsey, M. W. & Wilson, D. B. (2001). Practical Meta-Analysis. Thousand Oaks,
117
California: Sage Publications, Inc.
Loeb, K. L., Pike, K. M., Walsh, B. T., & Wilson, G. T. (1994). Assessment of diagnostic
features of bulimia nervosa: Interview versus self-report format. International
Journal of Eating Disorders, 16, 75-81.
Luce, K. & Crowther, J.H. (1999). The reliability of the eating disorder examination:
self-report questionnaire version (EDE-Q). International Journal of Eating
Disorders, 25, 349-351.
Machado, P. P. P., Machado, B. C., Gonçalves, S., & Hoek, H. W. (2007). The
prevalence of Eating Disorders Not Otherwise Specified. International Journal of
Eating Disorders, 40, 212-217.
Mannucci, E., Ricca, B., Di Bernardo, M., Moretti, S., Cabras, P. L., & Rotella, C. M.
(1997). Psychometric properties of EDE 12.0D in obese adult patients without
binge eating disorder. Eating and Weight Disorders, 2, 144-149.
Masheb, R. M. & Grilo, C. M. (2007). Rapid response predicts treatment outcomes in
binge eating disorder: Implications for stepped care. Journal of Consulting and
Clinical Psychology, 75, 639-644.
Mond, J. M., Hay, P. J., Rodgers, B., & Owen, C. (2006). Eating Disorder Examination
Questionnaire (EDE-Q): Norms for young adult women. Behaviour Research &
Therapy, 44, 53-62.
Mond, J. M., Hay, P. J., Rodgers, B., & Owen, C. (2007). Self-report versus interview
assessment of purging in a community sample of women. European Eating
Disorders Review, 15, 403-409.

118
Mond, J. M., Hay, P. J., Rodgers, B., Owen, C., & Beumont, P. J. V. (2004)a. Temporal
stability of the Eating Disorder Examination Questionnaire. International Journal
of Eating Disorder, 36, 195-203.
Mond, J. M., Hay, P. J., Rodgers, B., Owen, C., & Beumont, P. J. V. (2004)b. Validity of
the Eating Disorder Examination Questionnaire (EDE-Q) in screening for eating
disorders in community samples. Behaviour Research and Therapy, 42, 551-567.
Oehlert, G. W., & Bingham, C. (2005). MacAnova (Version 5.05). Retrieved June, 2009,
from http://www.stat.umn.edu/macanova/
Ortega, D., Waranch, H. R., Maldonado, A. J., & Hubbard, F. A. (1987). A comparative
analysis of self-report measures of bulimia. International Journal of Eating
Disorders, 2, 301-311.
Passi, V. A., Bryson, S. W., Lock, J. (2003). Assessment of eating disorders in
adolescents with anorexia nervosa: Self-report questionnaire versus interview.
International Journal of Eating Disorders, 33, 45-54.
Peterson, C. B., Crosby, R. D., Wonderlich, S. A., Joiner, T., Crow, S. J., Mitchell, J. E.
et al. (2007). Psychometric properties of the eating disorder examination-
questionnaire: Factor structure and internal consistency. International Journal of
Eating Disorders, 40, 386-389.
Peterson, C. B., Mitchell, J. E., Crow, S. J., Crosby, R. D., & Wonderlich, S. A. (2009).
The efficacy of self-help group treatment and therapist-led group treatment for
binge eating disorder. American Journal of Psychiatry, 166, 1347-1354.

119
Peterson, C. B., Miller, K. B., Johnson-Lind, J. Crow, S. J., & Thuras, P. (2007). The
accuracy of symptom recall in eating disorders. Comprehensive Psychiatry, 48,
51-56.
Ravaldi, C., Vannacci, A., Truglia, E., Zucchi, T., Mannucci, E., Rotella, C. M., et al.
(2004). The Eating Disorder Examination as a retrospective interview. Eating and
Weight Disorders, 9, 228-231.
Reas, D. L., Grilo, C. M., & Masheb, R. M. (2006). Reliability of the Eating Disorder
Examination-Questionnaire in patients with binge eating disorder. Behavior
Research and Therapy, 44, 43-51.
Rizvi, S. L., Peterson, C. B., Crow, S. J., & Agras, W. S. (2000). Test-retest reliability of
the Eating Disorder Examination. International Journal of Eating Disorders, 28,
311-316.
Rosen, J. C., Jones, A., Ramirez, E., & Waxman, S. (1996). Body Shape Questionnaire:
Studies of validity and reliability. International Journal of Eating Disorders, 20,
315-319.
Rosen, J. C., Vara, L., Wendt, S., & Leitenberg, H. (1990). Validity studies of the Eating
Disorder Examination. International Journal of Eating Disorders, 9, 519-528.
Rosenberg, M. (1965). Society and the adolescent self-image. Princeton, NJ: Princeton
University Press.
Rush, A. J., Giles, D. E., Schlesser, M. A., Fulton, C. L., Weissenburger, J., & Burns, C.
(1986). The inventory for depressive symptomatology (IDS): Preliminary
findings. Psychiatry Research, 18, 65-87.

120
Sellbom, M., Ben-Porath, Y. S., McNulty, J. L., Arbisi, P. A., & Graham, J. T.
(2006).Elevation Differences between MMPI–2 Clinical and Restructured
Clinical (RC) scales: Frequency, origins, and interpretative implications.
Assessment, 13, 430–441.
Sobell, L. C., Maisto, S. A., Sobell, M. B., Cooper, A. M. (1979). Reliability of alcohol
abusers’ self-reports of drinking behavior. Behavior Research & Therapy, 17,
157-160.
Sobell, M. B., Sobell, L. C., Klajner, F., Pavan, D., & Basian, E. (1986). The reliability of
a timeline method for assessing normal drinker college students’ recent drinking
history: Utility for alcohol research. Addictive Behaviors, 11, 149-161.
Spitzer, R. L., Yanovski, S. Z., & Marcus, M. D. (1993). Questionnaire on Eating and
Weight Patterns-Revised. McLean, VA: BRS Search Service.
Stunkard, A. J. & Messick, S. (1985). The Three-Factor Eating Questionnaire to measure
dietary restraint, disinhibition, and hunger. Journal of Psychosomatic Research,
29, 71-83.
Sysko, R., Walsh, B. T., Fairburn, C. G. (2005). Eating Disorder Examination-
Questionnaire as a measure of change in patients with bulimia nervosa.
International Journal of Eating Disorders, 37, 100-106.
Sysko, R., Walsh, B. T., Schebendach, J., & Wilson, G. T. (2005). Eating behavior
among women with anorexia nervosa. The American Journal of Clinical
Nutrition, 82, 296-301.

121
Tinsley, H. E. A. & Weiss, D. J. (1975). Interrater reliability and agreement of subjective
judgments. Journal of Counseling Psychology, 22, 358-376.
Wade, T. D., Byrne, S., Bryant-Waugh, R. (2008). The Eating Disorder Examination:
Norms and construct validity with young and middle adolescent girls.
International Journal of Eating Disorders, 41, 551-558.
Wade, T., Tiggemann, M., Martin, N., & Heath, A. (1997). A comparison of the Eating
Disorder Examination and a general psychiatric schedule. Australian and New
Zealand Journal of Psychiatry, 31, 852-857.
Wilfley, D. E., Bishop, M. E., Wilson, G. T., & Agras, W. S. (2007). Classification of
eating disorders: Toward DSM-V. International Journal of Eating Disorders, 40,
S123-S129.
Wilfley, D. E., Schwartz, M. B., Spurrell, E. B., & Fairburn, C. G. (1997). Assessing the
specific psychopathology of binge eating disorder patients: Interview or self-
report? Behavior Research and Therapy, 35, 1151-1159.
Wilfley, D. E., Schwartz, M. B., Spurrell, E. B., & Fairburn, C. G. (2000). Using the
Eating Disorder Examination to identify the specific psychopathology of Binge
Eating Disorder. International Journal of Eating Disorders, 27, 259-269.
Wilson, G. T. (1993). Assessment of Binge Eating. In C. G. Fairburn & G. T. Wilson
(eds.), Binge Eating: nature, assessment, and treatment (12e.), (317-360). New
York: Guilford.
Wilson, G. T., Grilo, C. M., & Vitousek, K. M. (2007). Psychological treatment of eating
disorders. American Psychologist, 62, 199-216.

122
Wilson, G. T., Nonas, C. A., Rosenblum, G. D. (1993). Assessment of binge eating in
obese patients. International Journal of Eating Disorders, 13, 25-33.
Wilson, G. T. & Smith D. (1989). Assessment of bulimia nervosa: An evaluation of the
Eating Disorders Examination. International Journal of Eating Disorders, 8, 173-
179.
Wolk, S. L., Loeb, K. L., Walsh, B. T. (2005). Assessment of patients with anorexia
nervosa: Interview versus self-report. International Journal of Eating Disorders,
37, 92-99.
Woodside, D.B., & Garfinkel, P.E. (1992). Age of onset in eating disorders. International
Journal of Eating Disorders, 12, 31-36.

123
Appendix A
Empirical Findings on the Reliability of the EDE
Test-retest Reliability
Two research groups have examined the test-retest reliability of the EDE. One
study assessed the short-term (2-7 days) test-retest reliability of the EDE in 20 female
participants with a variety of eating disorders (Rizvi, Peterson, Crow, & Agras, 2000).
The second reported on the test-retest reliability of the EDE over a longer period of time
(6-14 days) in 18 adult women with BED (Grilo et al., 2003). Both studies found that the
EDE demonstrates high test-retest reliability for the four subscales, with correlations
ranging from .50 to .88. The EDE also demonstrated high test-retest reliability for OBEs
and self-induced vomiting, with correlations ranging from .70 to .97. In contrast, the
items that assess SBEs have not demonstrated significant test-retest reliability, with
correlations ranging from .17 to .40. See Table 1 for additional detail. There have been no
studies that have assessed the test-retest reliability of the EDE items that assess laxative
misuse and diuretic misuse.
These data support the test-retest reliability of the four subscales, the individual
items that assess objective bulimic days and episodes, and the individual items that assess
self-induced vomiting days and episodes. However, the test-retest reliability correlations
weakened as the length of time between testing increased, and it is notable that the time
between testing was not long. The only exception to this was the Restraint subscale, for
which the test-retest correlations remained high after a 2-week lag time. The data do not
support the test-retest reliability of the items that assess subjective bulimic days and

124
episodes. Additionally, it should be noted that both studies had small sample sizes which
limit the generalizability of the findings.
Inter-rater Reliability of the EDE
Because the EDE is a semi-structured interview, it is important to examine
whether raters are able to reliably make similar ratings. One study has examined the
inter-rater reliability of each individual EDE item (Cooper & Fairburn, 1987). In this
study, three different raters each assessed 12 different participants, nine of whom met
criteria for BN and three of whom had no eating disorder. Of the 62 total items examined
(some of which have since been eliminated from the EDE), 27 items had perfect inter-
rater reliability and only three items had inter-rater reliability coefficients below .90.
Only two of these three items are still included in the EDE: “social eating” and “body
composition.” The third item, “pursuit of thinness,” is no longer included in the EDE.
The results of this study support the inter-rater reliability of the individual items of the
EDE.
Three studies have examined the inter-rater reliability of the four subscales of the
EDE3. The first used a sample of 106 undergraduate females (Rosen, Vara, Wendt, &
Leitenberg, 1990), the second sampled 20 adult females suffering from a variety of eating
disorders (Rizvi et al., 2000), and, in the third, participants were 18 adult women with
BED (Grilo et al., 2003). In all three studies, the inter-rater reliabilities of the Restraint
subscale and Eating Concern subscale were .90 or greater. The inter-rater reliability
3 Several studies have reported the inter-rater reliability coefficients for the EDE within the context of other studies (e.g., Masheb & Grilo, 2007); however, the inter-rater reliability of the EDE is not consistently reported in the literature. This summary only includes the three published studies whose purpose was to examine the inter-rater reliability of the EDE.

125
coefficients for the Shape Concern subscale ranged from .84 to .99 and the inter-rater
reliability coefficients for the Weight Concern subscale ranged from .65 to .99 (See Table
2.)The lowest inter-rater reliability coefficients for the Shape Concern and Weight
Concern subscales occurred in the Rosen et al. (1990) study, which was the earliest study
and the only one that used a nonclinical sample.
These three studies also assessed the inter-rater reliability for the items related to
binge eating and compensatory behaviors. In two of the studies, the inter-rater reliability
for objective bulimic days, objective bulimic episodes, subjective bulimic days, and
subjective bulimic episodes ranged from .91 to .99 (Grilo et al., 2003; Rizvi et al., 2000).
In the third study, the inter-rater reliability was only calculated for the frequency of binge
eating4 and the frequency of self-induced vomiting (Rosen et al., 1990). These inter-rater
reliability coefficients were .98 and .99, respectively. See Table 2 for additional detail.
The results of these studies support the inter-rater reliability for the four subscales of the
EDE and the individual items that assess binge eating and self-induced vomiting. No
published studies have assessed the inter-rater reliability of the individual items that
assess laxative misuse or diuretic misuse.
Internal Consistency
4 Rosen et al. (1990) did not differentiate between Objective Bulimic Episode (OBEs) and Subjective Bulimic Episodes (SBEs) in their analyses. Although the authors do not provide the explicit criteria used to define “binge eating,” it is assumed that when the term “binge eating” is used, it is meant to describe what should be termed as OBEs. This assumption will be applied to all other studies cited in this paper that analyzed frequency of binge eating without distinguishing between OBEs and SBEs

126
Four studies5 have examined the internal consistency of the four subscales of the
EDE in six total samples (Beumont, Kopec-Schrader, Talbot, & Touyz, 1993; Byrne et
al., in press; Cooper et al., 1989; Grilo et al., in press). The first study sampled an eating
disorder population, specifically, 47 women with AN, 53 women with BN, and 42
controls (Cooper et al., 1989). Participants in the second study were 116 adult females
suffering from various eating disorders (Beumont et al., 1993). Participants in the third
study were 688 adults seeking treatment for BED (Grilo et al., in press). Finally, the
fourth study (Byrne et al., in press), examined the internal consistency of the EDE
subscales in three samples: a female eating disorder sample including 24 participants with
AN, 67 with BN, and 67 with EDNOS, 317 women from a community sample, and 170
females seeking treatment for overweight or obesity.
The internal consistency coefficients of the subscales ranged from .58 to .78 for
the Restraint subscale, .44 to .78 for the Eating Concern subscale, .68 to .85 for the Shape
Concern subscale, and .51 to .76 for the Weight Concern subscale. A complete list of
internal consistency coefficients can be found in Table 3. The highest internal
consistency coefficients were found in the samples of women with full- and sub-threshold
AN and BN whereas the lowest internal consistency coefficients were consistently found
in either the community-based samples or the BED sample. The results of these studies
provide support for the internal consistency of the Shape Concern subscale and
preliminary support for the other three subscales. Internal consistency has not been
5 The internal consistency of the EDE is rarely reported by authors who have used the EDE in their research; thus, only studies whose purpose was to examine the internal consistency of the EDE are summarized here.

127
assessed for the overeating section of the EDE or for self-induced vomiting because those
assessments are based on only one item each.
Long Term Recall
Although research supports the test-retest reliability or repeatability of the EDE,
this does not demonstrate whether individuals accurately recall past symptoms. The EDE
asks individuals to recall symptoms that occurred up to 6 months prior to the interview,
but there is little data to suggest that individuals are able to recall these symptoms
accurately. Two studies have been conducted to assess longer-term recall accuracy of
eating disorder symptoms using the EDE. In the first, 70 participants with a variety of
eating disorders completed a first EDE at time 1 and a second EDE at either a 6 or 12
month follow-up assessment (Peterson, Miller, Johnson-Lind, Crow, & Thuras, 2007).
During the second EDE, they were asked to recall symptoms from time 1 rather than
current symptoms. The researchers found a strong correlation between OBE frequency at
time 1 and recall (r=.72). However, the correlation between SBE frequency at time 1 and
recall was significantly lower than the correlation for OBE frequency (r=.34, Z=2.95,
p<.001). The researchers also compared the diagnoses based on the data collected at time
1 and at recall. They found agreement rates ranging from 65% to 86% for narrow (e.g.,
AN, BN, BED) and broad (e.g., full-threshold eating disorder, sub-threshold eating
disorder) diagnoses, respectively.
A second group of researchers found similar results in a recall study (Ravaldi,
Vannacci, Truglia, Zucchi, Mannucci, Rotella et al., 2004). They assessed 25 participants
with a variety of eating disorders at two time points. At time 1, they were given the EDE

128
to assess their current symptoms. Five to 30 months later, they were instructed to recall
their symptoms at time 1 using the EDE. They found significant correlations between the
subscale scores at baseline and recall, with correlations ranging from .63 to .88. They also
found significant correlations between the bulimic behaviors reported at baseline and
recall: OBE days (.69), OBE episodes (.65), SBE days (.74), SBE episodes (.76), self-
induced vomiting (.79), laxative misuse (.85), diuretic misuse (.70), and excessive
exercise (.97). The results of these two studies provide support for the hypothesis that
participants are able to reliably recall their symptom presentation as far back as 2.5 years.
However, it is important to note that these data only examined whether participants
accurately recalled the symptoms they reported at the prior interview. These data do not
indicate whether participants accurately recalled the frequency of symptoms actually
experienced.

129
Appendix B
Empirical Findings on the Reliability of the EDE-Q
Test-Retest Reliability
The test-retest reliability of the EDE-Q has been examined by three groups of
researchers, two of which assessed test-retest reliability over a relatively short duration
(1-14 days; Luce & Crowther, 1999; Reas, Grilo, & Masheb, 2006) whereas the third
assessed the test-retest reliability over a relatively longer duration (5-14 months; Mond,
Hay, Rodgers, Owen, and Beumont, 2004a). In the first (Luce & Crowther, 1999), the
test-retest reliability of the EDE-Q was examined in a community sample of 139 female
undergraduate students whereas in the second (Reas et al., 2006), the test-retest reliability
of the EDE-Q was also examined in a sample of 86 men and women seeking treatment
for BED. In both studies (Luce & Crowther, 1999; Reas et al., 2006), the short-term test-
retest correlations were significant for all four subscales with correlation coefficients
ranging from .66 to .94. There were also significant test-retest correlations for the
frequency of binge eating and compensatory behaviors with correlation coefficients
ranging from .51 to .92. See Table 4 for a complete list of correlations. It is notable that
the weakest correlations were for SBEs, OOEs, and diuretic misuse. The correlations for
all four subscales were higher in the Luce and Crowther study, which is not surprising as
the sample was composed of undergraduate women for whom eating disorder cognitions
may not vary day to day.
One of these studies also analyzed the short-term test-retest reliability for the
individual items that are used to create the four subscales (Reas et al., 2006). These

130
correlations ranged from .40 (fear of weight gain) to .78 (importance of shape, reaction to
prescribed weighing) and were all significant at p<.01. They also analyzed the test-retest
correlations for different time lags: one day or less, two to 14 days, and 7 to 14 days
(Reas et al., 2006). The results show that there was little impact of the time lag on the
test-retest correlations for the EDE subscales or the OBE’s. However, there was a time
lag effect on the test-retest correlations for SBE’s and OOE’s, with the Spearman rho
correlations decreasing as the time lag increased.
Longer term test-retest reliability of the EDE-Q was examined in a community
sample of 196 Australian women (Mond et al., 2004a). The longer-term test-retest
correlations for the four subscales remained high despite the lengthy time lag and were
comparable to the short-term test-retest correlations found by Luce and Crowther (1999)
and Reas et al. (2006). Additionally, the correlations between individual items rated at
time 1 and time 2 were all significant, ranging from .42 (Eating in secret) to .69 (Feelings
of fatness). There were also significant test-retest correlations for OBEs, SBEs, and
excessive exercise; however they were weaker than the correlations for the EDE-Q
subscales and the 2-week test-retest correlations for these behaviors found by Luce and
Crowther (1999) and Reas et al. (2006). Additionally, when the analysis only included
participants who reported eating disorder symptoms, the correlations for OBEs were
lower than when the analysis included the entire sample. Thus, these data demonstrate
that the inclusion of respondents who report no disordered eating behavior can artificially
inflate the correlations between time 1 and time 2.
131
The data provide support for the short-term (1-14 days) test-retest reliability for
the assessment of the four subscales, OBEs, self-induced vomiting, and laxative misuse
as well as preliminary support for the assessment of SBEs, OOEs, and diuretic use. The
EDE-Q also demonstrated long-term (5-14 months) test-retest reliability for the four
subscales, but not OBEs, SBEs, or excessive exercise. Overall, these data suggest that the
EDE-Q may be more reliable with regard to the assessment of cognitive symptoms than
the behavioral symptoms, especially as the duration between testing sessions increases.
However, researchers must also consider the possibility that the cognitive symptoms of
eating disorders are more stable over time than the behavioral symptoms. Future research
needs to examine the test-retest reliability for the EDE-Q in participants with AN, BN,
and EDNOS diagnoses as well as more heterogeneous community samples.
Internal Consistency
There have been three studies that have assessed the internal consistency of the
EDE-Q subscales. The samples of these three studies included a community sample of
203 undergraduate women at time 1 and 139 (68.5%) of the women at time 2 (Luce &
Crowther, 1999), a community sample of 208 adult women (Mond et al., 2004a), and 203
adult women with BN (Peterson, Crosby, et al., 2007). The four subscales demonstrated
acceptable internal consistency in all three studies (Luce & Crowther, 1999; Mond et al.,
2004a; Peterson, Crosby, et al., 2007). All four subscales of the EDE-Q demonstrated
acceptable internal consistency, with correlations ranging from .70 to .93 (see Table 5 for
a complete list of internal consistency coefficients). One study also calculated the item-
total correlations for the EDE-Q (Mond et al., 2004a) and found correlations ranging

132
from .33 (“avoidance of eating,” “eating in secret”) to .76 (“dissatisfaction with weight,”
“dissatisfaction with shape”). These data indicate that the EDE-Q demonstrates good
internal consistency in both community samples of adult women and adult women with
BN. There has been no research on the internal consistency of the items on the EDE-Q
that assess specific behaviors because those items are typically analyzed as individual
items. Future studies should examine the internal consistency of the EDE-Q in both men
and women, adolescents, and patients with AN, BED, and EDNOS.

133
Appendix C
Theoretical Perspectives on Validity
Face validity
Face validity is the extent to which an instrument appears to measure what it
purports to measure. In other words, an instrument has face validity if the instrument
includes items that are assumed to be relevant to the construct of interest. The face
validity of an instrument is determined by a subjective judgment. For example, the EDE,
an assessment of eating disorder symptoms, may be judged to have face validity if it
included items that assess symptoms assumed to be relevant to eating disorders such as
food restriction, binge eating, purging, and importance of shape and weight. However, it
should be noted that face validity is neither necessary nor sufficient for an instrument to
be a valid assessment of a particular construct because instruments may have high
construct, content, or criterion-related validity without appearing to measure the given
construct
Content validity
Content validity is the extent to which an instrument assesses the entire domain of
the construct it purports to measure. For example, the EDE purports to measure eating
disorder symptoms in general and includes items that assess both behavioral and
cognitive symptoms of eating disorders. If the EDE only assessed the behavioral
symptoms of eating disorders, the content validity of the EDE as an assessment of
general eating disorder symptoms would not be supported because the cognitive
symptoms would not be assessed. One of the most common ways to determine whether

134
an instrument demonstrates content validity is to poll experts as to the essentiality of each
item to the instrument (Lawshe, 1975). These responses are then used to determine the
Content Validity Ratio (CVR), which is equivalent to (number of panelists indicating
“essential” – (total number of panelists/2) / (total number of panelists/2). It should be
noted that the content validity of an instrument can only be determined to the extent that
the domain of the construct is understood. In other words, if the definition or domain of a
construct changed, then the content validity of an instrument would change. For example,
if it was determined that affect is also essential to eating disorder symptomatology, the
EDE would not demonstrate content validity because it does not assess affect.
Criterion-oriented validity
Criterion-oriented validity refers to the extent to which the operationalization of a
given construct (i.e., predictor) is able to predict a criterion of interest (i.e., criterion) that
is either measured at the same time (concurrent validity) or at some point in the future
(predictive validity). Concurrent validity is often studied to determine whether the
instrument in question could be used to measure the criterion in place of another
instrument. To measure concurrent validity, the predictor and criterion are measured at
the same time and correlated. For example, the EDE is purported to predict current
diagnostic status. Thus, to examine the concurrent validity of the EDE with regard to
diagnostic status, one could administer the EDE and a separate diagnostic interview on
the same day. If the EDE performed well against the diagnostic interview, the EDE could
be used in place of the diagnostic interview.

135
Predictive validity, on the other hand, is used if one is interested in predicting a
criterion in the future. It is examined by measuring the criterion at some point in time
after the predictor has been assessed and correlating the two. For example, one might
want to know whether EDE scores predict diagnostic status after treatment. In this case,
the EDE would be administered prior to treatment and a diagnostic interview would be
administered post-treatment. If EDE scores pre-treatment are related to diagnostic status
post-treatment, the EDE would demonstrate predictive validity and could be used to
predict treatment response. However, it should be noted that the criterion-oriented
validity of an instrument is useful only in so far as the criteria used are valid themselves.
Thus, with regard to examining the concurrent validity of the EDE using the diagnostic
criteria for various eating disorders as the criterion, the validity estimate of the EDE will
only be as valid as the diagnostic criteria used.
Construct Validity
The construct validity of an instrument refers to the degree to which an instrument
operationalizes a specific construct. In other words, construct validity is the extent to
which the scores on the instrument reflect the desired construct rather than other
constructs. A construct is operationalized by placing it within a nomological network. A
nomological network describes the theoretical relationships between the abstract
constructs, the observable manifestations of the abstract constructs, and the proposed
empirical relationships between the observable manifestations of the abstract constructs.
The construct validity of an instrument is supported if the actual empirical relationships
between observable manifestations of constructs reflect the proposed empirical
136
relationships between observable manifestations of constructs. Failure of the empirical
relationships between observables to reflect proposed relationships between observables
may indicate a limitation of the instrument to measure the construct. However, it may
also indicate an error in the nomological network itself. Thus, the construct validation of
an instrument cannot be determined by a single study. Rather, construct validation is a
process by which the nomological network of a construct is tested. The most important
tests of the nomological network are reflected in the assessment of the convergent and
discriminant validity of an instrument. Convergent validity is the extent to which the
construct of interest is empirically related to theoretically-related constructs whereas,
discriminant validity is the extent to which the construct of interest is empirically
unrelated to theoretically-unrelated constructs.
The gold standard for measuring convergent and discriminant validity is the
Multitrait-Multimethod (MTMM) matrix (Campbell & Fiske, 1959). In MTMM, multiple
traits (often 3) are measured by multiple methods (often 3; e.g., paper and pencil,
interview, direct observation). This allows one to compare correlations between
assessments of similar constructs to the correlations between assessments of dissimilar
constructs. The MTMM matrix also allows for the comparison of correlations between
assessments using similar methods and correlations between assessments using dissimilar
methods. The MTMM matrices include four different types of correlations: Monotrait-
Monomethod (MTMM), Monotrait-Heteromethod (MTHM), Heterotrait-Monomethod
(HTMM), and Heterotrait-Heteromethod (HTHM). The MTMM correlations represent
the instrument’s correlation with itself and could reflect test-retest reliability if

137
participants have been assessed at multiple time points. The MTHM correlations
represent the correlations between instruments that measure the same construct using
different methods of assessment. The HTMM correlations represent the correlations
between different traits using the same method. Finally, the HTHM correlations reflect
the correlations between the assessments of different traits using different methods, so we
would expect these correlations to be the lowest in the matrix
If the MTHM correlations are significantly different from zero, the relationships
between these scores are due to overlap in the construct that is being assessed. Significant
HTMM correlations indicate that the relationship between scores is the result of overlap
in the method of measurement. The HTHM correlations are expected to be the lowest
correlations in the matrix because there is no overlap with regard to either the construct
being assessed or the method of measurement. Thus, significant HTHM correlations may
indicate significant amounts of error. If the MTHM correlations are higher than the
HTMM and HTHM correlations, the relationship between similar constructs measured by
different methods is stronger than the relationship between different constructs measured
by the similar methods and the relationship between different constructs measured by
different methods. In other words, if the MTHM correlations are significantly higher than
the HTMM and HTHM correlations, there is evidence for convergent and discriminant
validity.

138
Appendix D
Empirical Findings on the Validity of the EDE
Criterion-oriented validity: Concurrent validity of the EDE with regard to current
diagnostic status
In a seminal article on establishing validity, Cronbach and Meehl (1955)
explained that one method for testing criterion-oriented validity is to determine whether
the instrument predicts expected group differences. Four studies have examined the
ability of the EDE to discriminate between eating disorder populations and control groups
(Cooper et al., 1989; Rosen et al., 1990; Wilfley, Schwartz, Spurrell, & Fairburn, 2000;
Wilson & Smith, 1989). In the first of these studies (Cooper et al., 1989), the EDE scores
of 47 women with AN, 53 women with BN, and 42 women who did not have an eating
disorder were compared. Two studies have examined the EDE’s ability to discriminate
between women with BN and control women who score highly on a measure of restraint
(Rosen et al., 1990; Wilson & Smith, 1989). The final study compared 105 adult women
with BED to a group of 42 normal-weight and 15 overweight women without eating
disorders (Wilfley et al., 2000).
Data from these studies show that there were large effect sizes for the four
subscales between the following groups: AN group and Control group, BN group and
Control group, BN group and Restricting Control Group, BED group and Normal Weight
Control group, and a BED group and an Overweight Control group (range of Cohen’s d =
.97 to 6.68). The only exceptions were a moderate effect size (.40) between a BN and
Restricting Control group on the Restraint subscale and a small effect size (.16) between
139
the BED and Overweight Control group on the Restraint subscale. Additionally, the EDE
also demonstrated ability to discriminate between AN and BN samples on Shape
Concern, Weight Concern, and frequency of OBEs (Cooper et al, 1989). These statistics
are provided in Table 66.
One limitation of these data worth noting is that it is unclear from the description
of the Cooper et al. (1989) study whether the assessors were blind to the participants’
diagnostic status. Based on their percent of Ideal Body Weight (IBW), the women with
AN weighed much less than the women with BN or the control women (73.4 IBW, 103.3
IBW, 99.9 IBW respectively); thus, the assessors would likely be aware of the diagnostic
status of the participants with AN. As such, assessor knowledge of diagnostic status may
limit the validity of these results. Despite this potential limitation, the EDE appears to
discriminate between women with eating disorders and control women, even when the
control women report high restraint.
Construct validity: Convergent validity of the EDE and assessments of similar constructs
One method of testing construct validity is to determine whether two different
measures of a construct converge. Cronbach and Meehl (1955) state, “If two tests are
presumed to measure the same construct, a correlation between them is predicted (p.
286).” Two studies7 have assessed the convergent validity of the EDE’s four subscales
against measures of similar constructs (see Table 7), one of which used a sample of 106
6 The results from Rosen et al. (1990) are not included in the table as the authors only described the results of the group differences comparisons within text and did not report statistics from these comparisons. 7 Additional studies have examined the convergent validity of the EDE and self-report questionnaires of eating disorder symptoms (e.g., Greeno, Marcus, & Wing, 1995) as well as the convergent validity of the EDE and other interview-based assessments (e.g., Wade, Tiggemann, Martin, & Heath, 1997); however the purpose of these studies has been to examine the validity of the other instrument against the EDE. These studies are not reported here as it does not seem suitable to discuss the psychometric properties of the EDE against unvalidated instruments.

140
undergraduate females (Rosen et al., 1990) whereas the other used a sample of 82 women
seeking treatment for BN (Loeb et al.,1994). In both studies, all four subscales of the
EDE correlate with measures of similar constructs. Specifically, the Restraint subscale
was negatively correlated with behavioral measures of food consumption (e.g., frequency
of regular meals; Rosen et al., 1990) and positively correlated with other indices of
restraint (e.g., the Restraint subscale of the Three-Factor Eating Questionnaire; Loeb et
al., 1994). Likewise, the Eating Concern subscale correlated with behavioral measures of
disordered eating (e.g., frequency of binge eating; Rosen et al., 1990) as well as cognitive
assessments of eating concern (e.g., Dieting Concern subscale of the Eating Attitudes
Test; Loeb et al., 1994). The Shape Concern and Weight Concern subscales were both
significantly correlated with other indices of body dissatisfaction (e.g., Body Shape
Questionnaire; Loeb et al., 1994; Rosen et al., 1990). The majority of these correlations
demonstrate a medium to large effect, but it should be noted that although significant, the
correlations between the Restraint subscale and two similar constructs (the frequency of
eating snack foods and the EAT Oral Control subscale) demonstrated only a small effect.
A detailed summary of these statistics is provided in Table 7. In sum, research has
demonstrated that the subscales of the EDE correlate with instruments of similar
constructs.
Construct validity: Factor structure of the EDE

141
Finally, three studies8 have examined the factor structure of the EDE (Byrne et al.,
in press; Grilo et al., in press; Mannucci, Ricca, Di Bernardo, Moretti, Cabras, & Rotella,
1997). As stated previously, the EDE is conceptualized as having four subscales:
Restraint, Weight Concern, Shape Concern, and Weight Concern. However, none of
these studies replicated the EDE’s four-factor model. A more recent study examined the
factor structure of the EDE in a sample of 688 adults seeking treatment for BED (Grilo et
al., in press). The exploratory factor analysis suggested a 3-factor model (i.e., “Dietary
Restraint,” “Shape/Weight Overevaluation,” and “Body Dissatisfaction”) and this model
was supported by the confirmatory factor analysis. A second factor analysis using 115
obese adults who did not meet criteria for BED indicated a 2-factor model (Mannucci et
al., 1997). In this study, the first factor was similar to the Restraint subscale whereas the
other appeared to be a combination of the remaining three subscales. The third study
examined the factor structure in a sample of 158 adolescent and adult women with eating
disorders, 170 adult women seeking treatment for obesity, and 317 control women (Byrne
et al., in press). When the original four-factor structure of the EDE was compared to
three-, two-, and one-factor models, a one-factor model (i.e., Weight and Shape Concern)
was the best fit. Though the results from the three studies were inconsistent, it should be
noted that all three studies failed to discriminate between a Shape Concern factor and a
Weight Concern factor. It is notable that there was little overlap in the type of samples
used. Thus, additional data are needed to determine whether different factor structures
exist among participants with different symptom presentations.
8 A fourth study examined the factor structure of a version of the EDE adapted for use with children (Wade, Byrne, Bryant-Waugh, 2008). As this review primarily pertains to the adult version of the EDE, the Wade et al. (2008) study will not be discussed.

142

143
Appendix E
Empirical Findings on the Validity of the EDE-Q
Criterion-oriented validity: Concurrent validity of the EDE-Q with regard to current
diagnostic status
Four studies have been conducted to test the criterion-oriented validity of the
EDE-Q by examining its ability to discriminate between eating disorder and control
groups (Elder, Grilo, Masheb, Rothschild, Burke-Martindale, & Brody, 2006; Engelsen &
Laberg, 2000; Mond, Hay, Rodgers, Owen, & Beumont, 2004b; Wilson, Nonas, &
Rosenblum, 1993). Only one of these studies used a structured interview to classify
participants as cases or noncases of eating disorders (Mond et al., 2004b). In this study,
182 adult women without an eating disorder were compared to 13 women diagnosed with
BN nonpurging type and EDNOS. The results indicated that women with eating disorders
scored significantly higher on the EDE-Q than women who did not meet criteria for
eating disorders.
Two additional studies classified eating disorder cases and non-cases using the
EDE-Q (Engelsen & Laberg, 2000; Wilson et al., 1993). The first study demonstrated
that obese binge eaters (N=31) scored significantly higher than obese non-binge eaters on
15 individual items of the EDE-Q (Wilson et al., 1993). The items that did not
discriminate between the two groups were items that reflected dietary restraint and a
desire to lose weight. It is worth noting that the entire sample in this study was drawn
from a weight loss program and as such, one may not expect differences between groups
on these variables. The second study found that adolescents with AN (N=10) scored

144
significantly higher on the Eating Disorders Inventory (EDI; Garner, Olmsted, & Polivy,
1983) and all but one subscale of the 12-item version of the Eating Attitudes Test (EAT-
12; Garner, & Garfinkel, 1979), with effect sizes ranging from .87 to 1.56.
Finally, one study has examined the agreement between the EDE-Q and another
self-report measure of binge eating in identifying regular binge eaters (Elder et al., 2006).
In this study, the researchers examined the concordance between the EDE-Q and the
Questionnaire on Eating and Weight Patterns-Revised (QEWP-R; Spitzer, Yanovski, &
Marcus, 1993) in self-identified binge eaters among 249 adult bariatric surgery
candidates. When binge eating was defined as having at least 1 episode of binge eating
per week, approximately the same number of participants were classified as binge eaters
by the EDE-Q (20.7%) and QEWP-R (23.2%). Although the EDE-Q and QEWP-R
identified a similar number of binge eaters, the agreement between those measures was
low (Cohen’s kappa = .26). When binge eating was defined as having at least 2 binge
episodes per week, the QEWP-R identified 1.5 times as many binge eaters as did the
EDE-Q (13.9% and 8.9%, respectively) and the instruments were only in agreement
about 4 potential binge eaters (Cohen’s kappa = .05). This kappa value indicates that the
agreement between the EDE-Q and QEWP-R in identifying twice-weekly binge eaters is
almost entirely due to chance. It should be noted that both assessments used were self-
report questionnaires and it is unclear whether the discrepancy between the measures is a
limitation of the EDE-Q, a limitation of the QEWP-R, or a limitation of both. Also,
because “diagnostic status” was solely based on reported binge eating frequency, this

145
study highlights the difficulty in assessing binge eating and the importance of using
additional criteria to determine diagnostic status
Overall, the data from the first two studies provide support for the use of the
EDE-Q in distinguishing cases and non-cases of eating disorders. However, it is
important to note that only one study used a structured interview to diagnose eating
disorder cases. Additionally, the eating disorder samples were small in all four studies
ranging which limits the generalizability of the findings.
Construct Validity: Convergent validity of the EDE-Q compared to daily food records.
Two studies have examined the convergent validity of the EDE-Q against daily
food records (Grilo et al., 2001a; Grilo, Masheb, & Wilson, 2001b). Both studies asked
participants to record the number of OBE, SBE, and OOE episodes they experienced
each day for 28 days and then to complete an EDE-Q at the end of the monitoring period.
Sixty-six participants in the first study (Grilo et al., 2001a) and 37 participants in the
second study (Grilo et al., 2001b) completed the prospective daily self-monitoring and
EDE-Q. In both studies, there were significant correlations between the daily self-
monitoring and EDE-Q for the number of OBE episodes and SBE episodes reported;
there was a significant correlation between the daily self-monitoring and EDE-Q for OOE
episodes in the second study as well. There were no significant differences between the
number of OBE episodes reported on the daily self-monitoring and EDE-Q in either the
first (d = .08) or second studies (d = .08). However, participants reported significantly
higher numbers of SBE episodes on the daily self-monitoring in both the first (d = .53)
and second (d = .60) studies. Likewise, participants reported significantly more OOE

146
episodes on the daily self-monitoring in both the first (d = 1.13) and second (d = .75)
studies. These data do demonstrate additional support for the convergent validity of the
EDE-Q in assessing OBE episodes in adults with BED. However, it should be noted the
participants in both studies were given definitions for OBE, SBE, and OOE and were
asked to simply record the number of episodes they had had for each type of episode.
Because participants were classifying their eating episodes on both instruments, the
concordance between these two measures may be artificially inflated. Additionally,
because clinical interviewers did not classify eating episodes as OBE, SBE, or OOE
episodes, it is impossible to know whether the eating episodes were accurately coded by
the participants.
Construct Validity: Factor Structure of the EDE-Q
Two studies have examined the factor structure of the EDE-Q (Hrbabosky et
al., 2008; Peterson, Crosby, et al., 2007). In the first study (Peterson, Crosby, et al.,
2007), an exploratory factor analysis was conducted on EDE-Q data collected from 203
adults with full- and sub-threshold BN in an attempt to replicate the factors of the EDE-
Q. The results supported a four-factor model. The first factor appeared to be a
combination of the Shape Concern and Weight Concern subscales and included eight
items from these subscales. The second factor appeared to be an approximation of the
Eating Concern subscale, including all of the items from the Eating Concern subscale, the
preoccupation with shape and weight question from the Shape Concern and Weight
Concern subscales, and the empty stomach question from the Restraint subscale. The
third subscale was an approximation of the Restraint subscale and included the remaining

147
items from the Restraint subscale as well as the fear of weight gain question from the
Shape Concern subscale. Finally, the fourth subscale consisted solely of the two
questions about importance of shape and weight from the Shape Concern and Weight
Concern subscales.
A second study (Hrabosky et al., 2008) examined the factor structure of the
EDE-Q using exploratory and confirmatory factor analysis in a sample of 337 adult obese
bariatric surgery candidates. The results indicate that the first factor consisted of items
assessing overeating or binge eating and appeared to describe general disturbances in
eating behavior. The second factor consisted of items from the Shape and Weight
Concern subscales and was described by the authors as a general Appearance Concern
factor. The third factor appeared to be an approximation of the Restraint subscale and
included three items from the original subscale. The final factor replicated the findings
from the Peterson, Crosby, et al. (2007) study and included only the overevaluation of
shape and weight items.
These data provide moderate support for the construct validity of the Eating
Concern and Restraint subscales in adult women with full and sub-threshold BN. There
was also moderate support for the Restraint subscale in bariatric surgery candidates. It is
notable that most of the questions from the Shape Concern and Weight Concern
subscales load onto a single factor, which suggests that separating shape and weight may
not be a meaningful distinction for many people. Finally, the data suggest that the
importance of shape and weight represent a distinct construct and are not necessarily

148
related to body dissatisfaction, discomfort with body exposure, or desire to change one’s
body shape and weight.

149
Appendix F
Empirical Findings on the Convergent Validity of the EDE and EDE-Q
Although the EDE is considered the “gold standard” of eating disorder
assessment, it requires significant amounts of time to administer as well as intensive
assessor training. A questionnaire version of the EDE, the Eating Disorder Examination-
Questionnaire (EDE-Q), was developed to address these limitations (Fairburn & Beglin,
1994). The EDE-Q includes 41 questions that are meant to address the same constructs
assessed in the interview version. Respondents rate these questions on the same 7-point
Likert scale used in the EDE. Many of the questions posed by the EDE and EDE-Q are
worded exactly the same; however, there are slight variations in wording for some of the
questions. For example, to determine the extent to which a participant would be
distressed by regular self-weighing, the EDE asks, “Over the past four weeks, how would
you have felt if you had been asked to weigh yourself once each week for the following
four weeks, no more often and no less often?” whereas the EDE-Q queries, “How much
would it upset you if you had to weigh yourself once a week for the next four weeks?”
Additionally, the EDE allows the interviewer to ask additional questions prior to making
the final rating. Thus, although the EDE and EDE-Q were meant to assess the same
constructs, differences in wording and method of delivery may limit the extent to which
the two instruments converge.
Moreover, it is unclear which delivery method, interview or self-report, is more
accurate. Although interview-based instruments are generally considered superior, some
argue that interviews may be shaming and prone to respondent denial or minimization of

150
symptoms (e.g., Grilo, 2005). The self-report instruments may be more accurate
representations of a person’s symptoms because admitting to symptoms on a
questionnaire would be less likely to induce shame or embarrassment than admitting
these symptoms to another person. Thus, although it is important to examine whether the
EDE-Q displays convergent validity with regard to the EDE, it is just as important to
understand whether the EDE displays convergent validity with regard to the EDE-Q.
There have been 15 studies and 18 comparisons9 that have assessed the
convergent validity of the EDE and EDE-Q (Binford et al., 2005; Black & Wilson, 1996;
Carter et al., 2001; de Zwaan et al., 2004; Fairburn & Beglin, 1994; Goldfein et al., 2005;
Grilo et al., 2001a; Grilo et al., 2001b; Kalarchian et al., 2000; Mond et al., 2004b; Passi
et al., 2003; Sysko, Walsh, & Fairburn, 2005; Sysko, Walsh, Schebendach, et al., 2005;
Wilfley et al., 1997; Wolk et al., 2005). The following provides a qualitative summary of
these studies. The majority of these studies have assessed convergent validity using
correlations between the EDE and EDE-Q, comparison of means, and determining the
percentage of respondents whose scores on the EDE and EDE-Q were within one point of
each other. The majority of these studies assessed the convergent validity of the EDE and
EDE-Q with regard to the four subscales and OBE’s. Less than half assessed the
convergent validity of the EDE and EDE-Q with regard to compensatory behaviors or
SBE’s. Researchers have assessed convergent validity in a number of different
subsamples: 4 studies used participants with AN (Binford et al., 2005; Passi et al., 2003;
9 The Binford et al. (2005) study conducted three separate analyses in three different subsamples: participants with AN, participants with BN, and participants with EDNOS. The Fairburn and Beglin (1994) study also conducted separate analyses, one in a community sample and the other in a mixed group of participants with either AN or BN.

151
Wolk et al., 2005), 3 studies used participants with BN (Binford et al., 2005; Carter et al.,
2001; Sysko, Walsh, & Fairburn, 2005), 1 study used a combined AN and BN sample
(Fairburn & Beglin, 1994), 1 study assessed an EDNOS sample (Binford et al., 2005), 4
studies examined BED samples (Goldfein et al., 2005; Grilo et al., 2001a; Grilo et al.,
2001b; Wilfley et al., 1997), 2 studies assessed bariatric surgery patients (de Zwaan et al.,
2004; Kalarchian et al., 2000), 2 studies used community samples (Fairburn & Beglin,
1994; Mond et al, 2004b), and one study assessed the convergent validity of the EDE and
EDE-Q in substance users (Black & Wilson, 1996).
Overall, there is strong support for the convergent validity of the four subscales
of the EDE-Q. Table 8 summarizes the results of the 14 published comparisons of the
EDE and EDE-Q with regard to the Restraint subscale. Of all four subscales, the
Restraint subscale showed the strongest convergent validity with significant positive
correlations between the EDE and EDE-Q in 13 of the 14 comparisons10. These
correlations ranged from .35 to .85 (mean r = .68). Additionally, the majority of
participants’ EDE Restraint scores were within one point of their EDE-Q Restraint score
(range: 54% to 81%). In 14 of the 15 comparisons, participants scored higher on the
EDE-Q than the EDE (Binford et al., 2005; Black & Wilson, 1996; de Zwaan et al., 2004;
Fairburn & Beglin, 1994; Grilo et al., 2001a; Grilo et al., 2001b; Kalarchian et al., 2000;
Mond et al., 2004b; Passi et al., 2003; Sysko, Walsh, Schebendach, et al., 2005; Wilfley
et al., 1997; Wolk et al., 2005). However, these differences only reached statistical
significance in the BED patients, community samples, and the bariatric surgery patients
10 One study did not calculate the correlation between the EDE and EDE-Q Restraint scores (Sysko, Walsh, Schebendach, et al., 2005).

152
(de Zwaan et al., 2004; Fairburn & Beglin, 1994; Grilo et al., 2001a; Grilo et al., 2001b;
Kalarchian et al., 2000; Mond et al., 2004b; Wilfley et al., 1997) with one exception in a
BN sample (Binford et al., 2005).
There was also strong support for the convergent validity of the Eating Concern
subscale of the EDE and EDE-Q (see Table 9). There were 14 comparisons of the EDE
and EDE-Q for the Eating Concern subscale (Binford et al., 2005; de Zwaan et al., 2004;
Fairburn & Beglin, 1994; Grilo et al., 2001a; Grilo et al., 2001b; Kalarchian et al., 2000;
Mond et al., 2004b; Passi et al., 2003; Sysko, Walsh, Schebendach, et al., 2005; Wilfley
et al., 1997; Wolk et al., 2005) and all found significant correlations between the two
measures11. However, there was variability in the strength of these correlations, with
correlations ranging from .33 to .94 (mean r = .67). There was additional variability in the
percent of participants who reported Eating Concern scores on the EDE that were within
one point of their EDE-Q score (range: 30% - 96%). In all 14 comparisons, participants
scored higher on the EDE-Q than the EDE for the Eating Concern subscale and 9 of these
comparisons reached statistical significance12.
A review of the literature also provides strong support for the convergent
validity of the EDE and EDE-Q with regard to the Shape Concern subscale; however,
there was more variability in the validity statistics for this subscale (see Table 10). For
the Shape Concern subscale, there were 15 comparisons between the EDE and EDE-Q, of
11 One study did not provide correlations between the EDE and EDE-Q for the Eating Concern subscale (Fairburn & Beglin, 1994). 12 Two studies did not analyze the mean differences between the EDE and EDE-Q for the Eating Concern subscale (Fairburn & Beglin, 1994; Sysko, Walsh, Schebendach, et al., 2005).
153
which 14 out of 15 found significant correlations between the two measures13. These
correlations ranged from .42 to .91 (mean r = .75). Of note, 80% of the correlations
ranged from .69 to .85. In all cases, between 49% and 75% of participants reported Shape
Concern scores on the EDE within one point of their EDE-Q score. Finally, in 14 of the
15 comparisons, participants scored higher on the EDE-Q than the EDE and this
difference reached statistical significance in 11 studies14.
The results of 15 comparisons also support the convergent validity of the EDE
and EDE-Q with regard to the Weight Concern subscale. This information is summarized
in Table 11. The statistical support was slightly weaker for the Weight Concern subscale
than the Restraint subscale, but there was slightly less variance in the validity statistics
for the Weight Concern subscale than the Shape Concern subscale. All 14 studies that
calculated the correlation between the EDE and EDE-Q scores found significant
correlations between the two measures which ranged between .54 and .88 (mean r = .75).
In all cases, at least 56% of participants’ Weight Concern scores on the EDE were within
one point of their EDE-Q score. Finally, in 14 of the 15 comparisons, participants scored
higher on the EDE-Q than the EDE for the Weight Concern subscale and 13 of these
reached statistical significance15.
Overall, the data from 15 comparisons of the EDE and EDE-Q provide limited
support for the convergent validity of the EDE and EDE-Q in assessing rates of OBE’s
13 Sysko, Walsh, Schebendach, et al. (2005) did not calculate the correlation between the EDE and EDE-Q for the Shape Concern subscale. 14 Sysko, Walsh, Schebendach, et al. (2005) did not analyze whether there was a significant difference between the two instruments for the Shape Concern subscale. 15 Sysko, Walsh, Schebendach, et al. (2005) did not analyze whether there was a significant difference between the two instruments for the Weight Concern subscale

154
(see Table 12). The most consistent aspect of the data was the inconsistency of the
results. First, of the 15 comparisons, 10 assessed the concordance for OBE episodes
whereas the remaining 5 assessed the concordance for OBE days. Second, of the 15
comparisons between the EDE and EDE-Q, 13 found significant correlations between the
EDE and EDE-Q for rates of OBE’s. However, there were large discrepancies among
these correlations, which ranged from .28 to .92 (mean r = .51). The correlations were
lowest for the BED samples, with correlations ranging from .20 to .29. Third, of the 15
comparisons between the EDE and EDE-Q, 8 studies found significant differences
between the EDE and EDE-Q whereas the remaining 7 did not. Of the 8 studies that
found significant differences, 5 studies found that participants reported higher rates of
OBE’s on the EDE whereas 3 found that participants reported higher rates of OBE’s on
the EDE-Q. Altogether, 9 comparisons found that participants reported higher rates of
OBE’s on the EDE whereas 6 reported higher rates on the EDE-Q. Of note, 4 of the 5
studies that compared OBE days found that participants reported higher rates on the
EDE-Q. In contrast, 8 of the 10 studies that compared OBE episodes found that
participants reported higher rates on the EDE. However, it is important to note that for
many of these studies, the differences between the EDE and EDE-Q did not reach
statistical significance.
There have been nine published comparisons of the EDE and EDE-Q in
assessing the frequency of SBE episodes. This information is summarized in Table 13. In
these studies, the correlations between the EDE and EDE-Q ranged from -.09 to .78
(mean r = .40) and six of the eight correlations were significant. However, it should be

155
noted that the sample size of the study that reported the largest correlation (.78) was only
7 (Mond et al., 2004b). Only two of the eight comparisons found significant differences
between the number of SBE episodes reported on the EDE and EDE-Q; however, the
lack of significance may have been a power issue as few participants reported SBEs.
Only two comparisons found that participants reported more SBE episodes on the EDE-Q
than the EDE (de Zwaan et al., 2004; Grilo et al., 2001b) and these differences did not
reach statistical significance. Overall, the data on the convergent validity of the EDE and
EDE-Q in assessing SBE episodes is inconsistent at best. However, this may be because
the construct itself is difficult to conceptualize rather than a limitation of the instruments.
There have been nine comparisons of the EDE and the EDE-Q for
compensatory behaviors (e.g., self-induced vomiting, laxative use). Refer to Table 14 for
summary. The correlations between the EDE and EDE-Q for these behaviors were
significant and high, with most ranging from .88 to 1.0 (mean r = .87). In two studies,
there was a significant difference between the EDE and EDE-Q for self-induced
vomiting, one in which participants reported more episodes on the EDE (Carter et al.,
2001) and one in which participants reported more episodes on the EDE-Q (Fairburn &
Beglin, 1994). There was only one study that found a significant difference between the
EDE and EDE-Q for laxative use (Sysko, Walsh, & Fairburn, 2005). Overall, there was
support for the convergent validity of the EDE and EDE-Q in assessing self-induced
vomiting and laxative use. However, it should be noted that these behaviors were not
common in several of the studies; thus, it is possible that the concordance between the
two measures may be slightly inflated. There have been no published studies on the

156
convergent validity between the EDE and EDE-Q for diuretic misuse, fasting, or
excessive exercise.