Embed Size (px)
Citation preview

Durban 1993
A STUDY OF TITANIUM-BEARING OXIDES
IN HEA VY MINERAL DEPOSITS ALONG THE
EAST COAST OF SOUTH AFRICA
BY
VICTOR EMMANUEL HUGO
Submitted in partial fulfilment of the
requirement for the degree of
Doctor of Philosophy,
in the
Department of Geology and Applied Geology
University of Natal
. 1993
i
ABSTRACT
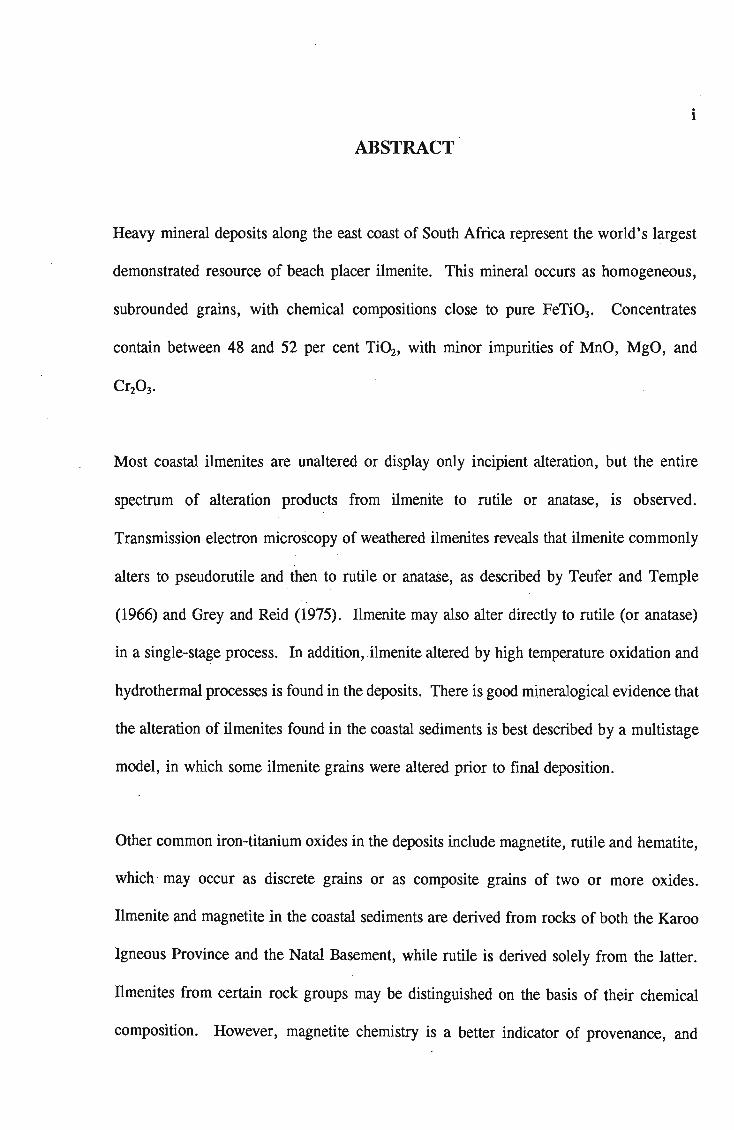
Heavy mineral deposits along the east coast of South Africa represent the world's largest
demonstrated resource of beach placer ilmenite. This mineral occurs as homogeneous,
subrounded grains, with chemical compositions close to pure FeTi03• Concentrates
contain between 48 and 52 per cent Ti02, with minor impurities of MnO, MgO, and
Cr20 3 •
Most coastal ilmenites are unaltered or display only incipient alteration, but the entire
spectrum of alteration products from ilmenite to rutile or anatase, is observed.
Transmission electron microscopy of weathered ilmenites reveals that ilmenite commonly
alters to pseudorutile and then to rutile or anatase, as described by Teufer and Temple
(1966) and Grey and Reid (1975). Ilmenite may also alter directly to rutile (or anatase)
in a single-stage process. In addition, ,ilmenite altered by high temperature oxidation and
hydrothermal processes is found in the deposits. There is good mineralogical evidence that
the alteration of ilmenites found in the coastal sediments is best described by a multi stage
model, in which some ilmenite grains were altered prior to final deposition.
Other common iron-titanium oxides in the deposits include magnetite, rutile and hematite,
which may occur as discrete grains or as composite grains of two or more oxides.
Ilmenite and magnetite in the coastal sediments are derived from rocks of both the Karoo
Igneous Province and the Natal Basement, while rutile is derived solely from the latter.
Ilmenites from certain rock groups may be distinguished on the basis of their chemical
composition. However, magnetite chemistry is a better indicator of provenance, and

ii
magnetites from the above two sources can be clearly distinguished. The petrography of
the iron-titanium oxides may be used as a provenance indicator, but may be misleading,
as the proportions of the oxide intergrowths change with transport and weathering.
Variations in the proportions and chemical compositions of iron-titanium oxides and other
heavy minerals within the coastal sediments are caused by provenance, selective sorting
during deposition, age of the deposit, weathering, and the recent geological history of the
area. A model is proposed in this study which describes the formation of the heavy
mineral deposits in relationship to the above influences.
/

Hi
PREFACE
The experimental work described in this thesis was carried out in the Department of
Geology and Applied Geology, University of Natal, Durban from March 1989 to
December 1991, under the supervision of Professor David H. Comell.
The experimental work related to the transmission electron microscopy study described in
this thesis was carried out in the Department of Earth Sciences, University of Cambridge,
England from October 1990 to March 1991, under the supervision of Dr Andrew Putnis.
These studies represent original work by the author and have not been submitted in any
form to another University. Where use was made of the work of others it has been duly
acknowledged in the text.

iv
ACKNOWLEDGEMENTS
This study was made possible by funding from Richards Bay Minerals (RBM) and the
Foundation for Research and Development, and I am most grateful for their support. I
would also like to thank RBM for the use of their analytical equipment, and numerous
other facilities for the preparation of the final manuscript.
I would like to thank:
My supervisor, Professor David Cornell, for his guidance during my research and for
meticulously editing several versions of this thesis. I would also like to thank him for
arranging my visit to Cambridge University.
Mr John Selby who arranged the funding from Richards Bay Minerals and who maintained
a keen interest in the progress of my research.
Dr Andrew Putnis and the many other staff members of the Department of Earth Sciences,
University of Cambridge, who helped me during my study visit to this University. Dr
Putnis also kindly helped to edit the sections related the transmission electron microscopy
study.
Mrs A. Pietersen (nee Turner) for drafting the map of the study area.
The Department of Geology, Rhodes University, for the use of their electron microprobe
and Mr Rob Skae who assisted with the analytical procedure.
Mr P. Evers and Ms F. McDonald who assisted in the operation of the JEOL JSM -35 and
Hitachi 520 scanning electron microscopes.
Dr Ian Grey, CSIRO, Australia, for kindly providing samples of altered ilmenite
concentrate from the Capel and Eneabba orebodies.

v
Ms D. Meth, Ms A. Pietersen (nee Turner), Mrs L. Turner and Mr G. Milne of the
University of Natal, Durban for providing various samples.
Mr J. Barnes of RBM who supplied a number of borehole samples and proof-read parts
of the final manuscript.
All the staff members at RBM who helped with sample preparation and analyses.
Messrs G. Chetty and V. Pakkirri, of the Department of Geology, University of Natal, for
preparing numerous polished thin-sections.
Or Peter Heaney and Or Gordon Nord for teaching me the "art" of transmission electron
microscopy and for enlightening discussions about mineralogy, geology in general, world
politics, and the quality of English beer.
I am . also in debt to my parents who selflessly supported me through much of 'my
university studies and who have waited patiently for me to finish my doctorate. Finally,
I reserve my deepest gratitude for my wife, Janet-Louise Sutherland, for her love and
support during this long and arduous undertaking, and for proof-reading numerous versions
of this thesis.

TABLE OF CONTENTS
CHAYfER 1: INTRODUCTION
1.1 1.2 1.3 1.4
South African heavy mineral deposits The iron-titanium oxides Scope and objectives Outline of thesis
vi
1
1 3 4 5
CHAYfER 2: THE GEOLOGY, MINING AND USES OF TITANIUM 7
2.1 2.2 2.2.1 2.2.2 2.2.3 2.3 2.3.1 2.3.2 2.4 2.4.1 2.4.2 2.5
Titanium - the metal Mineralogical and geological occurrence Mineralogy Igneous rock deposits Sedimentary deposits (mineral sands) Mining and recovery of titanium General methods Mineral processing at RBM Uses of titanium Pigment production Other uses of titanium Production of titanium minerals and products
7 8 8
11 13 19 19 20 22 22 24 25
CHAYfER 3: GEOLOGICAL AND GEOMORPHOLOGICAL SETTING 33
3.1 3.2 3.2.1 3.2.2 3.2.3 3.2.4 3.2.5 3.2.6 3.2.7 3.3 3.3.1 3.3.2 3.3.3 3.3.4 3.4 3.4.1 3.4.1.1 3.4.1.2 3.4.2
Introduction Regional Geology Kaapvaal Province Natal Metamorphic Province Natal Group Karoo Sequence Cretaceous Period Cainozoic sediments Outline of source rocks of heavy minerals Geomorphology of the study area General characteristics Zululand Natal-Transkei Eastern Cape Geological setting of the heavy mineral deposits Zululand coastal dune deposits Port Durnford - Cape St Lucia Cape St Lucia - Kosi Bay Older inland dune cordons in Zululand
33 33 34 34 34 34 35 36 37 38 38 40 42 45 45 47 47 49 49

3.4.3 3.4.4 3.5
TABLE OF CONTENTS (Continued)
Natal - Transkei Eastern Cape Formation of heavy mineral placer deposits
CHAPfER 4: SAMPLING AND ANALYTICAL TECHNIQUES
4.1 4.1.1 4.1.2 4.2 4.2.1 4.2.2 4.2.3 4.3 4.3.1 4.3.2 4.3.3 4.3.4 4.3.5 4.3.6
Sampling Description of samples Sample localities Sample preparation General preparation Detailed preparation Rock Samples Analytical methods Microscopy Point counting techniques Scanning electron microscopy Electron microprobe analysis X-ray diffraction studies Transmission electron microscopy
CHAPfER 5: MINERAWGY OF THE IRON-TITANIUM OXIDES
5.1 5.2 5.2.1 5.2.2 5.3 5.4 5.4.1 5.4.2 5.4.3 5.5 5.5.1 5.5.2 5.5.3 5.6 5.6.1 5.6.2 5.6.3 5.7 5.8
Introduction Nomenclature of the iron-titanium oxides Mineral nomenclature Grain nomenclature The iron-titanium oxides The Ti02 polymorphs: rutile, anatase and brookite Structure Mineral chemistry Mineral petrography Ilmenite-hematite series Structure Ilmenite-hematite chemistry Petrography of the ilmenite-hematite series Magnetite-ulvDspinel series Structure Mineral chemistry Petrography of magnetite-ulvDspinel series Other Titanium-rich minerals Discussion
vii
51 52 53
55
55 55 56 56 56 57 60 60 60 60 61 63 64 64
65
65 65 66 69 71 77 77 77 78 84 84 86 91 99 99 99
105 108 109
TABLE OF CONTENTS (Continued)
CHAPTER 6: mE ALTERATION OF ILMENITE
6.1 6.2 6.2.1 6.2.2 6.2.3 6.3 6.3.1 6.3.2 6.3.3 6.3.4 6.3.5 6.3.6 6.4 6.4.1 6.4.2 6.4.3 6.4.4 6.5 6.5.1 6.5.2 6.5.3 6.6
Introduction Previous work The mechanisms of ilmenite alteration Chemical changes accompanying ilmenite weathering Physical changes accompanying ilmenite weathering Electron microscopy study of .ilmenite weathering The relationship between pseudorutile and ilmenite Experimental Analytical techniques
· Petrography and chemistry of the concentrates Transmission electron microscopy
· Conclusions Alteration of ilmenite in the study area Ilmenite mineralogy and alteration Type I alteration Type 11 alteration Type III alteration Paragenesis of ilmenite alteration Evidence for in situ alteration in placer deposits Evidence for multistage alteration of ilmenite Dis~ussion: a I,llultistage model of ilmenite alteration The effect of alteration on ilmenite quality
viii
118
118 118 118 121 122 125 126 128 128 129 129 141 147 147 149 154 155 158 158 159 160 163
CHAPTER 7: PROVENANCE OF TI:IE IRON-TITANIUM OXIDES 167
7.1 7.2 7.3 7.4 7.4.1 7.4.1.1 7.4.1.2 7.4.1.3 7.4.1.4 7.4.1.5 7.4.2 7.4.2.1 7.4.2.2 7.4.2.3 7.4.2.4 7.5 7.5.1 7.5.2 7.5.3 7.5.4
Introduction Fe-Ti Oxides as provenance indicators - previous work Method of study Source rocks of iron-titanium oxides in the study area
· Natal Basement Rocks Kaapvaal Craton Natal Metamorphic Province Mafic metamorphic rocks Felsic metamorphic rocks Ultrabasic and basic complexes Karoo Igneous Province The Stormberg basalts Dolerite intrusions Gabbro and Picrite Rhyolite and other igneous rocks Ilmenite composition as a provenance indicator Method Ilmenite compositions in source rocks Distinguishing ilmenite from different source rocks Provenance of ilmenite in coastal sediments
167 167 170 172 173 173 175 177 178 179 180 180 182 183 184 184 184 185 193 196

7.6 7.6.1 7.6.2 7.7 7.7.1 7.7.2 7.7.3 7.7.4 7.7.5 7.8
TABLE OF CONTENTS (Continued)
Magnetite chemistry as a provenance indicator Method Magnetite compositions in source rocks Proportions of iron-titanium oxides in source rocks Modal proportions in source rocks The ilmenite-magnetite discrimination diagram The application of the ilmenite-magnetite diagram The magnetite discrimination diagram Application of the magnetite discrimination diagram Conclusions
ix
201 201 202 209 209 210 216 220 220 223
8: IRON-TITANIUM OXIDE VARIATIONS IN COASTAL SEDIMENTS 225
8.1 8.2 8.2.1 8.2.2 8.2.3 8.3 8.3.1 8.3.2 8.3.3 8.4 8.4.1 8.4.2 8.4.3 8.5 8.5.1 8.5.2 8.6 8.6.1 8.6.2
Introduction Variations in dunes and beaches
. The heavy mineral suites Grain size distribution and mineral proportions Iron-titanium oxide differences Variations between sediments of different ages Differences in the heavy mineral suites Influence of age and weathering on ilmenite alteration Reasons for differences in alteration .. '. .' Provenance and regional variations The influence of provenance on chemical composition The influence of provenance on petrographic textures The influence of provenance on the distribution of rutile The quality of ilmenite concentrates Chemical compositions of the concentrates Comparison with other ilmenite deposits The genesis of mineral assemblages and ore-bodies A model for ilmenite and magnetite variations Formation of the heavy mineral deposits
CHAPTER 9: SUMMARY AND CONCLUSIONS
9.1 9.2 9.3 9.3.1 9.4 9.5
Geological setting Iron-titanium oxide mineralogy Ilmenite alteration Alteration of ilmenite in older sediments Provenance of the iron-titanium oxides Variations in coastal sediments
REFERENCES
APPENDICES
225 225 225 229 234 237 237 237 243 244 244 250 253 257 257 265 267 267 268
271
271 272 273 274 275 276
277
299

v
Ms D. Meth, Ms A. Pietersen (nee Turner), Mrs L. Turner and Mr G. Milne of the
University of Natal, Durban for providing various samples.
Mr J. Barnes of RBM who supplied a number of borehole samples and proof-read parts
of the final manuscript.
All the staff members at RBM who helped with sample preparation and analyses.
Messrs G. Chetty and V. Pakkirri, of the Department of Geology, University of Natal, for
preparing numerous polished thin-sections.
Dr Peter Heaney and Dr Gordon Nord for teaching me the "art" of transmission electron
microscopy and for enlightening discussions about mineralogy, geology in general, world
politics, and the quality of English beer.
I am also in debt to my parents who selflessly supported me through much of , my
university studies and who have waited patiently for me to finish my doctorate. Finally,
I reserve my deepest gratitude for my wife, Janet-Louise Sutherland, for her love and
support during this long and arduous undertaking, and for proof-reading numerous versions
of this thesis.


""._ 11_]
TABLE OF CONTENTS
CHAPI'ER 1: INTRODUCTION
1.1 1.2 1.3 1.4
South African heavy mineral deposits The iron-titanium oxides Scope and objectives Outline of thesis
vi
1
1 3 4 5
CHAPI'ER 2: THE GEOLOGY, MINING AND USES OF TITANIUM 7
2.1 2.2 2.2.1 2.2.2 2.2.3 2.3 2.3.1 2.3.2 2.4 2.4.1 2.4.2 2.5
Titanium - the metal Mineralogical and geological occurrence Mineralogy Igneous rock deposits Sedimentary deposits (mineral sands) Mining and recovery of titanium General methods Mineral processing at RBM Uses of titanium Pigment production Other uses of titanium Production of titanium minerals and products
7 8 8
11 13 19 19 20 22 22 24 25
CHAPI'ER 3: GEOLOGICAL AND GEOMORPHOLOGICAL SETTING 33
3.1 3.2 3.2.1 3.2.2 3.2.3 3.2.4 3.2.5 3.2.6 3.2.7 3.3 3.3.1 3.3.2 3.3.3 3.3.4 3.4 3.4.1 3.4.1.1 3.4.1.2 3.4.2
Introduction Regional Geology Kaapvaal Province Natal Metamorphic Province Natal Group Karoo Sequence Cretaceous Period Cainozoic sediments Outline of source rocks of heavy minerals Geomorphology of the study area General characteristics Zululand Natal-Transkei Eastern Cape Geological setting of the heavy mineral deposits Zululand coastal dune deposits Port Durnford - Cape St Lucia Cape St Lucia - Kosi Bay Older inland dune cordons in Zululand
33 33 34 34 34 34 35 36 37 38 38 40 42 45 45 47 47 49 49


3.4.3 3.4.4 3.5
TABLE OF CONTENTS (Continued)
Natal - Transkei Eastern Cape Formation of heavy mineral placer deposits
CHAPTER 4: SAMPLING AND ANALYTICAL TECHNIQUES
4.1 4.1.1 4.1.2 4.2 4.2.1 4.2.2 4.2.3 4.3 4.3.1 4.3.2 4.3.3 4.3.4 4.3.5 4.3.6
Sampling Description of samples Sample localities Sample preparation General preparation Detailed preparation Rock Samples Analytical methods Microscopy Point counting techniques Scanning electron microscopy Electron microprobe analysis X-ray diffraction studies Transmission electron microscopy
CHAPTER 5: MlNERAWGY OF THE IRON-TITANIUM OXIDES
5.1 5.2 5.2.1 5.2.2 5.3 5.4 5.4.1 5.4.2 5.4.3 5.5 5.5.1 5.5.2 5.5.3 5.6 5.6.1 5.6.2 5.6.3 5.7 5.8
Introduction Nomenclature of the iron-titanium oxides Mineral nomenclature Grain nomenclature The iron-titanium oxides The TiOz polymorphs: rutile, anatase and brookite Structure Mineral chemistry Mineral petrography llnienite-hematite series Structure llmenite-hematite chemistry Petrography of the ilmenite-hematite series Magnetite-ulvospinel series Structure Mineral chemistry Petrography of magnetite-ulvospinel series Other Titanium-rich minerals Discussion
vii
51 52 53
55
55 55 56 56 56 57 60 60 60 60 61 63 64 64
65
65 65 66 69 71 77 77 77 78 84 84 86 91 99 99 99
105 108 109

..

TABLE OF CONTENTS (Continued)
CHAPfER 6: mE ALTERATION OF ILMENITE
6.1 6.2 6.2.1 6.2.2 6.2.3 6.3 6.3.1 6.3.2 6.3.3 6.3.4 6.3.5 6.3.6 6.4 6.4.1 6.4.2 6.4.3 6.4.4 6.5 6.5.1 6.5.2 6.5.3 6.6
Introduction Previous work The mechanisms of ilmenite alteration Chemical changes accompanying ilmenite weathering Physical changes accompanying ilmenite weathering Electron microscopy study of.ilmenite weathering The relationship between pseudorutile and ilmenite Experimental Analytical techniques Petrography and chemistry of the concentrates Transmission electron microscopy
. Conclusions Alteration of ilmenite in the study area Ilmenite mineralogy and alteration Type I alteration Type II alteration Type III alteration Paragenesis of ilmenite alteration Evidence for in situ alteration in placer deposits Evidence for multistage alteration of ilmenite Disqlssion: a multistage .model of ilmenite alteration The effect of alteration on ilmenite quality
viii
118
118 118 118 121 122 125 126 128 128 129 129 141 147 147 149 154 155 158 158 159 160 163
CHAPfER 7: PROVENANCE OF mE IRON-TITANIUM OXIDES 167
7.1 7.2 7.3 7.4 7.4.1 7.4.1.1 7.4.1.2 7.4.1.3 7.4.1.4 7.4.1.5 7.4.2 7.4.2.1 7.4.2.2 7.4.2.3 7.4.2.4 7.5 7.5.1 7.5.2 7.5.3 7.5.4
Introduction Fe-Ti Oxides as provenance indicators - previous work Method of study Source rocks of iron-titanium oxides in the study area
. Natal Basement Rocks Kaapvaal Craton Natal Metamorphic Province Mafic metamorphic rocks Felsic metamorphic rocks Ultrabasic and basic complexes Karoo Igneous Province The Stormberg basalts Dolerite intrusions Gabbro and Picrite Rhyolite and other igneous rocks Ilmenite composition as a provenance indicator Method Ilmenite compositions in source rocks Distinguishing ilmenite from different source rocks Provenance of ilmenite in coastal sediments
167 167 170 172 173 173 175 177 178 179 180 180 182 183 184 184 184 185 193 196


7.6 7.6.1 7.6.2 7.7 7.7.1 7.7.2 7.7.3 7.7.4 7.7.5 7.8
TABLE OF CONTENTS (Continued)
Magnetite chemistry as a provenance indicator Method Magnetite compositions in source rocks Proportions of iron-titanium oxides in source rocks Modal proportions in source rocks The ilmenite-magnetite discrimination diagram The application of the ilmenite-magnetite diagram The magnetite discrimination diagram Application of the magnetite discrimination diagram Conclusions
ix
201 201 202 209 209 210 216 220 220 223
8: IRON-TITANIUM OXIDE VARIATIONS IN COASTAL SEDIMENTS 225
8.1 8.2 8.2.1 8.2.2 8.2.3 8.3 8.3.1 8.3.2 8.3.3 8.4 8.4.1 8.4.2 8.4.3 8.5 8.5.1 8.5.2 8.6 8.6.1 8.6.2
Introduction Variations in dunes and beaches
. The heavy mineral suites Grain size distribution and mineral proportions Iron-titanium oxide differences Variations between sediments of different ages Differences in the heavy mineral suites Influence of age and weathering on ilmenite alteration Reasons for differences in alteration Provenance and regional variations The influence of provenance on chemical composition The influence of provenance on petrographic textures The influence of provenance on the distribution of rutile The quality of ilmenite concentrates Chemical compositions of the concentrates Comparison with other ilmenite deposits The genesis of mineral assemblages and ore-bodies A model for ilmenite and magnetite variations Formation of the heavy mineral deposits
CHAPTER 9: SUMMARY AND CONCLUSIONS
9.1 9.2 9.3 9.3.1 9.4 9.5
Geological setting Iron-titanium oxide mineralogy Ilmenite alteration Alteration of ilmenite in older sediments Provenance of the iron-titanium oxides Variations in coastal sediments
REFERENCES
APPENDICES
225 225 225 229 234 237 237 237 243 244 244 250 253 257 257 265 267 267 268
271
271 272 273 274 275 276
277
299


1
CHAPfERONE
INTRODUCTION
1.1 SOUTH AFRICAN HEAVY MINERAL DEPOSITS
The presence of heavy minerals in beaches and dunes along the coastline of South Africa ... ~
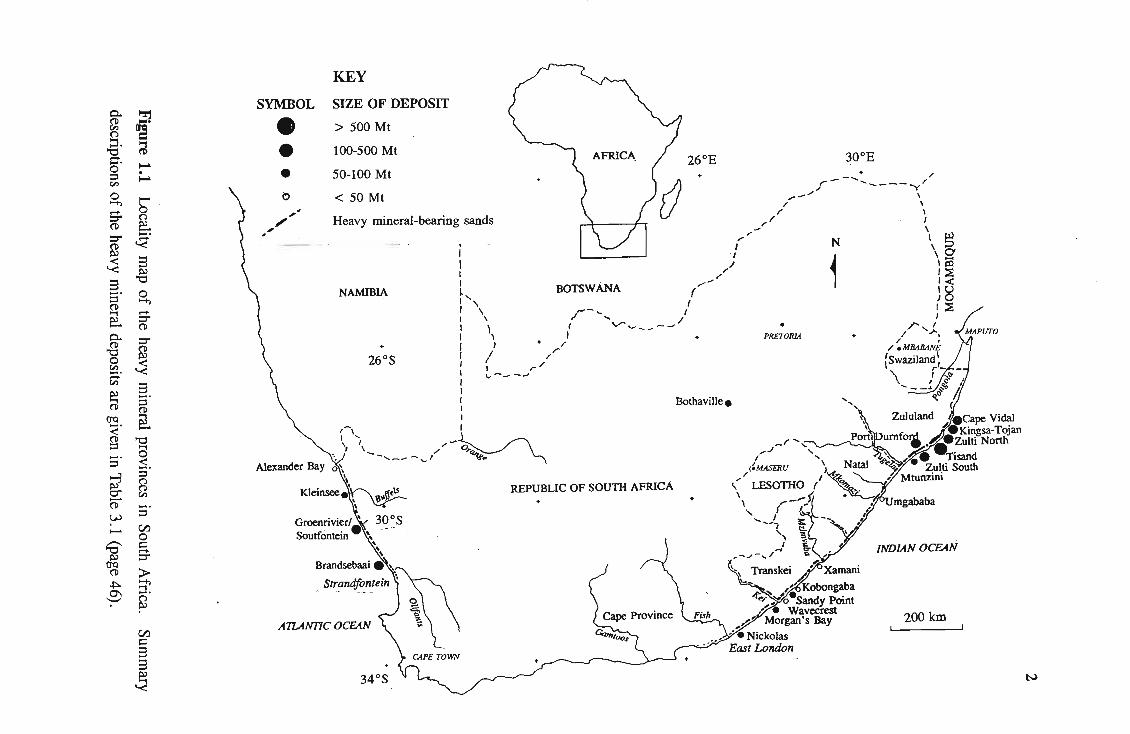
was discovered in the 1920's (MacPherson, 1982). Heavy mineral deposits are found
along the east coast between East London and the Mocambique border, and from
Strandfontein to the Orange River mouth along the west coast (Figure 1.1). Demonstrated
resources of heavy mineral sands containing ilmenite, rutile, and zircon along the east
coast are estimated at 2476 million tons (Wipplinger, 1985). Along the west coast
demonstrated resources containing the above minerals are estimated at well over 100
million tons of heavy mineral sands (Wipplinger, 1985).
Heavy mineral deposits have been mined at Umgababa (1960's) and Morgan's Bay (1950's
and 1960's) in the past, although these operations were short-lived. The Late Pleistocene
Holocene dunes north of Richards Bay are the only deposit presently being mined.
However, a number of companies are either exploring for deposits, or engaged in
feasibility studies of lease areas in southern Africa. The production of ilmenite, rutile and
zircon has grown steadily since mining operations began at Richards Bay, so that in 1990
South Africa produced 700 000 tonnes of titanium-slag (a beneficiated product of ilmenite),
70 000 tonnes of rutile (Heap, 1991) and 150 000 tonnes of zircon (Slddmore, 1991).
After Australia, the country is presently the second largest producer of titanium feed stocks
and zircon in the western world. Despite this, very little research has been done on the
heavy mineral deposits of South Africa and no specific study of the mineralogy of the
titanium-bearing heavy minerals has been undertaken.
p.. ~ (I) !re tIl
(") = "'1
~ _. 'g.
~ 0 . ::l ~ tIl
0 b .......
9- (")
(I) e:.. ..... ::r .... ~ '< <: :3 '< ~ 8 ..... 0 ::l ....... (I)
9-"'1
e:.. (I)
p.. ::r .g ~ 0
tIl '< _ . .... tIl 8 ~ .....
::l (I) (I) (J'Q e. _. <:
'0 (I) ::l "'1
0 ..... <: ::l .....
~ ::l (")
~ (I) tIl .........
(I) _.
W ::l Cl) ......... 0
~ ~
~ 9-(J'Q
:> (I)
~ ::t' 0\ ,....
(") ~
~
Cl) ~
3 3 ~
'<
KEY SYMBOL SIZE OF DEPOSIT
.'
• > 500Mt
• 100-500 Mt AFRICA. 26°E 300 E
• <:>
" ,,-
50-100 Mt
< 50 Mt
+ --..... + /
"...-/.r- -----"\' , \ ~ \
,~ I /~ \
Heavy mineral-bearing sands rJ
NAMIBIA
+
26°S
i "-" ( N \~ I ! 1 \9' I " ,~ I ' ,~ ~ BOTSWANA (/~ ,< I' I U I '\ ..,_ ( J 0 I \ " ........ I ' ~ I \ I "'--..... ~ ~/. ' ," I - ~ I I /' fIr I ( //' , ~ __ _ ..,r , f f , I
PRETORIA
Bothaville. "",
I~\ _~' \ ,,/' 0" -- ...... __ -,-I ~ocf'«!"
-, ....... , ,..J ,
I ' <'MASERU \
REPUBLIC OF SOUTH AFRICA +
,.. J,
.: LESOTHO /
" ,...-"f/ f ' " I ................ ,
" I
,--,-,/~ =-. ..:
\ .. " Transkei b" Xamani
"" ,." Kobongaba ~'~:-'o -simdy Point .' - Wavecrest
INDIAN OCEAN
A7UNTIC OCEAN ,1;" Morgan's Bay
.... Nickolas
200 km
East London
34°S N

Introduction 3
1.2 THE mON-TITANIUM OXIDES
Titanium-bearing minerals of the system FeO-F~03-Ti02 are ubiquitous to the heavy
mineral deposits of South Africa. Ilmenite (Fe2+Ti4+03) and rutile (TiOJ are the most
important minerals. The first is the most abundant economic mineral in the deposits, and
is the largest global resource of titanium. Rutile, although less abundant, is still the major
feed used in the production of titanium sponge metal and Ti02 pigment by the chloride
process.
Ilmenite has a wide range of chemical compositions because Mg2+, Mn2+ and Fe3 + can
substitute for Fe2+ in the ilmenite structure. The mineral may also contain small quantities
of Cr, Zn, Cu, AI, Si and Ca. High levels of these elements lower the quality of an
ilmenite concentrate because they decrease the grade of TiOz and represent unwanted
impurities in titanium feedstocks. The mineral also forms a large variety of intergrowths
with other iron-titanium oxides as a result of ex solution , oxidation or hydrothermal
processes. Ilmenite "locked" with these phases have different chemical compositions and
physical properties to homogeneous ilmenite. Furthermore, ilmenite undergoes alteration
in the weathering environment by a process which results in iron being removed from the
ilmenite structure and the consequent enrichment of titanium in altered grains, while the
physical properties of the mineral are changed. It is well established that the magnetic
susceptibility and density of ilmenite decreases as the degree of alteration increases
(Temple, 1966; Wort and Jones, 1981; Frost et al., 1986; Larrett and Spencer, 1971).
A knowledge and understanding of these variations in ilmenite mineralogy is therefore vital
to the exploitation of heavy mineral deposits. It influences not only the grade of deposit,
but also the qUality and recoverability of ilmenite, which is largely dependent on the
chemistry and magnetic susceptibility of the ilmenite grains. In addition, source rocks may
be characterised by ilmenite composition and petrography (as well as those of other iron
titanium oxides such as magnetite). These minerals can therefore be used for provenance
studies as demonstrated by Darby (1984), Basu and Molinaroli (1989) and Grigsby (1990).

Introduction 4
1.3 SCOPE AND OBJECTIVES
This work represents a comprehensive study of titanium-bearing oxides in deposits along
the east coast of South Africa. This study area Was chosen for a number of reasons. The
geological and geographical variations, in source rocks, shoreline morphology and climatic
conditions along this coastline, were expected to lead to variations in the titanium-bearing
minerals and the heavy mineral suites. The deposits are accessible and easy to sample
whereas access to many of the west coast deposits is restricted as they are within the lease
areas of diamond mines. Furthermore, the mining operation at Richards Bay provides a
"type deposit" with which other east coast deposits can be compared in terms of mineral
quality and recoverability. Although this work focuses on titanium-bearing oxides in the
east coast deposits, some comparisons are made with minerals from the west coast, and
from other countries, such as Australia and North America.
The overall objective of this work is to gain a greater knowledge and understanding of the
chemical and physical properties of the titanium-bearing oxides in heavy mineral deposits.
This will aid the exploration for, and recovery of, the strategic metal titanium. The study
is largely qualitative and no attempt is made to provide quantitative data concerning the
grade and size of deposits. The following aspects of the titanium-bearing oxides are
covered:
1. A mineralogical description of these minerals in terms of petrography, chemistry
and physical properties.
2. A description of ilmenite alteration, a study of the degree of alteration in different
environments, and a discussion of alteration mechanisms, compared with those of
previous authors.
3. The determination of the source rocks of the iron-titanium oxides.
4. The determination of variations in the proportions, chemical and physical properties
of titanium-bearing minerals along the coastline and in different types of deposits
(eg. beach and dune).
5. The reasons for the variations mentioned in 4 and the implications these hold for
exploration and exploitation.
Introduction 5
1.4 OUTLINE OF THESIS
Chapter 2 provides an introduction to the geology, mineralogy, production and uses of
titanium. The major rock and sedimentary titanium deposits of the world are outlined and
the South Africa deposits are placed in a global context.
The geological and geomorphological setting of the heavy mineral occurrences of the study
area is outlined in Chapter 3. The coastline is divided into 4 regions, according to
shoreline morphology, geographical setting and provenance, and the heavy mineral
deposits within each of these regions is described. The regional geology of the study area
is described, as this influences the provenance and formation of the deposits. Chapter 4
describes the sampling and analytical techniques used in the study.
The mineralogy of the iron-titanium oxides is described in detail in Chapter 5. Emphasis
is placed on the chemical and petrological variations originating in the source rocks, as
these are preserved during erosion and transportation and provide important clues to the
provenance of the oxide grains.
Chapter 6 describes a study of the alteration of ilmenite in the weathering environment.
This includes a transmission electron microscope study of altered ilmenites from Australia
and South Africa, together with detailed petrographic examination of ilmenite alteration
in the study area. Three types of ilmenite alteration are found in the South African
deposits, and a model is proposed for the paragenesis of altered ilmenite in the coastal
deposits.
The provenance of the iron-titanium oxides is investigated in Chapter 7. Source rocks are
identified and the chemistry and petrography of ilmenite and magnetite is used to
distinguish these minerals from different rock types.

Introduction 6
Chapter 8 describes the variations in heavy minerals and iron-titanium oxides found in the
coastal sediments. The influences of the energy of the depositional environment, age,
geographical location, and provenance are investigated. Finally, a model for the formation I .
of the heavy mineral deposits is proposed. The findings of the study are summarised in
Chapter 9.

7
CHAPfER TWO
THE GEOLOGY, MINING AND USES OF TITANIUM
This chapter serves as a brief introduction to the metal titanium, its mineralogical and
geological occurrence, mining, production and uses. The South African deposits are
placed in a global perspective.
2.1 TITANIUM - mE METAL
Titanium (Z = 22, A = 47.88) is the ninth most abundant of all elements and comprises
0.6 per cent of the earth's crust by weight. It was discovered by William Gregor in 1791 "
(Williams, 1974). The metal has a melting point of 1667°C, is less dense than iron (4.25
g.cm-3 compared to 7.87 g.cm-3 at 20°C), yet is almost as strong as steel and nearly as
resistant to corrosion as platinum (Hammerbeck, 1976). The metal's very high
strength/density ratio makes it ideally suited to the manufacture of strong, light-weight
alloys. This ratio is up to two times that of stainless steels, while some titanium alloys
with characteristics similar to high-strength steel are only 60 per cent as dense (Knittel,
1983).
Titanium dioxide (TiOz) is a white pigment without equal as it has a high opacity, is
chemically inert and non-toxic, and is relatively inexpensive. The pigment is produced by
two methods - the sulphate method, which uses ilmenite as a feed stock and the chloride
method which uses rutile and beneficiated ilmenite products as feed stock. At present the
greatest demand for the metal is as titanium dioxide and only about 5 per cent of titanium
minerals produced is consumed in the production of titanium metal (Towner, 1988).

Geology, mining and uses of titanium 8
2.2 MINERAWGICAL AND GEOWGICAL OCCURRENCE
2.2.1 Mineralogy
Titanium occurs in the crust in two predominant minerals: ilmenite and rutile. Ilmenite
is a common accessory mineral in many igneous and metamorphic rocks. The mineral can
contain up to 6 per cent F~03 (Ramdohr, 1950) and forms an extensive solid solution with
hematite at temperatures above 600°C. Magnesium and manganese may substitute for
ferrous iron in ilmenite, giving rise to the rare end-members geikeilite (MgTi03) and
pyrophanite (MnTi03).
Ilmenite is a common detrital mineral in sediments. In near-surface environments it often
undergoes alteration by a process in which the iron is oxidised and leached from the
ilmenite grain, resulting in the enrichment of titanium until it consists of Ti02, either in
the form of rutile or anatase. Rutile is stable over a wide range of geological conditions
and consequently is a widespread accessory mineral in metamorphic gneisses and schists
and in some igneous rocks such as pegmatites. Its stability and hardness result in rutile
being a common detrital mineral. Other major titanium-bearing minerals include anatase
and brookite (the low temperature polymorphs of rutile), perovskite (CaTi03), sphene
(CaTiSiOs), titanomagnetite and titanohematite. Anatase is usually formed by the
alteration of other titanium minerals, is a minor constituent of some igneous and
metamorphic rocks and is commonly found in granite pegmatites and hydrothermal veins,
or as an authigenic mineral in sediments. Titanium is also found in a number of other
minerals and a summary of the major and minor titanium-bearing minerals is given in
Table 2.1. More detailed descriptions of the common titanium-bearing minerals are given
in Chapter 5.
Titanium mineral deposits have been classified by Force (1991). His classification scheme
is reproduced in Table 2.2 which clearly shows that the most important economic deposits
are those found in igneous rocks and unconsolidated sediments. The world's demonstrated
resources of rutile and ilmenite in these deposits are estimated to be 29 million tonnes and

9
Table 2.1 More common, naturally occurring titanium minerals and their geological occurrence. The silicate minerals - biotite, augite, melanitic garnet, calcic amphiboles -which contain small quantities of titanium are not included in the table.
MinerallTenn Fonnula Ti02 (%)
llmenite FeTi03 45-53
Rutile Ti02 95-100
Anatase Ti02 95-100
Brookite Ti02 95-100
Altered ilmenite FeTi03 - F~ TiP9 53-70
Leucoxene high Ti02 70-100
Titanite (sphene) CaTiSiOs 40
Perovskite CaTi03 58
Pseudobrookite F~TiOs 33
Ulvospinel F~Ti04 36
Titanomagnetite (Fe,Ti)P4 0-34
Titanohematite (Fe,Ti)P3 0-30
Geikielite MgTi03 66
Pyrophanite MnTi03 53
Brannerite (U,Y,Ca,Fe,Th)3Tis016
Geological Occurrence
Common accessory mineral in most igneous and metamorphic rocks. May reach economic proportions in anorthosite and gabbro. Common detrital mineral.
Common accessory in medium to high grade metamorphic rocks, also found in granite pegmatite and as accessory in some ore deposits. Common detrital mineral and alteration product of ilmenite and other titanium minerals.
Low-temperature polymorph of rutile. Usually secondary or authigenic, fonned by the alteration of other titanium minerals. Also found in hydrothennal veins and granite pegmatite.
Metastable polymorph of rutile and anatase. Found in cavities, fissures and veins. Weathering product of other titanium minerals.
Alteration product of ilmenite in sediments. Common phase in altered ilmenite concentrate.
Tenn for the alteration products of ilmenite consisting of mixtures of ilmenite, pseudorutile and leucoxene. Common in heavy mineral sand.
Tenn for high Ti02 alteration products of ilmenite, usually consisting of microcrystalline rutile, or anatase, with minor pseudorutile, ilmenite, hematite or goethite.
Widely distributed accessory mineral in intrusive igneous, low grade metamorphic rocks and as a detrital mineral.
Accessory mineral in subsilicic igneous rocks, chondrite meteorites, contact metamorphic .aureoles in carbonate rocks or marble.
Accessory in rhyolite, quenched dikes, lava flows, and basic igneous rocks. Fonns as an oxidation product of ilmenite and titanomagnetite.
Accessory mineral in basic igneous rocks, usually found as exsolution lamellae in magnetite.
Isostructural with pseudobrookite, occuring as laths in olivine rich rocks.
Tenn for optically homogeneous Fe-Ti spinel containing magnetite and ulvospinel in solid solution. Common accessory in basic igneous rocks
Tenn for optically homogeneous hematite-ilmenite... Common accessory in acid intrusive and anorthosite suites .
Fonns solid-solution series with ilmenite. Ilmenites with high geikielite. contents are common in kimberlite.
Fonns solid-solution series with ilmenite. Ilmenite with high pyrophanite contents is found in intrusive acid suites.
Found in sedimentary uranium deposits.

10
Table 2.2 Classification of titanium-mineral deposits and their economic significance (After Force, 1991).
Class Type Typical Importance l Example Mineralogy
1. Metamorphic a. EcIogite Rutile B Piampaludo, Italy
b. A1uminosilicate Rutile E Evergreen, Colorado
c. Ultramafic contac~ Rutile E Dinning, Maryland
2. Igneous a. Magmatic ilmenite Ilmenite A A1lard Lake, Canada
b. Anorthosite margin Rutile, I1menite C Roseland, Virginia
c. Albitite Rutile E Kragero, Norway
d. Alkalic ' Perovskite, C Powerhom, rutile, brookite Colorado
3. Hydrothermal a. Porphyry Rutile C Bingham, Utah
4. Sedimentary : .... a. Fluvial · -{fr.,":.,!:: , ':: ... Ilmenite, rutile A Sierra Leone
b. Glaciolacustrine IImenite C Port Leydon, New York
d. beach (strandline) IImenite, altered A Eneabba, Australia ilmenite, rutile, leucoxene
e. coastal aeolian Ilmenite, altered A Richards Bay, ilmenite, rutile, South Africa leucoxene
f. lithified palaeo-beach Ilmenite, altered C Bothaville, South ilmenite, rutile, Africa anatase
5. Weathered a. Alkali parent rock Anatase B Tapira, Brazil
b. Mafic parent rock Ilmenite D Roseland, Virginia
c. Placer parent Altered ilmenite, A Trail Ridge, leucoxene Florida (in part)
1 A, of great importance; B, of probable great importance in the near future; C, of possible importance; D, of moderate importance; E, of minor importance.
•
Geology, mining and uses of titanium 11
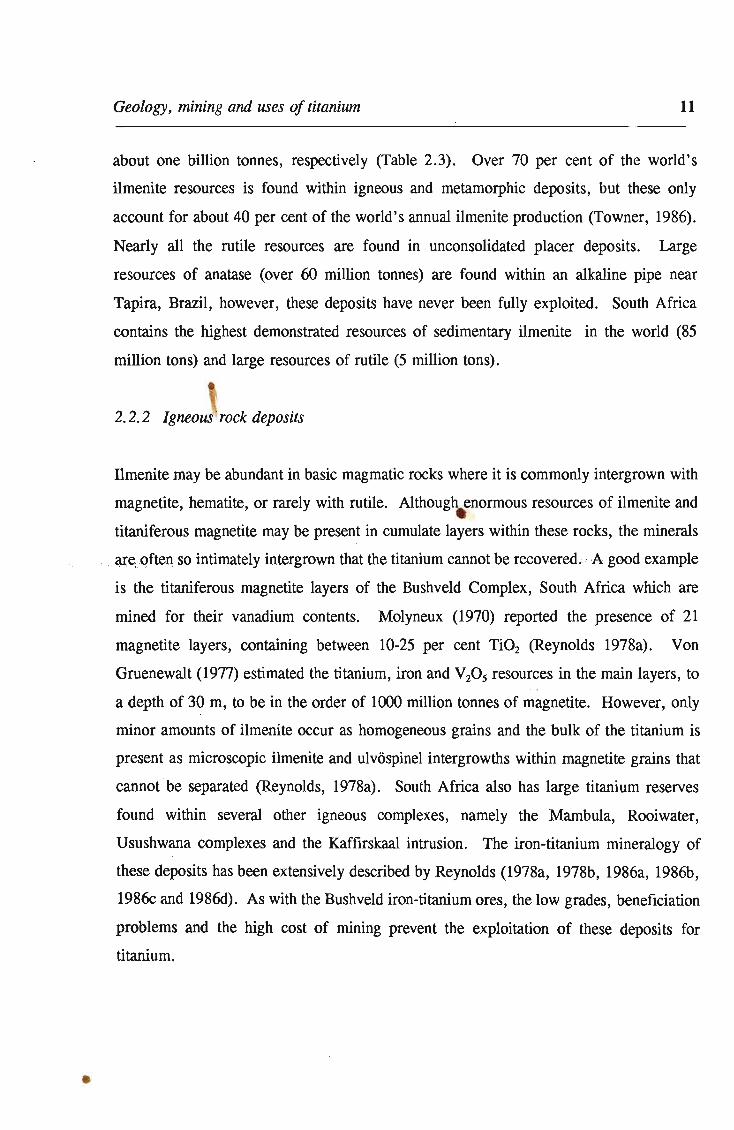
about one billion tonnes, respectively (Table 2.3). Over 70 per cent of the world's
ilmenite resources is found within igneous and metamorphic deposits, but these only
account for about 40 per cent of the world's annual ilmenite production (Towner, 1986).
Nearly all the rutile resources are found in unconsolidated placer deposits. Large
resources of anatase (over 60 million tonnes) are found within an alkaline pipe near
Tapira, Brazil, however, these deposits have never been fully exploited. South Africa
contains the highest demonstrated resources of sedimentary ilmenite in the world (85
million tons) and large resources of rutile (5 million tons).
2.2.2 Igneous rock deposits
Ilmenite may be abundant in basic magmatic rocks where it is commonly intergrown with
magnetite, hematite, or rarely with rutile. Althoug\ enormous resources of ilmenite and
titaniferous magnetite may be present in cumulate layers within these rocks, the minerals
" ,a,.t;'e" ,Qften so intimately intergrown that the titanium cannot be recovered .. A good example
is the titaniferous magnetite layers of the Bushveld Complex, South Africa which are
mined for their vanadium contents. Molyneux (1970) reported the presence of 21
magnetite layers, containing between 10-25 per cent Ti02 (Reynolds 1978a). Von
Gruenewalt (1977) estimated the titanium, iron and V20 S resources in the main layers, to
a depth of 30 m, to be in the order of 1000 million tonnes of magnetite. However, only
minor amounts of ilmenite occur as homogeneous grains and the bulk of the titanium is
present as microscopic ilmenite and ulvospinel intergrowths within magnetite grains that
cannot be separated (Reynolds, 1978a). South Africa also has large titanium reserves
found within several other igneous complexes, namely the Mambula, Rooiwater,
Usushwana complexes and the Kaffirskaal intrusion. The iron-titanium mineralogy of
these deposits has been extensively described by Reynolds (1978a, 1978b, 1986a, 1986b,
1986c and 1986d). As with the Bushveld iron-titanium ores, the low grades, beneficiation
problems and the high cost of mining prevent the exploitation of these deposits for
titanium .
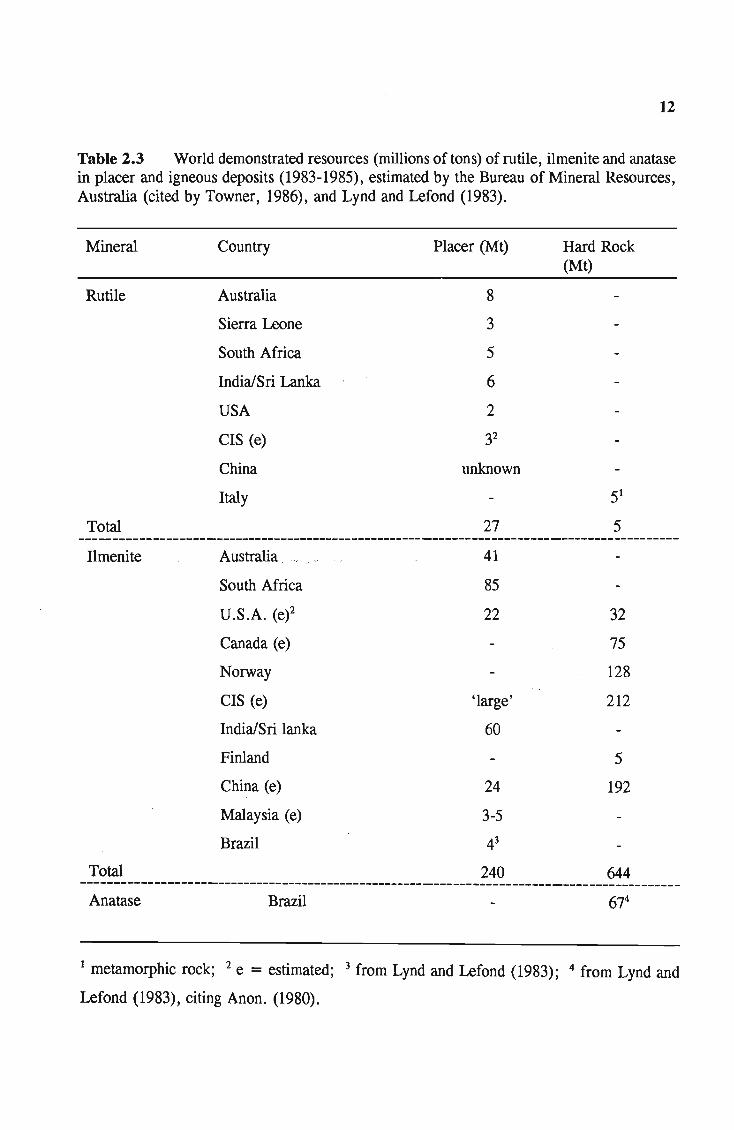
12
Table 2.3 World demonstrated resources (millions of tons) of rutile, ilmenite and anatase in placer and igneous deposits (1983-1985), estimated by the Bureau of Mineral Resources, Australia (cited by Towner, 1986), and Lynd and Lefond (1983).
Mineral Country
Rutile Australia
Sierra Leone
South Africa
India/Sri Lanka
USA
CIS (e)
China
Italy
Total
Ilmenite Australia " "",
South Africa
U.S.A. (e)2
Canada (e)
Norway
CIS (e)
India/Sri lanka
Finland
China (e)
Malaysia (e)
Brazil
Total
Placer (Mt)
8
3
5
6
2
32
unknown
27
41
85
22
'large'
60
24
3-5
240
Hard Rock (Mt)
51
5
32
75
128
212
5
192
644 ---------------------------------------------------------------------------------------------
Anatase Brazil
1 metamorphic rock; 2 e = estimated; 3 from Lynd and Lefond (1983); 4 from Lynd and
Lefond (1983), citing Anon. (1980).
- '''')
Geology, mining and uses of titanium 13
Nearly all the economic titanium rock deposits mined at present are found within
Precambrian andesine anorthosite massifs (Herz, 1976a). Titanium oxides in these rocks
include ilmenite, ilmeno-hematite, ilmeno-magnetite, titanomagnetite, rutile and ulvQspinel
(Budding ton et al., 1963). Where ilmenite is associated with magnetite these minerals
form granular intergrowths, which produce concentrates consisting of homogeneous grains.
In deposits where ilmenite is associated with hematite these minerals are intimately
intergrown due to ex solution and yield ilmeno-hematite or hemo-ilmenite concentrates
(Lynd and Lefond, 1983). A brief description of the more important igneous titanium
deposits is given in Table 2.4.
Titanium rock deposits consisting of minerals other than ilmenite are also found, but are
far less common and few have been mined. Large resources of anatase and ilmenite are
found in a carbonatite pipe, some 6 km in diameter, situated at Tapira, 50 km southeast
of Araxa, Brazil (Herz, 1976b). A deposit in southwestern Colorado is estimated to
.@~t;ajRal>out 50 million tonnes of Ti02 in the form of perovskite (Thompsofl,·1977). More
detailed descriptions of titanium minerals found in other rock deposits are given by Force
(1976) and Force (1991).
2.2.3 Sedimentary deposits (mineral sands)
Through the processes of weathering and erosion, titanium-bearing minerals are released
from the crystalline rocks in which they formed and introduced into fluvial systems which
transport the minerals to coastlines. Deposition of these minerals may occur in a number
of sedimentary environments, but economic concentrations are most common in beach and
dune deposits, formed by wave and wind action respectively. The mechanisms of
concentration are described in greater detail in Chapter 3. The sedimentary deposits may
be classified into the following types according to sedimentary environment and state of
lithification, after Macpherson and Masters (1983):
. 1. Marine shoreline placers - the heavy minerals are usually concentrated in flat-lying
beds or ribbons in beach, near-shore and, less frequently, estuarine environments,
which often cannot be distinguished from each other (Baxter, 1977).

Table 2.4 Description of major igneous titanium deposits. Large deposits are also found in China (Brady, 1981) and in the Ural Mountains, Ukraine, but no published data of these deposits is available.
Deposit Host Rock Type Ore Genesis
Allard Lake District, Precambian anorthosite late magmatic segregation and Quebec, Canada and gabbroic anorthosite injection into fractures within Lac Tio = major in the Morin series cooling anorthosite. deposit disseminated ore bodies
represent magmas, in which incomplete segregation occurred
Storgangen, Tellnes Precambrian Egersund- magmatic differentation from and Rodsand deposits, Ogna anorthosite massif same leuconorite magma as southwestern Norway surrounding anorthosite, and
intrusion into earlier-formed anorthosites
Sanford Lake orebodies located within magmatic segregation as a District, Adirondack anorthosite and gabbro in result of gravitation segregation Mountains, USA large anorthositic massif and filter-pressing of the
residual melt by injection into the wall-rock
Otanmaki deposit, orebodies occur in intrusive bodies of ilmenite and Finland hundreds of lenses located magnetite
along the contacts between amphibolite and anorthosite of the Otanmaki complex
Mineral Assemblage
massive, coarse-grained ilmenite-hematite lodes in anorthosite; disseminated Ti-magnetite, ilmenite-hematite •• in gabbroic rock
ilmenite with minor ex solved hematite and granular magnetite
ilmenite associated with titaniferous magnetite and minor ulvospinel
ilmenite associated with granular magnetite, minor ilmenite-hematite ..
Grades/Resources
100 Mt of ilmenite containing 32 per cent Ti02 and 36 % Fe
Tellnes deposit - about 200 Mt of ilmenite containing about 45 % Ti02, 34 % FeO and 12.5 % F~03.
Grades range from 9.5 to 30 % Ti02• 0.5 % V20 S occurs within magnetite
25 Mt containing about 30 % ilmenite and 40 % magnetite, 0.26 % V20 S
References
Rose (1969), Hammond (1952), Gillson (1932)
Geis (1971), Dybdahl(1960) , Bugge (1978), Anon (1978)
Buddington et al. (1955), Evrand (1949)
Harki (1956). Isokangas (1978)
~ .,.

Geology, mining and uses of titanium 15
2. Aoolian - the heavy minerals occur disseminated throughout dunes or concentrated
in stringers along dune foresets.
3. Alluvial placers - these are less common than the previous two types of deposit,
but economic occurrences are known to occur, for example, the rutile deposits
mined in Sierra Leone and the tin deposits in Malaysia, which produce ilmenite as
a by-product.
4. Lacustrine - such deposits are uncommon, but an example is the Lake Huron
deposits, Canada (Martini, 1975).
5. Palaeo-placers - these may consist of either the lithified or unlithified equivalents
of the above deposits, which have been preserved for a sufficient period to allow
for lithological changes to occur, .such as lithification, or mineral alteration which
results in iron staining of grains and the increase in clay content in deposits. Such
deposits are usually found some distance from present day coastlines. The fossil
beach deposits in the Vryheid Formation (Karoo Sequence) are an example of
lithified palaeo-placer deposits (Behr, 1965; Behr, 1986)
Some features of important sedimentary deposits are summarised in Table 2.5. Although
the Ti02 composition of unaltered ilmenite is between 45 to 52 per cent, the Ti02 contents
of ilmenite concentrates from different deposits may be much higher (up to 70 %)
depending on the degree of alteration of ilmenite in the deposIt. Further information
concerning these deposits may be found in Lynd and Lefond (1983) and Force (1991), who
describe the major world occurrences in detail.
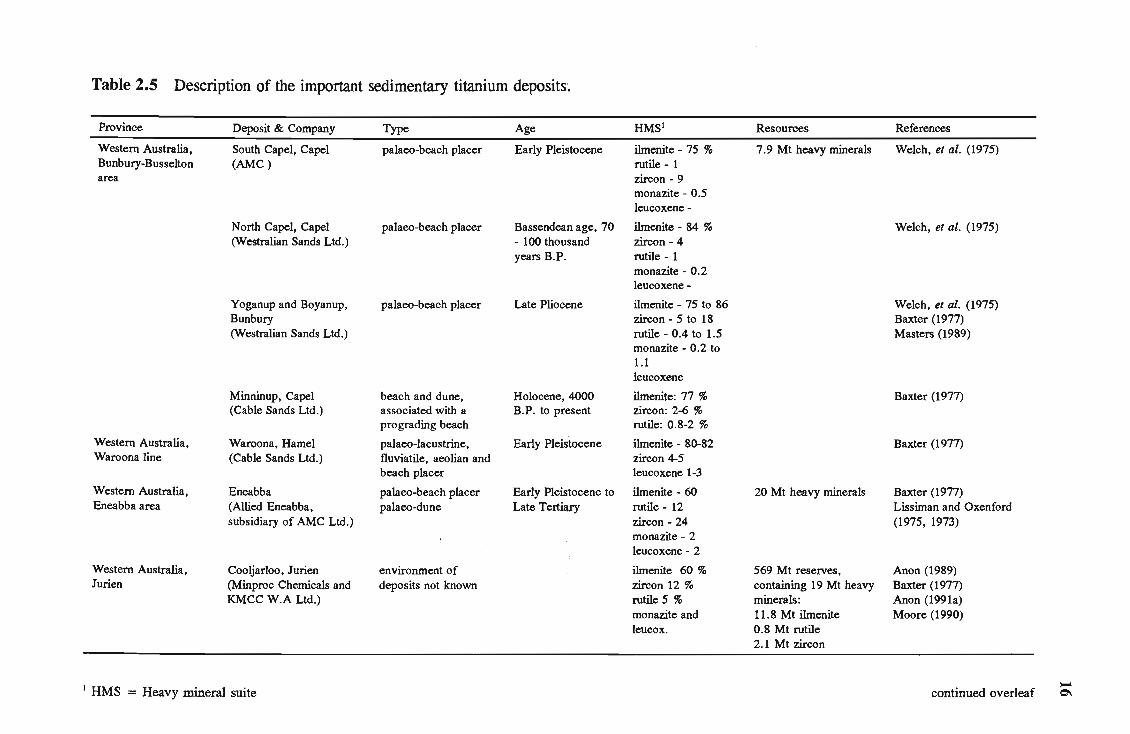
Table 2.5 Description of the important sedimentary titanium deposits'.
Province Deposit & Company Type Age
Western Australia, South Capel, Capel palaeo-beach placer Early Pleistocene Bunbury-Busselton (AMC) area
North Capel, Capel palaeo-beach placer Bassendean age, 70 (Westralian Sands Ltd.) - 100 thousand
years B.P.
Yoganup and Boyanup, palaeo-beach placer Late Pliocene Bunbury (Westralian Sands Ltd.)
Minninup, Capel beach and dune, Holocene, 4000 (Cable Sands Ltd.) associated with a B. P. to present
prograding beach
Western Australia, Waroona, Hamel palaeo-Iacustrine, Early Pleistocene Waroona line (Cable Sands Ltd.) fluviatile, aeolian and
beach placer
Western Australia, Eneabba palaeo-beach placer Early Pleistocene to Eneabba area (Allied Eneabba, palaeo-dune Late Tertiary
subsidiary of AMC Ltd.)
Western Australia, Cooljarloo, Jurien environment of Jurien (Minproc Chemicals and deposits not known
KMCC W.A Ltd.)
1 HMS = Heavy mineral suite
HMS1
ilmenite - 75 % rutile - 1 zircon - 9 monazite - 0.5 leucoxene -
ilmenite - 84 % zircon - 4 rutile - 1 monazite - 0.2 leucoxene-
ilmenite - 75 to 86 zircon - 5 to 18 rutile - 0.4 to 1.5 monazite - 0.2 to 1.1 leucoxene
ilmenite: 77 % zircon: 2-6 % rutile: 0.8-2 %
ilmenite - 80-82 zircon 4-5 leucoxene 1-3
ilmenite - 60 rutile - 12 zircon - 24 monazite - 2 leucoxene - 2
ilmenite 60 % zircon 12 % rutile 5 % monazite and leucox.
Resources
7.9 Mt heavy minerals
20 Mt heavy minerals
569 Mt reserves, containing 19 Mt heavy minerals: 11.8 Mt ilmenite 0.8 Mt rutile 2.1 Mt zircon
References
Welch, et al. (1975)
Welch, et al. (1975)
Welch, et al. (1975) Baxter (1977) Masters (1989)
Baxter (1977)
Baxter (1977)
Baxter (1977) Lissiman and Oxenford (1975, 1973)
Anon (1989) Baxter (1977) Anon (1991a) Moore (1990)
continued overleaf I-" Q\

Table 2.5 Description of important sedimentary titanium deposits (cont.)
Province Deposit & Company Type Age
Eastern Australia, North Stradbroke Island, beach strandIines, Pleistocene Queensland3 Brisbane (CRL2) coastal dunes,
transgressive dune systems
Eastern Australia, Tomago, Newcastle beach barrier, aeolian Pleistocene to New South Wales4 (R.Z. Mines Ltd.) deposits Holocene, 140000
to 6000 years B.P.
Stockton and Viney Creek aeolian (Mineral Deposits Ltd.)
South Africa Richards Bay, Natal aeolian Late Pleistocene to (RBM) Holocene
Brandsebaai, placer, Late Miocene to Vanrhynsdorp (AAC- aeolian cover sands Holocene project in development)
Sierra Leone Mogbwemo, Sherbo River alluvial Tertiary and (Sierra Rutile Ltd.) Pleistocene
India Manavalakurichi beach placer
Quilon, Kerala barrier beach, aeolian (Kerala Minerals and Metals Ltd.)
Chatrapur, Oris sa State (Indian Rare Earths)
1 HMS = Heavy mineral suite
HMS!
ilmenite 50 % rutile 16 % zircon 12 %
ilmenite rutile zircon monazite
ilmenite rutile zircon monazite
ilmenite: 50 % zircon: 3 % rutile: 7 % monazite: < 0.5 %
zircon: 9 % ilmenite: 26 % rutile: 1-2 % (garnet:43 %)
rutile (ilmenite)
ilmenite
ilmenite
Resources
1.5 Mt rutile 1.4 Mt zircon (1985)
0.35 Mt rutile 0.4 Mt zircon 0.15 Mt ilmenite
43 000 t rutile 17 000 t zircon
37 Mt ilmenite 4.8 Mt zircon 2.1 Mt rutile
400 Mt heavy mineral sands
Up to 30 Mt sand, containing 2-3 % rutile
Up to 80 % heavy minerals in beach sands
References
McKellar (1975) Towner (1986) Blaskett and Hudson (1967)
Suttill (1987)
Fockema (1986) MacPherson (1982) Hugo (1988)
Anon (1991b) Coetzee (1957) Smyth (1992) Anon (1992b)
Spencer and WilIiams (1964) Anon. (1981)
Lynd and Lefond (1983)
Lynd et al., (1954).
continued overleaf ~ ....,J

Table 2.5 Description of important sedimentary titanium deposits (cont.)
Province Deposit & Company Type Age
United States of Trail Ridge, Florida palaeo-shoreline Pliocene to :, America (DuPont) fonning broad sand Pleistocene
ridge by the reworking of deltaic sediments
Green Cove Springs, palaeo-beach ridge Florida (AMC Ltd.)
Sri Lanka Pulmoddai beach placer along Holocene (Ceylon Mineral Sands present shoreline Corp.)
Malaysia Perak and Ipoh alluvial tin deposits (ilmenite recovered as by product)
Brazil Espirito Santo beach placers along Holocene present shoreline
Madagascar Fort Dauphin beach placer Pleistocene (QIT)
Mocambique Congolone coastal aeolian Pleistocene to Holocene
New Zealand Barrytown, west coast of beach placer Pleistocene South Island (Fletcher Challenge Ltd.)
CIS (fonnerly the Dnepr River, Ukraine alluvial placer USSR)
China, Peoples' Guandong-Guangxi coast coastal deposits Republic of and Hainan Island
1 HMS = Heavy mineral suite
HMS!
ilmenite (altered) + leucoxene: 45 % zircon (rutile)
ilmenite (altered) leucoxene, monazite
'ilmenite: 70-75 % rutile: 10-12 % zircon: 8-10 % monazite: ,., 0 .4 %
ilmenite: 35-75 % monazite: 1-20 % zircon: 5-35 % rutile: 0.5-5 %
alt ilm (rutile, zircon, monazite)
ilmenite: 77 % zircon: 7 % rutile: 2 % monazite: 0.2 %
ilmenite: as high as 44 % of sands (gold)
ilmenite (rutile and zircon)
ilmenite
Resources
4 % heavy minerals
3 to 4 % heavy minerals
5 Mt of titanium minerals
60 million tonnes of sand
ilmenite: 4 Mt zircon: 0.4 Mt rutile: 0.1 Mt
average ilmenite grade: 12-13 % ilmenite
References
Pirkle and Yoho (1970) Lynd et al. (1954)
Pirkle et al. (1974)
Anon (1974) Bailey et al. (1956)
Gillson (1950) Lynd et al. (1954)
Bartle (1988)
Brown and Nossal (1990) .Bailey et al. (1956)
Mann and James (1986)
Towner (1984)
Towner (1984)
,... QC

Geology, mining and uses of titanium 19
2.3 MINING AND RECOVERY OF TITANIUM
2.3.1 General methods
Ilmenite in hard rock deposits is mined by conventional open-cast or underground methods
depending on the depth of the deposit and the amount of overburden material. Ore
dressing involves comminution followed by concentration using gravity and magnetic
separators. As the ilmenite concentrates from these deposits tend to have low Ti02 values
(see Table 2.4) certain mines upgrade the Ti02 content of their product by smelting the
ilmenite to produce pig iron and titanium slag, which commands a far higher price and has
greater market uses.
Unconsolidated sedimentary heavy mineral deposits are most commonly mined by suction
dredge methods. Artificial ponds are created which contain suction-cutting dredges and
""'~'"!, "" floating gravity concentrators. The dredges advance by under.cutting .. andcollapsing the
exposed face of the ore-body. The released sand is then pumped as a slurry to the
concentrator, where it is passed through screens to remove oversize material, such as
gravel, boulders and roots. The heavy minerals are separated from the lighter gangue
minerals, such as quartz and feldspar, using sluices, spirals or Reichart-cone gravity
separators to produce a heavy mineral concentrate. In some instances it is not possible to
mine the deposit by dredging because the sediment is too consolidated. Such deposits are
excavated by draglinesor front-end loaders and the ore is concentrated in gravity
concentrators situated close to the mine. The tailings are used as backfill and to
reconstruct the original topography. The mined areas are re-vegetated in programs
designed to restore the ecology to its former state.
Further processing of the ore is dependent on the heavy mineral suite of the ore body, the
grain-size of the minerals (both ore and gangue phases) and the presence of coatings or
stainings. Mineral separation circuits are designed specifically for each deposit. Most
mineral concentrates are produced using a combination of density, magnetic and
electrostatic separators.
Geology, mining and uses of titanium 20
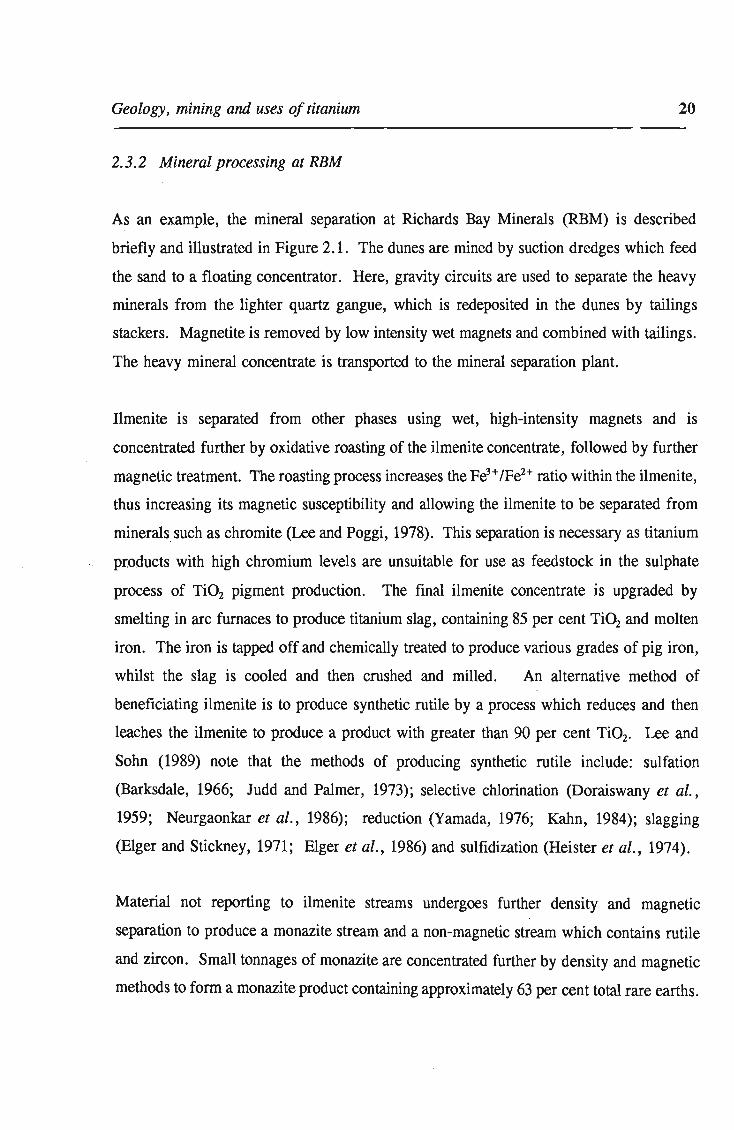
2.3.2 Mineral processing at RBM
As an example, the mineral separation at Richards Bay Minerals (RBM) is described
briefly and illustrated in Figure 2.1. The dunes are mined by suction dredges which feed
the sand to a floating concentrator. Here, gravity circuits are used to separate the heavy
minerals from the lighter quartz gangue, which is redeposited in the dunes by tailings
stackers. Magnetite is removed by low intensity wet magnets and combined with tailings.
The heavy mineral concentrate is transported to the mineral separation plant.
Ilmenite is separated from other phases using wet, high-intensity magnets and is
concentrated further by oxidative roasting of the ilmenite concentrate, followed by further
magnetic treatment. The roasting process increases the Fe3+ IPe2+ ratio within the ilmenite,
thus increasing its magnetic susceptibility and allowing the ilmenite to be separated from
minerals such as chromite (Lee and Poggi, 1978). This separation is necessary as titanium
products , with high chromium levels are unsuitable for use as feed stock in the sulphate
process of Ti02 pigment production. The final ilmenite concentrate is upgraded by
smelting in arc furnaces to produce titanium slag, containing 85 per cent Ti~ and molten
iron. The iron is tapped off and chemically treated to produce various grades of pig iron,
whilst the slag is cooled and then crushed and milled. An alternative method of
beneficiating ilmenite is to produce synthetic rutile by a process which reduces and then
leaches the ilmenite to produce a product with greater than 90 per cent Ti02• Lee and
Sohn (1989) note that the methods of producing synthetic rutile include: sulfation
(Barksdale, 1966; Judd and Palmer, 1973); selective chlorination (Doraiswany et al.,
1959; Neurgaonkar et al., 1986); reduction (Yamada, 1976; Kahn, 1984); slagging
(EIger and Stickney, 1971; EIger et al., 1986) and sulfidization (Heister et aI., 1974).
Material not reporting to ilmenite streams undergoes further density and magnetic
separation to produce a monazite stream and a non-magnetic stream which contains rutile
and zircon. Small tonnages of monazite are concentrated further by density and magnetic
methods to form a monazite product containing approximately 63 per cent total rare earths.

Geology, mining and uses of titanium
MINING OPERATION
DREDGE MINING GRAVITY CONCENTRATION
USING SLUICES AND CONES
21
TAILS STACKING REHABILITATION
HEAVY MINERAL (ILMENITE, ZIRCON, RUTILE, MONAZITE, SILICATES)
MINERAL SEPARATION PROCESS
RUTILE
PRODUCT
(BAGGED OR B
MAGNETITE TO TAILS
... ~
ULK)
NON-MAGS
DRY MAGNETIC +
ELECTROSTATIC
SEPARATION
ZIRCON
TREATMENT
PLANT
ZIRCON
PRODUCT
(BAGGED OR BULK)
CONCENTRATE
BY ROAD HAULAGE
MAGS WHIMS
WHIMS +
SLUICES
MAGNETIC
MIDDLINGS
MONAZITE
PLANT
MONAZITE
PRODUCT
(BAGGED )
• ILMENITE ~
STOCKPILE +
NON-MAGS ROASTER +
MAGNET CIRCUIT
MAGS
TAILINGS
. ~ S M ELT E R
TI-SLAG ~
PRODUCTS PROCESSING ~
SLAG PLANT
CRUSHING +
SCREENING
GRADED
TI-SLAG
(BULK)
IRON
INJECTION
PLANT
PIG IRON
PRODUCT
(INGOTS)
Figure 2.1 Schematic diagram illustrating the mineral processing at Richards Bay
Minerals. (LIWMS = low intensity wet magnets; WHIMS = wet high intensity magnets).

Geology, mining and uses of titanium 22
Zircon and rutile are separated into two circuits using high-tension electrostatic separators.
Impurities are removed from the circuits by further electrostatic and magnetic separations
and large silicate grains are removed by screening. The final rutile product consists of
about 85 per cent rutile and 15 per cent leucoxene, with minor impurities and contains
about 94 per cent Ti02• The zircon concentrate undergoes leaching in H2S04 to remove
iron staining and is then calcined to improve its appearance before being sold. More
detailed information about the mining and recovery methods at Richards Bay are given by
Lee and Poggi (1978), MacPherson (1982) and Hugo (1988) .
2.4 USES OF TITANIUM
2.4.1 Pigment production
Over 90 per cent of titanium ore mined is used in the production of Ti~ pigment (Anon,
. 1988). Refraction and reflection of white light occurs at the interface of a pigment and
the medium in which it is dispersed and the opacity increases with the number of
interfaces. Titanium dioxide has a high refractive index and can be produced with a fine
particle size, which makes it an excellent opacifier. Ti02 pigment is produced by two
methods - the sulphate and chloride processes. In the sulphate method, ilmenite or
titanium slag are dissolved in concentrated sulphuric acid at high temperatures to form
water soluble sulphates:
---- (2.1)
ilmenite solution precipitate
After purification and cooling to remove the iron as FeS04.7H20, the titanium IS
precipitated in a fine colloidal form by hydrolysis:
---- (2.2)
solution colloid

Geology, mining and uses of titanium 23
The addition of small rutile nuclei crystals prior to hydrolysis results in the Ti02 pigment
taking the form of rutile during calcining; without such seed the pigment would have the
structure of anatase (Anon, 1988). After calcining the product may be milled to form the
optimum particle size of 0.2 to 0.3 p,m and is then subjected to surface treatments to
produce the desired pigment properties. Rutile pigments are used exclusively in the paint
industry as they have a higher refractive index than anatase pigments and are less
susceptible to degeneration by ultra violet light.
The chloride process, developed in the 1950's by Du Pont Ltd., originally used only rutile
as feedstock. In recent years chloride process producers have devised the technology
which allows them to use lower grade feed materials and to blend different types of
titanium products for their feed (Gadsden, 1982). In the process, rutile, synthetic rutile
or blended high-grade Ti02 products (greater than 60 % TiO~ are reacted with chlorine,
using coke as a reductant:
Ti02 + 2C + 2Cl2 ~ TiCl4 + 2CO ---- (2.3)
The titanium tetrachloride is then superheated in oxygen in a reaction chamber at over
lOOO°C to form Ti02 pigment, with the optimum crystal size by the reaction:
---- (2.4)
The chloride process has the following advantages over the sulphate process:
1. The process is simpler than the sulphate method.
2. The TiCl4 made in the intermediate stage can be readily purified by distillation.
3. The chlorine used in the reaction can be recycled, producing small quantities of
waste such as iron chloride. In contrast the sulphate process creates large
quantities of ferrous sulphate and dilute sulphuric acid pollutants.
Despite the much cheaper price and greater availability of ilmenite feed stock for the
sulphate process, the proportion of Ti02 produced by chloride processes has grown from

Geology, mining and uses of titanium 24
nil in the early 1950's to 50 percent in 1990 (Ellis, 1989). This is due to the increasing
pressure of environmental legislation in many countries and the preference of pigment
consumers for chloride-grade pigment (Heap, 1991). A number of sulphate plants have
attempted to overcome their effluent problems by producing gypsum (CaS04) from their
waste R2S04 and by using higher-Ti02 feed stock to reduce the amount of ferrous sulphate
waste (Gadsden, 1982). The sulphate and chloride processes of pigment production are
described in greater detail by Lynd and Lefond (1983), Ramor (1986), MacKey (1972a)
and Anon (1988).
The bulk of titanium pigments produced is consumed by the paint industry, which uses an
estimated 60 per cent of world production. Ti02 pigments are also used in the paper
industry to improve opacity, brightness and printability of paper products, and in the
plastics industry to impart whiteness, chemical inertness and ultra violet resistance.
2.4.2 Other uses of titanium
Titanium metal for the aerospace and chemical industries is the second largest use of
titanium. The metal is produced in two forms from rutile and other high-grade Ti02
products: titanium sponge and ingots. Prior to 1970 titanium alloys were almost
exclusively used in the aerospace industry, where their high strength/density ratio and high
melting point were utilised in the manufacture of jet engine parts and structural parts in
aircraft (Knittel, 1983). By the mid-1980's only 63 per cent of titanium metals were
consumed by the aerospace industry. The metal is now also used by power stations for
heat exchanger tubing and in desalination, chemical and petroleum plants where the
strength; heat and corrosive resistant properties of the metal are used to protect processing
equipment (Knittel, 1983; Lynd and Lefond, 1983).
Rutile is also used in electronic components where it has good semiconductor properties;
as both the active agent and inactive support in catalysts; as coatings for welding rods and
as an opacifier in ceramics (Knittel, 1983; Whitehead, 1983).
Geology, mining and uses of titanium 25
2.5 PRODUCTION OF TITANIUM MINERALS AND PRODUCTS
The majority of the world's titanium mineral production comes from seven countries -
Australia, Canada, South Africa, United States of America, India, Sierra Leone and
Malaysia. Australia is the world's dominant producer of both rutile and ilmenite,
producing about 50 per cent of the world's annual supply for both minerals (Heap, 1991).
In contrast, the production and consumption of Ti02 pigment, sponge metal and products
manufactured from these, is dominated by industrialised countries such as the U.S.A.,
Japan and European countries. Salient western world production capacity figures and
prices for titanium products from 1960 to 1990 are given in Table 2.6. Production
statistics for countries with centralised economies (ie. The Peoples' Republic of China and
the Commonwealth of Independent States) are erratic and incomplete and are not included
in Table 2.6. These figures are drawn primarily from data published in Australian
Mineral Industry Annual Review and Metals and Minerals Annual Review (formerly the
Mining Annual Review).
The western world production of titanium feed stock has increased steadily over the last 30
years (Figure 2.2). These increases are the result of continued expansion of production
capacity of the TiOz pigment industry and to a lesser extent, titanium sponge manufacture
(see Table 2.6). The growth in production has been encouraged by steadily increasing
prices (Figure 2.3), which are the result of strong demand, and often short supply of both
feed stock and manufactured goods, coupled with inflation. Since mining operations
. commenced at Richards Bay, South Africa's share of world rutile and ilmenite (as titanium
slag) production has increased continuously (Figure 2.4). A recently completed expansion
project at RBM and the development of Anglo American's deposit at Brandsebaai will
result in South Africa occupying a leading position as a producer of titanium minerals.
A comparison of the proportions of titanium feed stock produced from 1960 to 1990 reveals
a marked increase in the amount of upgraded TiOz products produced at the expense of
rutile and ilmenite (see Figure 2.2) This is the result of strong demand for high grade
TiOz feedstock, caused by a shift away from the sulphate process, coupled with the need

Geology, mining and uses of titanium 26
to find cheaper and more abundant substitutes for rutile, which is both expensive (about
11/2 times the price of any other feedstock) and far less abundant than ilmenite (see Table
2.3, page 12). A further advantage of upgraded ilmenite products, over ilmenite
concentrate, is their higher market value; titanium slag and synthetic rutile currently
command 3 and 5 times higher prices than ilmenite, respectively (see Figure 2.3). In
addition, products such as titanium slag may be used in both pigment processes, increasing
marketability. As a result, the demand for ilmenite as a feed stock declined since 1970.
In contrast the amount of ilmenite used in the production of titanium slag and synthetic
rutile has risen in the same period (Figure 2.5) and since 1987 has exceeded the amount
sold as concentrate.

Geology, mining and uses of titanium 27
Table 2.6 Summary of Western World titanium production
2.6 A Titanium feedstock production capacity (Mt)
Year Rutile Ilmenite Ilmenite Ti Slag Syn. Rutile Leucoxene
Mined Prod.
1960 0.10 1.60 1.16 0.27
1961 0.10 1.80 1.27 0.33
1962 0.14 2.08 1.81 0.27
1963 0.18 2.13 1.80 0.33 1964 0.19 2.18 1.74 0.43 1965 0.21 2.74 1.67 0.39
1966 0.23 2.16 1.78 0.37 1967 0.26 3.00 1.85 0.42
1968 0.28 3.17 2.14 0.60 1969 0.35 3.22 2.33 0.68 0.01 1970 0.37 4.55 2.69 0.65 1971 0.41 4.37 2.48 0.77 0.01 1972 0.37 4.50 2.64 0.84 0.02 1973 0.34 4.80 2.71 0.86 0.07 0.02 1974 0.33 4.91 2.90 0.85 0.07 0.01 1975 0.37 4.07 2.53 0.75 0.11 0.01 1976 0.40 4.47 2.77 0.81 0.18 0.01 1977 0.40 4.38 2.94 0.69 0.01 1978 0.33 4.86 3.06 0.85 0.20 0.02 1979 0.37 4.09 3.09 0.91 0.16 0.01 1980 0.44 3.81 2.81 1.30 0.03 1981 0.38 5.66 3.02 1.16 0.04 1982 0.36 4.52 2.39 1.09 0.03 1983 0.34 4.34 2.05 1.05 0.03 1984 0.37 5.02 2.93 1.20 0.22 0.04 1985 0.41 5.11 2.88 1.19 0.22 0.04 1986 0.47 5.99 2.39 1.75 0.36 0.05 1987 0.47 5.78 2.21 1.90 0.36 0.04 1988 0.49 6.08 2.23 1.83 0.43 1989 0.50 6.52 2.98 1.89 0.44 0.02 1990 0.55 6.97 3.48 1.90 0.45 0.02
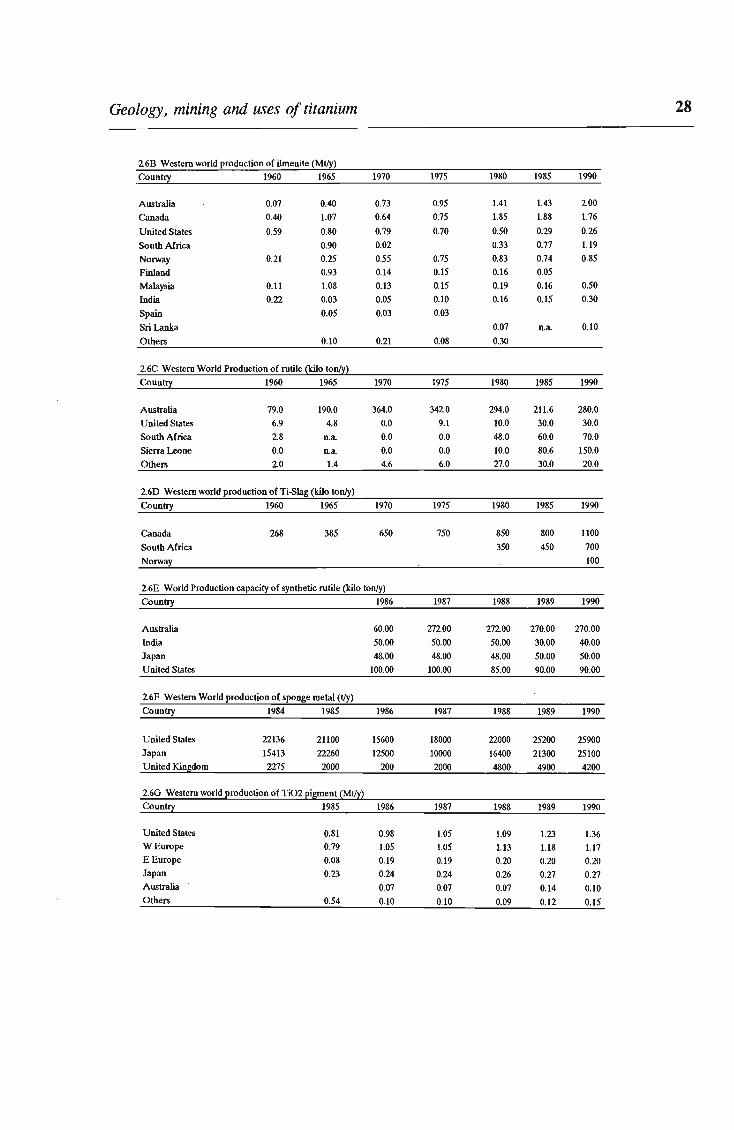
Geology, mining and uses of titanium 28
2.68 Western world production of i1menite (MtJy)
Country 1960 1965 1970 1975 1980 1985 1990
Australia 0.07 0.40 0.73 0.95 1.41 1.43 2.00
Canada 0.40 1.07 0.64 0.75 1.85 1.88 1.76
United States 0.59 0.80 0.79 0.70 0.50 0.29 0.26
South Africa 0.90 0.02 0.33 0.77 1.19
Norway 0.21 0.25 0.55 0.75 0.83 0.74 0.85
Finland 0.93 0.14 0.15 0.16 0.05
Malaysia 0.11 1.08 0.13 0.15 0.19 0.16 0.50
lndia 0.22 0.Q3 0.05 0.10 0.16 0.15 0.30
Spain 0.05 0.03 0.03
Sri Lanka 0.07 o.a 0.10
Others 0.10 0.21 0.08 0.30
2.6C Western World Production of rutile !kilo tonl~~
Coun!!I 1960 1965 1970 1975 1980 1985 1990
Australia 79.0 190.0 364.0 342.0 294.0 211.6 280.0
United States 6.9 4.8 0.0 9.1 10.0 30.0 30.0
South Africa 2.8 n.a 0.0 0.0 48.0 60.0 70.0
Sierra Leone 0.0 n.a 0.0 0.0 10.0 80.6 150.0
Others 2.0 1.4 4.6 6.0 27.0 30.0 20.0
2.6D Western world production of Ti-Slag (kilo tonly)
Country 1960 1%5 1970 1975 1980 1985 1990
Canada 268 385 650 750 850 800 1100
South Africa 350 450 700
Norway 100
2.6E World Production capacity of synthetic rutile (kilo tonly)
Country 1986 1987 1988 1989 1990
Australia 60.00 272.00 272.00 270.00 270.00
India 50.00 50.00 50.00 30.00 40.00
Japan 48.00 48.00 48.00 50.00 50.00
United States 100.00 100.00 85.00 90.00 90.00
2.6F Western World production of sponge metal (tJy)
Country 1984 1985 1986 1987 1988 1989 1990
United States 22136 21100 15600 18000 22000 25200 25900
Japan 15413 22260 12500 10000 16400 21300 25100
United Kin!ldom 2275 2000 200 2000 4800 4900 4200
2.6G Western world I!roduction of Ti02 l!i!2!!ent ~MtJ~~
Count!! 1985 1986 1987 1988 1989 1990
United States 0.81 0.98 1.05 1.09 1.23 1.36 WEurope 0.79 1.05 1.05 1.13 1.18 1.17 EEurope 0.08 0.19 0.19 0.20 0.20 0.20 Japan 0.23 0.24 0.24 0.26 0.27 0.27 Australia 0.07 0.07 0.07 0.14 0.10 Others 0.54 0.10 0.10 0.09 0.12 0.15

Geology, mining and uses of titanium 29
2.6H Titanium Feedstock prices 1969 - 1991 Year Rutile Ilmenite Cand. Slag SA Slag Syn. Rut. Leucoxene
A$/t A$/t US$/t US$/t A$/t A$/t
1969 119 10 45 1970 140 11 45 1971 130 12 48 93 1972 115 12 50 76 1973 163 12 61 76.7 1974 330 17 60 76.7 1975 250 17 75 119 1976 235 18 90 154 1977 205 17.5 102 150 147 1978 205 17.5 110 135 134 1979 240 18 115 135 187 147 1980 330 23 135 175 250 208 1981 285 27 150 190 235 206 1982 260 33 150 190 200 207 1983 290 28 162 185 220 1984 425 35 185 198 270 1985 520 55 196 212 269 1986 550 47 213 228 382 1987 620 75 220 230 410 1988 600 73 230 255 376 409 1989 675 85 260 275 442 459 1990 880 87 260 270 484 552 1991 650 90 280 310 520

30
2.2 3.5
3
2.5
~ 2
~ 1.5
0.5
1965 1970 1975 1980 1985 1990 YEAR
___ IIrn. Cone. -+- Ti-Slag ...... Rutile
-e- Syn. Rutile -++- Leueoxene
Figure 2.2 Western world production capacity of titanium feed stocks (1960 to 1990).
Data from Table 2.6A.
900
800
700
w 600 z z 500 0 t:::. w 400 ()
a: Cl...
1970
--- Rutile
1975
2.3
1980 YEAR
-+- IImenite
-e- Syn. Rutile -++- Leueoxene
1985 1990
...... Ti-Slag (US $)
Figure 2.3 Average prices of titanium feed stocks (1969 to 1991) in A $. Data from
Table 2.6H. Note that the price of South African Ti-slag is given in US $ (l US $ is
equal to approximately 2.5 A $, at 1993 exchange rates) .

Geology, mining and uses of titanium
2.4A 600~--------------------------------------.
~ 400H.- .-.. ----·------.------... -.--.-----.--.-------d~~~air·-····-·-··I s ~ .Q ;g W ...J i= ::J a:
~ c S .Q ;g w !::: z w ~ ::!
100·+·-·······-1
7
6
3
2
1
1 YEAR
D AUSTRALIA k :::1 UNITED STATES _ SOUTH AFRICA
EEEII SIERRA LEONE ~ OTHERS
2.48
1975 1980 1985 YEAR
o AUSTRALIA ~ CANADA (1) \::: :::1 UNITED STATES _ SOUTH AFRICA (1) ~ NORWAY
31
Figure 2.4 A. World production capacity ofrutile by country (1960 to 1990). B. World
production capacity of ilmenite by country (1960 to 1990). 1 South African and Canandian
ilmenite is used solely for the production of Ti-slag.
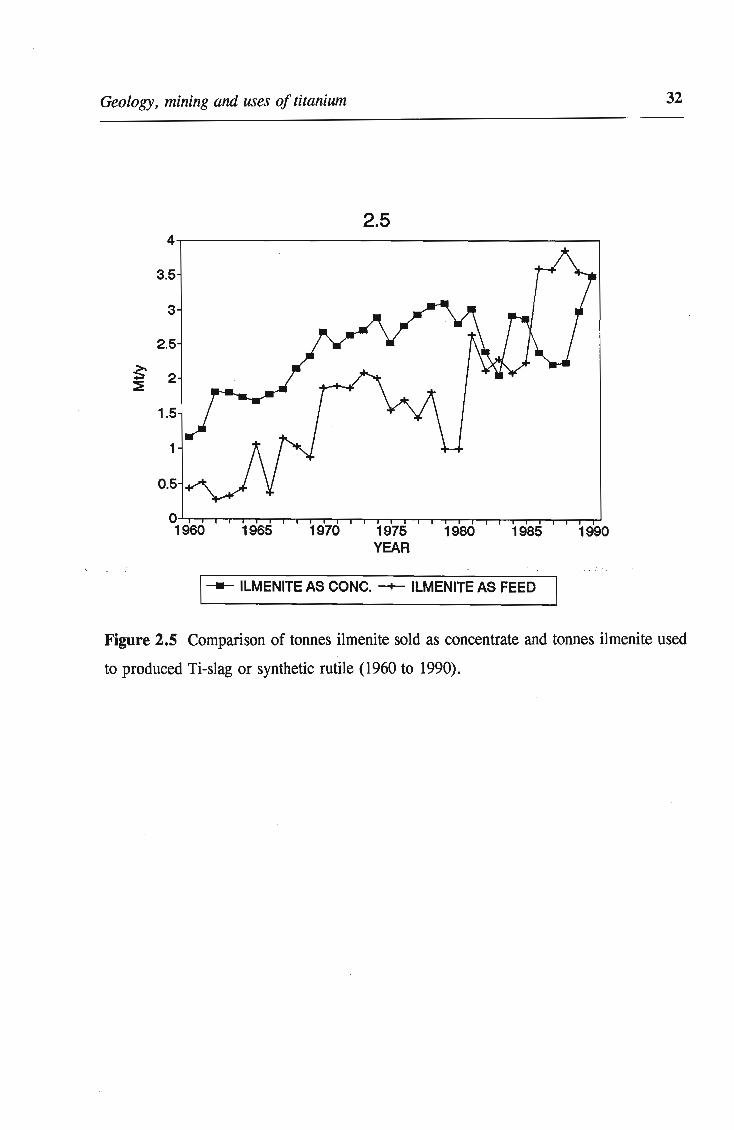
Geology, mining and uses of titanium 32
2.5 4
3.5
3
2.5
~ 2 ::E
1.5
1
0.5
0 1960 1965 1970 1975 1980 1985 1990
YEAR
1-- ILMENITE AS CONC. -+- ILMENITE AS FEED
Figure 2.5 Comparison of tonnes ilmenite sold as concentrate and tonnes ilmenite used
to produced Ti-slag or synthetic rutile (1960 to 1990).

33
CHAPTER THREE
GEOLOGICAL AND GEOMORPHOLOGICAL SETTING
3.1 INTRODUCTION
The heavy mineral deposits in the area of study occur within several ages of Cainozoic
aeolian sediments. These may form either individual dune cordons, as noted along the
Zululand coastal plain, or as complexes containing dunes of different ages stacked against
one another. The most economically viable deposits occur in modern dunes, forming high
coastal dune ridges or cordons along the Zululand coastline.
A knowledge of the geological and geomorphological setting of these deposits is important
if variations in the petrography, distribution and alteration state of titanium-bearing
minerals is to be understood. The regional geology within the catchment areas of present
day river systems is outlined to give an indication of provenance and to place the
geological history of the study area in context. The coastline may be divided into regions
according to shoreline morphology, geographical setting and provenance. The heavy
mineral deposits within each of these regions are described ' in terms of location,
sedimentary environment and age.
3.2 REGIONALGEOLOGY
The outcrop distribution of the major stratigraphic units within the eastern seaboard of
South Africa is shown in Map 1 (see enclosed folder). The geology of the area, which
ranges from Archean to Holocene, is briefly described in the following sections. The
major source rocks of the Sedimentary iron-titanium oxides are described in greater detail
in Chapter 7.
Geology and geomorphology 34
3.2.1 Kaapvaal Province
Rocks of this Archean province consist mainly of granitoids and gneisses with deformed
greenstone relicts, which are overlain by the supracrustal Pongola Sequence.
3.2.2 Natal Metamorphic Province
The Proterozoic Natal Metamorphic Province (circa 1250 - 900 Ma) crops out in a series
of basement inliers, which cover some 1000 km2 (Thomas et al., 1990). The province has
been subdivided into 3 stratigraphic units by Thomas (1989). The rocks of the northern
Tugela Terrane comprise amphibolite, biotite-, hornblende-plagioclase- and quartz-feldspar
gneiss, and magnetite quartzite. The central Mzumbe Terrane consists of a sequence of
amphibolite-grade gneisses and schists (Mapumulo Group), together with pre- to syn
tectonic granitoid-gneisses. The southern Margate Terrane consists of granulite grade
supracrustal gneisses, which have been intruded by various granitoid plutons, which may
reach batholithic proportions (Thomas, 1988, 1989).
3.2.3 Natal Group
The sedimentary sequence of the Ordovician-Silurian Natal Group consists predominantly
of quartz sandstone, with a basal conglomerate and minor arkosic sandstone, siltstone and
shale. The group forms a clastic wedge of varying thickness (from a few metres to over
600 m) and unconformably overlies the basement rocks (Linstrom, 1987).
3.2.4 Karoo Sequence
The Karoo Sequence ranges in age from Carboniferous to J urassic and underlies most of
the provenance area. The Dwyka Formation diamictite forms the base and unconformably
overlies older rocks. It is conformably overlain by continental sandstone and shale of the
Ecca and Beaufort Groups and the Mol~eno and Elliot Formations. These sedimentary
rocks formed in fluvio-deltaic and braided river environments at the margins of shallow

Geology and geomorphology 35
inland basins under increasingly arid conditions (Ryan and Whitfield, 1979). The fine
grained, , cross-bedded sandstone of the overlying Clarens Formation is generally
considered to be aeolian in origin.
The central Karoo Sequence is capped by a thick succession of tholeiitic basalt lava
(Drakensberg Formation) of Late Triassic to Jurassic age. To the east, early Jurassic and
younger basalt and rhyolite build a thick succession, monoclinally warped to the east,
forming the Lebombo-Nuanetsi-Sabi lineament stretching from Natal to Mocambique.
Associated with the volcanic rocks are dykes and sills of dolerite and gabbro, which are
commonly found within the sediments of the Karoo Sequence, but rarely occur within the
Natal Group and basement rocks (Eales et al., 1984). The intrusions, together with less
abundant granites, granophyres and undersaturated alkaline rocks, occur over a vast area
and demonstrate that the lavas are small erosional remnants of a much thicker and more
.extensive volcanic sequence (Eales et al., 1984).
3.2.5 Cretaceous Period
-The diastrophism of the late Jurassic markedly affected the coastal outline and continental
margin of the east coast (Maud, 1961). Early terrigenous conglomerates of the lower
, Cretaceous Makatini Formation were deposited as alluvial fans on the down warped
margins produced by the breakup of Gondwanaland (Hobday, 1979). These grade upwards
and eastwards into cross-bedded sandstone, marine marl and siltstone of the Mzinene and
St Lucia Formations, which underlie most of the Zululand coastal plain and are found
underlying off-shore sediments (Maud, 1968; Kennedy and Klinger, 1975). The
Cretaceous beds show only depositional dips and have not been affected by tectonic
movement since their deposition (Maud, 1968). This implies that the major features of
the South African landscape were formed before the Cretaceous.
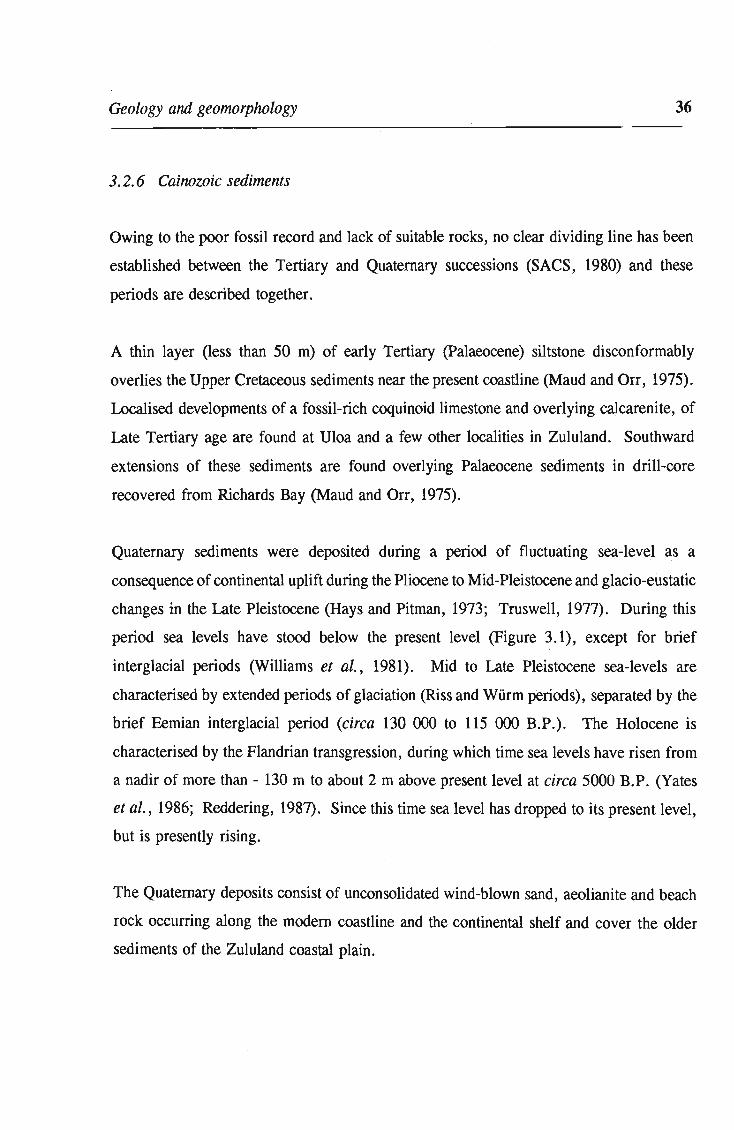
Geology and geomorphology 36
3.2.6 Cainozoic sediments
Owing to the poor fossil record and lack of suitable rocks, no clear dividing line has been
established between the Tertiary and Quaternary successions (SACS, 1980) and these
periods are described together.
A thin layer (less than 50 m) of early Tertiary (Palaeocene) siltstone disconformably
overlies the Upper Cretaceous sediments near the present coastline (Maud and Orr, 1975).
Localised developments of a fossil-rich coquinoid limestone and overlying calcarenite, of
Late Tertiary age are found at Uloa and a few other localities in Zululand. Southward
extensions of these sediments are found overlying Palaeocene sediments in drill-core
recovered from Richards Bay (Maud and Orr, 1975).
Quaternary sediments were deposited during a period of fluctuating sea-level as a
consequence of continental uplift during the Pliocene to Mid-Pleistocene and glacio-eustatic
changes in the Late Pleistocene (Rays and Pitman, 1973; Truswell, 1977). During this
period sea levels have stood below the present level (Figure 3.1), except for brief
interglacial periods (Williams et al., 1981). Mid to Late Pleistocene sea-levels are
characterised by extended periods of glaciation (Riss and Wiirm periods), separated by the
brief Eemian interglacial period (circa 130 000 to 115 000 B.P.). The Rolocene is
characterised by the Flandrian transgression, during which time sea levels have risen from
a nadir of more than - 130 m to about 2 m above present level at circa 5000 B.P. (Yates
et al., 1986; Reddering, 1987). Since this time sea level has dropped to its present level,
but is presently rising.
The Quaternary deposits consist of unconsolidated wind-blown sand, aeolianite and beach
rock occurring along the modern coastline and the continental shelf and cover the older
sediments of the Zululand coastal plain.

Geology and geomorphology 37
3.2.7 Outline of source rocks of heavy minerals
The primary sources of ilmenite and magnetite are a number of rock types from the Natal
Metamorphic Province, the Karoo Igneous Province and the Kaapvaal Craton. The
primary sources of rutile, zircon and garnet are the Archean and Proterozoic basement
rocks (Hammerbeck, 1976; Fockema, 1986). The heavy minerals are also reworked from
the sedimentary rocks of Ordovician to Pleistocene age.
YEARS x 1000
o 20 40 60 80 100 120 140 160
m o 1
-100
-200r-~----.-______ .--. __ ~-r~ __ r-~ ________ ~
3 6
Figure 3.1 Sea-level curve from the M~d-Pleistocene to present relative to present sea
level. After Williams et al. (1981) . -

Geology and geomorphology 38
3.3 GEOMORPHOWGY OF THE STUDY AREA
3.3.1 General characteristics
Two distinct features of the south-eastern African coast, formed by the breakup of
Gondwanaland are the linear coastline, which stretches from south of East London to the
Tugela River and the very narrow and steep continental margin. The continental margin
(Figure 3.2) may be as narrow as 3 km along parts of the coast, but widens gradually
south of Port St. Johns to more than 50 km near Port Elizabeth. The shelf also widens
considerably between Durban and Richards Bay where the Tugela Cone is situated. The
adjacent continental slope is steep, with values of 12 0 off the Transkei coast (Flemming,
1981). The shelf break is intermittently dissected by submarine canyons and interrupted
by a number of south-facing structural offsets, which may be linked to structural
displacements affecting the entire continental margin (Flemming, 1981).
The climate varies from warm temperate in the eastern Cape to sub-tropical north of the
Transkei. Rainfall in Natal and Zulu land occurs in the summer months, but the Eastern
Cape and parts of the Transkei experiences bimodal rainfalls in spring and early autumn.
The major winds are bidirectional, alternating between north-easterly and south-westerly ,
winds striking the coastline at an oblique, or semi-parallel direction (Tinley, 1985).
The near-shore zone of the continental shelf is dominated by high-energy, south-westerly
swells (Flemming, 1981) and a micro- to macro tidal environment. These swells are
refracted to form waves approaching the shore from the south-east. These generate
longshore drift of near-shore sediment to the north and the formation of zetaform (half
heart) bays (Tinley, 1985). At present much of the coastline is undergoing erosion due
to a global rise in sea level and only isolated areas, such as north of Tugela River, are
prograding (McCarthy, 1988a).

30·S
i o
Cape .
Province
39
10
d" . : ..... ;;-.,' 20 :. ':
::', ':. ::.~:~.
i
200 km Zululand
Figure 3.2 Map illustrating the linear coastline, the narrow continental margin and steep
continental margin along the east coast of southern Africa. All depth contours are in
metres. After Flemming (1981).

Geology and geomorphology 40
The coastline is also characterised by the formation of estuaries and lagoons at river
mouths. In many cases the estuaries are isolated from the sea by beach or dune barriers,
which are only breached during periods of flood. The estuaries have been formed by the
Flandrian marine transgression, flooding river valleys which had incised deeply into
coastal rocks during the Late Pleistocene glaciation (Sydow, 1988; Ramsey, 1991).
Geomorphologically the study area may be divided into 3 broad regions which are
described in the subsequent sections.
3.3.2 Zululand
Parallel dune ridges, typical of a prograding shoreline, are found from Tugela River to
Mtunzini (see Map 1). The ridges extend several kilometres inland where they encroach
on older fixed dunes. The coarse-grained sandy beaches are extensive and continuous.
A coastal plain of flat-lying sediments and a low elevation extends from Mtunzini
northwards into Mocambique (Maud, 1968). The plain widens towards the north and
reaches a width of 45 km at the Mocambique border. The coastline consists of a zigzag
pattern of linear, coarse-grained sandy beaches cut into unconsolidated aeolian sands (Plate
3.1A). Widely spaced headlands are formed by beach rock and aeolianites (Tinley, 1985).
An almost continuous cordon of Late Pleistocene - Holocene dunes occurs adjacent to the
modern beaches along the Zululand coast from Port Durnford northwards. The dune
cordon is high and narrow and is stabilised by vegetation and forestation (Plate 3.1B).
The major rivers in the area include the Umhlatuze, Umfolozi, Mkuze and Pongola Rivers
(Map 1). Access of rivers to the sea has been blocked by the coastal dune cordon and the
rivers flow into large, shallow, lakes, such as Lake St Lucia. The mouth of Pongola River
is currently situated in Mocambique, but it probably drained into the Indian Ocean near
Lake Sibaya during Pleistocene times (Ramsey, 1991). The catchment area of these rivers
includes Archean and Proterozoic basement rocks, Karoo sedimentary rocks and the
igneous rocks of the Lebombo lineament (Map 1).
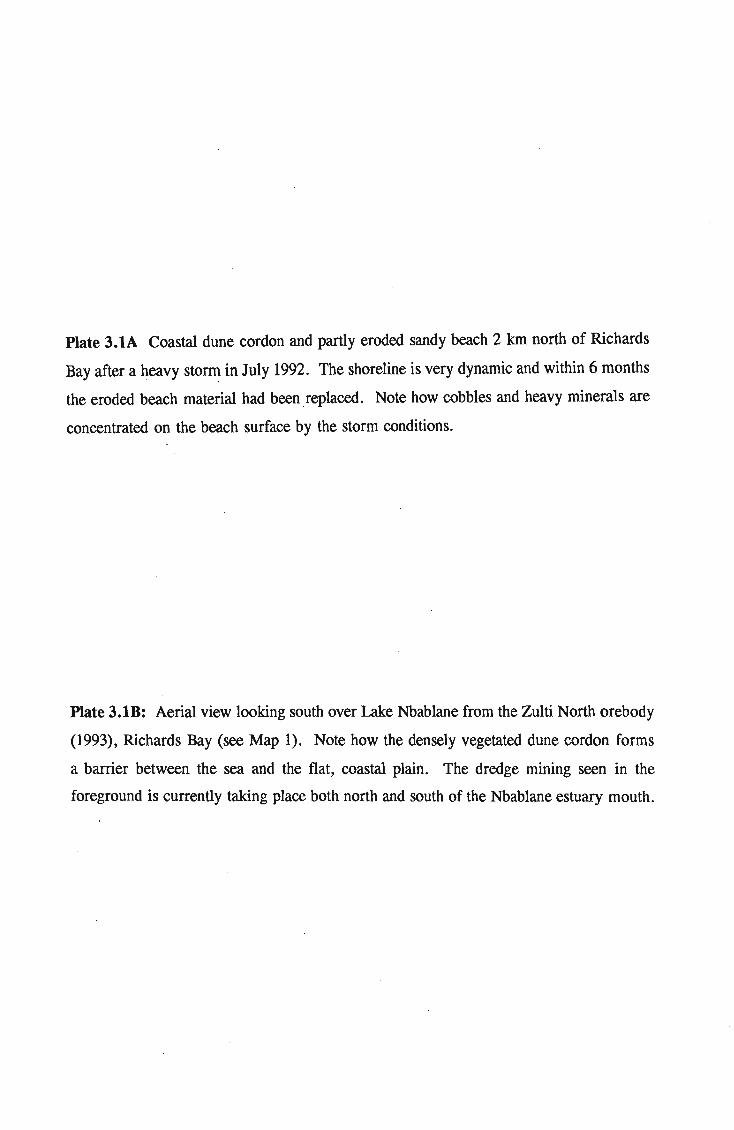
Plate 3.1A Coastal dune cordon and partly eroded sandy beach 2 km north of Richards
Bay after a heavy stor~ in July 1992. The shoreline is very dynamic and within 6 months
the eroded beach material had been replaced. Note how cobbles and heavy minerals are
concentrated on the beach surface by the storm conditions.
Plate 3.1B: Aerial view looking south over Lake Nbablane from the Zulti North orebody
(1993), Richards Bay (see Map 1). Note how the densely vegetated dune cordon forms
a barrier between the sea and the flat, coastal plain. The dredge mining seen in the
foreground is currently taking place both north and south of the Nbablane estuary mouth.

41
Plate 3.1 A
Plate 3.1 B

Geology and geomorphology 42
3.3.3 Natal-Transkei
In Natal the coastline consists of irregular rocky headlands and wave-cut platforms
separating linear or arcuate beaches. The beaches are narrow and consist predominantly
of coarse-grained sands. The beaches are stable and loss of sand during storm periods is .
replaced by onshore movement of sediment during fair weather periods (Flemming, 1981).
A cordon of Pliocene-Pleistocene dunes form a discontinuous ridge up to 120 m high,
trending parallel to coast. In places the cordon is adjacent to the beaches and may be
partly eroded by shoreline processes, while in other areas the dunes are several kilometres
inland, overlying rock at elevations of over 150 m (Maud, 1968). The ridges are heavily
dissected by river Valleys.
The linear Transkei coast consists mainly of exposed rocky headlands and wavecut
platforms dividing small beaches, which consist of coarse sands, shingle and pebbles (Plate
3.2). The Pliocene-Pleistocene dune cordon is not as well preserved as in Natal, but
remnants of these dunes are dispersed along the coastline. Modern dunes along the Natal
Transkei coastline are small and active. They are confined mostly to bayheads and river
mouths and comprise hummock, blowout and barrier dune types (Tinley, 1985).
The coastal region rises sharply inland and is characterised by steep topography and deeply
incised river Valleys. Major rivers include the Kei, Mzimvuba, Mtentu and the Mtamvuma
Rivers in the Transkei and the Mkomazi, Mgeni and Mvoti Rivers in Natal (Map 1). The
Transkei rivers drain catchment areas which consist almost entirely of Karoo sediment,
dolerite and basalt. The catchment areas of the northern Transkei rivers also contain
outcrops of Natal Group sandstone and basement rocks. In contrast, the Natal rivers drain
the entire succession from basement rocks to Karoo basalt (Map 1).
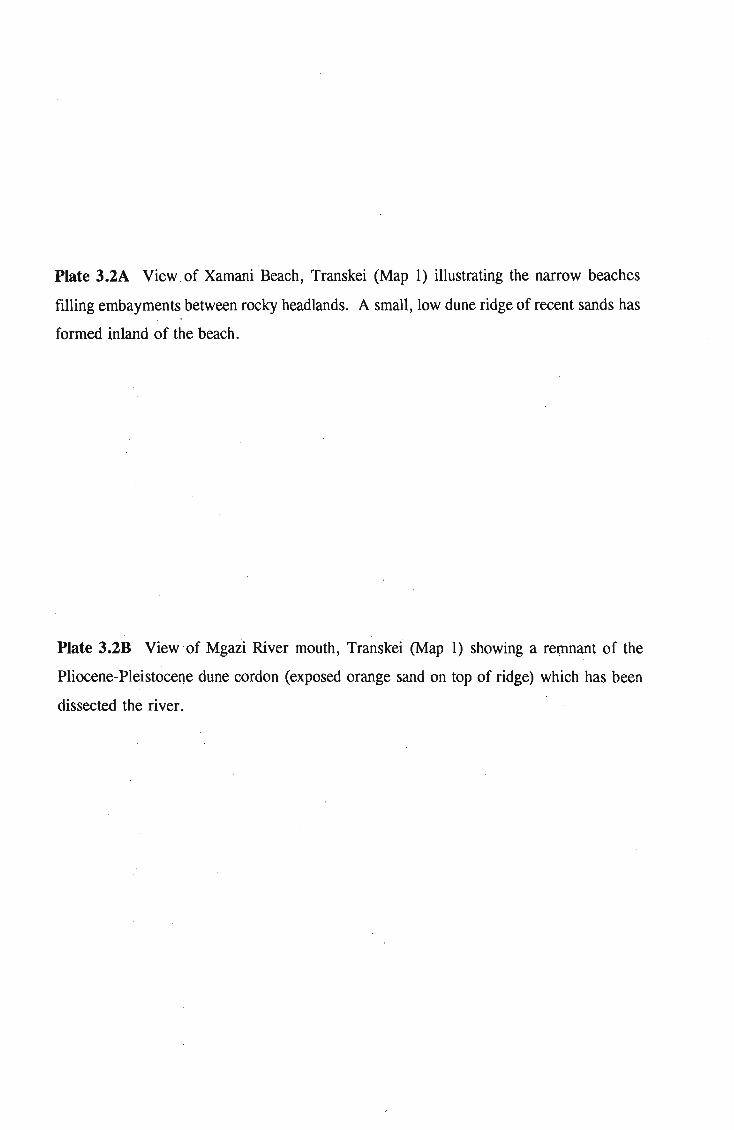
Plate 3.2A View .of Xamani Beach, Transkei (Map 1) illustrating the narrow beaches
filling embayments between rocky headlands. A small, low dune ridge of recent sands has
formed inland of the beach.
Plate 3.'28" View of Mgazi River mouth, Transkei (Map 1) showing a remnant of the
Pliocene-Pleistocene dune cordon (exposed orange sand on top of ridge) which has been
dissected the river.
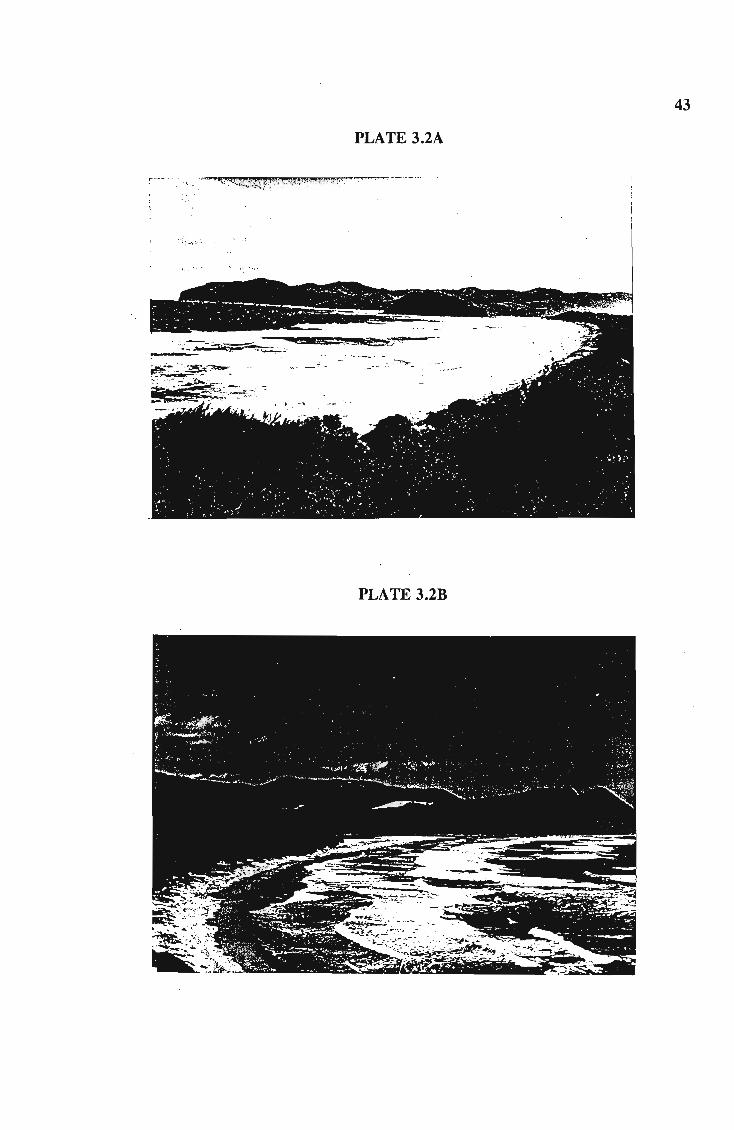
43
PLATE 3.2A
PLATE 3.2B

Plate 3.3A View of the beach immediately south of the Boesmansrivier mouth (Map 1)
showing the wide, fine-grained, sandy beaches found along the east Cape coastline. Note
the formation of low fore..;dunes and the low, vegetated dune cordon in the background.
Plate 3.3B A thick succession of heavy mineral layers found within beach sediment 2 km
north of Richards Bay. Layers of heavy minerals in beaches along the east coast of South
Africa are typically like those seen at the photograph, but thick concentrates may occur
where there is an abundant supply of heavy minerals and the correct energy conditions
prevail.

Geology and geomorphology 44
PLATE 3.3A
PLATE 3.3B
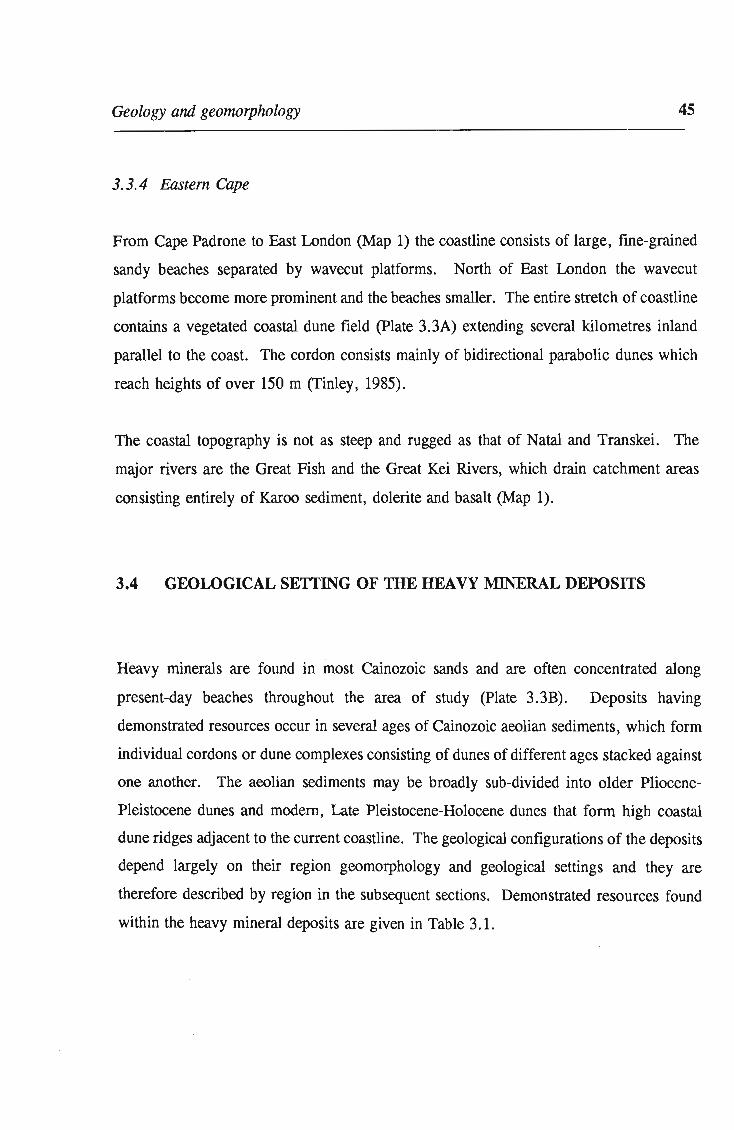
Geology and geomorphology 45
3.3.4 l?astern C7ape
From Cape Padrone to East London (Map 1) the coastline consists of large, fine-grained
sandy beaches separated by wavecut platforms. North of East London the wavecut
platforms become more prominent and the beaches smaller. The entire stretch of coastline
contains a vegetated coastal dune field (Plate 3.3A) extending several kilometres inland
parallel to the coast. The cordon consists mainly of bidirectional parabolic dunes which
reach heights of over 150 m (Tinley, 1985).
The coastal topography is not as steep and rugged as that of Natal and Transkei. The
major rivers are the Great Fish and the Great Kei Rivers, which drain catchment areas
consisting entirely of Karoo sediment, dolerite and basalt (Map 1).
3.4 GEOLOGICAL SETTING OF THE HEAVY MINERAL DEPOSITS
Heavy minerals are found in most Cainozoic sands and are often concentrated along
present-day beaches throughout the area of study (Plate 3.3B). Deposits having
demonstrated resources occur in several ages of Cainozoic aeolian sediments, which form
individual cordons or dune complexes consisting of dunes of different ages stacked against
one another. The aeolian sediments may be broadly sub-divided into older Pliocene
Pleistocene dunes and modem, Late Pleistocene-Holocene dunes that form high coastal
dune ridges adjacent to the current coastline. The geological configurations of the deposits
depend largely on their region geomorphology and geological settings and they are
therefore described by region in the subsequent sections. Demonstrated resources found
within the heavy mineral deposits are given in Table 3.1.

Table 3.1 Description of heavy mineral deposits along the east coast of South Africa (see Figure 1.1 and Map 1 for localities).
Region Deposit Type Age Resources Economic Minerals References
Zululand Tisand ore-body aeolian Pleistocene-Holocene 750Mt ilmenite, zircon, rutile, monazite, Fockema (1986) leucoxene Hammerbeck (1976)
Hugo (1988) Wipplinger (1985)
Zulti-North ore-body aeolian Pleistocene-Holocene 199 Mt ilmenite, zircon, rutile, monazite Fockema (1986) Hammerbeck (1976) Wipplinger (1985)
Zulti-South ore-body aeolian Pleistocene-Holocene 395 Mt ilmenite, zircon, rutile, monazite Hammerbeck (1976) (port Durnford) Wipplinger (1985)
Cape Vidal aeolian Pleistocene-Holocene 104 Mt ilmenite, rutile, zircon, leucoxene Hammerbeck (1976) Wipplinger (1985)
Kingsa-Tojan aeolian Pleistocene-Holocene 325 Mt ilmenite, rutile, zircon, leucoxene Hammerbeck (1976) Wipplinger (1985)
Coastal, red dunes, ego Mtunzini aeolian Pleistocene 70Mt ilmenite, rutile, zircon
Inland, red dunes, aeolian Pleistocene unknown ilmenite, rutile, zircon eg. Port Durnford and Kwabonambi State forests
Natal Umgababa aeolian (red dunes) Pleistocene to Holocene 44Mt ilmenite, rutile, zircon Hammerbeck (1976) Wipplinger (1985)
Transkei Sandy Point aeolian (reworked Holocene 64Mt ilmenite, rutile, zircon Hammerbeck (1976) beach and red dunes) Wipplinger (1985)
Wavecrest aeolian Holocene 48Mt ilmenite, rutile, zircon Hammerbeck (1976) Wipplinger (1985)
Kobongaba aeolian Holocene 37Mt ilmenite, rutile, zircon Hammerbeck (1976) Wipplinger (1985)
Xamani beach Holocene unknown ilmenite, rutile, zircon
Eastern Cape Morgan's Bay aeolian Pleistocene to Holocene 64Mt ilmenite, rutile, zircon Hammerbeck (1976) Wipplinger (1985)
Nickolas aeolian Pleistocene to Holocene 64Mt ilmenite, rutile, zircon Wipplinger (1985)
"'" Q\

Geology and geomorphology 47
3.4.1 Zululand Coastal dune deposits
3.4.1.1 Port Durnjord - Cape St Lucia
The geology of the heavy mineral deposits in the Richards Bay - Port Durnford area (Map
1) is described by Fockema (1986) and Johnson (1986). The mineralised Late Pleistocene
Holocene dunes form a thin, discontinuous cordon extending up to 2 km inland and reach
over 90 m in height above sea level (Figure 3.3). The dominant dune type is bidirectional
parabolic dunes, although whale-back dunes and reversing buttress dunes are found in
some localities. Slightly higher than present sea-levels during the Holocene have resulted
in shoreline erosion forming cliffed dunes along the coast.
w E
~ Coastal Aeolianites Holocene ]~O m
~l Port Durnford Formation Pleistocene - Pliocene 0 50 m
Figure 3.3 Schematic cross-section through the mineralised dunes, Richards Bay. After
10hnson (1986) and Hugo and Cornell (1991).

Geology and geomorphology 48
Lithologically the dunes consist predominantly of fine- to medium-grained quartz with
variable amounts of heavy minerals and feldspar. Shell fragments and calcareous material
are uncommon. The sands tend to be light coloured, unconsolidated and free-flowing,
although thin lignite bands may be found in dune troughs. Thin, discontinuous palaeosol
horizons are also recognised (Fockema, 1986).
Along the present shoreline, the dunes unconformably overlie the Mid-Pleistocene
sediments of the Port Durnford Formation, which represent a barrier-lagoon complex
(Hobdayand Orme, 1974). Further inland, the dunes rest on the remnants of Pleistocene
aeolian sediments and older Holocene lagoon sediments and calcarenites (John son, 1986).
The base of the dunes lies between 20 and 40 m above sea level and the water table often
coincides with this contact (Fockema, 1986). Relicts of an older, reddish-brown dune
system are found underlying the abundant yellow-brown dunes (Fockema, 1986). The red
dunes have low relief indicating that they have been reworked during the formation of the
younger dunes. As the older dunes overlie the Mid-Pleistocene Port Durnford sediments
(Fockema, 1986) they are considered to be Late Pleistocene in age. The heavy mineral
suites of the older dunes are very similar to those of the younger dunes (Beckering
Vinckers, 1986; Fockema, 1986) indicating that they have a similar provenance.
The economic minerals found in the deposits are ilmenite, zircon, rutile and monazite.
According to Fockema (1986) the grades of these minerals vary considerably within the
deposit, but the ratios between ilmenite, rutile and zircon are fairly constant. Other heavy
minerals present include pyroxene, amphibole, garnet, magnetite, hematite and leucoxene,
with minor chromite, epidote, apatite, tourmaline, sphene and goethite. The heavy mineral
grades range from about 3 per cent to over 15 per cent. Local upgrading by wind erosion
also occurs on the landward side of the dunes (Hammerbeck, 1976).
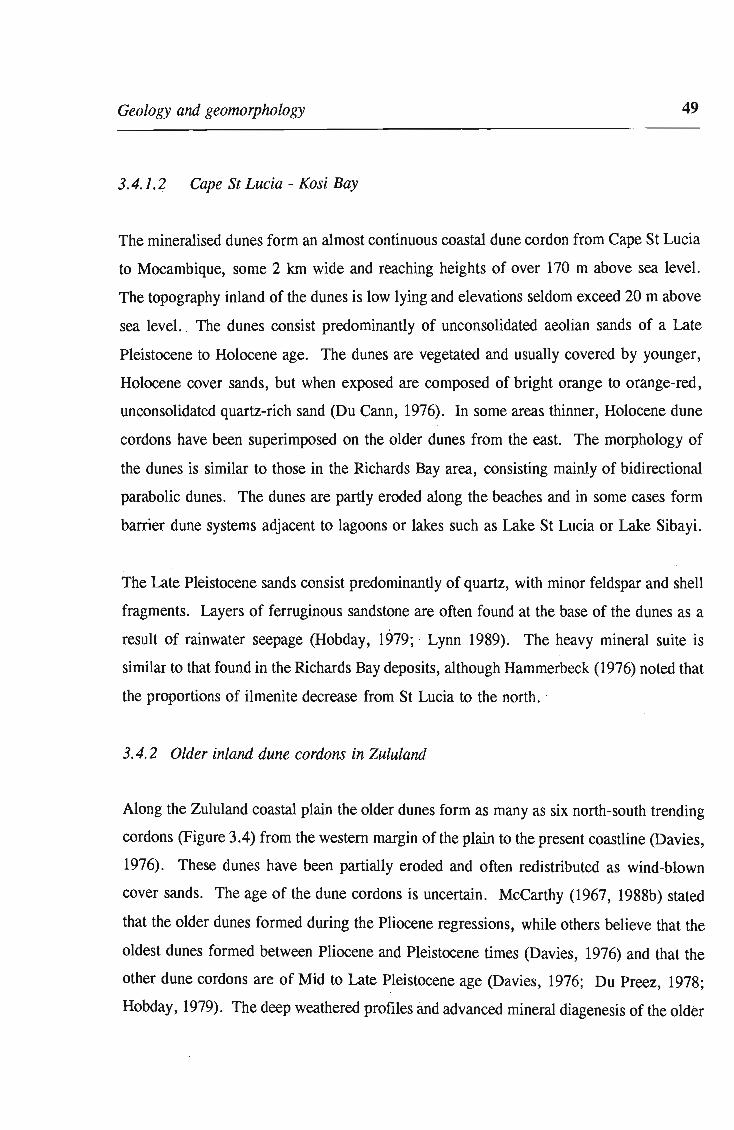
Geology and geomorphology 49
3.4.1.2 Cape St Lucia - Kosi Bay
The mineralised dunes form an almost continuous coastal dune cordon from Cape St Lucia
to Mocambique, some 2 km wide and reaching heights of over 170 m above sea level.
The topography inland of the dunes is low lying and elevations seldom exceed 20 m above
sea level.. The dunes consist predominantly of unconsolidated aeolian sands of a Late
Pleistocene to Holocene age. The dunes are vegetated and usually covered by younger,
Holocene cover sands, but when exposed are composed of bright orange to orange-red,
unconsolidated quartz-rich sand (Du Cann, 1976). In some areas thinner, Holocene dune
cordons have been superimposed on the older dunes from the east. The morphology of
the dunes is similar to those in the Richards Bay area, consisting mainly of bidirectional
parabolic dunes. The dunes are partly eroded along the beaches and in some cases form
barrier dune systems adjacent to lagoons or lakes such as Lake St Lucia or Lake Sibayi.
The Late Pleistocene sands consist predominantly of quartz, with minor feldspar and shell
fragments. Layers of ferruginous sandstone are often found at the base of the dunes as a
result of rainwater seepage (Hobday, 1979; · Lynn 1989). The heavy mineral suite is
similar to that found in the Richards Bay deposits, although Hammerbeck (1976) noted that
the proportions of ilmenite decrease from St Lucia to the north . .
3.4.2 Older inland dune cordons in Zululand
Along the Zululand coastal plain the older dunes form as many as six north-south trending
cordons (Figure 3.4) from the western margin ofthe plain to the present coastline (Davies,
1976). These dunes have been partially eroded and often redistributed as wind-blown
cover sands. The age of the dune cordons is uncertain. McCarthy (1967, 1988b) stated
that the older dunes formed during the Pliocene regressions, while others believe that the
oldest dunes formed between Pliocene and Pleistocene times (Davies, 1976) and that the
other dune cordons are of Mid to Late Pleistocene age (Davies, 1976; Du Preez, 1978;
Hobday, 1979). The deep weathered profiles and advanced mineral diagenesis of the older

Swaziland
I I I I , I I ,
Mocambique
+
-------------- ---)
+
/
, Indian Ocean
SCALE 50 km
N It? I COASTAL DUNE CORDON
~ 1/1 OLDER DUNE CORDON
50
Figure 3.4 Map showing the older dune cordons along the Zululand coastal plain (after
Davies, 1976).

Geology and geomorphology 51
dunes (Hobday, 1979) suggests that they were formed at least before the end of the Mid
Pleistocene, when they were subjected to intense tropical weathering during the Eemian
interglacial.
The older dunes form broad flat ridges with a maximum height of 30 m and are
characterized by their rich red colour, high clay content and deep soil horizons (Hobday,
1979). The younger dunes are steeper and less eroded than the inland dunes and appear
to be less weathered. They consist of well-sorted, red-brown to orange-brown sands
containing fine-grained, rounded quartz and heavy minerals, with small amounts of kaolin,
feldspar and mica and organic material. No published data exists on the heavy mineral
content of the different dune cordons.
3.4.3 Natal-Transkei
The heavy mineral deposits along the Natal-Transkei coastline are found within a Pliocene
Pleistocene dune cordon and the smaller Holocene foredune and beach sediments. The
aeolian sands often contain a basal layer of conglomerates or gravels up to several metres
thick (McCarthy, 1988c) and overlie Pre-Cainozoic rocks of different ages at elevations
from 0 m to over 100 m above sea level (Maud, 1968). Like the older dunes along the
Zululand coastal plain, the age of the older dunes is uncertain. McCarthy (1967, 1988a,
1988b) maintains that the dunes are Pliocene in age, while other authors (Maud, 1968;
Davies, 1976) assign a Pleistocene age to the cordons.
The dunes consist of fine-grained quartz (Maud, 1968) with small amounts of feldspar and
shell fragments. They have moderate to high clay contents, which are the result of in situ
tropical weathering of detrital feldspar and ferromagnesian silicates such as pyroxene and
amphibole (pyriboles). The dominant clay mineral is kaolinite (Maud, 1968). The sands
are massive, featureless and compact. Their red-brown colour is caused by iron-hydroxide
coatings on the surfaces of the quartz grains, which is derived from the alteration of the
pyriboles (McCarthy, 1967; Maud, 1968).

Geology and geomorphology 52
The heavy mineral content of the sands ranges from 2 to 25 per cent and averages between
7 to 10 per cent (Hammerbeck, 1976). The heavy mineral suite consists predominantly
of ilmenite, with lesser amounts of zircon, rutile and garnet. Minor amounts of pyriboles,
magnetite and hematite are also noted. Typical proportions of the heavy mineral suites are
given by Hammerbeck (1976) and in Chapter 8 of this study.
The younger Holocene dunes form small blowout and barrier-type dunes which may be
superimposed against the older dune cordon. The poor development of these dune systems
along much of the Natal-Transkei coast, compared to the Zululand dunes, is a result of the
scarcity of fine-grained sand for aeolian transport, combined with an actively eroding
shoreline (Tinley, 1985). The aeolian sands have been derived from the reworking of the
older dune cordons, together with beach sands and continental shelf sediments exposed
during the last glacial maxima (Hammerbeck, 1976; Wipplinger, 1985). The heavy
mineral suite of the sands is variable, depending largely on provenance. The common
heavy minerals are ilmenite, rutile, zircon, garnet, magnetite and pyriboles.
The more important deposits occur at Umgababa in Natal and Xolobeni, Xamana,
Wavecrest, Sandy Point and Kobonqaba in the Transkei (Map I and Figure 1.1, page 2).
The mineralogy and mineral processing of the Umgababa deposit' is described by Nel and
Koen (1960) and Langton and Jackson (1961), but details of the geology of these deposits
are not found in the literature and only brief descriptions are given by Hammerbeck (1976)
and Wipplinger (1985) .
3.4.4 l?astern C7aj7e
The grade of heavy minerals in coastal sediments in the eastern Cape is generally much
lower than those found further north; only two sub-economic deposits are noted by
Wipplinger (1985) and details of these are sketchy.
At Morgan's Bay (Map 1 and Figure 1.1) the heavy mineral deposit is found in young
(probably Holocene) aeolian sands resting on an exposed dolerite sill (Wipplinger, 1985).
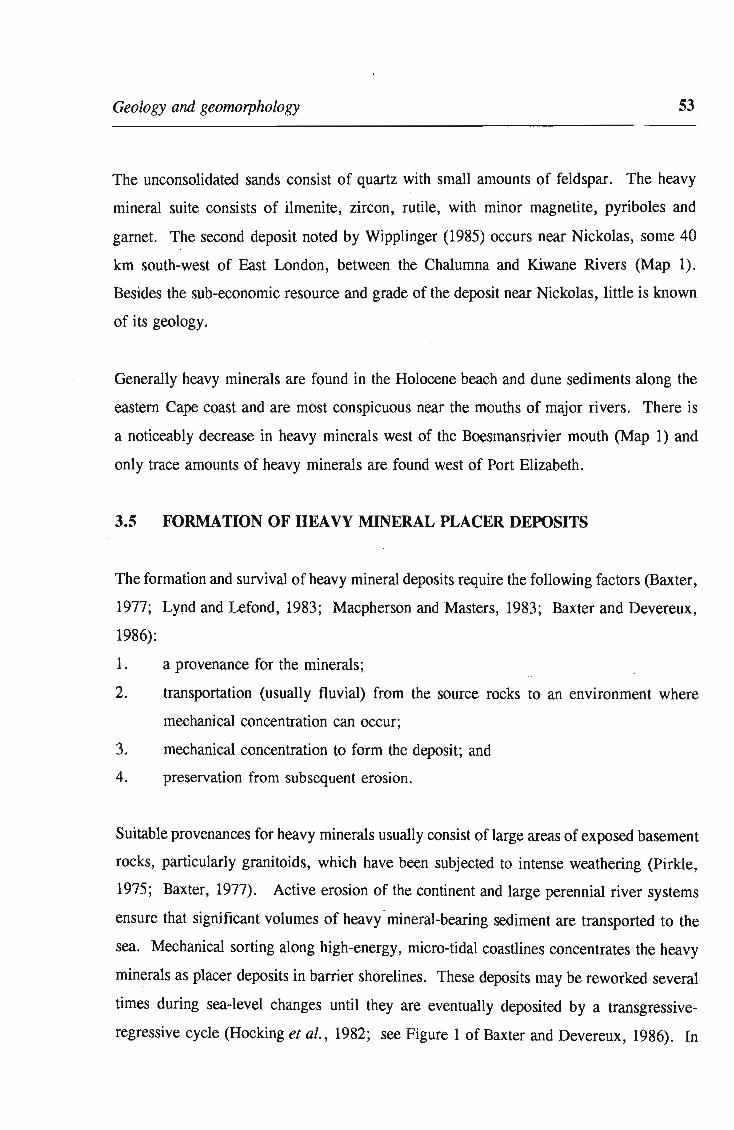
Geology and geomorphology 53
The unconsolidated sands consist of quartz with small amounts of feldspar. The heavy
mineral suite consists of ilmenite, zircon, rutile, with minor magnetite, pyriboles and
garnet. The second deposit noted by Wipplinger (1985) occurs near Nickolas, some 40
km south-west of East London, between the Chalumna and Kiwane Rivers (Map 1).
Besides the sub-economic resource and grade of the deposit near Nickolas, little is known
of its geology.
Generally heavy minerals are found in the Holocene beach and dune sediments along the
eastern Cape coast and are most conspicuous near the mouths of major rivers. There is
a noticeably decrease in heavy minerals west of the Boesmansrivier mouth (Map 1) and
only trace amounts of heavy minerals are found west of Port Elizabeth.
3.5 FORMATION OF HEAVY MINERAL PLACER DEPOSITS
The formation and survival of heavy mineral deposits require the following factors (Baxter,
1977; Lynd and Lefond, 1983; Macpherson and Masters, 1983; Baxter and Devereux,
1986):
1. a provenance for the minerals;
2. transportation (usually fluvial) from the source rocks to· an environment where
mechanical concentration can occur;
3. mechanical concentration to form the deposit; and
4. preservation from subsequent erosion.
Suitable provenances for heavy minerals usually consist of large areas of exposed basement
rocks, particularly granitoids, which have been subjected to intense weathering (Pirkle,
1975; Baxter, 1977). Active erosion of the continent and large perennial river systems
ensure that significant volumes of heavy' mineral-bearing sediment are transported to the
sea. Mechanical sorting along high-energy, micro-tidal coastlines concentrates the heavy
minerals as placer deposits in barrier shorelines. These deposits may be reworked several
times during sea-level changes until they are eventually deposited by a transgressive
regressive cycle (Hocking et al., 1982; see Figure 1 of Baxter and Devereux, 1986). In

Geology and geomorphology 54
some cases the heavy minerals in barrier systems may be redeposited in coastal dunes by
strong onshore winds.
The south-eastern African coastline and particularly the Zululand coastal plain, has all the
above critera for the formation of heavy mineral deposits and it is not surprising that large
reserves have been found here. Models for the genesis of the deposits and the nature of
the heavy mineral concentrate are proposed in Chapter 8.

55
CHAPTER FOUR
SAMPLING AND ANALYTICAL TECHNIQUES
This chapter describes the sampling and analytical techniques used in the course of the
study.
4.1 SAMPLING
4.1.1 Description of samples
The sampling methods attempted to achieve representative samples of the heavy mineral
suite and not to determine their quantity in the sediment, as it was not the purpose of this
thesis to determine grades within the deposits. The majority of the samples obtained were
composite samples, between 5 and 10 kg, consisting of 5 to 15 increments, collected
between 0 - 2 m below the surface of the sediments.
The sampling of each environment is described individually, as samples were collected
from a range of environments, sometimes for different purposes:
1. Beaches: Samples were collected from the swash zones and beach berms of
modern day beaches (Appendix A.l).
2. Dunes: Because dunes of more than one age are found along the southern African
coastline, a distinction was made between the younger Late Pleistocene - Holocene
dunes, and the older, red dunes. Both types of dunes were sampled (Appendix
A.2) to determine if any differences in the titanium-bearing mineralogy existed,
particularly with respect to the degree of alteration of ilmenite. Samples were
collected from the slip-faces of dunes. A number of borehole samples were
supplied by Richards Bay Minerals.
3. Rivers: Samples were collected from major rivers to help determine the general
provenance of the titanium-bearing minerals (Appendix A.3). Several tributaries

Sampling and analytical techniques 56
or streams, exclusively draining one rock-type, were also sampled to determine the
nature of the titanium-bearing minerals from that rock-type. Samples were
collected from cross-channel and side-channel bars.
4. Rock samples: A number of possible source rocks were sampled to study the
titanium-bearing minerals within these rocks (Appendix A.4). Usually rock
samples of about 5 kg were collected from selected outcrops. Rock samples were
also kindly supplied by Deanna Meth, Audrey Pietersen (nee Turner), and George
Milne (Department of Geology, University of Natal, Durban) and Leslie Turner
(Department of Chemical Engineering, University of Natal, Durban).
4.1.2 Sample localities
Sample localities are listed in Appendix A and the distribution of sampling sites within the
study area is shown in Map 1. The localities were chosen to conform to one or more of
the following criteria:
1. Economic or sub-economic heavy mineral deposit.
2. The existence of heavy mineral-rich layers within the sediment or rock was
previously described, or was observed by the author.
3. Heavy mineral-bearing sediments from beach, dunes and rivers occurred in close
proximity to each other, so that the influence of depositional environment on heavy
minerals from the same provenance area could be studied.
4. The sampling site was accessible.
5. A sample was required to obtain an even geographical distribution of samples.
4.2 SAMPLE PREPARATION
4.2.1 General preparation
A general preparation procedure was used for sand samples for microscopic examination
(summarised in Figure 4.1). Samples were split using a rotary splitter and a portion of
the original sample was stored. A second portion was wet sieved to remove the < 63 J-tm

Sampling and analytical techniques 57
fraction. This step is necessary to ensure clean separation during heavy liquid
concentration of the heavy minerals, although it is recognised that some silt-sized titanium
bearing minerals are lost in the process. Samples were then dried before undergoing
heavy liquid separation using TBE (tetrabromoethane, s.g. = 2.95 g.cm-3) to concentrate
the heavy minerals. Polished thin-sections were made from the heavy mineral concentrates
(HMC's) and studied using reflected light microscopy and scanning electron microscopy,
to identify the titanium-bearing minerals and examine their textural relationships. These
sections were also used for point-counting to determine mineral proportions in the samples.
4.2.2 Detailed preparation
A more detailed preparation procedure (Figure 4.2) was used for selected samples to
obtain grain-size, magnetic susceptibility and chemical data for the titanium-bearing oxides.
The initial steps follow the general procedure, although sieving was added to determine
the grain-size distributions of various fractions. A Franz Isodynamic Separator, with a
forward tilt of 15 0 and a side tilt of 100, was used to magnetically separate the heavy
minerals. A setting of 10 mA was used to remove magnetite, and a polished thin-section
was prepared of this fraction for microscopic and microprobe analysis. Ilmenite was
concentrated using a setting of 200 mA. This fraction underwent further density separation
using Clerici solution with an s.g. of 4.15 g.cm-3• Polished thin-sections, made of the sink
fractions, were examined microscopically to determine the impurity minerals present in
the ilmenite concentrates. These fractions were also used for grain-size, microprobe and
XRF chemical analysis. The latter was performed by Richards Bay Minerals using
wavelength dispersive XRF and in-house ilmenite standards and techniques.

· Sampling and analytical techniques
4.1
SAMP LE
5 - 10 kg
DRIED
11 0 Qc
SAMPLER SPLIT -
ROTARY SP LI TTER I----~ FRACTiON STORED
ABOUT 500g
WET SI EVED < 63 um
AT 63 um
> 63um
TBE SEPARATI ON FLOAT
2.95 -3 g.cm
SINK
t
SA MPLE SP L IT -
RIFFLER SPLITTER
ABOUT 20g
POLISHED THIN-SECTION
FOR PETROGRAPHI C STUDIES
DISCARDED
FRACTiON STORED
58
Figure 4.1 Flow-diagram showing the general sample preparation used for petrographic
study.

FRACTION USED FOR
GRAIN-SIZE ANALYSIS
BY SCREENING
POLISHED THIN-SECTION
FOR PETROGRAPHIC STUDIES
~ - 500g
~
4.2
SAMPLE
5- 10 kg
DRIED
110 QC
SAMPLER SPLIT -
ROTARY SPLITTER
ABOUT 500g
WET SIEVED < 63um
AT 63um
> 63um
TBE SEPARATION FLOAT
2.95 -3 g.cm
SINK
GRAIN-SIZE ANALYSIS
BY SCREENING
SAMPLE RECOMBINED
MAGS
REMAINING FRACTION
STORED
DISCARDED
DISCARDED
MAGNETIC SEPARATION
FRANZ - 10 mA 1----... MAGNETITE CONCENTRATE
POLISHED THIN-SECTION
NON-MAGS
MAGNETIC SEPARATION NON-MAGS POLISHED THIN-SECTION
FRANZ - 200 mA
MAGS er LMEN ITE)
FLOAT CLERIC I SEPARATION
4.15 g.cm- 3 1----. DISCARDED
SINK
SAMPLE SPLIT -XRF ANALYSIS
RIFFLER SPLITTER
59
Figure 4.2 Flow-diagram showing the detailed sample preparation used for electron
microprobe and XRF analysis of ilmenite concentrates.

Sampling and analytical techniques 60
4.2.3 Rock samples
Polished thin-sections were made of all the rock samples. In some cases, where the
titanium-mineral content was low, the samples were crushed and the heavy minerals
extracted by TBE separation. Polished thin-section were made of the heavy mineral
concentrates.
4.3 ANALYTICAL METHODS
4.3.1 Aficroscopy
Prior to mounting in exopy resin on a glass slide, the heavy minerals were mixed
thoroughly to minimize mineral segregation effects. The grain mounts were ground using
silicon carbide powder to between 50 and 100 I'm in thickness and polished, using
progressively finer diamond pastes from 30 I'm to 1 I'm. Such polished thin-sections are
good for the examination of mineral grains in both reflected and transmitted light and may
also be used in scanning electron microscope (SEM) and electron microprobe analysis .
A Leitz polarising light microscope was used for mineral identification and petrographic
descriptions. Both reflected and transmitted light modes were applied, although most of
the titanium-bearing minerals are opaque. Oil immersion lenses were used for the
reflected light microscopy.
4.3.2 Point counting techniques
Mineral proportions of the heavy mineral concentrates were determined by point-counting
in both reflected· and transmitted light microscopy. Five hundred grains were counted in
reflected light using an oil-immersion lens to determine the modal proportions of opaque
grains. The transparent minerals were counted together during this stage. The proportions
of the transparent minerals were then determined using transmitted light. Certain phases,
such as rutile, which both reflect and transmit light, were only counted in reflected light.

Sampling and analytical techniques 61
The counts were then converted to volume per cent for each sample. As determined by
Hugo (1988), these percentages correspond closely to the mineral mass proportions, the
differences often being within the error of point-counting. The reliability of point-count
data is dependent not only on how representative the thin-section is, but also on the total
number of points counted and the proportions of the minerals present. Van der Plas and
Tobi (1965) derived a chart (Figure 4.3) which estimates the reliability of point-counting
analysis. From this chart it can be seen · that to determine the proportion of a mineral
which constitutes 50 volume per cent of a sample to within 2 per cent accuracy, one
should count 2500 points. For 500 points the error varies from 1 to 4.5 per cent, hence
mineral proportions in this study are rounded to the nearest integer and minerals
determined at < 1 per cent are merely reported as "present".
4.3.3 Scanning Electron Microscopy
A Hitachi 520 Scanning Electron Microscope was used for detailed examination of
petrographic textures and for photomicrography. Back-scattered electron images are well
suited to the study of the iron-titanium oxide textures at magnifications of up to 6000 x,
which is well beyond the resolution of the optical microscope. The brightness of a phase
in a back-scattered electron image is dependent on the mean atomic number (Z) of its
elements. Phases with high Z appear white, whilst those with lower Z are grey. Such
images produce strong contrast between different minerals which often have similar optical
properties, and are particularly useful for observing textural relationships masked by
internal reflections under reflected polarised light.
Semi-quantitative chemical analyses of mineral grains were performed using a JEOL JSM-
35 Scanning Electron Microscope, coupled to a KEVEX 7000-77 energy dispersive X -ray
analyzer. The QUANTEX Magic V software package was used for data reduction. The
general operating conditions of the instrument are as follows: Operating voltage = 20 kV;
acquire time = 60 seconds; effective take-off angle = 18°; working distance = 38 mm;
lower limit of detection = 0.2 % (approximately).

Sampling and analytical techniques
5000
n
JOOO
2000
1500
1000 900 600
700
600
200
15 0
0
0
0
100
9
6
7
60
~
la
2 5
\ i 1 I '\, \ \ I \ 0 1
\ Iz%rel.lI"oreI.6"orel. .,..,. , 16% r~t! , \
t, \ r-. A \
\ J \ \ V<\ , ,
2~% reI. \
'y( " ~ " " \ .....-'<"' , " [.7
1\ " \ V 11 I V "
\ /\ / ,f '\
~ 11 \
I \ 1/, /, , ,
\ / X / ~ XI ~ ~ \
'/ I \ 1/> 7\ V
/ \
'/ VI lX ~ V-/\ -/ /" ----If I. 1/ k
\i / Y. /' " vii f( ~ \'/ / \,/ K// [7 ~o"lo reI.
\{ V /' ...
\ 1/ '\
" , I \' , , , \1 I' I,\rel. 3 "0 reI. z"Io reI. ~rlorel
" \ I , , \1 , \ -- , ~ 'J. , , '\
'" C>% " \ \ " \ , i" , '\ \
\' .~ ,
'\ \ , '\ \
I--.. , ......... \ ,
"- " Jj- I I', " .~
,
" , " '\ , \
" ~ 1\ \ '\ \ " , '"%" \\ \ \ ,
~" R:::: '\ 1\\ 1\\ \ , , t"- \ ... ..Tt
'\ .~~ I--- -. I~ '" "- \ '\ ,\ \ ,
~\ '\ " a'l
'\ .... ~ '", t\'\ \,' "- I'-- ' " , ~ ">-%"
'~ 1\\ ,
t"-"g. 1\, -.
~ , \ 0" pr = f4: 'J>\ f\. \ " "''''''' \" \ \ . \' , ,
"- "0 \ 1"'- \ ~ -;--."" ... " f.\\\ IN , I, "- '\ ~~ \\ ~
J2 o/~ reI. 2~'Yo reI. t;~ 1'-W \ ,
....-'\ -~ ,y
"- \ t-... '\ 1r
\ i', 17 o 10 20 30 .. 0 SO 60 70 60 100
p-
62
Figure 4.3 Van der Plas and Tobi (1965) chart for estimating the reliability of point
counting results. n = total number of counts; p = the estimated per cent by volume of
the mineral; full curves = 2a values; dashed curves = relative 2a curves. The 2a values
for mineral percentages determined by point-counting 500 grains are shown in Appendix
D.

Sampling and analytical techniques 63
4.3.4 Electron microprobe analysis
Quantitative chemical analysis was performed using a JEOL Superprobe 733 in the
Department of Geology, Rhodes University. The operating conditions were as follows:
accelerating voltage = 15 kV; beam current = 0.25 x 10⁻⁷ (A); beam diameter = 1 J.tm;
peak counting time = 30 seconds; background counting time = 10 seconds. Standards
and detection limits are given in Table 4.1. Data correction was based on the method of
Duncomb and Reid (1968).
Some electron microprobe data from Rugo (1988) was also used in the study. These
analyses were determined using a Cameca Camebax Electron Probe Microanalyzer in the
Department of Geochemistry, University of Cape Town, with operating conditions given
in Rugo (1988).
Table 4.1 Standards and lower limits of detection used for the JEOL 733 electron
microprobe analyses.
Element Standard Standard Standard Net Peak: L.L.D. Concentration Factor Intensity (%) (%) (c.s· l )
Si Pure 100 0.801 18277 0.03
Ti Pure 100 0.894 13225 0.02
AI Spinel 71.66 0.613 12359 0.02
Cr Chromite 48.95 0.918 8492 0.03
Fe llmenite 33.37 0.866 1557 0.02
Mn rhodonite 40.77 0.837 1721 0.01
Mg Spinel 28.34 0.6635 5852 0.02

Sampling and analytical techniques 64
4.3.5 X-ray diffraction studies
The identity of mineral phases was confirmed by standard X-ray powder diffraction
techniques using a Philips 1710 diffractometer and Fe-filtered Co Ka radiation. A
Gandolfi camera was used for single grain XRD studies of the alteration phases of
titanium-bearing minerals. Selected grains were crushed and mixed with gum acacia,
before being rolled into a ball, approximately 0.5 mm in diameter. This method is similar
to that described by Nicol (1975). The ball was then mounted in a Gandolfi powder
diffraction camera, 114.8 mm in diameter, and exposed to Co Ka radiation for 3 to 12
hours. The phases present were identified from their d-spacings, which were measured
on the resulting X-ray photographs.
4.3.6 Transmission Electron Microscopy
Transmission electron microscopy was performed in the Department of Earth Science,
Cambridge, England using a IEOL IEM l00CX microscope. The sample preparation and
methods used during this study are described in Chapter 6.3.

65
CHAYfER FIVE
MINERALOGY OF THE IRON-TITANIUM OXIDES
5.1 INTRODUCTION
As outlined in Chapter 1, an understanding of the chemistry and petrography of titanium
bearing minerals found in the area of study is important, because their composition affects
both titanium levels and concentrations of impurities or "penalty elements" in potential
ores. Petrography is important, as the minerals occur as both monomineralic and
composite grains consisting of two or more minerals. Many of the mineral assemblages
and textures found in these composite grains have formed in igneous and metamorphic
source rocks, either during crystallization or dldring subsequent events. These textures are
preserved during erosion and transportation and are observed in the coastal sediments,
providing clues to their provenance. The incl~sion of other phases in ore mineral grains
changes their physical properties, Ti02 content and impurity levels, thus affecting their
quality and economic potential.
In this chapter the mineralogy of the titanium-bearing minerals is described in terms of the
chemical and textural variations formed in the original source rock environment.
Variations caused by the alteration of the minerals under conditions of weathering are
described in the following chapter.
5.2 NOMENCLATURE OF THE IRON-TITANIUM OXIDES
The literature on iron-titanium minerals and particularly their alteration products, is
plagued by the inconsistent terminology of different authors and so it is important to define
each term used in this text. Because many of the grains observed consist of two or more
minerals, it is necessary to outline the nomenclature used for composite grains.

Mineralogy of the iron-titanium oxides 66
5.2.1 Mineral Nomenclature
Nearly all the significant titanium-bearing minerals belong to the Ti02-F~03-FeO system.
Although most workers adhere to the nomenclature proposed by Buddington et al. (1963)
(ej. Buddington and Lindsley, 1964) for the end-member and intermediate solid solution
minerals of this , system, the terminology is not universally accepted. The nomenclature
used in this thesis is defined below, with reference to Figure 5.1.
1. Rutile: A tetragonal phase, consisting of Ti02 with minor impurities. Rutile may
contain both ferrous and ferric iron and is termed ferrian-rutile if the iron content
is > 2 per cent. The niobium-rich variety, ilmenorutile, was not found in this
study.
2. Anatase: A tetragonal phase, essentially pure Ti02•
3. Brookite: An orthorhombic phase, essentially pure Ti02.
4. Ilmenite: A rhombohedral (trigonal) phase consisting of FeOTi02, with up to 6 per
cent F~03 in solid solution.
5. Ferrian-ilmenite: A rhombohedral phase containing more than 6 per cent F~03'
after Buddington et al.(1963). The abbreviation Ilmss is used to denote phases with
the composition of ferrian-ilmenite (after Haggerty, 1976a).
6. Hematite «(X-F~03): A rhombohedral (trigonal) phase with a stoichiometry
approaching F~03 (Elsdon, 1975) and with less than 5 per cent Ti02 (Budding ton
and Lindsley, 1964).
7. Titanohematite: A Fe-Ti phase with a stoichiometry of approximately R20 3 (where
R is Fe3+ or Ti4+) and at least 50 mole per cent hematite (Elsdon, 1975).
According to Buddington and Lindsley (1964) titanohematite contains more than
5 per cent Ti02, usually as FeOTi02 in solid solution, with a little excess Ti02.
The abbreviation Hemss is used to denote phases with the composition of
titanohematite (after Haggerty, 1976a).
8. Magnetite: A spinel phase with a stoichiometry approaching F~04 (Elsdon, 1975),
containing less than 5 per cent Ti02.

Mineralogy of the iron-titanium oxides
RutiLe ..Anatase Broolci.U Ltucoxene Ti02
F erropseudobrookite
FeT40s
I I Curie 'Point ("e) at ,
Cell edge (n-m.) aJ; '.If Lines of COttStant FejFe+Ti _ - - --
67
Figure 5.1 The system TiOrFeO-F~03 from Battey (1981), showing the solid solution
series and some of the physical properties of the iron-titanium oxides.

Mineralogy of the iron-titanium oxides 68
9. Titanomagnetite: A phase with an oxide stoichiometry of approximately R30 4
(Elsdon, 1975), which can be recalculated in terms of F~04' 2FeOTi02 or
FeOTi02, or both, with Fe304 as the dominant phase (Buddington et al., 1963).
10. Ulvospinel: An optically homogeneous phase with an inverse spinel structure and
a stoichiometry approaching F~Ti04·
11. Pseudobrookite: An optically homogeneous, orthorhombic iron-titanium phase with
a stoichiometry close to R30 S and having greater than 50 mole per cent F~TiOs
(Anderson, 1968).
12. Ferropseudobrookite: Similar to pseudobrookite, but with less than 50 mole per
cent F~TiOs (Anderson, 1968).
13. Maghemite: The gamma-F~03 formed as an oxidation product of magnetite,
containing < 2 per cent Ti02 in solution (Basta, 1959). Maghemite loses Fe ions
but retains the spinel structure (Battey, 1981).
14. Titanite (sphene): A monoclinic mineral with the general formula CaTiSiOs·
No standard nomenclature exists for the alteration products of ilmenite and the following
nomenclature is used:
1. Hydrated ilmenite: Areas of alteration within altered ilmenite grains (defined
below) which exhibit Ti02 contents between 53 and 60 per cent. These areas are
distinguished microscopically from ilmenite by their grey-blue colour and weaker
anisotropism. The term "hydrated ilmenite" was first used by Dyadchenko and
Khatuntseva (1960) and then Frost et al. (1983), referring to the small quantity of
structurally bound water found within altered ilmenites. Hugo and Cornell (1991)
defined hydrated ilmenite and altered ilmenite with between 53 and 60 % Ti02.
2. Pseudorutile: a deformed hexagonal, oxyhydroxide close to F~ Ti30 9 (Temple and
Tuefer, 1966; Grey et al., 1983), or Fe1.5Ti307.s(OH)1.5 with an extended range of
homogeneity (60 to 70 per cent Ti00 due to hydrogen exchange for iron during
hydration (Dyadchenko and Khatuntseva, 1960; Frost et al., 1983). Under
reflected light isotropic pseudorutile is blue-grey in colour with a slightly higher
reflectance than ilmenite. The mineral is difficult to identify positively as these

Mineralogy of the iron-titanium oxides 69
optical properties are often indistinct and its major XRD peaks exhibit d-spacings
similar to those of ilmenite, rutile and hematite. Historically pseudorutile was
called arizonite (Palmer, 1909) or proarizonite (Bykov, 1964).
3. Leucoxene: this term is used to describe inhomogeneous, cryptocrystalline, high
Ti02 (greater than 70 per cent) products of ilmenite alteration, following the
terminology of Temple (1966), Grey and Reid (1975), Dimanche and Bartholome
(1976) and Frost et al. (1983). Leucoxene is distinguished optically from rutile or
anatase by its characteristic sugary, internal reflections, although it may consist
almost entirely of crypto- or microcrystalline rutile, anatase or brookite in the final
stages of alteration. Golding (1961) quite correctly argues that leucoxene may
form from the alteration of any titanium-bearing mineral, such as titanomagnetite
or titanite and that these different leucoxenes, with markedly different
compositions, should not all be grouped together under one name. From a
petrographic point of view, however, it is impractical and at times very difficult,
to distinguished the large variety of leucoxene grains encountered and hence the
broader use of the word is preferred by the author.
5.2.2 Grain Nomenclature
Titanium-bearing oxides are found in both homogeneous and composite grains and the
grain forms the fundamental unit when determining mineral proportions in sediments. The
mineral make-up and genesis of these composite grains is varied and it is necessary to
classify such grains in a consistent way. The most common mineral in the grain is given
first followed by the next most important phase, connected by a hyphen. Minor minerals,
which may be absent, are added using the symbol " ± ". Examples of the nomenclature
of some of the commonly observed composite grains of titanium-bearing minerals are
given below:
1. Ilmenite-hematite (Ilm-Hem): These grains usually consist of ex solved lamellae of
Hemss in ilmenite or Ilmss.
2. Magnetite-ilmenite (Mt-Ilm): These grains usually consist of intergrowths of
ilmenite in magnetite formed by oxyexsolution.

Mineralogy of the iron-titanium oxides 70
3. Hematite-rutile + ilmenite ± pseudobrookite (Hem-Rut±Ilm±Psb): These grains
are usually formed by the high temperature oxidation of ilmenite.
4. Ilmenite-rutile (Ilm-Rut): These grains are usually formed by the hydrothermal or
supergene alteration of ilmenite or oxidised ilmenite grains.
5. Titaniferous magnetite: A general term for a titanium-bearing magnetite with no
implications as to whether the grain consists of homogeneous titanomagnetite or
magnetite containing micro-intergrowths (Budding ton et al., 1963).
6. Titaniferous maghemite: This is a general term for titanium-bearing maghemite
without implications as to whether the mineral is homogeneous or contains Ti-rich
intergrowths (Reynolds, 1978b).
In parts of the thesis and in particular this chapter, it is important to interpret petrology
of the composite grains and then the following abbreviations are used as subscripts to
denote the genesis of the grains:
1. ss = solid-solution of two phases, for example, titanohematite may be abbreviated
as Hemss to denote that the hematite contains some ilmenite in solid-solution.
2. ex = true ex solution of one phase in a solid solution series from another, for
example, ulvospinel ex solved from magnetite may be abbreviated Mlss -U sPeX" In
some instances both phases of a solid-solution series may exsolve from each other,
in which case both minerals are enclosed in brackets, for example, (Ilffiss-Heffiss)eX"
3. ox = high temperature oxidation as described by Haggerty (1976a), for example,
a grain consisting of ilmenite, titanohematite and rutile formed by the oxidation of
ilmenite may be abbreviated as Ilm-(Hemss-Rut)ox.
4. oe = oxyexsolution (oxidation-ex solution) of one phase from another, for example,
ilmenite intergrowths in titanomagnetite, formed by the above process, may be
abbreviated as Mlss-Ilffioo.
5. alt = alteration of one phase to another by either hydrothermal or supergene
alteration, for example, the alteration of ferrian-ilmenite to rutile by such a process
may be abbreviated as Ilmss-RutaJt.

Mineralogy of the iron-titanium oxides 71
The grain nomenclature of ilmenite altered by weathering used in this thesis is of a slightly
different nature, although based on the same principles. Two broad types of composite
grains are recognised:
1. Altered ilmenite grains: grains consisting of mixtures of + ilmenite + hydrated
ilmenite + pseudorutile with very little or no microscopic leucoxene present, that
is, grains in the composition range TilTi + Fe: 0.5 to 0.7.
2. Highly altered ilmenite: grains consisting of mixtures of leucoxene (as defined
above) ± ilmenite ± hydrated ilmenite ± pseudorutile ± rutile ± anatase.
5.3 THE mON-TITANIUM OXIDES
The titanium-bearing minerals are found exclusively in the heavy mineral fraction of the
samples studied and it is worthwhile comparing the physical properties of the titanium
minerals with other heavy minerals present in deposits within the study area. Table 5.1
lists the iron-titanium oxides and other heavy minerals, together with their physical
properties, abundance and economic importance. The optical properties of the minerals
observed under reflected and transmitted light are given in Table 5.2. A summary of the
structures of the iron-titanium oxides is given in Table 5.3.
Descriptions of the iron-titanium oxides given below are often specific to the area of study
and more general information about the mineralogy of the Ti02-Fez03-FeO system is
reviewed by Elsdon (1975), Rumble (1976), Haggerty (1976a, 1976b, 1991), Reynolds
(1978b) and Frost (1991a).

72
Table 5.1 Physical properties of iron-titanium oxides and other heavy minerals found along the east coast of South Africa.
Mineral Formula Density Magnetic Electrical Percent Economic g.cm-3 Susceptibility Conductivity valuel
Oxides
Ilmenite FeTi03 4.7 mod-high high c-a high
Hematite o:-Fe.z03 4.9-5.2 mod mod r-c low
Rutile Ti02 4.2 non high p-c high
Anatase Ti02 4.2 non high r-p high
Brookite Ti02 3.8 non high r mod
Magnetite Fe2+Ftf+P4 5.2 v. high p-c low
UlvQspinel Fe2+ 2Ti4+0 4 4.8 mod r-p low
Chromite Fe2+CrP4 4.1-4.9 mod mod r-p low
Maghemite r-Fe.z°3 4.9-5.2 low-mod non r none
Goethite FeO.OH 4.3 low-mod non r-c none
Pseudobrookite Ftf+2TiOs 4.3 low-mod mod r none
Pseudorutile Ftf+ 2TiP9 4.2 mod-high mod p mod
Leucoxene high Ti02 phase 3.6-4.2 non-mod mod p-c mod
Silicates
Augite (Fe,Mg,Ca)Si03 3.1-3.6 low non p-c poss
Diopside Ca(Mg,Fe)Si20 6 3.2 non-low non p poss
Hornblende Complex hydrated 3.2 mod mod p-a none silicate
Almandine Fe2+ 3~(Si04)3 4.3 mod mod p-c mod
Grossular Ca~Al~(Si04h 3.6 mod mod r-p low
Zircon ZrSi04 4.7 non non p-c high
Epidote C~(Al,FeMSi04)3OH 3.2-3.5 low-mod non r-p none
Tourmaline B,Fe,Al complex 3.0-3.2 mod mod r mod silicate
Titanite (sphene) CaTiSiOs 3.4-3.5 low non-mod r-p low
Kyanite Al2SiOs 3.6 low non r none
Phosphates
Monazite (La,Ce,Th)P04 4.9-5.3 low-mod non r-p high
Apatite Cas(P04)(F,OH,CI) 3.2 non-low mod r-p none
(r = trace or < 1 %; p = 1-10 %; c = 10-20 %; a= > 20 %; mod = moderate; pass = possible value)
1 Economic value within east coast heavy mineral deposits.

Table S.2A Optical properties of the opaque minerals found along the east coast of South Africa, as observed in reflected light, under oil. Quantitative data may be found in Craig and Vaughan (1981), Ramdohr (1980) and Uytenbogaardt and Burke (1971).
Mineral Colour Reflectance Bireflectancel Anisotropism Internal Notes Pleochroism Reflections
Ilmenite pinkish-brown moderate moderate-strong strong none similar in colour to magnetite, but > chromite blue to green strongly pleo. and anisotr. < rutile
Hydrated Ilmenite light blue-grey moderate moderate - moderate-isotropic none optical properties change with > ilmenite decreases with increasing alteration from ilmenite to < rutile inc. alteration psr.
Pseudorutile blue-grey moderate weak to none isotropic none > ilmenite = rutile
Rutile blue-grey moderate slight moderate-strong strong - yellow, IR often mask anisotropism > magnetite orange and red twinning common < hematite
Anatase blue-grey moderate very faint obscured by IR strong - white or = rutile blue-grey
Brookite grey
Leucoxene light-blue grey moderate obscured by IR obscured by IR very strong - IR oten mask other properties often masked by > rutile brown, yellow Colour of IR change with TiC\ strong IRI and white content.
Hematite light-grey to white moderate weak strong, blue and strong, red IR twin laths commonly observed highest of grey often found under X-Polars oxides titanohematite is greyer than hematite
Magnetite light brown moderate none isotropic none martitisation of magnetite common > ilmenite < rutile
~

Figure S.2A (Cont.) Optical properties of opaque minerals
" Mineral Colour Reflectance Bireflectancel Anisotropism Internal Notes
Pleochroism Reflections (IR)
Magnetite light brown moderate none isotropic none martitisation of magnetite common > ilmenite < rutile
Goethite blue-grey low-moderate weak strong strong - red colloform banding may be present < ilmenite grains usually porous and
inhomogeneous
Maghemite blue-grey low-moderate weak weak none porous mineral, usually associated < ilmenite with magnetite
Chromite grey low none isotropic none homogenous, dark grey grains < maghemite > silicates
Cr-spinel green-grey low weak isotropic none commonly show growth zoning -< ilmenite grey core and greenish margins > chromite
Pseudobrookite grey low none very weak none found as small blebs, formed by the < ilmenite oxidation of ilmenite or Ti-magnetite > chromite
~

Table S.2B Optical properties of transparent minerals found in heavy mineral deposits along the east coast of South Africa. All observations made in transmitted light. See Saggerson (1986) and Heinrich (1965) for more detailed descriptions.
Mineral Colour Shape Cleavage Relief Birefringence' Optic Picture Notes
Quartz colourless sub- to rounded none low low-pt order U (+)
Zircon c.less-pale pink, green eu-to anhedral, clear none very high high - colour rings U (+) growth and sector zoning crystal faces, prismatic common common, metamict grains grains, often fractured common
Monazite c.less to dull yellow well rounded, small, none very high, high - diffuse B (+) sometimes difficult to spherical grains < zircon colour rings distinguish from zircon
common
Sphene yellow to brown, sub- to rounded none high, high B (+) grains are often partly granular appearance < monazite altered
Epidote c.less to pale yellow, rounded, elongated usually none medium medium - B (+) anomalous yellow and may be slightly anomalous blue interference colours pleochroic common
Garnet c.less to pink large, subrounded none medium to high, isotropic may contain numerous hexagonal > epidote inclusions
Pyroxenes c.less to pale green, subrounded, elongated, good, medium 2M to 3rd order B (±) may be difficult to may be slightly prismatic to tabular 2 at 90° positively identify pleochroic
Amphiboles pale green to brown subrounded, tabular good, 2 at 60° medium 2M to 3rd order B (±) may be difficult to and dark green, and 120° . distinguish from pyroxene pleochroic.
Apatite c.less to pale green well rounded none low to medium bird' s eye texture U (-) mottled interference under X Polars colours under cross-
polars.
Tourmaline bright green-blue, sub-rounded none medium greens and blue U (-) may display zoning pleochroic
, high interference colours are common because the polished thin-sections are usually greater the 30 /lm in thickness.
~

Mineralogy of the iron-titanium oxides 76
Table 5.3 Summary of iron-titanium oxide structures.
Oxide System Unit Cell (run) Space Group Reference
Rutile Tetragonal (+) a 0.459 P42/m nm Deer et al. C 0.296 (1962)
Anatase Tetragonal (-) a 0.378 14/a md C 0.951
Brookite Orthorhombic a 0.5446 Pcab b 0.9184 c 0.5146
Ilmenite Trigonal ahex 0.5089 R3 chex 1.4163
Hematite Trigonal ahex 0.5035 R3c chex 1.3749
Pyrophanite Trigonal ahex 0.5137 R3 Lindsley (1976) Chex 1.429
Geikielite Trigonal ahex 0.5054 R3 chex 1.389
Magnetite Cubic a 0.8396 Fm3m
Ulvospinel Cubic a 0.8536
Chromite Cubic a 0.8378
Maghemite Cubic or a 0.833-0.834 P4332 Tetragonal c,e,3a P41(P43)
Pseudobrookite Orthorhombic a 0.9767 Bbmn Bowles (1988) b 0.9947 c 0.3717
Pseudorutile Hexagonal a 1.4375 P6322 Grey and Reid c 0.4615 (1975)

Mineralogy of the iron-titanium oxides 77
5.4 THE Ti02 POLYMORPHS: RUTILE, ANATASE and BROOKITE
5.4.1 Structure
As determined by Vegard (1916 and 1926) and Greenwood (1924), the internal structure
of rutile consists of Ti ions in six-fold coordination with oxygen ions at the corners of a
slightly distorted regular octahedron. Each oxygen atom is surrounded by three Ti ions
at the apices of an approximately equilateral triangle. The co-ordination of the titanium
and oxygen atoms in anatase is the same as in rutile, but the sequence of co-ordination
octahedra differs between the two minerals (pauling and Sturdivant, 1928). In rutile, the
octahedra form chains parallel to (001), (Figure 5.2A). In comparison, the anatase
structure contains no distinct chains (Figure 5.2B). The structure of brookite is more
complex than that of rutile (Lindsley, 1976), as the Ti ions are displaced from the centres
of the deformed co-ordination octahedra, which form zig-zag chains (Figure 5.2C).
Anatase is thermodynamically stable only at low to moderate temperatures and will convert
to rutile at approximately 600°C (Dachille et al., 1968), although this is pressure
dependent. Rutile is stable over a wide range of temperature and pressure, which accounts
for its common occurrence in metamorphic rocks. The mineral is also known to form as
an alteration product of ilmenite in the weathering environment (Temple, 1966; Grey and
Reid, 1975). Brookite is metastable (Bach, 1962; Elsdon, 1975) and readily transforms
to rutile or anatase.
5.4.2 Mineral chemistry
Although rutile consists essentially of Ti02, the mineral may contain varying amounts of
Fe2+, Fe3
+, Nb, or Ta and minor amounts of Cr, Al and Si. Isomorphou~ replacement of
Ti4+ by Nb5+ and Ta5+ can occur as they have similar ionic radii. Electrostatic balance
is maintained by either lattice vacancies, or by the complementary substitution of Fe2+"
Fe3+, or cr3+ ions (Deer et al., 1962). In some cases, however, the iron may occur as
fine inter~rowths of ilmenite or hematite.
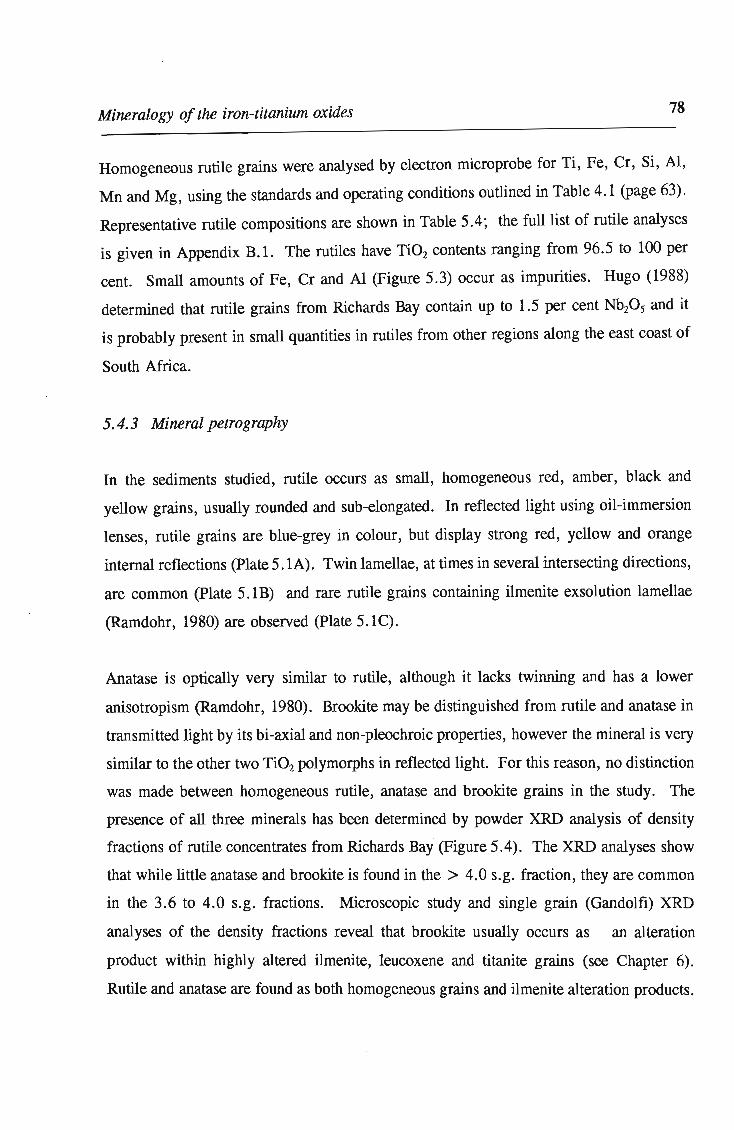
Mineralogy of the iron-titanium oxides 78
Homogeneous rutile grains were analysed by electron microprobe for Ti, Fe, Cr, Si, AI,
Mn and Mg, using the standards and operating conditions outlined in Table 4.1 (page 63).
Representative rutile compositions are shown in Table 5.4; the full list of rutile analyses
is given in Appendix B.I. The rutiles have Ti02 contents ranging from 96.5 to 100 per
cent. Small amounts of Fe, Cr and Al (Figure 5.3) occur as impurities. Hugo (1988)
determined that rutile grains from Richards Bay contain up to 1.5 per cent ~05 and it
is probably present in small quantities in rutiles from other regions along the east coast of
South Africa.
5.4.3 Mineral petrography
In the sediments studied, rutile occurs as small, homogeneous red, amber, black and
yellow grains, usually rounded and sub-elongated. In reflected light using oil-immersion
lenses, rutile grains are blue-grey in colour, but display strong red, yellow and orange
internal reflections (Plate 5.1A). Twin lamellae, at times in several intersecting directions,
are common (Plate 5.1B) and rare rutile grains containing ilmenite ex solution lamellae
(Ramdohr, 1980) are observed (Plate 5.1C).
Anatase is optically very similar to rutile, although it lacks twinning and has a lower
anisotropism (Ramdohr, 1980). Brookite may be distinguished from rutile and anatase in
transmitted light by its bi-axial and non-pleochroic properties, however the mineral is very
similar to the other two Ti02 poly morphs in reflected light. For this reason, no distinction
was made between homogeneous rutile, anatase and brookite grains in the study. The
presence of all three minerals has been determined by powder XRD analysis of density
fractions of rutile concentrates from Richards Bay (Figure 5.4). The XRD analyses show
that while little anatase and brookite is found in the> 4.0 s.g. fraction, they are common
in the 3.6 to 4.0 s.g. fractions. Microscopic study and single grain (Gandolfi) XRD
analyses of the density fractions reveal that brookite usually occurs as an alteration
product within highly altered ilmenite, leucoxene and titanite grains (see Chapter 6).
Rutile and anatase are found as both homogeneous grains and ilmenite alteration products.

Mineralogy of the iron-titanium oxides 79
c
5.2A
T c
13=--~#----'-'V
S.2B S.3C
Figure 5.2 The structures of the Ti02 poly morphs rutile, anatase and brookite (from
Lindsley, 1976). A. Four unit cells of rutile showing the octahedra of oxygens about the
Ti at the centre of each cell. B. Two unit cells of anatase showing the distorted octahedra
of oxygens about the Ti (the shared edges (s) are shorter than the unshared edges. C. The
chain of distorted oxygen octahedra about the Ti ions which make up the brookite
structure.

Mineralogy of the iron-titanium oxides 80
Table 5.4 Representative rutile microprobe analyses.
Analysis Si02 Ti02 A1203 Cr203 FeO MnO MgO Total
HZ 13 I 98.60 0.02 0.07 0.30 98.99
HZ 13 2 98.59 0.21 0.13 98.94
HZ 13 3 99.88 0.15 - 100.04 HZ 13 4 99.28 0.09 0.10 99.47 HZ 13 5 99.21 0.06 0.09 0.27 99.63 HZ 13 6 99.03 0.36 99.39 HZ 13 7 99.09 0.24 0.16 99.49 HZ 13 8 98.60 0.05 0.25 98.89 HZ 13 9 0.07 98.59 0.13 0.16 0.19 99.14 HZ 13 10 99.04 0.07 0.09 99.20
HN7 1 99.39 0.10 0.26 99 .75 HN7 2 98.71 0.04 0.12 98.87 HN7 3 99.41 0.08 0.21 99.70 HN7 4 99.18 0.06 0.11 99.34 HN7 5 98.46 0.20 98.67 HN7 6 98.59 0.13 98.72 HN7 7 98.75 0.17 98.92 HN7 8 98.73 0.15 98.88 HN7 9 99.93 0.13 - 100.06 HN7 10 99 .56 0.10 0.13 99.79
HT3 99.91 0.03 0.26 - 100.20 HT3 2 99.69 0.10 99.79 HT3 3 0.03 99.95 0.07 0.13 - 100.18 HT3 4 99.02 0.04 0.07 0.07 99.19 HT3 5 99.37 0.06 0.28 99.71 HT3 6 99.10 0.06 0.10 0.17 99.42 HT3 7 99.51 0.03 0.19 0.21 99.93 HT3 8 99.30 0.03 0.11 0.17 99.62 HT3 9 99.56 0.02 0.51 - 100.09 HT3 10 99.81 0.02 0.14 0.19 100.16
HEC5 99.12 0.03 0.47 99.64 HEC5 2 99.40 0.17 99.60 HEC5 3 98.95 0.06 0.21 99.23 HEC5 4 98.87 0.10 99.00 HEC5 5 0.03 99.67 0.05 0.19 99.94 HEC5 6 99.11 0.16 99.28 HEC5 7 99.55 0.18 99.73 HEC5 8 99.33 0.02 99.35 HEC5 9 99.31 0.11 0.05 99.47 HEC5 10 98.98 0.42 99.44
- = below detection limit
HZ 13 - Sodwana Bay, Zululand
HN 7 - Umdloti, Natal
HT 3 - Port St Johns, Transkei
HEC 5 - Kidd's Beach, Eastern Cape

(')
0 N « #.
(')
0 ~ 0 #.
0 .5
0.45
0.4
0 .35
0 .3
0.25
0 .2
0 .15
0 .1
0 .05
0 96
0.5
0.45
0.4
0 .35
0 .3
0 .25
0 .2
0 .15
0 .1
0 .05
0 96
97
97
*
x
o o
98
98
5.3A
0
+
0
+
99 % Ti02
5.38
o
99 % Ti02
5.3C
+ Zululand
x Natal
o Transkei
* Eastern Cape
0
100 101
+ Zululand
x Natal
o Transkei
* Eastern Cape
100 101
102
102
1.2..--------------.---------,
0 .8
0 (I)
0.6 u.. if.
0.4
0 .2
0 96 97
x x x
* o x
o
* o
+ Zululand
x Natal
o Transkei
* Eastern Cape
+ x 0
o:.:~~ 98 99
% Ti02 100 101 102
81
FigureS.3 Variation of Al20 3 • Cr20 3 • and Fe (as FeO) with T i0 2 for selected rutile
grains from the east coast of South Africa. The rutile grai ns contain low impuri ty level s
and no regional variations in the composition of grain s is evident.

Plate 5.1 Photo micrographs of rutile grains under plain-polarised reflected light using a
32x oil immersion lens. The single scale bar shown refers to each plate.
A. Homogeneous rutile grain displaying strong internal reflections. Richards Bay,
dune (HZ 17). Scale bar 75 /-tm.
B. Rutile grain displaying intersecting sets of twin lamellae. The dominant set
probabl y formed as a result of strain. Richards Bay, dune (HZ 17).
Scale Bar 75 /-tm.
C. Rare rutile (light grey) grain containing orientated lensoid lamellae of ex solved
ilmenite (medium grey). The thin, straight lamellae (medium grey) are rutile
twins. Port Durnford, dune (HZ 2). Scale Bar 50 /-tm.

82
Plate 5.1

83
... .c:::::====:..
... .c t\I
0 \0
... .c ... t\I
CD C"I
0 @ 10
~ Cl .c
t\I
... -=====:::=.
'-c:=--
... _-==========::-~c:================:
A..LISNH.LNI
Figure 5.4 Powder XRD traces of Ti02 poly morphs in rutile and leucoxene concentrates
from Richards Bay Minerals. A. Rutile concentrate 4.0 g.cm-3 sink fraction. B. Rutile
concentrate 3.8 to 4.0 g.cm-3 fraction. C. Leucoxene concentrate 3.8 to 4.0 g.cm-3
fraction. r = rutile; a = anatase; b = brookite; ab = peak formed by both anatase and brookite; q = quartz; z = zircon.
Mineralogy of the iron-titanium oxides 84
5.5 ILMENITE-HEMATITE SERIES
5.5.1 Structure
Ilmenite (R3) and hematite (R3c) have very similar rhombohedral structures (Table 5.3).
The rhombohedral unit cells are more conveniently treated as hexagonal cells (Lindsley,
1976) and hexagonal ilmenite and hematite indices are used. The two minerals form a
continuous solid solution series at high temperatures (greater than circa 800°C), but a
miscibility gap results in ex solution at lower temperatures (Lindsley, 1976). The minerals
form either a disordered ilmenite-hematite or an ordered ilmenite-hematite solid solution
series, depending on temperature and mole per cent FeTi03 (Nord and Lawson, 1989,
Figure 1).
The hematite structure consists of sheets of oxygen anions forming a nearly hexagonal,
close-packed array lying parallel to (0001). In pure hematite the cations consist of Fe3+,
which occupy two-thirds of the potential cation sites (Figure 5.5A) (Lindsley, 1976). In
high-temperature, disordered ilmenite-hematite solid solutions, Fe3+, Fe2 + and Ti4 + are
randomly distributed in the cation sites (Nord and Lawson, 1989). In the ordered ilmenite
hematite (R3) series, the cations occupy the same positions as in the disordered form, but
are segregated into alternating layers along the c-axis (Figure 5.5B), so that the sequence
of cations along the (0001) axis is Fe-Ti-O-Ti-Fe-O-Fe (Lindsley, 1976), where 0
denotes a vacancy.
The rare minerals pyrophanite (MnTi03) and geikielite (MgTi03) are isomorphous with
ilmenite, although their unit cell dimensions differ slightly (Table 5.3). Although
considerable substitution of Mg and Mn for Fe2+ in ilmenite can take place, the mineral
usually contains only small amounts of these elements (Deer et al., 1962). Magnesium
and manganese-rich ilmenites are termed picroilmenites and manganoan ilmenites,
respectively.

Mineralogy of the iron-titanium oxides 85
5.5A
~--aj3 )
5.5B
A
c
A
~--aj3--+
Figure 5.5 The structure of hematite and ilmenite-hematite projected on to the (1120)
from Nord and Lawson (1989). A. The structure of R3c hematite or disordered ilmenite--
hematite. B. The structure of R3c ilmenite-hematite. The small circles represent Fe and
Ti cation sites and the large circles represent oxygen atoms.

Mineralogy of the iron-titanium oxides 86
5.5.2 Ilmenite-hematite chemistry
As outline above, ilmenite may contain significant amounts of FeH, Mn and Mg in solid
solution and small or trace amounts of V, Cr, Ni, eu, Zn, Si and AI. Ilmenite grains
were analysed for Ti, Fe (as Fe2+), Mn, Mg, er, Al and Si by electron microprobe using
the standards and operating conditions outlined in Table 4.1 (page 63). Vanadium could
not be analysed because of the large overlap between the Ti KB and V Ka x-ray lines.
Step scans across the peak positions of Ni, Cu and Zn revealed that these elements
occurred in ilmenite grains in concentrations below the detection limit (generally about
0.02 per cent) of the instrument for the counting time selected (30 seconds for peaks, 10
seconds for backgrounds), so they were not included in the analyses. The F~03 content
and the mole proportions of FeTi03, MnTi03, MgTi03 and F~03 in ilmenite was
calculated from stoichiometry on the basis of three oxygen formulae, as outlined by
Stormer (1983).
Initially, a number of points were analysed in several ilmenite grains to determine the
degree of chemical variation and zonation. These analyses (Table 5.5) show that there is
no zonation. Thereafter each grain was analysed once, unless it consisted of two or more
phases, or displayed signs of alteration. Between 20 and 70 optically homogeneous
ilmenite grains were analysed in each sediment sample. Representative ilmenite analyses
are given in Table 5.6; the full results are given in Appendix B.2.
Variations in the chemistry of ilmenite are best illustrated by the quaternary plot of
FeTiOrF~03-MgTi03-MnTi03 mole proportions, as shown in Figure 5.6. This plot
shows that many east coast ilmenites have compositions close to FeTi03 with less than 20
mole per cent Mn and Mg present. The calculated F~03 contents are more variable, but
rarely exceed 20 mole per cent.
Tsusue (1973), Neumann (1974) and Haggerty (1976b) noted that MgO and MnO contents
of ilmenite may be correlated with the bulk composition of the host rock in which the
ilmenites crystallised. Ilmenites formed in ultrabasic and basic rocks have high MgO

Mineralogy of the iron-titanium oxides 87
values, while those crystallised in felsic,. particularly peralkaline, suites have high MnO
contents (Neumann, 1974). The increase in (Mn2+ I Fe2+)ilm with increasing
(Mn2+ IFe2+)magma is more pronounced for crystallisation at lower temperatures and with
increasing Differentiation Index (DI), or Si02 content of the host rocks (Buddington and
Lindsley, 1964; Lipman 1971; Neumann, 1974). This is caused by the enrichment of
Mn in low-temperature magma residues and the similarity between the ionic radii of Fe2+
(0.086 nm) and Mn2+ (0.091 nm) allowing for substitution in the ilmenite octahedral site.
Oxygen fugacity (/02) is a major factor controlling the F~03 content of ilmenites. At low
102 Fe2+ is the dominant iron cation , and phases such as Fe2+ 2Ti04 and Fe2+Ti03 are
formed. As 102 increases so does the Fe3+:Fe2+ ratio in rocks, which results in the
stabilisation of Miss and hematite-rich Ilmss (Haggerty, 197 6b).
Table 5.5 Microprobe analyses of single, homogeneous ilmenite grains, which indicate
that such grains show no systematic chemical zonation.
Grain Analysis SiO, TiO, Ai,03 Cr,03 FeO' MnO MgO Total
HN2-GR6 core 0.07 53.22 0.02 42.44 3.88 0.17 99.7
0.07 53 .51 41.50 3.94 0.17 99 .1
52.76 42 .80 3.94 0.16 99.6
52.46 42.80 3.87 0.14 99.3
margin 52.11 0.02 43.43 3.51 0.14 99 .2 -HN2~GR64-c~~;-----O.05-----52~30---------------------43~11-----i65-----0.13-----98~2-----
0.03
53.92
52.47
52.09
43 .37
42.83
43.09
3.21
3.14
2.64
0.12
0.11
0.11
99 .7
98.6
97 .9
margin 52.26 - 41.78 3.22 0.09 97.4 -HN9~RA-c-o~;-----o.03-----5-2~98-----o.03-----o.14-----44~OI-----o.66-----0.51-----98~3-----
53 .03 0.02 0.15 43 .51 0.65 0.51 97.9
53.05 0.02 0.14 43.93 0.66 0.54 98.3
53.48 0.16 42.93 0.59 0.51 97.7
margin 52.30 0.02 0.14 44.16 0.57 0.52 977 -HN9~R56-c~~;-------------49~2i----o.o2-----o.12-----48~19----~26-----O'06-----98~9-----
0.04 50.45 0.03 0.11 47.76 1.05 0.08 99 .5 0.04 50.04 0.02 0.11 47 .72 1.05 0.08 99 .0 0.03 50.03 0.03 0.11 48.03 1.04 0.09 99 .3
margin 0.05 50.27 0.Q2 0.11 48 .11 0.98 0.10 99.6
I All iron reported as F eO. HN2 = Umgababa dune; HN9 = Durban beach; - = below detection limit.

Table 5.6 Representative ilmenite microprobe analyses
Analysis
HZ 17 I
HZ 17 2
HZ 17 3
HZ 17 4
HZ 17 5
HZ 17 6
HZ 17 7
HZ 17 8
HZ 17 9
HZ 17 10
HZ 17 11
HZ 17 12
HZ 17 13
HZ 17 14
HZ 17 15
HN 9 I
HN 9 2
HN 9
HN 9 4
HN 9
HN 9 6
HN 9 7
HN 9 X
HN 9 <}
HN 9 10
HN 9 11
HN 9 12
HN 9 13
HN 9 14
HN 9 15
Si02
0.08
0 .07
0 .04
0.04
0.04
0.05
Ti02
48.14
48.48
50.04
52 .77
51.65
50.38
51.03
51.31
50 .33
52.67
51.89
53 .82
50.17
49.96
47.97
0,06 52 .00
0.10 50,98
0.04
0 .04
52, 88
51.06
50.33
52 ,27
50 .85
50 ,26
53,00
50.04
49 .29
49 .20
52.42
50.43
48.58
A1203
0.07
0.07
0.D2
0.04
0.03
0.04
0.02
0.03
0.04
0.12
0.03
0.04
0.02
0. 05
0.04
0 .02
0.Q3
0.02
0.02
Cr203
0.09
0.46
0.04
0.04
0.08
0.08
0. 04
0 .04
0 .07
MnO
0.80
0.37
0.55
0.68
0.45
0.42
0.67
0.69
2. 15
0.94
0.45
0 .52
0.39
8.75
0.33
3.66
0.48
0.57
0.79
0.43
1.98
0.61
1.13
1.72
0.45
0 .45
0.42
1.84
0 ,51
0.35
MgO
0.06
2.44
0.28
0.06
2.01
0.73
0.07
0.49
0.47
0.05
1.97
1.07
0.82
1.34
0.33
0.78
0.12
1.18
0.08
0 .21
0.22
0.29
0 .24
0.98
0.06
0.19
0.25
FeO
49.43
46 .74
48.25
46 .17
45.10
46 .81
47.46
46.10
44 .93
45 .14
44.78
43 .87
47.72
Recalculated
FeO Fe2Q3
42.46 7.74
38 .88 8.73
43 .94 4.79
46.17 0.00
42.46 2.93
43.62 3.55
45 . 11 2 .61
44 .61 1.65
42.27 2.95
45 . 14 0.00
42.71 2.30
43.87 0.00
43.27 4.94
Total
99.37
98.98
99.61
99.77
99.62
98.75
99.51
98.82
98.70
98.88
99.42
99.35
99.67
40 .21 36.07 4.61 99.45
48.42 40.42
43 .73 43.11
47.00 44.88
44 .78
46.55
46.25
44 .36
46.55
46 .56
45 .01
47.61
48 .52
48.32
44 .71
48 .09
48.67
44 .78
44.91
42.73
44 .36
44 .76
43 .66
45 ,01
44.06
43 .50
42 .09
44.71
44 .52
42 ,91
8.88 99.08
0 .70 99.65
2.35 99.18
0 ,00
1.82
3.91
0 .00
1.99
3 ,22
0,00
3.95
5 .58
6 .92
0.00
3,97
6.40
99 .03
98.74
98.71
98 .73
98.45
98.59
99,75
98.85
99 . 16
99.72
99 .08
99 .64
9855
Calculated mole per cent
FeTi03 MnTi03 MgTi03
84 .34 1.61 0.21
75 .54 0 .73 8 .46
89.12
98.29
86.42
89.85
93.48
93.58
88.17
97.75
87 .59
94 .73
87.28
1.13
1.47
0 .94
0.88
1.41
1.46
4.54
2.05
0.94
1.15
0.79
73.48 18 .04
1.01
0 .24
7.27
2.69
0.25
1.84
1.74
0 .19
7.22
4.12
2.96
Fe203
13.84
15.27
8.74
5 .37
6.58
4.86
3.12
5.54
0.00
4.25
8.98
8.44
79.04 0.66 4 .67 15.63
90 .84
93.35
95.80
94.43
87.58
95.40
94.16
90 .77
96 .27
90,67
88 .06
83.37
95.78
90 .98
86.73
7.82
1.01
1.23
1.67
0.90
4.31
1.29
2.38
3,73
0.94
0 .92
0.84
3.99
1.05
0.73
1.24
2.97
0.45
4.30
0.30
0.78
0 .82
1.06
0.85
3.46
0.23
0.67
090
1.32
4.40
0 .00
3.44
7.22
3.77
6.02
7.32
10. 17
12.33
7 .30
11.64
~ S· ~
~ C ~ ~ s. ~
~' ~
1 .... s' ~
~'
~ ~ '"
00 00

Table 5.6 (Cont.) Representative ilmenite microprobe analyses
Analysis
HT7
HT7 2
HT 7 3
HT7 4
HT 7 5
HT7 6
HT7 7
HT7 8
HT7 9
HT7 10
HT7 11
HT7 12
HT7 13
HT 7 14
HT7 15
HEC 3 I
HEC 3 2
HEC 3 3
HEC 3 4
HEC 3 5
HEC 3 6
HEC 3 7
HEC 3 8
HEC 3 9
HEC 3 10
HEC 3 11
HEC 3 12
HEC 3 13
HEC 3 14
HEC 3 15
Si02
0.05
0.03
0.03
0.04
0 .04
Ti02
49.76
46.86
50.62
51.46
51.05
52.64
49.85
51.38
51.50
51.15
52.86
49.69
49.28
51.41
52.01
52.59
52.46
53.03
52.48
52.78
50.97
51.84
52.25
51.87
50.83
50.56
51.13
50.94
51.57
52.11
HZ 17 - Richards Bay, Zululand
HN 9 - Durban, Natal
HT 7 - Wavecrest, Transkei
A1203
0.10
0.07
0.05
0.02
0.03
0.Q2
0.03
0.06
0.08
0.09
0.09
0.07
0.03
0.06
0.04
0.07
0.06
0.08
0.03
0.06
0.02
0.04
0.05
0.Q2
0.05
HEC 3 - Fish River Mouth, Eastern Cape
Cr203
0.08
0.32
0.04
0.08
0. 11
0.33
0.04
0.37
0.22
0.04
0.18
0.05
MnO
0.47
0.58
0.44
0.51
0.81
3.13
0.47
0.91
1.60
1.08
0.34
0.38
0.35
0.26
0.45
2.32
0.47
0.98
0.51
0.79
0.37
0.90
1.96
0.51
1.56
1.42
1.28
0.81
1.40
0.92
MgO
1.85
0.33
1.72
0. 19
0.12
0.66
0.14
0.34
0.07
1.66
1.50
1.44
0.65
1.32
0.13
0.91
0.29
0.96
0.60
1.35
0.20
0.09
0.88
0.12
0.12
0.22
0 .17
0.06
0.77
FeO
46.51
50.43
45.61
46.97
47.53
44.21
48.06
46.74
45.48
46.18
43.12
46.55
45.81
45.93
45.14
44.80
45 .96
45.45
44.82
45.07
46.12
46.19
45.00
45.86
45.97
46.74
46.25
46.29
45 .78
45.66
Recalculated
FeO Fe203
40.98 6.15
40.96 10.52
42.04 3.97
45.42 1.72
45.07 2.74
43 .97 0.26
43 .18 5.42
45.04 1.89
44.09 1.54
44.78 1.56
43.12 0.00
41.63 5.47
41.39 4.91
44.81 1.24
43 .96 1.32
Total
99.32
99.40
99.17
99.37
99.73
100.21
99.64
99.40
99.20
98 .66
98 .37
98.79
97.49
98.44
99.47
44.76
45 .09
45.45
44.82
45.07
43.06
45.39
44.85
44.58
43.96
43.82
44.29
44.73
44.86
44.59
0.04 100.13
0.96 99.97
0.00 99.84
0.00 98. 89
0.00 99.35
3.40 99.24
0.89 99.26
0. 16 99.38
1.42 99.35
2.24 98.78
3.24 99.21
2.18 99.33
1.73 98.49
0.96 98 .91
1.18 99.64
Calculated mole per cent
FeTi03 MnTi03 MgTi03
81.51
79.37
85.58
94.96
0.94
1.14
0.91
1.08
93 .17 1.69
92.41
86.87
94.00
92.45
94.47
92.89
83.93
84.94
94.65
91.67
94.48
93.85
96.80
95.25
96.01
88.06
95.67
95.13
93 .00
92.01
90.57
92.39
94.34
94.94
92.99
6.65
0.96
1.92
3.40
2.31
0.74
0.78
0.72
0.55
0.95
4.95
0.99
2.11
1.10
1.71
0.77
1.91
4.22
1.07
3.31
2.98
2.71
1.73
3.00
1.94
6.54
1.15
6.22
0.72
0.43
2.36
0.54
1.25
0.26
6.37
5.37
5.27
2.44
4.91
0.49
3.37
1.09
3.65
2.27
4.92
0.73
0.34
3.27
0.46
0.43
0.81
0.64
0.23
2.85
Fe203
11.00
18.34
7.28
3.23
5.09
0.50
9.81
3.55
2.90
2.95
9.92
9.07
2.36
2.47
0.08
1.79
6.25
1.68
0.31
2.67
4.22
6.03
4.09
3.29
1.83
2.22
~ ~ 'C"/ {::S
g ~ s. ~
~. ;::os
I ~ §, ;::os
~'
~
~
QC IC
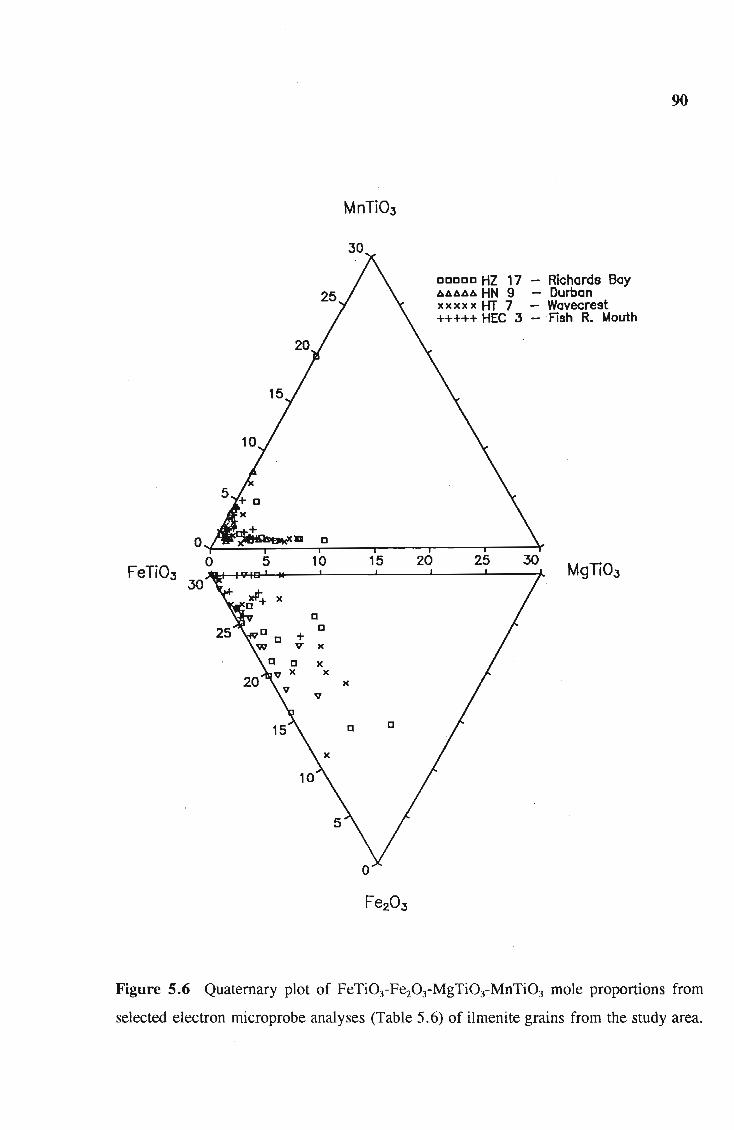
o FeTi03
30
5
D + V
D
10
D D
)(
X X
V
30
15 20
)(
D D
DDDDD HZ 17 - Richards Bay ~~~~~ HN 9 - Durban xxxxx HT 7 - Wavecrest +++++ HEC 3 _ . Fish R. t.4outh
25 30 MgTI03
90
Figure 5.6 Quaternary plot of FeTi03-Fez03-MgTi03-MnTi03 mole proportions from
selected electron microprobe analyses (Table 5.6) of ilmenite grains from the study area.

Mineralogy of the iron-titanium oxides 91
5.5.3 Petrography of the ilmenite-hematite series
Most ilmenites occur as homogeneous, sub- to well-rounded, slightly elongated grains
(Plate S.2A), which vary in size from 75 #-,m to 250 #-,m. Ilmenite is easily recognised
in oil-immersion, reflected light by its pinkish-brown colour, moderate pleochroism and
bireflectance and strong anisotropism.
Small quantities of skeletal ilmenite crystals are commonly observed in fluvial and coastal
sediments. These crystals are almost always surrounded by ferromagnesian silicates, such
as augite, (Plates S.2B and S.2C) which aids their preservation. Skeletal oxide crystals
are formed by the quenching or rapid cooling of magmas. They are derived from
volcanic or hypabyssal rocks, more specifically the basalt, rhyolite, or dolerite of the
Karoo Igneous Province.
Inclusions of augite, plagioclase, pyrite and other minerals are occasionally found within
ilmenite grains. They are either encapsulated in the ilmenite grains (Plate S.2D) during
the growth of ilmenite crystals, or formed by the reaction of ilmenite crystals with the
silicate melt (plate S.2B). The ferromagnesian silicate inclusions tend to alter readily to
clay (Plates S.2E and S.2F), or may be leached completely from the ilmenite. The
inclusions are important as they contribute to the Si, Ca and Al impurities in ilmenite •
concentrates. Modal analysis reveals, however, that the inclusions comprise less than I
per cent in ilmenite concentrates studied (See Chapter 8). A systematic study of the
inclusions in ilmenite grains would provide useful information about the provenance of the
ilmenite grains.
Under slow cooling conditions in rocks of moderate to high ./02, hematite (HemsJ may
ex solve from ferrian-ilmenite to form hemo-ilmenite grains (Ilffiss-Hemss)ex (Plate S.3A),
or ilmenite (ilmss) may ex solve from titanohematite forming ilmeno-hematite grains (Hemss-
Ilmss)ex (Plate S.3B). Typically the exsolutions form lenses parallel to the (0001) direction,
or basal plane, of the host. Often two generations of ex solution are observed (Plate S. 3C).
Ilmenite-hematite ex solution is most extensive in deep-seated anorthosite suites, but may
Mineralogy of the iron-titanium oxides 92
also develop in granites (Haggerty, 1976b). Ilmenite-hematite ex solution may also be
found in a wide variety of rock types of all metamorphic grades (Rumble, 1976), although
Frost (l991a) noted that such textures normally occur in rocks that were oxidised before
or during low-temperature metamorphism.
Titanohematite grains in acid igneous suites may contain both ilmenitess lensoids and rutile
lamellae (Plate 5.3D). The latter occur as z-shaped lamellae (Haggerty, 1976b) with
strong crystallographic control along the (0111) and (0112) planes of the titanohematite
(the "blitz" texture of Ramdohr, 1980). The ilmenite lenses are a result of sensu stricto
ex solution of ilmenite from the titanohematite host, while the rutile lamellae are formed
by oxyexsolution - an ex solution-like process related to oxidation, in the same sense that ~~~~f'~
ilmenite may "exsolve" from magnetite (Haggerty, 1976b). In some instances ilmenitess
lenses may not develop, resulting in assemblages consisting only of hematitess and rutile
(Plate 5. 3E).
llmenite, in igneous and metamorphic rocks may undergo high-temperature deuteric
oxidation. The progress of this oxidation in basalts, as outlined in Table 5.7, has been
described in detail by Haggerty (1976a, 1991). Two examples of this oxidation sequence
are commonly observed as composite grains in samples from Natal and Zululand:
1. Rutile + ferrian-rutile + Hemss as symplectite-like, vermiform or graphic
intergrowths within Ilmm hemo-ilmenite or ilmeno-hematite grains (Plate 5.4).
The assemblage is equivalent to the R5 stage of Haggerty (1976a, 1991), but
texturally is more like the oxidation of ilmenite from rocks other than basalt (cj.
Haggerty 1991, Figure 17 and Figure 20 f-j.).
2. Hemss-Rut±Psb assemblage (Plate 5.5). This assemblage may form by the
oxidation of ilmenite or titanomagnetite corresponding to the R5 and CS stages of
oxidation respectively (Haggerty, 1976a). Small amounts of pseudobrookite are
occasionally observed, indicating that the R6 and C6 stages of oxidation have been
reached. Where ilmenite is the original phase, Hemss and rutile occur in

Mineralogy of the iron-titanium oxides 93
approximately equal proportions. Hematitess dominates the assemblage when
titanomagnetite is the original phase.
Microprobe results from Hugo (1988) indicate that ferrian-rutile in these assemblages can
contain over 10 per cent FeO, while the Ti02 content of the hematitess may be as high as
30 per cent. However, for brevity, the above assemblages are referred to as Ilm-(Rut
Heffiss)ox, or (Rut-Hemss)ox assemblages in this text.
Ilm-(Rut-Hem) assemblages (excluding pseudobrookite) may also be formed by the
hydrothermal or supergene alteration of ilmenite (Ramdohr, 1980; Haggerty, 1976b).
Texturally the grains may resemble those formed by deuteric oxidation, although the rutile
crystals often form a trigonal network of oriented needles in the basal section of the
ilmenite (ej. Ramdohr, 1980, Figure 581; see also Grey and Reid, 1975, Figure 4).
Anatase-hematite intergrowths may also form from ilmenite as a result of hydrothermal
or supergene alteration (ej. Haggerty 1976b, Figure 20 h-j; Ramdohr, 1980, Figure 582).
Subsequent leaching of hematite results in grains containing a porous network of rutile or
anatase microcrystals. Rumble (1976), Ramdohr (1980) and Miicke and Chaudhuri (1991)
have noted that rutile or anatase may form directly from ilmenite during hydrothermal or
supergene alteration. Grains formed as a result of these processes are described in greater
detail in Chapter 6, where they are compared to altered ilmenite grains formed as a result
of weathering.

Mineralogy of the iron-titanium oxides 94
Table 5.7 An outline of the progressive stages of the high temperature oxidation of
magnetite (C series) and ilmenite (R series), from Haggerty (l976a).
Stage Minerals Notes
Cl magnetite .. -ul v6spinel .. optically homogeneous grains
C2 Mt-Usp.,-IlDlue small number of ilmenite lamellae formed along (Ill) magnetite planes by oxyexsolution
C3 Ti-poor Mt with abundant ilmenite may form trellis, sandwich, or composite Ill1\", types of intergrowths in the magnetite host.
C4 Mt-Ill1\", -ferrian-rutileox mottling within the ilmenite lamellae caused by the formation of ferrian-rutile
CS M t -Ill1\", -Rutax - Hel11"x development of rutile and Hem,. by the oxidation of ilmenite. With more intense oxidation, the rutile and hematite also develop within the magnetite
C6 Rutox -Hel11"x-Psb •• ± Mtrclic incipient pseudobrookite •• forms from rutile and hematite along relic magnetite planes
C7 Psb .. -Hem,. most advanced stage of oxidation
RI Ilmenite homogeneous grains of ilmenite
R2 ferrian-Ilm + ferrian wisp-like sigmoidal lenses of ferrian rutile along rutile (0001) and (OIl 1) planes of the ilmenite
R3 ferrian rutile + (ferrian lenses become thicker and more abundant Hm)
R4 Hm + Rutox + Ti-Hel11"x rutile and hematite occur as finely disseminated lamellae in ilmenite host
RS Rutax+Hem.. complete replacement of ilmenite by rutile and Hem,.
R6 Rut + Ti-Hem ± Psb this stage is characterised by the incipient development of Psb ..
R7 Psb-(Rut + Hem) Psb .. and hematite become the dominant phases

Plate 5.2 Back-scattered electron images of ilmenite grains.
A. General view of ilmenite concentrate illustrating the homogeneous, sub- to well
rounded nature of the ilmenite grains. Port Durnford, dune (RZ 2).
Scale Bar 300 /lm.
B. Skeletal ilmenite grain (white), elongated along the c-axis, found within a rock
matrix of pyroxene (medium grey) with minor plagioclase (darkgrey). Note the
deep embayment on the right-hand side of the ilmenite, formed by a reaction
between the mineral and the surrounding melt. Dolerite, Rooi Rand Dyke Swarm,
. Pongola River. Scale Bar 60 /lm.
C. Skeletal ilmenite grams preserved in a rounded gram of altered pyroxene.
Umgababa, dune (RN 2). Scale Bar 60 /lm.
D. . A subhedral pyroxene inclusion (grey) within an otherwise homogeneous ilmenite
grain. Wavecrest, dune (RZ 7). Scale Bar 60 /lm.
E. A pyroxene inclusion displaying partial alteration to clay (grey) within a rounded
ilmenite grain. Cape Vidal, beach (RZ 10). Scale Bar 60 /lm.
F. Clay residue (grey) after the alteration of an inclusion within the ilmenite grain .
.. Port Shepstone, beach (RN 14). Scale Bar 60/lm.
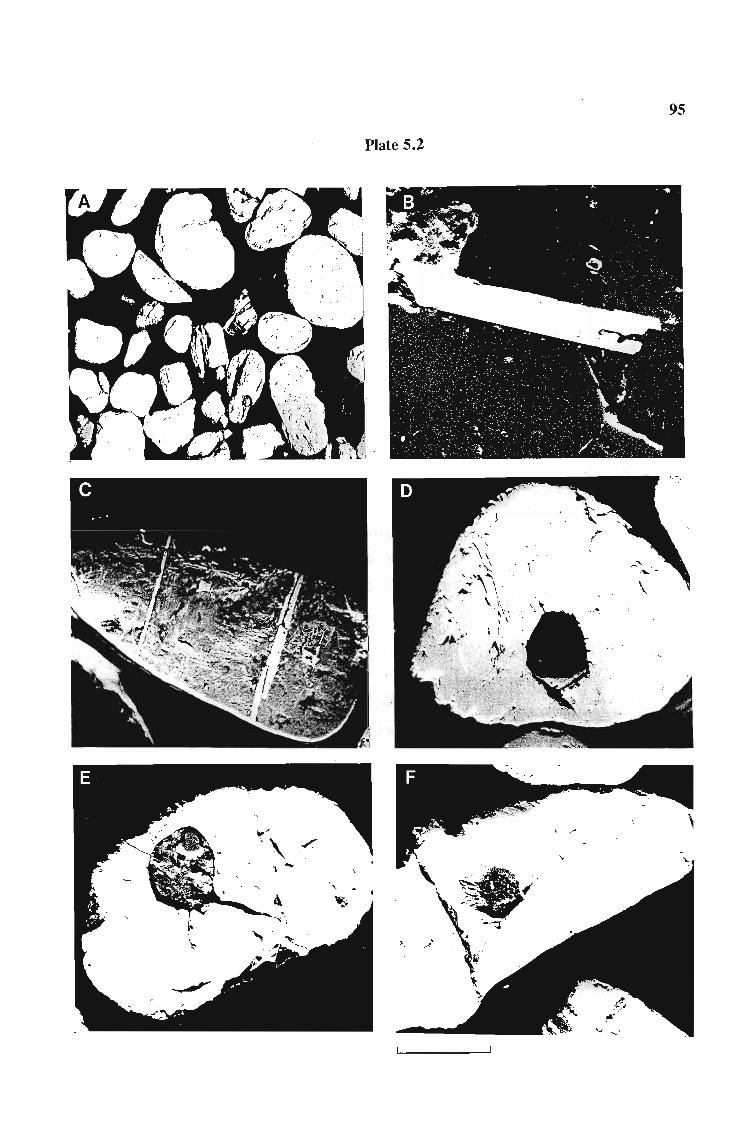
95
Plate 5.2
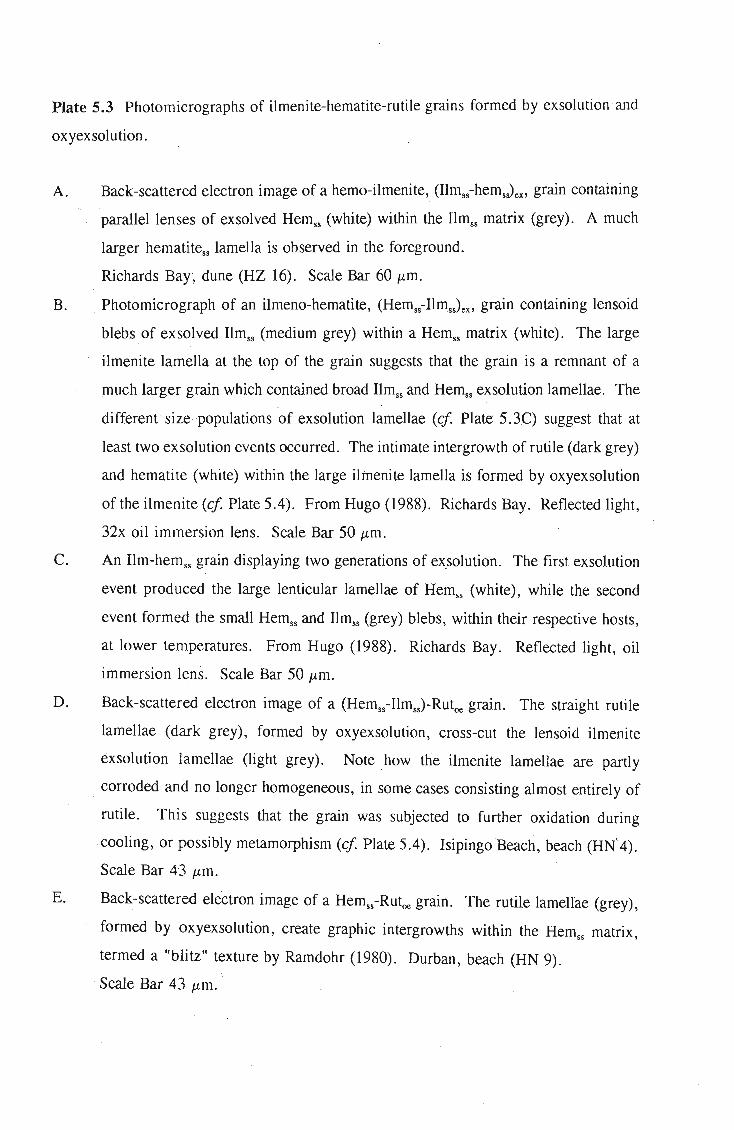
Plate 5.3 Photomicrographs of ilmenite-hematite-rutile grains formed by exsolution and
oxyexsolution.
A. Back-scattered electron image of a hemo-ilmenite, (Hmss-hemsJex, grain containing
parallel lenses of ex solved Hemss (white) within the Hmss matrix (grey). A much
larger hematitess lamella is observed in the foreground.
Richards Bay; dune (HZ 16). Scale Bar 60 Ilm.
B. ... Photomicrograph of an ilmeno-hematite, (Hemss-Hmss)ex> grain containing lensoid
blebs of exsolved Hmss (medium grey) within a Hemss matrix (white). The large
ilmenite lamella at the top of the grain suggests that the grain is a remnant of a
much larger grain which contained broad Hmss and Hemss ex solution lamellae. The
different size populations of ex solution lamellae (ef Plate 5.3C) suggest that at
least two ex solution events occurred. The intimate intergrowth of rutile (dark grey)
and hematite (white) within the large iltnenite lamella is formed by oxyexsolution
of the ilmenite(ef Plate 5.4). From Hugo (1988). Richards Bay. Reflected light,
32x oil immersion lens. Scale. Bar 50 Ilm.
C. An Hm-hemss grain displaying two generations of ex solution. The first exsolution
event produced the large lenticular lamellae of Hemss (white), while the second
event formed the small Hemss and Hmss (grey) blebs, within their respective hosts,
at lower temperatures. From Hugo (1988). Richards Bay. Reflected light, oil
immersion lens. Scale Bar 50 Ilm.
D. Back-scattered electron image of a (Hemss-Hmss)-Rutoe grain. The straight rutile
lamellae (dark grey), formed by oxyexsolution, cross-cut the lensoid ilmenite
ex solution lamellae (light grey). Note how the ilmenite lamellae are partly
. corroded and no longer homogeneous, in some cases consisting almost entirely of
rutile. This suggests that the grain was subjected to further oxidation during
cooling, or possibly metamorphism (ef Plate 5.4). Isipingo Beach, beach (HN'4).
Scale Bar 43 jJ.m.
E. Back-scattered electron image of a Hemss-Rutoe grain. The rutile lamellae (grey),
formed by oxyexsolution, create graphic intergrowths within the Hemss matrix,
termed a "blitz" texture by Ramdohr (1980). Durban, beach (HN 9).
Scale Bar 43 ILm.
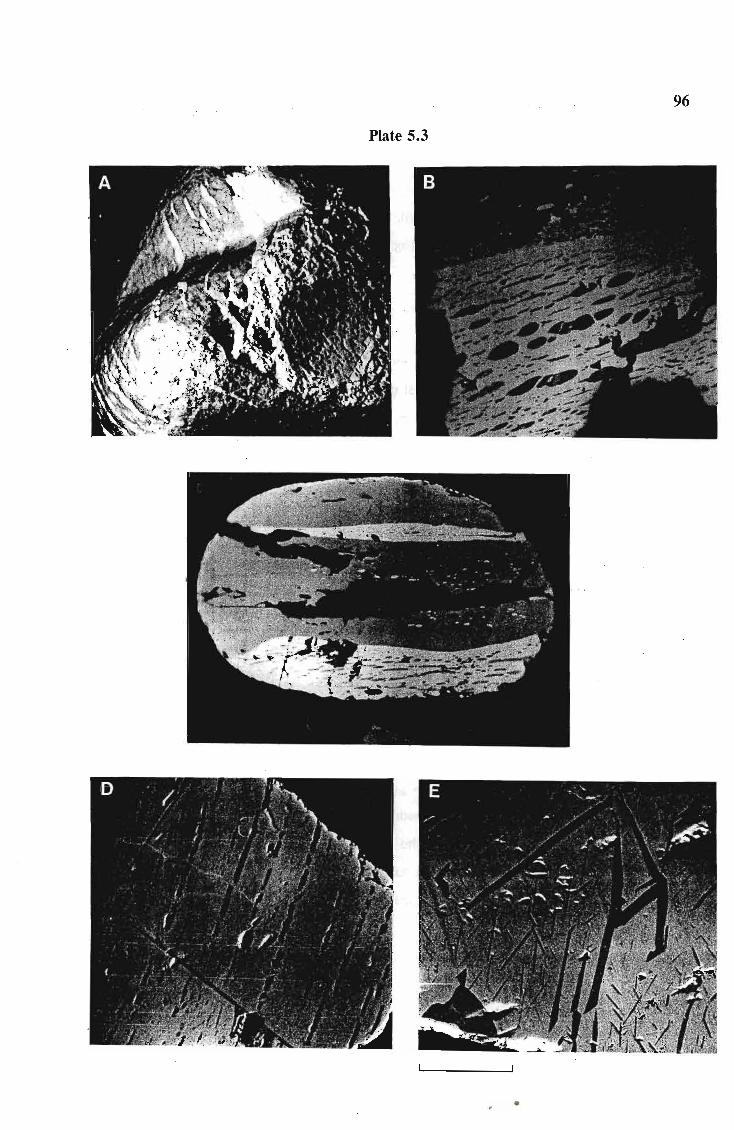
96
Plate 5.3
•

Plate 5.4 Photomicrographs of Rutile + hematitess + ilmenitess intergrowths formed by
the high-temperature oxidation of ilmenite.
A. Vermiform 'intergrowth of ferrorutile (grey) and hematitess (white) formed within
an ilmenite grain. From Hugo (1988). Richards Bay. Reflected light, 32x oil
immersion lens. Scale Bar 50 j.tm.
B. A more advanced stage of oxidation, with the ferrorutile (dark grey) - Rem.s
(white) intergrowth occupying most of the ilmenite (light grey) grain. Note how
the Hemss has been partially leached from the grain. The complete removal of
, hematite, probably by acidic ground water in the weathering environment, results
in the formation of ilmenite-rutile grains (see Chapter 6 for details). Port
Shepstone, beach (HN 14). Back-scattered electron image. Scale Bar 43 j.tm.
C. Partial oxidation of ilmenite (medium grey) to rutile (dark grey) + Hemss (light
grey) within an, (Ilmss-HemsJ ex grain. Note how the ex solution lamellae of Hem.s
have been recry'stallised during oxidation. Umdloti, dune (HN 7). Back-scattered
electron image. Scale Bar 20 j.tm.
D. (Remss-Ilmss)ex-Rutoe grain In which the some of the ilmenite lamellae have
undergone oxidation to rutile (dark grey) and hematite (light grey). In some cases
the rutile-hematite intergrowths pseudo morph the ilmenite lamellae (top, left-hand
'side), whilst in other instances the lameilae have been partly corroded by the
recrystallisation of hematite (right-hand side lamella). Isipingo Beach, beach
(RN 4). Back-scattered electron image. ,·Scale bar 30 j.tm.

97
Plate 5.4

Plate 5.5 Back-scattered electron images of hematitess-rutileox±pseudobrookite grains
formed by the high-temperature oxidation of i1menite.
A. Grain consisting entirely of intergrown Hemss (white) and Rutox (grey)
corresponding to the R5 stage of Haggerty's oxidation sequence. Tugela River
Mouth, beach (HZ 1). Scale bar 50 J-tm.
B. Complete oxidation of ilmenite in an (Ilmss-HemsJex grain to fine-scale rutile (grey)
and hematitess intergrowths. Note how the Hemss ex solution lamellae have been
preserved. 'Durban, beach (HN 9). Scale bar 43 J-tm.
C. Sub-graphic intergrowth of ferrorutile (grey) and hematitess (white) after complete
oxidation of an ilmenitess or (Ilm-Hem)ex. Richards Bay, dune (HZ 16).
Scale bar 43 J-tm.

98
Plate 5.5

Mineralogy of the iron-titanium oxides 99
5.6 MAGNETITE-UL VOSPINEL SERIES
5.6.1 Structure
Magnetite (Fe3+[Fe2+Fe3+]04) has a face-centred, cubic, spinel structure. The unit cell
consists of 32 oxygens, which form a nearly cubic-dose-packed framework along (111);
the divalent and half the trivalent cations occupy octahedral sites, while the remaining
trivalent cations occupy tetrahedral interstices between the oxygen layers (Lindsley, 1976) .
The spine1 structure is able to accept many cations with a wide range of valencies
(Linds1ey, 1976) and as a result magnetite forms solid-solution series with ulv6spinel
(TiF~04)' chromian spinels and the pleonaste series (FeAI20 4-MgAI20 4). The entire range
of composition between magnetite and u1v6spinel is possible, but because of the very low
. oxygen fugacity required for the formation of stoichiometric ulv6spinel, this mineral is
rare. U1v6spinel usually oxidises to ilmenite to form M~s-Illl\e grains (Elsdon, 1975;
Haggerty, 1976b).
5.6.2 Mineral chemistry
In addition to significant amounts of Ti, magnetite may also contain AI, Cr and V
substituting for Fe3+, while Mg, Mn, Ca and Co substitute for Fe2+ (Elsdon, 1975).
Buddington et al. (1963) determined that the Ti02 content of titaniferous magnetites
decrease with increasing SiDz content of the host rock from basic to felsic. Magnetite
from basic rocks of the Karoo Province is thus expected to have higher Ti02 contents (5
to 30 per cent) than those from granitoids « 5 per cent TiDz) in the Natal Metamorphic
Province. In addition, the spinel minerals tend to re-equilibrate readily during cooling via
inter-grain reactions. As a result magnetites in slow-cooled igneous or metamorphic rocks
have compositions close to pure F~04' with only small amounts of Ti02 « 1 per cent)
and trace amounts of other elements (Frost and Lindsley, 1991; Frost, 1991b).
Titaniferous magnetite and magnetite are therefore expected to be good indicators of
provenance.

Mineralogy of the iron-titanium oxides 100
Magnetite grains were analysed by electron microprobe for Ti, Fe (reported as FeO), Mn,
Mg, Cr, Al and Si as outlined in Table 4.1 (page 63). Homogeneous grains were
generally analysed, but some magnetite grains containing ilmenite, ulv6spinel or pleonaste
intergrowths were also analysed. The FeO and F~03 contents were recalculated from the
probe analyses by stoichiometry on the basis of four cation.s, after Stormer (1983).
Representative magnetite analyses are shown in Table 5.8 and the full list of magnetite
analyses is given in Appendix B.3.
The chemical variation in magnetite grains found within sediments along the southern
African east coast is illustrated in Figure 5.7 A -D, which shows the following features:
1. Ti is the major substituent for iron and almost the entire composition range
between ulv6spinel and magnetite is present (Figure 5.7 A). The wide range in
Ti02 contents suggests that the magnetite grains are derived from a variety of
source rocks.
2. The strong negative correlation between the Ti02 and Fez03 contents indicates that
many of the magnetites have near-stoichiometric compositions and have not been
affected by oxidation.
3. Other elements such as Mn, Mg, Al and Cr (Figures 5.7B-D) are present in small,
variable amounts, which indicates that there is generally little solid-solution
between titanomagnetite and the other spinel series. The variable nature of these
elements is probably a function of source rock composition and re-equilibration
with ilmenite and silicate grains during cooling.

Table 5.8 Representative magnetite microprobe analyses.
Analysis
HZ4 I
HZ4 2
HZ4 3
HZ4 4
HZ4 5
HZ4 6
HZ4 7
HZ4 8
HZ4 9
HZ4 10
HN 3 I
HN 3 2
HN3 3
HN 3 4
HN 3 5
HN3 6
HN 3 7
HN 3 8
HN 3 9
HN3 10
HT3
HT3 2
HT3 3
HT3 4
HT 3 5
HT3 6
HT3 7
HT3 8
HT3 9
HT3 10
HEC3
HEC3 2
HEC3 3
HEC3 4
HEC 3 5
HEC 3 6
HEC3 7
HEC 3 8
HEC 3 9
HEC 3 10
Si02
0.14
0.03
0.04
3.92
0.30
0.18
0.18
1.06
0.07
0.50
0 .07
0.04
1.28
4.44
1.23
1.29
Ti02
17.59
21.31
18.86
0.07
29 .60
24.86
13.02
14.44
29.40
26.69
12.40
17.74
11.75
12.01
25.69
0.08
20.71
22.08
0.37 23.89
0.08
0.08
0.21
0.10
3.82
0.31
0.20
0.13
0.13
19.99
33.40
6.71
19.35
10.02
19.18
12.05
23 .69
5.54
0.63 2.06
0.55 11.44
0.30 29 .92
1.01 12.22
0.10 14.87
0.12 17.00
6.93 1.86
3.13 24 .33
8.25
3.91
5.42
HZ 3 - Port Durnford, Zululand
HN 3 - Umgababa, Natal
HT 3 - Port SI Johns, Transkei
A1203 Cr203
0.91 0.04
1.48 0.11
2.26 0.13
0.05 0.07
2.14
1.12 0.08
1.87 0.14
1.32 0.11
0.65 0.04
1.17 0.10
1.93
1.37
2.60
1.89
1.10
0.06
1.77
1.54
0.06
1.01
2.01
0.63
0.72
1.68
3.63
1.46
3.86
0.83
1.56
0.62
0.80
1.33
1.42
1.37
1.44
3.79
1.19
0.51
1.05
0 .35
0.27
0.17
0.26
0.17
0.11
0.10
0.17
0.09
0 .10
0.06
0.13
0.14
0.11
0.15
0.17
0.09
0.13
0.14
0.04
0.04
0.04
0.04
0.04
0.12
0.16
HEC 3 - Fish River Mouth, Eastern Cape
MnO
0.79
0.46
0.55
1.68
1.04
0.50
0.48
2.65
0 .12
0.74
0 .75
0.20
0.54
0.69
0.12
1.23
0.75
0.07
1.04
0 .80
1.14
0.19
0.34
0.26
0.71
0.29
0.47
0.16
0.08
0.17
0.72
0.67
0.83
0.72
0.18
0.72
0.44
0.23
0.69
MgO
0.05
0.26
0 .27
0.01
0.08
0.32
0.06
0.09
0.08
0.12
0.18
0.11
0.04
0.65
0.12
0.37
0.22
0.66
0.92
0.04
0.04
0.06
0.14
0.Q3
0.06
0.15
0.09
0.26
0.10
0.25
0.09
0.05
0.12
0.46
0.07
0.21
2.58
FeO
76.91
72 .56
75.08
91.26
62.80
69.41
79.46
78.67
57.85
64.70
79 .80
76.59
80.59
79.52
67.87
91.99
71.02
72.11
Recalculatcd
FcO
46.80
49 .89
48.12
30.52
62.46
52.88
42 .89
44.05
54.65
54.03
42 .54
46 .97
42.15
42.76
60.44
30.78
50.08
52.56
Fc203
33.46
25 .20
29 .96
67 .50
0.38
18 .36
40.63
38.47
3.56
11.86
41.40
32.92
42 .72
40.86
8.26
68.03
23.27
21.73
90.56 30.16 67.12
70.93 51.87 21.18
71.\9
64.42
85 .57
75.26
76.32
72.51
76.56
70.15
87.30
47 .17
61.\4
37.11
48 .97
44.95
47.89
41.89
51.91
36 .62
26.70
3 .64
53.85
29.21
34.86
27 .36
38 .5 2
20 .27
56.32
89.14 33 .36 61. 98
82.15 41.94 44.69
64.49
78.91
77.61
77.34
82.56
67.13
83.67
85.96
57.89
42.48
43.85
46.50
42.32
56.08
37.71
33.49
7.34
40.48
37.52
34.27
44.71
12.28
51.08
58.31
85 .64 31.68 59.96
Total
99.78
98 .72
100.19
98.25
100.27
98.97
99.30
99.14
92.08
94.16
99.97
100.08
99.76
100.15
100.84
99.18
98.82
100.25
97.41
100.02
97.76
100.13
98.95
99.85
97.79
97.08
97.05
97.55
100.46
98.96
99.88
97.64
98.56
98.66
100.13
99.94
98.22
98.19
97.36
100.73
101

III I--u;
~ u;
102
0 0 I--~ I--
0 g
0g • • • • 0
0 c
• f6 • f6
• • •• • xi
x ~ x
~~ • ~(") i-0 • + 0 0 • ~ 0 ~ x + I--
g~ g~ u; + ~ + 0 0 0
+ 0
+ x x x x
~ . X Xo ~ 0
+ +
• + 0 ~ 0
• x ~
41 -I'
0 0
'" .q I/) 0 ~ I/) (") 10 '" .q ~ I/) 0 (") 10 cl
I/) I/)
N -i c? N ~ cl
00GlV% OBW %
0 0 >5<1--I--
~C')C') 8 0 0
0 NZ~ W
g • <0 J: J: J: J: • -+ x 0 - -0 0
0 0
- 0 • 0 I/) 10
- • • x x ,\". ~(") .if< 0
+ 0 ~(")
• 0 • + 0 0
'" '" 0 ~ 0 If 0 {f ,t I--
o~ o~ u; + 0 C') <t C')
00 c9 + + x x x x
~ ts X ~ 0
+ +
- + +- 0 0
;< ~
• x
0 + + 0
0 0 C') 10 '" .q I/) 0 ~ ~ g 10 ~ 10 0 I/) 0
N cl '" ~
W.1 % QUW %
Figure 5.7 Variations in Ti02 (A), Al20 3 (B) , MnO (C), and MgO (D) versus F~03 for
magnetites from selected samples along the east coast of South Africa (data from Table
5.8).

Mineralogy of the iron-titanium oxides 103
A few Cr-rich spinels are found in the coastal sediments. Although these phases contain
little titanium, they are of interest as a source of chromium impurities in ilmenite
concentrates from the east coast (Logan, 1974; Rugo, 1988). A number of Cr-rich
spinels were analysed by electron microprobe, which reveal that two types of Cr-bearing
spinel are found in the sediments (Table 5.9 and Figure 5.8): chromian spinel close to
chromite in composition, with low Fe3+ content and chromian magnetite falling within the
FeCr20 4-FeAI20 4-F~04 quaternary.
The chromites tend to have similar magnetic susceptibilities to ilmenite and are thus found
in ilmenite concentrates, while the chromian magnetites are almost as magnetic as
magnetite and are therefore easily separated from ilmenite (Logan, 1974; Lee and Poggi,
1978; Rugo, 1988).
5.8 12
•• Chromites • ...
10 • • • • 8 • en c
0
~ () 6 • + ('t) • .... • () • • 4 •
Cr -magnetites • •
2
Olt---~~--~----~----~ ____ ~ __ ~ o 2 4 6 8 10 12
Fe3 + Cations
Figure 5.8 Variation diagram showing the difference in composition between chromites
and chromian-magnetites found in the east coast sediments (data from Table 5.9).

Table 5.9 Microprobe analyses of er-rich spinels.
Sample Si02 Ti02 Al203 Cr203
HZI7
HZ 17
HZI7
HZ 13
HZ 13
HZ18
HZI8
HZI8
HZ 2
HZ 2
HZ 2
HZ 2
HZ I
HZ I
GI21
GI22
GI 23
GI 24
1.21
0.49 0 .58
0 .25
0 .19
0 . 19
0.72
0 .10
0.06
5.25
0.99
1.02
0 .50
1.22 0.34
6 .56
0 .58
10.35
2.34
0.13
1.70 0.50
0.60
4.61
2.42
0.34
1.77
4.99
11 .90
11.77
12.05
10.56 14.70
5.43
1.34
5.56
13.51
28.33
4 .12
5.83
15.80
12.69
22 .14
18 .63
20.20
21.03
49 .29
49.00
52.61
51.67 50 .58
33.15
15.65
18.27
43.39
31.19
43.71
41.61
38.95
Analyses G121-G124 are fro m Hugo (1988) .
HZ 17 - Richards Bay, Zululand
HZ 13 - Sodwana Bay, Zululand
HZ 18 - Umhlatuze , Zululand
HZ 2 - Port Dumford, Zululand
HZ I . Tugela Rive r Mouth , Zululand
FeO MnO MgO
74.59
62.77
69.46
66.64
60.20
32.03
31.98
24.79
27 .68
24 .56 37.00
73 .24
59.64
26.00
29 .85
47 .50
46 .82
32 .56
0.35
0 .55
0 .58
0.42
0.35
0.27
0.28
0.52
0 .54
0.41 0.64
0.43
0 .52
0.19
0 .31
0.45
0.25
1.20
1.90
4 .57
1.88 3.43
5.09
4.90
5.38 7 .56
6.43 7.21
3.31
2.65
2045
8.94
8 .56
1.44
1.90
8.30
Recalculated
FeO Fe203 Total
29.40
23 .23
26.67
25 .12
29.05
26.98
26.27
23.70
24.71
23.52
29.23
27.53
37040
21.04
22.86
31.57
29.63
20.60
50 .22 99.88
43.94 96 .86
47.55 95.76
46.14 97.15
34.61 100.37
5 .61 99 .94
6.34 100.07
1.21 99 .36
3 .30 98 .92
1.15 98.50 8.63 87.20
50.79 99.17
24 .72 99 .27
5.51 95 .11
7.76 99 . 15
17 .71 100.69
19.10 98.82
13 .29 98 .74
Si4+
0.00
0 .00
0.00
0 .00
0 .00
0.00
0.00
0 .32
0 . 13 0.16
0.08
0.06
0.00
0.05
0:00
0.00
0.00
0 .00
Cations per 32 Oxygens
Ti4+ A13+ Cr3+ Mn2+ Mg2+
0.16
0 .00
0.02 0.01
1.12
0 .20
0.21
0.10
0 .25 0 .07
1.60
0.13
2 .26
0.48
0 .02
0.37
0.11
0.12
1.60
0.86
0.12
0 .63
1.67
3 .82
3.77
3.79
3.40 4.63
2.07
0.47
1.90
4.37
8 .34
1041
2.00
4.94
2.95
5.24
4 .62
4.83
4 .71
10.62
10.52
11.11
11.15 10.69
8.48
3 .71
4. 19
9.42
6 . 16
10.00
9.59
8.17
0.09
0 .14
0 .16
0.11
0.08
0.06
0 .06
0.12
0 . 12 0 .09
0 .18
0 .11
0 .13
0 .04
0 .07
0 .11
0.06
0 .27
0 .83
2 .04
0.88
1.55 2. 15
1.99
2.18
3.01
2.62 2.87
1.60
1.18
1.06
3.66
3 . 19
0 .62
0.83
3.28
Fe3+
11.13
9.90
11.21
10.51
7 .38
1.15
1.30
0.24
0 .68 0.23
2.10
11.45
5.39
1.14
1.46
3 .86
4.19
2.65
Fe2+
7.24
5 .82
6 .99
6.36
6 .89
6.15
5.97
5.30
5.64 5.26
7.91
6.90
9.07
4.83
4.77
7.64
7.22 4.57
~ S· ~
~ g ~ s. ~
~ . ~
I ..... §. ~
~.
~
~
-o J;;..
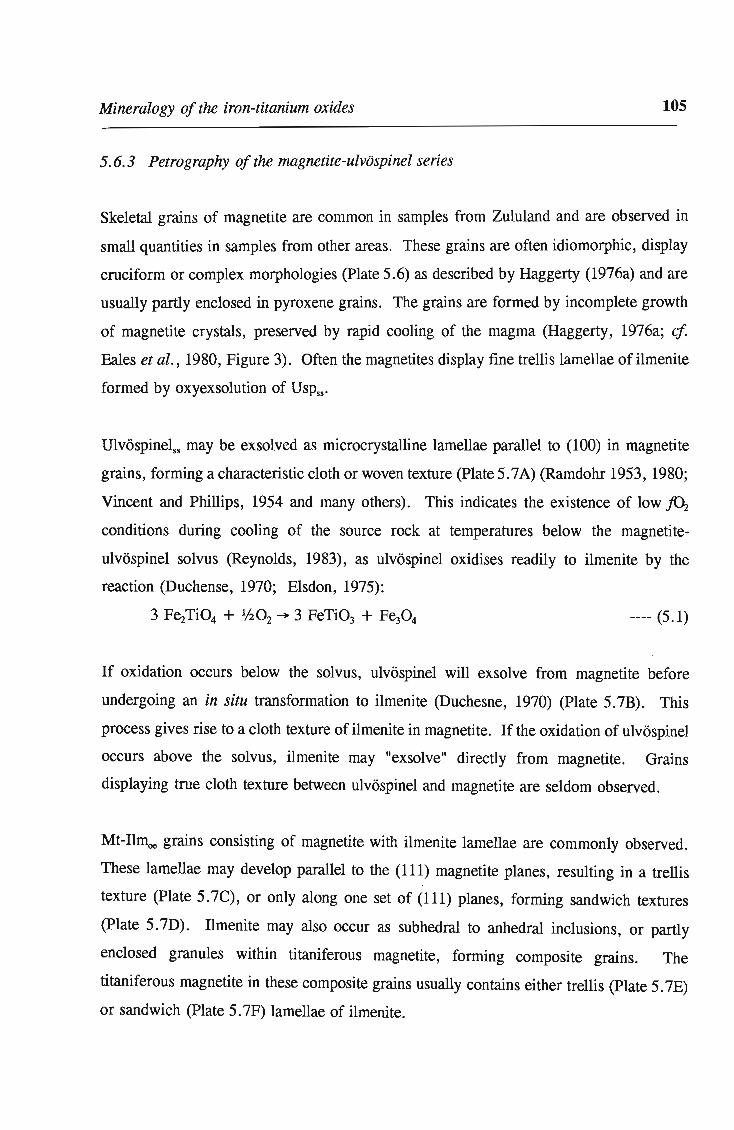
Mineralogy of the iron-titanium oxides 105
5.6.3 Petrography of the magnetite-ulvospinel series
Skeletal grains of magnetite are common in samples from Zululand and are observed in
small quantities in samples from other areas. These grains are often idiomorphic, display
cruciform or complex morphologies (Plate 5.6) as described by Haggerty (1976a) and are
usually partly enclosed in pyroxene grains. The grains are formed by incomplete growth
of magnetite crystals, preserved by rapid cooling of the magma (Haggerty, 1976a; ct Bales et al., 1980, Figure 3). Often the magnetites display fine trellis lamellae of ilmenite
formed by oxyexsolution of USPss.
Ulvospinelss may be exsolved as microcrystalline lamellae parallel to (100) in magnetite
grains, forming a characteristic cloth or woven texture (plate 5.7 A) (Ramdohr 1953, 1980;
Vincent and Phillips, 1954 and many others). This indicates the existence of 10w.fOz
conditions during cooling of the source rock at temperatures below the magnetite
ulvospinel solvus (Reynolds, 1983), as ulvospinel oxidises readily to ilmenite by the
reaction (Duchense, 1970; Elsdon, 1975):
---- (5.1)
If oxidation occurs below the solvus, ulvospinel will exsolve from magnetite before
undergoing an in situ transformation to ilmenite (Duchesne, 1970) (Plate 5. 7B). This
process gives rise to a cloth texture of ilmenite in magnetite. If the oxidation of ulvospinel
occurs above the solvus, ilmenite may "exsolve" directly from magnetite. Grains
displaying true cloth texture between ulvospinel and magnetite are seldom observed.
Mt-Illl\x, grains consisting of magnetite with ilmenite lamellae are commonly observed.
These lamellae may develop parallel to the (111) magnetite planes, resulting in a trellis
texture (Plate 5. 7C), or only along one set of (111) planes, forming sandwich textures
(Plate 5.7D). Ilmenite may also occur as subhedral to anhedral inclusions, or partly
enclosed granules within titaniferous magnetite, forming composite grains. The
titaniferous magnetite in these composite grains usually contains either trellis (Plate 5. 7E)
or sandwich (Plate 5. 7F) lamellae of ilmenite.

Mineralogy of the iron-titanium oxides 106
The trellis textures are formed by oxyexsolution of ilmenite from titanomagnetite
(Haggerty, 1976a), but the sandwich lamellae may form by either oxyexsolution or
simultaneous crystallization of ilmenite and magnetite (Buddington and Lindsley, 1964;
Duchesne, 1970; Haggerty, 1976b). Likewise, the composite types may have formed by
either process (Haggerty, 1991).
As with ilmenite, Haggerty (1976a, 1991) has classified the stages of high temperature
(> 600°C) titanomagnetite oxidation and the trellis and sandwich type grains observed
correspond to stages Cl to C3 of Haggerty's oxidation sequence (see Table 5.7, page 94).
No grains corresponding to the C4-C6 stages are observed, but graphic or symplectite-like
intergrowths of Heffiss-Psbss-Rut assemblages, resembling the C7 stage of oxidation are
often found (Plate 5.8). These assemblages are formed by rapid oxidation of the original
titanomagnetite (cj Haggerty, 1991, Figures 11 d-t).
Pleonaste (FeAI204-MgAI20 4) may ex solve from magnetite grains as small orientated
blebs, usually post-dating sparse ilmenite oxyexsolution lamellae (Plate 5.9). Such grains
are commonly derived from metamorphosed mafic and ultramafic rocks (Grigsby, 1990)
and are good indicators of provenance.
Magnetite and ilmeno-magnetite may undergo oxidation to hematite in source rocks at
temperatures above 550°C (Lepp, 1957). This results in fairly broad, straight-sided, or
anhedral hematite lamellae orientated along the (111) magnetite planes (Plate 5 . lOA) . This
replacement is colloquially referred to as martitisation (Haggerty, 197 6b). The ilmenite
lamellae, if present, are unaffected and extreme oxidation leaves ilmenite lamellae in a
matrix of hematite. Martitisation is also known to occur in the sedimentary environment
(Haggerty, 1976a; Riezebos, 1979), resulting in thin hematite lamellae, again orientated
along (111) magnetite planes. These develop inwards from the grain surfaces (Plate 5.10B
to 5.IOD). Martitised magnetite grains are commonly observed in the coastal sediments.
At moderate temperatures (200-375°C), in basic igneous rocks magnetite and titaniferous
magnetite can undergo oxidation-alteration to the cation-deficient metastable maghemite

Mineralogy of the iron-titanium oxides 107
or titanomaghemite series (Lepp, 1957; Basta, 1959; Lindsley, 1976). The maghemite
develops along cracks within magnetite, or adjacent to ilmenite lamellae (see Plate 5.11A).
Ilmenite is unaffected by the alteration and complete maghemitization of Mt-Il11\x, grains
results in maghemite-ilmenite assemblages (Plate 5 .11B).
Magnetite-ilmenite-titanite assemblages are formed by the late-stage, metasomatic alteration
of either ilmenite lamellae or magnetite to titanite in Mt-Il11\x, grains (Haggerty, 1976b;
Reynolds, 1986c). Turner (1990) found that the magnetite alters to titanite, while the
ilmenite lamellae remain unaltered in Karoo basalt and dolerite (Plate 5.11 C and 5 .11D).
Chlorite, amphibole or quartz may also replace titaniferous magnetite as a result of late
stage metasomatism (Reynolds, 1986c; Richards et al., 1991). The ilmenite lamellae
remain unaffected (Plate 5.12A and 5.12B), although in some extreme cases the ilmenite
may be recrystallised (plate 5 . 12C) , or altered to titanite or rutile, as noted by Richards
et al. (1991). In some cases these replacement minerals are subsequently leached from
the grains, leaving an orientated framework of ilmenite lamellae (Plate 5.12D). Grains
of this type are rarely observed in coastal sediments.
Vermiform intergrowths of ilmenite and hydrous ferromagnesian silicates are common in
Karoo dolerites which have undergone deuteric alteration (et Reynolds, 1983, Figure 4;
Turner, 1990). Reynolds (1983) interpreted these intergrowths as having been formed by
the alteration of titaniferous magnetite by late-stage hydrothermal fluids. The rounded
nature of the vermiform ilmenite is created by the overgrowth of ilmenite, formed in the
reaction, onto existing Il11\x, lamellae. Reynolds (1983) claimed that this explained the
optical continuity of t~e ilmenite bodies in the ilmenite-silicate intergrowths, as the original
ilmenite lamellae were orientated along the (111) planes of the original titaniferous
magnetite host. In contrast, Plate 5.13 shows that ilmenite in composite ilmenite-magnetite
grains may undergo alteration to form the vermiform ilmenite-silicate intergrowths
described by Reynolds (1983), while the titaniferous magnetite remains relatively
unaltered. It is also clear from Plate 5.13 that the reaction proceeds from the ilmenite
silicate interface and not from titaniferous magnetite as would be expected if the
intergrowth were formed by the breakdown of magnetite.
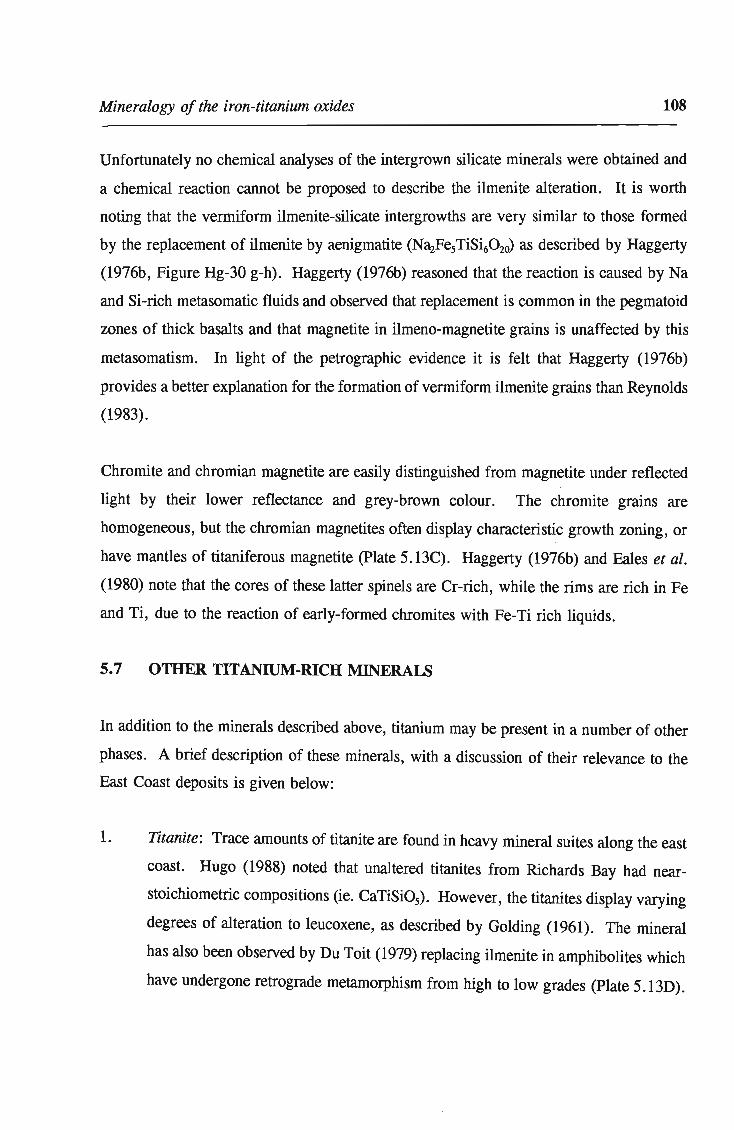
Mineralogy of the iron-titanium oxides 108
Unfortunately no chemical analyses of the intergrown silicate minerals were obtained and
a chemical reaction cannot be proposed to describe the ilmenite alteration. It is worth
noting that the vermiform ilmenite-silicate intergrowths are very similar to those formed
by the replacement of ilmenite by aenigmatite (Na2Fes TiSi60 2o) as described by Haggerty
(1976b, Figure Hg-30 g-h). Haggerty (1976b) reasoned that the reaction is caused by Na
and Si-rich metasomatic fluids and observed that replacement is common in the pegmatoid
zones of thick basalts and that magnetite in ilmeno-magnetite grains is unaffected by this
metasomatism. In light of the petrographic evidence it is felt that Haggerty (1976b)
provides a better explanation for the formation of vermiform ilmenite grains than Reynolds
(1983).
Chromite and chromian magnetite are easily distinguished from magnetite under reflected
light by their lower reflectance and grey-brown colour. The chromite grains are
homogeneous, but the chromian magnetites often display characteristic growth zoning, or
have mantles of titaniferous magnetite (plate S.13C). Haggerty (1976b) and Eales et al.
(1980) note that the cores of these latter spinels are Cr-rich, while the rims are rich in Fe
and Ti, due to the reaction of early-formed chromites with Fe-Ti rich liquids.
5.7 OTHER TITANIUM-RICH MINERALS
In addition to the minerals described above, titanium may be present in a number of other
phases. A brief description of these minerals, with a discussion of their relevance to the
East Coast deposits is given below:
1. Titanite: Trace amounts of titanite are found in heavy mineral suites along the east
coast. Hugo (1988) noted that unaltered titanites from Richards Bay had near
stoichiometric compositions (ie. CaTiSiOs). However, the titanites display varying
degrees of alteration to leucoxene, as described by Golding (1961). The mineral
has also been observed by Du Toit (1979) replacing ilmenite in amphibolites which
have undergone retrograde metamorphism from high to low grades (Plate S.13D).

Mineralogy of the iron-titanium oxides 109
2. Pseudobrookite: Homogeneous pseudobrookite is very rare in the deposits and is
only occasionally observed in composite grains together with ferrorutile or Hel1\.
formed by high temperature oxidation of ilmenite or titaniferous magnetite.
3. Titanium in silicates: The amount of titanium in the deposits present in silicates
such as augite, hornblende and biotite has not been determined, but given the
normal provenance of the silicates, the amount of titanium in these phases IS
expected to be insignificant compared with that of iron-titanium oxide phases.
5.8 DISCUSSION
From a mineral processing viewpoint, the textures within composite grains are of little
importance, as it is only the mineral proportions in a grain that determine the grain's
behaviour during concentration. The paragenesis of the composite grains does provide
useful information regarding the provenance of the titanium-bearing minerals, which in
turn controls the distribution of these minerals along the coastline.
Microscopic examination of the iron-titanium oxides clearly demonstrates that the
petrography of these phases along the east coast of South Africa is both varied and
complex. The textures of composite grains which were formed by processes in the source
rocks are often well preserved in the coastal sediments. The composite grains exhibit
textures formed by a number of different processes (see Plates 5.4D and 5 .l2B). As
described in the following chapter, alteration of composite grains in the sedimentary
environment adds further textural characteristics and at times overprints the source rock
textures, making petrographic interpretation difficult. Nevertheless, careful petrographic
examination of the composite iron-titanium grains often provides sound evidence for the
origin and paragenesis of the mineral assemblage.

Plate 5.6 Back-scattered electron images of skeletal titaniferous magnetite grains .
A. Skeletal titaniferous magnetite crystals preserved within a rounded pyroxene grain.
The crystals are of the cruciform and complex types (et Haggerty, 1976 b, Figure
Hg-25). Cape St Lucia, dune (HZ 5). Scale bar 150 ,um.
B. Cruciform titaniferous magnetite crystal preserved in a silicate grain (top right) .
Note how the magnetite appears to have been partially resorbed by the silicate melt
before quenching. The magnetite contains small ilmenite lamellae and is partially
altered to maghemite (medium grey). Sodwana Bay, beach (HZ 12). Scale Bar
75 ,um.
C. Sub-idiomorphic grain of titaniferous magnetite formed by the partial crystallisation
of a cruciform-type crystal. The titaniferous nature of the magnetite is displayed
by the oxyexsolution of thin ilmenite (light grey) lamellae (see text for
~xplanation). Once again the morphology of the grain has been preserved by its
partial enclosure in pyroxene. Cape Vidal , dune (HZ 11). Scale bar 60 Mm.
D. Nearly euhedral titaniferousmagnetite grain displaying ilmenite (light grey) trellis
lamellae (et Plate 5.7C) . Cape St Lucia, dune (HZ 5). Scale Bar 75 /-t m.
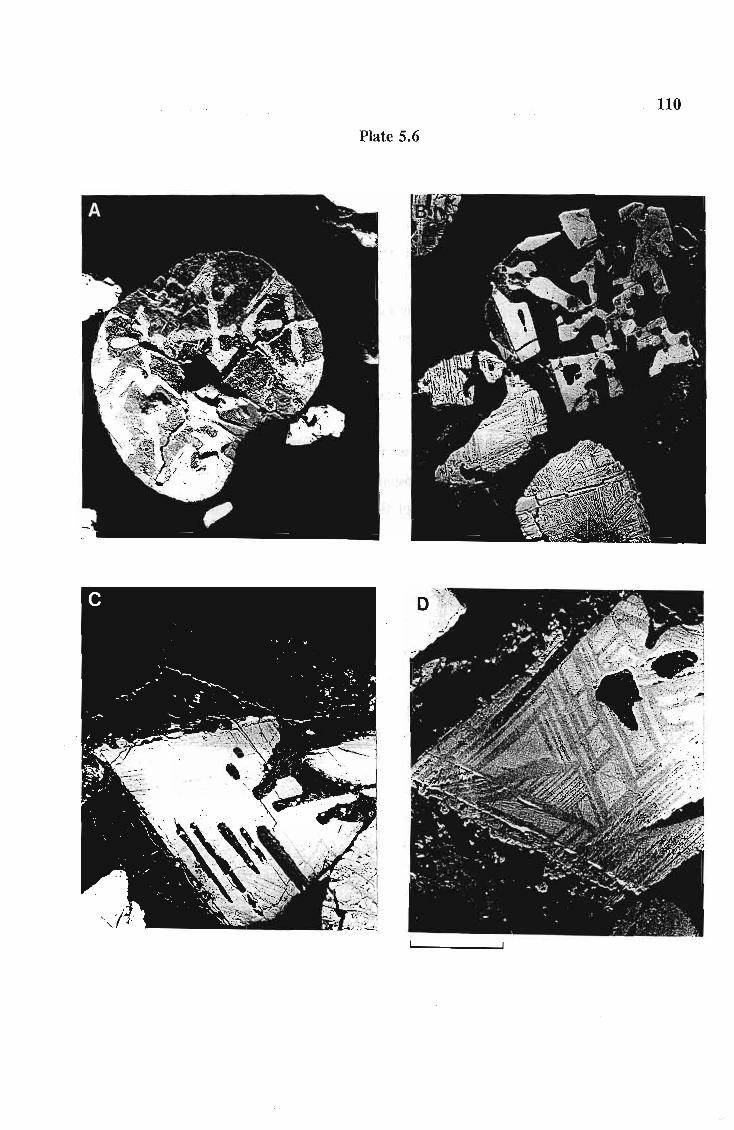
110,
Plate 5.6

Plate 5.7 Back-scattered electron images of ex solution and oxyexsolution textures within
titanomagnetite grains.
A. Magnetitess (white) containing fine-scale ex solution lamellae of ulvQspinel defining
a cloth texture. The homogeneous grey mineral adjacent to the magnetite is
ilmenite. Port St Johns, beach (HT 3). Scale Bar 30 J,tm.
B. Fine-scale ilmenite lamellae defining a cloth or woven texture ina magnetite (light
grey) grain. The lamellae were first formed by the ex solution of ulvQspinel from
titanomagnetite before undergoing sub-solvus 'oxidation to ilmenite (see text for
details). Hlatimi beach, (RN 11). Scale bar 25 J,tm.
C. Trellis lamellae of ilmenite (grey) with a magnetite grain. The ilmenite lamellae
are formed by the oxidation of ulvQspinel to ilmenite above the solvus resulting in
the direct 11 ex solution 11 , or oxyexsolution of ilmenite from magnetite. Umdloti,
dune (HN 7). Scale bar 30 J,tm.
D. Sandwich lamellae of ilmenite (grey) in magnetite formed by oxyexsolution. The
magnetite has subsequently undergone partial alteration to titanite (dark grey).
Richards Bay, dune (HZ 17). Scale bar 30 J,tm.
E. Composite Mt-llm grain consisting of homogeneous ilmenite (medium grey) and
magnetite (light grey) containing trellis lamellae of Ilmoe. Port St Johns, beach (HT
3). Scale bar 43 J,tm.
F. Composite Mt-Ilm grain consisting of large homogeneous ilmenite lamellae and
; 'magnetite containingIlmoe sandwich lamellae. The genesis of the composite Mt
llm'grains is discussed in the text. Morgan's Bay, beach (HEC 7).
, Scale Bar 43 J,tm.

111
Plate 5.7
\ \

Plate 5.8 Photomicrographs of Hemss-Psbss±Rut grains formed by the high-temperature
oxidation of titanomagnetite or ilmenite.
A. Coarse intergrowth between Hemss (white) and Psbss (dark grey) representing the
C7 stage of Haggerty's titaniferous magnetite oxidation series. Richards Bay, dune
(HZ 16) . . Reflected light, 32x oil immersion lens. Scale bar 50 j.tm.
B. Intimate,intergrowth between Hemss (white) and Psbss (grey) with remnants of rutile
(light grey)~ The large proportion of homogeneous hematite (top) suggests that the
original grain consisted of (Ilm-Hem)ex and therefore the present assemblage
corresponds to the R7 stage of Haggerty's oxidation series. Richards Bay, dune
(HZ 17). Reflected light, 32x oil immersion lens. Scale bar 50 j.tm.
C. A rare grain ~onsisting almost entirely of pseudobrookitess with little hematite (light
grey) and rutile (medium grey). Richards Bay, dune (HZ 17). Reflected light, 32x
oil immersion lens. Scale bar 50 j.tm.

112
Plate 5.8

Plate"S.9 Back-scattered electron images of titaniferous magnetites containing ex solved
pleonaste.
A. A magnetite grain containing orientated blebs of exsolved pleonaste. Cape St
Lucia, dune (HZ 5). Scale Bar 43 J'm.
B. Magnetite grain containing a single lamella of ilmenite (medium grey) and
orientated blebs of pleonaste. Note how the pleonaste lamellae cross-cut the earlier
formed ilmenite. The magnetite grain has been partially altered to titanite (bottom
right of grain). Tugela River mouth, beach (HZ 1). Scale bar 43 J'm.
C. Magnetite grain containing sparse ilmeniteoe lamellae (light grey) and orientated
blebs of ex solved pleonaste (dark grey). Again note that the pleonaste ex solution
post-dates the ilmenite and in some instances partially replaces the ilmenite.
Richards Bay, dune (HZ 17). Scale Bar 43 J'm.

· 113

Plate 5.10 Photomicrographs of martitised magnetites.
.~ '~
A. High temperature replacement of magnetite by broad, straight-sided hematite
lamellae. The hematite is also anhedral in shape. Richards Bay. Partial cross
polars, reflected light, 32x oil immersion lens. Scale bar 50 j-tm.
B. Low temperature martitisation of magnetite characterised by the development of
thin, orientated hematite lamellae from the surface of the rounded magnetite grain.
Richards Bay. Reflected light, 32x oil immersion lens. Scale bar 50 j-tm.
C-D. More advanced stages of martitisation of magnetite grains in coastal sediments. In
some cases hematite may completely replace magnetite. Richards Bay. Partial
cross-polars, reflected light, 32x oil immersion lens. Scale bar 50 j-tm.

114
Plate S.10
A

Plate 5.11 Scanning electron images of late-stage alteration reactions of magnetite and
titaniferous magnetite.
A. . Alteration of magnetite (white) to porous maghemite. Note that, in contrast to
hematite, maghemite does not follow the (111) magnetite planes (ej. Plat~~ 5.10).
Umgababa, dune (RN 1). Scale bar 43J'm.
B. Grain consisting of coarse ilmeniteoe sandwich lamellae (light grey) and
inhomogeneous maghemite (mottled . grey) which has almost totally replaced the
original magnetitess. Port St Johns, beach (HT 3). Scale bar 60 I'm.
C. Replacement of magnetite (mottled white) by titanite (dark grey) as a result of late
stage metasomatism. Note how the ilmenite (light grey) remains unaffected by the
alteration. Port Dumford, dune (HZ 2). Scale bar 43 I'm .
. D. Replacement of magnetite (white) by titanite (dark grey) within a (Mtss-UsPss)ex
grain displaying the characteristic cloth texture.
Umgeni River Mouth, beach (HN 6). Scale bar 43 I'm.

115
Plate 5.11
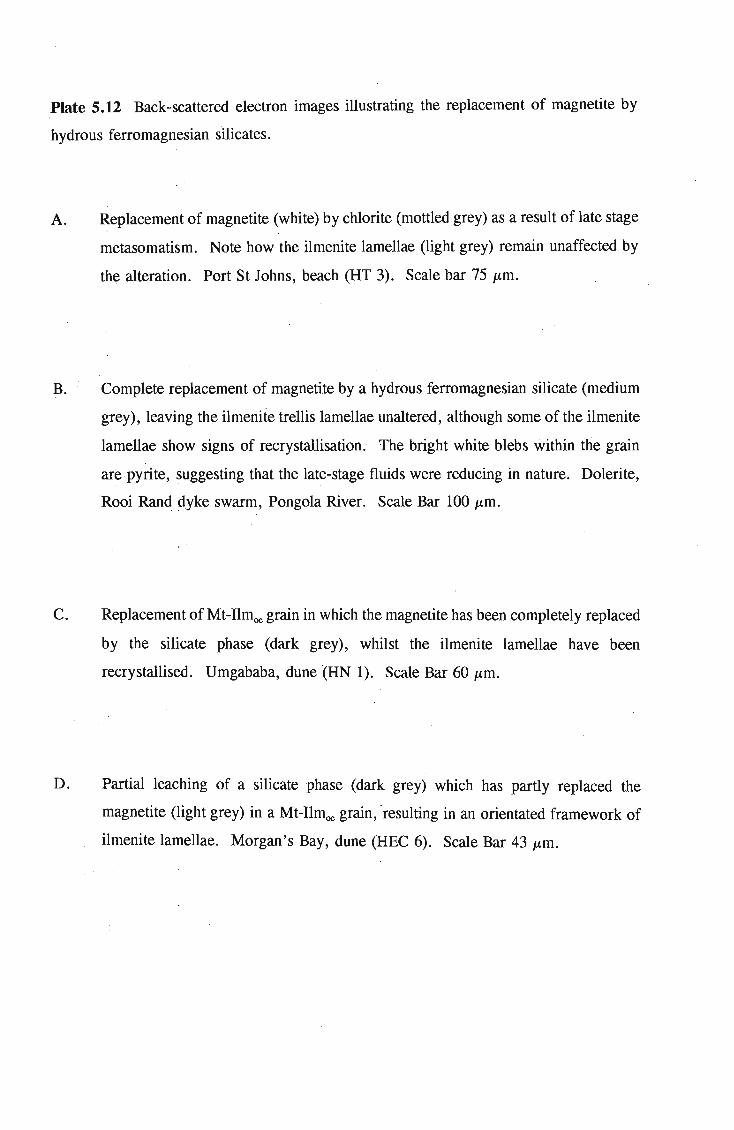
Plate 5.12 Back-scattered electron images illustrating the replacement of magnetite by
hydrous ferromagnesian silicates.
A. Replacement of magnetite (white) by chlorite (mottled grey) as a result of late stage
metasomatism. Note how the ilmenite lamellae (light grey) remain unaffected by
the alteration. Port St Johns, beach (HT 3). Scale bar 75 ~m. ;",
B. Complete replacement of magnetite by a hydrous ferromagnesian silicate (medium
grey), leaving the ilmenite trellis lamellae unaltered, although some of the ilmenite
lamellae show signs of recrystallisation. The bright white blebs within the grain
are pyrite, suggesting that the late-stage fluids were reducing in nature. Dolerite,
Rooi Rand dyke swarm, Pongola River. Scale Bar 100 ~m.
C. Replacement of Mt-Ilmoe grain in which the magnetite has been completely replaced
by the silicate phase (dark grey), whilst the ilmenite lamellae have been
recrystallised. Umgababa, dune (HN 1). Scale Bar 60 ~m.
D. Partial leaching of a silicate phase (dark grey) which has partly replaced the
magnetite (light grey) in a Mt-Ilmoe grain, 'reSUlting in an orientated framework of
ilmenite lamellae. Morgan ' s Bay, dune (HEC 6). Scale Bar 43 ~m.

116
Plate 5.12

Plate 5.13
A. Replacement of ilmenite (light grey) in a composite ilmeno-magnetite grain by a
. silicate phase (dark grey) to produce a typical vermiform intergrowth. Note how
the magnetite is unaffected by the reaction. Richards Bay, dune (HZ 16). Back~
:scattered electron image~ Scale bar 25 JLm.
B. Similar replacement to that described in A. in a large composite ilmeno-magnetite
in a dolerite from the Rooi Rand dyke swarm, Pongola River (DM90-25). Back
scattered electron image. Scale bar 60 JLm.
c. Back-scattered electron image of a zoned chromian magnetite grain. The core of
. the grain is chromium-rich, while the rim is chromium-poor and contains titanium.
The magnetite has been partially replaced by maghemite. Richards Bay, dune
(HZ 17). Scale bar 60 JLm.
D. Photomicrograph of the replacement of ilmenite (medium grey) by titanite (dark
grey). St. Lucia estuary mouth, beach (HZ 6). Reflected light, 32x oil objective.
Scale bar 50 JLm.
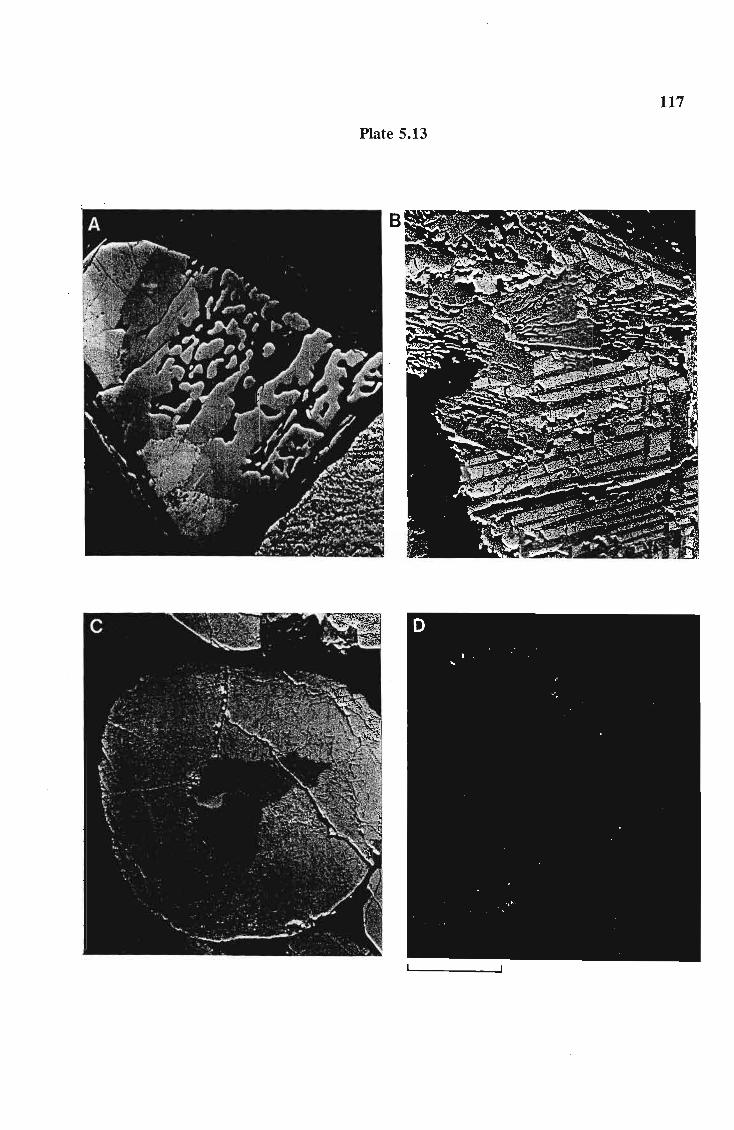
117
Plate 5.13

118
CHAPTER SIX
THE ALTERATION OF ILMENITE
6.1 INTRODUCTION
Ilmenite undergoes alteration in sediments by a process in which iron is removed from the
ilmenite structure to finally form rutile or anatase. This alteration process changes the
physical and chemical properties of the mineral, which influences its economic value. In
the first part of this chapter the literature on ilmenite alteration is briefly reviewed. The
central portion is concerned with the findings of a transmission electron microscope study
of ilmenite alteration, which was undertaken by the author in the Department of Earth
Sciences, Cambridge, England. The last part of the chapter describes the alteration of
ilmenite found within the study area. Much of this last section is extracted from Hugo and
Cornell (1991), published during the course of this study, which describes the alteration
of ilmenite from Zululand, South Africa. The nature of the ilmenite alteration in Zululand
is common to the entire study area, and the findings of Hugo and Cornell (1991) hold for
all the coastal sediments along the eastern seaboard of South Africa.
6.2 PREVIOUS WORK
6.2.1 The mechanisms of ilmenite alteration
The presence of phases with Ti02 contents greater than the theoretical 52.7 per cent of
ilmenite in sedimentary deposits has been known since the advent of heavy mineral sand
mining. The nature of these phases and the process of ilmenite alteration has been the
subject of much controversy, as unequivocal optical and chemical identification is often
impossible because of the very fine intergrowths formed by alteration products. The poor
crystallinity of the alteration phases and the coincidence of their XRD peaks with those of

Alteration of ilmenite 119
ilmenite, rutile, anatase and hematite, make their structural identification difficult. These
problems are exacerbated by the inconsistent nomenclature used by different workers .
In 1909 Palmer described a monoclinic phase from Arizona with a composition close to
the formula Fez03.3Ti02, which he named arizonite. Subsequent workers used the term
arizonite in their description of titaniferous concentrates, although they never positively
identified the phase (Gillson, 1949 and 1950; Miller, 1945; Theonen and Warne, 1949).
Others challenged the existence of arizonite in these concentrates (Emst, 1943; Overholt
et al., 1950; Lynd et al., 1954) and postulated that the concentrates, consisting of 56 to
63 per cent Ti02 were formed by the weathering of ilmenite (Cannon, 1949; Overholt et
al., 1950; Lynd et al. , 1954). From the results of petrographic, chemical, X-ray and
magnetic studies, Lynd et al. (1954) concluded:
"Since the composition and structure of [titaniferous] beach sand concentrates
corresponds so closely to what would be expected of ilmenites that have altered by
oxidation and leaching, there is no reason to postulate the existence of the
hypothetical compound, arizonite, to account for the composition of titaniferous
beach sand concentrates".
From X-ray analysis of the material studied by Palmer (1909), Lynd et al. (1954) stated
that arizonite consisted of a mixture of hematite, anatase and rutile, which agreed with the
findings of Overholt et al. (1950).
Bailey et al. (1956) also disputed the existence of arizonite in their study of ilmenite
alteration and concluded that ilmenite passed through three successive stages of alteration
from ilmenite to leucoxene, which consisted of finely crystalline rutile, or less commonly,
brookite. They also proposed that the ilmenite structure broke down during alteration to
form an amorphous mixture of titanium and iron oxides prior to the formation of
leucoxene: a conclusion reached subsequently by La Roche et al. (1962). The presence
of leucoxene in titaniferous concentrates and as an alteration product of ilmenite had been
recognised before by Cannon (1949) Creitz and McVay (1949) and Spencer (1948).

Alteration of ilmenite 120
Although most subsequent workers agreed that iron is oxidised and leached from ilmenite
during weathering, resulting in the enrichment of Ti02, the role of the phase arizonite was
still discussed (Karkhanavala, 1959; Karkhanavala and Momin, 1959; Karkhanavala et
al., 1959; Flinter, 1959, 1960a and 1960b; Lynd, 1960; Dyadchenko and Khatuntseva,
1960; Bykov, 1964).
Teufer and Temple (1966) identified an iron-titanite of hexagonal structure, with a
composition close to F~ Ti30 9, using single crystal XRD analysis. They called this phase
pseudorutile. In the same year Temple (1966) published a paper on the alteration of
ilmenite in which he stated that the alteration products are completely transitional in
composition from ilmenite to the end product of alteration, which has a composition close
to rutile. He also determined that the oxidation of FeO to F~03 is complete at a
composition of about 65-70% Ti02, which is close to the composition of pseudorutile.
Temple (1966) concluded that the alteration of ilmenite proceeded as follows: the initial
removal of sufficient iron to allow the oxygen lattice to adjust to the "primitive" hexagonal
structure of pseudorutile, with subsequent removal of iron resulting in the conversion of
pseudorutile to rutile, and only the phases pseudorutile and rutile were formed in the
process.
Pseudorutile was subsequently investigated by Larrett and Spencer (1971), while Grey and
Reid (1975) refined the structural data of the mineral and proposed that it was a stable
intermediate phase of the weathering of ilmenite in a ground water environment. They
proposed that ilmenite altered by a two-stage mechanism, similar to that suggested by
Temple (1966). This mechanism is described in greater detail in Section 6.4.
The alteration of ilmenite to microcrystalline rutile (leucoxene) via the distinct intermediate
phase, pseudorutile, has gained acceptance in the recent literature on ilmenite weathering.
However, . a number of contributions to, and departures from, the findings of Temple
(1966) and Grey and Reid (1975) have been made. Grey et al. (1983) determined that the
phase is an oxyhydroxide with a composition between F~Ti309 and F~Ti308(OH)2" Frost
et al. (1983) and Frost et al. (1986) determined that ilmenite may alter directly to
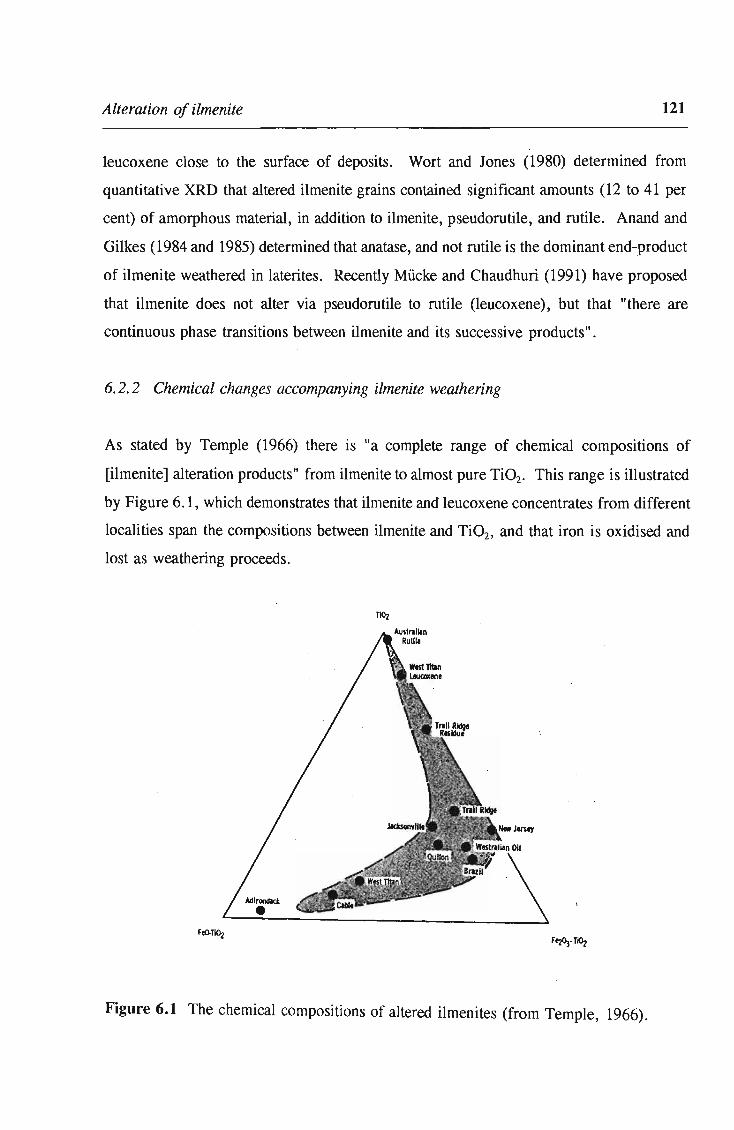
Alteration of ilmenite 121
leucoxene close to the surface of deposits. Wort and Jones (1980) determined from
quantitative XRD that altered ilmenite grains contained significant amounts (12 to 41 per
cent) of amorphous material, in addition to ilmenite, pseudorutile, and rutile. Anand and
Gilkes (1984 and 1985) determined that anatase, and not rutile is the dominant end-product
of ilmenite weathered in laterites. Recently Miicke and Chaudhuri (1991) have proposed
that ilmenite does not alter via pseudorutile to rutile (leucoxene), but that "there are
continuous phase transitions between ilmenite and its successive products".
6.2.2 Chemical changes accompanying ilmenite weathering
As stated by Temple (1966) there is "a complete range of chemical compositions of
[ilmenite] alteration products" from ilmenite to almost pure Ti02• This range is illustrated
by Figure 6.1, which demonstrates that ilmenite and leucoxene concentrates from different
localities span the compositions between ilmenite and Ti02, and that iron is oxidised and
lost as weathering proceeds.
nOz
feO-TIOz
Figure 6.1 The chemical compositions of altered ilmenites (from Temple, 1966).
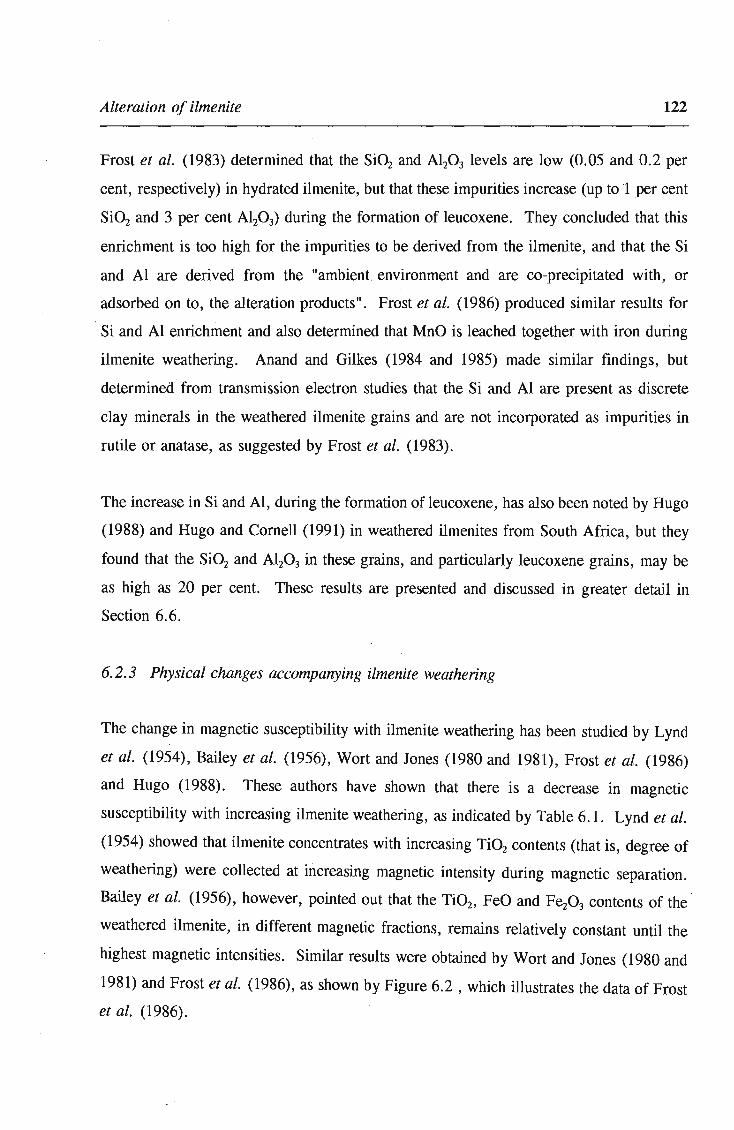
Alteration of ilmenite 122
Frost et al. (1983) determined that the Si02 and A120 3 levels are low (0.05 and 0.2 per
cent, respectively) in hydrated ilmenite, but that these impurities increase (up to 1 per cent
Si02 and 3 per cent A120 3) during the formation of leucoxene. They concluded that this
enrichment is too high for the impurities to be derived from the ilmenite, and that the Si
and Al are derived from the "ambient. environment and are co-precipitated with, or
adsorbed on to, the alteration products". Frost et al. (1986) produced similar results for
. Si and Al enrichment and also determined that MnO is leached together with iron during
ilmenite weathering. Anand and Gilkes (1984 and 1985) made similar findings, but
determined · from transmission electron studies that the Si and Al are present as discrete
clay minerals in the weathered ilmenite grains and are not incorporated as impurities in
rutile or anatase, as suggested by Frost et al. (1983).
The increase in Si and AI, during the formation of leucoxene, has also been noted by Rugo
(1988) and Rugo and Cornell (1991) in weathered ilmenites from South Africa, but they
found that the Si02 and Al20 3 in these grains, and particularly leucoxene grains, may be
as high as 20 per cent. These results are presented and discussed in greater detail in
Section 6.6.
6.2.3 Physical changes accompanying ilmenite weathering
The change in magnetic susceptibility with ilmenite weathering has been studied by Lynd
et al. (1954), Bailey et al. (1956), Wort and Jones (1980 and 1981), Frost et al. (1986)
and Rugo (1988). These authors have shown that there is a decrease in magnetic
susceptibility with increasing ilmenite weathering, as indicated by Table 6.1 . Lynd et al.
(1954) showed that ilmenite concentrates with increasing Ti02 contents (that is, degree of
weathering) were collected at increasing magnetic intensity during magnetic separation.
Bailey et al. (1956), however, pointed out that the Ti02, FeO and Fez03 contents of the ·
weathered ilmenite, in different magnetic fractions, remains relatively constant until the
highest magnetic intensities. Similar results were obtained by Wort and Jones (1980 and
1981) and Frost et al. (1986), as shown by Figure 6.2 , which illustrates the data of Frost
et al. (1986).

Alteration of ilmenite 123
Table 6.1 Magnetic susceptibilities of ilmenite and its weathered products (data from
Wort and Jones, 1981).
Mineral
ferrian-ilmenite
ilmenite
pseudorutile
rutile
Ti02 content (%)
40 to 50
50
60 to 63
100
Magnetic Susceptibility. (X).
100 to 361
96
34.5
1
Wort and Jones (1981) determined that the weathered ilmenite found in the most magnetic
fractions have susceptibilities higher than that of pure ilmenite, and concluded that these
grains were derived from the alteration of ferrian-ilmenite, which may have magnetic
susceptibilities close to that of magnetite. Similar results were obtained by Frost et al.
(1986).
As with magnetic susceptibility, the density of the weathered products of ilmenite
decreases with increasing alteration. The relationship between bulk specific gravity and
Ti02 content of various weathered ilmenite concentrates is shown in Figure 6.3 (from data
given in Table 6.2), which indicates that the density decreases linearly with increasing
alteration. Furthermore, leucoxenes have lower densities than that of rutile. Hugo (1988)
found significant amounts of leucoxenes with densities less than 3.8 g.cm-3 in the Richards
Bay deposit.
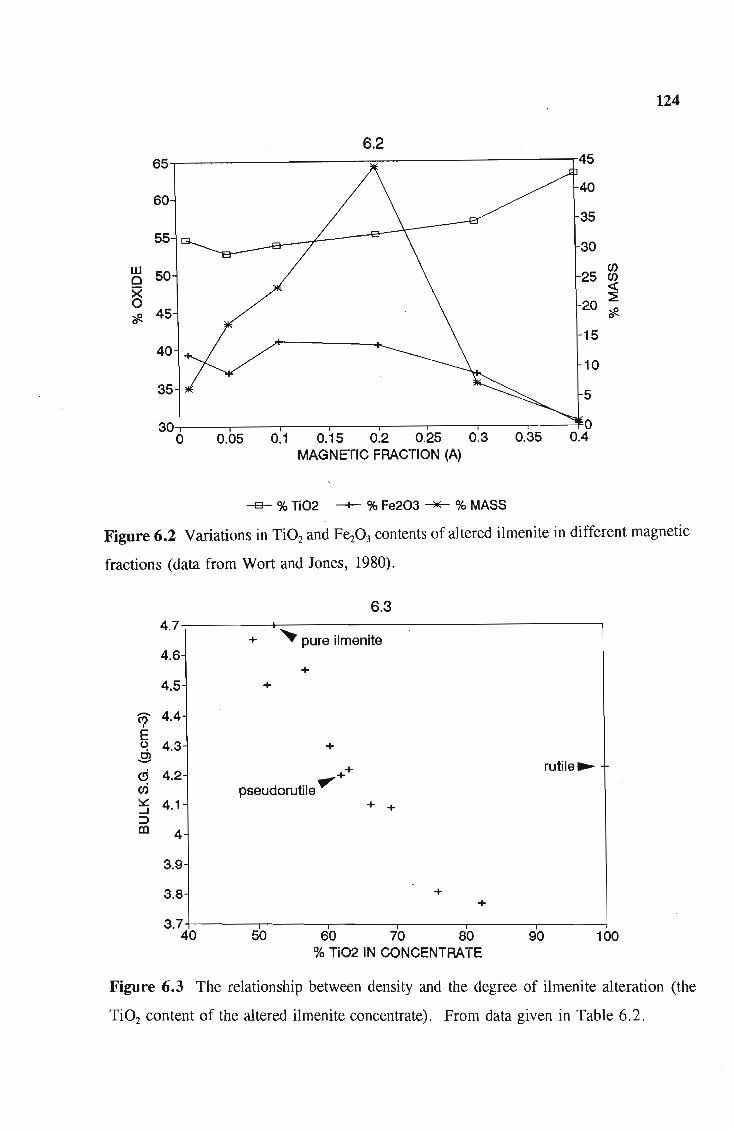
124
6.2 65 45
40 60
35 55
30 w 50 25
en 0 en X « 0 20 :E
*- 45 *-15
40 10
35 5
30 0 0 0.05 0.1 0.15 0.2 0.25 0.3 0.35 0.4
MAGNETIC FRACTION (A)
-e- % Ti02 -;- % Fe203 ---?Ib- % MASS
Figure 6.2 Variations in Ti02 and F~03 contents of altered ilmenite in different magnetic
fractions (data from Wort and Jones, 1980).
4.7
4.6
4.5
(0) 4.4 I
E (,) 4.3 C> -(!j 4.2 cri :::.::: 4.1 -l ::> m 4
3.9
3.8
3.7 40
6.3
+ ~ pure ilmenite
+ +
+
++ pseudorutile .,
+ +
+
50 60 70 80
+
% Ti02 IN CONCENTRATE
rutile ..
90 100
Figure 6.3 The relationship between density and the degree of ilmenite alteration (the
Ti02 content of the altered ilmenite concentrate). From data given in Table 6.2.
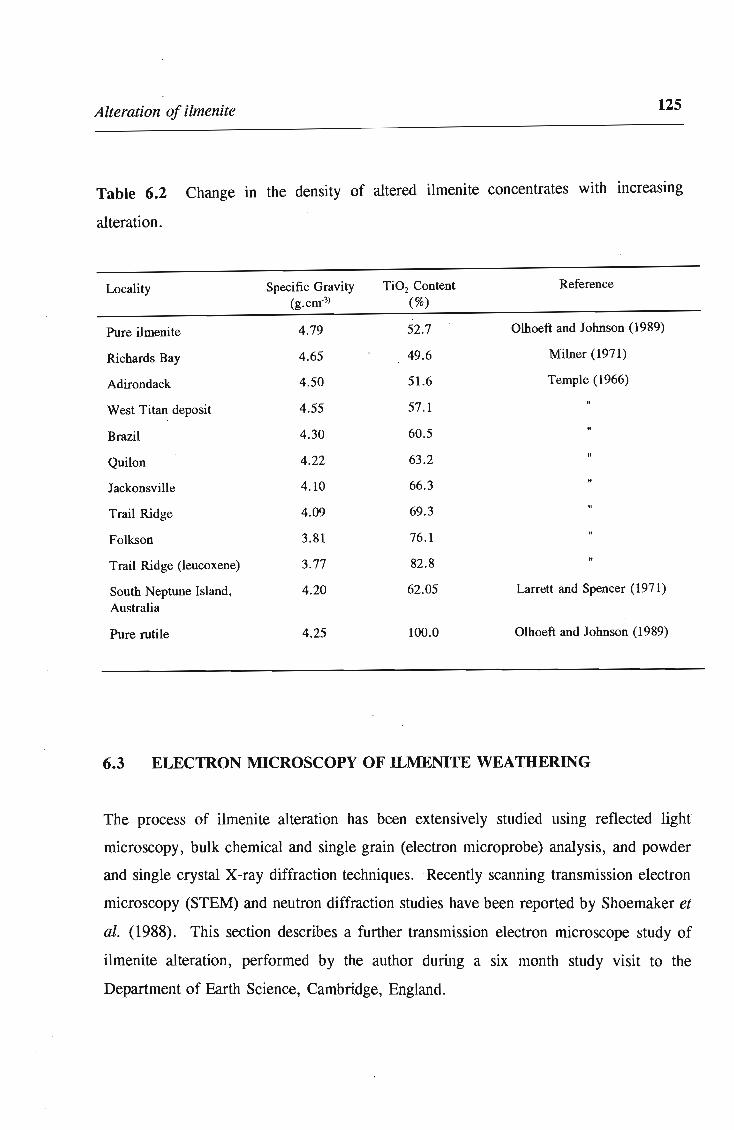
Alteration of ilmenite 125
Table 6.2 Change in the density of altered ilmenite concentrates with increasing
alteration.
Locality Specific Gravity Ti02 Content Reference (g.cm-3) (%)
Pure ilmenite 4.79 52.7 Olhoeft and lohnson (1989)
Richards Bay 4.65 49.6 Milner (1971)
Adirondack 4.50 51.6 Temple (1966)
West Titan deposit 4.55 57.1
Brazil 4.30 60.5
Quilon 4.22 63.2
lackonsville 4.10 66.3
Trail Ridge 4.09 69.3
Folkson 3.81 76.1
Trail Ridge (leucoxene) 3.77 82.8
South Neptune Island, 4.20 62.05 Larrett and Spencer (1971) Australia
Pure rutile 4.25 100.0 Olhoeft and lohnson (1989)
6.3 ELECTRON MICROSCOPY OF ILMENITE WEATHERING
The process of ilmenite alteration has been extensively studied using reflected light
microscopy, bulk chemical and single grain (electron microprobe) analysis, and powder
and single crystal X-ray diffraction techniques. Recently scanning transmission electron
microscopy (STEM) and neutron diffraction studies have been reported by Shoemaker et
al. (1988). This section describes a further transmission electron microscope study of
ilmenite alteration, performed by the author during a six month study visit to the
Department of Earth Science, Cambridge, England.

Alteration of ilmenite 126
The aim of the visit was to determine the potential of using electron microscopy in the
study of ilmenite alteration and then to investigate the alteration of ilmenite using bright
and dark field transmission electron microscopy in order to determine by which mechanism
ilmenite alters. The following possibilities were envisaged:
1. Direct alteration to pseudorutile, as proposed by Temple (1966), Grey and Reid
(1975) and that altered ilmenite grains with compositions between ilmenite and
pseudorutile (that is, hydrated ilmenite) consist of mixtures of ilmenite and
pseudorutile, as suggested by Frost et al. (1983);
2. Alteration to mixtures of other phases such as rutile, hematite and anatase, as
suggested by Overholt et at. (1950) and Lynd et al. (1954);
3. Alteration to an intermediate amorphous material, as suggested by Bailey et al.
(1956) and Wort and Jones (1980).
A further object of the study was to examine the structural relationships between ilmenite
and its weathered products, using transmission electron microscopy.
Information on the theory and practice of electron microscopy may be found in Edington
(1975), Wenk (1976), and Putnis and McConnell (1980).
6.3.1 The relationship between pseudorutile and ilmenite
Teufer and Temple (1966) determined that the structure of pseudorutile is hexagonal
(a = 0.287 nm, C = 0.461 nm). They proposed that the oxygen anions form a
hexagonally closed packed (RCP) structure and that the original ilmenite oxide lattice is
little affected by the topotactical transformation of ilmenite to pseudorutile and finally to
rutile. These authors considered the metal cations to be randomly distributed amongst the
octahedral sites. However, this does not fully explain the diffuse streaks or arcs observed
by precession camera patterns, in reciprocal (hkl) layers with I odd.

Alteration of ilmenite 127
Grey and Reid (1975) refined the structure of pseudorutile and proposed that the extra
XRD reflections are due to poor ordering of the metal atoms in the a-b plane. They
determined that ideally the metal ordering forms a five-fold supercell along a, so that
a = 1.437 nm for pseudorutile. The close agreement between the shape of the diffuse
reflections in precession camera patterns of pseudorutile and multiply twinned tivanite (an
ordered intergrowth of goethite and rutile-type structures described by Grey and Nickel,
1981) led Grey et al. (1983) to propose that "the structure of pseudorutile comprises a
statistical distribution of the various twin possible variants of a goethite-rutile intergrowth
structure". This argument was substantiated by the close similarities between the
structures of pseudorutile and various synthetic rutile-goethite type intergrowth structures.
These authors also determined that the cations are ordered in 4-5 nm microdomains and
that the coherency of the anion lattice is maintained over 3-4 twin variants, producing
microdomains of about 16 nm. Further, they established that pseudorutile contained
approximately 3 per cent structurally bound water, and that the phase should be considered
as an oxyhydroxide with a composition between F~Ti309 and F~Ti308(OHh The
important role that hydration plays in the alteration of ilmenite in the ground water
environment has been highlighted by other workers (Flinter, 1959; Dyadchenko and
Khatuntseva, 1960; Gevorkyan and Tananayev, 1964). Recently Frost et al. (1983) stated
that pseudorutile may undergo "concomitant hydroxy lation" and leaching of iron, as given
by the reaction:
.... (6.1)
A similar reaction has also been proposed by Miicke and Chaudhuri (1991).
Alteration beyond pseudorutile leads to the formation of cryptocrystalline rutile (Teufer
and Temple, 1966; Temple, 1966; Grey and Reid, 1975; Frost et al., 1983) or anatase
(Anand and Gilkes, 1984). Areas within weathered ilmenite which have (Ti/Ti + Fe) ratios
of more than 0.65 to 0.7 usually contain some rutile or anatase together with variable
amounts of pseudorutile, ilmenite, hematite, goethite and amorphous material.

Alteration of ilmenite 128
6.3.2 Experimental
\
A sample of altered ilmenite concentrate from the 90 foot strand line, Capel, Western
Australia, supplied by Dr lan Grey of the CSIRO, Australia, was first studied, as this has
been well characterised by Frost et al. (1983) and Frost et al. (1986). Samples from the
Port Durnford Formation (HZ 21) and the Late Pleistocene - Holocene dunes near
Richards Bay (HZ 17) were also studied. The latter samples yielded similar results to the
Western Australian samples, although the ilmenites are less altered.
The concentrates were separated into magnetic fractions using a Cook isodynamic
separator in order to concentrate the pseudorutile and to remove minor impurities. The
settings given by Frost et al. (1986) were used. A gravity separation was then performed
on each fraction, using 4.0 g.cm-3 Clerici solution, to remove any silicate impurities. The
4.0 g.cm-3 sink fractions were analysed using powder X-ray diffraction, reflected light
microscopy, SEM back-scatter analysis and electron microscope techniques, to determine
the degree and nature of the ilmenite alteration. From these analyses, magnetic fractions
which contained the highest proportions of weathered ilmenite, with compositions close
to pseudorutile and few impurities, were selected for the study. Grains from these
fractions were embedded in resin and then ground and polished to form discs of less than
30 ~m thick. These grids were then mounted on titanium grids and ion-beam thinned.
Electron ~icroscopy was performed using a JEOL JEM l00CX microscope fitted with a
double tilt goniometer stage, allowing for large angles of rotation. The diffraction patterns
were indexed with the aid of the Diffract software package.
6.3.3 Analytical techniques
All analyses for this study were performed using equipment in the Department of Earth
Sciences, Cambridge under the supervision of Dr Andrew Putnis. Reflected light
microscopy and a JEOL 6100 scanning electron microscope were used to study the
petrography of the weathered ilmenite grains. Microprobe analyses were done on a
Cameca Camebax IV microprobe. Powder X-Ray diffraction patterns of magnetic

Alteration of ilmenite 129
fractions were obtained using a Philips diffractometer, Co-Ka radiation, with filters, at a
scan speed of 1 degree 28 per minute.
6.3.4 Petrography and chemistry of the concentrates
The petrography and chemistry of the Capel concentrate has previously been described by
Frost et al. (1983), and only a summary is provided here. Scanning electron microscopy
shows that the weathered areas form patches or stringers, which are usually orientated
along the basal plane of the ilmenite grains (Plate 6.IA). Back-scattered electron images
(Plate 6.1 B and C) indicate that the weathered areas are inhomogeneous and microprobe
analyses reveal that the weathered grains have a complete range of compositions from
ilmenite to Ti02, however, most of the analyses from the Capel 0.2 and 0.3 A magnetic
fractions fall between the compositions of ilmenite and pseudorutile (Table 6.3). Powder
X-ray diffraction patterns of the magnetic fractions (Figure 6.4) show that the 0.3 A
fraction contains the highest proportions of pseudorutile. In comparison, the South African
samples contain less pseudorutile (Figure 6.5). Optical microscopy and SEM reveal that
the magnetic fractions of sample HZ 17, from the Richards Bay Late-Pleistocene -
Holocene dunes, contain mostly unaltered ilmenite. Sample HZ 21 from the Mid
Pleistocene Port Durnford Formation consists mostly of altered ilmenite grains, but these
show only incipient alteration to pseudorutile.
6.3.5 Transmission electron microscopy
Areas of weathered ilmenite are easily distinguished from ilmenite in bright field mode by
their inhomogeneous and mottled appearance (Plate 6.2A) and dark field (Plate 6.2B). It
appears that the degree of mottling and inhomogeneity is related to the degree of
weathering, but this cannot be substantiated without, at least, semi-quantitative chemical
analysis. The weathered areas are preferentially thinned by the ion beam and it is possible
that this method of preparation enhances the heterogeneity of the weathered ilmenite.

Plate 6.1 Back-scattered electron images of altered ilmenites in the 0.3 A magnetic
fraction from Capel 90 ft Strand Line, Australia.
A. General view of altered ilmenites grains showing the development of weathered
areas as patches or stringers, which are commonly orientated along the basal plane
of the ilmenite grains. Scale bar 100 p.m.
B. A partially altered ilmenite grain illustrating the inhomogeniety of the weathered
areas. Scale Bar 10 p.m.
C. A magnified view of the above grain, showing the zonations and fine intergrowths
which may develop in the weathered areas. Note also the highly porous nature of
the weathered zones, which may lead to preferential thinning by the ion-beam
during the manufacture of thin-foils. Scale Bar 10 p.m.
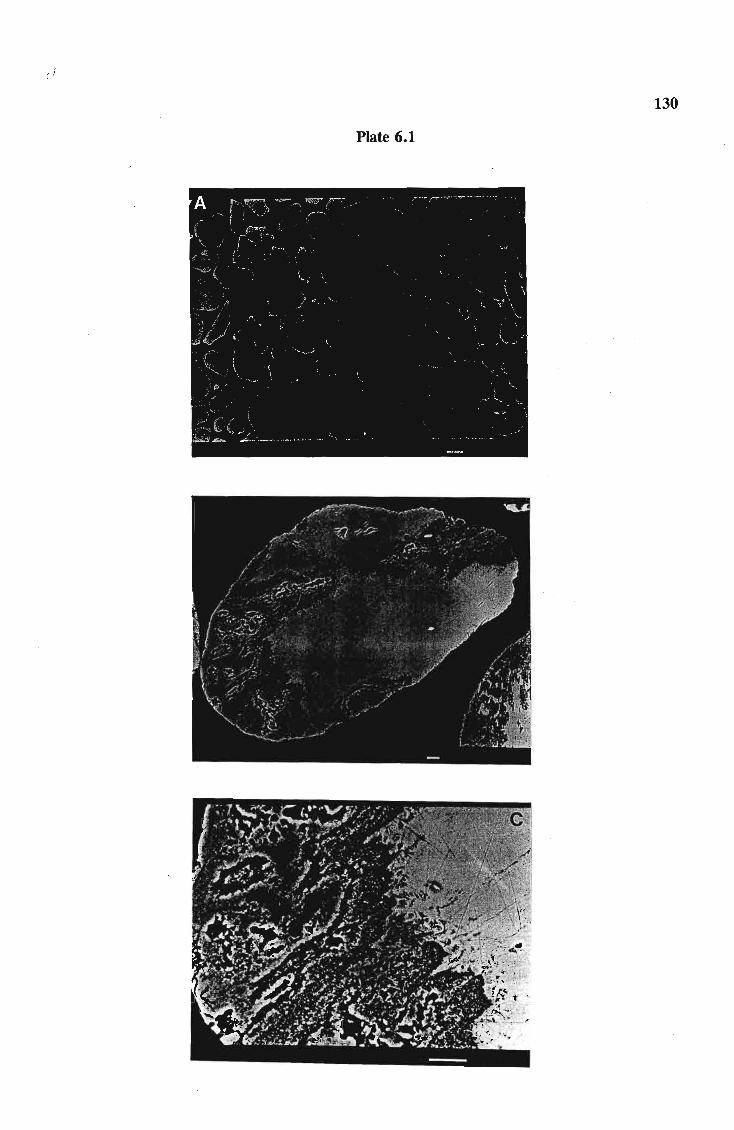
130
Plate 6.1

Alteration of ilmenite 131
Table 6.3A Representative microprobe analyses of altered ilmenites from Capel 90 Foot Strand line (0.2 A fraction)
Anal~sis Phase Ti02 FeO Al203 Si02 MgO MnO Cr203 Total G2 Al hyd ilm 54.01 44.35 1.73 100.09 G5 Al psr? 64.66 33.10 0.39 1.29 99.44 G6 Al hyd ilm 57.53 42.30 0.33 0.50 100.66
G9 Al hyd ilm 56.60 40.63 0.23 0.85 98.31 G9 A2 hyd ilm 60.46 35.42 0.42 0.28 0.16 0.65 97.43
GlO Al hyd ilm 56.88 40.88 0.82 98.57 GlO A2 hyd ilm 54.37 45.24 0.15 1.15 100.90
Gll Al ilmenite 50.99 43.08 0.14 1.94 96.15 G11 A2 hyd ilm 59.16 36.49 1.08 0.61 1.75 99.08 G11 A3 leucoxene 68.24 23.36 5.77 1.09 0.78 0.33 99.56 Gll A4 psr? 63.57 31.52 0.90 0.59 1.78 0.22 98.58
G14 Al hyd ilm 59.19 37.17 0.30 0.16 0.32 0.57 0.13 97.84 G14 A2 leucoxene 75.89 16.21 0.54 1.62 0.30 0.17 94.73
G16 Al ilmenite 51.72 46.80 0.13 0.38 0.76 99.79 G16 A2 psr? 62.23 33.57 0.28 0.38 0.47 96.92
G18 Al hyd ilm 55.70 44.16 0.97 100.82 G18 A2 leucoxene 74.26 19.80 2.29 1.08 0.29 97.71 GI8 A3 hyd ilm 58.26 38.07 0.48 0.39 1.45 98.65
blank = below detection limit hyd ilm = hydrated ilmenite psr ? = possibly pseudorutile G 1 Al = grain 1, analysis 1 all iron is reported as FeO
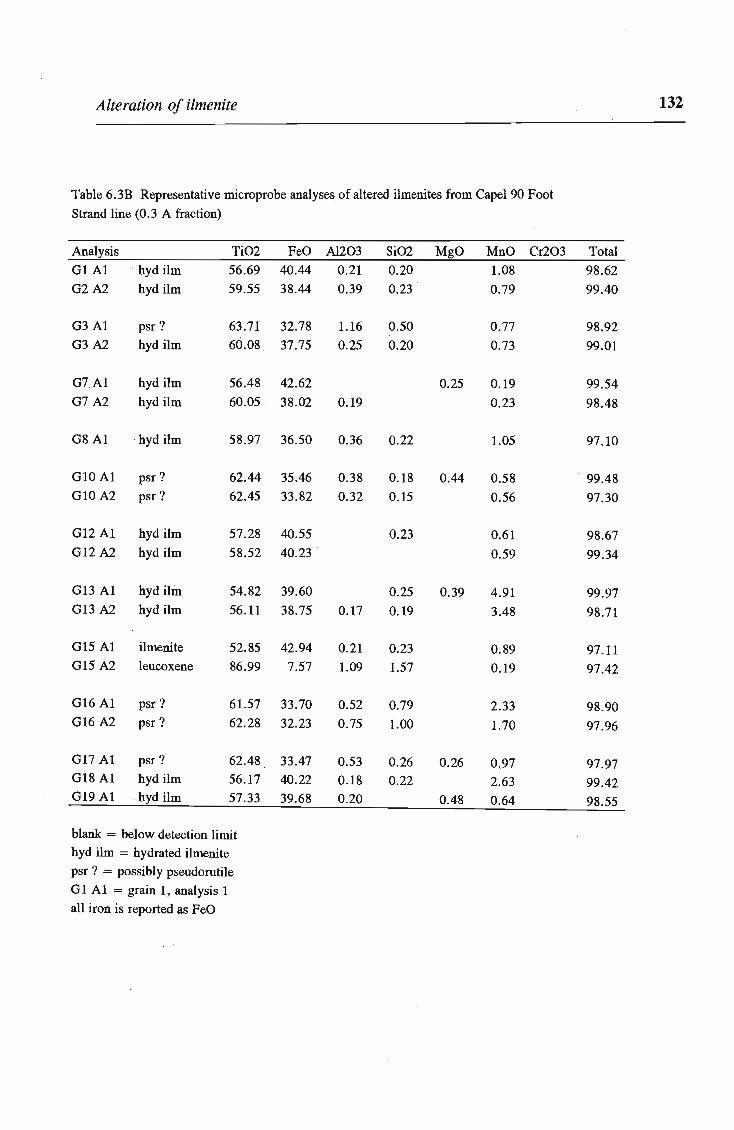
Alteration of ilmenite 132
Table 6.3B Representative microprobe analyses of altered ilmenites from Capel 90 Foot
Strand line (0.3 A fraction)
Analysis Ti02 FeO Al203 Si02 MgO MnO Cr203 Total
G1 Al hyd ilm 56.69 40.44 0.21 0.20 1.08 98.62
G2A2 hyd ilm 59.55 38.44 0.39 0.23 0.79 99.40
G3 Al psr? 63.71 32.78 1.16 0.50 0.77 98.92 G3A2 hyd ilm 60.08 37.75 0.25 0.20 0.73 99.01
G7A1 hyd ilm 56.48 42.62 0.25 0.19 99.54 G7 A2 hyd ilm 60.05 38.02 0.19 0.23 98.48
G8 Al . hyd ilm 58.97 36.50 0.36 0.22 1.05 97.10
GlOA1 psr? 62.44 35.46 0.38 0.18 0.44 0.58 99.48 GlOA2 psr? 62.45 33.82 0.32 0.15 0.56 97.30
G12A1 hyd ilm 57.28 40.55 0.23 0.61 98.67 G12A2 hyd ilm 58.52 40.23 0.59 99.34
G13 Al hyd Hm 54.82 39.60 0.25 0.39 4.91 99.97 G13 A2 hyd ilm 56.11 38.75 0.17 0.19 3.48 98.71
G15 Al ilmenite 52.85 42.94 0.21 0.23 · 0.89 97.11 G15 A2 leucoxene 86.99 7.57 1.09 1.57 0.19 97.42
G16 Al psr? 61.57 33.70 0.52 0.79 2.33 98.90 G16 A2 psr? 62.28 32.23 0.75 1.00 1.70 97.96
G17 Al psr? 62.48 33.47 0.53 0.26 0.26 0.97 97.97 G18 Al hyd ilm 56.17 40.22 0.18 0.22 2.63 99.42 G19 Al . hyd ilm 57.33 39.68 0.20 0.48 0.64 98.55
blank = below detection limit hyd ilm = hydrated ilmenite
psr? = possibly pseudorutile
G1 Al = grain 1, analysis 1 all iron is reported as FeO

133
Q.----~
Q.
Q.c:::::::::::::::::--
A~ISNllNI
Figure 6.4 Powder XRD patterns of altered ilmenites in magnetic fractions from the
Capel 90 ft Strand Line showing the concentration of pseudorutile in the 0.2A (A)
and 0.3 A (B) fractions.

A
B
c
h
h
h
h
25 35 45
Degree 29
h
55
p
134
i = Ilmenite r = Rutile h = Hematite p = Pseudorutile
65
Figure 6.5 Powder XRD patterns of ilmenite magnetic fractions from South African
deposits. A. Richards Bay (HZ17), 0.1 A. B. Richards Bay (HZ17), 0.3 A. C. Port
Durnford (HZ21). Only the Port Durnford sample shows any evidence of pseudorutile.

Alteration of ilmenite 135
Selected area diffraction patterns (SADP) of unaltered ilmenite display only the
fundamental reflections of ilmenite, but SADP's of weathered areas show the following
features illustrated in Plate 6.3:
1. the fundamental reflections become broadened and may become split or streaked;
2. the intensity of some fundamental reflections of ilmenite decreases and in some
cases they become extinct;
3. additional diffuse scattering and streaks appear;
4. extra, superlattice reflections, usually not corresponding to the fundamental
reflections, are formed.
Indexed schematic representations are given on the left hand side of the diffraction patterns
in Plate 6.3. These show that the fundamental reflections in SADP's of weathered areas
may be indexed using the ilmenite lattice. The SADP's indicate clearly that in these
samples altered ilmenite between the chemical compositions of ilmenite and pseudorutile
does not consist of mixtures of minerals such as rutile and hematite, or goethite. Neither
is there any indication of the formation of amorphous material, which would result in
SADP's with a circle of diffuse scattering around the transmitted beam and no distinct
reflections. No reflections unique to pseudorutile are observed. However, as shown by
the schematic diagrams for Plate 6.3, certain reflections indexed using an ilmenite lattice
may also be indexed by the fundamental cell of pseudorutile (a = 0.287 nm, C = 0.461
nm) given by Teufer and Temple (1966). It is possible that the ilmenite and pseudorutile
reflections are not clearly resolved due to two factors:
1. Spot broadening is caused by the poorly crystalline nature of weathered areas, and
the fine domains formed within these areas.
2. The d spacings of ilmenite and the pseudoruti1e subcell are similar with co-incident
axes.
If pseudorutile is formed, then a topotactical relationship clearly exists between ilmenite
and this phase, with ciIm parallel to cpsr and (1120)iIm parallel to apsr (Figure 6.6), as
suggested by Teufer and Temple (1966) and Grey and Reid (1975).

Plate 6.2 Transmission electron microscope images of an altered . ilmenite grain from
Capel 90 ft Strand Line.
A. Bright field image of weathered ilmenite showing the inhomogeneous nature of the
weathered area. The boundary between the unaltered ilmenite (left) and weathered
material is fairly sharp and embayed. Scale bar = 1 jlm.
B. Dark field image of the above area using an extra pseudorutile reflection along a* p'
Scale bar = 1 jlm.

136
Plate 6.2
:' '-I I -LL ,1-, "C:' - -' -'

" Ci,p
t .. ... • •
e 0~6i cl> 0002p
• • --- •
0 0 1120 al-o ~ 0110 p
• -- • --- •
0 0 0
• - • • [ 11001ilm
[ 2110]psr
C~
l'P
• . - • .. · •
I:: 2 0 0OO6j
0 0:: ilm+psr ..,.. - 0 - -0002p .:: ilm
l:: 1 • . • · •
Ip::O 0 - -0 1120j It - - 0 "---t>a 0110p P
• - • . •
0 - - 0 0
• - - • ... · .. [1100 ]-1 _ Im [2110]psr

137
Plate 6.3 SADP's of weathered areas orientated along the [1100]ilm zone axis. Sample
from Capel, Australia. Note A and B are taken at different camera lengths.
A. Development of streaking and extra reflections parallel to the (1120)ilm direction. The schematic diagrams indicate how the fundainental reflections may be indexed by both ilmenite and the subsell of pseudorutile occurring in a topotactic arrangement.
B. Development of superlattice reflection parallel to the (1120)iJm direction. See text for explanation.


Alteration of ilmenite 138
Figure 6.6 Schematic diagram showing the topotactical arrangement of ilmenite and the
pseudorutile subcell in real space perpendicular to the c axis. Large, open circles
represent oxygen anions, while Ti and Fe cations are depicted by the small circles.
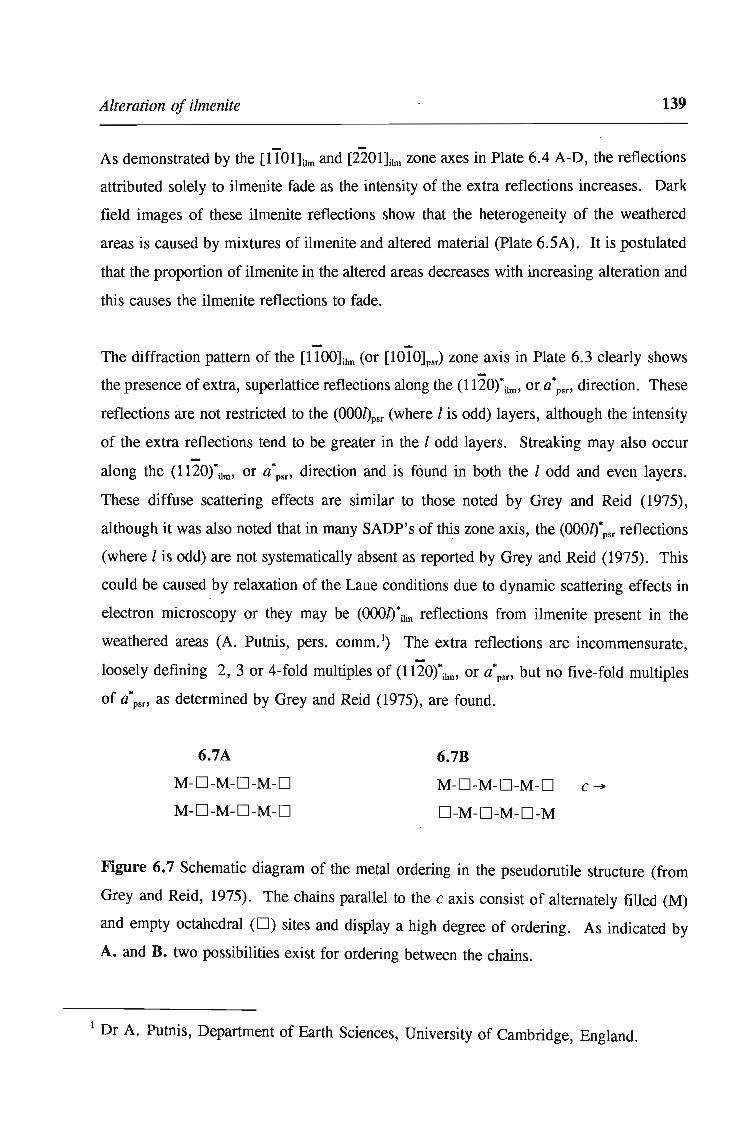
Alteration of ilmenite 139
As demonstrated by the [llOllilm and [2201]ilm zone axes in Plate 6.4 A-D, the reflections
attributed solely to ilmenite fade as the intensity of the extra reflections increases. Dark
field images of these ilmenite reflections show that the heterogeneity of the weathered
areas is caused by mixtures of ilmenite and altered material (Plate 6.5A). It is postulated
that the proportion of ilmenite in the altered areas decreases with increasing alteration and
this causes the ilmenite reflections to fade.
The diffraction pattern of the [llOOllm (or [lOlO]psr) zone axis in Plate 6.3 clearly shows
the presence of extra, superlattice reflections along the (1 I20rilm' or a·pm direction. These
reflections are not restricted to the (OOOl)psr (where I is odd) layers, although the intensity
of the extra reflections tend to be greater in the I odd layers. Streaking may also occur
along the (lliOrilm' or a*pm direction and is found in both the I odd and even layers.
These diffuse scattering effects are similar to those noted by Grey and Reid (1975),
although it was also noted that in many SADP's of this zone axis, the (OOOl)*psr reflections
(where I is odd) are not systematically absent as reported by Grey and Reid (1975). This
could be caused by relaxation of the Laue conditions due to dynamic scattering effects in
electron microscopy or they may be (OOOl)*ilm reflections from ilmenite present in the
weathered areas (A. Putnis, pers. comm. 1) The extra reflections are incommensurate,
loosely defining 2, 3 or 4-fold multiples of (liio)*ilm' or a*pm but no five-fold multiples
of a·pm as determined by Grey and Reid (1975), are found.
6.7A
M-O-M-O-M-O
M-O-M-O-M-O
6.7B
M-O-M-O-M-O
O-M-O-M-O-M c-
Figure 6.7 Schematic diagram of the metal ordering in the pseudorutile structure (from
Grey and Reid, 1975). The chains parallel to the c axis consist of alternately filled (M)
and empty octahedral (0) sites and display a high degree of ordering. As indicated by
A. and B. two possibilities exist for ordering between the chains.
1 Dr A. Putnis, Department of Earth Sciences, University of Cambridge, England.

Alteration of ilmenite 140
Grey and Reid (1975) observed that the diffuse scattering peaks indicated a one
dimensional periodic structure parallel to the c axis of pseudorutile, and that this chain
structure contained a high degree of ordering along the chain, but imperfect ordering
between chains. In pseudorutile the highly ordered chains are formed by alternately filled
and empty octahedral sites. As stated by these authors, two possibilities exist for the
ordering between pairs of chains (Figure 6.7), and
"if the two types of chains are randomly distributed, the corresponding diffraction
[X-ray] patterns will exhibit sheets [streaking] of diffuse intensity perpendicular to
the c axis",
that is, along (OOOl)"psr (Figure 6.7). As this streaking is observed in some SADP's (see
Plate 6.3A) it is concluded that in some instances there is little ordering (correlation)
between chains in weathered ilmenite. The introduction of correlations between chains
will result in the modulation of the diffuse intensity along (OOOI)*psr (Grey and Reid, 1975)
and hence the formation of extra reflections in this direction (Plate 6.3B). The presence
of these extra reflections in some SADP's therefore represent increased ordering (or
correlation) between chains in the weathered ilmenite. As these extra reflections may
define a number of superstructures (x2, x3 and x4 multiples) of the altered ilmenite lattice,
it is postulated that a number of different ordering schemes may develop between the
metal-vacancy chains.
The extra, superlattice reflections are observed within (hkil)psn with I = odd, layers in
SADP's of other zone axes (Plate 6.4), although superlattice reflections are also observed
in the I = 0 layer of the [llOI]ilm zone axis. These reflections are often diffuse and
streaked. In SADP's of some zone axes the superlattice reflections are connected by
diffuse streaking which has an arced (Plate 6.4B) or sinusoidal form (Plate 6.4D).
Complicated streaking effects are also observed in the SADP's of the [OOOI]ilm zone axis
(Plate 6.4E). The SADP's of areas which appear to only be slightly weathered often do
not display any superlattice reflections, and only diffuse scattering and streaking are
observed (Plates 6.4A and 6.4C).
Alteration of ilmenite 141
In dark field mode the diffuse scattering and streaks produce stippled textures as a result
of diffraction from small areas within the weathered material. These range in size from
3 to 5 nm, but may coalesce to form larger, inhomogeneous areas of diffraction (Plate
6.5B). Dark field analysis of the extra, superlattice reflections produce images which have
a coarser, mottled texture, forming microdomains which range in size from about 5 to 20
nm (Plate 6.5C) .
The diffuse scattering and streaking, and their associated dark field images indicate short
range order associated with metal-vacancy ordering parallel to the c axis , forming
microdomains within the weathered areas (Hugo, 1991). The curved shape of the streaks
may be caused by diffraction from microdomains having different orientation or twin
variants, as suggested by Grey et al. (1983). The formation of superlattice nodes with
increased weathering, and the larger microdomains contributing to these nodes, suggests
that a longer range of ordering is introduced by the correlation between the metal-vacancy
chains as weathering proceeds.
Slightly rounded, tabular precipitates are observed in a few weathered grains (Plate 6.6).
These vary in size from 25 to 200 nm and are roughly orientated parallel to each other.
The precipitates produced extra spots in SAPP's which are indexed by a rutile lattice.
This indicates that rutile nucleates as discrete precipitates from the weathered matrix.
6.3.6 Conclusions
The TEM study of weathered ilmenites from Australia and South Africa reveals that:
1. The weathered areas within grains are inhomogeneous consisting of mixtures of
ilmenite and altered material.
2. The underlying oxide lattice remains intact during the alteration of ilmenite to
pseudorutile.

Alteration of ilmenite 142
3. Pseudorutile (indexed by the unit cell a = 0.287 nm, C = 0.461 nm) has a
topotactic relationship with ilmenite, with ciJmll cpsr and (1120)iJmll Gpsr.
4. As the ilmenite is altered by the oxidation and removal of iron, the remaining metal
cations form ordered chains with the resulting vacancies parallel to the C axis of the
oxide lattice, as determined by Grey and Reid (1975).
5. The ordering (correlation) of different metal-vacancy chains forms a number of
superstructures (x2, x3 x4 supercells) in the (0001) plane, suggesting that the x5
supercell of Grey and Reid (1975) is not the only metastable ordering scheme
which may exist. The superstructures form microdomains of between 5 and 20 nm
within the altered ilmenite.
6. Altered areas between the composition of ilmenite (FeTi03) and pseudorutile
(F~ Ti30 9) do not consist of mixtures of minerals such as rutile or hematite, and
no amorphous material is formed.
7. Rutile nucleates as discrete precipitates within the weathered material.
The findings of this study are not conclusive and further research using high resolution
electron microscopy is required to examine the causes of short range ordering and
superstructuring in greater detail. STEM analysis should be used to correlate the structural
changes observed from SADP's with chemical analysis indicating the degree of alteration.
Finally, the study was unable to determine the role that hydration plays in the alteration
of ilmenite.
The type of ilmenite alteration described above is typical for ilmenite weathered below the
water table, in deposits which are slightly reducing and acidic (Grey and Reid, 1975).
Ilmenite may alter by different mechanisms when deposited under different physical
conditions. These mechanisms are described in the subsequent sections of this chapter
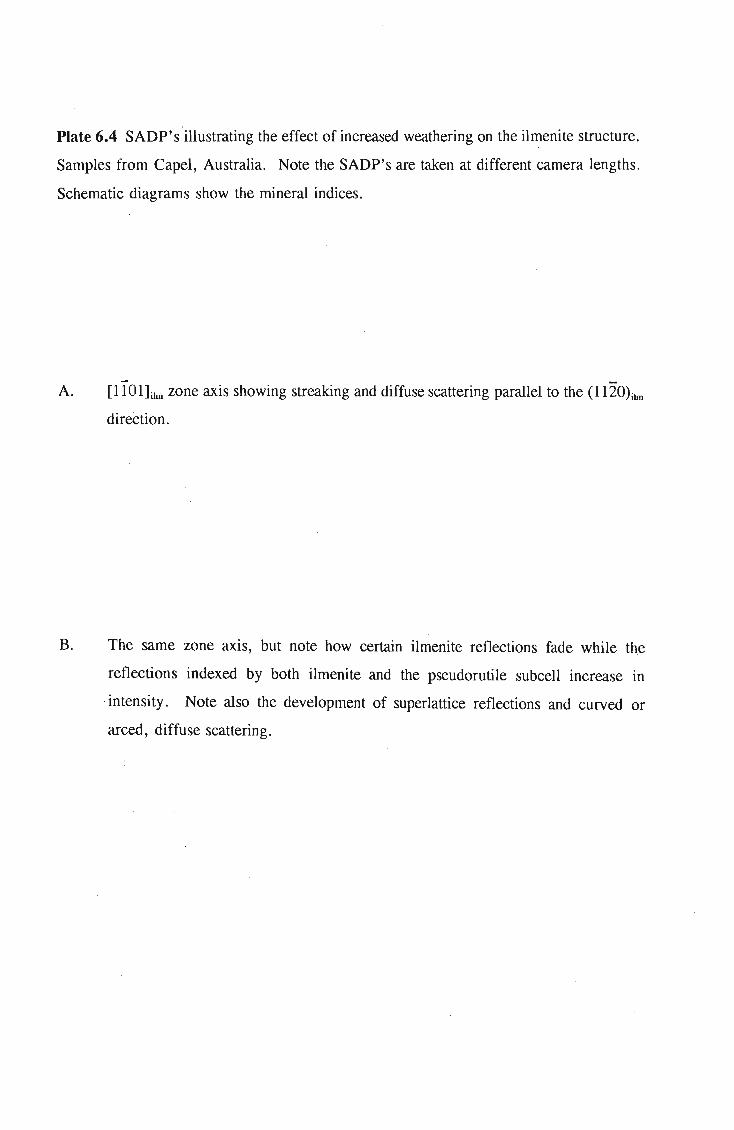
Plate 6.4 SADP's 'illustrating the effect of increased weathering on the iln:tenite structure.
Samples from Capel, Australia. Note the SADP's are taken at different camera lengths.
Schematic diagrams show the mineral indices.
- -A. [1101hriJ zone axis showing streaking and diffuse scattering parallel to the (1120)ilm
direction.
B. The same zone axis, but note how certain ilmenite reflections fade while the
reflections indexed by both ilmenite and the pseudorutile subcell increase m
,'intensity. Note also the development of superlattice reflections and curved or
arced, diffuse scattering.

Plate 6.4
0 0 1103p ff~2i • •
• • 1120j
0 0 0 1010p
• • • • •
0 0
(11011ilm .= ilm
[0111lpsr 0= ilm, psr
o o o • •
• • • , \ /
O ..... ,:' D .... ~: 0 " \ I \.
\ J
:;-~ 0 ' ,
\.~
• \
• • 1103p'.' 1102j
• • 1120 o •
•
o
• \
o • 1010
•
•
O \, >-....
r ' I O \ , ,---
/' ' O " I' -' 0 " -'. • • •
• • \ o ' , < o ,-/ 0
8
143
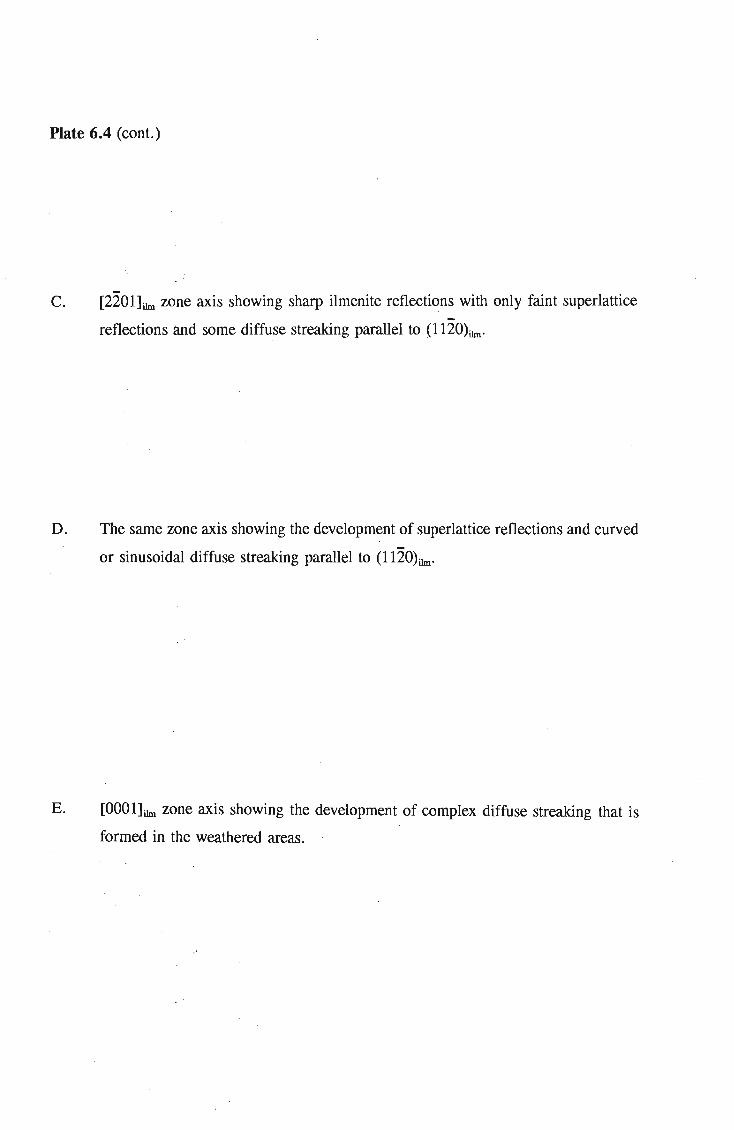
Plate 6.4 (cont.)
c. [2201]iIm zone axis showing sharp ilmenite reflections with only faint superlattice
reflections and some diffuse streaking parallel to (1120hn.
D. The same zone axis showing the development of superlattice reflections and curved
or sinusoidal diffuse streaking parallel to (1120)ilmO
E. [OOOl]iIm zone axis showing the development of complex diffuse streaking that is
formed in the weathered areas.

0
•
•
• •
•
• •
• o
• •
• •
"
• • [ 22011ilm
0 0 0112p 1
1 04.: • • I
.... , . .... -_ ...... " -...... - .
~--~.,.,
0
--- ...
•
• •
0
• • · --.--- . - .-, .
• o 0
[2201]ilm
[ 0221] psr
144
Plate 6.4 (cont.)
•
1120j •
•
0 • • • • • " .
~ • ""'- .... ~
• • • -1120 j
0 1010p • • • ", .
• • • -- - ..... , ' .
• • •
o • • E •
• • • • •
• • • • • • • • • • •
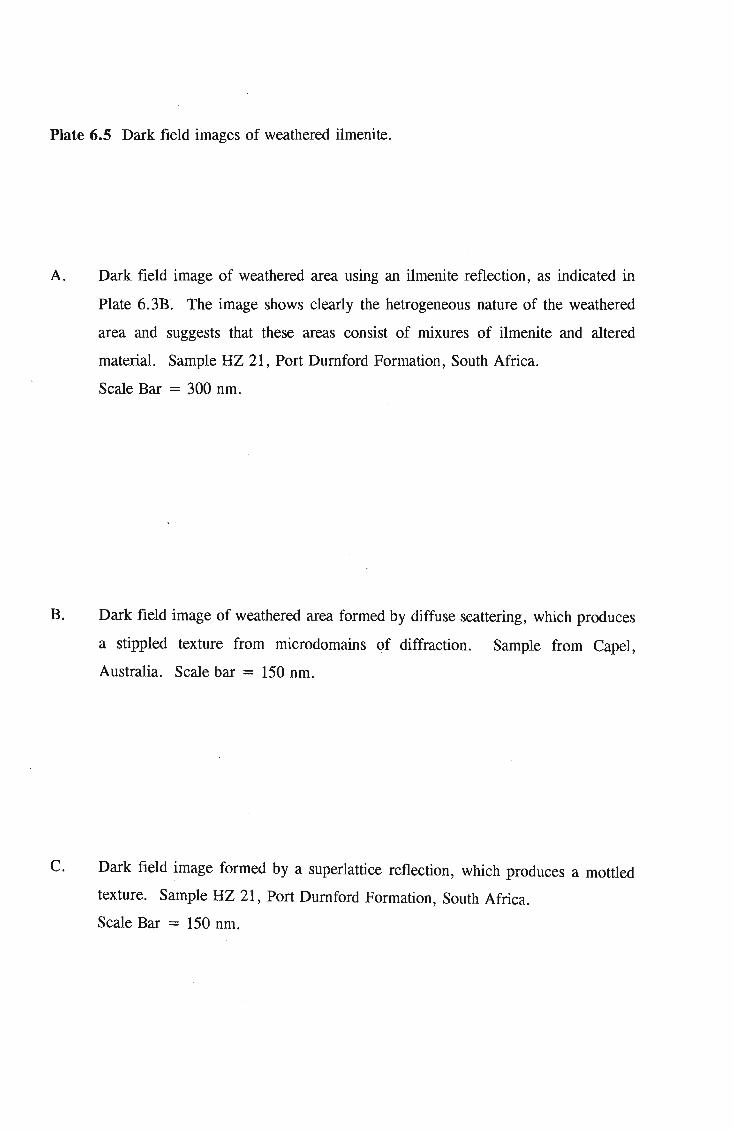
Plate 6.5 Dark field images of weathered ilmenite.
A. Dark field image of weathered area using an ilmenite reflection, as indicated in
Plate 6.3B. The image shows clearly the hetrogeneous nature of the weathered
area and suggests that these areas consist of mixures of ilmenite and altered
material. Sample HZ 21, Port Dumford Formation, South Africa.
Scale Bar = 300 nm.
B. Dark field image of weathered area formed by diffuse scattering, which produces
a stippled texture from microdomains of diffraction. Sample from Capel,
Australia. Scale bar = 150 nm.
C. Dark field image formed by a superlattice reflection, which produces a mottled
texture. Sample HZ 21, Port Dumford Formation, South Africa.
Scale Bar = 150 nm.

145
Plate 6.5
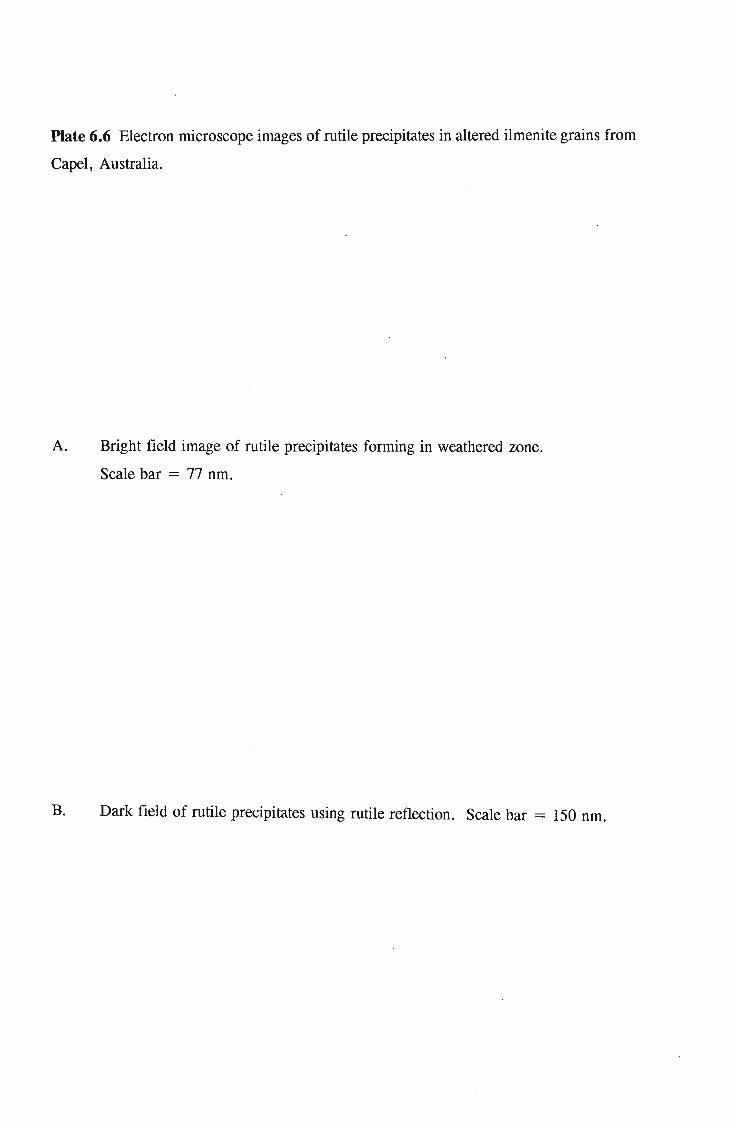
Plate 6.6 Electron microscope images of rutile precipitates in altered ilmenite grains from
Capel, Australia.
A. Bright field image of rutile precipitates forming in weathered zone.
Scale bar = 77 nm.
B. Dark field of rutile precipitates using rutile reflection. Scale bar = 150 nm.

146
Plate 6.6

Alteration of ilmenite 147
6.4 ALTERATION OF ILMENITE IN TIlE STUDY AREA
This section describes the petrographic and chemical study of ilmenite weathering from the
east coast of South Africa. The nature and types of ilmenite weathering are described and
compared to the findings and models of previous authors. The paragenesis of ilmenite
weathering is discussed and evidence is presented that some of the alteration prior to final
deposition. Much of the data is from Hugo and Comell (1991), who studied the alteration
of ilmenite from deposits in Zululand, however, their findings are true for the entire study
area.
6.4.1 Ilmenite mineralogy and alteration
Most of the ilmenite found in the east coast deposits occurs as homogeneous, unaltered
grains (see Table 8.1, page 226), however, as described in Chapter 5, ilmenite may be
found in composite grains formed by exsolution, oxidation or hydrothermal alteration
during cooling of the source rocks. These composite grains containing ilmenite are
petrographically distinct from grains formed by alteration processes commonly associated
with heavy mineral placer deposits.
Representative microprobe analyses of petrographically homogeneous ilmenite grains
(Table 6.4, see also Table 5.6, page 88 and Appendix B.2) show that little or no Ti02
enrichment has occurred in these grains. In addition, the majority of altered ilmenite
grains show only incipient alteration. As a result, ilmenite concentrates produced from
the east coast deposits have Ti02 contents of about 50 per cent (see Table 6.4). In this
respect the deposits are distinct from other major heavy mineral placers (such as Eneabba,
Western Australia or Trail Ridge, Florida) which tend to contain mostly weathered
ilmenite and yield concentrates containing between 54 to 66 per cent Ti02
(Mackey,
1972a).
Typical relative proportions of ilmenite and its alteration assemblages in the study area are
given in Table 6.5 (see also Map 1). This table shows that the entire spectrum from
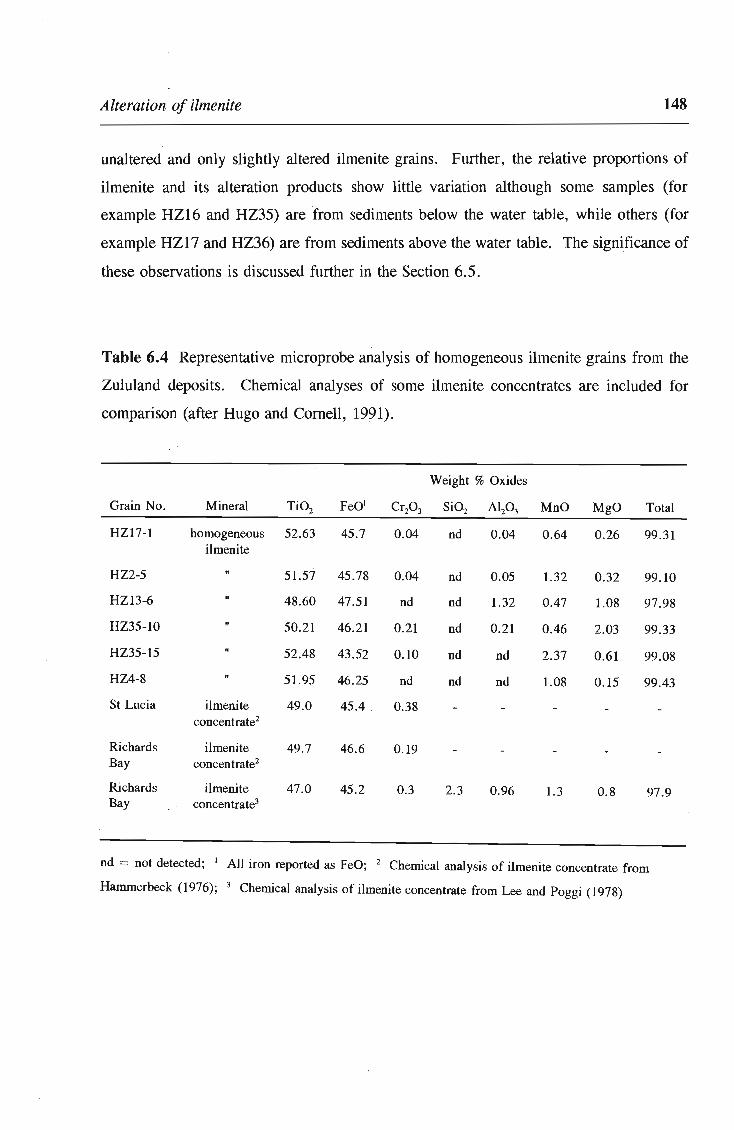
Alteration of ilmenite 148
unaltered and only slightly altered ilmenite grains. Further, the relative proportions of
ilmenite and its alteration products show little variation although some samples (for
example HZ16 and HZ35) are from sediments below the water table, while others (for
example HZ17 and HZ36) are from sediments above the water table. The significance of
these observations is discussed further in the Section 6.5.
Table 6.4 Representative microprobe analysis of homogeneous ilmenite grains from the
Zululand deposits. Chemical analyses of some ilmenite concentrates are included for
comparison (after Hugo and Cornell, 19?1).
Weight % Oxides
Grain No. Mineral Ti02 FeO' Cr20 3 Si02 AI20 3 MnO MgO Total
HZ17-1 homogeneous 52.63 45.7 0.04 nd 0.04 0.64 0.26 99.31 ilmenite
HZ2-5 51.57 45.78 0.04 nd 0.05 1.32 0.32 99.10
HZ13-6 48.60 47.51 nd nd 1.32 0.47 1.08 97.98
HZ35-1O 50.21 46.21 0.21 nd 0.21 0.46 2.03 99.33
HZ35-15 52.48 43.52 0.10 nd nd 2.37 0.61 99.08
HZ4-8 51.95 46.25 nd nd nd 1.08 0.15 99.43
St Lucia ilmenite 49.0 45.4 . 0.38 concentrate2
Richards ilmenite 49.7 46.6 0.19 Bay concentrate2
Richards ilmenite 47.0 45.2 0.3 2.3 0.96 1.3 0.8 97.9 Bay concentrate3
nd = not detected; , All iron reported as FeO; 2 Chemical analysis of ilmenite concentrate from
Hammerbeck (1976); 3 Chemical analysis of ilmenite concentrate from Lee and Poggi (1978)
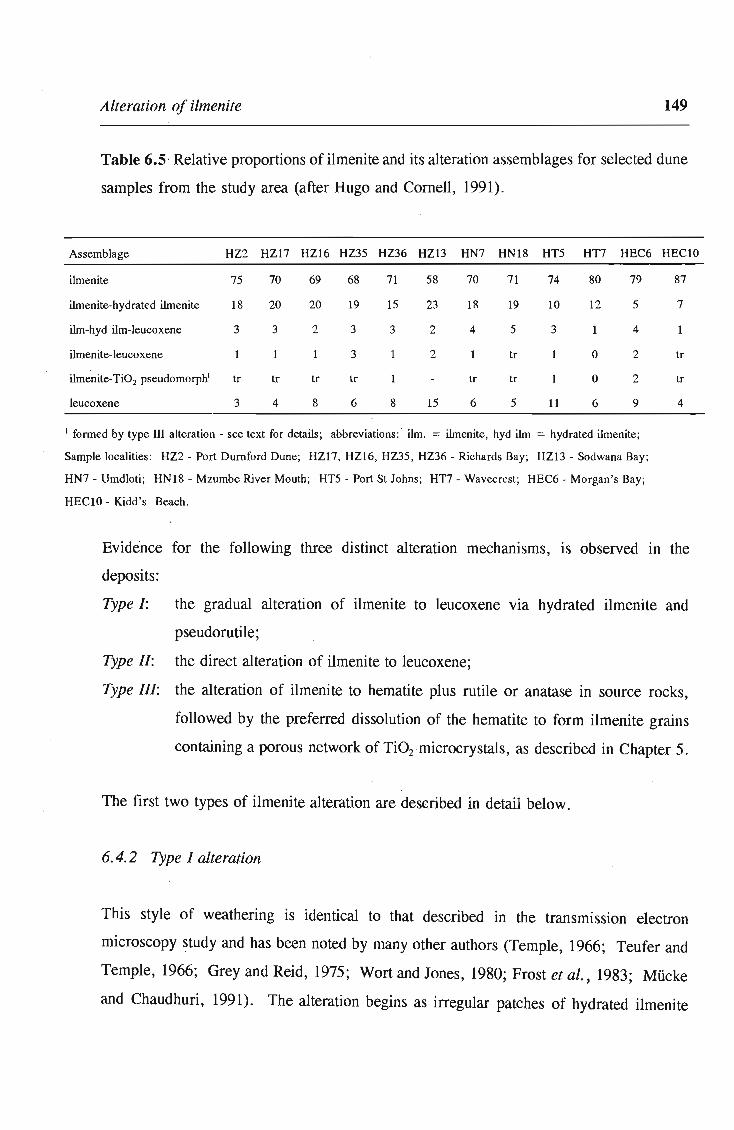
Alteration of ilmenite 149
Table 6.S · Relative proportions of ilmenite and its alteration assemblages for selected dune
samples from the study area (after Hugo and Cornell, 1991).
Assemblage HZ2 HZ17 HZ16 HZ35 HZ36 HZ13 HN7 HN18 HT5 HT7 HEC6
ilmenite 75 70 69 68 71 58 70 71 74 80 79
ilmenite-hydrated ilmenite 18 20 20 19 15 23 18 19 10 12 5
ilm-hyd ilm-leucoxene 3 3 2 3 3 2 4 5 3 4
ilmenite-Ieucoxene 3 2 tr 0 2
ilmenite-Ti02 pseudomorphl tr tr tr tr tr tr 0 2
leucoxene 3 4 8 6 8 15 6 5 11 6 9
1 formed by type III alteration - see text for details; abbreviations: ' ilm. = ilmenite, hyd ilm = hydrated ilmenite;
Sample localities: HZ2 - Port Durnford Dune; HZI7 , HZ16, HZ35 , HZ36 - Richards Bay; HZ13 - Sodwana Bay;
HN7 - Umdloti ; HN18 - Mzumbe River Mouth; HT5 - Port St Johns; HT7 - Wavecrest; HEC6 - Morgan's Bay;
HECIO - Kidd's Beach.
HEClO
87
7
tr
tr
4
Evidence for the following three distinct alteration mechanisms, is observed In the
deposits:
Type I: the gradual alteration of ilmenite to leucoxene via hydrated ilmenite and
pseudorutile;
Type Il: the direct alteration of ilmenite to leucoxene;
Type Ill: the alteration of ilmenite to hematite plus rutile or anatase in source rocks,
followed by the preferred dissolution of the hematite to form ilmenite grains
containing a porous network of Ti02 microcrystals, as described in Chapter 5.
The fIrst two types of ilmenite alteration are described in detail below.
6.4.2 Type I alteration
This style of weathering is identical to that described in the transmission electron
microscopy study and has been noted by many other authors (Temple, 1966; Teufer and
Temple, 1966; Grey and Reid, 1975; Wort and lones, 1980; Frost et al., 1983; Miicke
and Chaudhuri, 1991). The alteration begins as irregular patches of hydrated ilmenite

Alteration of ilmenite 150
along grain boundaries and weaknesses within the grain (Plate 6.7 A), or in the form of
orientated stringers along the basal plane of the ilmenite (Plate 6.7B).
Microprobe analysis indicates that the altered areas have variable Ti02 contents ranging
between 53 and about 65 percent (Table 6.6). With increasing Ti02 there is a
corresponding decrease in iron content. Slight increases in the Al20 3 and Si02 contents
are noted as the degree of alteration increases, which corresponds to the findings of Frost
et al. (1983). Back-scattered electron images indicate that the altered areas may be
inhomogeneous, consisting of fine intergrowths « I J.'m) of ilmenite and hydrated
ilmenite or pseudorutile (Plate 6.7C). No relationship was noted between the extent
(amount of grain altered) and the degree of alteration (percentage Ti02).
The second stage of alteration is marked by the development of leucoxene, which forms
as irregular patches along grain boundaries, or structural weaknesses (Plate 6.7C and D). ------ ~
The development of leucoxene alon . n boundaries is less common than expected for
enite. Leucoxene often develops from hydrated ilmenite or
ay also replace · ilmenite. The boundaries between leucoxene and the
other ses may be diffuse, consisting of fine intergrowths of hydrated ilmenite (or
pseudorutile) and leucoxene (see Plates 6.7C and D). Such textures indicate that a
gradual, continuous alteration has occurred from hydrated ilmenite to leucoxene. In other
instances the boundaries between leucoxene, and the phases it is replacing are sharp and
embayed (Plate 6.7E). This indicates that the alteration to leucoxene may also be
discontinuous, which contrasts with the findings of Miicke and Chaudhuri (1991) who
argue that the alteration of ilmenite is a continuous process. In a number of grains the
boundaries between leucoxene and the phases it is replacing are truncated by the grain
surface, showing that the alteration occurred in a larger grain (Plate 6.7F), which has
subsequently been broken during reworking of the sediment.
The alteration of some grains has proceeded until the grain consists entirely of leucoxene.
Such grains become more TiOrrich with increasing alteration until they consist entirely
of crypto- or microcrystalline rutile or occasionally anatase.

Alteration of ilmenite 151
Table 6.6 Selected microprobe analyses of altered ilmenite grains (from Hugo and
Cornell, 1991).
Weight % Oxides
Grain No. Coexisting phases Ti02 FeO l Cr2O) Si02 Alp) MnO MgO Total
G15 ilmenite 51.72 46.21 0 .07 nd nd 0.63 1.07 99.70 hydrated ilmenite 54.17 41.84 0.08 nd 0.04 0.89 0.94 97.96
G12 ilmeoite 50.66 48.52 nd nd nd 0 .70 0.04 99 .92 pseudorutile 66.25 27.95 nd 1.29 0.77 1.14 nd 97.40
Gl ilmenite 50.48 47.41 0.09 nd 0.09 1.54 0.18 99.79 hydrated ilmenite 55.36 38.52 0.25 0.32 0.27 1.75 0.13 98.85 pseudorutile 68.82 25.4 0.43 0.57 0.70 2.14 0.18 98.24
G3 ilmenite 5l.22 45.59 0.07 0.07 0.10 0.24 2.28 99.57 pseudorutile 61.26 32.42 0.15 0.73 0.56 0.42 2.12 97.66 leucoxene 79.72 13.25 0.10 1.10 1.45 0.31 1.82 97.75
Gll ilmenite 49.52 44.56 0.05 nd Dd 5.59 nd 99.72 hydrated ilmenite 56.80 36.50 Dd 0.15 0.26 4.61 nd 98 .32 leucoxeoe 86.30 7.71 Dd 2.21 0.59 1.56 nd 98 .37
G37 hydrated ilmenite 57.12 38.42 0.04 0.14 0.08 nd nd 95.82 leucoxene 79.14 9.33 nd 5.51 2.21 nd 0.1I 96.32 leucoxene 77.83 16.38 nd 1.85 0.46 0.11 nd 96.55
G30 ilmenite 50.77 46.56 nd nd 0.06 0.93 1.33 99.66 leucoxene 83.98 11.3 nd 0.79 0.71 0.65 0.98 98.41
G18 ilmenite 52.18 45.49 0.05 0.06 nd 0.82 nd 98.67 Ti02 pseudomorph 97.90 1.52 nd nd Dd nd nd 99.48
G51 ilmeoite 52.81 45.02 od nd od 1.36 0.33 99.58 Ti02 pseudomorph 96.92 1.65 od 0.35 0.04 nd od 99.00
G25 leucoxeoe 77 .20 7.09 od 8.49 4.25 0.15 0.28 97.45
G32 leucoxeoe 86.09 7.86 nd 0.63 0.65 0.10 0.05 95.39
nd = not detected; l All iron is reported as FeO.

Plate 6.7 Back-scattered electron images of ilmenites from Zululand di~playing Type 1
alteration.
A. Patchy alteration of ilmenite (I) to hydrated ilmenite (H). The different shades of
grey of hydrated ilmenite in the figure reflect varying degrees of alteration.
Richards Bay (HZ 35). Scale bar 75p.m.
B. Development of hydrated ilmenite along basal parting of ilmenite. Port Dumford
(HZ 2). Scale bar 75p.m.
C. A hydrated ilmenite (H) gram altering to leucoxene (L), displaying the
inhomogeneous nature of the hydrated ilmenite, and the gradual alteration to
leucoxene in the top left hand corner of the grain. Richards Bay (HZ 17). Scale
bar 25p.m.
D. The gradual replacement of hydrated ilmenite (H) by leucoxene (L) from the grain
boundary ,and within partings and fractures. Note the zoning of the leucoxene in
the grain. Richards Bay (HZ 16). Scale bar 60p.m.
E. The replacement of hydrated ilmenite (H) by leucoxene (L). The sharp, embayed
boundary between the phases indicates clearly that the alteration of ilmenite to
leucoxene via pseudorutile is not always a continuous process (cf. Miicke and
Chaudhari, 1991). Note that the grain surface truncates the boundary between the
hydrated ilmenite and leucoxene indicating that it has been reworked after
alteration. Cape St Lucia (HZ 4). Scale bar 40p.m.
F. Rounded ilmenite (I) grain altering to leucoxene (L) via pseudorutile (P) from grain
surface. Again note that the grain has been fractured after alteration. Cape Vidal
(HZ 11). Scale bar 60p.m.

Plate 6.7 152

Alteration of ilmenite 153
This type of alteration may be explained by the two stage model of Grey and Reid (1975).
The fIrst stage of this model involves the oxidation of all the ferrous iron and the leaching
of one third of the ferric iron from the ilmenite lattice by electrochemical corrosion. The
reaction is:
.... (6.2)
Ilmenite Pseudorutile + dissolved iron
This reaction is considered to operate in a mildly acidic groundwater situation (Grey and
Reid, 1975; Dimanche and Bartholome, 1976).
In this model the second stage of alteration beyond pseudorutile occurs via a dissolution
reprecipitation process whereby both iron and titanium are dissolved, but the titanium is
redeposited while the iron is leached from the grain. This leads to the formation of rutile
in beach sands (Grey and Reid, 1975) and anatase in lateritic soils (Anand and Gilkes,
1984, 1985), described by the reaction:
F~Ti309 + 4H+ - 3Ti02 + 2Fe2+ + 1/20 2 + 2H20 .... (6.3)
Pseudorutile rutile (or anatase) + dissolved iron
The second stage of alteration is thought to occur in the near-surface regions of the deposit
(Grey and Reid, 1975; Frost et al. 1986) in an environment which is rich in organic and
inorganic acids derived from the upper soil layer and condensation, creating mildly
reducing and acidic solutions (Grey and Reid, 1975; Frost et al., 1983).
Although hydrated ilmenite and pseudorutile develop from ilmenite in the coastal
sediments', in accordance with [6.2], these phases appear to be readily replaced by
leucoxene in the deposits, and few grains consisting entirely of hydrated ilmenite or
pseudorutile are found. This suggests that pseudorutile is unstable in the deposits and
alters readily to leucoxene by the dissolution and reprecipitation process of [6.3]. Once
Alteration of ilmenite 154
leucoxene forms it may also replace ilmenite by direct leaching and reprecipitation as
described below. In this sense the mechanism differs from Grey and Reid' s (1975) model.
6.4.3 Type II alteration
In this type of alteration, ilmenite, or slightly altered ilmenite, is observed altering directly
to leucoxene. The alteration occurs from grain boundaries (Plate 6.8A) , or along
weaknesses, such as fractures (Plates 6.8B and 6.8C) within the grains. In some instances
leucoxene may grow as replacement fronts across grains (Plate 6.8C) or may mimic the
original crystallographic directions of ilmenite grains (Plate 6.8D). The boundary between
the ilmenite and leucoxene may consist of a porous area of cellular or microcrystalline
leucoxene, indicating that isovolumetric replacement has occurred. SEM analyses indicate
that the pores in these areas have silica and aluminum contents well in excess of 10 per
cent. Beyond this zone the leucoxene is usually less porous, as shown in Plate 6.8B,
however, significant quantities of Si02 and Al20 3 may still be present (Table 6.6).
This style of alteration is similar to that observed by Hartman (1959), Frost et al. (1983) ,
and Frost et al. (1986). Hartman (1959), studying iron-titanium oxides during
bauxitization, found that ilmenite may alter directly to leucoxene or optically identifiable
anatase. Frost et al. (1983) noted relatively unaltered ilmenite cores surrounded by
leucoxene in a concentrate from the Capel 150 ft strand line, and concluded that these
assemblages represent a single step dissolution-reprecipitation process without the
formation of pseudorutile. This style of alteration of ilmenite to leucoxene, rutile or
anatase may be expressed by the equation:
FeTi03 + 2 H+ - Ti02 + Fe2+ + H20 .... (6.4)
ilmenite rutile (or anatase) + dissolved hematite
For the most part the Capel 150 ft strand line lies above the water table and Frost et al.
(1983) suggest that [6.4] occurs in the near surface regions, or pedogenic zones, of the
deposit, where soil acids may directly leach the ilmenite.

Alteration of ilmenite 155
The growth of leucoxene from cracks within the grains (Plate 6.8B) illustrates how acidic
groundwater may follow these weaknesses to dissolve the ilmenite and leach the iron from
the grain, while the titanium is reprecipitated.
6.4.4 Type III alteration
A number of altered ilmenite grains are observed in the deposits, which consist of ilmenite
and porous networks of microcrystalline Ti02 pseudomorphs (see Table 6.5). Two distinct
intergrowths are noted. The first type of intergrowth is characterised by the replacement
of ilmenite by euhedral to subhedral acicular or prismatic Ti~ microcrystals (Plate 6.9A).
The alteration does not occur along grain boundaries, but rather as patches within grains.
Often the microcrystals form a porous trellis-type structure which is filled by siliceous
material high in aluminium. In many instances the Ti~ needles appear orientated (Plate
6.9A). Grains of this nature are interpreted as having formed by hydrothermal or
supergene alteration of ilmenite, as similar textures have been described by . Rumble
(1976), Ramdohr (1980), Haggerty (1976b), Whalen and Chappel (1988) and Miicke and
Chaudhuri (1991), for ilmenites which have undergone such alteration in source rocks.
The second type of intergrowth is characterised by the development of anhedral, often
vermiform rutile microcrystals in patches within the ilmenite grains (Plate 6.9B). The
microcrystals form porous, symplectite-like intergrowths with each other and the ilmenite
matrix. In a few instances microcrystals of hematite are found within the rutile
intergrowths (plate 6.9C). Grains containing such intergrowths are considered to have
formed by the high temperature breakdown of ilmenite in igneous or metamorphic source
rocks to form intergrowths of rutile and hematite as described by Haggerty (l976b) and
Haggerty (1991, cl Figure 20 f and g). Subsequent dissolution of hematite has resulted
in grains consisting of only ilmenite and microcrystalline rutile. This interpretation is
supported by the presence of hematite relicts found within the rutile microcrystals in some
grains (see Plate 6.9C). The voids formed by the dissolution are often subsequently filled
by siliceous material or clay.

Plate 6.8 Variations of Type II ilmenite alteration observed in Zululand <;oastal deposits.
A. Back-scatterect electron image of leucoxene (L) replacing ilmenite (I) from the ,.
surface of the grain. Despite the fairly advanced state of alteration of the grain,
the ilmenite relicts are unaltered. Sodwana Bay (HZ 13). Scale bar 40J-tm.
B. Back-scattered electron image of leucoxene (L) replacing ilmenite (I) from tp.e grain
surface and along fractures originating at this surface. Note the partial coating of
siliceous material (dark grey) around the grain. Such coatings are uncommon in
the dune deposits and indicate that the grain may have been reworked froin another
sediment. Cape St Lucia (HZ 4). Scale bar 80Jlm.
C. Magnified view of upper part of grain in B, displaying the replacement of ilmenite
by leucoxene' along a crack within the grain. Scale bar lOJ-tm.
D. Alteration of ilmenite (1) by leucoxene (L). Note the highly porous nature of the
leucoxene adjacent to the ilmenite and the truncation of the leucoxene-ilmenite
boundary at the grain surface. This latter feature may either be caused by
leucoxene advancing as a front across the grain, or by the mechanical weathering
of a larger grain altered in a previous environment. From Hugo (1988), Richards
Bay. Scale bar 40J-tm.
E. Photomicrograph of ilmenite (I) altering directly to leucoxene (L) revealing the
origimil crystal planes of the ilmenite. From Hugo (1988), Richards Bay.
Scale bar 50J-tm.

156
Plate 6.8
Plate 6.9 Back-scattered electron images displaying variations in type III alteration
observed in Zululand deposits.
A. The replacement of ilmenite (I) by acicular Ti02 (T) microcrystals. Richards Bay
(HZ 19). Scale bar 75p.m.
B. Patches of vermiform rutile (R) microcrystals forming porous, symplectite-like
intergrowths within an ilmenite (I) grain. Port Dumford (HZ 2). Scale bar 75p.m.
c. Magnified area of grain shown in B. displaying the symplectite-like intergrowths
ofrutile microcrystals and the presence of relict hematite microcrystals (h). Note
also the the siliceous material (dark grey) filling the spaces between the rutile
microcrystals. See text for explanation. Scale bar 20p.m.

157
Plate 6.9
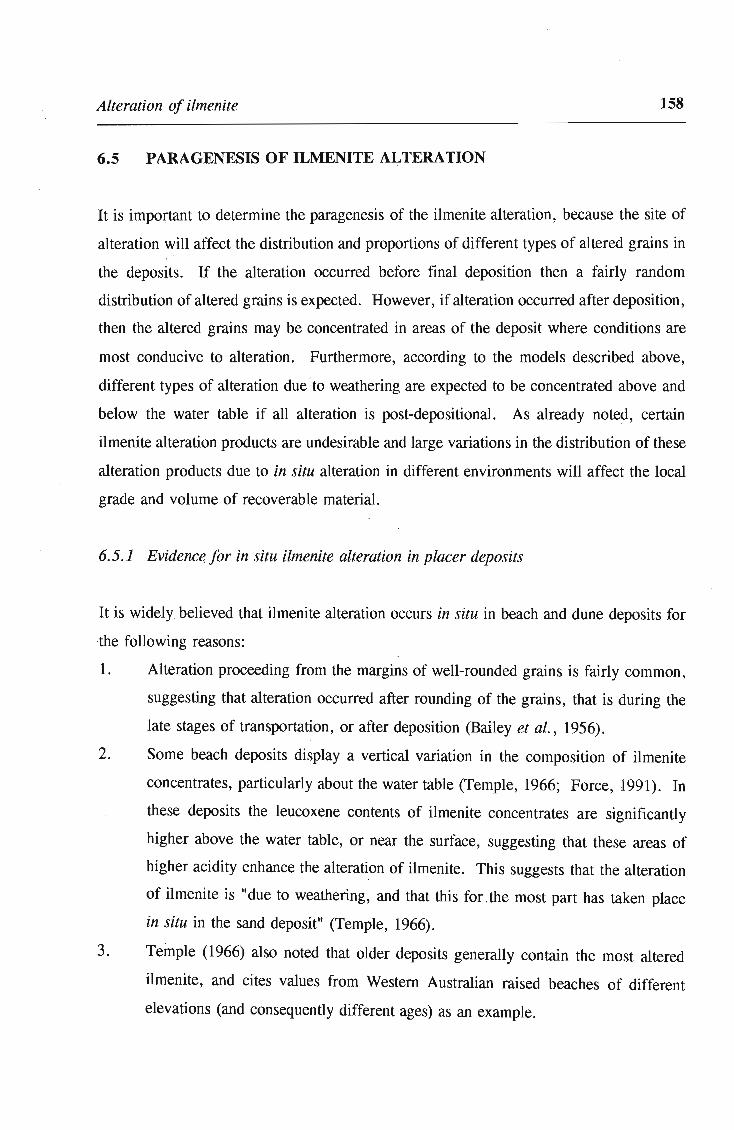
Alteration of ilmenite 158
6.5 PARA GENESIS OF ILMENITE ALTERATION
It is important to determine the paragenesis of the ilmenite alteration, because the site of
alteration will affect the distribution and proportions of different types of altered grains in
the deposits. If the alteration occurred before final deposition then a fairly random
distribution of altered grains is expected. However, if alteration occurred after deposition,
then the altered grains may be concentrated in areas of the deposit where conditions are
most conducive to alteration. Furthermore, according to the models described above,
different types of alteration due to weathering are expected to be concentrated above and
below the water table if all alteration is post-depositional. As already noted, certain
ilmenite alteration products are undesirable and large variations in the distribution of these
alteration products due to in situ alteration in different environments will affect the local
grade and volume of recoverable material.
6.5.1 Evidence, for in situ ilmenite alteration in placer deposits
It is widely believed that ilmenite alteration occurs in situ in beach and dune deposits for
the following reasons:
1. Alteration proceeding from the margins of well-rounded grains is fairly common,
suggesting that alteration occurred after rounding of the grains, that is during the
late stages of transportation, or after deposition (Bailey et al., 1956).
2. Some beach deposits display a vertical variation in the composition of ilmenite
concentrates, particularly about the water table (Temple, 1966; Force, 1991). In
these deposits the leucoxene contents of ilmenite concentrates are significantly
higher above the water table, or near the surface, suggesting that these areas of
higher acidity enhance the alteration of ilmenite. This suggests that the alteration
of ilmenite is "due to weathering, and that this for.the most part has taken place
in situ in the sand deposit" (Temple, 1966).
3. Temple (1966) also noted that older deposits generally contain the most altered
ilmenite, and cites values from Western Australian raised beaches of different
elevations (and consequently different ages) as an example.

Alteration of ilmenite 159
4. La Roche et al. (1962) noted that the alteration displayed by ilmenite in littoral
zones is not observed in the source rocks and is rarely found in alluvial ilmenite
grams.
6.5.2 Evidence for multistage alteration of ilmenite
The following observations indicate that alteration of ilmenite in the coastal sediments
cannot completely be described by a simple model in which ilmenite grains are eroded,
transported, deposited in the dunes, and then altered:
1. Most ilmenite grains are unaltered, or only slightly altered, yet the entire alteration
spectrum from ilmenite to leucoxene is found. Further, the amount of alteration
end-product leucoxene, which may constitute as much as 15 per cent of the ilmenite
alteration assemblage (see Table 6.5, page 149), is high relative to the 60-80 per
cent of unaltered ilmenite. This implies that either the ilmenite altered at strikingly
different rates, or that some of the ilmenite was altered prior to deposition in the
dunes.
2. Two types of ilmenite weathering are observed in all the samples studied,
regardless of whether they came from above or below the water table (see Table
6.5, page 149). Comparison with existing models indicates that type I alteration
develops in a groundwater environment, whereas the type II alteration occurs above
the water table in mildly reducing and acidic soils.
3. Ilmenite grains altered by oxidation or hydrothermal processes in the source rocks
are observed in the deposits.
4. In some grains the boundaries between ilmenite and phases formed by alteration
may be truncated by grain surfaces, which indicates that these grains have been
reworked.
5. Ilmeno-hematite or hemo-ilmenite grains present in a single sample may alter in
two ways: i) ilmenite alters to hydrated ilmenite or leucoxene while the hematite
remains unaltered (Plate 6. lOA); ii) ilmenite undergoes alteration and hematite is
partially or completely removed from the grain, resulting in pitted grains of altered
ilmenite (Plate 6.lOB). Dimanche and Bartholome (1976) used thermodynamic
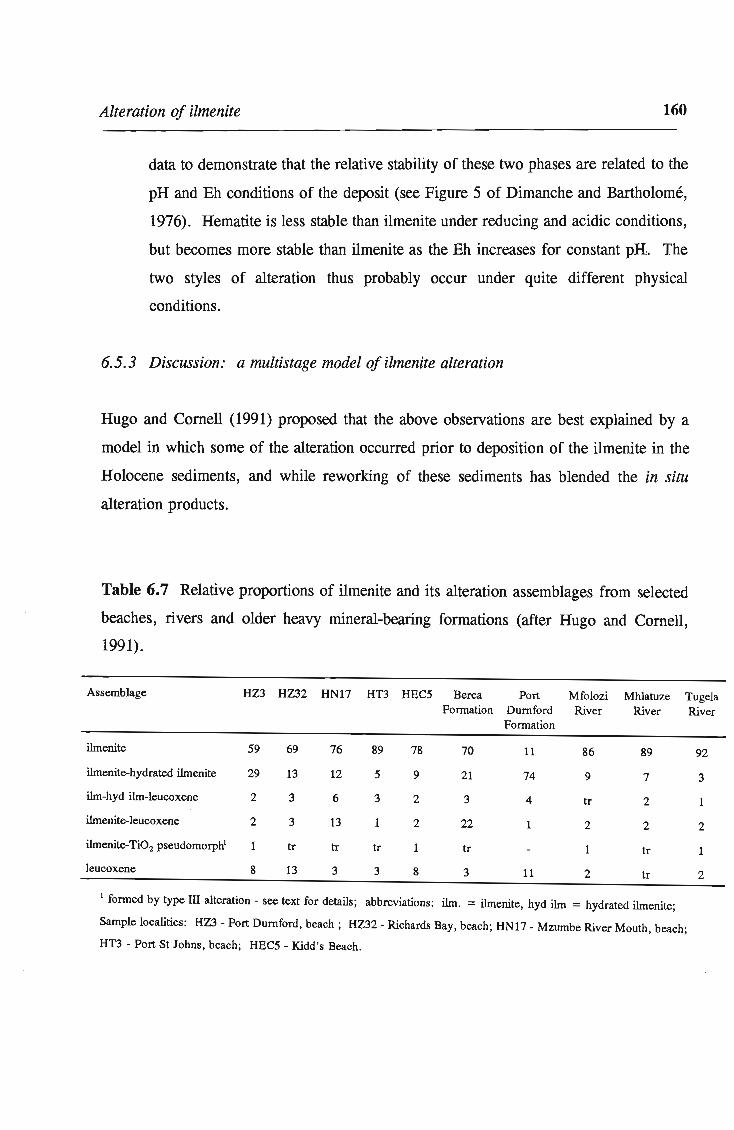
Alteration of ilmenite 160
data to demonstrate that the relative stability of these two phases are related to the
pH and Eh conditions of the deposit (see Figure 5 of Dimanche and Bartholome,
1976). Hematite is less stable than ilmenite under reducing and acidic conditions,
but becomes more stable than ilmenite as the Eh increases for constant pH. The
two styles of alteration thus probably occur under quite different physical
conditions.
6.5.3 Discussion: a multistage model ofilmenite alteration
Hugo and Cornell (1991) proposed that the above observations are best explained by a
model in which some of the alteration occurred prior to deposition of the ilmenite in the
Holocene sediments, and while reworking of these sediments has blended the in situ
alteration products.
Table 6.7 Relative proportions of ilmenite and its alteration assemblages from selected
beaches, rivers and older heavy mineral-bearing formations (after Hugo and Cornell,
1991).
Assemblage HZ3 HZ32 RN17 RT3 REC5 Berea Port Mfolozi Mhlatuze TugeJa Formation Dumford River River River
Formation
ilmenite 59 69 76 89 78 70 11 86 89
ilmenite-hydrated ilmenite 29 13 12 5 9 21 74 9 7
ilm-hyd ilm-leucoxene 2 3 6 3 2 3 4 tr 2
ilmenite-leucoxene 2 3 13 1 2 22 1 2 2
ilmenite-Ti02 pseudomorphl 1 tr tr tr 1 tr 1 tr
leucoxene 8 13 3 3 8 3 11 2 tr
1 formed by type III alteration - see text for details; abbreviations: ilm. = ilmenite, hyd ilm = hydrated ilmenite;
Sample localities: HZ3 - Port Dumford, beach; RZ32 - Richards Bay, beach; HN17 - Mzumbe River Mouth, beach;
HT3 - Port St Johns, beach; REC5 - Kidd's Beach.
92
3
1
2
1
2

161
Plate 6.10 Variations in the alteration of ilmeno-hematite or hemo-ilmenite grains.
A. Ilmenite ex solution lamellae in the grain have altered to hydrated ilmenite (H) and
leucoxene (L) while the hematite (h) remains unaltered. Back-scattered electron image.
Richards Bay (HZ 36). Scale bar 50 J.tm.
B. Secondary electron image of the surface of a hemo-ilmenite grain displaying lenticular
voids formed by the leaching of ex solved hematite from the grain. Richards Bay (HZ 36). Scale bar 20jlm.

Alteration of ilmenite 162
There is clear evidence that some ilmenite has been altered in source areas supplying
material to the coastal sediments. Grains containing ilmenite and microcrystalline rutile
(type III alteration) indicate that in some instances the alteration of ilmenite began in the
igneous or metamorphic source rocks by oxidation and hydrothermal alteration. As
mentioned, the sandstones of the Natal Group and the Vryheid Formation are significant
intermediate sources of heavy minerals. Behr (1986) has described the alteration of
ilmenites in the Vryheid sandstones (see Table 7.1, page 173). Pervasive alteration of
ilmenite is found in the sediments of the Port Durnford Formation which underlies the
Holocene dunes in many places (Table 6.7).
Ferruginous soils and lateritic soils have developed in the provenance areas of the dune
deposits since the Late Pleistocene. As shown by Anand and Gilkes (1984) these soils are
conducive to the pedogenic alteration of ilmenite. Fitzpatrick (1978), in his study of soil
types along the eastern seaboard of South Africa, noted that ilmenite commonly altered to
pseudorutile, anatase or rutile in the freely drained soils in the Mistbelt and Highland
Montane regions. Differences in the duration, and other burial conditions, would enhance
the variation of the degree of alteration of individual grains eroded from this environment,
as suggested by Austin (1960). Furthermore, small quantities of partially altered ilmenite
and leucoxene grains are observed in river sediments from Natal and Zululand (Table 6.7).
It is noted in Chapter 8 that there is little difference between the proportions of ilmenite
alteration products in beach and dune sediments in the study area (see enclosed map). As
the dunes are generally derived from the beach sands (Tinley, 1985; Iohnson, 1986), this
indicates that the ilmenites were altered prior to deposition in the aeolian environment.
From the above evidence it is concluded that small, but significant quantities of already
altered ilmenite grains were deposited in the coastal sediments. Iohnson (1986) suggested
that the dunes were derived from beach placer deposits, which were exposed during the
last glacial maxima. If the beach sands resided under similar conditions to those found
in other parts of the world (that is, below the water table, in mildly reducing and acidic
conditions), then it is likely that unaltered ilmenite began altering according to [6.2].

Alteration of ilmenite 163
Reworking of the beaches to form the dune deposits, which occur above the water table
(see Figure 3.3, page 47) would have changed the dominant mechanism of alteration so
that further alteration proceeded via the development of leucoxene according to reactions
[6.3] and [6.4]. This accounts for the instability of pseudorutile in the dunes and its
replacement by leucoxene. Reworking of the Late Pleistocene - Holocene dunes, as
indicated by the remnants of the older dune systems, would result in the homogenization
of the ilmenite alteration products. Transportation and subsequent reworking of the grains
also caused abrasion and fracturing of the altered ilmenite grains. It might explain the
truncation by grain surfaces of leucoxene boundaries with ilmenite or pseudorutile.
6.6 THE EFFECT OF ALTERATION ON ILMENITE QUALITY
It has been shown (Temple, 1966; Wort and Jones, 1980 and 1981; Frost et al., 1986)
that the magnetic susceptibility of ilmenite decreases with increasing alteration. Hugo
(1988) estimated the magnetic behaviour of ilmenite and altered ilmenite in the Richards
Bay deposits by determining their mass proportions in different magnetic fractions from
a heavy mineral concentrate. These results are reproduced schematically in Figure 6.8,
and show the following:
1. Altered ilmenite grains are slightly less magnetic than unaltered ilmenite grains, but
most of these grains will behave as ilmenite during magnetic separation.
2. Highly altered ilmenite grains (cf. type I and type 11 alteration) or Ti02
pseudomorphs (cf. type III alteration) have a large range of magnetic susceptibility
and may report to ilmenite concentrates or magnetic middlings fractions.
3. Leucoxene grains also have a large range of magnetic suseptibility extending from
that of ilmenite to that of non-magnetic rutile, and most leucoxene will report to
magnetic middlings or rutile concentrate. .
It is clear from the results of Hugo (1988) that the degree and type of alteration will affect
the recoverability of altered ilmenite grains.

Alteration of ilmenite 164
60 9 r - ILMENITE a m 50 ILM-PSEUDORUTlLE S
ILM-LEUCOXENE
P 40 LEUCOXENE e r RUTlLE
k 30 9
0 f 20
s a m 10 p I /
e 0 ... ....... --. ---- - - - ~ ----
0.2 0.4 0.6 0.8 1.0 1.2 1.4 1.6 1.8 2.0 2.2 2.4 Ampere Setting
Figure 6.8 Schematic plot of mass proportions (in grams per kg of sample) of ilmenite
and altered ilmenite grains in different magnetic fractions of a heavy mineral concentrate,
Richards Bay (After Hugo, 1988). The ilmenite mass has been divided by five. (From
Hugo and Comell, 1991).

Alteration of ilmenite 165
Frost et al. (1983) and Frost et al. (1986) have shown that there is a marked increase in
the Si02 and Al20 3 contents of ilmenite alteration phases containing more than 60 percent
Ti02 in Western Australian deposits. The increase in these impurities has been ascribed
to their co-precipitation with, or adsorption on to, alteration products (Frost et al., 1983),
or to the formation of clay minerals within pore spaces between alteration phases (Anand
and Gilkes, 1985). Microprobe analysis of altered ilmenite grains from the Zululand
deposits show the same Si02 and Al20 3 enrichment trends described by Frost et al. (1983),
but with levels as high as 10 percent (Figures 6.9A and 9B) in contrast to the maxima of
1 and 3 percent respectively, reported by Frost et al. (1983). These results indicate that
altered ilmenite grains containing leucoxene will contribute to the silica and aluminium
impurity levels in ilmenite concentrates. Of greater importance is the large contribution
made by leucoxene grains to the levels of these elements in rutile concentrates. In
addition, leucoxene may contain up to 20 percent iron (Figure 6.9C) which is another
undesirable element in rutile concentrates. It is therefore evident that altered ilmenite
grains containing leucoxene, and leucoxene grains themselves, are undesirable as they are
either non-recoverable or they contribute to impurity levels in concentrates.
Most of the ilmenite found in the Holocene dune deposits along the Zululand coastline is
unaltered or only slightly altered. However, the deposits contain a varied and
petrographically complex suite of altered ilmenite grains. These have formed as a result
of three different types of ilmenite alteration mechanisms which occur in distinctly
different physical environments, yet all samples studied contain grains reflecting all three
alteration mechanisms. This, together with other petrographic and mineralogical evidence,
indicates clearly that some ilmenite alteration occurred prior to deposition in the Holocene
dunes and that reworking of the dunes has blended the alteration products. This has
important implications for the mining and recovery of ilmenite from these dunes as it
indicates that the distribution of altered ilmenite grains should be fairly constant throughout
the dunes and should therefore not affect the quality and grade consistency of the material
mined.

10~----------------------------------'
9
8
7
6
5
4
3
2
o ...
...... ...
...... ...
50 55 60 65 70 75 80 85
wt% Ti02 90 95
10~----------------------------------.
9
8
7
6
5
4
3
2
... ...
95
5O~----------------------------------,
o 30 Q) u. "* 25 ~ 20
15
10
5
O~~~~~~---c--~--r-~--~---r--~ ~ 50 55 60 65 ro ~ 80 85 90 ~
wt % Ti02
166
Figure 6.9 Variations in Si02, Al20 3 and FeO contents with degree of alteration
(expressed as Ti02 percent) in altered ilmenite grains. A. Si02 weight percent B. Al20 3
weight percent. C. FeO weight percent. (From Hugo and Cornell , 1991).

167
CHAPTER SEVEN
PROVENANCE OF THE IRON-TITANIUM OXIDES
7.1 INTRODUCTION
Provenance is of primary importance to the interpretation of iron-titanium variations in
coastal sediments because it determines the initial distribution of heavy minerals along the
coastline. Furthermore, provenance may have subtle influences on the mineralogy of
heavy mineral deposits, such as the chemical composition of economic minerals or the
textural re~ationships of composite grains, as described in Chapter 5. This influences the
mineral concentrates produced and the mineral processing techniques used.
Hammerbeck (1976) noted that no consensus had been reached about the provenance of
the heavy minerals along the eastern coast of South Africa. Fockema (1986) suggested
that most of the ilmenite was derived from the basalt and dolerite of the Karoo Igneous
Province, while rutile and zircon originate from the basement rocks of the Natal
Metamorphic Province. The Kaapvaal Craton forms part of the basement in the north of
the provenance area and these Archean rocks are also a source of the iron-titanium oxides.
The aim of this chapter is to determine if ilmenite and magnetite from these major
provenance areas can be distinguished using their chemical and petrographic criteria.
7.2 Fe-Ti OXIDES AS PROVENANCE INDICATORS - PREVIOUS WORK
The potential of the iron-titanium oxides in provenance studies lies in variations in mineral
chemistry and petrographic textures related to source rock paragenesis, as described in
Chapter 5. Many iron-titanium oxides occur as intergrown grains in sediments and 't
according to Basu and Mofinaroli (1989), these features are considered equal to evidence , from rock fragments as fingerprints of their source rocks. In addition, the minerals are
relatively durable, easily concentrated, suitable for microscopic examination and are found
Provenance of the iron-titanium oxides 168
in most sands (Pettijohn et al., 1987). As a result, these oxides have been used in a
number of provenance studies in recent years.
Ilmenite was first used as a provenance indicator by Darby (1984), who determined the
provenance of different sediments in Virginia and Carolina, U.S.A. from the trace element
content of the ilmenite. Ilmenite was used as an indicator mineral as it was the most
abundant heavy mineral in the sediments, was easy to separate from other minerals and
contained a variety of trace elements depending on the paragenesis of the ilmenite.
Furthermore, chemical analysis of only one heavy mineral species eliminated factors such
as hydraulic sorting and selective weathering, which are inherent problems in provenance
interpretation based on heavy mineral suites (Darby and Tsang, 1987).
Darby (1984), and Darby and Tsang (1987) used atomic absorption spectroscopy to
determine the Ti, Fe, Mn, Mg, V, Zn, Cr, Cu and Ni contents of ilmenite concentrates
from rivers and estuaries to show that ilmenite could be used as a provenance indicator.
Although the method provided useful results, its fundamental weakness is that the
concentrates are never pure and some of the trace element variation is caused by impurities
of other minerals rather than source rock differences. This is particularly so when the
concentrates contain large proportions of minerals intergrown with ilmenite.
Basu and Molinaroli (1989, 1991), in a more integrated approach, studied the provenance
characteristics of iron-titanium oxides using both the petrographic and chemical variations
of ilmenite and magnetite. In their petrographic analysis, they grouped all the major oxide
minerals together as "detrital Fe-Ti oxides" (or "DOPQ") and claimed that the most
diagnostic features are the presence of exsolution lamellae, minimum lamellae widths and
"the number of crystallographic orientation (sic) of the lamellae". The chemical
composition of the oxides was determined by electron microprobe analysis for Ti02,
. A120 3, Cr203, Fe (as FeO), MnO, and MgO. Discriminant function analysis, on combined
petrographic and chemical data, was used to distinguish oxides from different source
rocks.

Provenance of the iron-titanium oxides 169
There are several problems with the method of Basu and Molinaroli (1989). Firstly, they
did not distinguish between the different types of iron-titanium oxides, or the intergrowths
formed between these minerals. Their rationale was that "almost all intergrowthtextures
of Fe-Ti oxide minerals (FTM) , be they true ex solution or oxidation "exsolution", are
products of sub-solidus reactions". This is not strictly true, as certain intergrowths, such
as sandwich lamellae of ilmenite in titaniferous magnetites, may have formed by co
precipitation of ilmenite and titanomagnetite (Haggerty, 1976a; Reynolds, 1983). Of
greater importance is their interpretation that hematite lamellae within magnetite grains are
formed by ex solution (see Basu and Molinaroli, 1989; Figure 3A). This is incorrect as
such lamellae are formed by oxidation (martitisation). Furthermore, this oxidation often
occurs in the sedimentary environment and may affect magnetite from any rock. It is
therefore not characteristic of the source rock.
Another problem with the method of Basu and Molinaroli (1989) is that they used the
number of directions of lamellae as a provenance criteria. This is a function of the
mineral's crystal structure and not its source. Lamellae in magnetite are usually orientated
along the (111) planes, resulting in three intersecting directions of lamellae in section,
whereas lamellae in the ilmenite-hematite series are orientated along the (0001) or basal
plane and so only one direction of lamellae is observed in section. The reason for Basu
and Molinaroli (1989) using this as a criteria for source rocks, instead of variations in
ilmenite, hematite and magnetite intergrowths, is unclear.
Recently Grigsby (1989, 1990) studied the use of detrital ma~netite as a provenance
indicator, using both the petrographic and chemical variations of this mineral. He was
able to distinguish magnetites from a wide range of rock-types by integrating the
petrographic and chemical data.
The provenance of rutile has been studied by Force (1980), who determined that nearly
all rutiles found in coastal sediments are derived from metamorphic rocks. The mineral
is most commonly found in pelitic rocks and metabasites (Frost, 1991a). Rutile, in
equilibrium with magnetite, is the stable titanium mineral in low grade rocks. The mineral

Provenance of the iron-titanium oxides 170
is found over the whole range of metamorphic temperatures (Frost, 1991a) and is common
in a wide variety of granulite and ec10gite facies rocks (Force, 1991).
Deer et al. (1962) noted that rutile may be widely distributed as minute grains in a variety
of igneous rocks. The occurrence of large crystals is restricted to granite pegmatites and
quartz veins (Elsdon, 1975). The occurrence of discrete rutile grains in basic igneous
rocks is not noted in any major texts on the subject (Haggerty, 1976a; Reynolds, 1978b;
Elsdon, 1975), and such grains were not found in samples of these rocks in this study.
It is therefore assumed that the rutile in coastal sediments of the study area is derived
solely from either the Kaapvaal Craton or the Natal Metamorphic Province.
7.3 METHOD OF STUDY
In this study both the chemical and petrographic characteristics of ilmenite and magnetite
are used to study the provenance of the iron-titanium oxides. An inherent weakness in
using petrographic features as provenance indicators is that the iron-titanium oxides have
different durabilities in the sedimentary environment. Ilmenite is generally more stable
than magnetite (Dryden and Dryden, 1946; Pettijohn, 1957; Darby, 1984), which, in
turn, is more durable than intergrown oxide grains. Riezebos (1979) and Molinaroli and
Basu (1987) found that intergrown grains of ilmenite-hematite survived weathering and
transport in rivers better than martite and magnetite-ilmenite grains. This indicates that
the proportions of iron-titanium oxides and their intergrowths in coastal sediments will be
different from their proportions in source rocks. This difference is expected to increase
with age and reworking of the sediment. This has been shown by Arran et al. (1992) who
found that ilmeno-magnetite grains suffer mechanical breakdown during fluvial transport,
resulting in an enrichment of homogeneous grains in river sediments compared to source
rocks.
Considering the above, it is best not to group the iron-titanium oxides together (cj.
Molinaroli and Basu, 1987), and in this work separate discussions of the ilmenite and
Provenance of the iron-titanium oxides 171
magnetite provenances are given. As these minerals are considered to be common to both
the major source areas, the consistency of results can be used as a test of their reliability.
Electron microprobe analysis was used to determine the chemical compositions of ilmenite
and magnetite. The analyses are rapid and many grains may be analysed, allowing for the
creation of a large data base. Approximately 1 p'm sized spots in single grains are
analysed, so there are no uncertainties related to mineral impurities, or mixing of minerals
from different sources, which are problems in methods using bulk analysis. Variations of
mineral compositions within individual rock-types and the chemistry of intergrowths within
composite grains may also be determined. A disadvantage of the method is that trace
elements such as Cu, Zn, and Ni, are difficult to analyse as their concentrations are close
to the detection limit of the instrument, while in the case of vandanium there is a large
overlap between the VKa and TiKB lines. However, the studies of Basu and Molinaroli
(1989) and Grigsby (1990) have shown that there is enough variation amongst the other
elements to distinguish iron-oxide minerals from different source rocks.
The method used to study the provenance of the iron-titanium oxides is outlined as
follows:
1. The probable major primary source rocks of the oxides were identified and
classified. It was assumed that the iron-titanium oxides are largely derived from
source rocks exposed in the present catchment areas. Considering the geological
history of the region, as described in Chapter 2, this is a valid assumption.
2. Samples of probable major source rocks were collected along with samples from
streams which exclusively drain these rocks. In some cases samples were obtained
from colleagues in the Department of Geology and Applied Geology, University
of Natal.
3. Polished thin-sections of the rock samples were used to determine the petrography
and chemistry of the oxides. Concentrates were made from the fluvial samples by
heavy liquid separation (see Chapter 4) and polished thin-sections were made from
these concentrates.

Provenance of the iron-titanium oxides 172
4. Discrimination diagrams were used to determine differences in the chemical
composition and petrographic features of ilmenite and magnetite from different
source rocks. Data from the literature, particularly from Reynolds (1983 and
1986d) were used to compliment the data base generated from this study.
5. Ilmenite and magnetite grains from coastal sediments were then used to test the
discrimination diagrams and to determine which source rocks are the major
contributors of these minerals.
7.4 SOURCE ROCKS OF IRON-TITANIUM OXIDES IN THE STUDY AREA
The Natal Metamorphic Province and the Karoo Igneous Province (Map 1) are considered
to be the two major primary sources of the heavy minerals in the study area
(Hammerbeck, 1976; Fockema, 1986; Hugo, 1990). The granite-greenstone terrane of
the Kaapvaal Craton crops out within the east coast catchment area and these rocks could
also contribute to the iron-titanium oxides in coastal sediments. The Kaapvaal Craton and
the Natal Metamorphic Province are grpuped together under the term "Natal Basement
rocks" because of the similarity of their lithology. Ilmenite and magnetite are common
accessory minerals in a wide range of rocks within these provinces. It is therefore
important to identify the major source rocks and group these according to their geological
association and the similarity of their ilmenite and magnetite mineralogy. The three
provinces mentioned above are described in the following section and the major source
rocks of iron-titanium oxides within these provinces are identified.
The sandstones of the Vryheid Formation in the Karoo Sequence and the quartzite of the
Natal Group are known to contain concentrations of heavy minerals (Hammerbeck, 1976;
Behr, 1986). These rocks are considered to be intermediate sources of the heavy minerals
in the coastal sediments (Fockema, 1986; Hugo and Cornell, 1991), but are not
considered as important provenances of pristine ilmenite and magnetite as it is known that
the minerals have undergone alteration in these rocks (Behr, 1986). This is shown by the
modal proportions of the heavy mineral suites in some samples of these rocks (Table 7. 1).

Provenance of the iron-titanium oxides 173
Table 7.1 Modal proportions of heavy mineral suites from the Natal Group and Vryheid
Formation sandstones.
Natal Group Sandstones Vryheid Formation Sandstones Minerals
Marian- Botha's Monte- Botha- Botha- Delmas l Carolina I hill Hill seel ville villel
altered ilmenite 3 8 15 55 59.7 56.5 25.1
leucoxene 5 5 2 12 11.4 6.5 22.0
anatase/rutile 11 7 4 4 1.4 tr 2.1
zircon 2 4 1 5 6.8 0.1 1.3
garnet 1 1 1.7 0.1 16.4
monazite 1 1.0 tr
hematite 2 64 70 12 11.4 13 .8 17.8
other minerals 6 12 8 10 6.6 23 .2 15.4
1 Average analyses from Behr (1986). tr = trace amounts present; - = not detected
7.4.1 Natal Basement Rocks
7.4.1.1 Kaapvaal Craton
The oldest possible source rocks (circa 3000 Ma; Linstrom, 1987) are the granite
gneisses, metabasites and small metamorphosed ultramafic intrusions of the Kaapvaal
Craton (see Figure 7.1). The granitoids form the bulk of this Archean basement crop out
in the valleys of the Tugela and Buffalo Rivers.
Little information about the iron-titanium oxides is available, but it is assumed that the
rocks noted above are sources of iron-titanium oxides as similar rocks, found elsewhere,
contain these minerals. Magnetite has been noted in metamorphosed ultramafic intrusions;
granoblastites from the Lubana Formation (Empangeni Metamorphic Suite); banded iron
formations of the Mozaan Group; and the Post-Pongola Sequence, syenite intrusions.
Titaniferous magnetite (Mt-Ilmoe) is found in the ultrabasic intrusions of Usushwana
Complex (Reynolds, 1986a) and Hlagothi Suite (Groenewald, 1984). Chromite is also a
common minor mineral in these ultrabasic rocks (Groenewald, 1984).

(
174
LEGEND
UNIT DESCRIPTION
Younger, cover rocks
I'.,~II Intrusive granite ,-" I'
~ 1=== Mozaan Group Shale, iron formation, quartzite
(::)i.~ Nsuze group Quartzite with minor other rock types , ,. \ ~ ", Granite and granite gneiss ....... '< ...
~ Basic lava altered to schists, quartzite,
~ cherts , iron formations
Figure 7.1 Simplified geological Map of the Kaapvaal Craton rocks found within the
catchment area of the study area. Map drafted from 1: 1000000 geological map' of South
Africa (South African Geological Survey, 1970) .

Provenance of the iron-titanium oxides 175
7.4.1.2 Natal Metamorphic Province
The Proterozoic Natal Metamorphic Province is composed of low to high-grade
supracrustal gneisses and granitoids. The rocks are almost continuously exposed as
erosional inliers for about 300 km and cover an area of some 10000 km2 (Thomas et al.,
1990). These exposures are subparallel to the coast and crop out from northern Transkei
to Empangeni in the north (Figure 7.2). The metamorphic grade increases from
green schist in the north to granulite fades in the south.
The province has historically been subdivided into two major terranes, but this has recently
been increased to three terranes by Thomas (1989), based on lithological, structural and
tectonic features (Table 7.2). The major rock types in the Natal Metamorphic Province
are amphibolites, supracrustal schists and gneisses, and pre- to post-tectonic granitoids.
Table 7.2 Subdivision of the Natal Metamorphic Province, after Thomas (1989) and
Thomas et al. (1990).
Terrane
Tugela
Group
Ntingwe Group
Mfongosi Group
Tugela Group
Description
Greenschist facies shallow-water shelf sediments
Greenschist facies metabasite and metashale
Mainly amphibolite with minor felsic schist
Intrusive rocks Mafic/ultramafic complexes, and minor granite -----------------------------------------~---------------------------------------------------
Mzumbe Mapumulo Group Upper amphibolite grade pelitic to quartz-feldspar gneiss and migmatite
Intrusive rocks Pre-to syntectonic I and S-type granitoid gneiss, rare metabasite. Late to post-tectonic rapakivi granite-charnockite plutons, and K-rich granite plutons
---------------------------------------------------------------------------------------------Margate Mzimkulu Group
Intrusive rocks (Oribi Gorge Granitoid Suite)
Granulite-grade supracrustal gneiss, marble, calcsilicate
Pre- and syntectonic granitoid gneiss and charnockite, rare metabasite. Late to posttectonic rapakivi granite-charnockite plutons.

MAPUMULO rH~UST
PIETERMARITZBURG o
MELLVILLE
ZONE
.<:;, ~\
\
o Phanerozoic cover rocks
NATAL PROVINCE
r-::-:-:1 t..:...:..d
Late- to post-tectonic Rapakivl granite - chamockite
-~ Tugela Terrane
r1i§1 Mzumbe Terrane
~ ~
Margate Terrane
Transkel terra ne 7
KAAPVAAL PROVINCE
E3 Granite-greenstone terrane
Major thrust zones
\
176
Figure 7.2 The outcrop pattern and major tectnostratigraphic subdivisions of the Natal
Metamorphic Province (from Thomas, 1989).

Provenance of the iron-titanium oxides 177
Very little information is found in the literature about the iron-titanium oxides in the Natal
Metamorphic Province. Most researchers have not done reflected-light microscopy and
group all the opaque minerals together, often under the incorrect term "ore minerals".
This makes it difficult to identify possible source rocks of ilmenite and magnetite from this
province. Scarce modal analyses, giving proportions of opaque phases, such as those by
Scogings (1989) and Du Toit (1979), indicate that all the major rock types contain opaque
minerals as accessory phases. This is in accordance with Frost (1991a) who noted that
magnetite and ilmenite are the most common iron-titanium oxides in metamorphic rocks
and that these minerals can coexist over the range of oxygen fugacities commonly found
in metamorphic rocks. Ilmenite is most common in metapelite and metabasite rocks, but
is absent in the lowest grade rocks, where rutile or titanite are the stable TiOrbearing
phases (Frost, 1991a). Magnetite is found in a wide variety of metamorphic rock types,
including metaperidotite, metabasite, iron-formations, quartzo-feldspathic gneiss and some
metapelites (Frost, 1991a). The following classification was therefore selected for the
study:
1. Mafic metamorphic rocks, which consist mainly of mafic schist and gneiss, but
include metabasite.
2. Felsic metamorphic rocks, mainly granitoids, but including felsic schist and gneiss,
and magnetite-bearing quartzite.
3. Rocks from metamorphosed ultrabasic/basic complexes.
7.4.1.3 Mafic Metamorphic rocks
Mafic schist and gneiss are most common in the central Mzumbe Terrane, where they
occur as amphibolite-grade, biotite-gamet and biotite-homblende gneisses of the
supracrustal Mapumulo Group. Metabasite is most commonly found in the Tugela Group
of the Tugela Terrane and part of the Mfongosi Group.
Ilmenite and magnetite in these rocks occur as small, homogeneous crystals (usually less
than 100 j.tm), normally occupying less than 1 per cent of the rock. Intergrowth textures
between ilmenite and magnetite are seldom observed. Du Toit (1979) noted that the

Provenance of the iron-titanium oxides 178
ilmenite grains are commonly rimmed by titanite in amphibolites which display evidence
of retrogression. The oxides are commonly subhedral to anhedral, and are associated with
ferromagnesian minerals such as biotite and pyroxene. Magnetite grains commonly have
polygonal cross-sections. Often the oxides in these rocks are exclusively either ilmenite
or magnetite, depending on the Ti02 content and./02 of the rock.
7.4.1.4 Felsic Metamorphic Rocks
Pre-tectonic granitoid-gneisses and late to post-tectonic granitoids are found as partly
exposed, ellipsoidal batholiths in the Mzumbe and Margate Terranes. The litho
stratigraphy of the granitoids is outlined by Thomas (1989). Felsic schists and gneisses
are common in the Mapumulo Group of the Mzumbe Terrane), but may be found through
out the Natal Metamorphic Province. Quartzite and quartzitic gneiss are also found within
the Mapumulo Group and may be associated with amphibolite in the Tugela Terrane.
Both S- and I-type granite are found in the Natal Metamorphic Province, and so the
granitoids may contain ilmellite or magnetite (Thomas, 1989). These minerals usually ~- --~ .--- - -- -- - ----- --- - ---- .
occur as anhedral grains associated with mafic minerals such as biotite and amphibole.
The ~!~.!l~~~ ~ .. ~~z~fromJ~_s !!It!ll_~Q!t~_l!!.!~2ve!JQ!tg_m. The content of the oxides
in granitoids may be as hi-Bh as 10 ~£..cent (Scogings, 1989), but is usually only 1 to 3
per cent. The mC!gE-et!-te .gl.ains are usually hO"-!~~~....illld have polygonal cross
sections. Intergrowths between magnetite and ilmenite are uncommon but composite or
granular textures are observed. Ilmenite grains are commonly homogenous, but in some
granites may contain extensive hematite exsoluti9Jl (see Plate 5.3A, page 96). Hematite
grains containing ex solved ilmenite (see Plate 5.3B), or oxyexsolution of rutile (see Plates
5.3D and 5. 3E) are less common. High temperature oxidation of ilmenite to assemblages
of Illllss+Hemox+Rutox or Hemss+Rutox±Psbox (see Plates 5.4 and 5.5, pages 97 and 98)
are almost exclusively found in the granitoids. Homogeneous magnetite is the dominant
iron-titanium oxide in quartzite and quartzitic gneiss.

Provenance of the iron-titanium oxides 179
7. 4.1. 5 Ultrabasic and basic complexes
Several metamorphosed ultrabasic and basic complexes are found within the Tugela
Terrane. Although not geologically extensive, these complexes locally contain high
concentrations and are important sources of iron-titanium oxides. In addition, the rocks ...... --~------ -- -------_._-----_ .• -are an imJ>.Qrt@t source. ~f_~hr2mite, which d~!eases the <Lllality of ilmenite concentrates,
.- -----as discussed in Chapter 8. The complexes consist of basic and ultrabasic rock types,
ranging from gabbro to pyroxenite and serpentinite (Linstrom, 1987). The two _~arg~
intrusions are the Mambula and the Tugela Rand ComQlex.es. -----_._-- -_ .. -
Titaniferous magnetite and chromite....are..found in the rocks of the Sithilo, Sebenzani,
Mambula and Tugela Rand Complexes (Thomas, et al., 1990). At least six vanadiferous
titaniferous magnetite layers, containing V -Ti-magnetite, granular ilmenite, and pleonaste,
are found in the Mambula Complex. These layers range in thickness from one to five
metres (Reynolds, 1986d).
Reynolds (1979, 1984, and 1986d) has studied the petrography of the V-Ti-bearing ores
of the Mambula Complex. The titaniferous magnetite is characterised by a wide variety
of ilmenite and pleonaste intergrowths, formed by sub-solidus reactions during
amphibolite-grade metamorphism (Reynolds, 1986d). Coarse pleonaste ex solution lamellae
in the magnetites are abundant and orientated parallel to (100), whereas the ilmenite
lamellae are less common and orientated parallel to (111). Very fine ilmenite granules,
formed by the oxidation of ulvospinel, are also found in some of the magnetites (Reynolds,
1986d). These textures are similar to those shown in Plate 5.9 (page 113).
Chromite is common in the complexes and low-alumina chromite has been mined from
podiform chromitite bodies in the Sithilo Complex (Wuth and Archer, 1986).
Provenance of the iron-titanium oxides 180
7. 4. 2 Karoo Igneous Province
The Karoo Igneous Province is an extensive suite of extrusive and intrusive rocks which
are found over a wide area of the southern African subcontinent. Current outcrops cover
an area of 140 000 km2 (Figure 7.3), although Cox (1970) estimated that the lava, and
associated dolerite, originally covered an area of 2 000 000 km2 in southern Africa. The
suite consists of ~(Ilt ~d-=:~~1iJ:'_ with minor rJl~~~, formed as a result of
the fragmenting of Gondwanaland (Eales et al. , 1984). Igneous activity began in the late
Triassic and continued into the early Cretaceous (Eales et al., 1984), although the majority
of the igneous rocks date from the early Jurassic (192 - 171 Ma). The relevant rock-types
of this province, together with their iron-titanium mineralogy, are described below.
7.4.2.1 The Stormberg basalts
Basaltic lavas are found in the highlands of Lesotho and the north-eastern Cape. In the
Natal Drakensberg these tholeiitic lavas reach thickness of 1400 m. In addition to the
Drakensberg lava, basaltic rocks of the Sabie River Basalt Formation are found in
Zululand and Swaziland. These rocks are associated with the Lebombo Monocline, and
are estimated to range from 3000 to 9000 m in thickness, although this is difficult to
determine as the basalts are deeply weathered and poorly exposed (Eales et al., 1984).
Iron-titanium oxides are ubiquitous accessory minerals in the basalt, and have previously -------.---~- ,- - -~- .... . .~_'w ..•. . _ ~. ___ +_. ___ ,~~ ___ .~ ___ _
been studied by Turner (1990), Arran et al. (1992), and Ramluckan (1992). They occur I
as small « 15~tl:'.~), l~t~-~_~ge.t!-~Q!!l.~g!!~.t!~_~d occasionally as high-Cr spinel. Most
of the titanomagnetite has undergone oxyexsolution to form Mt -Ilffioe grains displaying
trellis, and sandwich-type textures (Turner 1990). Primary ilmenite crystals are
uncommon but acicular laths are found (Ramluckan, 1992). The Mt-Ilffioe grains have
commonly undergone deuteric and hydrothermal alteration reSUlting in the replacement of
magnetite by titanite and chlorite as described by Reynolds (1986c), Turner (1990) and
Richards et al. (1991).

~ 'Tl e; riQ. 0 c:: 0 ""l
rt> -(TO :-J ::l (P W 0 c:
Cl':! Cl'> ...... ""1 3 0 (") ~ :;0:;-Cl'> ::ti
,.-" (P
:::t' 0-0 (TO
3 (P 0 g: 0"
(TO (1) o· Cl'>
~ ~
...... ..... ~ ~
:-- .§ ...... 0 \D ...., 00 ~ Cl'> '-" 0 c ......
::r (1) ""1 ::l
> ::t' o· ~
Cl'> ::r 0 ~ S·
(TO
...... ::r (1)
e: Cl'> ...... ::1. 0" c ...... ...... 0 ::l
0 ....,
,-I
.;,., -' ~L
,-;i-'
,.,::J.
" _ + A N G)
J~~_'Jd A +
B,
, ,
D es e r
'-,
'" <b
./ f
, \
'>
1" + 1; ;"-. '_" . - -----"-,,-,.-------- ----,
+
+
+
D Posl-Karoo Cover
G Intru si ve complelles
BB Karoo and later lavas
k,·,.<1 Karoo sediments
~1iJ Ca pe Fold Bell
[\:./.\1 Other pre - Ka roo rOCkS
.- . - . Inter nationa l boundary
KM 500
~ 00 ~

Provenance of the iron-titanium oxides 182
7.4.2.2 Dolerite intrusions
The Karoo dolerites have been well described by Walker and Poldervaart (1949) . They
consist of d~kes, sills and bell~jar .. intrusions which a~!~ ~s feeder channels to the .
overlying basalt (Bales et al., 1984). The intrusions are abundant in the sedimentary strata --~-----.~----
of the Karoo Sequence and extend almost to the outcrop limits of the main Karoo basin
(see Figure 7.3). In the central part of the basin the dolerite-sediment ratio may be higher
than 0.5 (Winter and Venter, 1970). Few dolerite intrusions are noted in the basement ----'-~~---------
rocks of the Natal Metamorphic Province. The chemical composition of the intrusions is ~","-,-",",.-.. - . .., .. -----"""~------..
similar to that of the tholeiitic lavas (Bales and Marsh, 1979) although anomalous types
do exist (Le Roex and Reid, 1978).
Basic dykes are also found associated with the Lebombo Monocline. These dykes are best
developed in the Rooi Rand dyke swarm, which has previously been described by Du Toit
(1929), Bristow (1976), Armstrong (1978), Saggerson et al. (1983) and Armstrong et al.
(1984). The swarm crops out for 200 km along the western flank of the Lebombo
volcanic belt and consists almost entirely of sub alkaline to tholeiitic dykes.
The iron-titanium oxides in Karoo d01erite have been described by Reynolds (1978b and
1983), Turner (1990) and Arran et al. (1992). These rocks contain between 0.5 and 4 per , '
cent ilmenite and titanomagnetite, which form as late-stage phases (Reynolds, 1983). --; .. _--------_.,---..... -~","","-.. ... ~ -. ---.,-------......... _---....,..._ .. -.....--. ll.!!lenite is the dominant opaque phase and is found as isolated crystals (generally> 100 --. - .. .. - .- .... _~<=JO __ .'-',.""..::I=.,..,...,.~...,.,..... ........ _ . ....,_~_ ."... _·.~v-. , __ ............. _ •.
JLm) o~ 1am~1}.ar _~d gran~,L~ _ b.29!es ~ ~it~il!. t!taniferous magnetite grains. Titaniferous
magnetite crystallises after ilmenite and usually forms anhedral, composite grains with
subhedral ilmenite. These grains commonly contain trellis and sandwich lamellae of
ilmenite, formed by oxyexsolution. Turner (1990) and Arran et al. (1992) noted that the
sandwich and composite-type intergrowths are far more common than trellis lamellae in
dolerites, while the latter is more common in Stormberg basalt.

Provenance of the iron-titanium oxides 183
Armstrong et al. (1984) noted that opaques phases constitute between 5 and 15 per cent
of the Rooi Rand dykes. Titaniferous magnetite is the dominant oxide phase, although
homogeneous ilmenite grains are present.
7.4.2.J Gabbro and picrite
Intrusive sills in the Central Karoo Province may attain thicknesses of several hundred
metres and are often internally differentiated by gravity settling or by flow concentration
of phenocrysts (Bales et al. 1984). Differentiation in the Mount Ayliff intrusions, near
Kokstad has resulted in a thick base of ultramafic and mafic cumulates, containing some
sulphide mineralisation (Maske, 1966).
Ilmenite in the Mount Ayliff intrusions has been extensively studied by Cawthorn and
Groves (1985), Groves et al. (1986), and Cawthorn et al. (1988) in an attempt to
determine the origin of the magnesium-rich rocks found within the differentiated
intrusions. Ilmenite in these rocks occurs as discrete, elongated grains, ranging in size
from 0.1 to 1 mm in length (Groves et al. , 1986). The ilmenite grains are commonly
embayed by silicates and sulphides. Cawthorn et al. (1988) estimated that ilmenite makes
up about 1 per cent of the rock.
The petrography of spinel phases in gabbros, picrites and silicic differentiates of the
Central Karoo Province has been studied by Bales et al. (1980). These authors noted that
true chromites and magnetites are unknown in the tholeiitic rocks of the Central Karoo
Province. The spinels constitute less than 2 per cent of the rocks, and range in size from
0.1 mm to 2 mm in size. Chromian-magnetite grains are euhedral to anhedral, depending
on how early they crystallised from the magma. These grains often show zonation in the
chill margins of intrusions where quenching has prevented homogenization (Bales et al.,
1980). The titaniferous magnetites display a variety of habits depending on the paragenesis
of the host rock, but generally the grains are intergrown with ilmenite, forming trellis or
sandwich lamellae.

Provenance of the iron-titanium oxides 184
7.4.2.4 Rhyolite and other igneous rocks
Rhyolites are exposed for more than 600 km along the Lebombo Monociine, from the
Msunduzi River to just south of the Limpopo River in the north and reach a maximum
thickness of 5000 m (Cleverly et al., 1984). The rhyolites overlie Karoo basalt and mark
the end of the main phase of Karoo volcanism.
Cleverly et al. (1984) found titaniferous magnetite to be a ubiquitous phenocryst phase,
in addition to being present in the groundmass of the rhyolite. The grains tend to be
anhedral, and vary in size from less than 0.1 to rare 2 mm large crystals. In contrast,
ilmenite was only identified in one sample. These rocks are therefore an unlikely source
of ilmenite.
Iron-titanium oxides have been identified in other rock-types, such as picritic basalts and
nephelinites of the Karoo Igneous Province (Cawthorn et al., 1989), but they occur well
outside the catchment area of the study area.
7.5 ILMENITE COMPOSITION AS A PROVENANCE INDICATOR
7.5.1 Method
Ilmenite grains from selected rock types, described in Section 7.4, were analysed by
electron microprobe, as outlined in Table 4.1 (page 63). Analyses of ilmenite in
appropriate source rocks from the literature were also added to the data set. All analyses
were recalculated by the method of Stormer (1983) to estimate the F~03 and FeO in
ilmenite. The full list of analyses used is given in Appendix C.l . Source rocks were
grouped together according to their geological association and the similarity of their
ilmenite compositions (Table 7.3). The oxides were plotted against each other to
determine which oxides best distinguished ilmenites from different source rocks.

Provenance of the iron-titanium oxides 185
Table 7.3 Classification of source rocks for provenance study using ilmenite composition.
Major Division Rock Group
Karoo Igneous Province Gabbro
Picrite
Dolerite
Basalt
Granophyre
Description
Gabbro in basic differentiates, taken to represent all basic plutonic rocks from this province
Picrite in basic differentiates, taken to represent all ultrabasic plutonic rocks from this province
Dolerites dykes and sills within Karoo sediments, and the Rooi Rand dyke swarm
Basalt from the Natal Drakensberg
Granophyre from magmatic differentiates, taken to represent all felsic plutonic rocks in this province
----------------------------------------------------------------------------------------Natal Basement Granitoid
(+ Felsics)
Mafic metamorphic
Basic/ultrabasic Complex
Granitoid-gneiss, granite, and chamockite; quartz-feldspar gneiss
pelitic and semi-pelitic schist, mafic gneiss and metabasite
metamorphosed basic and ultrabasic rocks in intrusive complexes
7.5.2 Ilmenite compositions in source rocks
The compositions of ilmenites from the source rock groups (Table 7.3) are plotted in
Figure 7.4, and described below.
Gabbro:
Analyses of ilmenite from gabbros were obtained from Cawthorn and Groves (1985) and
Cawthorn et al. (1988). These represent ilmenites from basic plutonic rocks of the Karoo
Igneous Province. Ilmenite compositions are variable, but are characterised by Mg
substitution for Fe2+ in the ilmenite-geikielite solid-solution series (Figure 7.4E). This
results in moderately high MgO and Ti02 contents, intermediate between the picrite and
dolerite/basalt fields. The gabbroic ilmenites may also have relatively high Cr20
3 levels,
ranging between 0.1 and 0.5 per cent (Figure 7.41) .
Provenance of the iron-titanium oxides 186
Picrite:
Analyses of ilmenite from picrites from the Mount Ayliff intrusions were obtained from
Cawthorn et al. (1988). These rocks were included in the list of source rocks because
they may be an important source of ilmenite along the Transkei-southern Natal coastline.
Furthermore, they characterise ilmenite from high-MgO basic rocks. The ilmenite
compositions are characterised by high Ti02 , MgO, and Cr20 3 values, but low FeO
contents, compared to other rocks from the Karoo Igneous Province (Figure 7.4). The
high MgO content is a function of the high MgO content of the ultrabasic magma
(Haggerty, 1976b). The strong negative correlation between MgO and FeO content
(Figure 7.4E) reflects the substitution of MgTi03 for FeTi03 in the picrite ilmenites. The
higher mole per cent of MgTi03 in the ilmenite accounts for the higher per cent Ti02 , as
the atomiC weight of Mg (24.305) is considerably less than Fe (55.847) .
Dolerite and Basalt:
The dolerite and basalt are characterised by ilmenite with compositions close to the FeTi03
end-member. Consequently the ilmenite has high FeOcontents, .and low MgO and MnO
levels (Figure 7.4E and 7.4G). There is a strong positive correlation between Ti02 and
FeO (Figure 7.4A), and a corresponding negative F~03-FeO correlation, which reflects
the dominant ilmenite-hematite solid-solution series in these ilmenites. There is a large
overlap between ilmenite from dolerite and basalt. This is expected, given the close
geological association of these rock types.
Granophyre:
A small number of ilmenite analyses in granophyre, from Groves et al. (1986), are
included. These analyses are considered to represent ilmenite compositions in felsic,
plutonic rocks from the Karoo Igneous Province. llmenite from the granophyres is
distinguished from other Karoo igneous rocks by their higher MnO contents, which may
reach 7.5 per cent (Figure 7.4G). This represents the substitution of MnTi03
for FeTi03
,
which is common in felsic rocks and increases with the MnO content of the magma, and
decreasing temperature of crystallisation (Neumann, 1974).

Provenance of the iron-titanium oxides 187
Granitoid and felsic metamorphic rocks:
Like the granophyres, ilmenites from these rocks are characterised by ilmenite-pyrophanite
substitution, resulting in moderate to high MnOlevels (Figure 7.4H).
Metabasite and other mafic metamorphic rocks:
Ilmenites from these rocks are similar and are characterised by compositions close to pure
FeTi03. Hematite and pyrophanite substitution may increase the MnO and Fez03 contents
slightly. The "pure" composition of the ilmenite is caused by re-equilibration with
surrounding silicates during metamorphism. Cassidy and Groves (1988) noted that the
MnO content of ilmenites in metabasite and metapelite decreases markedly with increasing
metamorphic grade. The MnO content is also dependent on the proportion of garnet in
the rocks, as MnO is strongly partitioned into garnet. (Tracy, 1982).
Ultrabasic and .basic complexes:
Analyses of ilmenite from the Mambula Complex are obtained from Reynolds (l986d).
These represent ilmenite compositions from metamorphosed basic-ultrabasic complexes
(MUBC). These ilmenites have compositions similar to the picrite and gabbro of the
Karoo Igneous Province and are the only 'metamorphic ilmenites enriched in MgO. These
ilmenites are prevented from re-equilibration with silicates during metamorphism because
they occur in cumulate oxide layers and this preserves their high MgO contents.

7.4A
KAROO IGNEOUS ROCKS 188 60
+ GABBRO o PICRITE T DOLERITE
58 I- '" BASALT 0 x GRANOPHYRE
0 0
0 e CD 66- c []J c c - Cbe C 0 CD 0
.5 c c.B 64 I- COD
~ CO Q • .Si 0 0 <>
I:il 0 + ..
C\I 0 0 x x +~ .. 0 52 r 0 0 0() ",+T $f
+T -; i= xx l#\: ~ ';I. 0 {- AA
50 - • .. +-1-X .. j ....
41 x x + .. T
~'" T T.,+ -1-+
+ .. -It .. 48 I- .. ..
46 I J 1
30 35 40 45 60 % FeO In IImenlte
7.48
56 BASEMENT ROCKS '" GRANITOID & FELSIC o AMPHIBOLlTE IB MAFIC METAMORPHIC • MUBe
54 - • v
'" '" IB~IB
Cl) , fi! III - M ~.y I\Il C • • v Cl) • VJIB
~ 52 l- • • o ~ v • '" '" v
• v. "' ''' "w'ij • . '" 0
.5 '" • "'~ 00 v • v'"
C\I ",<17 fI '" 0
0 50 -v ,<+w (:
j:: '" V "Ill fl v '"
'11 IB v o 0
~ v 0
'" 0
48 I-
'"
46 .L I I I
30 35 40 45 50 % FeO In IImenlte
Figure 7.4 Variation diagrams showing the differences in chemical compositions of
ilmenite from different source rocks from the Karoo Igneous Province. A. Ti02 versus
FeO for Karoo Igneous Rocks . B. Ti02 versus FeO for Natal Basement Rocks.
Note: MUBC = metamorphosed ultrabasic/basic complexes
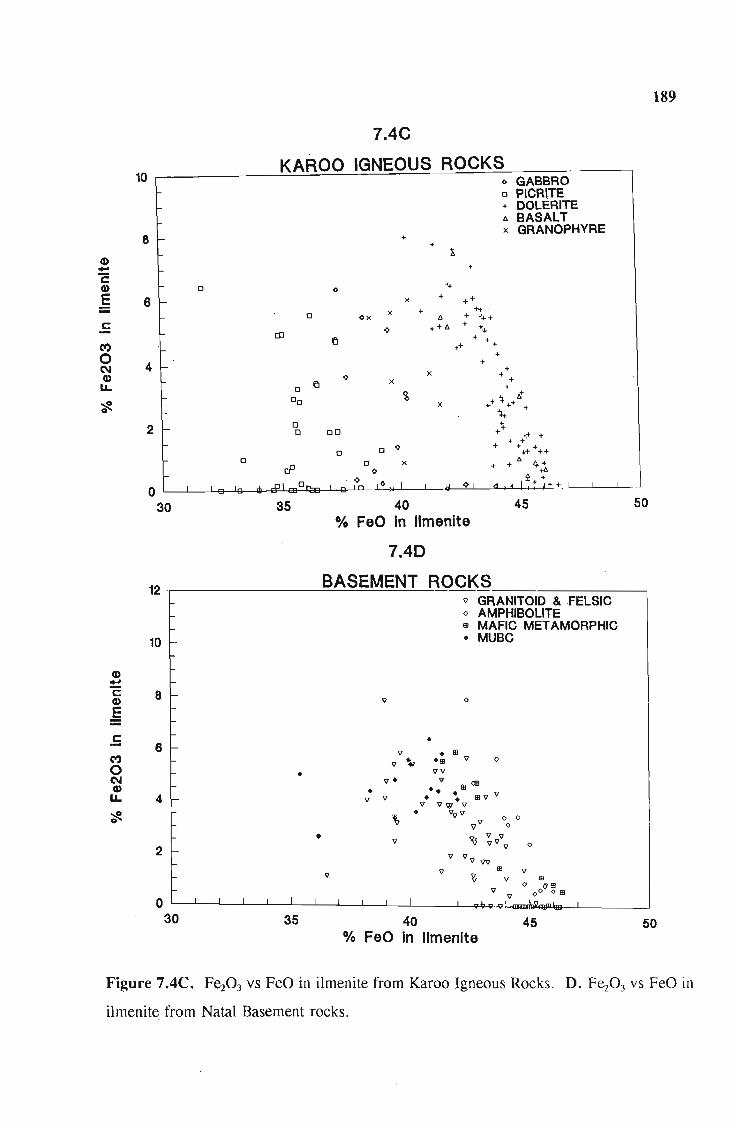
189
7.4C
10 KAROO IGNEOUS ROCKS
() GABBRO o PICRITE + DOLERITE 6. BASALT x GRANOPHYRE
8 f- + +
1. Cl)
+ -'E J+ Cl) 0 ()
~ 6 l-x + ++
x + ++ 0 Ox 6. + J++
.E ++ 6. + -1:+ 0 III
{l + + + Cl) t+
0 +
4 + N l- x + Cl) () +
eJ x + LL 0 +
t!! 00 <& ~ ,t
x ++ ++ ~ +
2 0 ... l- D 00 ++
,+ + + + +
0 + ... ++++ 0 0 0 0 x '" 4+ rP + +
0 +6 I-
,0 .... I I ~+ + + + ..pI 0 () 0 ... 0
30 35 40 45 50 % FeO In IImenlte
7.40
12 BASEMENT ROCKS '" GRANITOID &FELSIC <> AMPHIBOllTE ID MAFIC METAMORPHIC
10 l- • MUBC
Cl) .... 'E 8 f-Cl) '" <>
.§
.E • 6 f-'" • IB
Cl) '" ~ ·IB '" <>
0 • "'''' N ",. '" 1B<l!l Cl) • •• • IB '" '" LL 4 I- '" '" • • '" "'VI '"
~ \ • "''1'" <> 0 0 '1 '" 0
• '" "i7 '" '" 2 '1'" '" 0
f-'" "' ", w
'" III
'" '" ~ '" ID <> O' IB
'" 0 0 0 m 0 1 1 I 1 I .,'" ,-
30 35 40 45 50 % FeO In IImenlte
Figure 7.4C. Fe.z03 vs FeO in ilmenite from Karoo Igneous Rocks. D. FezOJ vs FeO in
ilmenite from Natal Basement rocks.

7.4E 190
12 KAROO IGNEOUS ROCKS 0:- GABBRO o PICRITE + DOLERITE
0 11 BASALT 10 x GRANOPHYRE 0
Q) 0 o Cb - 8 ~ "E Q)
0 00
E Do CbCbDo
Cl]
c:: 6 0 0 0 0
0 0:-
0 0 o~8 0 0)
<> ::E <> 4 <> ~ ~ 0
0:- '!i> <> <>
2 1111 <>
+ 11 +
0 +
30 35 40 45 50 % FeO In IImenlte
7.4F
12 BASEMENT ROCKS '1 GRANITOID & FELSIC o AMPHIBOLlTE III MAFIC METAMORPHIC
10 f- • MUBC
Q) - 8 t-"E Q)
~ • c:: 6 f- • 0 0)
::E 4 • • t-
~ • 0 , .. •
2 t- . ~ .. • 0
0 1 1 I 1 " I" .. I. IB o~o 0..m
30 35 40 45 50 % FeO in IImenlte
Figure 7.4E. MgO vs FeO in ilmenite from Karoo Igneous Rocks. F. MgO vs FeO in
ilmenite from Natal Basement rocks.
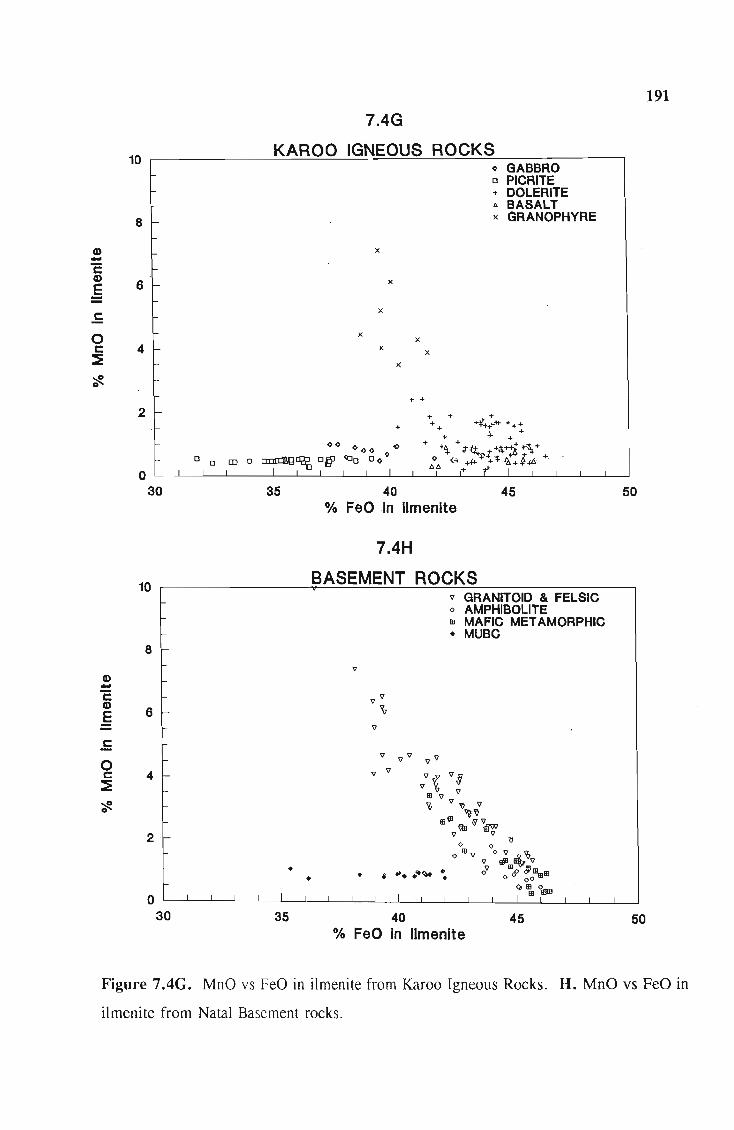
Q) -"E Q)
.§
o c:
::E
Q) -"E Q)
E
.E o c: ::E
7.4G
10~ ________ ~K~A~R~O~O~IG~N~E~O~U~S~R~O~C~K~S~ ________ _ Q GABBRO
a f-
6 f-
2 f-
10
f
a f-
6 f-
4 f-
21-
o 0 CD 0
35
• •
x
x
x
x
x
x
+
40
x x
+ +
o PICRITE + DOLERITE A BASALT x GRANOPHYRE
45 % FeOln IImenlte
7.4H
BASEMENT ROCKS
"
"v '\>
v
•
v GRANITOID & FELSIC <> AMPHIBOLlTE m MAFIC METAMORPHIC • MUBe
40 45 % F eO in IImenite
50
50
191
Figure 7.4G. MnO vs FeO in ilmenite from Karoo Igneous Rocks. H. MnO vs FeO in
ilmenite from Natal Basement rocks .

Q) -"E Q)
E
.5 C')
o "I ... o
7.41
KAROO IGNEOUS ROCKS 1.5 ,.-----------.!..:~~~~~~~:-:..=--=--:..=..=-:...:...<>=-::G:-:A:-:B:-;:;B:;;R::::O=------l
o PICRITE .. DOLERITE " BASALT x GRANOPHYRE 1.25 t-
o
1 -0
0
0 0 0 0
.75 r-0
0
0 0 0 +
0 0 IJJ 0 0 0 x
0 0 0
0 0 0
0 [I)
0
+ + 0 ..
<> +
.5 t-
0
0 0<> <> + 0 + .25 t-
x x + +
<><> <> I I ~ I I i.
35 40 45 50 % F eO In IImenite
7.4J
BASEMENT ROCKS 1.5 ~---------='::"":":::"=:"':"':'=::':"":'-=--":""'::"':=--':::~=----------,
1.25
1
.75
.5
.25
• •
0 30 35
%
• 'V 'V 'V 'V
'V GRANITOID & FELSIC Q AMPHIBOLlTE III MAFIC METAMORPHIC • MUBC
• .". ...... * <>
~ <> <>
40 45 FeO In IImenite
50
192
Figure 7.41. Cr20 3 vs FeO in ilmenite from Karoo Igneous Rocks . J. Cr20 3 vs FeO in
ilmenite from Natal Basement rocks.

Provenance of the iron-titanium oxides 193
7.5.3 Distinguishing ilmenite from different source rocks
From Figures 7.4A-J it is evident that there is a large overlap between ilmenites from:
1. dolerite and basalt (Karoo Igneous Province) and metabasite and mafic
metamorphic rocks (Natal Basement);
2. granophyre (Karoo Igneous Province) and granitoid and other felsic rocks (Natal
Basement);
3. basic and ultrabasic plutonic rocks (Natal Igneous Province) and metamorphosed
basic-ultrabasic complexes (Natal Basement).
This suggests that ilmenite chemistry cannot be used to distinguish ilmenite from the two
major provenances. However, granophyre (and other felsic rocks) are a minor component
of the Karoo Igneous Province, whereas the granitoids and felsic metamorphic are major
constituents of the Natal Basement rocks. It is therefore probable that ilmenite containing
high MnO contents is from the latter rock types.
Although the ilmenite from basic and ultrabasic rocks is similar in composition, these may
be distinguished by geographical locality. The metamorphosed igneous complexes are
found in northern Natal and Zululand, while the large basic intrusions of the Karoo
Igneous Province occur in southern Natal, Transkei and the eastern Cape.
These observations indicate that chemical composition may be used to distinguish ilmenite
from certain rock types. Figure 7.5 plots the compositions of ilmenite from both the
Karoo Igneous Province and the Natal Basement together. Certain rock types, containing
similar ilmenite compositions are grouped together as follows:
1. Ultra/basic plutonic: picrites, gabbros and metamorphosed ultra/basic complexes;
2.
3.
Dolerite and basalt: dolerites and basalts from the Karoo Igneous Province;
Granitoid and felsics: granitoids and other felsic rocks from the Natal Basement· , 4. Mafic Metamorphic: metabasite and other mafic rocks from the Natal Basement.

Cl)
7.5A
SOURCE ROCKS 60 ~----------------~~~~~~~~o~U~L~T~R~A~/~BA~S~IC~P~L~U=TO~N~IC~--
0 DOLERITE & BASALT + GRANITOID & FELSIC c. GRANOPHYRE x MAFIC METAMORPHIC
194
-C 55 Cl)
E
.E C\I o t-~ o
Cl) -c Cl)
E
C
C\I 0 t-
';f!
50
45 0
60
55
50
45 30
2
0 .,. 0
0
o x o 00
0.,D
4 6 8 10 12 % Fe203 In IImenite
7.58
SOURCE ROCKS o UL TRA/BASIC PLUTONIC o DOLERITE & BASALT + GRANITOID & FELSIC c. GRANOPHYRE x MAFIC METAMORPHIC
.,. 0 0 00 0 0
0 0 <> 0 0
00«> <>0 $
<Jo <> <> o ++ +x~X'<x
'" :ill 0 0 0 >::~ x 0:> 0 0 o + * C'" '8
<> 0
'~ . . ~'" 0+ <> <> o 8 +<0+ ::: +):t* ~
+ + <> ti +M ID + -+t- A +
o + -\:>tio.x 0 o to. + + x 'I<"'li ~RJ 0 c. + to...,. X +0>0 0
+ o ou:x 00 + 0 o 61 o ·
0 0 +
35 40 45 50 % FeO in IImenite
Figure 7.5 Variation diagrams of ilmenite compositions from different source rocks.
Fields of composition which are occupied almost exclusively by ilmenites from one rock
group are marked on the diagrams. A. Ti02 versus F~03 ' B. Ti02 versus FeO.

Cl) -"2 Cl)
E
Cl) -c Cl)
E
c:
o c:
::iE
7.5C
SOURCE ROCKS 12 --~~~~~~~~~~~~~~~O~U~L~T-R-A-/~B~A~S~IC~P~LU~T~O~N~I~C~~
10
8
6
4
2
35
10
8
6
4
2
o
0
<00
0
"'" 0
o
0
0 00
0
o
0
o 00
o
40
o DOLERITE & BASALT + GRANITOID & FELSIC 6 GRANOPHYRE X MAFIC METAMORPHIC
00
o
45 % FeD in IImenite
7.50
SOURCE ROCKS
+ + "'+ [>,
+
o UL TRA/BASIC PLUTONIC o DOLERITE & BASALT + GRANITOID & FELSIC 6 GRANOPHYRE x MAFIC METAMORPHIC
50
o L-~~~L-~-L~~1--L~~L-~-L __ C-~-L~~~-L~ __
30 35 40 45 50 % FeD In IImenite
195
Figure 7.5 Variation diagrams of ilmenite compositions from different source rocks. C.
MgO versus FeO. D. MnO vs FeO.

Provenance of the iron-titanium oxides 196
Fields delineating ilmenite from these different rock groups are shown in Figure 7.5, and
indicate that:
1. ilmenite from the ultra/basic plutonic group is most distinct, having high Ti02 , low
FeO, and high Cr20 3 (see Figure 7.41 and 7.4J);
2. ilmenite from felsic rocks may be distinguished by their high MnO contents;
3. ilmenite from basic igneous rocks (basalts and dolerites) cannot be distinguished
from mafic metamorphic rocks, however as a gro~p, all these rocks may be
distinguished from other rocks types, as they have high FeO and low MnO contents
(Figure 7.5D).
4. MgO and MnO content are the best discriminators of ilmenite source rocks, as the
ilmenite compositions tend to fall either along the pyrophanite or geikielite solid
solution series (Figures 7.5C and 7.5D).
Figure 7.6 is a plot of MnO against MgO on a log scale, for ilmenites from the major
provenance rock types. Fields for the different source rocks are drawn in and indicate that
this diagram is the best discrimination diagram for ilmenite from the different source
groups.
7.5.4 Provenance of ilmenite in coastal" sediments
The MnO versus MgO contents of all ilmenite analysed in coastal sediments (see Appendix
B. 2) are plotted in Figure 7.7. The fields demarcated in Figure 7.6 are also shown in
these diagrams, indicating the source rocks from which the ilmenite is derived. Each
diagram is of ilmenite from one of the major geographical regions along the coast. The
samples used range from Port Elizabeth in the south to Sodwana Bay in the north, and the
analyses therefore represent ilmenite from the entire study area.
Of the 829 analyses used in Figure 7.7, more than 65 per cent of the ilmenite appear to
be derived from basic igneous (dolerite and basalt) or mafic metamorphic rocks. Less than
10 per cent of the ilmenite can be identified as being derived from granitoid, or other
felsic rocks, and less than 5 per cent of the ilmenite falls in the basic/ultrabasic field. The
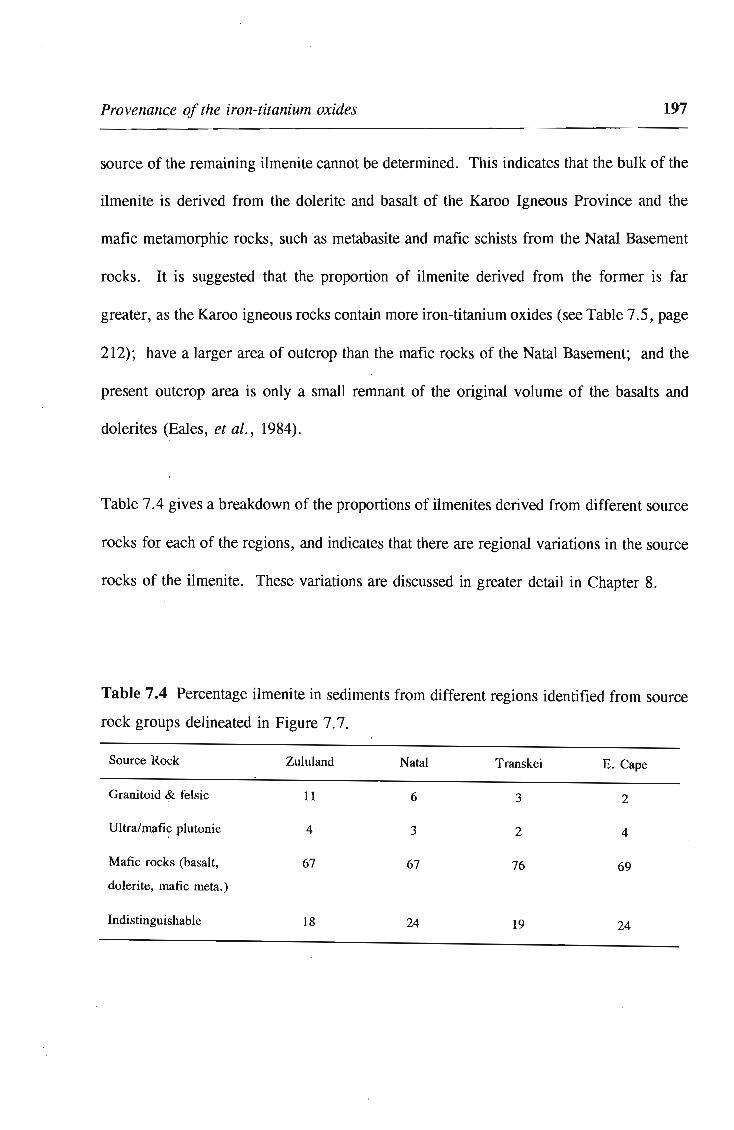
Provenance of the iron-titanium oxides 197
source of the remaining ilmenite cannot be determined. This indicates that the bulk of the
ilmenite is derived from the dolerite and basalt of the Karoo Igneous Province and the
mafic metamorphic rocks, such as metabasite and mafic schists from the Natal Basement
rocks. It is suggested that the proportion of ilmenite derived from the former is far
greater, as the Karoo igneous rocks contain more iron-titanium oxides (see Table 7.5, page
212); have a larger area of outcrop than the mafic rocks of the Natal Basement; and the
present outcrop area is only a small remnant of the original volume of the basalts and
dolerites (Bales, et al., 1984).
Table 7.4 gives a breakdown of the proportions of ilmenites derived from different source
rocks for each of the regions, and indicates that there are regional variations in the source
rocks of the ilmenite. These variations are discussed in greater detail in Chapter 8.
Table 7.4 Percentage ilmenite in sediments from different regions identified from source
rock groups delineated in Figure 7.7.
Source Rock
<Jranitoid ~ felsic
Ultra/mafic plutonic
Mafic rocks (basalt,
dolerite, mafic meta.)
Indistinguishable
Zululand
11
4
67
18
Natal Transkei E. Cape
6 3 2
3 2 4
67 76 69
24 19 24

Provenance of the .iron-titanium oxides
Cl) -C Cl)
E
.5 0 c ~
~ 0
7.6
ILMENITE DISCRIMINA lION DIAGRAM 100 ~----~~~~~~~~~~~~~~~~~~~~--, <> UL TRAlBASIC PLUTONIC
10
0
1
'FELSIC FIELD
MAPIC IGNEOUS & MEr AMORPHIC FIELD
o DOLERITE & BASALT + GRANITOID & FELSIC to GRANOPHYRE x MAFIC METAMORPHIC
.1 L--L-LLL~~~~~~~ __ ~LLLUilll __ ~~~~L--L-L~~~
.001 .01 .1 1 10 100 % MgO in IImenite
198
Figure 7.6 Plot of MnO versus MgO using log scale to distinguish ilmenite from different
rock groups. The clearly defined fields of most of the different rock groups indicate that
this plot is the best discrimination diagram for ilmenite provenance. (Note: the lower limit
of detection for MgO in ilmenite, using the operating conditions described Table 4.1 is
0.02).
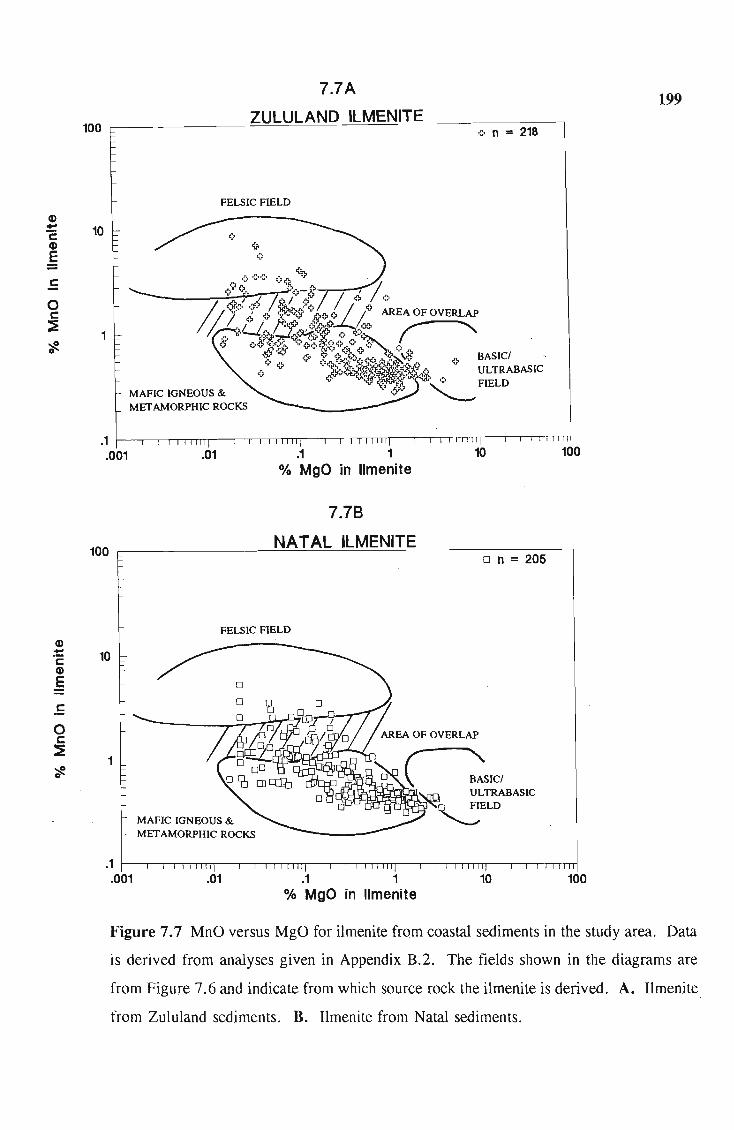
Cl) ~ c Cl)
E
.5 0 c ~
'1! 0
Cl)
:!:: c Cl)
E
c
0 c ~
~ 0
199 7.7A
ZULULAND ILMENITE 100 ~--------------~~~~~~~~~~~-----o~n~=~2~1~8--1
10
1
FELSIC FIELD
MAFIC IGNEOUS & MET AMORPHIC ROCKS
~ <>
.1 ~~~~~--.-,,~mr-'-'lTnnrr--r"nlnrr,-'-"TITnn .001 .01 .1 1 10 100
% MgO in IImenite
7.78
100 r--_ ____ .~N~A~T...:..._A=L~IL~M=E:..:....:N:..:....:IT:.....=E=____ ____ ~____, o n = 205
10
1
FELSIC FIELD
0
'--
MAFIC IGNEOUS & MET AMORPHIC ROCKS
.1 ~-'''''~~-'-'''OT~--'-''Tn~--'-''''~'--'-'TTnTm .001 .01 .1 1 10 100
% MgO in IImenite
Figure 7.7 MnO versus MgO for ilmenite from coastal sediments in the study area. Data
is derived from analyses given in Appendix B.2. The fields shown in the diagrams are
from Figure 7.6 and indicate from which source rock the ilmenite is derived. A. Ilmenite
from Zululand sediments. B. Ilmenite from Natal sediments.

CD :!:: c: CD E
c:
0 c: ::! ~ 0
CD -C CD E
.E 0 c: ~
~ 0
7.7C
TRANSKEI ILMENITE 100 ~--------------~~~~~~~~~~----~x~n~=~21~6--1
FELSIC FIELD
10
1 BASIC! ULTRABASIC
MAPle IGNEOUS & METAMORPHIC ROCKS
x
.1 .001 .01 .1 1 10 100
% MgO in IImenite
7.70
EASTERN CAPE ILMENITE 100 ------------~~~~~~~~~~~~~------------~
10
1
.1 ~~~~~~~~~~~~~~~~~~~~~~~~~~
.001 .01 .1 1 10 100 % MgO in IImenite
200
Figure 7.7 MnO versus MgO for ilmenite from coastal sediments in the study area. C.
Ilmenite from Transkei sediments. D. Ilmenite from eastern Cape sediments.
Provenance of the iron-titanium oxides 201
7.6 MAGNETITE CHEMISTRY AS A PROVENANCE INDICATOR
7.6.1 Method
Magnetite from the following rock types and sediments were analysed by electron
microprobe, as described in Chapter 4 (see page 63):
1. Karoo dolerite, including the Rooi Rand dyke swarm;
2. Basalt;
3. rivers (Kei and Fish) which exclusively drain the above rock types;
4. granite-gneiss (MS17);
5. mafic gneiss;
6. rivers which exclusively drain the metamorphic terranes (Mgeni River tributaries)
consisting mainly of granite-gneiss and porphyroblastic gneiss with mafic enclaves;
Where possible, homogenous magnetite was analysed, but in some rock types, such as
dolerite and basalt, most of the magnetite is inhomogeneous, containing ilmenite
"oxyexsolution" textures, or ex solution of pleonaste or ulvospinel. Magnetite analyses
were also obtained from the literature to complement the magnetite data base. All analyses
were recalculated by the method of Stormer (1983) to estimate the F~03 in the grains.
The full list of analyses used is given in Appendix C.2.
Source rocks were grouped as follows:
1. Basic Igneous Rocks - mainly dolerite and basalt, with minor gabbro, which are
considered to represent rocks from the Karoo Igneous Province.
2. Metamorphic ultrabasic-basic complexes (MUBC) - data from the Usushwana
(Reynolds, 1986a) and Mambula Complexes (Reynolds 1986d).
3. Granitoids - granite-gneiss, metagranite, and minor granite.
4. Metamorphic rocks - other metamorphic rocks, including metabasite, mafic schist,
ortho- and paragneiss.
Variation diagrams were plotted to determine which oxides best distinguish magnetites
from the different source rocks.

Provenance of the iron-titanium oxides 202
7.6.2 Magnetite compositions in source rocks
The major elements in magnetite from the above rock groups were plotted as oxides
against Fe:z03 (Figure 7.S). From the plots it is evident that the major variation in
magnetite chemistry is caused by Ti02 and Fe:z03 content (see Figure 7.SA). The
compositions plot along the magnetite-ulvospinel tie-line, indicating that the variation is
caused by ulvospinel solid-solution within the magnetite. The variation in Ti02 is a
function of the initial Ti02 content and./02 of the magma, the degree of subsequent
ex solution of ulvospinel, or oxyexsolution of ilmenite, from the magma during cooling
(Haggerty, 1976b). In some cases the high Ti02 levels analysed by electron microprobe
may be caused by sub-microscopic intergrowths of ulvospinel in the magnetite. Figures
7.SC and 7.SD indicate that, of the other oxides, Al20 3 results in the greatest variation in
magnetite composition.
Magnetite from basic igneous rocks (that is, those equated with the Karoo igneous rocks)
may be distinguished from those of other rocks, as the former contain higher Ti02 and
Al20 3 contents, and correspondingly low Fe:z03 levels. The data set is biased towards the
volcanic and hypabyssal rocks, which contain magnetites enriched in Ti02 and rarely have
Ti02 contents of less than 5 per cent. Frost and Lindsley (1991) note that titanomagnetite
in MORB and flood basalts contain 50 to SO per cent ulvospinel. The Ti02 content
decreases as ulvospinel or ilmenite is formed from the titanomagnetite. The variability of
the Ti02 content, and to a lesser degree, the other oxides, is an indication of the ease with
which spinels tend to undergo catton-exchange with other minerals during slow cooling.
Magnetite in volcanic rocks is therefore expected to have higher levels of impurities, as
these rocks cool quickly.
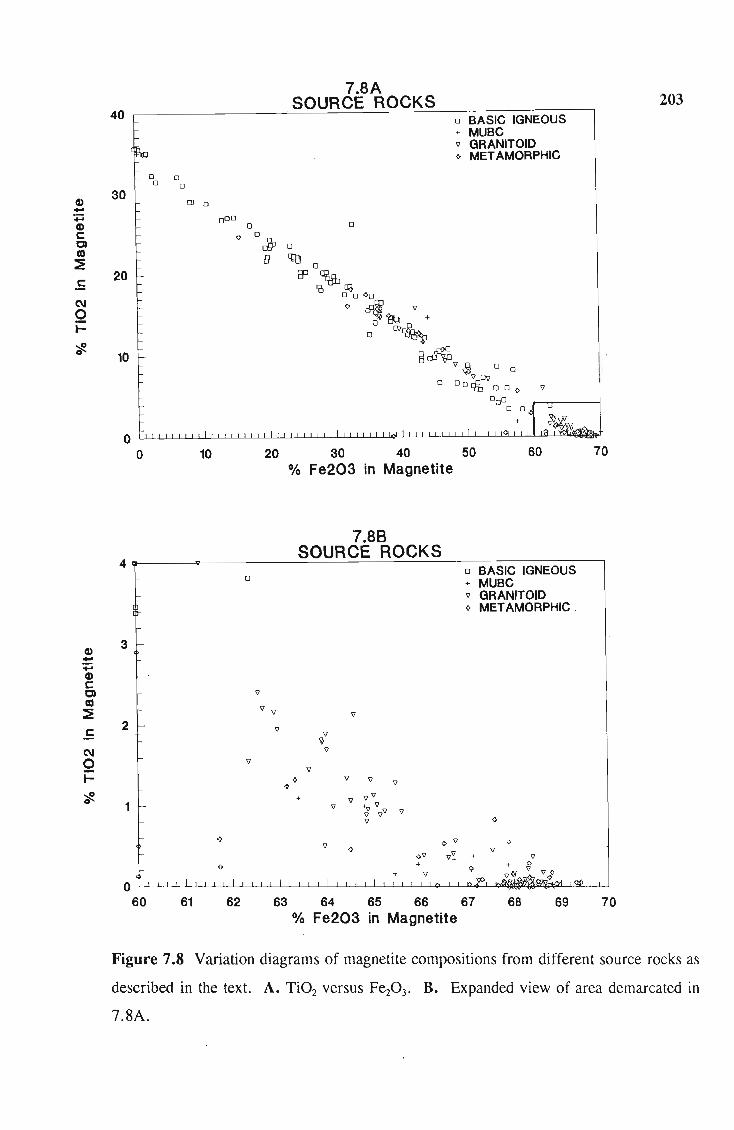
c:::
(\j
o I-
Q) --Q) c::: 0) a1 ~
.E (\j
o I-
7.8A SOURCE ROCKS 203
40 0 BASIC IGNEOUS + MUBC
30
20
10
o o o
o
'0 GRANITOID <> METAMORPHIC
01 0
o
O ~~ull~~uD~~~~~~~~~~~~~~
o 10 20 30 40 50 60 70 % Fe203 in Magnetite
7.88 SOURCE ROCKS
4 .-----~----------~~~---------------o~B~A~S~IC~IG~N~E~O~U~S~--o
+ MUBC '0 GRANITOID <> METAMORPHIC
3 -
2 -
1 I-<>
<> '0 <>
<> +
70
Figure 7.8 Variation diagrams of magnetite compositions from different source rocks as
described in the text. A. Ti02 versus F~03 ' B. Expanded view of area demarcated in
7.8A.

Q)
!:: ... Q) c 0)
ca ~ c et)
0 ('11
« '::f!. 0
Q) ... ... Q) c 0)
ca ~ c: et)
0 ('11
;;;: '::f!. 0
7.8C SOURCE ROCKS
7 0 o BASIC IGNEOUS
+ MUSC 'J GRANITOID
6 o METAMORPHIC
5 0
0 4 0
0 0 3 0 0 0
0 0 DD 0 0 0
0 0 o 0
0 0 0
2 0 0 od 0 0 +
o 0 0 00 o 0 ° 0
m 00 o 0 0 0 Qo 0 +
0 DO 0 0 <> 0 dd rn Bg d>0 <>0 1 0 0 0
0 tJf DO dJ 0 0
'J
0 I&J 0Cl ",,0 0 <P
00,& () 0
0 10 20 30 40 50 60 70
% Fe203 in Magnetite
7.80
7 SOURCE ROCKS
o BASIC IGNEOUS + MUSC 'J GRANITOID
6 "" METAMORPHIC
5
4
3 0
0 0 0 0 0
2 0 0 0 +
0
° 0 + 1 0 <> 0
'J <>
'V 0
0 50 55 60 65 70
% Fe203 in Magnetite
Figure 7.8C. Al20 3 versus F~03 in magnetite from different source rocks.
D. Expanded view of area demarcated in 7.8C.
204

7.BE 205 SOURCE ROCKS
2 o BASIC IGNEOUS + MUSC v GRANITOID o METAMORPHIC
(l) 1.5 0 ... :;::
(l) 0 0
c: 0 0) 0 0 (\1
::!: 0 o 0
1 o 0 0 c: 0
o 0 0 0 0
0 0 DO 0 0 0 0 0
c: 0 0
::!: 0 0
0 0 0
0 0 DJ 0 l\;Jo 0
~ 0
.5 0 0 0 0 DD V 'V 00 0
0 10 dd
0 0 V <> 08 0 000 J1 D~ 0 0 ,.g 0 0 0 0
0 D 0
0 <> 0 o+.p 0 V
D I2J 0 0 Dv V cP D 0
V o liD D 00~00~ VD +
0 0 10 20 30 40 50 60 70
% Fe203 in Magnetite
7.BF 5
SOURCE ROCKS o BASIC IGNEOUS + MUSC
4.5 v GRANITOID 0 ~ METAMORPHIC
4
(l) 0 :!:: 3.5 + -(l) c:
3 0) (\1
::!: c: 2.5
0 2 0) 0
::!: ~ 1.5 0 0 00 0
0 D !9
0 1 v D
0 Do dd 0 0 0 0 0
.5 0 000 oCD 0
0
o 0
0 10 20 30 40 50 60 70 % Fe203 in Magnetite
Figure 7.SE MnO versus F~03 in magnetite from different source rocks.
F. MgO versus F~03'

Provenance of the iron-titanium oxides 206
The magnetite from metamorphic rocks and granitoid rocks (that is, those equated with the
Natal Basement rocks) have indistinguishable compositions. Magnetite from granitoid
rocks tends to have compositions very close to pure F~04' with only minor Ti02 and
Al20 3 substitution. This is attributed to extensive sub-solidus re-equilibration of the
magnetites with other minerals in these rocks which is enhanced by the presence of
aqueous fluids (Frost and Lindsley, 1991).
As with the granitoids, most metamorphic rocks contain pure magnetites, although the
solid-solution of ulvDspinel in some magnetites from the data set may be high (up to 24
per cent Ti02 in the magnetite). Frost (1991b) states that magnetite is nearly pure F~04
in most metamorphic rocks and although magnetite in high grade rocks may contain
considerable titanium, this is expelled during re-equilibration on cooling.
The variations in Al20 3, Ti02 and Fez03 contents in the magnetites are combined to form
the variation diagram shown in Figure 7.9. Using these field delineators in Figure 7.9,
only 2 per cent the basement magnetite, and 2 per cent of the basic igneous magnetite is
incorrectly classified. Eight and 10 per cent of the basement and igneous magnetites,
respectively, fall within the field of overlap. The plot of Al20 3 against
Fez03/(Fez03+Ti02) ratio is therefore a good discriminator of magnetite from the two
major, primary provenances. This variation diagram is used in Chapter 8 to help interpret
variations in the chemistry of magnetites found in the coastal sediments.
Although AI, Ti and Fe3+ are effective discriminators, V and Cr are also expected to be
useful, as these elements are commonly concentrated in magnetite from basic and
ultrabasicplutonicrocks (Haggerty, 1976b; Reynolds,1986<1; Frost and Lindsley, 1991).
Grigsby (1990) has shown that V, in particular, is a good discriminator of magnetite
source rocks.

(I)
0 ~ et:
~ 0
Provenance of the iron-titanium oxides 207
7.9 MAGNETITE DISCRIMINATION DIAGRAM 5 ------~~~~~~~~~~~~~~~~--~--~
o BASIC IGNEOUS + MUSC 'V GRANITOID {> METAMORPHIC
4 o o
0 0 3
0
0 0 BASIC IGNEOUS 0
0 0 0 C\3 FIELD 0
0 0 00 0 0 0 2 0 0 d" o 0
0 0 0 AREA OF OVERLAP
0 00 0 0
(I] 0 o 0 0 0
0 0 0 0 0 BASEMENT ROCKS 0 0 0
0 0 ' 0 0
0 a 0 0 tlo 0 0
0
0 0 .1 .2 .3 .4 .5 .6 .7 .8 .9 1
F e203/(F e203+ Ti02)
Figure 7.9 A plot of A120 3 versus F~03/(F~03+Ti02) in magnetite, which is the best
discrimination diagram of magnetite from different source rocks.
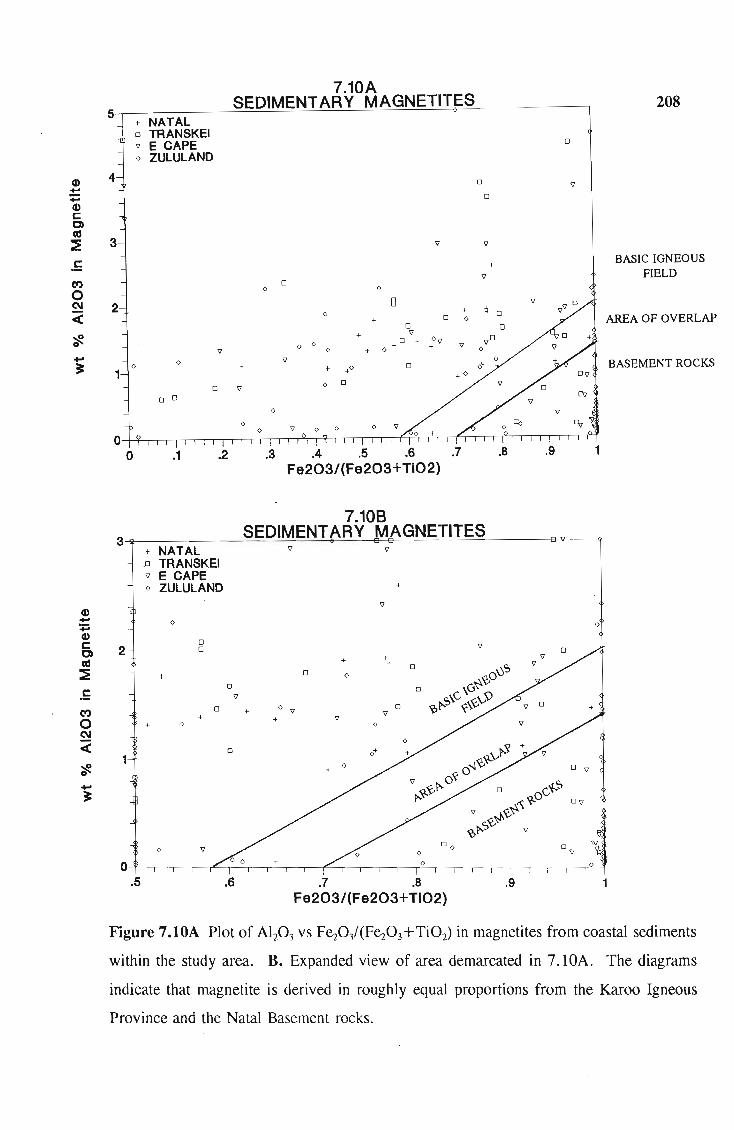
Cl) .. :;:0 Cl) c:: 0) as ~
.s et)
o ~ c(
7.10A SEDIMENT ARY MAGNETITES 5~--------~~~~~~~~~~~~--------~
+ NATAL o TRANSKEI " E CAPE o ZULULAND
4
3
2
o o + 1
o "
o 0
o
o 0
.1 .2
o
o
" +
0 " 0 0
El 0 + ~ 0
+ 0 0 0 0
+ " 0 +0 + 0" "
,,0 0 + 0 + 0 0
" + +0 0
0 0
o
.3 .4 .5 .6 .7 .8 Fe203/(Fe203+Ti02)
7.108 3 SEDIMENT ARY MAGNETITES
+ NATAL 'Cl
.0 TRANSKEI " E CAPE o ZULULAND +
'Cl
0
0 2 0 "
+ ++
+ 0
0
" 0 + 0
" + + + 0
0 o'\:!s 0
0 G~~ s\c ~x.v\)
0 'Cl" ~~ " 0
0
1 0+
+ 0
o DO
o
"
o
" "
0" O~-,-,-, __ r-,O~O,-,-+-.-,~~ __ .-,-,-~-.-,-,-, __ .-,-,-,-~o~
.5 .6 .7 .8 .9 Fe203/(Fe203+Ti02)
208
BASIC IGNEOUS FIELD
AREA OF OVERLAP
BASEMENT ROCKS
Figure 7.10A Plot of Al20 3 vs F~03/(F~03+Ti02) in magnetites from coastal sediments
within the study area. B. Expanded view of area demarcated in 7. lOA. The diagrams
indicate that magnetite is derived in roughly equal proportions from the Karoo Igneous
Province and the Natal Basement rocks.

Provenance of the iron-titanium oxides 209
7.6.3 Provenance of magnetite in coastal sediments
All magnetite analyses, from coastal sediments are plotted on the discrimination diagram
described 'above (Figure 7.10). These analyses (see Appendix B.3) are obtained from
samples of the major heavy mineral regions, although there is a bias towards the Zululand
sediments, which constitute about 50 per cent of the data base).
Of the 202 analyses plotted in Figure 7.10, about 43 per cent of the magnetites fall in the
Karoo Igneous (dolerite and basalt) field, 48 per cent are derived from Natal Basement
rocks, and the remaining magnetites (9 per cent) cannot be classified. This clearly shows
that magnetite in the coastal sediments is derived from both the major provenances in
roughly equal proportions.
7.7 PROPORTIONS OF IRON-TITANIUM OXIDES IN SOURCE ROCKS
7. 7.1 Modal proportions in source rocks
The proportions of the iron-titanium oxides in samples of various source rocks were
determined by point-counting 100 oxide grains per sample. The proportions of the oxides
in the samples were visually estimated. The modal proportions are given in Table 7.5 and
indicate that the following intergrowths or textures are exclusive to certain rock groups:
1. Skeletal ilmenite and magnetite grains, er-spinels, and magnetite containing trellis
and sandwich lamellae of ilmenite, are found almost exclusively in basalt and
dolerite of the Karoo Igneous Province and are therefore good provenance
indicators of these rocks.
2. (Ilm-Hem)ex, (Hem-Ilm)ex ± Rutoe , Ilm-(Hem+Rut±Psb)ox and (Hem-Rut±Psb)ox
grains are good indicators of granite-gneiss and granitoids from the Natal
Metamorphic Province.
3. Mt-Pleoex±Ilffioe and, to a lesser extent, chromite grains are good indicators of
metamorphosed layered intrusions from the Natal Metamorphic Province.

Provenance of the iron-titanium oxides 210
4. The Natal Metamorphic Province is also characterised by rutile, titanite and
ilmenite-titanite grains.
The presence of oxides containing these intergrowths or textures in coastal sediments
should indicate that the minerals are derived from specific rock groups.
7. 7.2 The ilmenite-magnetite discrimination diagram
Homogeneous ilmenite and magnetite grains are found in a wide range of source rocks and
are therefore poor petrographic indicators of provenance by themselves. These minerals,
together with Mt-IlIl\x:± USPex intergrowths, are the dominant phases in the source rocks
examined. When their proportions are plotted on a ternary diagram - the ilmenite
magnetite discrimination diagram (Figure 7.11) - clear differences between the basement
and Karoo igneous rocks are noted. The basalts and dolerites contain high proportions of
Mt-IlIl\x:± USPex and low amounts of homogeneous magnetite. The basement rocks contain
high proportions of homogeneous ilmenite and magnetite and less than 10 per cent
intergrown magnetite. An exception is the ultrabasic rocks which plot within the field of
the dolerites and basalts, however, most of the magnetite from these rocks contain
pleonaste intergrowths and so these rocks can be distinguished from the Karoo igneous
rocks.
The differences in the proportions of the iron-titanium oxides from the different source
areas are caused by variations in bulk chemistry,./Oz, and cooling rate. As noted by
Haggerty (1976a) the low j02 of basic rocks results in the crystallisation of ilmenite and
the extensive solid-solution of ulvQspinel in magnetite. Slight increases inj02 result in the
oxyexsolution of ilmenite from magnetite, but the rapid cooling of the basalts and smaller
dolerite intrusions ensures that the ilmenite lamellae are intimately intergrown with the
magnetite. Coarser intergrowth textures are usually found in the larger dolerite sills, or
in the basic plutonic rocks, where slow cooling results in the development of sandwich or
composite textures.

Provenance of the iron-titanium oxides
Mt-Ilm-Usp
100 c Basalt and rhyolite o Dolerite 11 Granitoid and felsic
211
+ Metabasite, mafic met. x MUSe
7.11
METAMORPHIC ROCKS
+ * ~ (:{ *' :t: * * /i *100 O'~------~-------r++-----.--------r-------~ 100 80 60 40 20 o
MAGNETITE ILMENITE
Figure 7.11 The ilmenite-magnetite discrimination diagram, which is a plot of the relative
proportions of homogeneous magnetite, ilmenite and Mt-Umoe-UsPex.
Note: MUBC = metamorphosed ultrabasic/basic complexes.

Provenance of the iron-titanium oxides 212
Table 7.5 Modal Proportions of iron-titanium oxide intergrowths in source rocks, determined by point-counting. All values are expressed as a per cent. Sample localities are given in Appendix A.
Oxide Grain Types
Umenite
vennifonn ilmenite
skeletal ilmenite
Urn-Hem
Hem-llm
Hem-Dm-Rut
Hem-Rut
Dm-(Hem-Rut-Psb)
(Hem + Rut + Psb)
(Hem-Pab)
Hematite
Magnetite
skeletal magnetite
Mt-Usp
Mt-Dm-Usp
trellis
sandwich
composite
Mt-Pleo-llm
Chromite
Cr-Spinel
Rutile
Sphene
llm-Sph
Altered grains
Total
Per cent of Rock
Normalised values
llmenite
Magnetite
Mag+ilm+ulv+pleo
Homo magnetite
llmeno-magnetite
Uiv + Pleonaste Mag
- ... not observed
r = trace amounts
• < 1 % ··1-10 % ···10-25 %
····25-50 % ••••• > SO %
HSl
9
-•• --------
10
•• 2
79
•••••• ••
--r
---
nd
100
3.5
9.0
10.0
81.0
11.0
86.8
2.2
BASALTS
HS2 HS3 HS4
5 7 3
- - -•• • •• - - -- - -- - -- - -- - -- - -- - -- - -
25 17 13
• •• •• •• 6 2 4
64 74 80
• •••• • ••••• •••••• •• •• • •• • • - - -- - -- r r
- - -- - -- - -
nd nd nd
100 100 100
2 1 4.5
5.0 7.0 3.0 25 .0 17.0 13.0
70.0 76.0 84.0
26.3 18.3 13.4 67.4 79.6 82.5
6.3 2.2 4.1
RHYOLITES
HS5 HS6 PJ'A 1 PJ'A 2 HLl HL2
IS 2 10 12 2 5
- - - - - -•• • •• • • - -- - - - - -- - - - - -- - - - - -- - - - - -- - - - - -- - - - - -- - - - - -- - - - - -
19 5 10 8 6 3
• • • •• • • • • r 1 - - 4 6
66 88 69 72 88 86
• •••• • ••••• • ••• • •••• •••••• • ••••• •• ••• • ••• •• •• • •• • •• • • •• • - 1 - " - -- - - - - -- 3 - - - -- - - - - -- - - - - -- - - - - -
nd nd 11 8 nd nd 100 100 100 100 100 100
3 3 nd nd 1 0.5
15.0 2.1 11.2 13.0 2.0 5.0 19.0 5.2 11.2 8.7 6.0 3.0 66.0 92.8 77.5 78.3 92.0 92.0
22.4 5.3 12.7 10.0 6.1 3.2 77.6 92.6 87.3 90.0 89.8 90.5
0.0 2.1 0.0 0.0 4.1 6 .3

Provenance of the iron-titanium oxides
Table 7.5 (cont.)
Oxide Grain Types
Ilmenite
vennifonn ilmenite
skeletal i1menite
IIm-Hem
Hem-Ilm
Hem-IIm-Rut
Hem-Rut
IIm-(Hem-Rut-Psb)
(Hem+ Rut+ Psb)
(Hem-Psb)
Hematite
Magnetite
skeletal magnetite
Mt-Usp
Mt-IIm-Usp
trellis
sandwich
composite
Mt-Pleo-IIm
Chromite
Cr-Spinel
Rutile
Sphene
IIm-Sph
Altered grains
Total
Per cent of Rock
N onnalised values
Ilmenite
Magnetite
Mag+ilm+ulv+pleo
Homo magnetite
Ilmeno-magnetite
Ulv + Pleonaste Mag
- = not observed
r = trace amounts
• < 1 % •• 1-10 %
... 10-25 % •••• 25-50 %
VDl
58
** • *.
11
•• 4
27
•• • ** **
nd
100
0.5
VD2
43
* ••
4
14
39
•• ••• •••
nd
100
0.5
58.0 43 .0
11.0 4.0
31.0 53.0
26.2 7.0
64.3 68.4
9.5 24.6
VD3
59
..
6
27
D6
22
* **
12
** 3
61
***
D8
34
•• •••
7
2
56
••• ** *** **
*** **** "'''''''*
nd nd
lOO 99
0.5 3
59.0 22.4
6.0 12.2
35.0 65.3
14.6 15.8
65.9 80.3
19.5 3.9
nd
100
34.3
7.1
58.6
10.8
86.2
3.1
DOLERITES
PTA3 PTA4
19 22
• *
11
nd
44
**
••
9
nd
43
•• **"'* "'''''''*
*** "''''*
26 26
lOO 100
nd nd
25.7 29.7
14.9 12.2
59.5 58.1
20.0 17.3
80.0 82.7
0.0 0.0
LHD3
25
• ••
8
*
67
••• ••
***'"
nd
100
2.5
25.0
8.0
67.0
10.7
89.3
0.0
LRRD2
22
• * •
14
• 3
61
••
**.
nd
100
4
22.0
14.0
64.0
17.9
78.2
3.8
DM90-18
20
• •
8
• 4
65
•• ****
•• *
3
nd
lOO
4.5
20.6
8.2
71.1
10.4
84.4
5.2
DM90-6
38 .. ••
4
• 2
56
•• ***'"
****
nd
100
6
38.0
4.0
58.0
6.5
90.3
3.2
213
DM90-8
28
2
• 3
67
••• •••
*"'''''''
nd
100
28.0
2.0
70.0
2.8
93.1
4.2
DM90-2~
.,
6!
** ~
nc
10<
18,(
6.C
76.(
7.3
84.1
8.5

Provenance of the iron-titanium oxides
Table 7.5 (cont.)
Oxide Grain Types Ilmenite
vermiform ilmenite skeletal ilmenite
IIm-Hem Hem-IIm
Hem-IIm-Rut
Hem-Rut IIm-(Hem-Rut-Psb)
(Hem +Rut+ Psb) (Hem-Psb)
Hematite Magnetite
skeletal magnetite Mt-Usp
Mt-IIm-Usp trellis
sandwich
composite
Mt-Pleo-IIm
Chromite
Cr-Spinel Rutile
Sphene IIm-Sph
Altered grains Total
Per cent of Rock
Normalised values
llmenite Magnetite
Mag+ilm+ulv+pieo
Homo magnetite llmeno-magnetite
Ulv + Pleonaste Mag
- = not observed r = trace amounts
* < 1 %
** 1-10 % *** 10-25 %
VG1 VG2
35 6
- -- -
r -
r -- -
- -
4 -
- -- -
r -
58 92
- -
- -3 2
- -
- -
** * - -
- -- -
- -
- -
- -
nd nd 100 100
3 1
36.5 6.0 60.4 92.0
3.1 2.0
95.1 97.9 4.9 2.1
0.0 0.0
GRANITOIDS
VG3 VG4 VG5
42 80 7
- - -- - -r 10 68
- - 12
- - 2
- - 1
6 8 6
- 2 r
- - r
- r 4
46 - -
- - -
- - -
6 - -
- - -
* - -
** - -
- - -
- - -
- - -
- - -
- - -
- - -
nd nd nd
100 100 100
1.5 0.5 2
44.7 100.0 100.0 48.9 0.0 0.0
6.4 0.0 0.0
88.5 11.5
0.0
214
MS17 MS18 UMG UMG UMG UMG UMG
55 80 38 28 53 21 35
- - - - - - -
- - - - - - -
r - 12 8 7 14 21
- - r 4 3 r 6
- - r r - r 2
- - 1 3 3 1 1 - - 3 5 4 6 4
- - 2 1 r r r
- - r r - r r
- - 5 6 3 8 12
40 12 32 38 21 45 12
- - - - - - -
- - - - - - -
5 8 6 4 3 4 3
- - - - - - * * * - - - - -
* ** ** ** * * * - - - - - - -
- - r 1 - - -
- - - - - - -
- - r 2 3 1 3
- - 1 r - - -
- - r r - - 1
nd nd nd nd nd nd nd
100 100 100 100 100 100 100
0.5 0.5 na na na na na
55.0 80.0 50.0 40.0 68.8 30.0 70.0 40.0 12.0 42.1 54.3 27.3 64.3 24.0 5.0 8.0 7.9 5.7 3.9 5.7 6.0
88.9 60.0 84.2 90.5 87.5 91.8 80.0 11.1 40.0 15 .8 9.5 12.5 8.2 20.0 0.0 0.0 0.0 0.0 0.0 0.0 0 .0

Provenance of the iron-titanium oxides
Table 7.5 (cont.)
Oxide Grain Types
llmenite
vermiform ilmenite
skeletal ilmenite
llm-Hem
Hem-llm
Hem-llm-Rut
Hem-Rut
llm-(Hem-Rut-Psb)
(Hem + Rut + Psb)
(Hem-Psb)
Hematite
Magnetite
skeletal magnetite
Mt-Usp
Mt-llm-Usp
trellis
sandwich
composite
Mt-Pleo-Ilm
Chromite
Cr-Spinel
Rutile
Sphene
llm-Sph
Altered grains
Total
Per cent of Rock
Normalised values
llmenite
Magnetite
Mag+ilm+ulv+pIeo
Homo magnetite
llmeno-magnetite
Ulv+Pleonaste Mag
- = not observed
r = trace amounts
"<1% .... 1-10 %
...... 10-25 %
........ 25-50 %
NDF 5 '- VAl
2 5
- -- -- -- -- -
- -
- -
- -
- -
- -
92 87
- -- -
6 8
- -- -
.... ... - -
- -
- -
- -
- -- -
. nd nd
100 100
2 0.5
2.0 5 .0
92.0 87.0
6.0 8.0
93.9 91.6
6.1 8.4
0 .0 0.0
AMPHmOLITES
VA2 VA3
85 92
- -- -- -
- -
- -
- -
- -- -
- -- -
9 4
- -
- -
6 4
- -
- -.... .. ..
- -
- -
- -- -- -
- -nd nd
lOO lOO
0.5 I
85.0 92.0
9.0 4 .0
6.0 4 .0
60.0 50.0
40.0 50.0
0.0 0.0
VA4
22
-
-
-
-
--
-
-
--
70
-
-
8
-
-
.... -
--
-
-
-
nd
lOO
1
22.0
70.0
8.0
89.7
10.3
0.0
215
MAFlC SCHlSTS METAMORPHOSED
AND GNElSSES ULTRABASlC
NDFl -' VM2 VM3 VM3 VMI IRI IR2
3 5 81 4 20 15 25
- - - - r - -
- - - - - - -- - 4 - - - -- - - - - - -
- - - - - - -- - - - - - -
- - r - - - -- - - - - - -
- - - - - - -- - r - - - -
4 6 8 84 6 r r
- - - - - - -
- - - - r r r
- - 7 12 2 r r
- - - - - - -
- - - - .. .. -
- - .... .... .. - .. - - - - 72 85 75
r r - - - - -- - - - - - -
80 - - - - -
13 I - - - - -- 88 - - - - -
nd nd nd nd nd nd nd
lOO lOO lOO lOO lOO lOO 100
0.5 I 2 4 80 > 70 > 70
42.9 45 .5 84.4 4 .0 20 .0 15.0 25.0 57.1 54 .5 8.3 84 .0 6.0 0.0 0.0
0.0 0.0 7.3 12.0 74 .0 85.0 75 .0
100.0 100.0 53.3 87.5 7 .5 0.0 0 .0 0.0 0.0 46.7 12.5 2.5 0.0 0 .0 0.0 0 .0 0.0 0.0 90.0 100.0 100.0

Provenance of the iron-titanium oxides 216
The higher ./02 in felsic rocks increases the Fe3+:Fe2+ ratio, forming magnetite with
compositions close to the F~04 end-member. Extensive ilmenite-hematite solid-solutions
are also common and the slow cooling of felsic plutonic rocks results in the ex solution of
hematite from ilmenite and vice-versa. The high proportions of homogeneous ilmenite and
magnetite in metamorphic rocks is attributed to the re-crystallisation and re-equilibration
of the iron-titanium oxides during metamorphism. Ilmenite is unstable in weakly
metamorphosed rocks and breaks down to rutile (Ferry, 1984), or titanite (Cassidy and
Groves, 1988), but may re-form from these minerals in the mid-green schist facies (Cassidy
and Groves, 1988). This break down and re-crystallisation of ilmenite results in the
destruction of ilmeno-magnetite grains and hence their scarcity in metamorphic rocks, as
noted by Rumble (1976) and Frost (1991b). Reported occurrences of magnetite-ilmenite
intergrowths are either from sillimanite or higher grade rocks, or from partially re
crystallised igneous rocks (Rumble, 1976).
7. 7.3 The application of the ilmenite-magnetite diagram
The large differences in the proportions of the major iron-titanium oxides from various
source areas, shown in Figure 7.11, indicate that this discrimination diagram is a good
means of determining the provenance of the oxides found in coastal sediments. For
example, high proportions of homogeneous magnetite in sediments would indicate that the
oxides were derived from basement rocks, notably amphibolites or magnetite-bearing
quartzite.
To test the usefulness of the ilmenite-magnetite diagram, the normative proportions of
ilmenite, magnetite and Mt-Ill1\x,± USPex from selected coastal sediments, and rivers
feeding these sediments (Table 7.6), are plotted on the ilmenite-magnetite diagram in
Figure 7.12. Most of the dune and beach samples plot close to the ilmenite apex, within
the Natal Basement field. If this were the only data plotted, it would suggest that the
Karoo Igneous rocks make little contribution to the ilmenite and magnetite in coastal
sediments. However, the distribution of the river samples indicates that the relative
proportions of the oxides is not so much a function of provenance, but rather the

Provenance of the iron-titanium oxides 217
differences in durability of ilmenite and magnetite. The composite grains of Mt
Ilmoe± USPex break down during transportation and sedimentary re-working, as noted by
Molinaroli and Basu (1987). This results in a greater number of homogeneous grains, and
a shift towards the ilmenite-magnetite axis. In addition, magnetite is less stable than
ilmenite in the sedimentary environment (Dryden and Dryden, 1946; Pettijohn, 1957;
Darby, 1984) and the oxide assemblages are expected to shift towards the ilmenite apex
with increasing sediment maturity and age.
The Tugela River provides a good example of the evolution of the oxide assemblages
(Figure 7.13). At the source of the river the oxide assemblage plots close to the Mt-Ilm
Usp apex, as the main source is the basalts of the Natal Drakensburg. Further down the
river the oxides plot in a more central position, within the field of the Karoo dolerites as
these rocks are the major source. Once the river runs through the Natal Basement rocks,
there is a large deviation towards the homogeneous magnetite apex as this is the dominant
mineral from these rocks. At the mouth of the river, homogeneous magnetite accounts for
almost 70 per cent of the oxide assemblage. The sediment movement is northwards along
this stretch of coastline (Flemming, 1981), and the shoreline between the Tugela River
mouth and Mtunzini is the only prograding shoreline along the east coast (McCarthy,
1988a). The magnetite content in samples of coastal sediments in this region is soon
reduced and the oxide assemblages plot close to the ilmenite apex. This is caused by
either the destruction of magnetite along the high energy coastline, or the dissemination
of the magnetite into existing heavy mineral suites containing much larger quantities of
ilmenite, as discussed in Chapter 8.
The above indicates that the proportions of ilmenite and magnetite in coastal sediments
may be very different from that found in their source rocks and that the ilmenite-magnetite
discrimination diagram is inappropriate to provenance studies. It also suggests that the
method of Basu and Molinaroli (1989, 1991) would give misleading results if applied in
the study area.

Mt-lIm-Usp
100
7.12
A
D e A
eeDee BEACH AND DUNE "''''''''''''' RIVERS
218
O~ ____ -. _____ M_~~AM __ O_~_H_I_C~RO_C_~ __ -__ ~-M~~100
100 80 60 40 20 o
MAGNETITE ILMENITE
Figure 7.12 The proportions of magnetite, ilmenite and Mt-Ilmoe-UsPex from selected
coastal sediments plotted on the ilmenite-magnetite discrimination diagram. Data is
derived from Table 7.6.
Mt-Ilm-Usp
7.13
2
4 :3
5
1 - PTA2 Tugela Source 2 - PTA4 Tugela ferry 3 - HZ24 Tugela Raif 4 - HZl Tugelo Mouth 5 - HZ25 Mtunzini · Beach 6 - HZ26 Mtunzini Dune 7 - HZ:3 Port Dumford Beach 8 - HZ2 Port Dumford Dune
6 78
0~ ____ -r ____ ~ ____ -''-____ r-____ ~100
100 Ba 60 40 20 o
MAGNETITE ILMENITE
Figure 7.13 Plot of magnetite, ilmenite and Mt-ilm£UsPex from selected sediments
related to the Tugela River on the ilmenite-magnetite diagram.
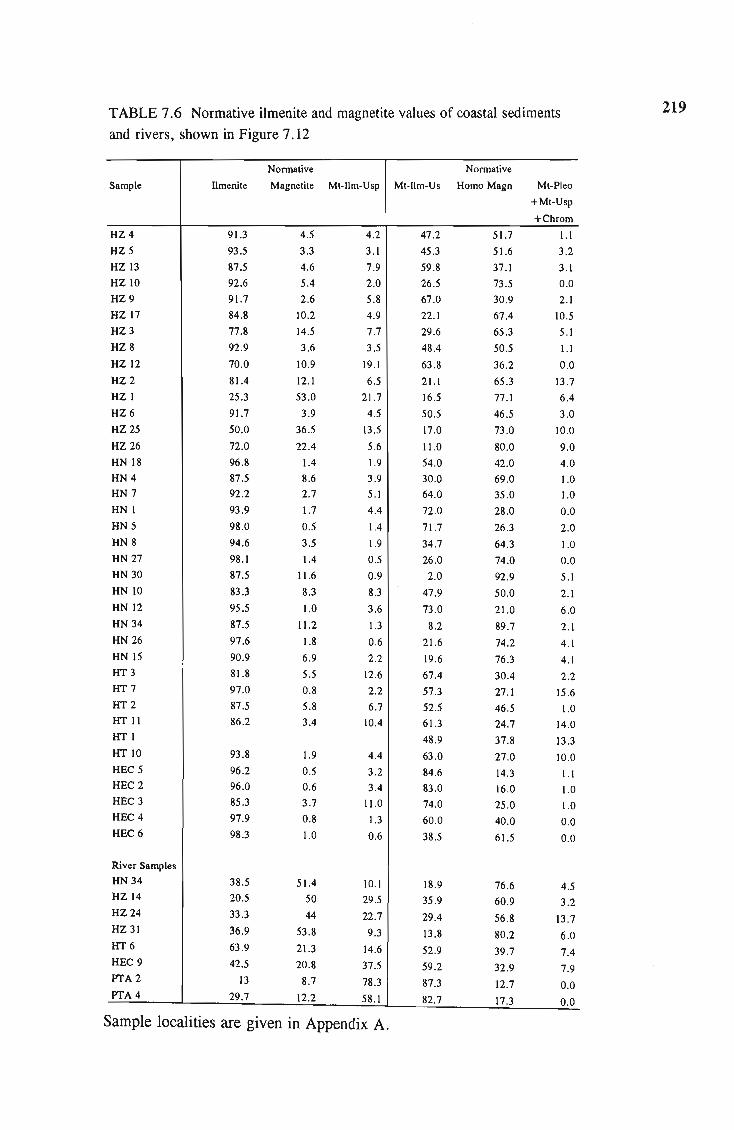
TABLE 7.6 Normative ilmenite and magnetite values of coastal sediments 219
and rivers, shown in Figure 7.12
Normative Normative Sample llmenite Magnetite Mt-Ilm-Usp Mt-Ilm-Us Homo Magn Mt-Pleo
+Mt-Usp
+Chrom HZ4 91.3 4.5 4.2 47 .2 51.7 1.1 HZ5 93.5 3.3 3.1 45.3 51.6 3.2 HZ 13 87.5 4.6 7.9 59.8 37.1 3.1 HZ 10 92.6 5.4 2.0 26.5 73 .5 0.0 HZ9 91.7 2.6 5.8 67.0 30.9 2.1 HZ 17 84.8 10.2 4.9 22.1 67.4 10.5 HZ3 77.8 14.5 7.7 29 .6 65.3 5.1 HZ8 92.9 3.6 3.5 48.4 50.5 1.1 HZ12 70.0 10.9 19 .1 63.8 36 .2 0.0 HZ2 81.4 12.1 6.5 21.\ 65.3 13 .7 HZ 1 25.3 53 .0 21.7 16.5 77.1 6.4 HZ6 91.7 3.9 4.5 50 .5 46.5 3.0 HZ25 50.0 36.5 13 .5 17.0 73.0 10.0 HZ26 72.0 22.4 5.6 11.0 80.0 9.0 HN 18 96.8 1.4 1.9 54.0 42 .0 4.0 HN4 87.5 8.6 3.9 30.0 69.0 1.0 HN7 92.2 2.7 5.1 64.0 35 .0 1.0 HN 1 93.9 1.7 4.4 72 .0 28.0 0.0 HN 5 98 .0 0.5 1.4 71.7 26.3 2.0 HN 8 94.6 3.5 1.9 34.7 64 .3 1.0 HN27 98.1 1.4 0.5 26.0 74.0 0.0 HN30 87.5 11.6 0.9 2.0 92.9 5.1 HN 10 83.3 8.3 8.3 47.9 50.0 2.1 HN 12 95.5 1.0 3.6 73 .0 21.0 6.0 HN34 87.5 11.2 1.3 8.2 89.7 2.1 HN 26 97.6 1.8 0.6 21.6 74.2 4.1 HN 15 90.9 6.9 2.2 19 .6 76 .3 4.1 HT3 81.8 5.5 12.6 67.4 30.4 2.2 lIT 7 97.0 0.8 2.2 57.3 27.1 15.6 lIT 2 87.5 5.8 6.7 52.5 46 .5 1.0 lIT 11 86.2 3.4 10.4 61.3 24.7 14.0 lIT 1 48 .9 37.8 13.3 HT 10 93.8 1.9 4.4 63.0 27 .0 10.0 HEC 5 96 .2 0.5 3.2 84.6 14.3 1.\ HEC2 96 .0 0.6 3.4 83.0 16 .0 1.0 HEC3 85.3 3.7 11.0 74 .0 25 .0 1.0 HEC4 97.9 0.8 1.3 60 .0 40.0 0.0 HEC6 98.3 1.0 0.6 38.5 61.5 0.0
River Samples HN34 38.5 51.4 10.1 18.9 76.6 4.5 HZI4 20.5 50 29 .5 35.9 60.9 3.2 HZ24 33.3 44 22 .7 29.4 56.8 13.7 HZ31 36.9 53 .8 9.3 13 .8 80.2 6.0 lIT 6 63.9 21.3 14.6 52.9 39.7 7.4 HEC9 42.5 20.8 37.5 59.2 32.9 7.9 PTA 2 13 8.7 78.3 87 .3 12.7 0.0 PTA 4 29.7 12.2 58 .1 82 .7 17.3 0.0
Sample localities are given in Appendix A.

Provenance of the iron-titanium oxides 220
7. 7.4 The Magnetite discrimination diagram
The problem caused by the different stabilities of magnetite and ilmenite in rivers and
coastlines may be partly overcome by using a single oxide species to determine provenance
by petrographic means. Grigsby (1990) used variations in magnetite petrography to
distinguish various source rocks. Figure 7.14 is a plot of the magnetite data using ternary
diagram of Grigsby (1990). The diagram indicates that clear distinctions may be made
between magnetites from:
1. mafic and felsic metamorphic rocks;
2. basalt,dolerite and rhyolite;
3. plutonic basic rocks;
4. metamorphosed ultrabasic-basic rocks.
Figure 7.15 is from Grigsby (1990) and shows that the fields for the different rock types
from this study are similar to his fields, although he found more homogeneous magnetite
in his mafic volcanic and ultramafic complexes. Grigsby (1990) used sediments derived
from the source rocks, and not the rocks themselves, to determine his mineral proportions
and this may explain the differences between the two studies. More data is required to
define the fields more accurately.
7. 7.5 Application of the magnetite discrimination diagram
The usefulness of the magnetite diagram was tested by plotting data (Figure 7.16) fmm
the same sedimentary samples used in the ilmenite-magnetite diagram (Table 7.6). Most
of the data plot along the homogeneous magnetite - Mt-Ilm-Usp axis, within the field of
mixing. This suggests that the Karoo Igneous Province (basalts and dolerites) and the
Natal Basement rocks contribute to the magnetite in coastal sediments. A few samples plot
in the field of plutonic igneous rocks and a number of other samples clearly contain
magnetites from metamorphosed basic-ultrabasic complexes. This data is far more
consistent with the results of the magnetite chemistry than the ilmenite-magnetite
discrimination diagram (Figure 7. 11) data. This suggests that the magnetite

Provenance of the iron-titanium oxides 221
discrimination diagram is useful for the interpretation of the effect of provenance on
variations in oxide proportions in coastal sediments. The diagram is also applied in
Chapter 8.
Magnetite
7.14
e ~ BASIC IGNEOUS FIELD
eeoee Basalt and rhyolite ~ ~ ~ ~ ~ Dolerite ***** Granitoid and felsic +++++ Metabasite, mafic met. x x x x x MUSe
, . ,
O~~ __ ~ __ -L __ ~ ____ ~ ______ ~~ __ ~100
100 80 60 40 20 o
Mt-Ilm-Usp Mt-Pleo, Mt-Usp
Figure 7.14 The magnetite discrimination diagram, which is a plot of the relative
proportions of homogeneous magnetite, Mt-IlIl\x,-UsPex and Mt-Pleoex + Mt-UsPex . The
plot clearly shows that different source rocks can be distinguished by the proportions of
magnetite textures.

Provenance of the iron-titanium oxides
Homogeneous grains
Grains with trellisor composite-type ma~netite-ilmenite
mtergrowths
A
Intermediate volcanic
Metamorphosed m aficlultramafic
complexes
Grains with exsolved pleonaste
or Ulvospinel
Figure 7.15 Fields for the different rock-types studied by Grigsby (1990).
7.16
Homogeneous Magnetite
IELD
x x x x x Beaches&: Dunes cc c c c River sediments
MUBe FIELD o 100 ~--------~-----L----'----------r------------r--L ____ -¥ 100 80 60
Mt-IImoe-Uspex 40 20 o Mt-Pleo
Mt-Usp
222
Figure 7.16 Magnetite textural proportions form selected coastal sediments (Table 7.6)
plotted on the magnetite discrimination diagram. See text for explanation.

Provenance of the iron-titanium oxides 223
7.8 CONCLUSIONS
The following conclusions are made from the above study of ilmenites and magnetites in
probable source rocks:
1. Ilmenite from certain rock groups may be distinguished on the basis of chemical
composition, however there are large areas of overlap between ilmenite from basalt
and dolerite, and those from a variety of metamorphic rocks. It is possible that
trace element chemistry may be able to distinguish ilmenites from these rock types.
The only study of trace element chemistry of ilmenite from different rock types
was performed by Borisenko and Lyanpunov (1984), and therefore there is little
data available to substantiate this.
2. A plot of MnO versus MgO, on a log scale, is the best discriminator of ilmenite
provenance, although this diagram effectively only distinguishes ilmenite from
granitoids (and other felsic rocks), and ultrabasic/basic plutonic rocks from other
rock types.
3. Magnetite from basic igneous rocks is readily distinguished from basement rocks
using Al20 3, Ti02, and F~03' Magnetite from granitoids and metamorphic rocks
cannot be distinguished by minor oxide chemistry.
4. Ilmenite and magnetite from the two major, primary provenances can be identified.
In addition, specific source rock types within these areas may be identified using
magnetite or ilmenite chemistry.
5. The petrographic textures of the iron-titanium oxides may be used as a provenance
indicator as the proportions of the different oxide intergrowths vary markedly
between the different major source rocks. In addition, some intergrowths are
found almost exclusively in certain source rocks, providing a clear indication of
provenance.
6. Although discrimination diagrams based on textural proportions distinguish
different source rocks, these diagrams should be used with caution in provenance
interpretation, as the oxide proportions change with transport and weathering.
7. The ilmenite-magnetite diagram is inappropriate for provenance studies, but the
magnetite discrimination diagram has application.

Provenance of the iron-titanium oxides 224
8. The fields drawn on the discrimination diagrams are not absolute, and the addition
of further data will alter the fields.
9. Magnetite in coastal sediments appear to be derived from the basalt and dolerite of
the Karoo Igneous Province and the Natal Basement rocks in approximately equal
proportions.
10. Ilmenite in coastal sediments is derived mainly from the dolerite and basalt of the
Karoo Igneous Province, and the mafic rocks of the Natal Basement. The larger
area of outcrop of the former indicates that more ilmenite is derived from these
rocks.
The dual provenance of ilmenite and magnetite in coastal sediments along the east coast
of South Africa is unique and contradicts authors who state that the provenance of major
heavy mineral placer deposits is metamorphic basement rocks (Baxter, 1977; Macpherson
and Masters, 1983; Force, 1991) .

225
CHAYfER EIGHT
IRON-TITANIUM OXIDE VARIATIONS IN COASTAL SEDIMENTS
8.1 INTRODUCTION
Variations in the proportion, chemical composition and petrographic texture of iron
titanium oxides, and other minerals, in coastal sediments are caused by differences in
provenance; sediment type (eg. beach or dune); age of the deposit; and the physical and
chemical environment of the deposit, which affects the weathering of minerals. This
chapter describes these variations within the study area and evaluates the influence of the
above factors. The effect of regional variations on ilmenite quality is also examined.
Finally, a model is proposed to explain the genesis of the mineral assemblages and the
formation of the heavy mineral deposits.
8.2 V ARIATIONS IN DUNES AND BEACHES
As described in Chapter 3, heavy minerals are found mainly in beach and dune deposits
along the south-east African coast. The major economic heavy mineral deposits are found
in aeolian sediments, but a number of potential deposits have been located in present-day
beaches along the Transkei coast (See Table 3. 1, page 46).
8.2.1 The Heavy Mineral Suites
The average mineral proportions, together with minimum and maximum values, for the
four major geographical regions are given in Table 8.1 and illustrated in Figure 8.1 (full
results are given in Appendix D). The data shows that in nearly all the regions the
ilmenite content is higher in dunes, while the pyribole content is higher in beaches. The
exception is the eastern Cape, where the proportions of these minerals are similar in both
sediment types. Most other heavy minerals are found in the sediments in minor amounts
and little difference in their proportions is noted between the beach and dune sediments.

Table 8.1 Average modal proportions of minerals in the heavy mineral suite from beaches and dunes for each of the four major regions in the study area. The range is given in brackets. Full modal analyses are given in Appendix D.
Mineral HECB HECD HTB HTD HNB HND HZB HZD Grain n=7 n = 5 n=5 n = 8 n = 12 n=8 n=7 n = 10
Ilmenite 38 (15-56) 41 (32-59) 24 (14-36) 41 (23-65) 20 (7-41) 35 (20-52) 15 (5-25) 27 (14-35)
Alt ilmenite 4 (2-7) 4 (2-6) 3 (2-5) 5 (3-10) 4 (2-8) 6 (2-12) 4 (3-7) 8 (4-15)
HAJ 1 (1-3) 2 (1-3) 2 (1-3) 1 (0-2) 2 (1-4) 2 (1-4) 1 (1-3) 2 (1-5)
(Ilm-Hem)ex p p 1 (1-1) P 2 (0-5) 1 (0-5) p (0-1) 1 (1-2)
(Hem-Rut)ox p p p P 1 (0-3) 1 (1-2) P (0-1) 1 (0-3)
Ilm-(Hem-Rut)ox p p p P 1 (0-2) 1 (0-2) P P (0-1)
Leucoxene 6 (2-14) 6 (3-12) 2 (2-3) 3 (1-5) 1 (1-3) 2 (1-4) 3 (1-4) 3 (1-6)
Rutile 5 (3-8) 5 (3-8) 4 (2-4) 3 (2-4) 2 (1-3) 2 (1-4) 2 (1-3) 3 (2-5)
Magnetite 4 (1-9) 4 (1-7) 4 (2-8) 4 (2-7) 3 (1-8) 2 (0-6) 3 (1-5) 4 (2-8)
Chromite p p p p p p p P (0-1)
Hematite 1 (0-2) 1 (1-1) 1 (1-2) 1 (1-2) 5 (0-19) 2 (0-7) 1 (0-3) 2 (1-4)
Goethite p (0-1) p P 1 (0-9) 1 (0-2) 2 (0-8) 1 (0-4) 1 (0-4)
Zircon 10 (5-18) 8 (5-12) 5 (3-7) 5 (2-10) 4 (1-6) 4 (2-8) 5 (2-8) 8 (3-12)
Monazite 1 (0-1) P P P P P P (0-1) 1 (0-3)
Pyribole 24 (9-38) 22 (10-31) 51 (43-65) 33 (8-67) 44 (10-67) 34 (2-50) 61 (44-75) 36 (23-64)
Garnet 7 (5-10) 5 (3-8) 5 (3-8) 4 (2-7) 11 (2-17) 7 (1-15) 4 (2-5) 3 (1-5)
Apatite 2 (0-4) P P p P P (0-2) P P Tourmaline 1 (0-2) 1 (0-2) P P (0-2) P P (0-2) 1 (0-2) P Epidote p (0-1) p p p p p P (0-2) 1 (1-2)
HEC B = East Cape beaches; HEC D = East Coast dunes; HT B = Transkei beaches; HT D = Transkei Dunes; HN B = Natal beaches; HN D = Natal dunes; HZ B = Zululand beaches; HZ D = Zululand dunes. HA! = Highly altered ilmenite; Pyribole = pyroxene & amphibole; p = often present, but less than 1 per cent of heavy mineral suite. Sample HZ 1 has been excluded from the average of the Zululand beach samples because it contains very high proportions of magnetite.
N N e-.
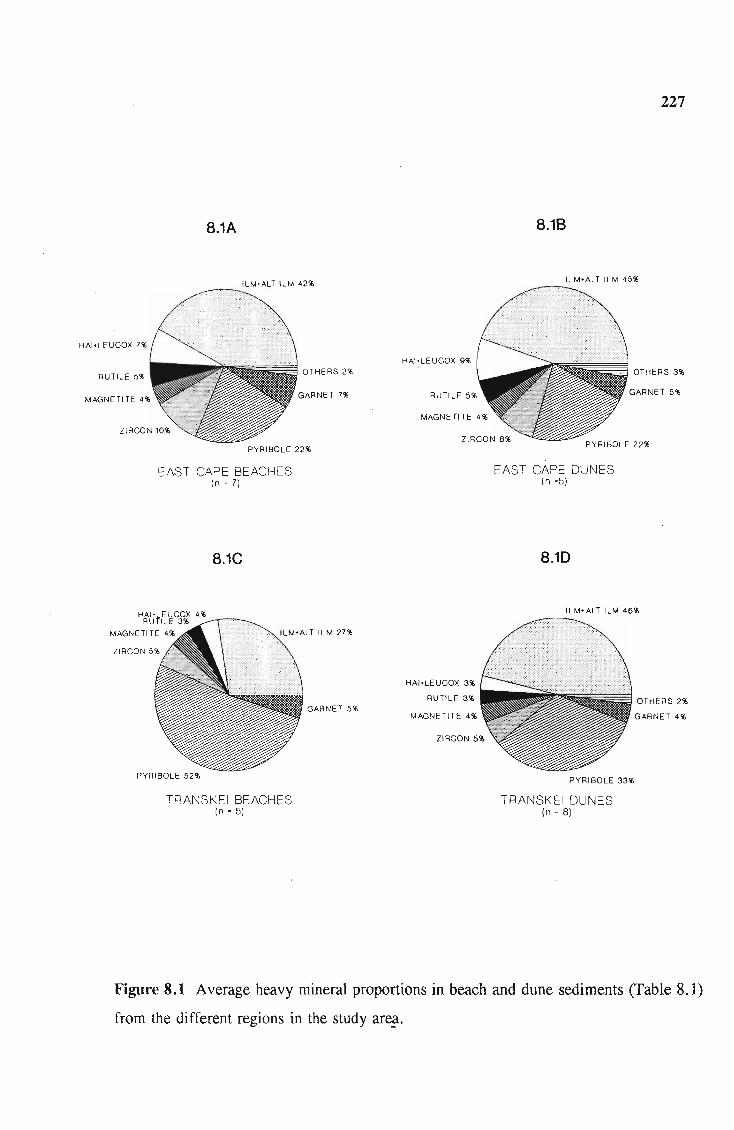
HAI' LEUCOX 7%
RU TILE 5%
8.1A
ILM.ALT IL M 42%
OTHERS 2%
GARNET 7%
PYRIBOLE 22%
EAST CAPE BEACHES In " 7)
8.1C
PYRIBOLE 52%
TR ANSK EI BEACHES In " 5)
HAI+LEUCOX 9%
HAI +LE UCOX 3%
RUTIL E 3%
MAGNETITE 4%
227
8.18
ILM+ALT ILM 45%
OTHERS 3%
PYRIBOL E 22%
EAST CAPE DUNES In "5)
8.1D
ILM+ALT ILM 45%
PYRIBOLE 33%
TRANSK EI DUNES (n = 8 )
OTHER S 2%
GARNET 4%
Figure 8.1 Average heavy mineral proportions in beach and dune sediments (Table 8.1)
from the different regions in the study area.

HAI'LEUCOX 4%
RUTILE 2%
8.1E
OTHERS 9%
NATAL BEACHES (n = 12)
8.1G
ILM+ALT ILM 19%
MAGNETITE 3%
ZIRCON 5%
ZULULAND BEACHES (n = 7)
HAI.LEUCOX 3%
RUTILE 2% MAGNETITE 2%
Z IRCON 4%
8.1F
228
ILM'ALT ILM 41%
OTHERS 6%
PY RIBOLE 34%
MAGNETITE 4%
ZIRCON 8%
NATAL DUNES (n = 11 )
8.1H
PYRIBOLE 36%
ZULULAND DUNES (n = 10)
Figure 8.1 (Cont.) Average heavy mineral proportions.

229
8.2.2 Grain size distribution and mineral proportions
The deposition of sediment in beaches and dunes is caused by very different mechanisms.
The energy of wave and current action is far greater than that of wind, thus beaches
contain coarser sands than dunes. Prevailing onshore winds winnow the finer sediment
from beaches or exposed continental-shelf sediments during periods of marine regression,
forming well-sorted aeolian sands. Rubey (1933), in developing the theory of hydraulic
equivalence, noted that the proportions of heavy minerals is dependent on the mean grain
size of the sediment. Differences in the energy of beach and dune sediments, and hence
their grain size distribution, is expected to influence their heavy mineral suites.
The grain size distributions of beaches and dunes were studied to investigate the effect of
the energy of deposition on variations in their heavy mineral suites. The grain SIze
distribution of the sediment sample, and its corresponding heavy mineral suite, was
determined by screening (Table 8.2). The grain size distributions were plotted on
cumulative frequency curves, from which the mode (<Iso) was read. From Table 8.2 it is
noted that the coarsest dune sediment is derived from the coarsest beach and the same
applies to the finest beach and dune sediments. This indicates that the grain size of the
dunes is related to both the strength of the prevailing on-shore winds and the grain size of
the source sediment.
Figure 8.2A shows that the grain size distribution of the heavy mineral suite is related to
that of the host sediment. A positive, linear correlation is observed, when dso (the mode)
values are compared (Figure 8.2B). This indicates that the grain size distribution of the
heavy mineral suite is strongly dependent on the grain size of the sediment containing the
heavy minerals.
The grain size distributions of garnet and pyribole were determined by point-counting their
proportions in different size fractions of a heavy mineral concentrate from Richards Bay,
and their cumulative distributions are given in Table 8.3, together with data from Fockema

KEY TO TABLE 8.2
Sample No. Locality
HEC 7 Morgan's Bay
HEC 6 Morgan's Bay
RT8 Sandy Point
HT 3 Port St lohns
RN 11 Hlatimi
RN 14 Port Shepstone
RN 18 Mzumbe
HZ 25 Mtunzini
HZ 26 Mtunzini
RZ50 Richards Bay
HZ 13 Sodwana Bay
HMS = Heavy Mineral Suite
ILM = Ilmenite concentrate
Sediment Type
. Beach
Dune
Dune
Beach
Beach
Beach
Dune
. Beach
Dune
Dune
Dune

Iron-titanium variations in coastal sediments 230
Table 8.2 Grain-size analysis of selected samples. Recorded as cumulative per cent passing.
Sample Screen size in '\lm.
710 500 355 250 ·180 125 90 ·63 50 d 50
HEC7 0.0 0.0 0.0 2.7 41.7 87.8 97 .2 99.9 100.0 170
HEC7HMS 0.0 0.0 0.6 5.7 18.2 54.2 97.9 100.0 100.0 130 HEC7 ILM 0.0 0.0 0.0 0.8 5.0 28.3 80.0 100.0 100.0 120 HEC6 0.0 0.0 0.2 1.6 31.1 87.8 97.7 100.0 100.0 165 HEC6HMS 0.0 0.0 0.0 0.7 5.3 36.2 86.2 98.9 100.0 120
HEC6ILM 0.0 0.0 0.0 0.0 0.5 16.4 90.2 100.0 100.0 120
HT8 0.0 0.0 0.0 0.5 20.9 62.4 93 .8 100.0 100.0 180
HT 8 HMS 0.0 0.0 0.0 0.1 4.7 39.9 91.0 100.0 100.0 118
HT3 0.0 0.1 2.3 26.2 71.7 93.3 99.4 99.9 100.0 215
HT3 HMS 0.0 0.0 2.9 21.1 56.2 87.5 98.9 100.0 100.0 190 HN 11 1.1 8.0 29.5 72.5 93.7 98.9 99 .9 100.0 100.0 310 HN 11 HMS 0.0 0.0 7.8 42.4 75.5 95 .2 99.9 100.0 100.0 200 HN 14 0.4 5.5 35.0 84.9 98.5 99.9 100.0 100.0 100.0 325 HN14HMS 0.0 2.2 17.6 66.0 95.3 99.5 99.9 100.0 100.0 280 f~N 14 ILM 0.0 0.0 0.0 3.2 35.7 79.2 99.0 100.0 100.0 160 HN 18 0.0 0.1 0.3 8.6 58.8 90.4 99 .2 99.8 100.0 190 HN18HMS 0.0 0.0 0.0 1.3 15.3 67.4 98.2 100.0 100.0 140 HZ25 2.0 13.5 41.9 79.1 97.0 99.7 99.9 100.0 100.0 330 HZ25 HMS 0.0 3.8 29.1 52.5 67.6 84.7 98.2 100.0 100.0 255 HZ26 0.0 0.8 5.9 31.0 78.7 95.8 99.0 100.0 100.0 225 HZ26 HMS 0.0 1.3 4.4 16.3 62.0 90.3 95.0 99.0 100 200 HZ 19 0.0 0.3 1.9 19.3 72.1 90.7 98.4 99.5 100.0 210 HZ 19 HMS 0.0 0.0 0.1 0.8 8.0 39.5 92.8 100.0 100.0 135 HZ50 1.1 3.6 22.6 62.8 89.4 98.4 99.6 100 100 280 HZ50HMS 0.5 0.8 2.8 10.5 45 .9 77 94.5 100 100 170 HZ50ILM 0.0 0.0 0.0 1.4 5.0 42.9 95 .9 99.8 100.0 130 HZ 13 0.0 0.5 5.0 28.5 75.2 90.4 96.1 100.0 100.0 220
See Key for sample descriptions.

<fi-
~ w >
~ ::J ~ ::J U
-E ::J -Cl)
~ ::c LL 0 0 LO "'C
8.2A 100
90 ~--+--+-+--+.--!--t--+-; -+1---+-1 _.-4 of: I I 1/ 80
70
60
50
40
30
20
10
I I'J I.tl / i If Ij: 1 / If! :!
If v II !
/ JI Vi /1
./' if I'i .. '*- i I " ,I' I
~b=1 C::-~v:::l~ , 0~~-4--~~~~~~-+~~+--+~~
--HT8
--. --HT8H -.+E
HN18
--* --HN 18 H
-+-HZ26 --+.-HZ26 H
-700-650 -600 -550 -500 -450 -400 -350 -300 -250 -200 -150 -100 -50 GRAIN SIZE (urn)
8.28 350~--------------------------------------,
300
• 250 •
200 • • • •
150 • • •
• • 100
150 175 200 225 250 275 300 325 350 d50 OF SEDIMENT (urn)
231
Figure S.2A. Cumulative frequency distribution curves for sediments and their respective
heavy mineral suites (HMS). Sample localities are given in the key to Table 8.2. B. A
plot of the dso of the HMS versus their host sediment, illustrating the positive correlation
between the grain size of the heavy minerals and sediment.

Iron-titanium variations in coastal sediments 232
(1986) . This table shows that the grain size of garnet and pyribole is distinctly larger than
that of ilmenite, rutile and zircon. The amount of ilmenite decreases with increasing grain
size of the heavy mineral suite, while there is an antipathetic increase in pyribole content
(Figure 8.3). This confirms the findings of Force and Stone (1990), who determined that
for a common supply, the proportion of a heavy mineral in the sediment is dependent on
the grain size of that mineral in comparison to the grain size of the sediment.
Variations in the relative proportions of heavy minerals from the same provenance, in the
beach and dune sediments are caused by selective sorting of these minerals according to
the energy of the depositional environment. Ilmenite, zircon and rutile being finer-grained
than pyribole, are concentrated in finer sediments. As dunes tend to be finer-grained than
beaches, these sediments often contain higher proportions of ilmenite, zircon and rutile.
Table 8.3 Grain size distribution of selected heavy minerals from Richards Bay,
expressed as cumulative per cent retained.
Screen Size Ilmenitel Rutilel Zirconl Garnet Pyribole (jLm)
600 2 0.4
400 12.5 2.4
355 19.8 6.5
250 0.3 0.2 0.9 48.6 22.6
212 1.1 0.6 1.9 64.9 32.6
180 3.6 3.4 7.3 78.8 53.1
150 15.4 20.5 30.2 89.2 67.2
125 34.3 47.2 56.3 97.4 85.7
106 82.4 83.0 86.8 100.0 97.8
90 94.1 93.6 95.8 100.0
75 99.7 98.6 99.3
-75 100.0 100.0 100.0
I Grain size analysis from Fockema (1986)

Iron-titanium variations in coastal sediments 233
8.3 80
+ 70
Cl) 60 -::2: • J: 50 • +
z + + .....J + ~ 40 +
w • z .30 • ::2:
* 20 + I • 10 + ++
• 0 100 125 150 175 200 225 250 275 300
d50 OF HMS (urn)
• IIrnenite + Pyribole
Figure 8.3 Plot of ilmenite and pyribole proportions in the heavy mineral suites given in
Table 8.2 versus the dso of the HMS. The plot illustrates the antipathetic behaviour of
ilmenite and pyribole with increasing grain size. Modal proportions of the minerals are
obtained from Appendix D.

Iron-titanium variations in coastal sediments 234
8.2.3 Iron-titanium oxide differences
Figure 8.4 compares the proportions of iron-titanium oxides (calculated from Table 8.1)
in the beaches and dunes for each region. Selective sorting of the iron-titanium oxides by
wave or wind action is not expected as the minerals have similar densities and grain sizes.
Little difference is noted between the sediment types, although the dunes contain more
ilmenite and the beaches have more magnetite. The Natal samples (Figures 8.4E and
8.4F) are an exception, as the beach samples contain over 50 per cent more "other oxides"
- notably hematite (see Appendix F) - than the dunes.
The proportions of ilmenite and its alteration products in the beach and dune sediment
provides further evidence for the mUlti-stage alteration of ilmenite in the coastal sediments,
described in Chapter 6. The beaches contain similar proportions of altered ilmenite grains
to the dunes (Figure 8.4). In addition, certain regions, notably the eastern Cape (Figures
8.4A and 8.4B), contain higher proportions of highly altered ilmenites and leucoxenes than
altered ilmenite grains, and this is more common in the beach sediments. This may be
interpreted in two ways:
1. Assuming the dunes are formed by sand derived from beaches and exposed shelf
sediment, then much of the extensively altered ilmenites is not formed in situ in the
dunes, but is re-worked from other sources.
2. Conversely, the highly altered grains in the beaches may be partly derived from
dunes which have been partially eroded during the Flandrian Regression (Johnson,
1986).
Neither interpretation can be proven using the existing data, but both indicate that mixing
of unaltered and altered ilmenite has occurred prior to final deposition in the dunes.

8.4A
iE~~!Ijjj_ OTHERS 2%
HAI+LEUCOX 12% RUTILE B%
EAST CAPE BEACHES (n • 7)
8.4C
ILMENIT E 59% '
ALT tLM 7%
OTHERS 5%
RUTt LE 7% MAGNETITE 10%
TRANSKEI BEACHES (n • 5)
8.48
7l~~~~~ OTHERS 2%
HAI+LEUCOX 14%
EAST CAPE DUNES (n • 5 )
8.40
HAI+LEUCOX 5i> RUTILE 5i>
TRANSK EI DUNES (n • 8)
ALT tLM 6%
235
Figure 8.4 Average iron-titanium oxide proportions in beach and dune sediments from
the different regions in the study area.

HAI+LEUCOX 10%
HAI+LEUCOX 13%
8.4E
ILMENITE 48%
ILM-HEM 5% ALT ILM 10%
NATAL BEACHES (n = 12)
8.4G
ILMENITE 48%
MAGNETITE 10%
ZULULAND BEACHES (n = 7)
OTHERS 8%
HAI-LEUCOX 10%
8.4F
OTHERS 8%
NATAL DUNES (n = 11)
8.4H
ILMEN ITE 53%
MAGNETITE 6% ILM-HEM 2%
ZULULAND DUNES (n = 10)
236
ILM-HEM 2%
MAGNETITE 4%
RUTILE 4%
HAI'LEUCOX 6%
OTHERS 8%
Figure 8.4 (Cont.) Average iron-titanium oxide proportions in beach and dune sediments

Iron-titanium variations in coastal sediments 237
8.3 V ARIA TIONS BETWEEN SEDIMENTS OF DIFFERENT AGES
Heavy minerals in two older aeolian formations were examined to determine the effect of
age on the heavy mineral suite. These are the red-brown dune ridges, commonly referred
to as the Berea Formation, and the aeolian sequence of the Upper Port Durnford
Formation (described in Chapter 3).
8.3.1 Differences in the heavy mineral suites
The proportions of the minerals in the older sediments are given in Table 8.4. The heavy
mineral suite of the different sediments are compared in Figure 8.5, which indicates that
the red dunes and Port Durnford sands have higher proportions of ilmenite (and altered
ilmenite) and zircon, but lower pyribole contents than the Late Pleisocene - Holocene
dunes from Zululand and Natal. The Port Durnford samples also contain slightly higher
rutile contents (Figure 8.5C). The magnetite content of all three sediment types is similar
(Figure 8.5D), although the Port Durnford samples contain little magnetite.
The Port Durnford Formation and red dune sands have slightly finer grain SIze
distributions than the Holocene dunes (Beckering Vinckers, 1986) and the higher
proportions of ilmenite, zircon and rutile may be caused by selective sorting of heavy
minerals. The highly weathered nature of the older dunes suggests that enrichment of the
stable heavy minerals is caused by the removal of ferromagnesian silicates by weathering.
8.3.2 Influence of age and weathering on ilmenite alteration
Many authors have noted that ilmenite alteration increases with the age of the deposit (for
example, Temple, 1966; Baxter, 1977; Force, 1991). Given the weathered nature of the
older dunes on the Zululand coastal plain, it is expected that the ilmenite in these
sediments will be more altered than in the Late Pleistocene-Holocene dunes.

Sample
HT 12
HN 13
HN 16
HN 19
HN22
HN23
HN24
HN25
HN28
HN31
HN 35
HZ27
HZ 18
HZ 19
HZ40
HZ 41
HZ42
HZ 30
HZ43
HZ44
HZ45
HZ46
HZ47
HZ9
HZ5
HZ21
HZ22
HZ23
HZ23
HZ 51
HZ52
KEY TO SAMPLE WCALITIES IN TABLE 8.4
Locality
Xamani
Htatimi
Port Shepstone
Mzumbe River mouth
Umkomaas
Durban North
U mhlanga Rocks
Ballito Bay
Tinley Manor
Blythedale Beach
Zinkwazi
Mtunzini
Port Dumford
Richards Bay
False Bay, St Lucia
Ridge west of Tshongwe, Zululand coastal plain
Tshongwe
Richards Bay
Lake Sibayi
Lake Sibayi
Sodwana Bay
Charter's Creek, St Lucia
Dukuduku Forest
Mission Rocks
Cape St Lucia
Richards Bay
Richards Bay
Richards Bay
Richards Bay
Richards Bay
Richards Bay

Table 8.4 Proportions of heavy minerals in red dunes and the Port Dumford Formation, determined by point-counting 500 grains per sample (See key for sample localities; sample descriptions are given in Appendix A.2).
Grain Type Pliocene-Pleistocene Red Dunes
HT12 HN13 HN16 HN19 HN22 HN23 HN24 HN25 HN28 HN31 HN35 HZ27 HZ18 HZ19 HZ40 HZ41 HZ42
Ilmenite 52 71 52 64 46 62 55 59 63 66 68 54 50 51 49 37 54
Alt ilmenite 14 3 7 6 7 6 8 10 6 6 5 8 12 9 11 5 8
HA! 2 P 3 1 2 1 2 2 1 2 2 3 1 1 2 1 3
(Ilm-Hem)ex p p 1 1 2 1 2 3 1 1
(Hem-Rut)ox p 1 1 1 P 1 1 1 P 1 4 1 1
Ilm-(Hem + Rut)ox p p 1 P 1 P 1 1 1 1
Leucoxene 4 3 3 2 6 3 8 3 3 2 4 1 1 2 9 3 3
Rutile 9 5 2 2 6 5 6 6 3 2 3 3 5 3 6 4 6
Magnetite l 3 4 2 2 5 2 3 1 3 1 1 6 7 3 1 17 7
Chromite p p p 1 1 P P P P 1
Hematite 2 1 1 2 1 2 3 3 3 5 4 2 1 1 1
Goethite 1 1 4 3 5 1 2 1 2 2 P 1 1 1 2 3
Zircon 12 9 21 15 10 13 11 10 10 8 8 13 11 13 7 9 11
Monazite 1 p P P 1 1 1
Pyribole 4 1 2 9 1 2 1 2 2 1 2 1 11 5 14 5
Garnet 1 1 2 P 1 P 1 P 1 1 1 P 1 1 2
Apatite
Tourmaline 1 2 1 1 2 2 2 1
Epidote 1
1 includes Mt-IlIIlue-UsPex' Mt-UsPex' and Mt-Pleoex-IlIIlue grains; P = less than 1 per cent; - = less than 1 in 500 grains.
N ~ QC

Table 8.4 (cont.) . Proportions of heavy minerals in beaches and dunes, determined by point-counting 500 grains per sample.
Grain Type Pliocene-Pleistocene red dunes Port Durnford Formation
HZ30 HZ43 HZ44 HZ45 HZ46 HZ47 HZ9 HZ5 HZ21 HZ22 HZ23 HZ51 HZ52
Ilmenite 40 30 5 28 43 28 33 29 6 14 6 8 12
Alt ilmenite 13 40 49 4 21 8 8 16 55 54 64 43 38
HAJ 1 2 2 2 5 2 3 3 3 1 4 8 12
(Ilm-Hem)ex 2 1 1 1 P P
(Hem-Rut)ox p p 1
Ilm-(Hem + Rut)ox 1 1 P Leucoxene 1 4 11 1 6 5 2 3 11 8 5 8 8
Rutile 2 6 9 2 7 3 3 4 9 7 3 10 8
Magnetitel 3 4 3 2 1 P 0 2 3
Chromite p p p
Hematite 1 1 1 3 1
Goethite 5 1 45 P
Zircon 8 12 17 7 9 4 5 7 10 11 12 15 13
Monazite p 1 1 1 P 1
Pyribole 28 6 7 40 5 4 32 30 2 4 3 3 1
Garnet 3 3 2 1 4 3 1 P P 2 4
Apatite p
Tourmaline p 1 P 1
Epidote 1 p 1 P 1 P
I includes Mt-IlIl\,.,-Uspex. Mt-Uspex. and Mt-Pleoex-IlIl\,., grains; p = less than 1 per cent; - = less than 1 in 500 grains.
N w \C

Iron-titanium variations in coastal sediments 240
The influence of age and weathering on the alteration of ilmenite is examined in Figure
8.6, where the proportions of fresh and altered ilmenite are compared. Ilmenite in the
Port Dumford Formation sands is much more altered than in the Late Pleistocene -
Holocene sediments. In contrast, most of the red dunes contain no more altered ilmenite
grains than the Late Pleistocene-Holocene dunes. The levels of highly altered ilmenite
(Figure 8.6B), and leucoxene (Figure 8.6C) are also similar in these older and younger
dunes.
The greater proportion of altered ilmenite in the Port Dumford Formation is confirmed by
XRF analysis of ilmenite concentrates produced from the different dune types (Table 8.5).
Ilmenite from the Holocene and red dunes have similar compositions, whereas the Port
Dumford ilmenite has a higher Ti02 content of about 55 per cent and lower FeO, clearly
indicating that alteration has occurred.
Table 8.S Chemical compositions of ilmenite concentrates from Late Plesitocene-
Holocene, Port Dumford Formation and Old Red dunes. Analyses by XRF in RBM
laboratories.
Sample Description Ti02 FeO I MgO MnO Number
HN5 Holocene dune - Isipingo 48.3 45 .8 0.65 1.12
HZ7 Holocene dune - Mission Rocks 48.3 45.9 0.63 1.22
HZ 17 Holocene dune - Richards Bay 49.1 45.2 0.57 1.3
HZ 18 Red dune - Umhlatuze 49.7 46.2 0.81 0.92
HN28 Red dune - TinIey Manor 50.5 45.9 0.51 0.88
HZ 30 Red dune - Richards Bay 50.9 45.4 0.62 0.90
HZ 21 Port Dumford Formation - Richards Bay 54.2 40.8 0.61 0.72
HZ22 Port Dumford Formation - Richards Bay 55.3 39.8 0.45 0.62
I All iron reported as F eO
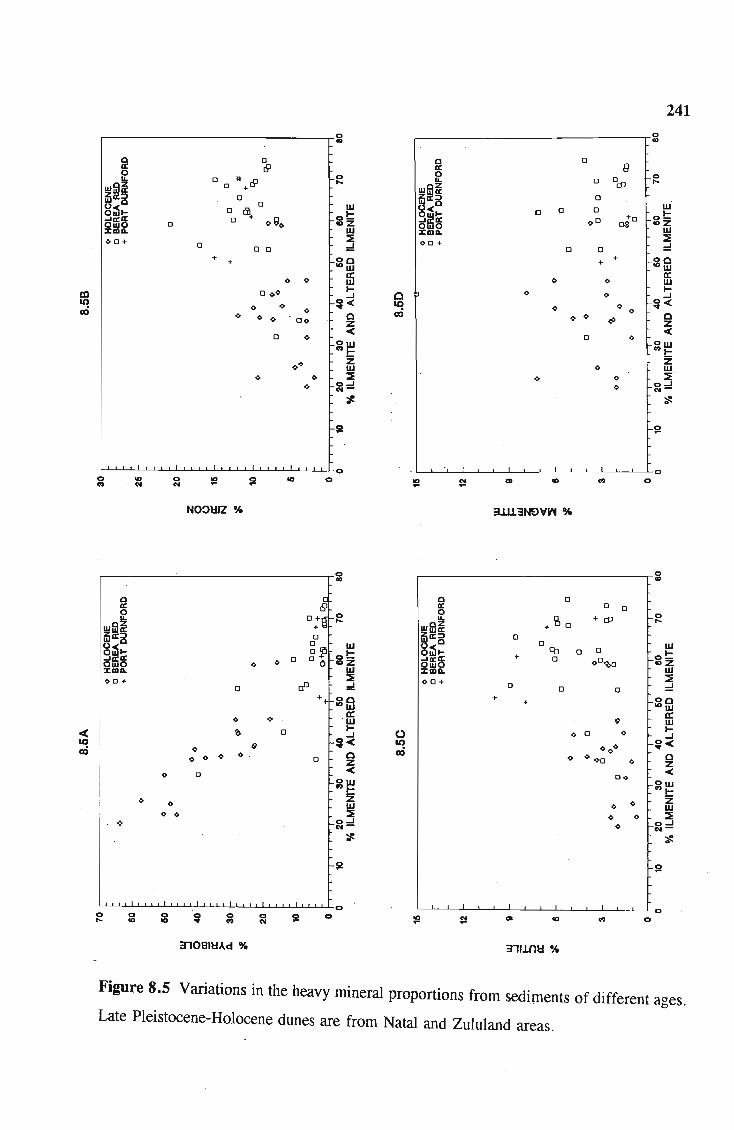
241 0 0 co co
0 0 9
0 0 a: a: 61 0
odJ 0 0 0 ... 0 .... 0 '11
+61 ....
wfa~ wfil! 0
0 ffia: 0 ffia::l w 0 w O·~t [J 0 [J
Ot:: 8:i ... 0 t5l+ :i!~ o ...
<>0 0$0 Oe<> -'a: a: 40Z 6153 0 OwO w 0 W XIDIL
~ XIDIL
~ 00+ :::! 00+ 0 :::! [J 0 o 0 + 00 + 00 + tOw + tOw
a: ffi 0 0 w <> <> I-... <> <> ...I III 0<><> ...I 0
<> ~-< ~-< 10 <> 0
10 0 0
<> cO <> <> a cO 0 <> <> a «> Z 0<> Z -< -< 0 0 0 0 ow °w "'1-.., ... Z
0 0 Z <> w w
0 ~. <> <> ~
<> 0...1 0...1 ... -<> .,.-tI- tI-
li ~
i -.l 0 0 .., 0 ~ Cl> co 0 to 0 \9 ~ 10 0 \9 .., ... ... NOOl:llZ % :uu.3NeVW .~
0 0 co GO
~ 0 0 0 a: 0 0 a: 0
+ cP 0 0 0:8
0 ... + ~ 0
.... ... wfa~ wfil! 0 ffia: 0 ~a:5 0 w 0 w :i ... Cb 0 0 ot:: 8~ ... o~ ot:: + 0 <>o~o
0+ 6ffi~ 40Z -,w3 0 0 0 coz w 015 0 w XIDIL
~ XIDIL
~ <>0+ :::! 00+
aD :::! 0 0 0 0 + 00 +
~fiI + tOw a: a:
9 w <> 0 w ... ... Q <> 0 <> ...I cC ~ 0 ...I ~-< ~-< 10
00<> 10
~ cO a cO <> a <> 000 0 Z <> <> 0 o 0 Z
-< -< 0<>
°w <> 0
°w .., ... .., ... z z
0 0 w 0 <> w ~ ~ 0 0 <> <>
<> 0...1 0...1 ... -0 .,.-tI- ~ .
li ~
i .J. 0 0 0 \9 ~ Cl> 40 0
0 0 0 0 0 0 ~ ... 40 10 .... .., .,.
31081l:1Ad % 311J.nl:l %
Figure 8.S Variations in the heavy mineral proportions from sediments of different ages.
Late Pleistocene-Holocene dunes are from Natal and Zululand areas.
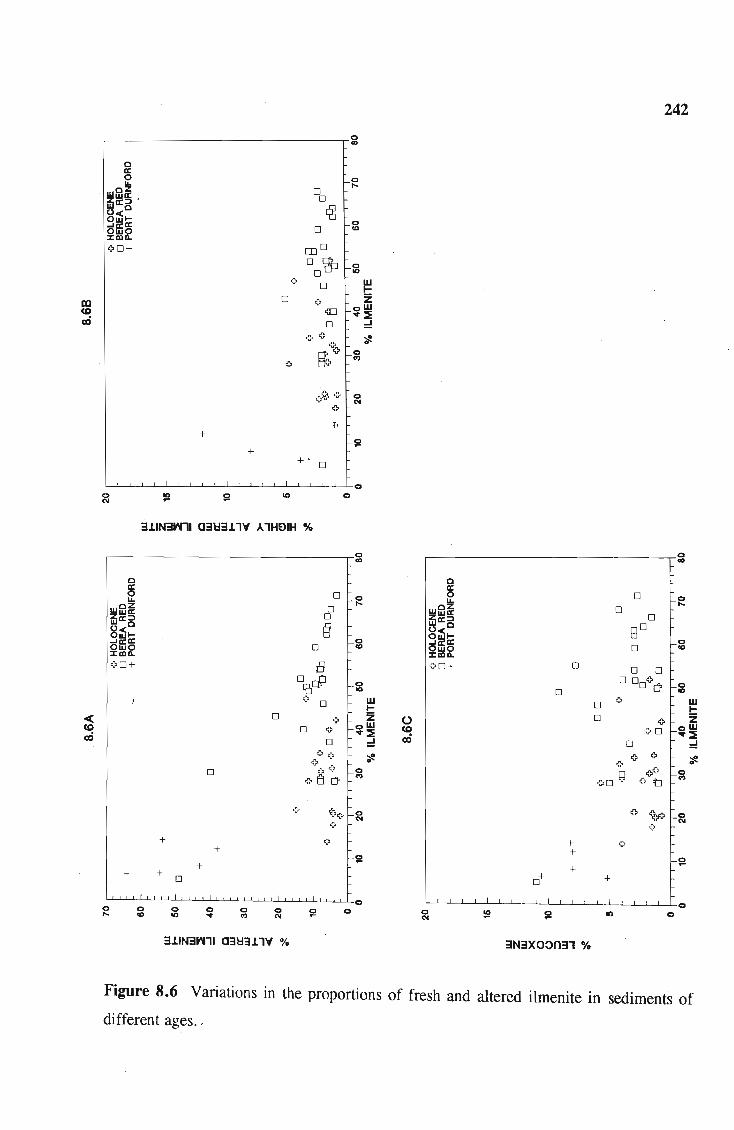
m CQ
ui
< CQ
ui
242
0 CD
f-~ 0
0
~ 0 f-~
o
~o 0 t'I
0
+ +
\2 +
++ 0
I I 0
0 ~ \2 10 0 (\j
3~IN3nll a3t13~ 1"1 A lHDIH %
0 CD 0
CD
0 0 a: a:
0 0 0 0 L&. L&. ...
wOz wOz 0 zwa: zwa: 0 wa:::J wa:::J g o 0 0<0
O~I-Owl-f-~ ...la: a: ...I a: a:
0 OwO OwO J:1IlD.. J:1IlD..
0 f-~
0 0
BD
0 I-~
00+ 8 00+
009 f-~ ID
° 0 W I-
0 0 z 0 0 0 f-ow CQ
.... :::E ui 0 ::! 00 ',/. ° 0 0 0
o ~ Ll' ..,
0 0 0
o 000Ll' 0 0 10
0 0 W l-
D °
Z 00 oW
.... :::E 0 ::!
° ° ::.!! 0 0
00 g 0 0 f-~
0'tJ
0 <i?o I-~ 0
+ 0 +
1-\2 +
+ + 0
+ +
+ 0+ +
I I I 0
0 0 0 0 0 0 l2 0 0 ..... CD Il) .... (') N (\j
I I
:2 S! 10 o
3~IN3nll a3t13~lV % 3N3XOOn31 0/0
Figure 8.6 Variations In the proportions of fresh and altered ilmenite in sediments of
different ages._

Iron-titanium variations in coastal sediments 243
8.3.3 Reasons for differences in alteration
Miller and Folk (1955) noted that ilmenite and magnetite are common heavy minerals in
redbeds, but are absent in greenish-coloured reduced beds within the redbed sequences.
They concluded that ilmenite and magnetite are stable under oxidising conditions, but are
dissolved under local reducing conditions after deposition. Dimanche and Bartholome
(1976) noted that the stability of ilmenite, hematite and magnetite is dependent on the pH
and Eh of ground water, and showed that hematite and magnetite will dissolve under acidic
and reducing conditions, whereas ilmenite will alter under acidic conditions.
The colouration of the red dunes is caused by iron hydroxide coatings on sand grains
(Hammerbeck, 1976; Du Preez, 1978; McCarty, 1988b), which were formed by the
intense weathering of ferromagnesian silicates during wet, hot climatic · conditions
(McCarthy, 1988b). The weathering of silicate minerals is also responsible for the high
clay contents of these sediments. This re-precipitation of iron-hydroxides indicates that
weathering in these sediments proceeded under oxidizing conditions, where ilmenite,
hematite and magnetite are stable. In addition, the iron-hydroxides form coatings around
the ilmenite grains, which may prevent further alteration (Lissiman and Oxenford, 1973;
Baxter, 1986).
The Upper Port Dumford Formation also contains high clay contents from in situ
alteration of silicates. In the Richards Bay area, the Port Dumford Formation occurs
below the water table (Fockema, 1986), and the white, leached appearance of the
sediments is due to the removal of iron by acidic, reducing ground waters. These acidic
and reducing conditions cause magnetite and hematite to dissolve and ilmenite to alter, as
noted by Dimanche and Bartholome (1976).
The age of the two sediment types is similar and some of the red dunes may be older than
the Port Dumford Formation. The unaltered nature of the ilmenite in the red dunes
indicates that ilmenite will be preserved in sediments if the Eh and pH are sufficiently

Iron-titanium variations in coastal sediments 244
Furthermore, the data indicates that the alteration of ilmenite is more dependent on the
physical conditions within the sediment than on the age of the deposit.
8.4 PROVENANCE AND REGIONAL V ARIA TIONS
Iron-titanium oxides in coastal sediments are ultimately derived from two major source
areas - the Karoo Igneous Province and the Natal Basement rocks. The oxides are also
re-worked from intermediate sandstones and unconsolidated sands. Source rocks of the
Karoo Igneous Province are found throughout the study area, but those of the Natal
Basement have a much smaller area of outcrop and are found only in Natal and southern
Zululand. Figure 8.4 (page 235) showed that the proportions of iron-titanium oxides in
beaches and dunes from the same regions are similar, but that regional variations exist.
The extent to which the provenance of the iron-titanium oxides influences these regional
variations is investigated here. Both beach and dune samples are studied, but the former
are expected to be a closer reflection of the provenance, as these have suffered less
mechanical break-down by transportation and sediment re-working.
8.4.1 The influence of provenance on chemical composition
As shown in Chapter 7, ilmenite from different source rocks can be identified using its
MnO and MgO contents (see Figure 7.6, page 198). Ilmenite analyses from individual
samples within the different regions are plotted in Figure 8.7. All the regions, and most
samples studied, contain ilmenite derived from each of the 3 distinguishable source groups.
In general, the variation of ilmenite MnO and MgO content is similar for each of the
regions. Ilmenite from the eastern Cape (Figure 8.7 A) and the Transkei (Figure 8. 7B) fall
within the basic igneous/metamorphic and the basic plutonic fields and only a small
number of grains are derived from granitoid or felsic rocks. Natal (Figure 8.7C) and
Zululand (Figure 8.7D) contain more ilmenite derived from granitoids and felsics,
suggesting that the influence of these rocks is greater in these areas due to the outcrop of
Natal Basement rocks.

Iron-titanium variations in coastal sediments 245
Average compositions of ilmenite from the different regions (Table 8.6) are very similar.
There is a slight increase in MnO, and corresponding decrease in MgO, from south to
north, but otherwise there is little difference in ilmenite compositions along the coastline.
This is probably because the majority of ilmenites have low MgO and MnO contents and
are close to the ilmenite end-member in composition. There is little regional variation in
ilmenite chemistry and provenance has only a minor influence.
It was shown in Chapter 7 that magnetites from different source rocks could be identified
by their chemical compositions (Figure 7.9, page 207). The variations in chemistry from
different regions are shown in Figure 8.8, which clearly shows that magnetites in the
eastern Cape (Figure 8.8A) and Transkei (Figure 8.8B) are derived almost exclusively
from the basic igneous rocks of the Karoo Igneous Province. In contrast, over 50 per cent
of the magnetites in Natal (Figure 8.8C) and Zululand (Figure 8.8D) are derived from the
Natal Basement rocks. This indicates that provenance plays a far greater role in region
variations of magnetite compared to that of ilmenite.
Table 8.6 Average compositions of ilmenites from the different regions in the study area,
determined by electron microprobe analysis.
Oxide (%) Zululand Natal Transkei eastern Cape
Ti02 51.22 50.73 51.01 51.66
Al20 3 0.04 0.04 0.04 0.04
Cr20 3 0.05 0.04 0.09 0.07
MnO 1.09 0.90 0.80 0.84
MgO 0.58 0.50 0.68 0.69
FeO 43.67 43.76 43.71 44.20
F~031 2.56 3.39 2.67 1.90
1 calculated from stoichiometry
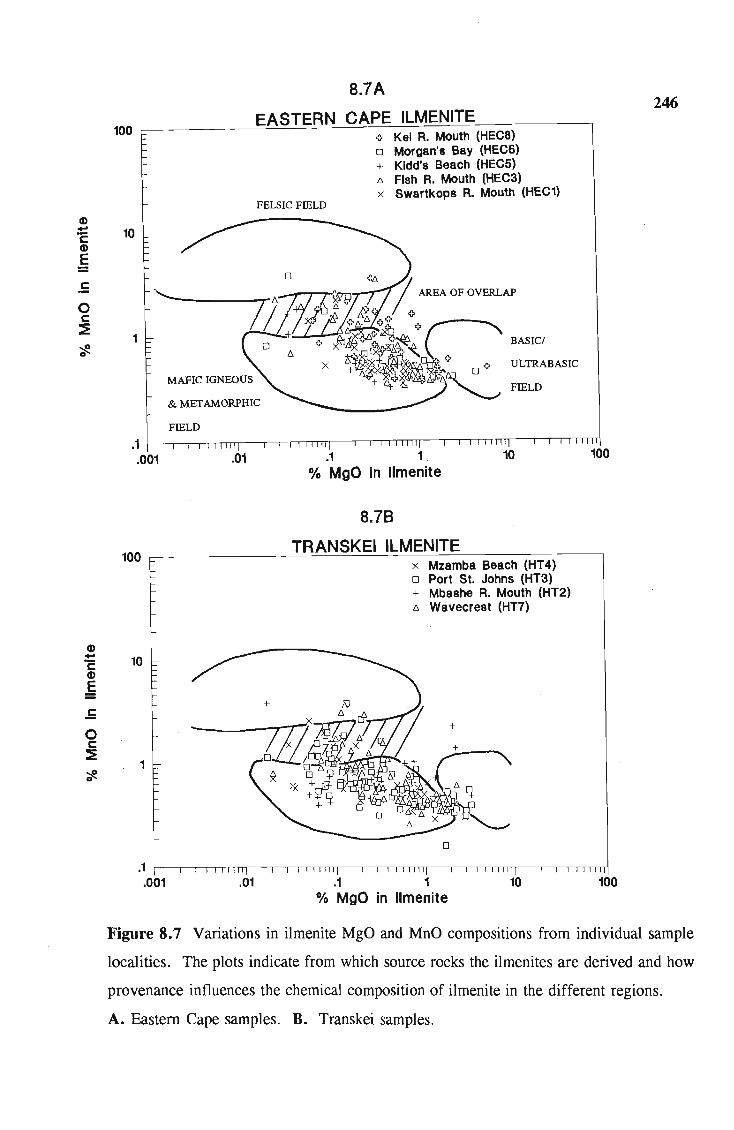
CD -C CD E
.5 0 c::: ~
~ 0
CD -C CD E
.5 0 c ~
~ 0
8.7A 246
EASTERN CAPE ILMENITE 100 ~----------~~~~~~~~o~K~e~I=R~.~M~o~ut~h~(~H=EC=8~)------~
o Morgan's Bay (HEC6) + Kidd's Beach (HEC5) 6. Fish R. Mouth (HEC3) x Swartkops R. Mouth (HEel)
FELSIC FIELD
10
0
'-
1
& METAMORPHIC
FIELD
.1 100 .001 .01 .1 1 10
% MgO in IImenite
8.78
100 TRANSKEI ILMENITE
x Mzamba Beach (HT 4) 0 Port St. Johns (HT3) + Mbsshe R. Mouth (HT2) 6. Wavecresl (HT7)
10
- +
1
.1 ~~~~~~-.~~~rr--.~rn~rr--.~~~rr--.-.,,~m
.001 .01 .1 1 10 100 % MgO in IImenite
Figure 8.7 Variations in ilmenite MgO and MnO compositions from individual sample
localities. The plots indicate from which source rocks the ilmenites are derived and how
provenance influences the chemical composition of ilmenite in the different regions.
A. Eastern Cape samples. B. Transkei samples.
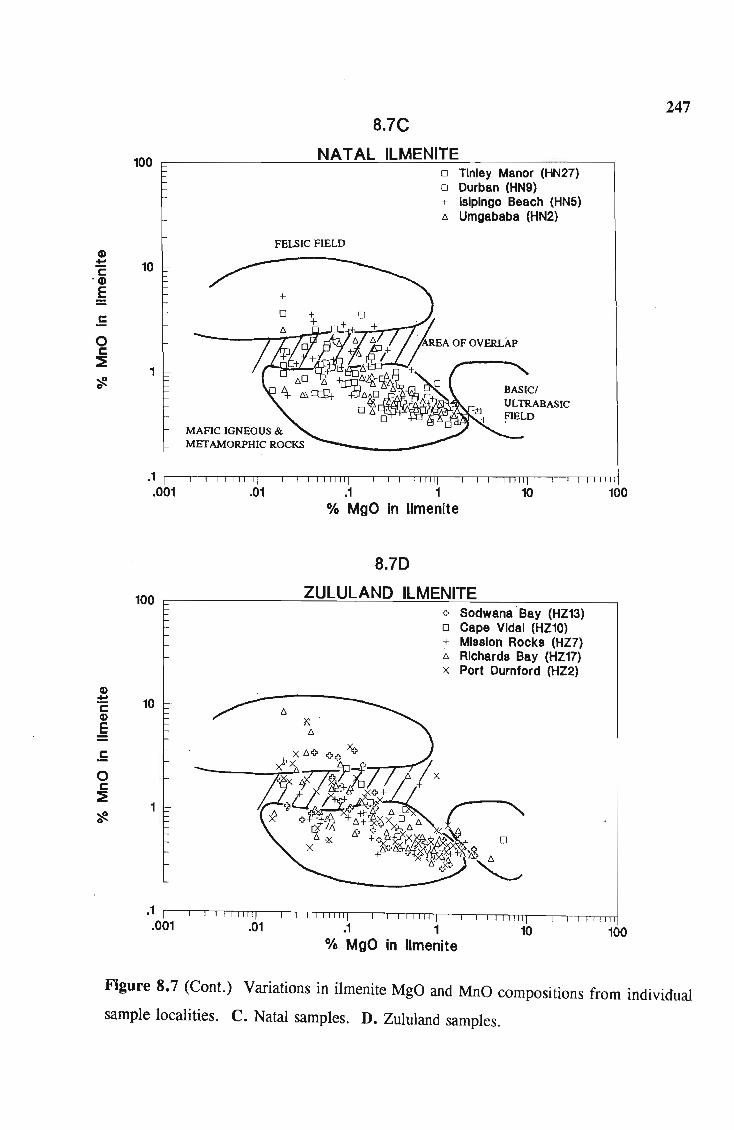
G) -c .4)
E
c:
o c: ~
.5 o c: ~
B.7e
NA T AL ILMENITE 100 ~--------------~~~~~~~~D~T~ln~le~Y~M~a=n=o~r~(~HN~2~7~)--~
FELSIC FIELD
10
1
o Durban (HN9) + Islplngo Beach (HN5) b. Umgababa (HN2)
.1 ~~~TnTIrr--IIIITITm1--T1-nTITm1--T1-nTITmlo--"rn~TI100 .001 .01 .
% MgO in IImenite
B.70
ZULULANO ILMENITE 100 ~------------~~~~~~~~~O~S~o~dw-a-n-a~B~a-Y~(H~Z=13~)~~
10
-1
o Cape Vldal (HZ10) + Mission Rocks (HZ7) b. Rlchards Bay (HZ17) x Port Durnford (HZ2)
.1 ~~'-~Trrrr--.-r"nnn--'-'TTnnn--'-'TTnnn--'-rTTTITIT .001 .01 .1 1 10 100
% MgO in IImenite
247
Figure 8.7 (Cont.) Variations in ilmenite MgO and MnO compositions from individual
sample localities. C. Natal samples. D. Zululand samples.

Q) -:;: Q) c Cl
'" :E c ('I)
0 C\I
< ~ 0 -~
('I)
o C\I
<
-~
8.8A S EASTERN CAPE MAGNETITE
5 + HEC5 o HEC6 \l HEC3
4
3 + +
+
2 0
1
O~~~~~~"~IITinnllrhll,rrnIlTn~T'~ o .1 .2 .3 .4 .5 .6
Fe203/(Fe203+TI02)
8.8B TRANSKEI MAGNETITES
5~------------~~~~~~~~~~==------------~
4
3
2
1
+ HT1 o HT3 \l HT7
0 0
o
o
o o
+
o
o
o
'V
o +
/' 0 +
o
+ O~~~~~~~~~~"""""r.""TTTTTTTTTTTTTT~
o .1 .2 .3 .4 .5 .6 .7 .8 .9 Fe203/(Fe203+Ti02)
248
Figure 8.8 Variations in magnetite compositions in individual samples from the different
regIOns. The plots indicate from which source rocks the magnetites are derived and how
provenance influences their chemical compositions in the different regions.
A. Eastern Cape samples. B. Transkei samples.
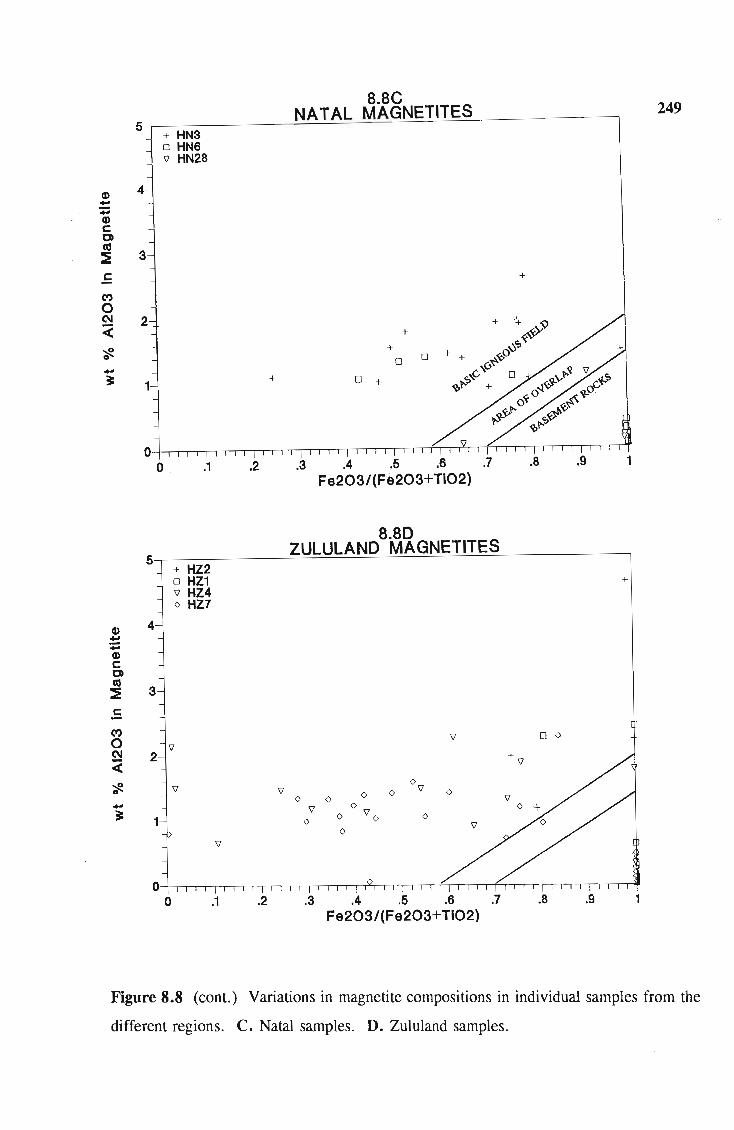
CD -:;::: CD c: C) CO :! .f C")
o C\I ;;:
-~
CD .... :;:::
CD c: C) CO
::E c:
(W)
0 ~ cC
~ D -~
8.8C NATAL MAGNETITES 5 ~----------~~~~~~~~----------~
+ HN3
249
o HN6 \J HN28
4
3
+
2
1
0 0 .1 .2 .3 .4 .5 .6
Fe203/(Fe203+Ti02)
8.80 5 ZULULAND MAGNETITES
+ HZ2 o HZ1 + \J HZ4 o HZ7
4
3
\J o 0
2
\J
1
O~~~~~~~~"~~~""",rTTTT~~""'-",,,,~ o .1 .2 .3 .4 .5 .6 .7 .8 .9 1
Fe203/(Fe203+Ti02)
Figure 8.8 (cont.) Variations in magnetite compositions in individual samples from the
different regions. C. Natal samples. D. Zululand samples.

Iron-titanium variations in coastal sediments 250
8.4.2 The influence of provenance on petrographic textures
The chemical results given above are confirmed by the petrographic data (see Table 7.6,
page 219 and Figure 8.9) which shows that magnetites from the eastern Cape and the
Transkei are derived almost exclusively from rocks of the Karoo Igneous Province. Few
samples from these regions show signs of provenance mixing. A small number of samples
plot outside the basic igeous field, but these samples contain Mt-UsPex intergrowths and
no Mt-Pleoex is present, indicating that no mixing with metamorphosed ultrabasic/basic
rocks has occurred. These samples probably contain magnetite from the large
differentiated dolerite intrusions found in the Transkei.
Magnetites in Natal indicate a mixed provenance, although some samples appear to be
derived exclusively from the Karoo Igneous Province or the Natal Basement. Samples
with a distinct Karoo Igneous signature are found near Hlatimi in southern Natal , and the
magnetite is probably from the Mtamvuna River, which erodes little of the Natal
Basement. Magnetite from two Natal samples, namely, Zinkwazi (HZ 34) and Blythedale
Beach (HZ 30), appear to be derived exclusively from the Natal Basement. These
localities are close to the mouth of the Tugela River which has been shown to contain
mainly metamorphic magnetite (see Figure 7.13, page 218). The influence of the Tugela
River is also evident in the high proportions of metamorphic magnetite found along the
southern Zululand coastline (samples HZ 25, HZ 26, HZ 1 and HZ 2) . The relatively
high proportions of Mt-Pleoex in southern and central Zululand (Richards Bay) indicate that
some input from metamorphosed basic-ultrabasic rocks has occurred. These magnetites
were derived from the metamorphosed layered complexes found with the Natal Basement,
which are eroded by the Tugela and Mhlatuze Rivers. The remaining magnetites in
Zulu land have a mixed provenance signature comprising both Karoo Igneous Province and
Natal Basement rocks, with little input from the metamorphosed basic-ultrabasic
complexes.

Iron-titanium variations in coastal sediments 251
The great variability of magnetite intergrowths in different samples indicates that
provenance has a far greater influence on the distribution of this mineral than is the case
for ilmenite. Conversely, magnetite is a far better indicator of provenance than ilmenite.
It was noted in Chapter 7 that certain iron-titanium oxide intergrowths are characteristic
of specific source rocks (see Table 7.5, page 212). The proportions of these intergrowths
in the different regions are given in Table 8.1 and Appendix D, and are shown in Map 1.
Data from Hugo (1990) is also used. The variations of these characteristic intergrowths
are summarised in Table 8.7. Intergrowths diagnostic of the Natal Basement granitoids
are most common in Natal and are rare in the eastern Cape and Transkei samples.
Intergrowths characteristic of the Karoo Igneous Province are found in all regions.
The chemical and petrographic data presented above clearly indicates that the iron-titanium
oxides are derived from both the Karoo Igneous Province and the Natal Basement rocks
in the Natal and Zululand, but that the former is far more important as a source of these
minerals in the Transkei and eastern Cape. This indicates that the present outcrop
distribution of the source rocks has a strong influence on variations of the iron-titanium
oxides. This influence is greater on the distribution of magnetite intergrowths and
ilmenite-hematite grains than on homogeneous ilmenite.
It is also evident from Map 1 that samples taken close to river mouths have higher
proportions of magnetite and intergrown iron-titanium oxides. These samples reflect most
clearly the influx of minerals from the source areas. Mechanical breakdown of the
intergrown grains by sediment reworking and the dissemination of the recently introduced
material into existing, more mature sands, reduces the provenance signature of the samples
away from the river mouths. This is demonstrated by the dispersion of magnetite from
the Tugela River, as outlined in Section 7.7.3 (page 216).

252
Table 8.7 Regional variations in iron-titanium intergrowths and minerals, which are characteristic of source rocks (ct Rugo, 1990).
Intergrowth
(Um-Hem)a
(Hem-Ilm)a ± Rut.,.
Ilm-(Hem + Rut
±Psb)""
(Hem + Rut ± Psb )""
Hem + Rut.,. (Blitz texture)
Mag-Ilm.,. (sandwich lamelle)
Mag-Ilm.,. (trellis lamellae)
Skeletal Magnetite
Skeletal Ilmenite
Cr-Spinels
Chromite
Mt-Pleoox -Ilm.,.
Rutile
Ilmenite-titanite
Source Rock
granitoid
basaltldolerite
Basic Igneous
Ultrabasicl basic complexes
Metamorphic rocks
Metamorphic rocks
Zulu land
*(*)
*
*
*
(*)**
(*)**
*(**)
*
*
*(**)
*(**)
**
*
Natal Transkei Eastern Cape
(*)** * *)
*(**)
*(**)
*
(*)** ** **
(*)** (*)** (*)**
* *(**) *(**)
* * * *
*
*
** ** **
*
* = < 1 per cent; ** = 1-10 per cent; () = occasionally found in these proportions
Magnetite
100 8.9
MET AMORPHIC C[]C[]C ZULULAND t.t.t.t.t. NATAL 00000 TRANSKEI 'f('f(trlr:'f( EASTERN CAPE
0~--__ r-~ __ -' ____ -' ______ r-~ __ ~100 100 80 60 40 20 o
Mt-lIm-Usp Mt-Pleo, Mt-Usp
F.igu~e .8.9. Plo~ of magnetite proportions in beach and dune samples on the magnetite dIscnmmatlOn dIagram (Figure 7.14, page 221)

Iron-titanium variations in coastal sediments 253
8.4.3 The influence of provenance on the distribution of rutile
Rutile is found in varying amounts in all samples. Microprobe analyses of homogeneous
rutile grains, from selected samples are given in Appendix D.l. This data is summarised
in Table 8.8 and indicates that there are no distinct differences between regions.
As mentioned in Chapter 7, rutile is thought to be derived exclusively from the Natal
Basement rocks, but no work has been done to determine the specific source rocks of this
mineral. As rutile is a metamorphic mineral, it is expected that the proportions of this
mineral would be higher along the Natal and Zululand coastlines. Examination of Map
1 and Figure 8.4 (page 235) reveals that this is not so, and that the eastern Cape and
Transkei have higher relative proportions of rutile than the northern regions. The
proportions of zircon and garnet, two other metamorphic minerals, may also be relatively
high in these regions (see Figure 8.1, page 227).
As there are no basement source rocks in the eastern Cape and very little basement outcrop
in the Transkei, these minerals must be incorporated in the sediments by one of the
following processes:
1. The minerals are derived from intermediate sedimentary hosts, which, in turn,
were derived from the Natal-Namaqua Mobile Belt or Kaapvaal Craton. Such
sediments are probably the Beaufort and Ecca Groups of the Karoo Sequence.
2. The minerals were transported from Natal by the strong southerly Agulhas Current.
The occurrence of heavy minerals in Karoo Sequence rocks from Natal has been described
in Chapter 7. Behr (1986) also noted that minor concentrations of heavy minerals,
including rutile, zircon and garnet are found in the Beaufort Group in the southern Cape
Province. Stavrakis (1980) has described occurrences of these minerals in the Katberg
Sandstone (Beaufort Group) in the eastern Cape. Examination of samples from the Fish
and Kei Rivers (Table 8.9) reveals that rutile, zircon and garnet are eroded from the
source areas of the Transkei and eastern Cape. Some rutile, zircon and garnet is therefore
reworked from the Karoo sediments by erosion, and transported to the coastline by rivers .

Iron-titanium variations in coastal sediments 254
Table 8.8 Summary statistics of rutile microprobe analyses given in Appendix B.l
Region % Si02 % Ti02 % AiZ03 % CrZ0 3 % FeO Total Oxides
Zululand
Mean 0.05 99.20 0.04 0.10 0.18 99.45
Variance 0.00 0.17 0.00 0.00 0.01 0.14
Minimum 0.00 98.59 0.02 0.04 0.08 98.83
Maximum 0.07 99.90 0 .13 0.24 0.36 100.04
n' 2 30 19 27 21 30
Natal
Mean 0.16 99. 11 0.04 0.11 0.27 99.45
Variance 0.01 0.26 0.00 0.00 0.07 0.31
Minimum 0.10 98.15 0.02 0.04 0.08 98.37
Maximum 0.30 100.03 0.15 0.24 0.98 100.43
n' 3 39 13 34 28 39
Transkei
Mean 0.12 99.27 0.07 0.11 0.23 99.64
Variance 0.02 0.25 0.01 0.00 0.02 0.32
Minimum 0.03 98.04 0.02 0.02 0.08 98.34
Maximum 0.36 99.98 0.35 0.25 0.64 100.79
n' 6 31 24 21 29 31
eastern Cape
Mean 0.16 99.26 0.08 0.12 0.20 99.52
Variance 0.05 0. 16 0.01 0.01 0.02 0.12
Minimum 0.03 98.21 0.02 0.04 0.08 98.60
Maximum 0.71 100.02 0.40 0.46 0.68 100.22
n' 7 36 11 12 28 36
, n = number of analyses above detection limit.

Iron-titanium variations in coastal sediments 255
Table 8.9 Modal proportions of heavy minerals from the Fish and Kei Rivers, determined
by point-counting 500 grains per sample.
Grain Type Kei River (HT6) Fish River (HEC9)
Ilmenite 16 15
Altered ilmenite 1 1
HAI tr
Rutile 3 2
Hematite tr tr
Magnetite 9 7
Mt-IlI1loe± USPex 7 13
Mt-UsPex 1 1
Zircon 2 4
Garnet 2 1
Pyribole 60 56
tr = trace; - = not observed.
Flemming (1981) studied the dispersal of sediment along the continental shelf of
southeast Africa. He noted that the sediment dispersal is controlled by 4 major factors:
morphology of the upper continental shelf; wave and wind-driven circulation; the
Agulhas Current; and the supply of sediment to the shelf. The continental shelf is narrow
and is interrupted by a number of structural offsets, and dissected by a numerous
submarine canyons. The near-shore sediments appear to be in equilibrium with the high
energy wave regime and additional sediment entering the system, via rivers, is quickly
dispersed onto the central shelf (Flemming, 1981). Here the Agulhas Current dominates
the sediment dispersion and the sand is transported south until it spills over the shelf break
at one of the structural offsets.
The regional sedimentary dispersal model of Flemming (1981) is reproduced in Figure
8.10. The diagram includes the catchment areas of the major river systems and divides
the terrigenous input into 4 sedimentary compartments. The model suggests that sediment
introduced to the continental shelf in Natal is either transported northwards by current
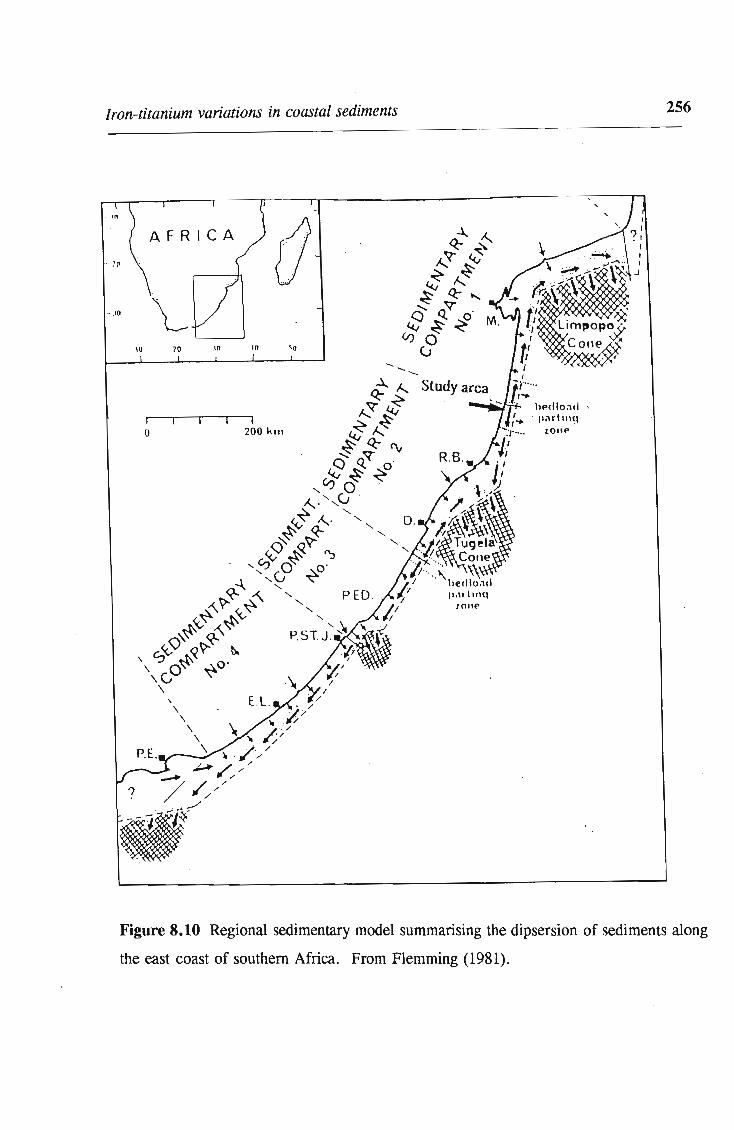
Iron-titanium variations in coastal sediments
In
AFRICA
- :p
- .10 L IU 10 '" '0 \0
I u 200 kill
~~ f.....~ 0 ~ f.....~ ~ Q: ~
....... ~
~;~- M. 00
U
p.\I lmq lOUP
· I'artillq lOllt'
256
Figure 8.10 Regional sedimentary model summarising the dipsersion of sediments along
the east coast of southern Africa. From Flemming (1981).

Iron-titanium variations in coastal sediments 257
reversals, or are expelled from the shelf at the shelf break between Port Edward and Port
St Johns. Flemming (1981) states that the model applies strictly to interglacial sea-level
highs, and that during glacial maxima, "terrigenous sediment would have been supplied
directly to the upper continental slope along the entire continental margin". Since the
Eemian Interglacial, sea-levels have stood between - 10 and - 130 m. During glacial
maxima, much of the terrigenous sediment introduced to the Indian Ocean would have
been transported to the continental slope via the river valleys which now form the
submarine canyons.
The above model strongly suggests that there is little likelihood of rutile, zircon and garnet
being transported from Natal to the Transkei and eastern Cape by the Agulhas current, and
that these minerals are derived from the intermediate sedimentary rocks described above.
8.5 THE QUALITY OF ILMENITE CONCENTRATES
It has been shown that regional variations exist in both the heavy mineral suite and the
iron-titanium oxides. The effect that these variations have on the quality of ilmenite
concentrates is examined here.
8.5.1 Chemical compositions of the concentrates
The quality of titanium mineral products is important as certain impurities reduce the
whiteness of Ti02 pigments. Such impurities include chromium, calcium, manganese, and
vanadium, and products should not contain more than a few tenths of a per cent of these
elements (Lynd and Lefond, 1983). The ferric to ferrous ratio is also important because,
in the sulphate process of Ti02 pigment manufacture, ferric iron must be reduced to the
ferrous state, which increases production costs. Ti02 products used in the chloride process
must be low in calcium, phosphrous and magnesium as these elements form non-volatile
chlorides with high boiling points during chlorination (Hamor, 1986). High levels of
alumina and silica are also undesirable in feed stocks for the chloride route because of their
refractory nature.

Iron-titanium variations in coastal sediments 258
Chromium is an important impurity in ilmenite concentrates, as this element imparts a
yellow colour to Ti02 pigments, thereby reducing the quality of the product. The pigment
industry requires ilmenite feedstock with less than 0.1 per cent Cr20 3• Large reserves of
ilmenite along the east coast of Australia are unsaleable because of high Cr20 3 levels in
the ilmenite concentrates (Lynd and Lefond, 1983). Blaskett and Hudson (1967) noted that
this Cr20 3 is mainly present in discrete chromite grains, however, the Cr20 3 levels cannot
be reduced below 0.2 per cent because the chromite has very similar grain size, magnetic
susceptibility, and conductivity to the ilmenite. Manganese is an important impurity in
ilmenite concentrates if pig iron is a by-product, as is the case at RBM. High MnO
contents are detrimental in many end uses of the metal, and low MnO iron « 1 %) is far
more marketable.
llmenite concentrates were produced by the method outlined in Section 4.2.2 (page 58).
The chemical compositions of the ilmenite concentrates, together with data from previous
studies, are given in Table 8.10. The concentrates have similar compositions, but the
Ti02, Cr20 3 and MnO levels show some regional variation. The eastern Cape and
Transkei concentrates have higher Ti02 contents than the Natal and Zululand samples
(Figure 8.11), and there is a general decrease in TiDz from south to north along the
coastline. As noted by Hammerbeck (1976) and Fockema (1986) the Cr20 3 content of the
ilmenite concentrates is low in the eastern Cape and Transkei (generally less than 0.1 per
cent), but the levels of this impurity increase northwards and the highest values are found
in Zululand. The MnO content is also higher in the Natal and Zululand samples. These
analyses agree well with those of previous workers (ct Hammerbeck, 1976; Logan, 1974;
Reynolds, 1978b).
The levels of impurities in ilmenite grains may be estimated from electron microprobe
analysis and average values, per sample, are given in Table 8.10. Comparison with Table
8.9 indicates that the levels of most of impurity elements are lower in ilmenite grains than
the bulk analysis. The Cr20 3 content from the bulk and microprobe analyses are compared
in Figure 8.12A. This shows that the Cr20 3 in ilmenite accounts for the chromium levels
in the eastern Cape and Transkei samples, but that other phases must contain the bulk of

Iron-titanium variations in coastal sediments 259
Table 8.10 Chemical compositions of ilmenite concentrates.
Sa!!!£le number Ti02 FeO Si02 Al203 CaO MgO Cr203 MnO
HEC5 Kidd's Beach 50.1 46.2 0.5 0.35 0.08 0.61 0.06 0.55
HEC3 Fish R. Mouth 49.6 47.5 0.6 0.54 0.13 0.63 0.09 0.69
HEC6 Morgan's Bay 49.6 47.6 0.2 0.33 0.04 0.63 .0.08 0.43 HT? Wavecresl . 50.3 45.8 0.7 0.43 0.17 0.4 0.11 0.38 HT3 Port Sl Johns 50.1 46.8 0.4 0.41 0.09 0.74 0.11 0.62 HT5 Mzamba Beach 48.4 47.0 0 .9 0.66 0.Ql 0.65 0.08 0.51 HN2 Umgababa 49.8 45.3 0.9 0.42 0.06 0.66 0.08 1.06 HN5 Isipingo 48.3 45.8 0.4 0.4 0.05 0.65 0.11 1.12 HN27 Tinley Manor 48.9 46.8 0.5 0.53 0.05 0.64 0.12 1.1 HZ2 Port Dumford 47.6 46.8 0.6 0.73 0.12 0.57 0.36 1.76 HZ17 Richards Bay 49.1 45.2 0.4 0.62 0.11 0.57 0.23 1.3 HZ7 Mission Rocks 48.3 45.9 0.7 0.42 0.08 0.63 0.19 1.22 HZ13 Sodwana Bay 48.3 46.2 0.6 0.58 0.12 0.66 0.23 1.3
Reference Ti02 FeO Fe203 Al203 CaO MgO Cr203 MnO V205
Morgan Bay Hammerbeck (1976) 50 38 13.1 0 .05 Sandy Point 50.3 36.5 10.9 0.07 Umgababa 49.9 37.2 10.5 0 .16 0.33 Isipingo 46.6 39.5 9.1 . 0.1 2.76 Richards Bay 49.7 36.6 11.1 0.19 0.29 Sl Lucia 49 32.5 14.3 0.38
Umgababa Langton and Jackson 49 34 13 0.01 0.75 0.18 0.4 1.0 (1961)
Richards Bay 1 Logan (1974) 48.62 34.56 14.41 0.25 Richards Bay 2 51.6 35.39 10.27 0.05 Richards Bay 3 48.71 34.27 14.11 0.27 Richards Bay 4 50.4 37.89 8.89 0.05
Jeffery's Bay Reynolds (l978)p 49.53 35.23 13.88 0.04 0.21 0.08 0.5 Maitland R.M. 50.26 37.51 11.14 0.04 0.37 0.1 0.43 Swartkops R.M. 50.68 38.45 9.7 0.06 0.3 0.06 0.42 FishR.M. 49.54 40.36 8.36 0.10 0.57 0.04 0.48 Morgan's Bay 49.76 39.27 9.91 0.03 0.36 0.04 0.4 Nahoon Beach 50.47 39.92 7.96 0.05 0.33 0.04 0.39 Boknes Beach 51.08 40.43 7.14 0.06 0.22 0.11 0.42 Bushman's R.M. 51.29 40 .3 7.04 0.04 0.33 0.02 0.46 Kasouga 50.97 38.25 9.62 0.04 0.32 0.04 0.4 Port Alfred 49.77 37.71 11.18 0.04 0.23 0.Q3 0.44

Iron-titanium variations in coastal sediments 260
this impurity in the Natal and Zululand concentrates. Microscopic examination (Table
8.12) reveals that both chromite and less abundant Cr-bearing spinel (probably chromian
magnetite) are present in ilmenite concentrates from these regions. This was also noted
by Logan (1974) and Rugo (1988). The regional trend is expected, as chromite is derived
from metamorphosed ultrabasic and basic complexes, which are found in Zululand. The
level of Cr20 3 in ilmenite concentrates is therefore strongly related to provenance.
Zululand concentrates contain Cr20 3 levels which are over twice the limit required by the
pigment industry. Lee and Poggi (1978) describe how roasting ilmenite at elevated
temperatures increases its magnetic susceptibility, thereby enabling the removal of less
magnetic chromite. This patented process enables RBM to produce titanium slag with the
required chromium specification.
Comparison of MnO content in the concentrates and ilmenite grains (Figure 8.12B)
indicates that in many cases ilmenite accounts for all the MnO in the concentrates. The
average MnO content of the eastern Cape and Transkei ilmenite is consistently higher than
that of the concentrates. This is caused by a small number of grains containing high MnO
levels, which elevates the average value of the microprobe analyses. A higher MnO
content of Natal and Zululand ilmenite is seen in both the microprobe averages and bulk
analyses. As described early, this is due to high-MnO ilmenite from granitoid and felsics
of the Natal Basement rocks in these regions.
The level of CaO in ilmenites was found to be below the microprobe detection limit, and
this impurity in the concentrates is ascribed to discrete impurity minerals. Rugo (1985)
found that garnet and hornblende were the major contributors to CaO in ilmenite
concentrates from Richards Bay. Once again the Natal and Zulu land concentrates tend to
have higher CaO levels than those in the . southern regions.

Iron-titanium variations in coastal sediments 261
Table 8.11 Average ilmenite microprobe analyses from selected samples in the study
area.
Sample No. Ti02 FeOI Si02 Al20 3 CaO MgO Cr20 3 MnO Analyses (%) (%) (%) (%) (%) (%) (%) (%)
HEC 5 Kidd's Beach 15 51.18 46.68 0.07 0.08 nd 0.30 nd 0.71
HEC 3 Fish R. Mouth 57 51.85 45.82 nd 0.03 nd 0.50 0.05 0.90
HEC 6 Morgan's Bay 33 51.42 47.86 nd 0.05 nd 0.18 0.06 0.47
HT 7 Wavecrest 54 50.82 46.40 nd 0.04 nd 0.66 0.10 0.64
HT 3 Port St Johns 73 51.20 46.11 nd 0.05 nd 0.68 0.09 0.74
HT 5 Mzamba Beach 56 51.06 45.96 0.03 0.04 nd 0.69 0.06 0.74
HN 2 Umgababa 45 50.50 47.12 nd 0.05 nd 0.44 nd 0.79
RN 5 Isipingo 56 50.82 46.52 0.03 0.05 nd 0.57 0.06 0.77
RN 27 Tinley Manor 53 51.17 46.75 nd 0.03 nd 0.52 nd 1.24
HZ 2 Port Dumford 53 51.06 45.96 nd 0.04 nd 0.50 0.05 1.16
HZ 17 Richards Bay 55 50.96 46.19 nd 0.02 nd 0.59 nd 0.83
HZ 7 Mission Rocks 47 51.47 45.69 0.04 0.05 nd 0.62 nd 1.17
HZ 13 Sodwana Bay 48 51.42 46.02 nd 0.03 nd 0.54 nd 1.17
I all iron reported as FeO; nd = below detection limit.
A study of the mineral impurities in ilmenite concentrates (Table 8.12) reveals that the
eastern Cape and Transkei have fewer mineral impurities than the Natal and Zululand
samples. The latter concentrates also contain a larger variety of mineral impurities,
including more Ilm-Hemex, and Hem-Rutox grains, which may account for their lower Ti02
contents. A greater number of impurity minerals increases the complexity of mineral
processing and makes it harder to achieve grade specifications for the final products.
Economic titanium deposits require large reserves to justify the high capital investment
required to develop and exploit the deposits. Generally, new deposits, which cannot be
treated in an existing plant, require a minimum reserve of about 1 million tonnes of
recoverable Ti02 in order to be economical (Lynd and Lefond, 1983). In addition to
mining, infrastructure and labour considerations, the economic viability of a deposit is
influenced by the ability of markets to absorb the titanium concentrates produced, and by

Iron-titanium variations in coastal sediments 262
the prevailing prices of the minerals or their upgraded products (Lynd and Lefond, 1983).
The eastern Cape and Transkei ilmenites are of better quality than the Natal and Zululand
ilmenites, as they contain higher Ti02 contents, lower Cr20 3, CaO and MnO levels, and
have fewer mineral impurities. Unfortunately the Cape and Transkei deposits are all sub
economic to marginal due to their small size, and the lack of infrastructure in their vicinity
(Hammerbeck, 1976).
• 4 7. 5~=-=-'--:-::::!::---"--:-~---'--r--r--.--,----,.--.-----,--.J HEC5 HEC6 HT3 HN2 HN27 HZ17 HZ13
HEC3 HT7 HT4 HN5 HZ2 HZ7 SAMPLES FROM SOUTH TO NORTH
Figure 8.11 Variation in Ti02 content of ilmenite concentrates from south to north along
the coastline. Sample localities are shown in Map 1.

8.12A 263
0.4
0.35
0.3
C") 0.25
0 ~ 0.2 <.> *- 0.15
0.1
0.05
o HEC5 HEC6 HT3 HN2 HN27 HZ17 HZ13 HEC3 HT7 HT 4 HN5 HZ2 HZ7
SAMPLES FROM SOUTH TO NORTH
-- ILMENITE CONC. -+- MICROPROBE ANALYSIS
8.128 1.8
1.6
1.4
1.2 0 c: ~ 1
*-0.8
0.6
0.4
0.2 HEC5 HEC6 HT3 HN2 HN27 HZ17 HZ13 HEC3 HT? HT4 HN5 HZ2 HZ7
SAMPLES FROM SOUTH TO NORTH
-- ILMENITE CONC. -+- MICROPROBE ANALYSIS
Figure 8.12 Variations in Cr20 3 (A.) and MnO (B.) contents of ilmenite concentrates
from south to north along the coastline. Sample localities are shown in Map 1.

Table 8.12 Proportions of impurities in selected ilmenite concentrates. Determined by point-counting 500 grains per sample. ;:;-c ;::r .!. -.
Grain Type HEC5 HEC3 HEC6 HT7 HT3 HT5 HN2 HN5 HN27 HZ2 HZ17 HZ7 HZ13 S ;::r -. Alt ilmenite **** **** *** *** **** **** **** **** **** **** **** **** **** § HAI *** *** ** ** *** ** *** ** ** ** ** ** *** ~
;::So
Cllm-Hem)" ** ~
* * * ** ** * * ** * :::l-. ~
CHem-Rut)"" * * * ** ** ** ** ** ** *** c; -. ;::r Ilm-(Hem + Rut)"" * * * ** ** *** *** ** ** ** 8 Leucoxene * * * * * * * t;
S -Mag-I~-USPcx * * * * * * * * * * ....,
Magnetite ~
* * * * ~f ~
Chromite * * * * * * ** * ** ** ;::r ~
er-spinel * * * *
Hematite * * * * * ** * * * *
Goethite * * *
Pyribole * * * ** ** ** ** ** ** ** ** ** **
Garnet * * * *** ** * ** ** ** **
Monazite * * * * * * * * *
* = less than 0.5 %; ** = 0.5 to 1 %; *** = 1 to 5 %; **** = 5 to 10 %
N
i::
Iron-titanium variations in coastal sediments 265
8.5.2 Comparison with other ilmenite deposits
The compositions of some ilmenite concentrates from the South African east coast (Table
8.13) are compared with those from major ilmenite deposits around the world in Figure
8.13A. The plot, first used by Temple (1966), indicates the degree of ilmenite alteration
in the concentrates. Data from the other deposits is from Temple (1966) and Baxter
(1977). The general trend is due to the initial alteration from ilmenite to pseudorutile,
followed by the progressive alteration to Ti02, via leucoxene. The ilmenite concentrates
from the study area are unique as they are practically unaltered, and lie closest to the
ilmenite apex of all the deposits (Figure 8.13B). This is reflected in their lower Ti02
content of 48.5 to 50.5 per cent Ti02, in comparison to other major ilmenite provinces
which produce concentrates containing 53 to 65 per cent Ti02 (MacKey, 1972a). Two
concentrates from the west coast of South Africa are also included in Figure 8.13 . These
samples contain even lower Ti02 than the east coast deposits (Table 8.13) . Petrographic
study of samples from these west coast regions has revealed that many of the ilmenite
grains contain extensive hematite ex solution (Hugo, 1990). These grains are incorporated
in the ilmenite concentrates, lowering the Ti02 levels of the ilmenite product.
As outlined by Force (1991) the Ti02 content of the ilmenite concentrate is economically
important, because the greater the Ti02 content, the more Ti02 extracted per ton of
feed stock. Consequently concentrates with high Ti02 contents fetch much higher prices,
as described in Chapter 2. Generally ilmenite feed stocks with less than 54 per cent Ti~
are not traded (Force, 1991) and beneficiation of the concentrate is required to sell the
material. This indicates that the southern African ilmenite concentrates are of a lower
quality than ilmenites from other countries, however, their purity facilitates the production
of high-grade titanium slag and pig iron by smelting the ilmenite. The slag contains about
85 per cent Ti02 and is suitable for both the sulphate and chloride methods of pigment
production, making the product very marketable (Lee and Poggi, 1978).

8.13 A 100
266
0~ __ 4~~1~O~ __ ~~ ____ -. ______ ,-____ ~100 100 BD 60 40 20 o
FeO.Ti02
40 8.13 B
8
2 35 8
9 7
0 4 10 11 40
100 95 90 B5 BD 75 70 65 60
FeO.Ti02 Fe203·Ti02
Figure 8.13A Comparison of the Ti02 and iron contents of southern African ilmenite concentrates (see Table 8.13) with those of other major titanium deposits in the world. Data for the overseas deposits is taken from Temple (1966). B. Expanded view of the field in 8. BA, showing the unaltered nature of the southern African ilmenites. Sample localities: 1 = Morgans Bay; 2 = Sandy Point; 3 = Umgababa; 4 Isipingo; 5 = Richards Bay; 6 = St Lucia; 7 = Richards Bay; 8 = Richards Bay; 9 = eastern Cape; 10 = Vanrhynsdorp; 11 = Soutfontein.

Iron-titanium variations in coastal sediments 267
Table 8.13 Ilmenite concentrations from South Africa used in Figure 8.13.
Locality Reference Percent Normalised
Ti02 FeO Fez03 FeO.Ti02 Fez03·Ti0 2 Ti02
Morgans Bay Hammerbeck (1976) 50.0 38.0 13.1 84.51 13.11 2.38
Sandy Point 50.3 36.5 10.9 80.69 10.84 8.46
Umgababa 49.9 37.2 10.5 82.90 10.53 6.57
Isipingo 46.6 39.5 9.1 90.61 9.39 0.00
Richards Bay 49.7 36.6 11.1 81.89 11.17 6.93
St Lucia 49.0 32.5 14.3 73.76 14.60 11.64
Richards Bay 1 Logan (1974) 48.62 34.56 14.41 79.05 14.83 6.12
Richards Bay 2 48.71 34.27 14.11 78.24 14.49 7.27
eastern Cape! Reynolds (1978) 50.3 38.4 9.51 84.90 9.46 5.64
Vanrhynsdorp Coetzee (1957) 41.6 34.1 19.17 79.81 20.19 0.00
Soutfontein Herzburg (1970) 41.8 28.45 22.74 73.55 26.45 0.00
! Average of 9 analyses from eastern Cape beaches.
8.6 THE GENESIS OF MINERAL ASSEMBLAGES AND ORE-BODIES
8. 6.1 A model for magnetite and ilmenite variations
Iron-titanium oxide assemblages in the coastal sediments are dominated by ilmenite and
its alteration products. In contrast, magnetite is often the most abundant mineral in the
source rocks and rivers from which the oxides are derived. Although magnetite is less
durable than ilmenite, it is unlikely that this mineral could be destroyed so quickly after
reaching the marine environment, so that its proportions would be so much less than
ilmenite in the beach and dune sediments. Some other explanation is required to explain
the discrepancy between iron-titanium oxide proportions in river and the modern coastal
sediments, and the following model is proposed.
The sea-level curve of Williams et al. (1981) shown in Figure 3.1 (page 37) indicates that
sea-levels fluctuated between -10 and -130 m between the Eemian high (circa 120 000
B.P.) and the last glacial maximum (15000 - 18000 B.P.). Seven marine transgression-
Iron-titanium variations in coastal sediments 268
regression cycles are identified during this period and terrigenous sediment entering the
marine environment would thus have been extensively reworked. During periods of glacial
maxima rivers incised deeply into the exposed marine sediments (Fockema, 1986; Van
Heerden, 1987) and carried their terrigenous bedload to the outer parts of the continental
margin. During the last glacial maxima, when sea-level stood at about -130 m below
present m.s.l., the river sediment was transported directly to the continental slope
(Flemming, 1981; Sydow, 1988; Ramsey, 1991). This indicates that much of the
sediment supplied by rivers during the Late Pleistocene was lost from the continental shelf
and the sediment which remained in the shelf system was re-worked. Thus most of the
iron-titanium oxide assemblages (and other heavy minerals) found in the Late Pleistocene
Holocene dunes are at least 15000 years old. This is a realistic period for the breakdown
of magnetite (and other, less resistant, heavy minerals), leading to the enrichment of
ilmenite in the iron-titanium oxide assemblages of the beaches and dunes.
The Flandrian Transgression has resulted in the deposition of fresh terrigenous sediment
on the coastal shelf. Where rivers contain high proportions of magnetite and introduce
large volumes of bedload into the shelf system (for example, the Tugela River), the
beaches contain correspondingly high amounts of magnetite. The new minerals are,
however, soon dispersed by wave and current actions, and disseminated within the much
larger "pool" of existing minerals. This obscures the influence of the terrigenous
sediments away from the river mouths, and ilmenite remains the dominant iron-titanium
oxide.
8.6.2 Formation of the heavy mineral deposits
It is difficult to provide models for the formation of the older (Pliocene-Pleistocene) red
dune deposits because of the paucity of geological information concerning these deposits,
and the uncertainty of their age. There were, however, periods of marine regression
during both the Pliocene and Pleistocene which would have exposed large areas of
unconsolidated sands on the continental shelf, providing source material for the dune
cordons. Likewise, sea levels remained below present levels during the Late Pleistocene,
lron-:titanium variations in coastal sediments 269
exposing sediments on the continental shelf to strong on-shore winds during glacial
maxima. It is postulated that the Late Pleistocene dunes, found along the Zululand coast,
formed a coastal cordon between circa 100000 - 20 000 B.P. The beach facies of these
aeolian sediments may well be the drowned beach rocks described by Ramsey (1991)
which form palaeocoastlines. The landward migration of the dunes was probably inhibited
by remnants of the Mid-Pleistocene Port Dumford dunes, outcrops of beachrock and
aeolianites of a similar age. Subsequent erosion and redistribution of the dune sands
flattened and smoothed the relief of the cordons. Subaerial weathering of the deposits
produced the red-brown colouration.
The maxima of the Late Pleistocene glaciations occurred between 18000 and 15 000 B.P.,
dropping sea level to about 130 m below the present level. This would have moved the
shoreline close to the edge of the continental margin, exposing huge volumes of
unconsolidated sands. Bathymetric maps of the continental margin (Dingle et al., 1978)
show that the greatest volume of sand exposed would have been along the Tugela cone.
These would have been driven onshore by strong southerly and northerly winds, blowing
sub-parallel to the coast, to form the extensive Late Pleistocene-Holocene dune cordons
along the Zululand coast. The dunes overlie the Port Dumford sediments and Late
Pleistocene dune remnants, which prevented further landward migration. The Flandrian
transgression raised sea-levels up to + 1.5 to 2 m. about 5000 B.P. (Yates et al., 1986;
Reddering, 1987), and consequently destroyed the dune fields formed on the shelf. Along
the Zululand coast the present coastal barrier dune system and underlying rocks were
eroded, forming the typical cliff dunes, as the shoreline was shifted approximately 40 m
landward (Ramsey, 1991).
The poor development of dune systems along the Natal-Transkei coast is thought to be a
result of the scarcity of fine-grained sand supply for aeolian formation, combined with an
actively eroding shoreline (Tinley, 1985). The aeolian sands are considered to have been
derived from the reworking of the older dune cordons, together with beach sands and
continental shelf sediments exposed during the last glacial maxima (Hammerbeck, 1976;
Wipplinger, 1985). It is probable that along the Natal and Transkei coastlines the rise in

Iron-titanium variations in coastal sediments 270
sea level resulted in the destruction of landward backdunes to form small foredunes during
the formation of a new littoral environment. The reworking of the older dunes may
explain the high ilmenite contents found in modern dunes from some localities along the
Natal and Transkei coastlines. This is particularly evident at places such as Wavecrest and
Sandy Point where there is evidence of the re-working of the older red dunes
(Ham merbeck , 1976).
As described by Flemming (1981), the continental margin broadens southwards off the
East Cape reaching a width of over 40 km. Here again, the Late Pleistocene glacial
maxima would have exposed large areas of unconsolidated sands, facilitating the formation
of extensive aeolian deposits along the coastline. Towards the south, the eastern Cape
does not have the same provenance as the Transkei. As shown in Map 1, the major rivers
in this region drain less and less of the Karoo Igneous rocks from East London to Port
Elizabeth. Consequently a greater proportion of the heavy minerals is reworked from the
Karoo sediments. This results in a more mature heavy mineral assemblage in the coastal
sediments, which is reflected by higher proportions of altered ilmenite, leucoxene and rutile.

271
CHAPfER NINE
SUMMARY AND CONC~USIONS
9.1 GEOLOGICAL SETTING
The east coast of South Africa contains an estimated 2476 million tonnes of heavy mineral
bearing sands (Wipplinger, 1985). This constitutes the world's largest demonstrated
resource of ilmenite in sedimentary deposits (see Table 2.3, page 12). Despite the
economic potential, little research has been done on the mineralogy of the economic
minerals, notably ilmenite.
The south~eastern African coastline, and particularly the Zulu land coastal plain, conforms
to all the criteria for the formation of heavy mineral placer deposits. The deposits occur
within several ages of Cainozoic aeolian and beach sediments. The most exploitable
deposits are found in Late Pleistocene - Holocene dunes, which occur intermittently along
the present-day coastline between East London and the Mocambique border. The most
economically viable of these deposits are the high coastal dune ridges found between Port
Durnford and Cape Vidal, along the Zululand coast. These deposits contain over 1700 Mt
(Wipplinger, 1985) of free-flowing, heavy mineral-bearing sand, containing economic
grades of ilmenite, zircon, rutile and monazite. The deposits north of Richards Bay are
currently dredge-mined by Richards Bay" Minerals.
Large resources of heavy minerals are also found in palaeo-dunes of Pliocene - Pleistocene
age. These occur as both coastal ridges and inland cordons along much of the coastline.
The grade of heavy minerals in these deposits is variable, but the high clay content of the
sediment has prevented exploitation.
Summary and Conclusions 272
9.2 IRON-TITANIUM OXIDE MINERALOGY
Little weathering has occurred in the Late Pleistocene - Holocene dunes, or the modem
beaches and most of the heavy minerals are still preserved in the deposits. The iron
titanium oxides occur as both monomineralic grains or composite grains, which display a
variety of textures formed in the source rocks of the oxides. These include exsdlution,
oxidation, oxyexsolution, deuteric and hydrothermal alteration textures. Two or more of
these textures are often found in single grains. In addition, these primary textures may
be overprinted by alteration textures, formed by weathering in the coastal deposits. This
makes the petrography of the composite iron-titanium oxide grains both complex and
interesting.
The most common composite grains observed in the deposits are Mt-IlIlloe±UsPen Ilmss-
Hemoe an<l (Hem-Rut±Psb)ox grains. The composite grains are preserved during erosion
and transportation, and provide important clues to the provenance of the iron-titanium
oxides. These grains play an important role in mineral processing, as they affect the
recovery of Ti02 from the deposits . Titanium-bearing phases in composite grains are
difficult to concentrate, because their physical properties are influenced by the other phases
present in the grains, and the final concentrate may be of poor chemical qUality.
Ilmenite is the most abundant iron-titanium oxide in the coastal deposits. It occurs mainly
as homogeneous, subrounded grains, ranging in size from 75 to 250 jLm. These grains
have chemical compositions close to pure FeTi03• Limited solid-solution with hematite
(Fez0 3), pyrophanite (MnTi03) and geikielite (MgTi03) occurs in some ilmenite grains (see
Figure 5.6, page 90). Ilmenite concentrates from the study area contain between 48 and
52 per cent Ti02 • This Ti02 content is lower than most ilmenite concentrates from placer
deposits and testifies to the unaltered nature of the ilmenites.
Magnetite has a wide range of chemical compositions. Titanium is the major substituent
for iron, and extensive solid-solution between ulvospinel and magnetite is found in some
grains. These grains usually contain ilmenite lamellae formed by oxyexsolution during

Summary and Conclusions 273
cooling. Ot~er elements, such as AI, Mg, Mn and Cr also substitute for Fe2+ and Fe3+
in the magnetite grains. Many magnetites have compositions close to F~04' which is
caused by re-equilibration of the magnetite with other minerals during slow cooling in the
source rocks. Most magnetite grains in the coastal sediments display varying stages of
martitisation.
Rutile is commonly found as homogeneous grains, with chemical compositions close to
pure Ti02 • Minor impurities of Fe, Cr, and Al are found in rutile grains. Niobium is also
a common impurity in rutile grains (Hugo, 1988). Rutile, together with anatase, and
minor brookite, occurs in leucoxene grains, formed by the alteration of ilmenite.
9.3 ILMENITE ALTERATION
Although most ilmenites in the coastal sediments are unaltered, varying proportions of
altered ilmenite grains are found in the different deposits. This alteration is mostly caused
by weathering of the ilmenite in the sedimentary environment. Many of these grains
display only incipient alteration, but the entire spectrum of alteration products from
ilmenite to leucoxene is observed at each locality studied.
Transmission electron microscopy of weathered ilmenites from Australia and South Africa
reveals that ilmenite commonly alters to pseudorutile · and then to rutile or anatase, as
described by Teufer and Temple (1966) and Grey and Reid (1975). The weathered areas
within grains are inhomogeneous and consist of mixtures of ilmenite and altered material.
No other phases, such as rutile, hematite, or amorphous material, were identified in altered
areas with compositions between ilmenite and pseudorutile. The underlying oxide lattice
remains intact during the alteration of iImenite to pseudorutile, which has a topotactic
relationship with ilmenite, with cihnl I cpsr and (1120)ihnl I apsr-
As the ilmenite is altered by the oxidation and removal of iron, the remaining metal
cations form ordered chains, with the resulting vacancies parallel to the C axis of the oxide
lattice, as determined by Grey and Reid (1975). The ordering of different metal-vacancy
Summary and Conclusions 274
chains forms a number of superstructures in the (0001) plane. The superstructures form
microdomains of between 5 and 20 nm within the altered ilmenite. Rutile or anatase
nucleate as discrete precipitates within the weathered material.
Two types of ilmenite alteration are observed in the study area:
1. two-stage alteration in which ilmenite alters to leucoxene via pseudorutile, as
described in the TEM study;
2. single-stage alteration of ilmenite directly to rutile (or anatase) .
These are known to operate under quite different physical conditions in unconsolidated
sediments. In addition, ilmenite altered by high temperature oxidation or hydrothermal
processes is found in the deposits.
There is clear evidence that some ilmenite was altered in source areas supplying material
to the coastal sediments. Grains containing ilmenite and microcrystalline rutile (type III
alteration) indicate that some alteration of ilmenite began in the igneous or metamorphic
source rocks. Altered ilmenites may also have been derived from intermediate
sedimentary hosts, such as the sandstones of the Natal Group, the Vryheid Formation and
the Port Durnford Formation, or ferruginous soils common to the eastern seaboard of
South Africa. Reworking of both continental shelf sediments and dunes during Pleistocene
sea-level fluctuations resulted in the mixing of altered ilmenite grains formed by the
different mechanisms. These observations indicate that the alteration of ilmenites found
in the coastal sediments is best described by a multistage model, in which some ilmenite
grains were altered prior to deposition in the Holocene dunes. In situ alteration of
ilmenite, followed by subsequent reworking, has mixed the altered ilmenites formed in
different environments (Hugo and Cornell, 1991).
9.3.1 Alteration of ilmenite in older sediments
Heavy mineral suites of the older red Pliocene - Pleistocene dunes and the Mid-Pleistocene
Port Durnford Formation are markedly different from those of younger beaches and dunes.
In particular, the older deposits contain far less ferromagnesian minerals, which have been

Summary and Conclusions 275
weathered in the deposits. Ilmenite in the Port Durnford Formation is partially altered to
pseudorutile, but ilmenite in most of the red dunes is unaltered. The re-precipitation of
iron in the red dunes indicates that the environment is oxidising, which is conducive to the
preservation of ilmenite, magnetite and hematite. As the sediments are of comparable age,
this indicates that the alteration of ilmenite is more dependent on the physical conditions
within the sediment, than on the age of the deposit.
9.4 PROVENANCE OF THE IRON-TITANIUM OXIDES
Ilmenite and magnetite in the coastal sediments are derived from rocks of both the Karoo
Igneous Province and the Natal Basement. Rutile is derived solely from the latter.
Ilmenite from certain rock groups may be distinguished by chemical composition,
however, there is large overlap between ilmenites from basalt, dolerite, and a variety of
metamorphic rocks. Magnetite from basic igneous rocks is readily distinguished from
basement rocks using A120 3, Ti02, and Fez03 content, but magnetite from granitoid and
metamorphic rocks cannot be distinguished. The petrography of the iron-titanium oxides
may be used as a provenance indicator, but caution must be used in the interpretation of
this data, as the proportions of the oxide intergrowths change with transport and
weathering. The dual provenance of ilmenite and magnetite in coastal sediments along the
east coast of South Africa is unique, as these minerals are derived solely from
metamorphic basement rocks in most major heavy mineral placer deposits.
Provenance has an important influence on the variations of iron-titanium oxides found in
the coastal sediments. Ilmenite and magnetite in eastern Cape and Transkei sediments are
derived almost exclusively from basalt and dolerite of the Karoo Igneous Province. Those
found in Natal and Zululand are derived from both the Karoo Igneous Province and the
Natal Basement rocks. In addition, certain minerals, such as chromite, and composite
grains, such as Ilm-Hel1\,x or (Hem-Rut)ox, are derived exclusively from the Natal
Basement rocks. The higher proportions of these phases in the Natal and Zululand
sediments produce subtle changes in the chemical compositions of ilmenite concentrates.

Summary and Conclusions 276
Differences between the Ti02, MnO, and Cr203 contents of ilmenite concentrates from the
different regions are observed.
Rutile, zircon and garnet are found in coastal sediments throughout the region, although
their primary source is the Natal Basement rocks. Significant proportions of rutile and
zircon are found as far as Port Elizabeth, but it is evident that these minerals have been
reworked from the sediments in the Karoo Sequence.
9.5 VARIATIONS IN COASTAL SEDIMENTS
Beaches and dunes contain the same heavy minerals, but the proportions of the minerals
in the heavy mineral suites from these sediments are different. Beaches have higher
proportions of pyriboles and other less dense heavy minerals compared to dunes. This is
caused by selective sorting of these minerals according to the energy of the depositional
environment. llmenite, zircon and rutile are finer-grained than pyriboles and are
concentrated in the finer dune sediment, while the coarser pyriboles and garnet remain in
the beach sands.
Clear differences exist between the relative proportions of ilmenite and magnetite in rivers
and coastal dunes in the study area. The rivers have higher proportions of magnetite,
while ilmenite is the dominant phase in the dunes. This disparity may be explained by the
recent geological history of the east coast, which indicates that the iron-titanium oxide
assemblages found in the Late Pleistocene-Holocene dunes are at least 15 000 years old
and that these minerals have been extensively reworked. This may be a realistic period
for the breakdown of magnetite leading to the enrichment of ilmenite in the coastal dunes.
A model for the formation of the deposits proposes that the heavy mineral-bearing dunes
were formed during the last glacial maxima (18 000 - 15000 B.P.), when the drop in sea
level exposed most of the continental margin along the east coast of southern Africa.
Prevailing onshore winds reworked the exposed shelf sediments in dune fields which
moved inland until their migration was interrupted by a palaeo shoreline.
277
REFERENCES
Anand, R.R and Gilkes, RI. (1984). Weathering of ilmenite in a lateritic pallid zone.
Clays and Clay Minerals, 32, 363-374.
---- and Gilkes, RI. (1985). Some alumina and silica in weathered ilmenite grains is
present in clay minerals - a response to Frost et al. (1983). Mineral. Mag., 49,
141-145.
Anderson, A.T. (1968). Oxidation of the LaBlanche Lake titaniferous magnetite
deposit, Quebec. Jour. of Geol., 76, 528-547.
Anon. (1974). Pulmoddai's mineral sands. Industrial Minerals, 77, 27.
Anon. (1978). Titania: the largest producer of titanium minerals in Europe. Mining
Magazine, 139, 365-371.
Anon. (1980). Titanio, Anmmo Mineral Brasileiro. Brasilia, 10, 358.
Anon. (1981). Sierra Rutile. Mining Magazine, 144, 458-465.
+ Anon. (1988). Titanium beach sands. Mining Magazine, 149, 397-403.
Anon. (1989). The sands of Cooljarloo. Mining Magazine, 150, 6-7.
Anon. (1991a). W. Australia beach sands: continued growth. Mining Magazine, 152,
288-293.
Anon. (1991b). AAC's mineral sands venture. Mining Journal, 317, 433.
Anon. (1992a). Tough times for titanium. Mining Journal, 318, 12.
Anon. (1992b). Namakwa heavy mineral reserves at 12-million tons a year.
Engineering News, Mining Supplement,150, 13.
Armstrong, R.A. (1978). A geological and geochemical appraisal of Rooi Rand dyke
swarm, Lebombo. M.Sc. thesis (unpubl.), Univ. Natal, 135 pp.
----, Bristow, I.W. and Cox, K.G. (1984). The Rooi Rand dyke swarm, southern
Lebombo. Spec. Publ. geol. Soc. S. Afr., 13, 77-86.
+ Arran, P.T., Hugo, V.E., Turner, A, and Cornell, D.H. (1992). The contribution of
Fe-Ti oxides in basalts and dolerites to ilmenite in heavy mineral deposits along
the Natal-Zululand coastline. Abstract Geocongress '92, geol. Soc. S. Afr.,
Bloemfontein.
-\ Austin, S.R (1960). Ilmenite, magnetite and feldspar alteration under reducing
conditions. Econ. Geol., 55, 1758-1759. ..

References 278
Baars, F.I. (1990). Geologic and petrologic evidence for granulite fades panial
melting in the Garies-Platbakkies supracrustal gneiss belt, Namaqualand
Metamorphic Complex, South Africa. M.Sc. thesis (unpubl.), Univ. of Cape
Town, 128 pp.
Bach, H. (1962). Formation of brookite as thin Ti02 layers. Naturwissenschafen, 51,
10-11.
-t Bailey, S.W., Cameron, E.N., Spedden, H.R., and Weege, R.I. (1956). The alteration
of ilmenite in beach sands. Econ. Geol., 51, 263-279.
% Barksdale, I. (1966). Titanium: Its occurrence, chemistry and technology. Ronald
Press Co., New York, 223 pp.
Bartle, W.W. (1988). The Madagascar mineral sands project - its impact on the
market. In: Clarke G.M. (ed.). Proceedings 8th. Industrial Minerals
International Congress, Boston, 82-89.
Basta, E. Z. (1959). Some mineralogical relationships in the system Fez03-F~04 and
the composition of titanomagnetite. Econ. Geol., 54, 689-719.
Basu, A. and Molinaroli, E. (1989). Provenance characteristics of detrital opaque Fe
Ti oxide minerals. Jour. Sed. Petrol., 59, 922-934.
---- and Molinaroli, E. (1991). Reliability and application of detrital opaque Fe-Ti
oxide minerals in provenance determination. In: Morton, A.C., Todd, S.P.
and Haughton, P.D. (eds). Developments in sedimentary provenance studies.
Geol. Soc. Spec. Publ. No. 57., 55-65.
Battey, M.H. (1981). Mineralogy for students. 2nd. Bd., Longman, London, 355pp.
Baxter, I.L. (1977). Heavy sand deposits of Western Australia. Geol. Surv. W. Aust.
Mineral Resources bulletin 10, 137 pp.
---- (1986). Supergene enrichment of ilmenite - is it related to laterization? The
AusIMM Penh Branch, Australia: A world source of ilmenite, rutile, monazite,
zircon, Conference September-October 1986.
---- and Devereux, M. (1986). What gives a shoreline heavy mineral potential on the
Swan Coastal Plain? The AusIMM Perth Branch, Australia: A world source of
ilmenite, rutile, monazite, zircon, Conference September-October 1986.

References 279
--\- Beckering Vinckers, J. (1986). A geological repon on the Pon Durnford Formation
and heavy mineral bearing sands at Richards Bay Minerals. B.Sc.(Hons) thesis
(unpubl.), Univ. Natal, 49 pp.
Behr, S.H. (1965). Heavy-mineral beach deposits in the Karoo System. Mem. geol.
Surv. S. Aft., 56, 110 pp.
--- (1986). Heavy mineral deposits in the Karoo Sequence. In: Anhaeusser, C.R. and
Maske, S. (eds). Mineral deposits of Southern Africa. Geol. soc. S. Afr.,
2105-2118.
B1askett, K.S. and Hudson, S.B. (1967). Beach sand minerals. Proc. 8th
Commonwealth Mining and Metall. Congress. Aust. l.M.M., 3, 313-340.
Bohlen, S.R. and Essene, E.J. (1977). Feldspar and oxide thermometry of granulites
in the Adirondack Highlands. Contr. Mineral. Petrol., 62, 153-169.
Essene, E.J. and Hoffman, K.S. (1980). Update on feldspar and oxide
thermometry in Adriondack Mountains, New York. Geol. Soc. Amer. Bull., 91,
110-113.
Borisenko, L.F. and Lyanpunov, S.M. (1984). Trace elements in ilmenite from various
magmatic associations. Geokhimiya, 9, 1308-1317. (reprinted in Geochem. Int.,
22, 137-146).
Bowles, J.F.W. (1988). Definition and range of composition of naturally occuring
minerals with the pseudobrookite structure. Amer. Mineral., 73, 1377-1383.
Brady, E.S. (1981). China's strategic minerals and metals - titanium. China Business
Review, 8, 62-65.
Braun, C. and Raith, M. (1985). Fe-Ti oxides in metamorphic basites from the Eastern
Alps, Austria: A contribution to the formation of solid solutions of natural Fe
Ti Oxide assemblages. Contr. Mineral. Petrol., 99, 199-213.
Bristow, J.W. (1976). The geology and geochemistry of the southern Lebombo. M.Sc.
thesis (unpubl.), Univ. Natal. 331 pp.
Bristow, J.W. (1980). The geochronology and geochemistry fo Karoo volcanics in the
Lebombo and adjacent areas. PhD. thesis (unpubl.), Univ. of Cape Town.

References 280
Brown, A.G. and Nossal, M. (1990). The Congolone heavy mineral sand deposit in
Mozambique. In: Griffiths, J.B. (ed.). 9th Industrial Minerals International
Congress, 228-237.
Buddington, A.F., Fahey, J. and Vlisidis, A. (1955). Thermometric and petrogenetic
significance of titaniferous magnetite. Amer. Jour. Sci., 253, 497-532.
+- ----, Fahey, J., and Vlisidis, A. (1963). Degree of oxidation of the Adirondack iron
oxide and iron-titanium oxide minerals in relation to petrography.
Jour. Petrology, 4, 138-169.
~ ---- and Lindsley, D.H. (1964). Iron-titanium oxide minerals and their synthetic
equivalents. Jour. Petrology, 5, 310-357.
Bugge, I.A.W. (1978). Norway. In: Bowie, S.H.U., Kvalheim, A. and Haslam,
H.W. eds. Mineral deposits of Europe, Volume 1: Northwest Europe. London:
The Inst. Mining and Metall. and the Mineral. Soc., 199-249.
Bykov, A.D. (1964). Proarizonite as a secondary mineral due to supergene alteration
of ilmenite. Dokl. Akad. SSSR, 156, 435-438.
Cannon, H.B. (1949). Economic minerals from beach sands of the southeastern United
States. Proc. of the Symp. on Mineral Resources S.E. U.S., Univ. Tennessee
Press, Kno:xville, Tenn., 202-210.
Cassidy, K.F. and Groves, DJ. (1988). Manganoan ilmenite formed during regional
metamorphism of Archean mafic and ultramafic rocks from Western Australia.
Canadian Mineral., 26, 999-1012.
Cawthom, R.G. and Groves, D.1. (1985). Magnesian ilmenite: Clue to high-Mg
parental magma of the Insizwa Complex, Transkei. Canadian Mineral., 23,
609-618.
----, Maske, S., De Wit, M., Groves, D.I., and Cassidy, K.F. (1988). Contrasting
magma types in the Mount Ayliff intrusion (Insizwa Complex), Transkei:
Evidence from ilmenite compositions. Canadian Mineral., 26, 145-160.
----, Bristow, I.W. and Groves, D.1. (1989). Magnesian ilmenite in picrite basalts from
the Karoo Province, South Africa. Mineral. Mag., 53, 245-252.

References 281
Cleverly, RW., Betton, P.J. and Bristow, J.W. (1984). Geochemistry and
petrogenesis of the Lebombo Rhyolites. Spec. Publ. geol. Soc. S. Aft., 13,
171-194.
--\-- Coetzee, C.B. (1957). Ilmenite-bearing sands along the west coast in the Vanrynsdorp
District. Bull. geol. Surv. S. Aft., 25, 17 pp. In Afrikaans (English summary).
Cox, K.G. (1970). Tectonics and volcanism of the Karoo period and their bearing on
the postulated fragmentation of Gondwanaland. In: Clifford, T.N. and Gass,
LG. (Eds). African Magmatism and Tectonics. Oliver and Boyd, Edinburgh,
461 pp.
Craig, J.R and Vaughan, D.J. (1981). Ore microscopy and ore petrography. Wiley
and Sons, New York, 406 pp.
Creitz, E.E., and McVay, T.N. (1949). A study of opaque minerals in Trail Ridge,
Fla. dune sands. Amer. Inst. Min. Met. Eng. Trans., 181, 417-423.
Dachille, P., Simons, P.Y. and Roy, R (1968). Pressure-temperature studies of
anatase, brookite, rutile and Ti02-IL Amer. Mineral., 53, 1929-1939.
("SS"J'} -T- Darby, D.A. (1984). Trace elements in ilmenite; a way to discriminate provenance or
age in coastal sands. Geol. Soc. America Bull., 95, 1029-1218.
---- and Tsang Y.W. (1987). Variation in ilmenite element compositions within and
among drainage basins: implications for provenance. Jour. Sed. Petrol., 56,
831-838.
Davies, J.L. (1980). Geographical variation of coastal development. (2 ed.), Longman,
London, 212pp.
--\- Davies, o. (1976). The older coastal dunes in Natal and Zululand and their
relationship to former shorelines. Ann. S. Afr. Mus., 71, 19-32.
Deer. W.A., Howie, RA. and Zussman, J. (1962). The rockforming minerals. Vol.
5: Non-silicates. Longmans, London. 1st ed. 371pp.
Desmarais, N.R. (1981). Metamorphosed Precambrian ultramafic rocks in the Ruby
Range, Montana. Precamb. Res., 16, 67-101.
-\- Dimanche, P ., and Bartholome, P. (1976). The alteration of ilmenite in sediments.
Minerals Sci. Engng., 8, 187-201.

References 282
Dingle, R.V., Goodlad, S.W., Martin, A.K. (1978). Bathymetry and stratigraphy of
the northern Natal Valley (SW Indian Ocean). A preliminary report. Marine
Geology, 28, 89-106.
Doriaswamy, L.K., Bijawat, H.C. and Kunte, M.V. (1959). Chlorination of ilmenite
in a fluidised bed. Chem. Eng. Prog., 55, 80-88.
Dryden, L. and Dryden, C. (1946). Comparative rates of weathering of some common
heavy minerals. Jour. Sed. Petrol., 16, 91-96.
Du Cann, B.C. (1976). The Post-Karoo geology of the St. Lucia and Kosibaai sheets.
(unpubl.). geol. Surv. S. Afr.
Duchesne, I.C. (1970). Microtextures of Fe-Ti oxide minerals in the South-Rogaland
anorthosite complex (Norway). Ann. Soc. geol. Belg., 93, 527-544.
Duncomb and Reid (1968). Data reduction method for electron microprobe analysis.
NBS special publication, 298, 135pp.
Du Preez, I.W. (1978). The geology of the area west of Richards Bay. (unpubl.).
Rep. geol. Surv. S. Afr., 155pp.
Du Toit, A.L. (1929). The volcanic belt of the Lebombo: a region of tension. Trans.
R. Soc. S. Afr., 18, 189-218.
Du Toit, P. (1979). Geology of the Nanda area, Natal. M.Sc. thesis (unpubl.), Univ.
Natal.
+ Dyadchenko, M.G. and Khatuntseva, A. (1960). Mineralogy and Petrology of the
weathering process of ilmenite: Doklady Akad. Nauk. SSSR Eanh Sci. Sect.,
132, 435-438.
Dybdahl, 1. (1960). Ilmenite deposits of the Egersund anorthosite complex. XXI
International. Geol. Congress, Copenhagen, Guidebook to Excursion No. C-JO,
43-53.
Bales, H. V and Marsh, I.S. (1979). High-Mg rocks and their significance in the Karoo
Central Province. S. Aft. J. Sci., 75, 400-404.
----, Reynolds,I.M. and Gouws, D.A. (1980). The spinel- group minerals of the central
Karoo tholeiitic province. Trans. geol. Soc. S. Afr., 83, 243-253.
----, Marsh, I.S. and Cox, K.8 The Karoo igneous province: an introduction.
Spec. Publ. geol. Soc. S. 4fF. ,13, 1-26.

References 283
Elgar, G.W. and Stickney, W.A. (1971). Production of high-purity rutile from a
domestic ilmenite concentrate. Bureau of Mines Nonmetallic Minerals Program,
TPR-37, 10 pp.
Wright, J.B., Tress, J.E., Bell, H.E., Jordan, RR (1986). Producing
chlorination-grade feedstock from domestic ilmenite - Laboratory and pilot-plant
studies. U.S. Bureau of Mines, R.I. 9002, 24 pp.
IY\ ~ Ellis, B.A. (1989). Titanium. Mining Annual Review - 1982. Mining Journal,
~ C81-C82.
Elsdon, R (1975). Iron-titanium oxide minerals in igneous and metamorphic rocks.
Minerals Sci. Engng., 7, 48-70.
Edington, J.W. (1975). Practical electron microscopy in materials science. Van
Nostrand Reinhold, New York, 350 pp.
Ernst, T. (1943). Fusion equilibrium in the system Fe20 3-FeO-Ti02 and notes on the
minerals pseudobrookite and arizonite. Ztsch. Angew. Min., 4, 394-409.
Evrand, P. (1949). Differentiation oftitaniferous magmas. Econ. Geol., 44, 210-232.
Ferry, J.M. (1984). A biotite isogradin south-central Maine, D.S.A.: Mineral
reactions, fluid transfer, and heat transfer. Jour. Petrol., 25, 871-893 .
.\ Flemming, B.W. (1981). Factors controlling shelf sediment dispersal along the
southeast African continental margin. Marine Geology, 42, 259-277.
"'Y~('l Fitzpatrick, R.W. (1978). Occurrence and propenies of iron and titanium oxides in
11) \ soils along the eastern seaboard of South Africa. Ph.D. thesis (unpubl.), Dniv.
Natal.
Flinter, B.H. (1959). The magnetic separation of some alluvial minerals in Malaya.
Amer. Mineral., 44, 738-751.
(1960a). The alteration of Malayan ilmenite grains and the question of
"arizonite". Econ. Geol., 54, 720-729.
---- (1960b). Malayan ilmenite vs. arizonite. Econ. Geol., 55, 1069-1070.
Fockema, P.D. (1986). The heavy mineral deposits north of Richards Bay.
In: Anhaeusser, C.R and Maske, S. (eds), Mineral Deposits of South Africa,
Geol. Soc. S. Afr., Johannesburg. 2301-2307.

References 284
Force, E.R. (1976). Titanium minerals in deposits of other minerals. In: Force, E.R.
(ed.). Geology and resources of titanium. Professional Paper 959-A to F, US
Geological Survey, F 1-F5.
Force, E.R. (1980). The provenance of rutile. Jour. Sed. Petrol., 50, 485-488.
---- and Stone, B.D. (1990). Heavy mineral dispersal and deposition in sandy deltas
of glacial Lake Quinebaug, Connecticut. U.S. Geol. Surv. Bull. 1874, 21p.
---- (1991). Geology of titanium-mineral deposits. Geol. Soc. America, Special Paper
259. 112 pp.
Frost, B.R. and Lindsley, D.H. (1991). Occurrence of iron-titanium oxides in igneous
rocks. Reviews in Mineral., 25, 433-467.
---- (1991a). Stability of oxide minerals in metamorphic rocks. Reviews in Mineral.,
25, 469-487.
---- (1991b). Magmatic petrology: Factors that control the occurrence of magnetite in
crustal rocks. Reviews in Mineral., 25, 489-509.
Frost, M.T., Grey.LE., Harrowfield, LR. and Mason, K. (1983). The dependence of
alumina and silica contents on the extent of alteration of weathered ilmenites
from Western Australia. Mineral. Mag., 47, 201 - 208.
----, Grey, I.E., Harrowfield, I.R. and Li, C. (1986). Alteration profiles and impurity
element distributions in magnetic fractions of weathered ilmenite. Amer.
Mineral., 71, 167-175.
Gadsden. P. (1982). Titanium. Mining Annual Review - 1982. Mining Journal, 58-59.
Geis, H.P. (1971). A short description of the iron-titanium provinces of Norway, with
special reference to those in production. Minerals Sci. Engng., 3, 13-24.
Gevorkyan, V.K. and Tananayev, N.V. (1964). Some data on the initial stages of
leucoxenization of ilmenite from the sedimentary deposits of the northern Azov
area. Dopov. Adak. Nauk Ukr. RSR, 10, 1366-1369.
Gillson, J.L. (1932). Genesis of the ilmenite deposits of St. Urbain, County
Charlevoix, Quebec. Econ. Geol., 27, 554-577.
---- (1949). Titanium. Industrial minerals and rocks, 2nd Bd., 1042-1073.
---- (1950). Deposits of heavy minerals on the Brazilian coast. Trans. A.I.M.E., 187,
685-693.

References 285
Gjelsvik, T. (1957). Geochemical and mineralogical investigations of titaniferous iron
ores, west coast of Norway. Econ. Geol., 54, 698-719.
Golding, H.G. (1961). Leucoxene terminology and genesis. Econ. Geol., 56,
1138-1149.
Grigsby, I.D. (1989). Magnetite and ilmenite as provenance indicators. Ph.D. thesis.
(unpub1.), Univ. Cincinnati, 306 pp.
---- (1990). Detrital magnetite as a provenance indicator. Jour. Sed. Petrol., 60,
940-951.
Greenwood, G. (1924). The crystal structure of cuprite and rutile. Phil. Mag., 48,
654-663.
Grey, I.E., and Reid, A.F. (1975). The structure of pseudorutile and its role in the
natural alteration of ilmenite. Amer. Mineral., 60, 898-906.
---- and Nickel, E.H. (1981). Tivanite, an new oxyhydroxide mineral from Western
Australia, and its structural relationship to rutile and diaspore. Amer. Mineral.,
66, 866-871.
Li, C. and Watts, I.A. (1983). Hydrothermal synthesis of goethite-rutile
intergrowth structures and their relationship to pseudorutile. Amer. Mineral.,
68, 981-988.
Groenewald, P.B. (1984). The lithostratigraphy and petrogenesis of the Nsuze Group
northeast of Nkandhla, Natal. M.Sc. thesis (unpub1.), Univ. Natal, 323pp.
Groves, D.I., Marchant, T., Maske, S. and Cawthorn, R.G. (1986). Compositions of
ilmenites in Fe-Ni-Cu sulphides and host rocks, Insizwa, Southern Africa:
Proof of coexisting immiscible sulphide and silicate liquids. Econ. Geol., 81,
,_ 725-731.
Grutter, H.S. (1986). The petrography and petrology of poly metamorphic cordierite
quartz gneisses near geselskapbank, northeast of Springbok. B.Sc.(Hons) thesis
(unpub1.), University of Cape Town.
Haggerty, S.E. (1976a). Oxidation of opaque mineral oxides in basalts. Reviews in
Mineral., 3, Hg1-Hg98.
---- (1976b). Opaque mineral oxides in terrestrial igneous rocks. Reviews in Mineral.
,3, Hg101-Hg277.

References 286
Haggerty, S.B. (1991). Oxide textures - a mini-atlas. Reviews in Mineral, 26, 128-211.
Hammerbeck, B.C.I. (1976). Titanium. In: Coetzee, C.B. (ed). Mineral resources
of the Republic of South Africa. Geol. Surv. S. Afr. Handbook. 7, 5th ed. 221-
226.
Hammond, P. (1952). Allard Lake ilmenite deposits. Econ. Geol., 47, 634-649.
Harki, I., et al. (1956). The discovery and mining methods at Finland's largest Fe-Ti
V mine. Mining World, 18, 62.
Hamor, L. (1986). Titanium dioxide manufacture. Australia: a world source of
ilmenite, rutile, monazite and zircon. AusIMM, Perth branch Conference Sept
Oct 1986, 143-146.
Hartman, I.A. (1959). The titanium mineralogy of certain bauxites and their parent
materials. Econ. Geol., 54, 1380-1405.
Hays, I.D. and Pitman, W.C. (1973). Lithospheric plate motion, sea level changes,
climatic and ecological consequences. Nature, 246, 18-22.
Heap, A.S. (1990). Titanium. Metals and Minerals Annual Review - 1990. Mining
Journal, 75-77.
---- (1991). Titanium. Metals and Minerals Annual Review - 1991. Mining Journal,
83-84.
Heinrich, E.W. (1965). Microscope identification of minerals. McGraw-Hill, New
York, 414 pp.
Heister, N.K., Liston, E.M. and Georz, D. (1974). Beneficiation of ilmenite by
sulfidization. Light Metals Proc. 103rd AIME Annu. Meet., 2, 410-424.
Herz, N. (1976a). Titanium deposits in anorthosite massifs. In: Force, B.R. (ed.).
Geology and resources of titanium. Professional Paper 959-A to F, US
Geological Survey, D1-D6.
---- (1976b). Titanium deposits in alkalic igneous rocks. In: Force, B.R. (ed.).
Geology and resources of titanium. Professional Paper 959-A to F, US
Geological Survey, E1-E6.
Herzburg, W. (1970). The deposit of heavy minerals in the dune sand near
Soutfontein, in Namaqualand. S. Aft. Geol. Surv. Report 1970-0050.
Unpublished.
\
References 287
Hocking, RM., Warren, I.K., and Baxter, I.L (1982). Shoreline geomorphology, In:
Exploitation of mineral sands: Perth, Western Australia Institute of Technology,
81-92.
Hobday, D.K. and Orme, A.R (1974). The Port Dumford Formation: a major
Pleistocene barrier-lagoon complex along the Zululand coast. Trans. geol. Soc.
S. Afr;, 77, 141-149.
---- (1979). Geological evolution and geomorphology of the Zululand coastal plain. In:
Allanson, B.R (ed.). Lake SIbaya. Mongraphiae Biologicae, 36, 1-20.
Hugo, V.E. (1985). Mineralogical study of the Roaster Feed Circuit (Richards Bay
Minerals). Unpubl. Report, Univ. Natal, 44pp.
---- (1988). A mineralogical and chemical study of titanium losses at Richards
Bay Minerals. M.Sc. thesis (unpubl.), Univ. Natal, 201pp.
---- (1990). The relative abundance and alteration of iron-titanium oxides along the
South African coastline. Abstract Geocongress '90, geol. Soc. S. Afr., Cape
Town, 261-264.
---- (1991). A transmission electron microscope study of the weathering processes of
detrital ilmenite. Electron microscopy of South Africa, 21, 275-276.
---- and Cornell, D.H. (1991). Altered ilmenites in Holocene dunes from Zululand,
South Africa: petrographic evidence for multi stage alteration. S. Afr. J. Geol.,
94, 365-378.
Isokangas, P. (1978). Finland. In: Bowie, S.H.U., Kvalheim, A. and Haslam, H.W.
(eds). Mineral deposits of Europe, Volume 1: Northwest Europe. London: The
Inst. Mining and Metall. and the Mineral. Soc., 39-92.
\- Iohnson C.H. (1986). The geology of the Zululand titanium deposits: Abstracts
Geocongress '86. Geol. Soc. S. Afr, Johannesburg, 417-420.
Iudd, B.P. and Palmer, E.R (1973). Production of titanium oxide from ilmenite of the
west coast South Island, New Zealand. Proc. Australas, Inst. Min. Metal., 247,
23-33.
Kahn, I.A. (1984). Non-rutile feedstocks for production of titanium. Jour. Metals,
33-38.

References 288
Karkhanavala, M.D. (1959). The nature of arizonite. Econ. Geol., 54, 1302-1308.
---- and Momin, A.C. (1959). The alteration of ilmenite. Econ. Geol., 54, 1095-1102.
----, Momin, A.C. and Rege, S.G. (1959). An X-ray study of leucoxene from Quilon,
India. Econ. Geol., 54, 913-918.
Kennedy, W.J. and Klinger H.C. (1975). Cretaceous faunas from Zululand and Natal,
South Africa. Introduction, Stratigraphy. Bull. Brit. Mus. Nat. Hist., 25, 265-
315.
Knittel, D. (1983). Titanium and titanium alloys. In: Grayson, M. and Eckroth, D.
(eds). Kirk-Othmer encyclopedia of chemical technology. 3rd Ed., Vo!. 23:
98-130. Wiley and Sons, New York.
Laird, J. (1980). Phase equilibra in mafic schist from Vermont. Jour. Petrol., 21,
1-37.
Langton, G. and Jackson, E.J. (1961). Recovery of ilmenite, rutile and zircon at
Umgababa. Trans. 7th Commonw. min metall. Congr., 3, 1075-1091.
Larrett, M.J., and Spencer, W.G. (1971). Contributions to Australasian mineralogy
3 'pseudorutile' from South Neptune Island, South Australia. Amdel Bull., 12,
74-80.
La Roche, H., de Kern, M., and Bolfa, J. (1962). Contribution a l'e tude de
l'alteration des ilmenites. Sci. Terre, 8, 215-248.
Lee, C.T and Sohn, H.Y. (1989). Recovery of synthetic rutile and iron oxide from
ilmenite ore by sulfation with ammonium sulfate. In. Eng. Chem. Res., 28,
1802-1808.
Lee, H.Y. and Poggi, D. (1978). Mine, mill, and smelting complex at Richards Bay
Minerals. In: Toguri, J.M. and Weatherly, G.C. (eds). Metall. Soc. of
C.I.M. Annual Volume featuring "hydrogen in metals" and "titanium",
Montreal, Can. Inst. Min. Metal1., 93-96.
Lepp, H. (1957). Stages in the oxidation of magnetite. Amer. Mineral., 42, 679-681.
Le Roex, J.L. and Reid, D.L. (1979). Geochemistry of Karoo dolerite sills in the
Calvina district, western Cape Province, South Africa. Contr. Miner. Petrol.,
66, 351-360.

References 289
Lindsley, D.H. (1976). The crystal structure of the oxide minerals as exemplified by
the Fe-Ti oxides. Reviews in Mineral., 3, L1-L60.
Linstrom, W. (1987). The Geology of the Dundee Area. Expl. Sheet 2830. geol. Surv.
S. Aft., 52 pp.
Lipman, P.W. (1971). Iron-titanium oxide phenocrysts in compositionally zoned ash
flow sheets from southern Nevada. Jour. Geol., 79, 438-456.
Lissiman, I.C. and Oxenford, RI. (1975). Eneabba rutile-zircon-ilmenite sand deposit,
W.A. In: Knight, C.L. (ed.). Economic geology of Australia and Papua New
Guinea. 1. Metals. AIMM Monograph Series No. 5, 1062-1070.
Lissiman, I.C., and Oxenford, RI. (1973). The Allied Minerals N.L. heavy mineral
sand deposit as Eneabba, Western Australia. The Aus. I. M. M. Conference,
Western Australia, May 1973, 153-161.
Logan, C. (1974). A mineralogical examination of beach-sand concentrates from a
pilot plant at Richards Bay. NIM Report No. 1632.
Lynd, L.E., Sigurdson, H., North, C.H. , and Anderson, W.W. (1954). Characteristics
of titaniferous concentrates. Mining Engineering, 6, 817-824.
---- (1960). Alteration of ilmenite. Econ. Geol., 55, 1064-1068.
---- and Lefond, S.I. (1983). Titanium minerals. In: Lefond S.I. (ed.). Industrial
minerals and rocks. American Inst. of Mining and Metal!. and petroleum
engineers, New York, 1303-1362.
Lynn, B.C. (1989). Landform, geomophologyand Geology. In: Lubke, RA., Avis,
A.M., and Iackson, P.B. (eds). An environmental appraisal on the effects of
dredge mining on the KingsalTojan lease region of the Eastern Shores of Lake
St Lucia (Draft), 33-39.
Mackey, T.S. (1972a). Alteration and recovery of ilmenite and rutile. Part 1: World
occurence, production, reserves, demand. Australian Mining, November 1972,
18-33.
---- (1972b). Alteration and recovery of ilmenite and rutile. Part 2: Alteration of
ilmenite in nature. Australian Mining, November 1972, 33-44.
Macpherson, M.H., and Masters, B.K. (1983). Exploration for mineral sands.
MMIJ/AusIMM Joint Symposium 1983, Sendai. 177-192.

References 290
~ Macpherson,R.D. (1982). Mineral processing at Richards Bay Minerals .. In: Glen,
. ~~ o ' H.W. (ed.). Proc. 12th CMMI Congress, S. Afr. Inst. Mm. Metall.,
Johannesburg., 835-840.
Mann, G. and James, D. (1986). The evaluation and development of the Barrytown
ilmenite deposit as a source of titanium dioxide pigment. Australia: a world
source of ilmenite, rutile, monazite and zircon. AusIMM, Perth branch
Conference Sept-Oct 1986, 139-143.
Martini, LP. (1975). Sedimentology of a lacustrine barrier system at Wasaga Beach,
Ontario, Canada. Sediment. Geol., 14, 169-190.
Maske, S. (1966). The petrography of the Ingeli mountain range. Ann. Univ.
Stellenbosch., 41, 1-109.
Masters, B.K. (1989). Heavy minerals of the Yoganup Formation, W.A. In press -
Aus. I.M.M. Monograph.
) y-- Maud, R.R. (1961). A preliminary review of the structure of coastal Natal. Trans.
geol. Soc. S. Aft., 64, 247-256.
---- (1968). Quaternary geomorphology and soil formation in coastal Natal. ZeitschriJt
fiir Geomorphologie N.F., 7, 155-199.
(' ---- and Orr, W.N. (1975). Aspects of post-Karoo geology in the Richards Bay area.
Trans. Geol. Soc. S. Aft., 78, 101-109.
McCarthy, M.I. (1967). Stratigraphical and sedimentological evidence form the
Durban region of major sea-level movements since the Late Tertiary. Trans.
geol. Soc. S. Aft., 70, 135-165.
---- (1988a). Late-Godwana to Recent geology of the Natal north coast. Excursion C
guidebook. Geocongress 88, geol. Soc. S. Aft., Durban.
---- (1988b). Some observations on the occurrence of "Berea-Type" red sand along the
Natal Coast. Geocongress 88, geol. Soc. S. Aft., Durban, 403b-403d.
---- (1988c). The geology of Durban. Excursion C guidebook. Geocongress 88, geol.
Soc. S. Aft., Durban.
McKellar, J.B. (1975). The Eastern Australian rutile province. In: Knight, C.L. (ed.).
Economic geology of Australia and Papua New Guinea. 1. Metals. Aus. I.M.M.
Monograph Series No. 5, 1055-1062.

References 291
Meth, D. (1991). The Rooi-Rand dyke swarm. Classification and intra/interdyke
chemical relationships. B.Sc. (Hons) thesis (unpub1.), Univ. Natal, 30 pp.
Miller, R. (1945). The heavy minerals of the Florida beach sands. Amer. Mineral.,
30,65-75.
Miller, D.N. and Folk, R.L. (1955). Occurrence of detrital magnetite and ilmenite in
red sediments: new approach to significance of redbeds. Am. Assoc. Petrol.
Geol. Bull., 39, 338-345.
Milner, S. (1971). Investigation of beach sands from Bantu Area No. 4, Nhlabane,
Zululand. NIM Report No. 1217. 3 pp.
Molinaroli, E. and Basu, A. (1987). Studio di minerali opachi in sabbie fluviali
oloceniche e nelle corrispondenti rocce madri di zone sottoposte a c1imi diversi
(Montagne Rocciose e Monti Appalachi in U.S.A.). Rendiconti della Soc.
Italiana di Mineral. E. Petrologia., 42, 271-283.
Molyneux T.G. (1970). A geological investigation of the Bushveld complex in
Sekhukhuneland and part of the Steel port valley, eastern Transvaal, with
particular reference to the oxide minerals. D.Sc. Thesis (unpub1.), Univ.
Pretoria.
Moore, D.E. (1990). Development of the Cooljarloo mineral sands deposit in
Australia. In: Griffiths, I.B. (ed.). 9th Industrial Minerals International
Congress, 228-237.
Miicke, A. and Chaudhuri, I.N. (1991). The continuous alteration of ilmenite through
pseudorutile to leucoxene. Ore Geology Reviews, 6, 25-44.
- L Nel, H.J and Koen, G.M. (1960). The relative abundance of ilmenite, rutile and l
zircon in a dune sand at Umgababa, south coast, Natal. Trans. geol. Soc. S.
Afr., 63, 1-7.
Neumann, E-R. (1974). The distribution of Mn2+ and Fe3+ between ilmenites and
magnetites in igneous rocks. Amer. Jour. Sci., 274, 1074-1088.
Neurgaonkar, V.G., Gorkan, A.N. and Ioseph, K. (1986). Beneficiation of ilmenite
to rutile by selective chlorination in a fluidised bed. Jour. Chem. Technol.
Biotechnol., 36, 27-30.
References 292
Nicol, A.W. (1975). X-ray diffraction. In: Nicol, A.W. (ed.). Physiochemical
methods of mineral analysis. Plemim Press, London. 508 pp.
Nord, G.L. and Lawson, C.A. (1989). Order-disorder transition-induced twin domains
and magnetic properties in ilmenite-hematite. Amer. Mineral., 74, 160-176.
Nowicki, T .E. (1986). The petrology of osumilite-bearing and related metapelitic
gneisses from the Bitteifontein area, Namaqualand. B.Sc. (Hons) thesis
(unpub1.), Univ. Cape Town.
Olhoeft, G.R. and Johnson, G.R (1989). Densities of rocks and minerals. In:
Carmichael, RS. (ed.). Practical handbook of physical properties of rocks and
minerals. CRC Press, Boca Raton, 741 pp.
Oliver, G.H. (1978). Ilmenite-magnetite geothermometry and oxygen barometry in
granulite and amphibolite facies gneisses from Doubtful Sound, Fiordland, New
Zealand. Lithos, 11, 147-153.
Overholt, J.L, Vaux, G., and Rodda, J.L. (1950). The nature of "arizonite". Amer.
Mineral., 35, 117-119.
Palmer, C. (1909). Arizonite, ferric metatitanite. Amer. Jour. Sci. Ser. 4, 28, 353-
356.
Pauling, 1. and Sturdivant, J.H. (1928). The crystal structure of brookite.
Z. Kristallogr., 68, 239-256.
Pettijohn, F.J. (1957). Sedimentary Rocks. 2nd Bd., Harper and Row, New York,
718 pp.
---- Potter, P.E., and Siever, R (1987). Sand and sandstone, 2 Ed., Springer-Verlag,
New York, 533 pp.
Pirkle, E.C. and Yoho, W.H. (1970). The heavy mineral ore body of Trail Ridge,
Florida. Econ. Geol., 65, 17-30.
----, Pirkle, A. and Yoho, W.H. (1974). The Green Cove springs and Boulougne
heavy-mineral sand deposits of Florida. Econ. Geol., 69, 1129-1137.
Pirkle, F.L. (1975). Evaluation of possible source regions of Trail Ridge Sands.
Southeastern Geology., 17, 93-114.
Putnis, A. and McConnell, J. (1980). The princples of mineral behaviour. Blackwell
Scientific Publications, Oxford, 257 pp.
References 293
Ramdohr, P. (1950). Die Ervnineralien und ihre Verwachsungen, Akademie Verlag,
Berlin, 875pp.
(1953). UlvQspinel and its significance in titaniferous iron ores. Econ.
Geol., 48, 677-687.
---- (1980). The ore minerals and their intergrowths. 2nd ed. Pergamon, Oxford.
1174 pp.
Ramluckan, V.R. (1992). The petrology and geochemistry of the Karoo sequence
basaltic rocks in the Natal Drakensberg at Sani Pass. M.Sc. thesis (unpubl.),
Univ. Durban-Westville.
Ramsey, P.I. (1991). Sedimentology, coral reef zonation, and late Pleistocene
coastline models of the Sodwana Bay continental shelf, northern Zululand.
Ph.D. thesis (unpubl.), Univ. Natal, 202 pp.
Reddering, I.S.V. (1987). Evidence for a middle Holocene transgression, Keurbooms
Estuary, South Africa. Palaeoecology of Africa, 19, 79-86.
Reynolds, LM. (1978a). Mineralogical studies of South African titaniferous iron ores:
their application to extractive mineralogy. Trans. geol. Soc. S. Afr., 81, 233-
240.
---- (1978b). A mineralogical investigation of co-existing Iron-titanium oxide from
various igneous rocks with special reference to some South African titaniferous
ores. Ph.D. thesis (unpubl.), Rhodes Univ., 622 pp.
---- (1979). Vanadium-bearing titaniferous iron ores from the Rooiwater, Usushwana,
Mambula, Kaffirskraal, and Trompsburg igneous complexes. Nat. Inst.
Metallurgy, Randburg, Report 2017, 61 pp.
---- (1983). The iron-titanium oxide mineralogy of Karoo dolerite in the eastern Cape
and southern Orange Free State. Trans. Geol. Soc. S. Aft., 86, 211-220.
---- (1984). Tectonically deformed ilmenite in titaniferous iron ores of the Mambula
Complex, Zululand, South Africa. Canadian Mineral., 22, 411-416.
---- (1986a). The mineralogy and petrography of some titaniferous iron ores from the
Usushwana Complex. In: Anhaeusser, C.R. and Maske, S. (eds) , Mineral
Deposits of South Africa, Geol. Soc. S. Afr., Johannesburg. 1267-1286.

References 294
Reynolds, I.M. (1986b). Vanadium-bearing titaniferous iron ores of the Rooiwater
Complex, North-eastern Transvaal. In: Anhaeusser, C.R. and Maske, S. (eds) ,
Mineral Deposits of South Africa, Geol. Soc. S. Afr., Johannesburg. 451-460.
---- (1986c). The mineralogy and ore petrology of the Bushveld titaniferous magnetite
rich layers. In: Anhaeusser, C.R. and Maske, S. (eds) , Mineral Deposits of
South Africa, Geol. Soc. S. Afr., Johannesburg. 1267-1286.
---- (1986d). The mineralogy and petrography of some vanadium-bearing titanferous
iron ores of the Mambula Complex, Zululand. In: Anhaeusser, C.R. and
Maske, S. (eds) , Mineral Deposits of South Africa, Geol. Soc. S. Afr.,
Johannesburg. 1675-1708.
Richards, J.M., Badenhorst, J.C. and Hamilton, C.C. (1991). Some effects of sulphide
mineralisation of the titaniferous magnetite of the Bushveld Igneous Complex in
the Potgieterus Area, Northern Transvaal. ICAM '91 Int. Congr. Applied
Mineral. Paper 46.
Riezebos, P.A. (1979). Compositional downstream variation of opaque and translucent
heavy residues in some modern Rio Magdalena sands (Colombia). Sediment.
Geol., 24, 197-225.
Rollinson, H.R. (1980). Iron-titanium oxides as an indicator of the role of the fluid
phase during cooling of granites metamorphosed to granulite facies. Mineral.
Mag. , 43, 623-631.
Rose, E. R. (1969). Geology of titanium and titaniferous deposits of Canada. Economic
Geology Report No. 25, Geol. Surv. Canada, 177p.
Rubey, W.W. (1933) . The size distribution of heavy minerals within a water-laid
sandstone. Jour. Sed. Petrology, 29, 153-163.
Rumble, D. III (1976). Oxide minerals in metamorphic rocks. Reviews in Mineral.,
3, R1-R20.
Ryan, P.J. and Whitfield, G.G. (1979). Basinal analysis of the Ecca and lowermost
Beaufort beds and associated coal, uranium and heavy mineral beach sand
occurrences. Geokongres 77. Spec. Publ. geol. Soc. S. Afr., 6, 17-21.

References 295
Russ-Nabelek, C. (1989). Isochemical contact metamorphism of mafic schist, Laramie
Anorthosite Complex, Wyoming: amphibole compositions and reactions. Amer.
Mineral., 74, 530-548.
Saggerson, E.P., Bristow, J.W. and Armstrong, RA. (1983). The Rooi Rand dyke
swarm. S. Afr. J. Sci., 79, 365-369.
Saggerson, E.P. (1986). A handbook o/minerals under the microscope. University of
Natal press, Pietermaritzburg, 54 pp.
Scogings, A.J. (1989). Peralkaline gneissic granite and alkaline mafic gneisses,
northwest of Eshowe, Natal. S. Afr. J. Geol., 92, 339-351.
Shoemaker, G.L., Shephens, J.D. and Teller, RG. (1988). Microdiffraction and
microanalysis of iron-titanium mineral samples with a VG STEM. Microbeam
Analysis, 23, 480-485.
Skidmore, C.A. (1991). Zirconium and Hafnium. Metals and Minerals Annual Review
- 1991. Mining Journal, 87-89.
Smyth, C.P. (1992). The Namakwa sands project: some mineralogical aspects. In:
Mineralogy for mineral processing. Course Notes, SAIMM.
Spencer, RV. (1948). Titanium minerals in Trail Ridge Fla. U.S. Bureau of Mines
R.I. 4208, 21pp.
Spencer, RV. and Williams, F.R (1964). The development of a rutile mining
industry in Sierra Leone. Industrial Minerals, 67, 13-26.
South African Committee for Stratigraphy (SACS) (1980). Stratigraphy of South
Africa. Part 1 (Comp. L.E. Kent). Lithostratigraphy of the Republic of South
Africa, South West Africa/Namibia, and the Republics of Bophuthatswana,
Transkei and Venda: Hanb. geol. Surv. S. Afr., 8, 690 pp.
Stavrakis, N. (1980). Opaque heavy minerals of the Katberg sandstone, South Africa.
Trans. geol. Soc. S.Afr., 83, 17-21.
Stormer, Jr, J.C. (1983). The effects of recalculation on estimates of temperature and
oxygen fugacity from analyses of multicomponent iron-titanium oxides. Amer.
Mineral, 68, 586-594.
i' Suttill, K.R (1987). Mineral sands an on-going success. Engineering and Mining
Journal, 44-47.

References 296
Sydow, C.l. (1988). Stratigraphic control of slumping and canyon development on the
Zululand continental margin, east coast, South Africa. B.Sc. (Hons) thesis
(unpubl.), Univ. Cape Town.
Temple, A.K. (1966). Alteration of ilmenite. Econ. Geol., 61, 695 - 714.
Teufer, G. and Temple, A.K. (1966). Pseudo-rutile - a new mineral intermediate
between ilmenite and rutile in the alteration of ilmenite. Nature, 211, 179-181.
Theonen J.R. and Warne J.D. (1949). Titanium minerals in central and northeastern
Florida. U.S. Bureau of Mines, R.l. 4515.
Thomas, R.J. (1988). Geology of the Port Shepstone area. Expl. sheet 3030 (Port
Shepstone), geol. Surv. S. Afr., 136 pp.
---- (1989). A tale of two tectonic terranes. S. Afr. J. Geol., 92, 306-321.
---- Bullen, W.D., de Kler~, I, and Scogings, A.J. (1990). The distribution and genesis
of precious and base metal mineralisation in the Natal Metamorphic Province.
S. Afr. J. Geol., 93, 683-695.
Thompson J.V. (1977). Appraising large diameter core and percussion drilling for bulk
samples. Engineering and Mining Journal, 178, 80-82.
f- Tinley, K.L. (1985). Coastal dunes of South Africa. S. Afr. Natl. Sci. Prog. Report
No. 109.
Towner, R.R. (1986). Resources of mineral sands. What of their future? Australia:
a world source of ilmenite, rutile, monazite and zircon. AusIMM, Perth branch
Conference Sept-Oct 1986, 35-50.
---- (1984). Titanium. Australian Mineral Industry Annual Review for 1984.
Canberra: Aust. Govt. Publ. Serv., 256-263
(1987). Titanium. Australian Mineral Industry Annual Review for 1985.
Canberra: AUSf. Govt. Publ. Serv., 256-263
(1988). Titanium. Australian Mineral Industry Annual Review for 1986.
Canberra: Aust. Govt. Publ. Serv., 239-245.
Tracy R.J. (1982). Compositional zoning and inclusions in metamorphic minerals.
Rev. Miner., 10, 355-397.
\ Truswell, J.F. (1977). The geological evolution of South Africa. Purnell, Cape Town,
218 pp.

References 297
Tsusue, A. (1973). The distribution of manganese and iron between ilmenite and
granitic magma in the Osumi Peninsula, Japan. Contr. Mineral. Petrol., 40,
305-314.
Turner, A. (1990). Iron-titanium oxide mineralogy of the Sani Pass Karoo basalts and
selected Karoo dolerites in Natal. B.Sc. (Hons) thesis (unpubl.), Univ. Natal,
26pp.
Uytenbogaardt, W. and Burke, E.A. (1971). Tables for microscopic identification of
ore minerals. Elsevier Publ. Co., Amsterdam, 429 pp.
Van der Plas, L. and Tobi, A.C. (1965). A chart for judging the reliability of point
counting results. Amer. Jour. Sci., 263, 87 - 90.
r-- Van Heerden, I.L. (1987). Sedimentation in the greater St. Lucia complex as related
to palaeo-sea levels. Abstract. 6 th National Oceanographi~Symposium,
Stellenbosch, Paper 157: B-106.
Vincent, E.A. and Phillips, R. (1954). Iron-titanium oxide minerals in layered gabbros
of the Skaergaard intrusion, East Greenland. Geochim. Cosmo. Acta, 6, 1-26.
Vegard, L. (1916). Results of crystal analysis. Phil. Mag., 32, 65-96.
---- (1926). Results of crystal analysis. Phil. Mag., ser.7, voll, 1151.
Von Gruenewalt, G. (1977). The mineral resources of the Bushveld complex.
Minerals Sci. Engng., 9, 83-95.
Walker, F. and Poldervaart, A. (1949). Karroo (sic.) dolerites of the Union of South
Africa. Bull. Geol. Soc. S. Afr., 60, 591-706.
Welch, B.K., Sofoulis, J. and Fitzgerald, A.C.F. (1975). Mineral sand. deposits of the
Capel area W.A. In: Knight, C.L. (ed.). Economic geology of Australia and
Papua New Guinea. 1. Metals. AIMM Monograph Series No. 5, 1070-1088.
Wenk, H.R. (1976). Electron microscopy in mineralogy. Springer-Verlag, Berlin,
564pp.
Whalen, J.B. and Chappell, B.W. (1988). Opaque mineralogy and mafic mineral
chemistry of I- and S-type granites of the Lachlan fold belt, south east Australia.
Amer. Mineral., 73, 281-296.

References 298
Whitehead, J. (1983). Titanium compounds - inorganic. In: Grayson, M. and Eckroth,
D. (eds). Kirk-Othmer encyclopedia of chemical technology. 3 rd ed. Vol. 23:
131-176. WHey and Sons, New York.
Williams, F.R. (1974). William Gregor, 1761-1817. Educ. Chem., 11, 115.
Williams, D.F., Moore, W.S., and Fillon, R.S. (1981). Role of the glacial Arctic
Ocean ice sheets in Pleistocene oxygen isotope and sea-levels records. Earth
Planet. Sci. Lett., 56, 157-166.
Winter, J. de la R., and Venter, J.J. (1970). Lithostratigraphic correlation of recent
deep boreholes in the Karoo-Cape sequence. Proc. Pap. Second Gondwana
Symposium, South Africa, 395-408.
Wipplinger, P.E. (1985). Extract from report: An outline of the economic p0tential
of titanium in South Africa: S. A. Geol. Surv. Report.
Wort, M.J., and Jones, M.P. (1980). X-ray diffraction and magnetic studies of altered
ilmenite and pseudorutile. Mineral. Mag., 43, 659-663.
---- and Jones, M.P. (1981). Magnetic properties of ilmenite, detrital altered ilmenite
and pseudorutile. Trans. Inst. Min. Metall., 90, C130-C137.
Wuth, M.G. and Archer, P.D. (1986). Chromite mineralisation at Sithilo, Northern
Zululand, 1689-1694. In: Anhaeusser, C.R. and Maske, S. (Eds). Mineral
Deposits of Southern Africa, II, Geol. Soc. S.Afr., Johannesburg, 2335 pp.
Yamada, S. (1976). Ilmenite beneficiation and its implications for titanium dioxide
manufacuture. Industrial Minerals, 1, 33-40.
Yates, R.J., Miller, D.E., Halket, D.J., Manhire, A.H., Parkington, J.E. and Vogel,
J.C. (1986). A mid-Holocene high sea level: a preliminary report on the
geoarchaeology at Elands Bay, western Cape Province, South Africa, S. Afr. Jour. Sci., 82, 164-165.

299
APPENDIX A
List of samples collected in the study area

300
APPENDIX A.I: LIST OF SAMPLES COLLECTED FROM BEACHES
Sample No. Region Locality Age Notes
HZ 12 Zululand Sodwana Bay Holocene f-mlg; white; m-h/HM, pyr, opq; 1 km N. of Jesser Point.
HZ 10 Cape Vidal f-m/g, beige; mlHM, opq, gt; S. of boat launch area.
HZ 8 Mission Rocks mlg, It.beige; mlHM, opq, pyr, gt; 1 km S. of Mission Rocks.
HZ6 St Lucia Estuary mlg, mottl. brown; l-m/HM; mouth 1.5 km N. of estuary mouth.
HZ 32 Richards Bay m-c/g, beige; h/HM, opq, pyr; 2 Mile Beach.
HZ25 Mtunzini c/g, d.beige; hIHM, pyr; beach in nature reserve.
HZ3 Port Dumford m-c/g, d.beige; mlHM, pyr, opq; close to access road.
HZ 1 " Tugela River c/g, beige; h/HM, magn, opq, Mouth pyr, gt; 500 m N. of r. mouth
HN33 Natal Zinkwazi Holocene m/g, beige; m/HM, opq, pyr, gt; berm across r. mouth
HN29 Blythedale Beach c/g, It. beige; l-mlHM, pyr, opq, gt; Main swimming beach.
HN26 TinIey Manor c/g, mottl. beige; l-mlHM, pyr, opq; opposite car park.
HN8 Umhloti mlg, mottl. beige; l-mlHM, pyr, opq, gt, lagoon mouth.
HN6 Umgeni River mlg, beige; m-h/HM, opq, pyr, Mouth gt; south of Blue Lagoon pier.
HN9 South Beach, f-m/g, black; v.h/HM, opq, gt, Durban pyr; after heavy storm.
HN4 Isipingo Beach m/g, It. beige, m/HM, opq, gt, pyr, near car park.
HN3 Umgababa c/g, mottl. beige, l-mlHM, pyr, opq, gt; 5 km N. of r. mouth.
HN20 Umkomaas c/g, It. beige, IIHM, pyr, opq, 1 km S. of r. mouth.
HN 17 Mzumbe River mlg,d.beige, mlHM, pyr, gt, Mouth opq; 1 km N. of r. mouth
HN 14 Port Shepstone c/g, d. beige, mlHM, pyr, opq, gt; 0.5 km north of r. mouth
HN 10 Hlatimi c/g, 1. beige, IIHM, pyr, opq; berm across r. mouth
HN 11 Hlatimi c/g, 1. beige, l-mlHM, pyr, opq; 1 km N. r. mouth

Sample No.
HT4
HT3
HT 14
HT9
HT 13
HEC 8
HEC7
HEC5
HEC4
HEC 3
HEC2
HEC 1
Region
Transkei
Locality
Mzamba Beach
Port St Johns
Mazeppa Bay
Xamani
Mbashee River Mouth
eastern Cape Kei River Mouth
Morgan's Bay
Kidd's Beach
Nahoon Beach
Fish River Mouth
Bushmans' River Mouth
Swartkops River Mouth
Age
Holocene
Holocene
301
Notes
m1g, beige; m1HM, opq, pyr; 3 km S. of casino
m-c/g, grey-brown, h/HM, opq, pyr; 1 km N. of r. mouth
f-mlg, mottl. beige, m1HM, opq; S. of r. mouth.
f-mg/, mottl. grey-beige, h/HM, opq; 3 km N. of river mouth
f-m1g, mottl. It. beige, m/HM, opq, pyr, 1 km N. of r. mouth
fIg, It. beige; l-m/HM, opq; 0.5 km S. of r. mouth
fIg, mottl. beige; m/HM, opq; 2 km S. of r. mouth, opposite hotel
fIg, It. beige, I-m1HM, opq, pyr; 0.5 km N. of car park.
fIg, white; l-m/HM, opq; main swimming beach.
fIg, It. beige; l-m/HM, opq; 0.5 km S. of r. mouth.
fIg, mottl. white; I/HM, opq; at r. mouth.
fIg, mottl.white; v.l/HM; near car park.
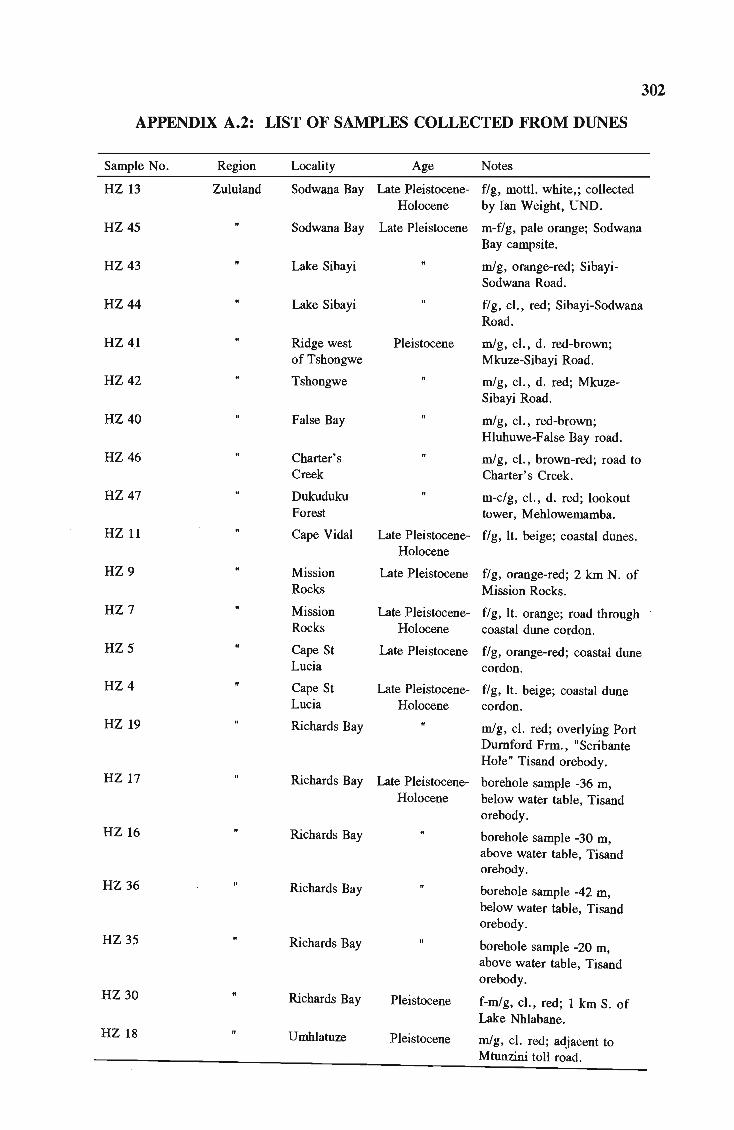
302
APPENDIX A.2: LIST OF SAMPLES COLLECTED FROM DUNES
Sample No. Region Locality Age Notes
HZ 13 Zululand Sodwana Bay Late Pleistocene- fig, mottl. white,; collected Holocene by Ian Weight, UND.
HZ 45 Sodwana Bay Late Pleistocene m-fig, pale orange; Sodwana Bay campsite.
HZ43 Lake Sibayi mlg, orange-red; Sibayi-Sodwana Road.
HZ44 Lake Sibayi fig, cl., red; Sibayi-Sodwana Road.
HZ41 Ridge west Pleistocene mlg, cl., d. red-brown; of Tshongwe Mkuze-Sibayi Road.
HZ42 Tshongwe mlg, cl., d. red; Mkuze-Sibayi Road.
HZ40 False Bay mlg, cl., red-brown; Hluhuwe-False Bay road.
HZ46 Charter's mlg, cl., brown-red; road to Creek Charter' s Creek.
HZ 47 Dukuduku m-c/g, cl., d. red; lookout Forest tower, Mehlowemamba.
HZ 11 Cape Vidal Late Pleistocene- fig, It. beige; coastal dunes. Holocene
HZ9 " Mission Late Pleistocene fig, orange-red; 2 km N. of Rocks Mission Rocks.
HZ7 Mission Late Pleistocene- fig, It. orange; road through Rocks Holocene coastal dune cordon.
HZ5 Cape St Late Pleistocene fig, orange-red; coastal dune Lucia cordon.
HZ4 Cape St Late Pleistocene- fig, It. beige; coastal dune Lucia Holocene cordon.
HZ 19 Richards Bay mlg, cl. red; overlying Port Dumford Frm., "Scribante Hole" Tisand orebody.
HZ 17 Richards Bay Late Pleistocene- borehole sample -36 m, Holocene below water table, Tisand
orebody. HZ 16 Richards Bay borehole sample -30 m,
above water table, Tisand orebody.
HZ 36 Richards Bay borehole sample -42 m, below water table, Tisand orebody.
HZ 35 Richards Bay borehole sample -20 m, above water table, Tisand orebody.
HZ 30 Richards Bay Pleistocene f-mlg, cl., red; 1 km S. of Lake Nhlabane.
HZ 18 Umhlatuze Pleistocene mlg, cl. red; adjacent to Mtunzini toll road.

303
Sample No. Region Locality Age Notes
HZ27 Mtunzini Pleistocene f-mlg, cl. d.red-brown; Mtunzini town.
HZ26 Mtunzini Late Pleistocene- m/g, It. beige; coastal Holocene foredune, near car park.
HZ2 Port m/g, It. beige; coastal Dumford foredune.
-------------------------------------------------------------------------------------HN35 Natal Zinkwazi Pliocene- m-c/g, cl. red; ridge inland
Pleistocene of Zinkwazi town.
HN34 " Zinkwazi Late Pleistocene- f-mlg, It. beige; coastal dune Holocene cordon, 1 km N. of r. mouth
HN31 Blythedale Pliocene- mlg, cl. red; inland dune Beach Pleistocene ridge.
HN30 Blythedale Late Pleistocene- mlg, beige; coastal foredune Beach Holocene near car park.
HN28 Tinley Pliocene- mlg, cl. d.red; inland dune Manor Pleistocene ridge.
HN27 Tinley Late Pleistocene- f-m/g, beige; coastal dune Manor Holocene cordon.
HN7 Umdloti f-mlg, d.beige; coastal foredune, 0.5 km N. of r. mouth.
HN25 Ballito Beach Pliocene- m/g, cl. red-orange; dune Pleistocene ridge adj. to N2.
HN24 Umhlanga m/g, cl. orange; adj. to Rocks R106, 5 km N. of Umhlanga
Rocks.
HN23 Durban fIg, cl. d. orange; inland North dune ridge, approx. 3 km
north of Umgeni River. HN5 Isipingo Late Pleistocene- fIg, It. beige; coastal
Beach Holocene foredune. HN 1 Umgababa m-c/g, beige; old mining site HN2 Umgababa Pliocene- m/g, cl. red; old mining site
Pleistocene HN22 Umkomaas clayey red sand, railway
cutting HN21 Umkomaas Late Pleistocene- f-m/g, white; coastal dune
Holocene cordon, near beach road. HN 19 Mzumbe Pliocene- mlg, cl. red; 0.5 km N. of
River Mouth Pleistocene r. mouth, adj. to N2. HN 18 Mzumbe Late Pleistocene- mlg, mott!o white, coastal
River Mouth Holocene foredune, 1 km N. of r. mouth.
HN 16 Port Pliocene- m/g, cl. red; adj. to N2, 3 Shepstone Pleistocene km N. of r. mouth.
HN 15 Port Late Pleistocene- mlg, mott!o beige; coastal Shepstone Holocene foredune; 3 km N. of r.
mouth.

Sample No. Region
RN 13
HN 12
HT 5 Transkei
HT 15
HT 16
HT 11
HT 12
HT 10
HT2
HT7
HT 8
Locality
Hlatimi
Hlatimi
Mzamba Beach
Port St J ohns
Mazeppa Bay
Umgazi River Mouth
Xamani
Xamani
Mbashee River Mouth
Wavecrest
Sandy Point
Age
Pliocene-Pleistocene
Late Pleistocene-Holocene
Late Pleistocene-Holocene
PliocenePleistocene
Notes
mlg, cl. red; dune ridge adj. to N2.
mlg, beige; foredune; lkm N. of river mouth.
f-m/g , It. beige; coastal foredune, 5 km south of casino.
f-mlg, mottl. beige; coastal foredune, 3 km N. of r. mouth.
fIg, It. beige; coastal foredune, adj. to r. mouth.
f-mlg , mottl. beige; coastal foredune, S. of r. mouth.
mlg, cl. red; high dune ridge; 3 km S. of Umgazi r. mouth.
Late Pleistocene- mlg, beige; low coastal Holocene foredune, 2 km N. of r.
mouth.
304
mlg, beige, coastal foredune.
mlg, orange; low coastal dune ridge, 1 km S. of hotel
fIg, It. beige; coastal foredune, 4 km N. of r . mouth
-------------------------------------------------------------------------------------HEC6
HEC 13
HEC 10
HEC 11
HEC 12
eastern Cape Morgan's Bay
Fish River Mouth
Kidd's Beach
Nahoon Beach
Bushman's River Mouth
Late Pleistocene- fIg, It. beige, coastal dune Holocene cordon, 0.5 km N. of r.
mouth.
fIg, white; coastal foredune, 0.5 km S. of river mouth.
f-m/g, mott!o white, coastal dune cordon, 0.5 km N. of swimming beach.
fIg, white; coastal dune cordon, 1 km N. of swimming beach.
fIg, mottl. white; low coastal dune cordon, 1 km S. of r. mouth.
HZ 21 Zululand -------------------------------------------------------------------------------------
HZ22
HZ23
HZ 51
HZ52
Port Durnford Formation
Mid-Pleistocene f-m/g, cl. white; IIHM, opq; "Scribante Hole", Tisand orebody
mlg, cl. white; lIHM, opq; 2 Mile beach, Richards Bay.
f-mlg, cl. white; IIHM, opq; 5 Mile Beach, Richards Bay.

305
APPENDIX A.3: LIST OF SAMPLES COLLECTED FROM RIVERS
Sample No. Region River Notes
HZ24 Zululand Tugela side-channel bar, near railway bridge, Mandini
HZ 31 Mhlatuze side-channel bar, N2 bridge
HZ 14 Pongola mid-channel bar, N2 bridge
HZ34 Mfolozi side-channel bar, N2 bridge
UMG1-UMG5 Natal Mgeni tributaries of the Mgeni R. draining rocks of the Natal Struct. and Met. Province; Downstream of Nagal Dam.
HN32 Natal Mvoti mid-channel bar, N2 bridge
HT6 Transkei Kei side-channel bar, N2 bridge
HEC9 eastern Cape Fish mid-channel bar, N2 bridge
HS 6 Natal Tugela gravelly, side-channel bar, Royal Natal National Park, sample was pre-concentrated by removing the + 1 mm sized material.
PTA 2 Natal Tugela average of 4 river samples, Royal Natal National Park; from Arran et al. (1992)
PTA 4 Natal Tugela average of 3 river samples, Tugela Ferry area; from Arran et al. (1992).
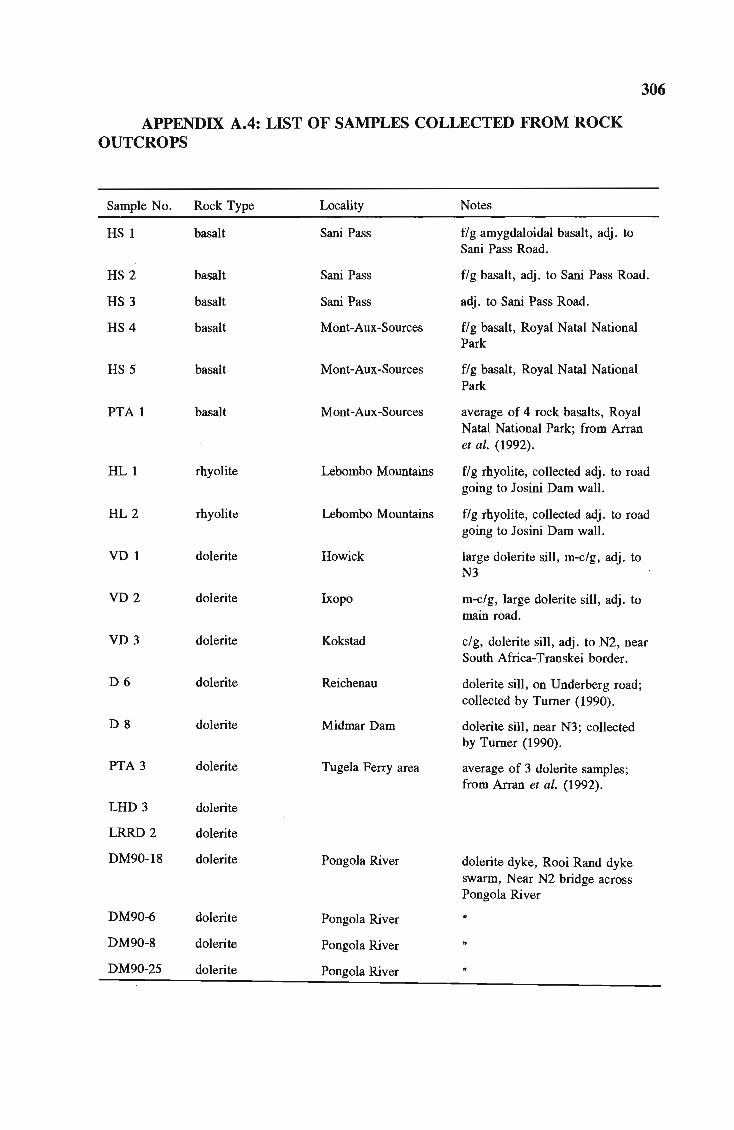
306
APPENDIX A.4: LIST OF SAMPLES COLLECTED FROM ROCK OUTCROPS
Sample No. Rock Type Locality Notes
HS 1 basalt Sani Pass fig amygdaloidal basalt, adj. to Sani Pass Road.
HS 2 basalt Sani Pass fig basalt, adj. to Sani Pass Road.
HS 3 basalt Sani Pass adj . to Sani Pass Road.
HS 4 basalt Mont-Aux-Sources fig basalt, Royal Natal National Park
HS 5 basalt Mont-Aux-Sources fig basalt, Royal Natal National Park
PTA 1 basalt Mont-Aux-Sources average of 4 rock basalts, Royal Natal National Park; from Arran et al. (1992).
HL 1 rhyolite Lebombo Mountains fig rhyolite, collected adj. to road going to Josini Dam wall.
HL2 rhyolite Lebombo Mountains fig rhyolite, collected adj. to road going to Josini Dam wall.
VD 1 dolerite Howick large dolerite sill, m-c/g, adj. to N3
VD2 dolerite Ixopo m-c/g, large dolerite sill, adj. to main road.
VD 3 dolerite Kokstad c/g, dolerite sill, adj. to N2, near South Africa-Transkei border.
D6 dolerite Reichenau dolerite sill, on Underberg road; collected by Turner (1990).
DS dolerite Midmar Dam dolerite sill, near N3 ; collected by Turner (1990).
PTA 3 dolerite Tugela Ferry area average of 3 dolerite samples; from Arran et al. (1992).
LHD3 dolerite
LRRD2 dolerite
DM90-1S dolerite Pongola River dolerite dyke, Rooi Rand dyke swarm, Near N2 bridge across Pongola River
DM90-6 dolerite Pongola River
DM90-S dolerite Pongola River
DM90-25 dolerite Pongola River

307
Sample No. Rock Type Locality Notes
VG 1 granite Kloof End Pluton unfoliated, m/g granite, Hibberdene
VG2 granite-gneiss Ngoye granite-gneiss magnetite-bearing micro granite, W. of Univ. of Zululand.
VG 3 granite-gneiss Mgeni Batholith c/g granite-gneiss, containing feldpar phenocrysts, Mgeni Valley
VG4 chamockite Port Edward coastal outcrop.
VG5 granite-gneiss Mzimlilo Suite m/g, leucocratic; collected near Glenrosa, along Hibberdene-Ixopo road.
MS 17 megacrystic Mgeni Batholith collected by G. Milne, Dept. of granite-gneiss Geology, UND
MS 18
NDF 50 amphibolite Mapumulo Suite fig amphibolite, collected by G. Milne, Dept. of Geology, UND.
VA 1 Mapumulo Suite amphibolite, Mgeni River.
VA2 Tugela Group Silambo Formation, on Eshowe Road.
VA3
VA4
NDF 10 biotite schist Mapumulo Suite collected by G. Milne, Dept. of Geology, UND.
VM2 biotite-hbl. gneiss Mapumulo Suite Nkandla area.
VM3 amphibolite-gneiss Thondo Formation on Eshowe-Gingingdlovu road.
VM4
VM 1 Metamorphosed Mambula Complex c/g, massive, Fe-Ti oxide layer in Ultrabasic complex ultrabasic host.
IRland2 from Reynolds (1986d)

APPENDIX B
Electron microprobe analyses of rutile, ilmenite and magnetite
from coastal sediments
308


310 APPENDIX B.l- MICROPROBE ANALYSES OF RUTILE IN COASTAL SEDIMENTS
Analysis Si02 Ti02 Al203 Cr203 FeO MnO MgO Total
RN 19 1 99.13 0.03 0.96 100.12
RN 19 2 100.03 0.06 0.34 100.43
RN 19 3 0.30 98.16 0.15 0.98 99.59
RN 19 4 0.10 98.92 0.11 0.13 0.91 100.17
RN7 1 99.39 0.10 0.26 99.75
RN7 2 98.71 0.04 0.12 98.87
RN7 3 99.41 0.08 0.21 99.70
RN7 4 99.18 0.06 0.11 99.34
RN7 5 98.46 0.20 98.67
RN7 6 98.59 0.13 98.72
RN7 7 98.75 0.17 98.92
RN7 8 98.73 0.15 98.88 RN7 9 99.93 0.13 100.06 RN7 10 99.56 0.10 0.13 99.79 RN7 11 99.10 0.02 0.06 0.11 99.29 RN7 12 98.63 0.02 0.07 0.10 98.81 RN7 13 98.52 0.02 0.11 0.29 98.94 RN7 14 99.73 0.14 0.09 99.96 RN2 1 99.40 0.15 0.08 99.64 RN2 2 99.63 99.63 RN2 3 98.94 0.05 0.21 99.20 RN2 4 98.15 0.12 0.10 98.37 RN2 5 98.24 0.12 0.18 98.54 RN2 6 98.84 0.10 0.21 99.14 RN2 7 99.22 0.02 0.08 0.16 99.48 RN2 8 99.31 0.10 0.17 99.58 RN2 9 99.77 0.02 0.14 0.16 100.09 RN2 10 99.32 0.08 0.24 99.64 HN2 11 98.47 0. 19 98.66 HN2 12 98.62 0.10 0.10 98.82 HN2 13 99.30 0.12 0.37 99.80 RN2 14 99.71 0.03 0.14 99.87 HN2 15 99.41 0.13 99.54 RT2 1 99.45 0.03 0.09 99.56 HT3 1 99.91 0.03 0.26 100.20 HT3 2 99.69 0.10 99.79
Blank = below detection limit

311 APPENDIX B.1 - MICROPROBE ANALYSES OF RUTILE IN COASTAL SEDIMENTS
Analysis Si02 Ti02 Al203 Cr203 FeO MnO MgO Total
HT3 3 0.03 99.95 0.07 0.13 100.18
HT3 4 99.02 0.04 0.07 99.12
HT3 5 99.37 0.06 0.28 99.71
HT3 6 99.10 0.06 0.10 0.17 99.42
HT3 7 99.51 0.03 0.19 0.21 99.93
HT3 8 99.30 0.03 0.11 0.17 99.62
HT3 9 99.56 0.02 0.51 100.09
HT3 10 99.81 0.02 0.14 0.19 100.16
HT3 11 99.91 0.10 0.09 0.27 100.36
HT3 12 99.98 0.11 0.09 0.19 100.37
HT7 1 0.05 98.75 0.24 0.05 0.32 99.41
HT7 2 99.12 0.15 99.27
HT7 3 99.08 99 .08
HT7 4 99.23 0.15 99.38
HT7 5 98.81 0.12 98.93
HT7 6 98.75 0.02 0.17 0.08 99.02
HT7 7 0.23 99.83 0.16 0.13 0.44 100.79
HT7 8 0.03 99.31 0.06 0.16 0.22 99.78 HT7 9 99.96 0.03 0.08 0.20 100.28 HT7 10 98.99 0.03 0.14 0.16 99.31 HT7 11 98.91 0.02 0.02 0.27 99.22 HT7 12 0.03 98.04 0.03 0.10 0.14 98.34 HT7 13 99.54 0.03 0.25 0.39 100.21 HT7 14 99.26 0.04 0.09 0.31 99.69 HT7 15 98.13 0.07 0.11 0.08 98.38 HT7 16 99.03 0.05 0.45 99.53 HT7 17 99.48 0.13 0.09 99 .70 HT7 18 0.36 98.65 0.35 0.09 0.64 100.10
HEC5 1 99.12 0.03 0.47 99.64 HEC5 2 99.40 0.17 99.60 HEC5 3 98.95 0.06 0.21 99.23 HEC5 4 98.87 0.10 99.00 HEC5 5 0.03 99.67 0.05 0.19 99.94 HEC5 6 99.11 0.16 99.28 HEC5 7 99.55 0.18 99.73 HEC5 8 99.33 99.35
Blank = below detection limit

312 APPENDIX B.1 - MICROPROBE ANALYSES OF RUTILE IN COASTAL SEDIMENTS
Analysis Si02 Ti02 Al203 Cr203 FeO MnO MgO Total
HEC5 9 99.31 0.11 99.47
HEC5 10 98.98 0.42 99.44
HEC6 1 99.21 0.04 0.21 99.46
HEC6 2 99.56 0.11 99.67
HEC6 3 99.89 0.06 99.95
HEC6 4 99.52 0.05 0.08 99.66
HEC6 5 99.56 0.04 99.60
HEC6 6 99.47 0.05 99.52
HEC6 7 99.64 0.11 99 .75
HEC6 8 99.22 99.22 HEC6 9 99.95 0.04 0.20 100.19 HEC6 10 99.46 0.10 99.56 HEC 1 1 99.50 0.19 99 .69 HEC 1 2 99.59 0.10 0.09 99.78 HEC 1 3 99.64 0.10 99.74 HEC 1 4 99.16 0.13 99 .29 HEC 1 5 98.81 98.81 HEC 1 6 100.02 0.02 0.18 100.22 HEC 1 7 99.32 0.02 0.10 0.11 99.55 HEC 1 8 98.99 0.02 0.07 0.21 99.29 HEC 1 9 0.71 98 .21 0.40 0.17 0.42 99.90 HEC 1 10 0.08 99.12 0.32 99.52 HEC 1 11 0.03 98.33 0.13 0.11 98.60 HEC 1 12 0.04 99.28 0.10 0.10 99.52 HEC 1 13 98.66 0.46 0.68 99.80 HEC 1 14 0.06 98.97 0.14 99.17 HEC 1 15 0.18 98.91 0.04 0.18 99.31 HEC 1 16 98.99 0.14 99.14
Blank = below detection limit
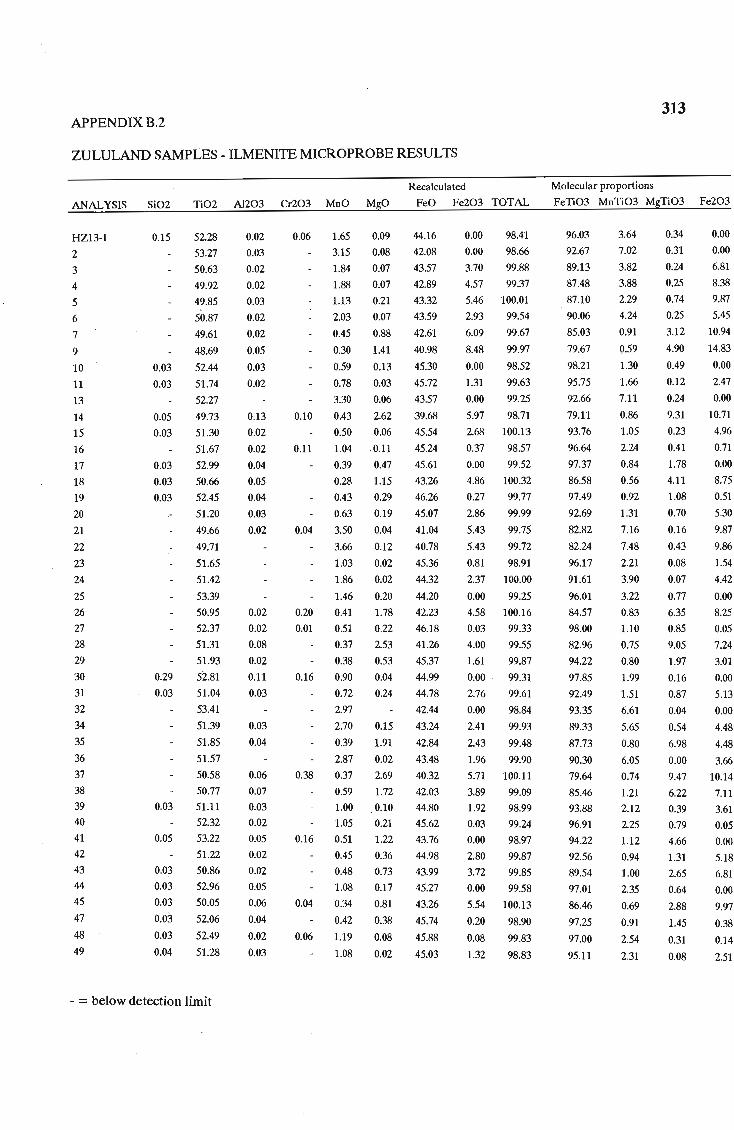
APPENDIX B.2 313
ZULULAND SAMPLES - ILMENITE MICROPROBE RESULTS
Recalculated Molecular proportions
ANALYSIS Si02 Ti02 AI203 Cr203 MnO MgO FeO Fe203 TOTAL FeTi03 MnTi03 MgTi03 Fe203
HZ13-1
2 3
4 5
6
7
9
10
11
13
14
15
16
17
18
19
20
21
22 23
24
25
26
27
28
29
30
31
32
34
35
36 37
38
39
40
41
42
43
44 45
47
48
49
0.15
0.03 0.03
0.05
0.03
0.03
0.03
0.03
0.29
0.03
0.03
0.05
0.03
0.03
0.03
0.03
0.03
0.04
52.28
53.27
50.63
49.92
49.85
50.87
49.61
48.69
52.44
51.74
52.27
49.73
51.30
51.67
52.99
50.66
52.45
51.20
49.66
49.71
51.65
51.42
53.39
50.95
52.37
51.31
51.93
52.81
51.04
53.41
51.39
51.85
51.57
50.58
50.77
51.11
52.32
53.22
51.22
50.86
52.96
50.05
52.06
52.49
51.28
-= below detection limit
0.02
0.03
0.02
0.02
0.03
0.02
0.02
0.05
0.03
0.02
0.13
0.02
0.02
0.04
0.05
0.04
0.03
0.02
0.02
0.02
0.08
0.02
0.11
0.03
0.03 0.04
0.06 0.07
0.03
0.02
0.05
0.02
0.02
0.05
0.06
0.04
0.02
0.03
0.06 1.65 0.09 44.16
3.15 0.08 42.08
1.84 0.07 43.57
1.88 0.07 42.89
1.13 0.21 43.32
2.03 0.07 43.59
0.45 0.88 42.61
0.30 1.41 40.98
0.59 0.13 45.30
0.78 0.03
3.30 0.06
0.10 0.43 2.62
0.50 0.06
0.11 1.04 .0.11
0.39 0.47
0.28 1.15
0.43 0.29
0.63 0.19
0.04 3.50 0.04
3.66 0.12
1.03 0.02
1.86 0.02
1.46 0.20
0.20 0.41 1.78
0.01 0.51 0.22
0.37 2.53
0.38 0.53
0.16 0.90 0.04
0.72 0.24
2.97
2.70 0.15
0.39 1.91
2.87 0.02
45.72
43.57
39.68
45.54
45.24
45.61
43:26
46.26
45.07
41.04
40.78
45.36
44.32
44:20
42.23
46.18
41.26
45.37
44.99
44.78
42.44
43.24
42.84
43.48
0.38 0.37 2.69 40.32
0.59 1.72 42.03
1.00 . 0.10 44.80
1.05 0.21 45.62
0.16 0.51 1.22 43.76
0.45 0.36 44.98
0.48 0.73 43.99
1.08 0.17 45.27
0.04 0.34 0.81 43.26
0.42 0.38 45.74
0.06 1.19 0.08 45.88
1.08 0.02 45.03
0.00 98.41
0.00 98.66
3.70 99.88
4.57 99.37
5.46 100.01
2.93 99.54
6.09 99.67
8.48 99.97
0.00 98.52
1.31 99.63
0.00 99.25
5.97 98.71
2.68 100.13
0.37 98.57
0.00 99.52
4.86 100.32
0.27 99.77
2.86 99.99
5.43 99.75
5.43 99.72
0.81 98.91
2.37 100.00
0.00 99.25
4.58 100.16
0.03 99.33
4.00 99.55
1.61
0.00
2.76
0.00
2.41
2.43
1.96
99.87
99.31
99.61
98.84
99.93
99.48
99.90
5.71 100.11
3.89 99.09
1.92 98.99
0.03 99.24
0.00 98.97
2.80 99.87
3.72 99.85
0.00 99.58
5.54 100.13
0:20 98.90
0.08 99.83
1.32 98.83
96.03
92.67
89.13
87.48
87.10
90.06
85.03
79.67
98.21
95.75
92.66
79.11
93.76
96.64
97.37
86.58
97.49
92.69
82.82
82.24
96.17
91.61
96.01
84.57
98.00
82.96
94.22
97.85
92.49
93.35
89.33
87.73
90.30
79.64
85.46
93.88
96.91
94.22
92.56
89.54
97.01
86.46
97.25
97.00
95.11
3.64
7.02
3.82
3.88
2.29
4.24
0.91
0.59
1.30
1.66
7.11
0.86
1.05
2.24
0.84
0.56
0.92
1.31
7.16
7.48
2.21
3.90
3.22
0.83
1.10
0.75
0.80
1.99
1.51
6.61
5.65
0.80
6.05
0.74
1.21
2.12
2.25
1.12
0.94
1.00
2.35
0.69
0.91
2.54
2.31
0.34
0.31
0.24
0.25
0.74
0.25
3.12
4.90
0.49
0.12
0.24
9.31
0.23
0.41
1.78
4.11
1.08
0.70
0.16
0.43
0.08
0.07
0.77
6.35
0.85
9.05
1.97
0.16
0.87
0.04
0.54
6.98
0.00
9.47
6:22
0.39
0.79
4.66
1.31
2.65
0.64
2.88
1.45
0.31
0.08
0.00
0.00
6.81
8.38
9.87
5.45
10.94
14.83
0.00
2.47
0.00
10.71
4.96
0.71
0.00
8.75
0.51
5;30
9.87
9.86
1.54
4.42
0.00
8.25
0.05
7.24
3.01
0.00
5.13
0.00
4.48
4.48
3.66
10.14
7.11
3.61
0.05
0.00
5.18
6.81
0.00
9.97
0.38
0.14
2.51

APPENDIX B.2
ZULULAND SAMPLES - ILMENITE MICROPROBE RESULTS
Recalculated
ANALYSIS Si02 Ti02 Al203 Cr203 MnO MgO FeO Fe203 TOTAL
50
Average
HZI0
1
2 3
4
5 6
7
8
9
10
11
13
14
16
17
18
19
HZ7
1
2
3
4
5
6
7
8
9
10
11
12
13
14
15
16
17
18
19
20
21
22 23
0.03
0.05
0.04
0.06
0.04
0.04
0.03
0.03
0.03
0.63
0.03
0.07
50.56
51.42
51.52
51.19
52.58
52.58
52.86
50.72
50.99
50.71
50.22
51.76
47.47
49.45
52.49
53.27
51.06
51.78
51.16
52.11
50.42
52.26
50.38
53.12
48.72
51.02
50.13
47.79
52.51
52.16
52.33
50.63
52.60
51.08
51.77
51.59
53.50
51.88
51.71
52.13
51.09
52.00
-= below detection limit
0.05
0.04
0.02
0.03
0.03
0.03
0.02
0.03
0.02
0.19
0.04
0.12
0.06
0.06
0.04
0.02
0.03
0.06
0.03
0.02
0.03
0.03
0.04
0.08
0.02
0.02
0.03
0.02
0.05
0.45
0.04
0.22
0.07
0.06
0.68 0.35
0.12 1.17 0.55
44.19
43.82
0.63 0.04 45.61
0.04 1.59 0.08 44.29
0.83 0.40 45.73
0.73 0.53 5.55 36.86
1.76 0.14 43.94
0.10 0.40 1.09 43.27
0.04 0.61 0.38 44.55
0.06 0.55 0.36 44.40
0.83 0.18 44.00
0.05 2.48 0.10 43.85
0.30 0.33 1.32 40.00
0.10 0.36 1.02 42.28
0.15 0.43 0.87 44.73
0.49 0.48 44.68
0.05 1.18 0.18 44.40
0.06 1.02 0.44 44.74
0.05 1.71 0.02 44.25
0.93 0.15
0.42 0.41
0.08 0.38 2.33
0.71 0.05
1.25 0.07
45.69
44.20
42.46
44.51
44.48
1.49 0.25 41.86
0.74 0.07 45.03
0.90 0.49 2.09 40.86
0.54 0.28 41.94
1.39 0.03 44.19
4.09 42.77
0.38 1.42 44.16
0.81 0.05 44.65
0.48 1.01 44.68
0.05 0.44 1.39 43.04
0.07 0.42 1.09 44.22
0.04 0.43 0.87 44.46
1.75 0.63 43.73
0.70 0.35 44.56
0.77 0.18 45.43
0.76 0.15 45.92
0.53 0.86 43.91
0.06 0.41 1.18 44.26
3.58
2.44
99.45
1.01 98.83
1.37 98.58
0.18 99.77
3.25 99.48
0.00 98.71
3.17 98.79
2.91 99.51
2.81 98.93
4.21 99.48
0.04 98.29
10.22 99.83
5.87 99.13
0.00 98.81
0.00 98.98
1.93 98.80
0.76 98.86
2.53 99.75
0.50
3.71
1.24
2.76
0.00
99.44
99.21
98.83
98.50
99.00
7.12 99.46
1.36 98.26
3.67 98.18
8.01 98.63
0.00 98.23
0.00 99.08
0.15 98.58
3.04 99.22
0.00 98.82
3.37 99.42
1.90 99.52
1.31 98.77
0.00 99.63
0.00 98.56
0.67 98.83
om 99.25
1.47 97.95
0.80 98.78
314
Molecular proportions
FeTi03 MnTi03 MgTi03 Fe203
90.72
96.56
93.70
96.40
73.42
95.58
89.27
91.91
92.25
89.88
94.15
77.10
84.99
95.73
97.08
93.18
94.71
91.66
96.49
90.77
88.24
93.10
96.97
83.34
95.55
84.44
83.54
%.79
91.14
93.51
92.45
95.11
87.84
91.54
93.38
93.79
97.12
96.37
97.78
92.84
93.18
1.41
1.36
3.40
1.76
1.06
3.87
0.84
1.28
1.16
1.71
5.40
0.65
0.73
0.94
1.07
2.50
2.18
3.59
2.00
0.88
0.80
1.51
2.75
3.01
1.58
1.03
1.10
3.09
8.82
0.82
1.71
1.04
0.92
0.89
0.90
3.80
1.54
1.66
1.64
1.14
0.86
1.27
0.17
0.30
1.50
19.70
0.55
4.00
1.41
1.35
0.67
0.37
4.53
3.66
3.33
1.85
0.67
1.67
0.04
0.57
1.49
8.65
0.19
0.28
0.89
0.27
7.70
1.01
0.12
0.04
5.37
0.18
3.85
5.04
4.02
3.25
2.41
1.34
0.69
0.57
3.23
4.44
6.61
1.92
2.61
0.34
5.82
0.00
5.89
5.40
5.25
7.74
0.08
17.72
10.62
0.00
0.00
3.64
1.44
4.71
0.95
6.86
2.32
5.20
0.00
12.76
2.60
6.83
14.36
0.00
0.00
0.30
5.66
0.00
6.20
3.54
2.47
0.00
0.00
1.28
0.01
2.80
1.52
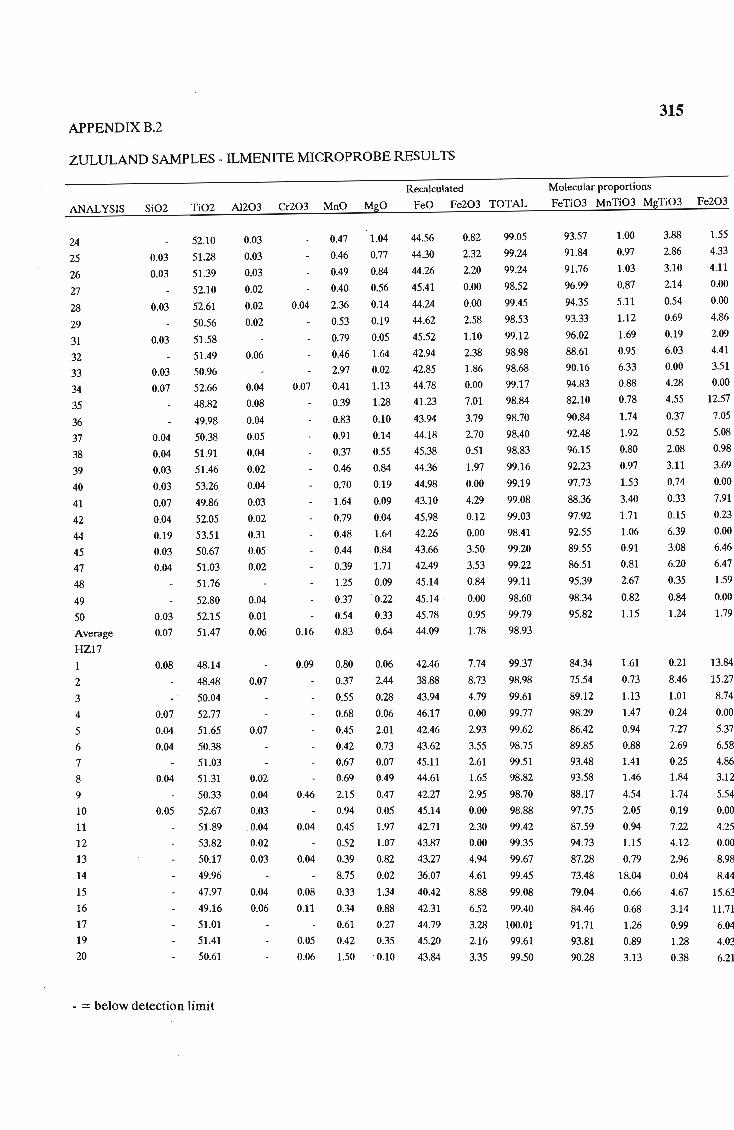
APPENDIX B.2 315
ZULULAND SAMPLES - ILMENITE MICROPROBE RESULTS
Recalculated Molecular proportions
ANALYSIS Si02 Ti02 Al203 Cr203 MnO MgO FeO Fe203 TOTAL FeTi03 MnTi03 MgTi03 Fe203
24
25
26
27
28
29
31
32
33
34
35
36
37
38
39
40
41
42
44
45
47
48
49
50
Average
HZ17
1
2
3
4
5
6
7
8
9
10
11
12
13
14
15
16
17
19
20
0.03
0.03
0.03
0.03
0.03
0.07
0.04
0.04
0.03
0.03
0.07
0.04
0.19
0.03
0.04
0.03
0.07
0.08
0.07
0.04
0.04
0.04
0.05
52.10
51.28
51.39
52.10
52.61
50.56
51.58
51.49
50.96
52.66
48.82
49.98
50.38
51.91
51.46
53.26
49.86
52.05
53.51
50.67
51.03
51.76
52.80
52.15
51.47
48.14
48.48
50.04
52.77
51.65
50.38
51.03
51.31
50.33
5],.67
51.89
53.82
50.17
49.96
47.97
49.16
51.01
51.41
50.61
-= below detection limit
0.03
0.03
0.03
0.02
0.02
0.02
0.06
0.04
0.08
0.04
0.05
0.04
0.02
0.04
0.03
0.02
0.31
0.05
0.02
0.04
0.01
0.06
0.07
0.07
0.02
0.04
0.03
0.04
0.02
0.03
0.04
0.06
0.47 1.04 44.56
0.46 0.77 44.30
0.49 0.84 44.26
0.40 0.56 45.41
0.04 2.36 0.14 44.24
0.53 0.19 44.62
0.79 0.05 45.52
0.46 1.64 42.94
2.97 O.oz 42.85
0.07 0.41 1.13 44.78
0.39 1.28 41.23
0.83 0.10 43.94
0.91 0.14 44.18
0.37 0.55 45.38
0.46 0.84 44.36
0.70 0.19 44.98
1.64 0.09 43.10
0.79 0.04
0.48 1.64
0.44 0.84
0.39 1.71
1.25 0.09
0.37 · 0.22
0.54 0.33
0.16 0.83 0.64
0.09 0.80 0.06
0.37 2.44
0.55 0.28
0.68 0.06
0.45 2.01
0.42 0.73
0.67 0.07
0.69 0.49
0.46 2.15 0.47
0.94 0.05
0.04 0.45 1.97
0.52 1.07
0.04 0.39 0.82
8.75 0.02
0.08 0.33 1.34
0.11 0.34 0.88
0.61 0.27
0.05 0.42 0.35
0.06 1.50 · 0.10
45.98
42.26
43.66
42.49
45.14
45.14
45.78
44.09
42.46
38.88
43.94
46.17
42.46
43.62
45.11
44.61
42.27
45.14
42.71
43.87
43.27
36.07
40.42
42.31
44.79
45.20
43.84
0.82 99.05
2.32 99.24
2.20 99.24
0.00 98.52
0.00 99.45
2.58 98.53
1.10 99.12
2.38 98.98
1.86 98.68
0.00 99.17
7.01 98.84
3.79 98.70
2.70 98.40
0.51 98.83
1.97 99.16
0.00 99.19
4.29 99.08
0.12
0.00
3.50
3.53
0.84
0.00
0.95
1.78
7.74
8.73
4.79
0.00
2.93
3.55
2.61
1.65
2.95
0.00
2.30
0.00
4.94
99.03
98.41
99.20
99.22
99.11
98.60
99.79
98.93
99.37
98.98
99.61
99.77
99.62
98.75
99.51
98.82
98.70
98.88
99.42
99.35
99.67
4.61 99.45
8.88 99.08
6.52 99.40
3.28 100.01
2.16 99.61
3.35 99.50
93.57
91.84
91.76
96.99
94.35
93.33
96.02
88.61
90.16
94.83
82.10
90.84
92.48
96.15
92.23
97.73
88.36
97.92
92.55
89.55
86.51
95.39
98.34
95.82
84.34
75.54
89.12
98.29
86.42
89.85
93.48
93.58
88.17
97.75
87.59
94.73
87.28
73.48
79.04
84.46
91.71
93.81
90.28
1.00
0.97
1.03
0.87
5.11
1.12
1.69
0.95
6.33
0.88
0.78
1.74
1.92
0.80
0.97
1.53
3.40
1.71
1.06
0.91
0.81
2.67
0.82
1.15
1.61
0.73
1.13
1.47
0.94
0.88
1.41
1.46
4.54
2.05
0.94
1.15
0.79
18.04
0.66
0.68
1.26
0.89
3.13
3.88
2.86
3.10
2.14
0.54
0.69
0.19
6.03
0.00
4.28
4.55
0.37
0.52
2.08
3.11
0.74
0.33
0.15
6.39
3.08
6.20
0.35
0.84
1.24
0.21
8.46
1.01
0.24
7.27
2.69
0.25
1.84
1.74
0.19
7.22
4.12
2.96
0.04
4.67
3.14
0.99
1.28
0.38
1.55
4.33
4.11
0.00
0.00
4.86
2.09
4.41
3.51
0.00
12.57
7.05
5.08
0.98
3.69
0.00
7.91
0.23
0.00
6.46
6.47
1.59
0.00
1.79
13.84
15.27
8.74
0.00
5.37
6.58
4.86
3.12
5.54
0.00
4.25
0.00
8.98
8.44
15.63
11.71
6.04
4.03
6.21

APPENDIX B.2 316
ZULULAND SAMPLES - ILMENITE MICROPROBE RESULTS
Recalculated Molecular proportions
ANALYSIS Si02 Ti02 AI203 Cr203 MnO MgO FeO Fe203 TOTAL FeTi03 MnTi03 MgTi03 Fe203
21
22
23
24
25
26
27
28
29
30
31
32
33
34
35
36
37
39
40
41
42
43
44
46
47
48
49
50
51
52
53
54
55
57
58
59
Average
HZ2
1
2
3
4
5
6
7
0.04
0.05
0.03
0.03
0.03
0.05
0.05
53.50
50.24
48.50
50.65
51.12
50.87
51.24
48.34
51.32
53.21
50.22
51.23
51.67
53.02
50.47
51.96
51.99
49.02
50.71
49.43
50.34
52.03
48.43
50.22
53.03
50.76
51.04
52.82
51.54
51.35
51.25
52.20
50.78
50.40
51.69
53.53
50.96
52.02
49.66
50.41
49.76
50.28
50.71
51.16
-= below detection limit
0.11
0.03
0.03
0.04
0.06
0.05
0.01
0.02
0.03
0.02
0.04
0.06
0.03
0.03
0.02
0.03
0.06
0.02
0.G4
0.07
0.05
0.06
0.06
0.96 0.31
0.54 0.05
0.39 0.35 4.03
3.29
0.41 '1.22
0.39 0.63
0.40 0.71
1.82 0.03
44.80
44.57
36.08
42.20
43.38
44.24
44.43
41.57
0.58 0.12 45.36
0.77 0.12 44.97
2.98 42.14
0.04 3.51 0.04 42.46
0.15 0.55 0.68 44.71
0.04 0.86 0.07 44.08
0.05 1.59 0.07 43.68
0.90 0.02 45.82
0.07 0.41 0.25 45.92
1.71 0.07 42.24
0.48 1.01 43.35
0.77 0.62 42.58
0.36 0.61 43.83
1.02 0.04 45.71
0.31 0.87 41.70
0.04 1.18 0.14 43.73
0.64 1.75 43.72
0.43 0.47 44.39
0.36 ,1 .14 43.51
0.86 0.19 44.85
2.39 0.03
0.45 0.54
2.75 0.08
0.04 0.98 0.19
5.57 0.04
0.38 1.95
0.10 0.41 0.92
1.63 0.11
0.11 1.16 0.62
6.79 0.04
1.48 0.05
0.50 0.06
0.30 1.25
0.35 1.05
0.49 0.85
0.46 1.33
43.87
44.75
43.17
45.63
39.95
41.48
44.43
44.25
43.36
39.85
43.08
44.73
42.28
42.98
43.61
43.19
0.00
3.86
9.31
3.51
2.74
3.72
2.08
7.77
99.62
99.26
98.75
99.68
98.91
99.90
98.91
99.56
2.18 99.60
0.00 99.15
4.00 99.40
2.64 99.93
1.23 99.07
0.00 98.16
3.57 99.45
0.94 99.70
0.30 99.00
6.42 99.50
3.61 99.24
6.51 99.94
3.65 98.89
0.77 99.61
7.60 99.00
3.88 99.22
0.00 99.19
3.58 99.69
3.14 99.22
0.00 98.74
1.54
2.11
2.39
0.30
3.22
4.06
1.30
0.00
3.14
0.82
4.36
3.49
4.87
3.42
3.39
2.93
99.38
99.24
99.67
99.36
99.60
98.37
98.87
99.53
99.31
99.54
98.63
99.22
98.58
98.14
99.12
99.15
%.71
91.58
69.40
86.63
89.56
90.10
92.62
82.38
94.25
97.83
86.38
87.61
93.95
97.82
89.84
96.24
97.59
84.67
88.67
84.63
90.23
96.21
82.74
89.85
92.08
90.79
89.29
97.37
91.91
93.08
89.47
96.62
82.27
84.67
93.22
96.01
89.69
83.84
88.67
92.24
85.95
89.00
89.62
88.76
2.11
1.12
0.68
6.85
0.86
0.80
0.85
3.66
1.22
1.69
6.19
7.35
1.17
1.92
3.31
1.92
0.89
3.47
0.99
1.55
0.75
2.17
0.63
2.45
1.37
0.89
0.75
1.89
5.08
0.96
5.77
2.10
11.62
0.79
0.87
3.57
14.47
3.09
1.05
0.61
0.74
1.01
0.96
1.19
0.17
13.81
0.03
4.48
2.30
2.63
0.11
0.45
0.48
0.05
0.13
2.55
0.26
0.24
0.06
0.94
0.26
3.70
2.18
2.25
0.17
3.06
0.52
6.55
1.73
4.17
0.75
0.10
2.02
0.31
0.72
0.15
7.09
3.46
0.42
0.13
0.17
0.23
4.53
3.89
3.10
4.86
0.00
7.13
16.11
6.49
5.09
6.81
3.90
13.85
4.08
0.00
7.39
4.91
2.33
0.00
6.61
1.79
0.58
11.59
6.64
11.64
6.77
1.45
13.57
7.18
0.00
6.59
5.80
0.00
2.91
3.94
4.46
0.57
5.96
7.46
2.45
0.00
1.56
8.07
6.48
8.91
6.37
6.27
5.42

APPENDIX B.2 317
ZULULAND SAMPLES - ILMENITE MICROPROBE RESULTS
Recalculated Molecular proportions
ANALYSIS Si02 Ti02 Al203 Cr203 MnO MgO FeO Fe203 TOTAL FeTi03 MnTi03 MgTi03 Fe203
8 9
10
11
12
13
14
15
17
19
20
21
22
23
24
25
26
27
28
29
30
31
32
33
35
38
39
40
41
42
43
44
45
46
47
48
50
51
52
53
54
55
56
57
58
0.12
0.08
0.03
0.03
0.03
0.03
.-
0.03
0.03
50.18
52.44
52.90
51.31
51.47
51.98
51.45
51 .63
52.36
50.74
50.76
54.89
51.47
46.71
49.39
46.07
51.47
50.50
51.56
51.13
49.85
53.10
50.84
47.33
52.05
50.91
49.35
51.79
50.46
51.78
52.38
50.22
51.32
49.73
51.99
52.88
49.95
53.42
51.26
52.89
51.05
51.77
49.24
52.30
53.02
-= below detection limit
0.03
0.04
0.04
0.13
0.04
0.06
0.02
0.07
0.02
0.17
0.03
0.03
0.03
0.04
0.04
0.05
0.02
0.02
0.06
0.05
0.06
0.03
0.08
0.04
0.06
0.02
0.09
0.07
0.03
0.03
0.05
0.06
0.04
0.05
0.18
0.47 0.59
1.33 0.16
1.24 0.23
0.46 0.63
0.45 0.38
0.73 0.20
0.46 0.45 1.76
0.49 0.86
0.79 ·0.02
0.11 0.46 1.53
0.69 0.33
0.05 0.94 0.05
1.83 0.02
0.08 0.54 0.48
2.74 0.02
0.80 0.23
0.06 0.54 0.59
0.34 0.40 1.28
2.54 0.02
0.42 0.04
1.92 0.04
0.04 0.47 0.25
0.41 1.91
0.09 0.48 1.18
0.49 0.34
0.06 0.79 0.29
0.10 0.72 1.34
7.07 0.04
0.06 0.48 0.61
0.07 0.62 1.05
0.92 . 0.09
3.38 0.03
0.65 0.05
0.07 0.35 0.61
0.93 0.54
4.01 0.11
0.25 0.58 0.41
1.46 0.17
2.01 0.12
0.64 0.99
1.03 0.48
1.35 0.07
1.97 0.02
1.82 0.07
0.40 0.65
43.62
45.54
45.67
44.58
45.15
45.67
42.68
44.41
45.61
42.44
44.36
40.31
44.41
40.61
4.34 99.24
0.42 99.90
0.00 100.06
2.24 99.26
2.04 99.53
0.00 98.84
2.10 98.95
2.09 99.54
0.00 98.81
4.64 100.00
3.89 100.05
0.00 96.48
1.70 99.50
10.96 99.42
41.59 6.53 100.29
40.22 12.12 99.51
44.70 1.33 98.76
42.75 3.90 99.23
43.80 0.85 98.85
45.52 2.47 99.65
42.85 4.54 99.25
45.48 0.00 99.36
41.90 4.82 99.96
39.97 9.66 98.76
45.73 0.02 98.71
44.47 2.52 99.08
41.27
39.37
43.80
44.07
46.01
41.68
45.41
43.29
44.85
42.93
43.60
45.57
43.87
44.34
44.03
45.07
42.27
45.09
44.09
5.50 98.35
1.52 99.80
4.63 100.08
1.42 99.07
1.29 100.73
4.35 99.70
2.75 100.23
5.85 99.98
1.30 99.69
0.00 99.97
4.24 99.05
0.00 100.62
1.32 98.66
0.00
2.01
0.06
4.67
0.30
0.00
98.93
98.66
98.37
98.17
99.61
98.38
88.94
95.79
96.48
92.54
93.81
97.65
88.62
91.91
98.21
85.20
90.26
97.50
92.84
78.29
82.71
76.83
94.10
87.33
92.86
94.37
87.55
98.02
83.71
77.98
97.61
92.54
83.66
82.08
88.41
92.10
95.32
84.94
93.38
86.60
93.58
90.99
89.46
96.25
92.72
94.82
92.22
96.70
87.18
95.27
96.57
0.97
2.82
2.66
0.96
0.95
1.59
0.94
1.03
1.73
0.93
1.42
2.30
3.87
1.05
5.52
1.56
1.16
0.82
5.46
0.88
3.98
1.03
0.83
0.95
1.06
1.67
1.47
14.93
0.98
1.32
1.93
6.98
1.36
0.70
1.96
8.61
1.20
3.12
4.31
1.39
2.19
2.94
4.12
3.90
0.88
2.13
0.59
0.86
2.32
1.42
0.76
6.51
3.16
0.06
5.47
1.20
0.21
0.09
1.67
0.09
0.78
2.23
4.67
0.07
0.14
0.13
0.96
6.80
4.11
1.30
1.06
4.83
0.13
2.21
3.91
0.34
0.10
0.17
2.17
2.01
0.40
1.51
0.63
0.47
3.78
1.79
0.25
0.03
0.25
2.56
7.96
0.79
0.00
4.18
3.82
0.00
3.92
3.90
0.00
8.39
7.12
0.00
3:20
19.00
11.68
20.83
2.51
7.18
1.62
4.61
8.34
0.00
8.66
16.96
0.04
4.73
10.04
2.85
8.40
2.67
2.41
7.98
5.09
10.54
2.45
0.00
7.83
0.00
2.50
0.00
3.80
0.11
8.67
0.57
0.00

APPENDIX B.2
NATAL SAMPLES - ILMENITE MICROPROBE RESULTS
ANALYSIS Si02 Ti02
HN27-1
2 3
4 5 6
7
8
9
10
12
13
14
15
16
17
18
19
20
21
22 23
24
25
28
29
30
31
32
33
34
38
39
40
41
43
44 45
46
47
48
49
50
51
53
51.35
50.90
53.34
49.88
52.16
50.38
49.36
50.77
50.21
49.96
51.49
52.57
0.03 49.76
0.03
0.05
0.03
0.04
0.03
0.03
0.03
0.04
0.04
52.09
52.18
51.39
51.54
51.02
51.93
50.54
48.56
51.78
49.85
52.43
51.33
51.79
51.89
50.50
50.92
52.24
52.41
51.50
51.40
50.05
51.30
52.15
53.40
49 •. 42
50.19
50.33
50.95
50.54
50.96
50.79
51.85
- = below detection limit
A1203
0.03
0.04
0.02
0.05
0.02
0.05
0.09
0.07
0.06
0.02
0.03
0.06
0.02
0.02
0.03
0.02
0.04
0.05
0.03
0.03
0.04
0.06
0.05
0.02
0.09
0.02
0.04
0.03
0.04
0.03
0.02
0.02
0.02
0.04
0.02
0.05
Recalculated
Cr203 MnO MgO FeO Fe203 TOTAL
0.04 0.44 0.60 44.68
0.42 0.28 44.87
0.13 0.66 0.52 44.79
0.05 0.41 0.63 43.34
0.66 0.02 46.23
0.15 0.50 1.64 41.89
0.06 0.41 1.21 41.83
0.06 0.44 2.45 40.87
0.86 0.34 43.69
1.57 0.02 43.36
0.43 0.33 45.28
0.48 0.65 45,30
0.58 0.30 43.65
2.03 0.04 44.73
0.05 1.03 0.05 45.81
0.07 1.21 0.06 44.89
0.47 1.27
0.07 0.86 0.19
0.06 1. 75 0.03
0.05 0.96 0.02
0.06 1.30 0.17
0.52 0.28
0.04 0.55 0.36
0.06 0.48 0.86
0.07 0.60 0.06
0.43 0.73
1.57 0.02
0.07 0.42 0.93
0.44 1.05
0.38 0.53
0.02 0.47 0.52
0.85 0.24
0.31 1.34
0.78 0.11
0.43 0.69
1.17 0.05
43.65
44.69
44.88
44.49
42.05
45.54
43.63
45.13
45.47
44.86
45.06
43.34
43.50
45.70
45.62
45.03
43.53
44.05
44.51
45.67
1.10 0.19 45.00
0.05 0.42 2.91 38.85
0.96 0.12 43.97
0.49 0.27 44.31
0.68 0.13 44.94
0.43 0.14 44.78
0.63 0.06 45.13
0.04 0.33 1.70 42.31
0.41 0.60 45.16
3.02 100.17
2.88 99.44
0.00 99.47
5.69 100.06
0.31 99.44
5.41 100.01
6.60 99.55
5.37 100.04
4.45 99.64
4.30 99.22
1.60 99.16
0.00 99.04
5.66 100.00
0.47 99.37
0.75 99.88
1.68 99.32
2.37
2.90
0.67
99.37
99.76
99.35
2.66 98.74
7.97 100.12
1.69
5.34
0.92
1.97
1.54
0.72
4.30
99.86
99.79
99.91
99.55
99.40
99.31
99.59
4.12 100.12
0.00 98.97
0.00 99.10
1.64 99.29
2.01 98.70
4.28
2.37
0.08
99.32
99.39
99.19
0.00 99.74
7.56 99.29
4.78 100.09
3.86 99.35
2.33 99.09
3.48 99.43
2.88 99.75
4.22 99.42
1.72 99.86
318
Recalculated mole fraction
FeTi03 MnTi03 MgTi03 Fe203
91.35
92.73
96.57
86.69
97.95
83.49
83.10
80.92
88.84
88.79
94.82
96.50
87.52
94.59
96.22
94.04
89.98
92.13
94.85
92.95
82.71
94.70
87.91
94.06
94.82
93.52
95.20
87.94
87.84
97.15
97.02
94.21
90.61
90.10
92.14
97.14
96.87
75.77
88.90
90.87
93.70
92.14
93.10
85.51
93.71
0.92
0.89
1.44
0.82
1.41
1.00
0.82
0.88
1.78
3.25
0.92
1.03
1.18
4.35
2.18
2.58
0.97
1.80
3.74
2.02
2.58
1.10
1.13
1.02
1.27
0.90
3.36
0.86
0.90
0.82
1.01
1.80
0.66
1.62
0.90
2.52
2.41
0.83
1.96
1.03
1.44
0.89
1.33
0.68
0.87
2.18 5.56
1.02 5.36
1.99 0.00
2.25 10.24
0.06 0.59
5.81 9.70
4.28 11.80
8.64 9.57
1.24 8.14
0.03 7.93
1.24 3.02
2.46 0.00
1.09 10.22
0.16 0.90
0.18 1.42
0.21 3.17
4.65
0.68
0.13
0.02
0.61
1.03
1.29
3.19
0.21
2.70
0.08
3.36
3.77
2.02
1.97
0.90
4.96
0.40
2.54
0.20
0.72
10.13
0.44
0.99
0.48
0.52
0.22
6.14
2.22
4.40
5.39
1.28
5.01
14.10
3.17
9.68
1.73
3.70
2.89
1.36
7.85
7.49
0.00
0.00
3.08
3.77
7.88
4.42
0.15
0.00
13.27
8.70
7.12
4.37
6.45
5.36
7.67
3.21
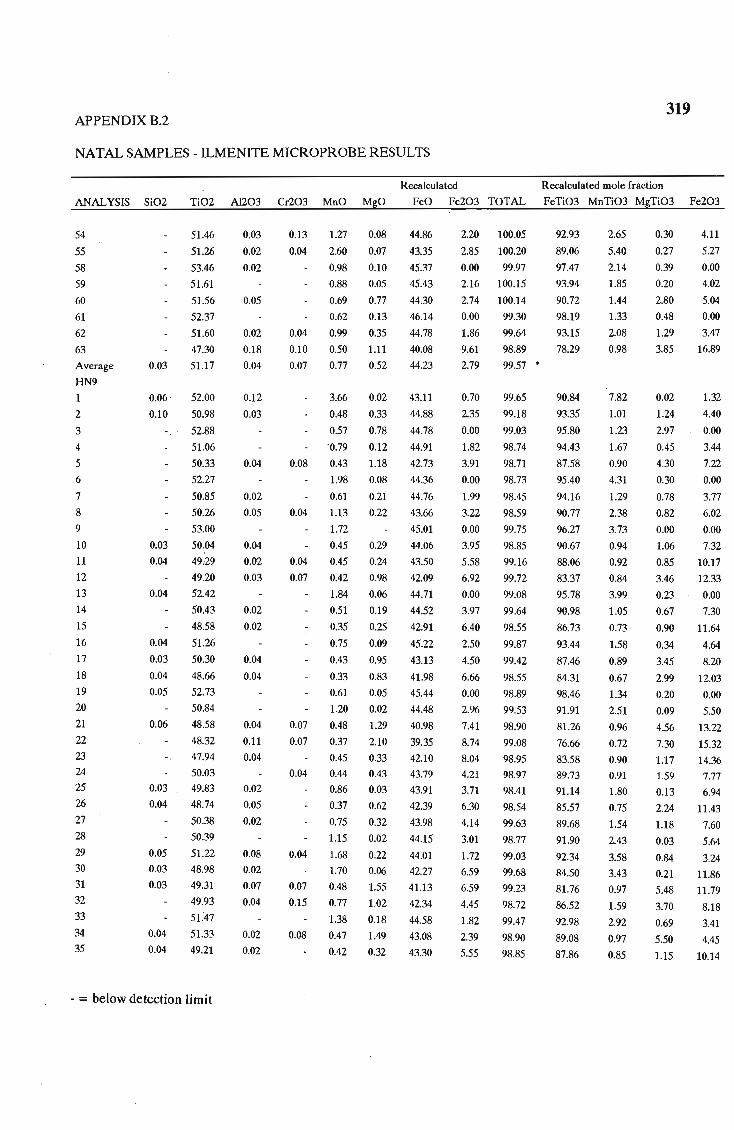
APPENDIX B.2 319
NATAL SAMPLES - ILMENITE MICROPROBE RESULTS
Recalculated Recalculated mole fraction
ANALYSIS Si02 Ti02 Al203 Cr203 MnO MgO FeO Fe203 TOTAL FeTi03 MnTi03 MgTi03 Fe203
54
55
58
59
60
61
62
63
Average
HN9
1
2 3
4
5
6
7
8
9
10
11
12
13
14
15
16
17
18
19
20
21
22 23
24
25
26
27
28
29
30
31
32
33
34
35
0.03
51.46
51.26
53.46
51.61
51.56
52.37
51.60
47.30
51.17
0.06 · 52.00
0.10 50.98
0.03
0.04
0.04
0.04
0.03
0.04
0.05
0.06
0.03
0.04
0.05
0.03
0.03
0.04
0.04
52.88
51.06
50.33
52.27
50.85
50.26
53.00
50.04
49,29
49.20
52.42
50.43
48.58
51.26
50.30
48.66
52.73
50.84
48.58
48.32
47.94
50.03
49.83
48.74
50.38
50.39
51.22
48.98
49.31
49.93
51."47
51.33
49.21
-= below detection limit
0.03
0.02
0.02
0.05
0.02
0.18
0.04
0.12
0.03
0.04
0.02
0.05
0.04
0.02
0.03
0.02
0.02
0.04
0.04
0.04
0.11
0.04
0.02
0.05
0.02
0.08
0.02
0.07
0.04
0.02
0.02
0.13 1.27 0.08
0.04 2.60 0.07
0.98 0.10
0.88 0.05
0.69 0.77
0.62 0.13
0.04 0.99 0.35
0.10 0.50 1.11
0.07 0.77 0.52
3.66 0.02
0.48 0.33
0.57 0.78
0.79 0.12
0.08 0.43 1.18
1.98 0.08
0.61 0.21
0.04 1.13 0.22
1.72
0.45 0.29
0.04 0.45 0.24
0.07 0.42 0.98
1.84 0.06
0.51 0.19
0.35 0.25
0.75 0.09
0.43 0.95
44.86
43.35
45.37
45.43
44.30
46.14
44.78
40.08
44.23
43.11
44.88
44.78
44.91
42.73
44.36
44.76
43.66
45.01
44.06
43.50
42.09
44.71
44.52
42.91
45.22
43.13
0.33 0.83 41.98
0.61 0.05 45.44
1.20 0.02 44.48
0.07 0.48 1.29 40.98
0.07 0.37 2.10 39.35
0.45 0.33 42.10
0.04 0.44 0.43 43.79
0.86 0.03 43.91
0.37 0.62 42.39
0.75 0.32 43.98
1.15 0.02 44.15
0.04 1.68 0.22 44:01
1.70 0.06 42.27
0.07 0.48 1.55 41.13
0.15 0.77 1.02 42.34
1.38 0.18 44.58
0.08 0.47 1.49 43.08
0.42 0.32 43.30
2.20 100.05
2.85 100.20
0.00 99.97
2.16 100.15
2.74 100.14
0.00 99.30
1.86 99.64
92.93
89.06
97.47
93.94
90.72
98.19
93.15
9.61
2.79
98.89 78.29
0.70
2.35
0.00
1.82
3.91
0.00
1.99
3.22
0.00
3.95
5.58
6.92
0.00
3.97
6.40
2.50
4.50
6.66
0.00
2.96
7.41
8.74
8.04
4.21
3.71
6.30
4.14
3.01
1.72
6.59
6.59
4.45
1.82
2.39
5.55
99.57 •
99.65
99.18
99.03
98.74
98.71
98.73
98.45
98.59
99.75
98.85
99.16
99.72
99.08
99.64
98.55
99.87
99.42
98.55
98.89
99.53
98.90
99.08
98.95
98.97
98.41
98.54
99.63
98.77
99.03
99.68
99.23
98.72
99.47
98.90
98.85
90.84
93.35
95.80
94.43
87.58
95.40
94.16
90.77
96.27
90.67
88.06
83.37
95.78
90.98
86.73
93.44
87.46
84.31
98.46
91.91
81.26
76.66
83.58
89.73
91.14
85.57
89.68
91.90
92.34
84.50
81.76
86.52
92.98
89.08
87.86
2.65
5.40
2.14
1.85
1.44
1.33
2.08
0.98
7.82
1.01
1.23
1.67
0.90
4.31
1.29
2.38
3.73
0.94
0.92
0.84
3.99
1.05
0.73
1J58
0.89
0.67
1.34
2.51
0.96
0.72
0.90
0.91
1.80
0.75
1.54
2.43
3.58
3.43
0.97
1.59
2.92
0.97
0.85
0.30
0.27
0.39
0.20
2.80
0.48
1.29
3.85
0.02
1.24
2.97
0.45
4.30
0.30
0.78
0.82
0.00
1.06
0.85
3.46
0.23
0.67
0.90
0.34
3.45
4.11
5.27
0.00
4.02
5.04
0.00
3.47
16.89
1.32
4.40
0.00
3.44
7.22
0.00
3.77
6.02
0.00
7.32
10.17
12.33
0.00
7.30
11.64
4.64
8.20
2.99 12.03
0.20 0.00
0.09 5.50
4.56 13.22
7.30 15.32
1.17 14.36
1.59 7.77
0.13 6.94
2.24 11.43
1.18 7.60
0.03 5.64
0.84 3.24
0.21 11.86
5.48 11.79
3.70 8.18
0.69 3.41
5.50 4.45
1.15 10.14

APPENDIX B.2 320
NATAL SAMPLES - ILMENITE MICROPROBE RESULTS
Recalculated Recalculated mole fraction
ANALYSIS Si02 Ti02 Al203 Cr203 MnO MgO FeO Fe203 TOTAL FeTi03 MnTi03 MgTi03 Fe203
36
37
38
39
41
42
44
45
46
47
48
49
50
53
54
55
56-60
HN5
1
2
3
4
5
6
7
8
9
10
11
12
13
14
15
16
17
18
19
21
24
25
26
27
28
29
0.03
0.03
0.03
48.53
49.55
51.05
48.91
50.06
52.80
51.39
50.54
49.65
49.63
51.10
50.39
50.23
0.04 50.08
0.04 51.64
0.11 51.19
0.04 50.01
0.03
50.94
48.58
51.49
50.26
50.78
49:33
50,43
48.41
51.78
49.59
49.56
53.05
49.79
51.15
51.09
50.77
52.58
49.78
50.81
49.18
51.24
51.16
52.03
51.58
52.79
51.88
-= below detection limit
0.02
0.04
0.02
0.04
0.04
0.04
0.02 0.06
0.03
0.05
0.02
0.02
0.03
0.03
0.06
0.02
0.03
0.04
0.03
0.03
0.05
0.08
0.02
0.04
0.02
0.05
0.05
0.41
0.02
0.02
0.05
0.62 0.04 42.97
0.57 0.58 42.98
0.04 1.12 0,07 44.67
0,04 0.60 0.12 43.20
0.05 0.43 1.61 41.75
0.04 3.51 0.15
0.04 0.77 0.10
0.05 0.49 0.42
43.58
45.27
44.22
0.04 0.54 0.56 43.11
0.07 0.67 0.53 43.01
0.51 0.92 43.80
0.04 0.70 0.39 43.92
0.46 0.45 43.91
0.10 1.97 43.09
0.12 1.10 0.07 45.25
0.10 2.55 0.05 43.50
0.11 1.07 0.08 43.78
0.06 1.40 0.02
0.72 0.35 3.29
1.33 0.04
1.66 0.13
1.00 0.06
0.69 0.38
0.53 0.87
0.16 0.43 2.69
0.80 0.06
0.07 0.36 1.42
0.07 0.35 1.70
0.16 2.87 0.09
0.07 0.34 1.71
0.04 0.82 0.08
1.39 0.03
1.19 0.03
0.04 0.65 0.48
1.61 0.28
0.06 1.16 0.06
0.11 0.38 0.85
0.39 0.30
0.09 0.85 0.20
0.08 0.47 0.80
0.05 2.44 0.10
0.56 0.40
0.09 0.79 0.28
44.37
37:47
44.91
43.30
44.55
42.99
43.27
38.31
45.65
41.70
41.20
44.00
41.41
45.05
44.49
44.43
45.67
42.63
44.40
42.37
45.17
44.80
45.00
43.75
45.47
45.37
7.40
5.27
1.47
6.60
5.37
99.62
99.05
98.45
99.53
99.34
0.00 100.09
2.38 99.98
3.06 98.83
4.87 98.84
4.71 98.63
2.85 99.26
3.74 99.22
5.03 100.15
4.48 99.78
1.20 99.44
1.70 99.22
4.65 99.77
1.85
8.32
1.21
3.61
2.33
5.34
98.65
98;79
99.02
99.03
98.74
98.76
4.54 99.70
8.71 98.74
1.51 99.79
6.39 99.58
6.39 99.35
0.00 100.20
5.25 98.67
2.84 100.03
2.45 99.50
3.61 100.09
0.00 99.46
5.65
2.84
6.24
2.38
2.49
0.15
1.51
0.00
0.75
99.99
99.38
99.58
99.54
99.61
98.69
99.47
99.25
99.19
85.36
87.12
94.54
86.48
83.68
91.95
93.58
91.71
87.91
88;01
90.27
90.21
88.35
87.73
95.14
91.21
88.99
93.45
73.23
94.72
89.34
93.26
87.43
87.54
74.58
95.27
82.82
81.85
93.47
83.61
92.74
92.38
90.80
96.80
85.52
92.02
84.94
93.63
92.84
95.65
91.59
97.27
95.82
1.25
1.18
2.40
1.21
0.88
7.50
1.61
1.04
1.12
1.39
1.07
1.45
0.93
4.06
2.34
5.41
2.21
3.00
0.69
2.83
3.48
2.12
1.43
1.08
0.85
1.69
0.73
0.71
6.18
0.69
1.70
2.92
2.46
1.39
3.27
2.44
0.77
0.81
1.78
1.00
5.17
1.21
1.69
0.16
2.08
0.26
0.42
5.75
0.55
0.37
1.55
2.04
1.92
3.37
1.43
1.62
0.00
0.25
0.17
0.30
0.04
11.46
0.16
0.48
0.23
1.38
3.12
9.32
0.21
5.03
6.02
0.35
6.15
0.30
0.12
0.10
1.80
1.02
0.23
3.03
1.12
0.74
3.05
0.39
1.52
1.07
13.23
9.62
2.81
11.88
9.69
0.00
4.44
5.71
8.93
8.68
5.29
6.91
9.10
8.22
2.27
3.21
8.50
3.52
14.62
2.29
6.71
4.40
9.76
8.26
15.25
2.83
11.41
11.42
0.00
9.55
5.26
4.58
6.64
0.00
10.19
5.30
11.26
4.43
4.64
0.29
2.85
0.00
1.42
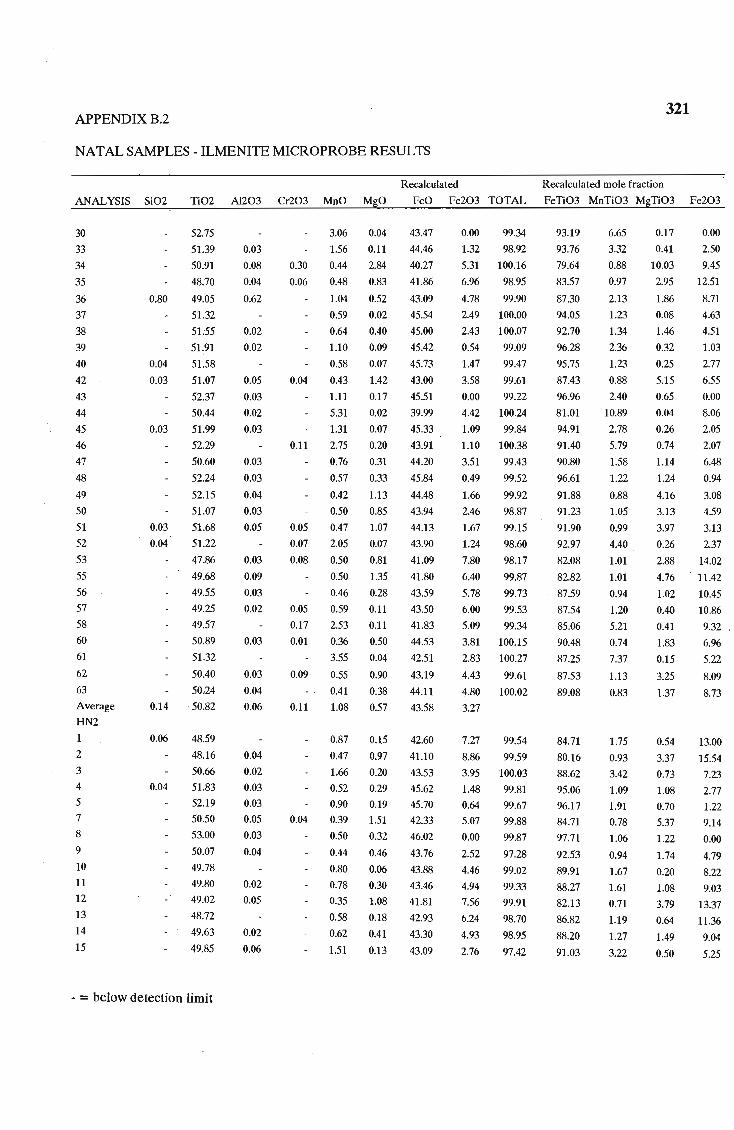
APPENDIX B.2 321
NATAL SAMPLES - ILMENITE MICROPROBE RESULTS
Recalculated Recalculated mole fraction
ANALYSIS Si02 Ti02 AI203 Cr203 MnO MgO FeO Fe203 TOTAL FeTi03 MnTi03 MgTi03 Fe203
30
33
34
35
36
37
38
39
40
42
43
44
45
46
47
48
49
50
51
52
53
55
56
57
58
60
61
62
63
Average
HN2
1
2
3
4
5 7
8
9
10
11
12
13
14
15
0.80
0.04
0.03
0.03
0.03
0.04
0.14
0.06
0.04
52.75
51.39
50.91
48.70
49.05
51.32
51:55
51.91
51.58
51.07
52.37
50.44
51.99
52.29
50.60
52.24
52.15
51.07
51.68
51.22
47.86
49.68
49.55
49.25
49.57
50.89
51.32
50.40
50.·24
50.82
48.59
48.16
50.66
51.83
52.19
50.50
53.00
50.07
49.78
49.80
49.02
48.72
49.63
49.85
-= below detection limit
0.03
0.08
0.04
0.62
0.02
0.02
0.05
0.03
0.02
0.03
0.03
0.03
0.04
0.03
0.05
0.03
0.09
0.03
0.02
0.03
0.03
0.04
0.06
0.04
0.02
0.03
0.03
0.05
0.03
0.04
0.02
0.05
0.02
0.06
3.06 0.04
1.56 0.11
43.47
44.46
0.30 0.44 2.84 40.27
0.06 0.48 0.83 41.86
1.04 0.52 43.09
0.59 0.02 45.54
0.64 0.40 45.00
1.10 0.09 45.42
0.58 0.07 45.73
0.G4 0.43 1.42 43.00
1.11 0.17 45.51
5.31 0.02 39.99
1.31 0.07 45.33
0.11 2.75 0.20 43.91
0.05
0.07
0.76 0.31
0.57 0.33
0.42 1.13
0.50 0.85
0.47 1.07
2.05 0.07
0.08 0.50 0.81
44.20
45.84
44.48
43.94
44.13
43.90
41.09
41.80
43.59
43.50
41.83
44.53
42.51
43.19
44.11
43.58
0.50 1.35
0.46 0.28
0.05 0.59 0.11
0.17 2.53 0.11
0.01 0.36 0.50
3.55 0.G4
0.09 0.55 0.90
0.41 0.38
0.11 1.08 0.57
0.87 0.15 42.60
0.47 0.97 41.10
1.66 0.20 43.53
0.52 0.29 45.62
0.90 0.19 45.70
0.04 0.39 1.51 42.33
0.50 0.32 46.02
0.44 0.46 43.76
0.80 0.06 43.88
0.78 0.30 43.46
0.35 1.08 41.81
0.58 0.18
0.62 0.41
1.51 0.13
42.93
43.30
43.09
0.00
1.32
99.34
98.92
5.31 100.16
6.96 98.95
4.78 99.90
2.49 100.00
2.43 100.07
0.54 99.09
1.47 99.47
3.58 99.61
0.00 99.22
4.42 100.24
1.09 99.84
1.10 100.38
3.51
0.49
1.66
2.46
1.67
1.24
99.43
99.52
99.92
98.87
99.15
98.60
7.80 98.17
6.40 99.87
5.78 99.73
6.00 99.53
5.09 99.34
3.81 100.15
2.83 100.27
4.43 99.61
4.80 100.02
3.27
7.27
8.86
99.54
99.59
3.95 100.03
1.48 99.81
0.64 99.67
5.07 99.88
0.00 99.87
2.52 97.28
4.46 99.02
4.94 99.33
7.56 99.91
6.24
4.93
2.76
98.70
98.95
97.42
93.19
93.76
79.64
83.57
87.30
94.05
92.70
96.28
95.75
87.43
96.96
81.01
94.91
91.40
90.80
96.61
91.88
91.23
91.90
92.97
82.08
82.82
87.59
87.54
85.06
9G.48
87.25
87.53
89.08
84.71
80.16
88.62
95.06
96.17
84.71
97.71
92.53
89.91
88.27
82.13
86.82
88.20
91.03
6.65
3.32
0.88
0.97
2.13
1.23
1.34
2.36
1.23
0.88
2.40
10.89
2.78
5.79
1.58
1.22
0.88
1.05
0.99
4.40
1.01
1.01
0.94
1.20
5.21
0.74
7.37
1.13
0.83
1.75
0.93
3.42
1.09
1.91
0.78
1.06
0.94
1.67
1.61
0.71
1.19
1.27
3.22
0.17
0.41
0.00
2.50
10.03 9.45
2.95 12.51
1.86 8.71
0.08 4.63
1.46 4.51
0.32 1.03
0.25 2.77
5.15 6.55
0.65 0.00
0.04 8.06
0.26 2.05
0.74 2.07
1.14
1.24
4.16
3.13
3.97
0.26
2.88
4.76
1.02
0.40
0.41
1.83
0.15
3.25
1.37
0.54
3.37
0.73
1.08
0.70
5.37
1.22
1.74
0.20
1.08
3.79
0.64
1.49
0.50
6.48
0.94
3.08
4.59
3.13
2.37
14.02
11.42
10.45
10.86
9.32
6.96
5.22
8.09
8.73
13.00
15.54
7.23
2.77
1.22
9.14
0.00
4.79
8.22
9.03
13.37
11.36
9.04
5.25

APPENDIX B.2 322
NATAL SAMPLES - ILMENITE MICROPROBE RESULTS
ANALYSIS Si02 Ti02 A1203 Cr203 MnO MgO
16
17
20
21
22
23
24
26
27
28
31
33
34
35
36
37
38
39
40
41
42
43
45
46
47
48
49
60 63
64
66-70
0.03 49.38
0.03· 48.92
0.03 44.64
0.03
0.03
0.03
0.Q4
0.03
50.64
49.74
51.86
50.24
52.11
48.62
52.46
51.85
51.45
49.48
53.26
48.38
50.43
50.08
48.98
52.15
51.89
51.16 52.05
51.07
51 .16
51.63
53.23
50.22
50.01
51.36
49.20
52.97
-= below detection limit
0.03
0.02
0.13
0.04
0.05
0.05
0.04
0.78
0.02
0.03
0.04
0.03
0.05
0.02
0.03
0.09
0.02
0.04
0.02
0.02
0.09
0.04
0.02
0.02
0.52 0.69
0.77 0.19
0.15 0.43 1.68
0.04 0.44 0.58
0.12 0.40 1.11
0.14 0.60 0.03
0.09 0.88 0.15
2.03 0.19
0.05 0.49 0.19
0.60 0.03
1.08 0.15
0.55 0.36
0.42 0.19
1.07 0.10
0.08 0.73 0.25
0.07 0.83 0.17
0.05 0.35 0.82
0.34 1.96
0.08 0.60 0.15
1.89 0.08
0.04 0.69 0.32
0.81 0.03
0.53 0.18
0.04 0.49 0.57
2.57 0.02
0.13 0.48 1.07
0.06 0.38 1.55
0.15
0.15
0.15
2.02
0.68
0.92
0.63
0.12
0.02
0.27
0.52
Recalculated Recalculated mole fraction
FeO Fe203 TOTAL FeTi03 MnTi03 MgTi03 Fe203
42.69
42.90
36.75
44.08
42.34
45.99
44,05
44.46
42.90
46.34
45.30
45.10
43.73
44.89
42.32
44.23
43.25
40.22
46.03
44.64
44.73
45.93
45.09
44.52
43.83
44.58
42.03
42.76
45.48
42.86
43.71
6.20
5.84
15.26
3.48
5.39
0.25
3.84
0.07
5.90
0.00
99.53
98.67
99.07
99.31
99.15
98.93
99.29
98.89
98.95
99.46
0.81 99.27
2.54 100.07
6.08 99.95
0.00 99.37
8.08 99.90
3.98 99.78
5.07 99.68
8.47 100.09
0.25 99.30
1.55 100.15
3.67 100.64
0.08 98.93
3.00 99.88
3.30 100.11
1.66 99.72
0.00 99.52
5.54 99.88
4.04
0.96
4.76
0.00
99.05
98.66
98.22
98.01
85.34
87.06
68.16
90.54
85.39
98.10
90.53
94.74
87.46
98.57
95.60
92.84
87.53
97.24
83.33
90.32
87.15
77.84
97.66
92.82
90.72
97.98
92.71
90.86
91.43
94.90
83.79
87.88
96.64
88.26
96.56
1.06
1.58
0.80
0.91
0.83
1.29
1.83
4.38
1.02
1.30
2.30
1.15 0.85
2.36
1.46
1.73
0.71
0.67
1.29
3.99
1.42
1.76
1.10
1.00
5.44
1.Q4
0.77
4.20
1.45
1.93
1.40
2.44
0.69
5.56
2.11
4.00
0.13
0.53
0.74
0.69
0.12
0.56
1.30
0.67
0.41
0.89
0.63
2.94
6.75
0.58
0.30
1.16
0.11
0.65
2.07
0.01
4.06
5.51
0.45
0.08
1.00
2.04
11.16
10.67
25.47
6.44
9.79
0.47
7.11
0.14
10.83
0.00
1.54
4.71
10.95
0.00
14.32
7.32
9.20
14.74
0.47
2.89
6.70
0.16
5.55
6.07
3.12
0.00
9.93
7.47
1.83
8.81
0.00

APPENDIX B.2
TRANSKEI SAMPLES - ILMENITE MICROPROBE ANALYSES
Recalculated
ANALYSIS Si02 Ti02 Al203 Cr203 MnO MgO FeO Fe203 TOTAL
HT4-1
2
3
4 5
6
7
8
9
10
11
12
13
14
15
16
17
18
19
20
21
22
23
24
25
26
27
28
29
30
31
32
34
35
36
37
38
39
40
41
42
44 46 47
48
0.04 52.51
0.03 52.70
50.26
50.42
0.03 48.15
1.13 51.54
50.59
0.03 50.49
0.03 50.25
0.03 49.57
51.54
50.97
· 51.59
51.85
· 51.54
51.36 50.04
51.12
52.13
50.90
50.19
51.80.
50.08
51.44
49.57
51.95
52.05
50.72
50.58
50.90
0.03 52.27
51.07
50.90
51.18
· 51.14 50.90
· 52.60
50.55
0.06 51.40
51.96
51.64
50.67
49.04
0.03 51.14
50.09
- = below detection limit
0.03
0.02
0.05
0.05
0.03
0.03
0.02
0.06
0.05
0.02
0.06
0.04
0.04
0.06
0.02
0.03
0.03
0.09
0.08
0.27
0.02
0.03
0.02
0.G3
0.04
0.03
0.02
0.G3
0.G3
0.03
0.04
0.03
0.04
0.03
0.02
0.04
0.04
0.G7
0.58 0.68 45.10
1.22 0.05 45.36
0.45 1.07 42.84
0.13 0.38 1.67 41.99
0.51 1.66 39.85
0.61 0.03 45.62
0.05 2.00 0.G7 43.36
0.52 0.63 43.79
0.04 0.34 0.71 43.60
0.39 0.84 42.73
0.50 0.97 44.12
0.05 0.52 0.49 44.45
0.45 1.55 43.19
0.10 0.51 0.81 44.68
1.50 0.17 44.54
0.06 0.88 0.14 45.05
0.71 0.02 44.26
0.61 0.65 44.21
0.56 0.86 44.77
0.04 0.80 0.13 44.74
0.29 1.27 42.60
45.94
39.81
42.08
40.79
44.02
43.63
44.75
0.58 0.04
0.31 2.77
0.05 0.41 2.12
0.05 0.45 1.87
2.59 0.05
0.G7 0.44 1.54
0.64 0.13
0.57
0.93
0.17 2.37
1.78
0.61
0.46 0.43
0.44
0.22 0.39
0.58
1.10
1.54
0.48
0.42
0.15 0.48
0.41
0.71
0.39
0.12 44.72
0.20 44.50
0.08 44.20
0.12 43.94
0.48 44.32
1.21 43.45
1.97 42.05
1.45 42.80
0.82 44.33
0.11 44.17
0.G3 44.68
0.54 45.30
1.00 44.22
0.19 44.75
0.74 42.37
0.30 44.76
1.60 41.81
0.00
0.00
4.26
4.74
9.06
0.00
1.64
3.04
3.69
5.06
1.63
2.34
2.35
0.45
1.59
2.04
3.61
2.03
0.24
1.87
4.30
0.95
5.83
2.21
6.22
0.60
0.94
2.67
98.95
99.39
98.93
99.39
99.41
98.94
97.77
98.55
98.69
98.68
98.85
98.86
99.20
98.44
99.39
99.58
98.66
98.71
98.60
98.51
98.70
99.35
98.92
98.37
99.23
99.27
98.71
98.96
2.64 98.67
2.44 99.01
0.00 99.13
1.95 98.95
1.03 97.39
1.63 98.40
3.50 99.16
3.00 98.82
0.00 98.37
2.35 98.34
0.86 98.62
1.78 100.11
1.50 98.82
3.49 99.76
5.41 98.03
2.87 99.84
4.42 98.41
323
Recalculated mole fractions
FeTi03 MnTi03 MgTi03 Fe203
96.14
97.16
87.35
84.62
77.40
98.53
92.27
90.89
89.82
86.90
92.26
92.67
89.03
94.97
93.21
93.81
91.74
92.48
95.06
94.26
86.90
96.83
79.15
87.22
81.29
93.11
91.53
93.16
93.40
92.74
94.57
92.10
94.86
91.45
85.54
88.28
95.60
92.81
94.92
93.70
92.53
91.85
86.53
92.11
85.27
1.26
2.64
0.94
0.77
1.00
1.34 4.31
1.09
0.71
0.80
1.07
1.11
0.93
1.10
3.18
1.85
1.49
1.29
1.21
1.71
0.60
1.24
0.61
0.85
0.91
5.55
0.94
1.35 1.20
1.96
5.14
3.78
1.32
0.92
0.90
0.82
1.27
2.34
3.31
1.00
0.89
0.99
0.85
1.47
0.81
2.60
0.20
3.90
6.01
5.76
0.13
0.28
2.33
2.62
3.04
3.60
1.84
5.68
3.08
0.62
0.53
0.04
2.41
3.27
0.48
4.60
0.13
9.81
0.00
0.00
7.82
8.59
15.84
0.00
3.14
5.69
6.85
9.26
3.07
4.39
4.36
0.86
2.99
3.81
6.72
3.83
0.46
3.55
7.90
1.80
10.43
7.82 4.12
6.64 11.16
0.19 1.14
5.75 1.78
0.49 5.00
0.44
0.73
0.30
0.44
1.84
4.55
7.14
5.34
3.14
0.40
0.11
1.99
3.74
0.71
2.68
1.11
5.81
4.96
4.57
0.00
3.68
1.98
3.09
6.42
5.56
0.00
4.44
1.65 3.31
2.83
6.45
9.94
5.31
8.12

APPENDIX B.2
TRANSKEI SAMPLES - ILMENITE MICROPROBE ANALYSES
Recalculated
ANALYSIS Si02 Ti02 A1203 Cr203 MnO MgO FeO Fe203 TOTAL
49
50
51
52
53
54
55
56
57
58
60
Average
HTI
1
2
3
4
5
6
8
9
10
11
12
13
14
15
16
17
18
19
20
21
22
24
25
26
27
28
29
30
31
32
33
34
52.15
51.86
52.04
51.11
48.93
51.78
51.67
48.90
52.76
52.35
50.65
0.14 51.06
53.28
52.20
0.03 50.65
53.48
50.69
. 49.67
49.69
51.55
50.80
52.31
49.76
51.31
50.30
50.98
50.99
50.12
51.08
50.66
52.04
51.87
0.03 51.01
51.23
51.54
51.07
50.00
. 51.01
50.53
51.81
50.27
0.04 49.28
52.59
0.03 52.29
- = below detection limit
0.02
0.03
0.03
0.07
0.03
0.05
0.03
0.06
0.02
0.02
0.04
0.02
0.03
0.09
0.05
0.06
0.04
0.02
0.03
0.03
0.02
0.04
0.04
0.03
0.05
0.04
0.02
0.03
0.02
0.06
0.02
0.06
0.05
0.02
0.07
0.05 0.86 0.12 45.23
0.06 0.44 0.19 45.87
0.61 0.16 45.66
0.07 0.39 0.90 43.96
0.33 1.04 0.19 42.61
0.35 0.69 45.00
0.04 0.82 0.18 45.31
0.04 0.45 0.79 42.12
0.25 1.49 0.09 44.18
0.31 0.65 1.05 44.09
0.06 0.75 0.26 44.33
0.13 0.74 0.69 43.87
2.68 0.19 43.38
0.32 0.56 3.09 40.86
0.05 2.31 0.08 43.10
0.66 0.11 44.76
0.89 0.12 44.47
0.57 0.35 2.85 39.24
0.06 0.38 0.81 42.87
1.18 0.06 45.05
0.04 0.60 0.07 44.94
0.12 0.53 1.76 43.35
0.06 1.00 0.09 43.59
0.67 0.21 45.11
0.19 0.41 0.99 43.05
0.14 0.55 0.53 44.35
0.14 0.50 0.59 44.32
0.10 0.61 0.25 44.00
0.07 1.64 0.08 44.15
0.24 0.65 0.20 44.57
0.22 0.38 1.95 42.94
0.12 0.47 2.08 42.48
0.06 0.75 0.68
0.10 0.93 0.05
0.06 1.04 0.09
0.07 0.64 0.18
0.43 0.48 1.36
0.52 0.45 1.59
0.08 0.40 1.37
0.09 0.53 0.50
0.07 0.42 1.37
0.47 0.42
3.83 0.13
0.06 0.44 1.86
43.94
45.06
45.15
44.97
42.07
42.60
42.62
45.17
42.36
43.15
42.31
43.30
0.00
0.14
0.00
2.39
4.78
0.90
0.53
5.98
0.00
0.00
2.71
2.32
0.00
2.14
2.26
0.00
2.34
6.52
4.98
0.62
2.33
0.70
4.46
2.26
4.46
2.65
2.52
3.81
2.36
2.12
2.15
1.70
2.42
2.24
1.21
2.37
4.47
3.24
4.53
1.37
4.58
5.79
0.00
1.19
98.43
98.58
98.52
98.90
97.90
98.79
98.59
98.33
98.78
98.49
98.78
99.56
99.20
98.48
99.02
98.57
99.29
98.86
98.47
98.79
98.84
98.98
99.64
99.43
99.24
99.09
98.91
99.43
98.50
99.72
98.81
98.92
99.64
99.12
99.35
98.86
99.44
99.60
99.51
99.15
99.24
98.93
99.24
324
Recalculated mole fractions
FeTi03 MnTi03 MgTi03 Fe203
97.68
98.09
98.05
91.37
88.23
94.95
96.51
85.34
96.34
94.56
92.37
93.43
83.62
90.51
98.11
93.24
77.64
87.17
96.02
94.05
90.96
89.35
93.60
87.40
91.95
92.07
90.74
91.84
93.86
88.10
88.12
91.39
93.67
95.15
93.53
85.85
87.30
86.03
94.44
85.84
87.02
91.14
89.97
1.87
0.94
1.33
0.83
2.18
0.75
1.77
0.91
3.29
1.42
1.58
0.45
0.71
0.62
3.34
0.69
2.58
0.69
2.85
0.36
4.02
0.97
0.00
0.26
0.00
4.47
8.90
1.72
1.02
10.90
0.00
0.00
5.08
5.84 0.74 0.00
3.94
4.27
0.00
4.41
1.16 11.28
4.92 0.30
1.45 0.44
1.90 0.45
0.71 10.05 11.61
9.11
1.19
4.39
1.31
8.23
4.23
8.15
4.94
4.71
7.07
4.41
4.01
3.96
3.18
0.78 2.93
2.55 0.24
1.28 0.28
1.14
2.07
1.41
0.84
1.15
1.05
1.28
3.46
1.39
0.79
0.99
1.57
1.96
2.22
1.35
0.98
0.94
0.81
1.13
0.87
0.97
8.35
0.93
6.60
0.34
0.76
3.60
1.96
2.17
0.91
0.29
0.74
7.14
7.70
2.51 4.53
0.18 4.19
0.33 2.30
0.68 4.43
4.95 8.21
5.79 5.97
4.92 8.24
1.86 2.57
4.94 8.35
1.50 10.51
0.51 0.00
6.88 2.22

APPENDIXB.2
TRANSKEI SAMPLES - ILMENITE MICROPROBE ANALYSES
Recalculated
ANALYSIS Si02 . Ti02 Al203 Cr203 MnO MgO FeO Fe203 TOTAL
35
36
37
38
39
40
41
42
45
46
47
48
49
50
51
52
53
54
55
56
57
58
59
60
61
62
63
64
65
66
67
68
69
70
71
72
73
74
75
76
77
Average
HTI-ILM
52.11
51.03
52.45
0.03 51.34
0.04 51.64
51.12
51.83
49.83
52.57·
52.38
52.90
50.10
51.27
51.16
0.05 50.27
49.85
51.74
0:03 50.43
51.99
52.07
48.28
50.83
50.54 . 51.23
0.06 50.82
49.30
51.93
52.28
52.16
0.08 49.70
50.84·
50.25
0.04 52.38
0.22 51.02
0.04 52.14
0.02 50.86
0.04 52.09
51.01
0.04 51.04
53.81
50.98
0.05 51.20
0.04 50.37
- = below detection limit
0.02
0.02
0.02
0.04
0.05
0.05
0.02
0.10
0.03
0.02
0.03
0.03
0.03
0.14
0.02
0.02
0.06
0.15
0.10
0.02
0.03
0.04
0.17
0.05
0.02
0.03
0.02
0.05
0:03
0.07
0.05
0.55
0.02
0.03
0.04
0.05
0.06
0.05
0.05
0.03
0.08 2.30 0.08
0.73 0.16
0.83 0.12
0.49 0.68
0.56 0.50
0.16 0.59 0.22
1.00 0.33
0.08 0.69 0.79
0.09 0.82 0.25
0.06 1.42 0.10
0.09 0.72 0.14
0.05 0.56 0.55
2.01 0.08
0.11 0.88 0.78
0.08 0.40 1.81
0.14 0.34 2.08
0.04 0.42 0.55
0.07 0.61 0.11
0.06 0.40 0.84
0.08 0.43 0.92
0.20 0.31 2.83
0.14 0.43 0.26
0.18 0.35 1.61
0.63 0.14
0.38 0.18
0.60 0.25
0.63 0.08
0.05 1.05 0.21
0.06 0.49 0.08
0.04 0.46 0.61
0.04 0.36 0.89
0.31 0.30
0.42 0.82
0.16 1.67
0.05 0.48 0.19
0.06 0.43 0.85
0.57 0.19
0.39 0.88
0.04 0.98 0.14
0.08 0.52 0.45
0.09 0.78 0.42
0.12 0.74 0.68
0.04 1.88 0.12
44.40
44.87
46.03
44.49
45.03
45.00
45.01
42.71
44.87
44.77
45.35
43.52
43.93
43.73
41.64
40.79
45.13
44.56
44.85
44.76
38.08
44.81
42.24
45.20
45.07
43.28
45.92
45.58
46.28
43.23
43.79
44.36
45.26
43.00
46.11
43.80
45.98
43.93
44.70
43.86
44.31
43.94
43.23
0.99 100.00
2.52 99.38
0.00 99.48
2.49
1.%
2.61
1.50
4.85
0.00
0.00
0.00
4.72
2.14
2.02
4.28
5.47
1.29
2.60
1.08
0.54
9.05
2.37
3.90
1.94
1.41
6.26
0.11
0.26
0.48
4.04
2.64
3.13
0.41
99.58
99.80
99.77
99.70
99.06
98.63
98.74
99.22
99.53
99.47
98.71
98.56
98.80
99.20
98.44
99.27
98.96
98.87
98.88
98.86
99.22
98.09
99.77
98.69
99.45
99.58
98.22
98.60
98.47
99.39
3.06 99.67
0.83 99.86
3.56 99.62
(0.00) 98.93
2.00 98.32
2.64 99.64
0.00 98.74
2.95 99.59
2.41
2.38 98.10
325
Recalculated mole fractions
FeTi03 MnTi03 MgTi03 Fe203
92.96
93.16
97.78
91.84
93.34
93.09
93.84
86.84
97.24
96.53
97.87
88.27
91.46
91.44
84.78
81.98
94.62
93.38
93.97
94.59
73.83
93.65
86.26
94.49
95.80
86.62
98.13
96.47
97.73
89.27
91.01
92.37
95.26
87.96
96.70
89.46
98.07
92.11
92.51
97.08
91.34
91.02
4.89
1.52
1.78
1.03
1.17
1.24
2.11
1.42
1.81
3.10
1.58
1.15
4.23
1.86
0.83
0.68
0.90
1.30
0.85
0.91
0.61
0.91
0.72
1.33
0.81
1.22
1.36
2.24
1.05
0.96
0.77
0.66
0.89
0.33
1.02
0.90
1.22
0.82
2.05
1.16
1.64
4.00
0.29
0.61
0.44
2.51
1.85
0.80
1.24
2.87
0.95
0.38
0.55
1.97
0.30
2.90
6.55
7.45
2.05
0.42
3.13
3.48
9.76
0.98
5.86
0.54
0.68
0.89
0.30
0.79
0.31
2.26
3.28
1.10
3.08
6.08
0.71
3.10
0.71
3.30
0.53
1.76
1.55
0.46
1.87
4.71
0.00
4.62
3.65
4.87
2.82
8.87
0.00
0.00
0.00
8.61
4.02
3.80
7.84
9.88
2.44
4.91
2.04
1.02
15.79
4.46
7.16
3.64
2.71
11.27
0.21
0.49
0.91
7.51
4.94
5.87
0.77
5.63
1.56
6.54
(0.00)
3.77
4.92
0.00
5.47
4.51

APPENDIX B.2
TRANSKEI SAMPLES - ILMENITE MICROPROBE ANALYSES
Recalculated
ANALYSIS Si02 Ti02 A1203 Cr203 MnO MgO FeO Fe203 TOTAL
2
3 4
5
HTI-ILM
1
3
4
5 6
7
9
10
11
12
14
0.03 50.52
50.55
51.93
51.38
51.21 . 51.27
51.25
50.09
50.33
51.58
51.50
50.85
52.J3.
51.77
52.49
51.93
52.10
0.21 51.02
52.03
51.46
51.32
51.50
51.05
51.13
51.08 . 52.92
0.03 50.82
0.05 . 50.14
0.05 51.96
0.06 51.58
0.04 51.49
0.06 52.38
49.76.
46.86
50.62
51.46
51.05
52.64
49.85
51.38
51.50
51.15
52.86
-= below detection limit
0.02
0.08
0.05
0.03
0.08
0.08
0.06
0.02
0.05
0.04
0.05
0.02
0.05
0.03
0.02
0.06
0.05
0.04
0.13
0.03
0.02
0.02
0.03
0.02
0.09
0.06
0.10
0.07
0.05
0.02
0.03
0.02
0.03
0.06
1.66 0.32
0.26 0.43 1.95
0.42 0.66
0.78 0.05
43.22
41.55
45.10
45.34
1.02 0.08 44.89
1.12 0.09 44.81
0.49 0.70 44.34
0.10 0.40 1.54 41.90
0.09 0.36 0.51 43.98
1.24 0.08 45.00
0.57 0.17 45.45
0.43 0.75 43.97
1.19 0.05 45.58
0.05 0.40 1.25 43.92
0.05 0.65 0.24 45.23
0.54 0.06 46.06
0.40 0.72 45.17
0.81 0.09
1.57 0.06
1.16 0.02
1.10 0.34
0.23 0.49 2.06
0.42 0.29
0.57 0.30
0.33 0.40 3.29
0.88 0.35
0.55 0.19
0.42 0.59
0.97 0.25
0.57 0.15
0.17 0.36 2.21
0.35 1.31
45.15
45.09
45.10
44.44
42.14
44.96
44.88
39.68
46.10
44.84
43.67
45.36
45.60
42.05
44.30
0.47 1.85 40.98
0.08 0.58 0.33 40.96
0.32 0.44 1.72 42.04
0.04 0.51 0.19 45.42
0.81 0.02 45.07
0.08 3.13 0.12 43.97
0.47 0.66 43.18
0.91 0.14 45.04
0.11 1.60 0.34 44.09
1.08 0.07 44.78
0.34 1.66 43.12
3.81 99.59
3.68 98.51
1.83 100.01
2.44 100.03
1.52 98.77
2.66 99.98
2.67 99.53
4.67 98.79
3.75 99.08
1.83 99.79
1.46 99.20
3.76 99.83
0.61 99.63
2.57 100.01
0.00 98.70
0.62 99.25
0.26 98.72
1.74 99.07
0.17 98.98
1.69 99.47
2.38 99.60
3.55 100.03
3.37 100.16
2.55 99.47
5.51 100.42
0.15 100.46
3.67 100.13
4.17 99.07
1.96 100.59
1.52 99.50
3.55 99.95
0.00 98.48
6.15 99.32
10.52 99.40
3.97 99.17
1.72 99.37
2.74 99.73
0.26 100.21
5.42 99.64
1.89 99.40
1.54 99.20
1.56 98.66
0.00 98.37
326
Recalculated mole fractions
FeTi03 MnTi03 MgTi03 Fe203
88.38
85.18
93.28
93.66
94.63
92.39
91.44
85.07
90.42
93.64
95.40
89.52
96.09
89.86
97.64
97.42
95.90
94.67
96.04
94.30
92.01
85.14
91.88
92.95
77.97
96.57
91.44
89.30
93.44
95.36
84.87
94.28
81.51
79.37
85.58
94.96
93.17
92.41
86.87
94.00
92.45
94.47
92.89
3.44
0.89
0.88
1.63
2.18
2.34
1.03
0.82
0.75
2.62
1.21
0.88
2.54
0.83
1.43
1.16
0.86
1.72
3.39
2.45
2.30
1.01
0.87
1.20
0.79
1.86
1.14
0.88
2.02
1.20
0.74
0.76
0.94
1.14
0.91
1.08
1.69
6.65
0.96
1.92
3.40
2.31
0.74
1.16
7.13
2.43
0.18
0.31
0.32
2.57
5.57
1.88
0.31
0.63
2.71
0.20
4.57
0.92
0.24
2.74
0.32
0.23
0.06
1.25
7.40
1.06
1.10
11.51
1.29
0.69
2.15
0.90
0.57
7.94
4.96
6.54
1.15
6.22
0.72
0.05
0.43
2.36
0.54
1.25
0.26
6.37
7.02
6.79
3.41
4.53
2.89
4.94
4.96
8.54
6.94
3.43
2.76
6.89
1.16
4.74
0.00
1.19
0.50
3.29
0.33
3.18
4.44
6.45
6.19
4.75
9.74
0.27
6.73
7.68
3.64
2.87
6.45
0.00
11.00
18.34
7.28
3.23
5.09
0.50
9.81
3.55
2.90
2.95
0.00

APPENDIX B.2
TRANSKEI SAMPLES - ILMENlTE MICROPROBE ANALYSES
Recalculated
ANALYSIS Si02 Ti02 A1203 Cr203 MnO MgO FeO Fe203 TOTAL
15
16
17
18
19
20
21
22
23
24
25
26
27
28
29
30
31
32
33
34
35
36
37
38
39
40
41
42
43
44
45
46
47
48
49
50
51
52
53
55
56
57
58
49.69
49.28
51.41
52.01
50.48
51.50
53.53
50.21
50.76
50.32
51.11
52.40
52.06
51.73
51.02
49.75
50.94
50.58
51.82
50.94
52.05
50.69
51.08
51.75
49.71
50.62
52.95
50.84
0.05 51.37
. 49.02
50.75
49.03
50.35
52.62
49.19
49.50
50.87
52.86
50.86
50.04
47.49
49.29
50.75
-= below detection limit
0.08
0.09
0.07
0.04
0.09
0.03
0.02
0.07
0.06
0.04
0.06
0.03
0.07
0.07
0.03
0.04
0.08
0.04
0.03
0.05
0.03
0.04
0.05
0.03
0.04
0.09
0.02
0.02
0.04
0.06
0.04
0.02
0.03
0.04
0.03
0.12
0.06
0.05 0.38 1.50 41.63
0.040.35 1.44 41.39
0.26 0.65 44.81
0.37 0.45 1.32 43.96
0.17 0.38 0.91 43.38
0.07 0.90 0.31 44.84
0.22 1.11 0.38 43.78
0.38 0.36 1.74 41.68
0.05 0.40 1.01 43.44
0.46 0.26 44.33
0.40 0.62 2.25 41.33
0.05 0.53 0.27 46.10
0.12 1.80 0.18 44.67
0.51 1.32 43.65
0.04 0.36 1.55 42.76
0.04 0.75 0.41 43.26
0.33 0.89
0.04 0.40 1.04
0.12 3.68 0.13
0.07 0.99 0.19
0.80 0.18
0.04 0.34 0.63
0.66 0.60
0.04 0.81 0.19
0.16 0.41 1.77
0.06 0.60 0.88
0.05 0.46 0.34
0.90 0.17
1.56 0.12
43.90
43.21
42.65
44.47
45.67
44.12
44.20
45.37
41.14
43.36
45.11
44.51
44.47
0.09 0.60 0.30 42.94
0.06 2.98 0.21 42.24
0.10 0.96 0.13 42.88
0.04 0.78 0.64 43.35
0.44 0.49 46.01
0.38 0.44 1.05 41.92
0.04 0.96 0.16 43.25
1.27 0.23 44.04
0.43 0.55 45.07
1.76 0.10 43.79
0.32 0.42 0.65 43.41
0.19 1.34 0.15 41.09
0.12 0.44 1.43 41.35
0.04 0.92 0.07 44.59
5.47 98.79
4.91 97.49
1.24 98.44
1.32 99.47
3.14 98.56
1.21 98.85
0.00 99.05
4.96 99.40
3.31 99.03
4.33 99.74
2.82 98.59
0.40 99.79
1.10 99.93
2.78 100.08
3.68 99.47
5.19 99.42
2.35
3.80
0.59
2.58
0.74
3.78
3.12
1.34
5.33
2.72
0.00
2.38
1.90
98.47
99.15
99.00
99.27
99.46
99.65
99.74
99.53
98.55
98.29
98.94
98.85
99.58
6.49 99.46
2.60 98.86
5.38 98.52
4.20 99.43
0.56 100.17
6.13 99.14
4.49 98.42
3.16 99.62
0.00 98.97
3.55 100.13
5.05 99.93
8.32 98.69
6.51 99.20
2.51 98.88
327
Recalculated mole fractions
FeTi03 MnTi03 MgTi03 Fe203
83.93
84.94
94.65
91.67
89.97
94.60
96.04
84.00
89.33
90.18
85.21
97.09
93.43
89.04
86.92
87.54
91.60
88.36
90.50
92.39
96.21
90.04
90.68
95.04
83.11
90.37
97.69
93.01
92.70
86.00
88.05
87.64
88.35
96.21
84.26
89.06
90.64
%.95
89.47
87.62
81.86
82.37
93.10
0.78
0.72
0.55
0.95
0.80
1.93
2.47
0.73
0.83
0.94
1.29
1.13
3.81
1.05
0.73
1.53
0.69
0.84
7.90
2.08
1.72
0.71
1.37
1.72
0.84
1.26
1.00
1.91
3.29
1.22
6.30
1.99
1.61
0.92
0.91
2.01
2.66
0.94
3.64
0.86
2.70
0.88
1.94
5.37
5.27
2.44
4.91
3.36
1.18
1.49
6.27
3.71
0.95
8.25
1.03
0.69
4.80
5.61
1.47
3.31
3.81
0.48
0.70
0.67
2.31
2.20
0.72
6.37
3.25
1.31
0.62
0.44
9.92
9.07
2.36
2.47
5.87
2.29
0.00
9.00
6.13
7.92
5.24
0.75
2.07
5.10
6.73
9.46
4.41
7.00
1.12
4.83
1.40
6.95
5.76
2.52
9.68
5.11
0.00
4.47
3.57
1.07 11.70
0.78 4.88
0.48 9.89
2.33 7.71
1.82 1.05
3.74 11.09
0.60 8.33
0.85 5.85
2.11 0.00
0.36 6.52
2.35 9.17
0.53 14.92
5.07 11.68
0.25 4.71

APPENDIX B.2
EASTERN CAPE SAMPLES - ILMENITE MICROPROBE ANALYSES
Recalculated Recalculated mole fractions
Sample Si02 Ti02 A1203 Cr203 MnO MgO FeO Fe203 TOTAL FeTi03 MnTi03 MgTi03 Fe203
HECB-l
2
3
4
5
6
7
8
9
12
13
14
15
16
17
18
19
20
21
22 23
24
25
26
27
28
29
30
31
32
33
34
35
36
37
39
40
41
42
43
44
45
46
47
48
49
50
52.78 0.03
51.93 0.04
52.43 0.02
50.65 0.03
51.56 0.06
50.81 0.06
50.15 0.07
51.38 0.02
51.39 0.04
50.68 0.03
51.28 0.04
53.09 0.05
51.53 0.03
50.81 0.06
51.19 0.05
53.48 0.02
51.25 0.02
50.69 0.04
0.03 51.85 0.03
52.98 0.02
51.34 0.08
50.98 0.04
49.69 0.04
0.03 51.66 0.04
0.03 50.15 0.07
50.87 0.06
51.24 0.05
0.03 51.65 0.05 .
0.10 51.70 0.04
0.04 51.18 0.05
50.72
51.68 0.03
0.04 52.25 0.05
0.03 53.27 0.06
51.93
52.52 0.07
52.70 0.03
0.04 51.68 0.03
50.64 0.08
0.03 50.94 0.02
0.04 51.36 0.03
49.65 0.04
0.04 53.87 0.05
52.43
0.03 53.62 0.05
0.03 51.08 0.03
0.18 51.26 0.02
-= below detection limit
1.66 0.49 5.93 36.39
0.05 0.48 0.44 45.43
0.12 0.42 0.43 45.96
0.60 0.43 1.59 42.28
0.05 0.45 0.82 44.47
0.15 0.40 1.68 42.32
0.14 0.49 1.65 41.66
0.05 0.63 0.19 45.22
0.05 0.54 0.26 45.22
0.04 0.81 0.33 44.17
0.47 0.73 44.34
0.12 0.59 2.17 43.28
0.12 1.31 0.39 44.33
0.04 0.36 1.11 43.34
0.38 0.54 44.69
0.39 1.69 0.34 43.53
0.04 0.68 0.65 44.25
0.13 0.47 1.36 42.70
0.40 0.28 45.75
0.50 0.29 46.19
0.10 0.37 1.45 43.23
0.11 1.52 0.12 44.11
0.39 1.08 42.38
0.39 1.00 44.32
0.41 1.50 42.04
0.50 0.98 43.51
0.39 1.10 43.74
0.61 0.51 44.96
0.13 2.48 0.12 43.88
0.04 0.51 0.59 44.50
0.05 1.79 0.08 43.67
0.13 0.91 0.18 45.25
0.14 0.55 1.61 43.61
0.10 3.47 0.31 42.10
1.42 0.48 44.44
0.45 0.83 45.33
0.73 0.41 45.96
0.12 2.11 0.17 44.08
0.09 0.44 1.71 42.07
0.03 1.40 0.07 44.31
0.92 0.24 44.86
0.43 0.92 42.59
0.04 0.67 0.38 44.42
0.92 0.52 45.31
0.47 0.39 44.44
0.24 1.75 0.27 43.71
1.19 1.02 43.29
3.04
0.64
0.26
3.72
2.64
4.17
5.39
2.92
1.80
2.86
2.58
0.50
0.%
2.92
2.31 ·
0.00
1.82
3.65
1.55
0.00
2.82
3.18
5.71
2.56
5.23
3.99
3.42
2.37
0.58
2.88
3.52
1.20
1.56
0.00
1.81
0.62
0.51
1.28
4.08
3.55
1.66
5.00
0.00
0.47
0.00
2.77
2.73
100.33
99.02
99.64
99.32
100.07
99.60
99.54
100.42
99.29
98.94
99.47
99.79
98.68
98.65
99.19
99.45
98.72
99.06
99.89
100.01
99.41
100.06
99.33
100.02
99.45
99.94
99.96
100.18
99.02
99.79
99.86
99.40
99.82
99.32
100.12
99.85
100.36
99.51
99.14
100.34
99.12
98.68
99.46
99.71
99.03
99.88
99.71
72.50
96.07
97.00
86.46
91.19
85.56
83.42
92.60
94.53
91.72
91.54
89.81
93.90
89.71
92.87
94.95
92.69
87.35
95.20
97.84
88.71
90.54
85.05
90.82
84.36
88.17
88.95
92.49
93.10
91.44
89.50
95.11
90.04
91.20
91.91
94.79
96.01
92.47
85.44
90.35
94.02
86.63
97.04
95.21
97.44
90.20
88.76
1.00
1.04
0.90
0.89
0.92
0.81
0.99
1.31
1.13
1.71
0.98
1.23
2.82
0.76
0.81
3.73
1.45
0.97
0.85
1.08
0.77
3.16
0.79
0.82
0.83
1.02
0.80
1.27
5.33
1.05
3.72
1.93
1.15
7.61
2.96
0.94
1.54
4.49
0.91
2.88
1.95
0.89
1.47
1.95
1.05
3.66
2.47
21.06
1.67
1.61
5.80
3.01
6.04
5.88
0.71
0.95
1.23
2.70
8.02
1.46
4.09
2.01
1.32
2.44
4.96
1.04
1.08
5.32
0.43
3.85
3.63
5.38
3.54
3.99
1.86
0.47
2.18
0.29
0.68
5.91
1.19
1.76
3.09
1.51
0.62
6.20
0.25
0.91
3.34
1.48
1.95
1.51
0.99
3.72
5.45
1.22
0.49
6.85
4.87
7.58
9.71
5.39
3.38
5.34
4.79
0.94
1.83
5.44
4.31
0.00
3.42
6.72
2.91
0.00
5.20
5.88
10.31
4.73
9.44
7.27
6.26
4.38
1.10
5.33
6.49
2.27
2.90
0.00
3.37
1.17
0.95
2.42
7.46
6.52
3.12
9.15
0.00
0.89
0.00
5.15
5.04
328

APPENDIX B.2
EASTERN CAPE SAMPLES - ILMENITE MICROPROBE ANALYSES
Recalculated Recalculated mole fractions
Sample Si02 Ti02 Al203Cr203 MnO MgO FeO Fe203 TOTAL FeTi03 MnTi03 MgTi03 Fe203
51
52
53
54
55
56
57
61
67
68
HEC6
1
2 4
5
6
7
8 9
10
11
12
13
14
15
16
17
18
19
20
21
22 23
24
25
26
27
28
29
30
31
0.10 50.37 0.03
0.03 52.09
50.85 0.03
51.34 0.02
51.89 0.02
53.13
52.79 0.03
51.96
0.04 52.11 0.03
0.04 52.00 0.04 .
50.17 0.02
0.05 53.48 0.04
52.07 0.02
51.35 0.05
51.94 0.06
50.77 0.04
0.03 52.26 0.08
52.50
50.87 0.05
51.42 0.04
0.04 52.92 0.03
49.62 0.Q4
52.58 0.05
49.66
52.29 0.02
51.86 0.02
52.07 0.04
49.08 0.06
0.03 51.97 0.04
0.03 51.39 0.07 .
53.33 0.02
52.00 0.06
53.01 0.04
51.89 0.10
0.04 49.66 0.05
0.05 49.Q4 0.09
50.27
51.21 0.02
51.34 0.07
0.04 51.21 0.09
32 0.07 50.36 0.24
33 0.03 51.57 0.07
34 0.03 51.59 0.02
Average 0.04 51.42 0.06
-= below detection limit
1.58 0.87 42.26
- 0.58 0.22 45.90
0.12 0.39 0.78 43.94
0.41 0.79 44.37
0.43 0.73 44.96
0.47 0.50 46.06
1.03 0.32 45.86
0.04 1.18 0.47 44.73
0.04 0.85 0.08 45.90
0.04 1.33 0.18 45.14
0.44 1.05 42.81
0.52 0.44 4.42 39.83
0.76 0.50 45.06
0.39 0.91 44.17
0.50 0.63 45.09
0.50 0.41 44.43
0.70 0.32 45.75
0.58 0.55 45.02
0.04 0.49 0.39 44.56
0.44 0.94 44.12
0.42 0.68 44.95
0.Q4 3.73 0.04 40.80
0.66 0.25 46.18
0.40 2.44 39.91
0.54 2.35 0.17 44.34
0.87 0.16 45.49
0.51 0.26 45.86
0.08 0.57 1.17 41.49
0.46 1.35 43.89
0.42 0.51 44.91
0.47 0.69 45.54
0.07 1.06 0.51 44.80
0.41 0.96 45.55
0.59 0.63 44.96
0.12 0.51 0.86 42.65
0.09 0.51 1.37 41.20
0.04 0.55 0.50 43.76
0.41 0.68 44.45
0.47 0.43 44.95
0.42 0.98 43.92
1.71 0.09 43.47
0.05 0.40 1.48 43.36
0.81 0.02 45.56
0.16 0.73 0.80 44.03
3.28
1.51
3.92
3.09
98.47
100.34
100.03
100.06
1.29 99.33
0.00 ' 100.20
0.05
1.69
0.43
0.14
4.09
0.54
0.00
2.21
0.46
2.61
0.27
0.00
2.72
1.89
0.00
5.13
0.21
6.97
0.57
0.96
0.07
6.83
1.62
1.32
0.00
1.84
0.22
2.03
5.68
6.94
4.59
2.92
1.57 .
3.17
2.00
2.86
0.70
2.21
100.10
100.09
99.47
98.92
98.62
99.31
98.44
99.09
98.68
98.78
99.41
98.68
99.14
98.86
99.05
99.43
99.95
99.42
100.28
99.41
98.82
99.28
99.37
98.66
100.06
100.36
100.24
100.24
99.57
99.29
99.73
99.72
98.85
99.86
97.97
99.82
98.73
99.31
87.40
95.16
89.21
90.60
93.97
97.13
96.49
92.65
97.07
96.18
87.72
81.90
96.46
91.70
95.67
92.53
96.78
96.63
92.45
92.03
96.47
82.82
97.24
78.35
93.27
95.72
97.79
82.50
91.02
94.67
96.37
92.49
95.13
92.68
85.62
81.75
88.69
91.27
94.42
89.72
92.16
88.54
96.83
91.50
3.31
1.22
0.80
0.84
0.90
1.00
2.19
2.48
1.82
2.88
0.91
0.92
1.64
0.81
1.08
1.05
1.51
1.26
1.04
0.94
0.92
7.66
1.42
0.80
5.00
1.86
1.11
1.14
0.98
0.91
1.01
2.22
0.86
1.24
1.03
1.02
1.12
0.85
0.99
0.86
3.68
0.83
1.75
1.53
3.20
0.80
2.82
2.88
2.70
1.87
1.22
1.72
0.30
0.68
3.84
16.19
1.90
3.37
2.37
1.54
1.20
2.11
1.44
3.49
2.60
0.14
0.94
8.54
0.64
0.61
0.98
4.14
4.98
1.92
2.62
1.87
3.59
2.31
3.08
4.85
1.82
2.48
1.62
3.58
0.35
5.37
0.08
2.93
6.10
2.82
7.16
5.68
2.43
0.00
0.10
3.15
0.82
0.27
7.53
0.99
0.00
4.12
0.88
4.88
0.51
0.00
5.08
3.55
0.00
9.38
0.40
12.31
1.08
1.81
0.13
12.23
3.02
2.50
0.00
3.42
0.42
3.77
10.26
12.38
8.37
5.40
2.98
5.84
3.81
5.26
1.34
4.05
329

APPENDIX B.2
EASTERN CAPE SAMPLES - ILMENITE MICROPROBE ANALYSES
Recalculated Recalculated mole fractions
Sample Si02 Ti02 Al203 Cr203 MnO MgO FeO Fe203 TOTAL FeTi03 MnTi03 MgTi03 Fe203
HEC5
1
2
3
4
5
6
7
8
9
12
13
14
15
16
17
18
0.04 50.37 0.04
0.04 51.74 0.04
0.03 51.76 0.03
51.45
51.55
0.04
0.04
51.53 0.04
50.17 0.04
0.26 50.74 0.14
50.79 0.04
0.03 49.91 0.01
50.96
50.13 0.06
51.94
0.05 52.89 0.02
0.56 50.55 0.31
0.05 52.37
Average 0.13 51.18
0.03
0.06
HEC3
1
2
3
5
6
7
8
9
10
11
13
14
15
16
17
18
19
20
23
24
25
26
27
28
29
30
31
0.05 52.59 0.03
52.46 0.06
53.03 0.04
0.03 52.48 0.07
52.78 0.06
50.97 0.08
0.03 51.84 0.02
52.25 0.03
51.87 0.06
0.04 50.83
50.56
51.13
0.02
0.04
0.05
0.04 50.94 0.02
51.57 0.02
52.11 0.05
52.43
51.39 0.03
50.88 0.05
0.08 53.27 0.11
0.03 51.89 0.04
51.67 0.04
0.03 51.74 0.04
0.04 52.44
0.03 53.52
53.17 0.05
0.05 52.63 0.05
0.03 52.38 0.03
-= b~low detection limit
0.06 0.47 0.18 44.54
0.45 0.35 45.50
0.54 0.20 45.69
0.63 0.16 45.36
0.57 0.37 45.14
0.06 1.79 0.05 44.47
0.07 1.26 0.23 43.45
0.32 0.48 44.75
0.36 0.32 44.73
1.04 0.04 43.80
0.49 0.20 45.00
0.52 0.65 43.41
0.45 0.42 45.51
0.43 0.42 45.40
1.62 0.04 44.42
0.41 0.71 45.49
0.06 0.71 0.30 44.79
0.22 2.32 0.13 44.76
0.47 0.91 45.09
0.98 0.29 45.45
0.51 0.96 44.82
0.04 0.79 0.60 45.07
0.37 1.35 43.06
0.90 0.20 45.39
1.96 0.09 44.85
0.51 0.88 44.58
1.56 0.12 43.96
1.42 0.12 43.82
0.18 1.28 0.22 44.29
0.05 0.81 0.17 44.73
1.40 0.06 44.86
0.92 0.77 44.59
1.13 0.14 45.79
0.14 0.45 0.47 44.93
0.52 0.80 43.83
0.04 1.74 0.25 43.59
- 1.12 0.17 45.27
0.04 0.58 0.17 45.62
0.04 0.42 0.72 44.85
0.04 2.23 0.03 43.90
0.05 1.56 0.23 43.38
0.50 0.43 44.59
0.04 0.49 1.02 44.38
0.50 0.30 45.37
3.49
2.01
1.80
2.32
2.35
1.57
2.86
2.24
3.50
3.96
2.82
4.52
0.46
0.00
1.81
1.16
2.31
0.04
0.96
0.00
0.00
0.00
3.40
0.89
0.16
1.42
2.24
3.24
2.18
1.73
0.96
1.18
0.87
2.47
2.99
0.00
0.48
1.64
0.84
0.00
0.00
0.00
0.00
0.00
99.16
100.15
100.08
100.00
100.09
99.54
98.08
98.94
99.75
98.78
99.51
99.30
98.82
99.24
99.32
100.23
99.44
100.13
99.97
99.84
98.89
99.35
99.24
99.26
99.38
99.35
98.78
99.21
99.33
98.49
98.91
99.64
100.38
99.87
99.09
99.07
99.02
99.76
98.68
98.69
98.79
98.79
98.66
98.61
91.89
94.05
94.77
93.75
93.07
93.07
91.08
93.33
91.62
90.35
92.99
88.30
96.54
97.46
93.00
94.37
94.48
93.85
96.80
95.25
96.01
88.06
95.67
95.13
93.00
92.01
90.57
92.39
94.34
94.94
92.99
95.48
92.75
90.42
95.19
96.05
95.09
94.78
95.00
95.59
97.22
95.06
97.75
0.98
0.94
1.12
1.32
1.20
3.80
2.68
0.68
0.74
2.17
1.02
1.07
0.97
0.93
3.44
0.85
4.95
0.99
2.11
1.10
1.71
0.77
1.91
4.22
1.07
3.31
2.98
2.71
1.73
3.00
1.94
2.38
0.94
1.08
3.84
2.41
1.22
0.90
4.90
3.49
1.10
1.05
1.08
0.65
1.27
0.74
0.61
1.36
0.17
0.84
1.80
1.19
0.14
0.74
2.35
1.60
1.61
0.14
2.61
0.49
3.37
1.09
3.65
2.27
4.92
0.73
0.34
3.27
0.46
0.43
0.81
0.64
0.23
2.85
0.51
1.72
2.95
0.97
0.63
0.61
2.73
0.10
0.92
1.68
3.88
1.16
6.48
3.73
3.37
4.32
4.37
2.96
5.39
4.20
6.45
7.34
5.24
8.28
0.88
0.00
3.42
2.17
0.08
1.79
0.00
0.00
0.00
6.25
1.68
0.31
2.67
4.22
6.03
4.09
3.29
1.83
2.22
1.63
4.59
5.55
0.00
0.91
3.07
1.59
0.00
0.00
0.00
0.00
0.00
330

APPENDIX B.2
EASTERN CAPE SAMPLES - ILMENITE MICROPROBE ANALYSES
Recalculated Recalculated mole fractions
Sample Si02 Ti02 Al203 Cr203 MnO MgO FeO Fe203 TOTAL FeTi03 MnTi03 MgTi03 Fe203
32
33
34
35
39
41
42
43
44
45
46
47
48
49
50
51
52
53
54
55
56
57
58
59
60 61
62
0.03
0.03
0.04
50.14 0.04
48.19 0.05
53.47
52.71
52.15
51.30
51.95
50.82
51.89
53.28
51.45
52.72
52.25
0.02
0.05
0.02
0.05
0.02
0.03
0.02
0.04
51.83 0.02
52.30 0.04
52.63 0.03
0.04 50.89
50.43
51.29
50.47
0.02
52.12 0.04
52.25 0.03
50.46 0.02
52.09
51.31 0.03
0.03 53.13 0.03
0.08 51.23 0.25
63 0.03 53.06 0.03
64 51.20
Average 0.04 51.85 0.04
HE Cl
2
4
8
10
11
13
14
15
25
26
27
29
30
36
37
49.29 0.03
50.73 0.05
51.82 0.04
52.74 0.05
51.46 0.02
53.45 0.05
51.51 0.03
51.20 0.03 52.01 0.03·
0.03 52.48 0.02
0.03 52.64 0.08
0.03 51.13 0.03
0.04 51 .66 0.07
0.07 51.30 0.05
0.06 52.87
-= below detection limit
0.05 0.41 0.90 43.08
0.13 0.38 1.88 39.61
0.87 0.13
0.42 1.00
0.36 0.45
0.50 1.05
0.72 0.54
0.34 0.70
0.56 0.54
1.45 0.27
0.43 0.86
1.91 0.05
0.48 0.32
45.18
45.21
45.74
43.75
45.03
44.12
45.14
43.89
44.29
45.07
45.94
0.51 0.23 45.69
1.05 0.42 45.22
0.05 0.77 0.90 44.45
0.41 2.19 41.44
0.07 1.91 0.13 43.19
0.74 0.37 44.72
0.06 0.38 0.94 43.33
0.13 0.50 0.22 45.97
0.43 0.29 45.79
0.06 0.95 0.14 44.17
0.48 0.45 45.55
0.97 3.39 0.35 42.08
0.43 0.24 45.38
0.96 0.69 43.96
0.69 0.04 46.48
0.51 0.29 45.03
0.13 0.90 0.50 44.52
0.11 0.56 0.29 43.24
0.04 0.46 0.35 44.53
1.07 0.43 44.75
0.52 0.24 45.94
0.40 0.44 45.10
0.35 0.67 45.18
0.46 0.31 45.32
0.48 0.27 45.07
0.08 0.98 0.20 45.45
0.08 0.79 0.12 45.53
0.06 0.55 0.70 44.46
0.08 1.38 0.06 44.50
0.06 0.48 0.68 44.80
0.08 0.39 0.71 44.55
0.09 2.16 0.13 44.92
4.29
8.63
0.00
0.47
0.33
3.20
1.80
3.46
2.24
0.00
3.13
0.00
0.67
0.99
0.63
0.00
4.19
2.88
1.34
3.91
0.67
0.00
2.70
0.91
1.58
0.00
2.89
0.00
1.96
1.44
4.51
3.45
1.46
0.00
2.08
0.00
1.77
2.80
1.07
0.00
0.00
0.84
0.08
0.97
0.00
98.94
98.88
99.70
99.89
99.02
99.82
100.05
99.45
100.38
98.93
100.16
99.78
99.66
99.25
99.61
98.81
99.16
98.61
98.48
99.10
99.61
98.78
98.48
99.49
99.69
99.25
100.09
100.33
99.00
99.31
98.03
99.61
99.57
99.50
99.50
99.70
99.40
99.86
99.84
99.05
98.53
98.05
97.87
98.13
100.22
87.98
77.50
97.58
94.48
96.92
89.28
93.16
90.38
92.72
95.74
90.23
95.70
96.52
96.19
95.03
94.90
83.66
90.09
94.49
88.60
96.82
97.96
92.39
95.57
88.49
98.14
90.15
98.38
94.16
93.56
89.38
91.38
93.39
97.97
93.66
96.68
94.56
92.81
95.16
97.81
96.08
95.15
96.18
94.61
94.90
0.86
0.74
1.91
0.90
0.76
1.02
1.50
0.70
1.16
3.19
0.89
4.11
1.02
1.09
2.23
1.67
0.83
4.04
1.58
0.79
1.07
0.94
2.02
1.03
7.22
0.95
1.99
1.47
1.08
1.92
1.17
0.96
2.26
1.12
0.83
0.76
0.98
1.00
2.08
1.71
1.21
2.99
1.04
0.83
4.63
3.27
6.56
0.51
3.72
1.69
3.83
1.99
2.54
1.97
1.07
3.14
0.20
1.18
0.84
1.56
3.43
7.89
0.47
1.38
3.42
0.83
1.10
0.51
1.68
1.30
0.91
2.52
0.15
1.07
1.86
1.06
1.29
1.61
0.91
1.61
2.57
1.14
1.01
0.75
0.47
2.71
0.24
2.61
2.70
0.47
7.89
15.20
0.00
0.89
0.63
5.87
3.35
6.38
4.15
0.00
5.74
0.00
1.28
1.87
1.18
0.00
7.61
5.41
2.55
7.20
1.27
0.00
5.08
1.71
2.99
0.00
5.33
0.00
3.70
2.66
8.39
6.37
2.75
0.00
3.89
0.00
3.32
5.18
2.01
0.00
0.00
1.62
0.16
1.86
0.00
331

APPENDIX B.2
EASTERN CAPE SAMPLES - ILMENITE MICROPROBE ANALYSES 332
Recalculated Recalculated mole fractions
Sample Si02 Ti02 Al203 Cr203 MnO MgO FeO Fe203 TOTAL FeTi03 MnTi03 MgTi03 Fe203
39 0.07 51.54 0.03 0.06 0.45 0.48 45.11 0.35 98.08 96.52 0.98 1.84 0.66
42 0.08 53.27 0.03 0.76 0.47 44.56 0.00 99.19 96.50 1.68 1.82 0.00
43 0.03 50.43 0.03 0.07 0.69 0.34 44.08 3.91 99.56 90.14 1.42 1.24 7.19
44 0.04 51.47 0.06 0.53 0.73 44.49 2.94 100.24 90.86 1.10 2.65 5.39
48 50.69 0.08 0.09 0.44 1.41 42.64 3.97 99.32 86.73 0.90 5.10 7.27
49 0.06 50.46 0.10 0.03 0.42 0.67 43.82 1.44 96.99 93.75 0.92 2.57 2.77
52 0.04 51.45 0.04 0.54 0.30 45.22 1.50 99.09 94.87 1.15 1.14 2.84
54 52.87 0.03 0.52 0.09 45.46 0.00 99.00 98.50 1.14 0.36 0.00
55 52.75 0.06 0.49 0.77 45.02 0.00 99.11 96.00 1.06 2.94 0.00
56 52.54 0.05 0.39 0.66 44.73 0.00 98.39 96.62 0.84 2.54 0.00
62 0.03 48.63 1.07 0.23 42.26 7.51 99.75 83.65 2.15 0.82 13.38
68 51.11 0.76 0.20 44.85 3.12 100.06 91.95 1.58 0.72 5.75
69 0.03 51.42 0.62 0.24 45.23 1.84 99.39 94.36 1.30 0.88 3.46
-= below detection limit

APPENDIX B.3: MAGNETITE ANALYSES FROM COASTAL SEDIMENTS 333
Recalculated Sample Si02 Ti02 Al203 Cr203 FeO MnO MgO FeO Fe203 Total
HZ2-1 0.03 0.13 0.08 92.07 - 30.83 68.06 99.18 2 0.37 0.07 0.53 0.12 91.52 0.08 0.08 31.32 66.90 99.45 3 - 0.72 4.61 12.69 74.59 0.35 1.90 29.40 50.22 99.88 4 0.05 0.03 - 92.98 - 31.06 68.81 100.00 5 0.04 0.06 - 93.08 0.21 0.01 30.96 69.04 100.32 6 0.07 0.36 0.15 92.06 0.07 30.92 67.94 99.54 7 0.05 0.04 92.60 0.12 - 30.88 68.60 99.73 8 0.07 0.06 92.43 - 30.86 68.42 99.49 9 0.03 0.34 0.46 0.13 91.44 0.02 31.12 67.03 99.19 10 0.06 2.23 0.13 89.11 - 30.81 64.78 98.08 11 0.04 0.09 - 92.31 0.11 - 30.79 68.37 99.41 12 0.23 0.60 90.59 0.14 30.35 66.95 98.32 13 0.08 0.05 93.04 - 31.07 68.87 100.09 14 0.09 0.04 92.70 - 30.95 68.61 99.70 15 0.07 0.05 92.10 - 30.75 68.17 99.11 16 0.11 0.34 0.18 91.52 0.06 30.78 67.50 98.96 17 0.16 - 92.26 - 30.87 68.22 99.30 18 0.13 11.56 1.19 0.09 80.06 0.19 - 41.20 43.19 97.56 19 0.14 11.52 1.17 0.10 80.21 0.25 0.04 41.13 43.43 97.77 20 0.06 0.44 0.10 91.69 0.07 30.79 67.69 99.15 21 0.05 0.33 0.08 91.49 0.08 30.62 67.64 98.84 22 0.09 0.42 0.10 91.51 0.03 30.79 67.49 98.94 23 0.06 0.12 0.04 92.63 0.10 - 30.94 68.56 99.81 24 0.05 0.37 0.15 91.34 0.03 30.66 67.43 98.73 25 0.03 0.05 0.11 0.09 89.95 0.03 30.11 66.51 96.95 26 0.86 13.42 1.98 0.05 77.01 0.61 0.35 43.25 37.52 98.04 27 0.12 - 92.49 0.08 0.02 30.84 68.50 99.60 28 0.07 0.20 - 92.13 0.24 30.73 68.24 99.48 29 0.05 0.29 0.11 92.22 0.04 30.91 68.14 99.55 30 0.06 - 93.58 0.16 31.15 69.38 100.82
-= Below detection limit

APPENDIX B.3:MAGNETITE ANALYSES FROM COASTAL SEDIMENTS 334
Recalculated Sample Si02 Ti02 Al203 Cr203 FeO MnO MgO FeO Fe203 Total
HZ1-1 0.08 0.03 0.05 92.56 - 31.04 68.36 99.63 2 0.10 0.04 91.47 - 30.53 67.72 98.47 3 0.09 10.64 2.26 0.16 80.47 0.19 0.10 40.59 44.32 98.35 4 0.04 - 92.71 0.07 - 30.93 68.65 99.75 5 0.04 0.04 0.05 - 92.38 0.15 0.02 30.80 68.43 99.54 6 0.03 0.11 92.45 0.08 30.80 68.51 99.58 7 0.06 . 0.05 92.24 0.07 30.79 68.28 99.29 8 2.42 22.14 62.77 0.55 4.57 23.24 43.93 96.87 9 0.37 0.04 0.63 0.19 91.17 0.10 31.27 66.57 99.15 10 0.05 0.05 0.09 0.19 91.49 - 30.70 67.56 98.68 11 0.05 0.13 0.15 0.07 92.41 0.40 - 30.87 68.39 100.05 12 0.07 0.04 0.07 0.09 91.47 0.22 - 30.57 67.68 98.73 13 0.06 0.04 0.08 92.04 0.07 - 30.79 68.06 99.13 14 0.05 0.04 0.10 0.16 92.38 0.34 - 30.78 68.46 99.93 15 0.07 0.07 0.12 0.11 92.44 0.39 - 30.83 68.47 100.06 16 0.04 0.08 0.06 91.82 0.16 0.02 30.62 68.01 98.99 17 0.05 0.06 0.28 0.10 91.76 - 30.87 67.67 99.07 -18 0.04 0.12 0.15 92.21 0.07 - 30.90 68.13 99.45
HZ7-1 0.10 0.34 18.63 69.46 0.58 1.88 26.67 47.55 95.76 2 0.14 17.59 0.91 0.04 76.91 0.79 0.05 46.80 33.46 99.78 3 0.03 21.31 1.48 0.11 72.56 0.46 0.26 49.89 25.20 98.72 4 0.04 18.86 2.26 0.13 75.08 0.55 0.27 48.12 29.96 100.19 5 0.07 0.05 0.07 91.26 - 30.52 67.50 98.25 6 3.92 29.60 2.14 - 62.80 1.68 0.08 62.46 0.38 100.27 7 0.30 24.86 1.12 0.08 69.41 1.04 0.32 52.88 18.36 98.97 8 0.18 13.02 1.87 0.14 79.46 0.50 0.06 42.89 40.63 99.30 9 0.18 14.44 1.32 0.11 78.67 0.48 0.09 44.05 38.47 99.14 10 0.06 1.77 20.20 66.64 0.42 3.43 25.12 46.14 97.15 11 1.06 29.40 0.65 0.04 57.85 2.65 0.08 54.65 3.56 92.08 12 0.07 26.69 1.17 0.10 64.70 0.12 0.12 54.03 11.86 94.16 13 0.12 0.43 0.16 91.22 0.11 30.67 67.28 98.79 14 11.08 20.92 1.50 - 64.69 0.41 0.35 64.32 0.41 98.99 15 0.04 0.05 0.13 91.84 0.03 30.67 67.98 98.92 16 0.05 0.07 0.05 91.83 30.69 67.94 98.85 17 1.37 27.95 1.46 0.08 64.57 1.76 0.20 56.49 8.98 98.30 18 0.08 0.23 0.58 92.52 31.23 68.11 100.28 19 0.09 0.16 0.04 91.63 0.02 30.71 67.70 98.77
- = Below detection limit

APPENDIX B.3: MAGNETITE ANALYSES FROM COASTAL SEDIMENTS 335
Recalculated Sample Si02 Ti02 Al203 Cr203 FeO MnO MgO FeO Fe203 Total
HZ7-1 0.09 26.46 0.83 0.08 68.72 0.44 0.26 54.59 15.71 98.44 2 0.04 0.04 92.08 0.00 30.77 68.13 99.09 3 0.30 25.32 1.22 0.08 67.00 2.38 0.17 51.96 16.72 98.14 4 0.06 18.76 1.42 1.81 72.15 0.19 1.04 46.50 28.51 98.28 5 0.04 0.07 0.07 0.08 92.53 0.08 0.03 30.96 68.42 99.75 6 0.04 0.14 0.08 92.30 0.01 30.87 68.26 99.49 7 0.48 0.18 91.37 - 30.82 67.30 98.83 8 0.20 14.88 0.72 0.09 79.70 0.35 0.09 44.76 38.83 99.92 9 0.15 11.21 0.95 0.13 81.86 0.57 0.22 40.82 45.60 99.66 10 0.09 0.13 0.09 91.65 0.08 - 30.70 67.74 98.83 11 - 22.06 1.58 0.10 72.99 0.30 0.26 51.07 24.36 99.76 12 0.07 0.16 0.14 91.89 - 30.80 67.88 99.10 13 0.10 0.16 91.72 - 30.68 67.84 98.84 14 0.05 28.40 0.99 0.04 67.37 0.36 0.20 56.59 11.98 98.60 15 9.13 2.27 0.18 81.30 0.24 0.22 38.76 47.27 98.09 16 0.16 0.18 0.06 92.16 - 30.98 67.98 99.43 17 0.39 24.29 1.02 0.09 69.60 1.91 0.02 52.14 19.40 99.26 18 0.04 0.14 0.08 91.62 - 30.67 67.73 98.68 19 - 25.66 0.06 - 72.22 - 54.86 19.29 99.89 20 0.22 28.45 1.33 0.05 64.87 2.51 0.02 55.01 10.96 98.55 21 0.07 0.13 0.28 92.10 - 30.91 68.00 99.44 22 0.21 23.36 1.41 0.06 71.18 0.63 0.40 51.85 21.48 99.39 23 0.23 26.62 1.06 - 69.37 0.50 0.08 55.48 15.44 99.44 24 0.04 25.10 1.38 0.13 69.97 0.29 0.33 53.58 18.21 99.08 25 0.20 34.93 0.80 0.04 62.81 0.46 0.44 62.69 0.13 99.69 26 0.12 0.19 0.05 91.17 0.16 - 30.53 67.39 98.44 27 0.05 13.33 1.19 0.09 79.24 0.32 0.26 42.53 40.79 98.57 28 0.67 20.56 1.05 0.09 71.68 1.45 0.08 49.05 25.15 98.10 29 0.18 27.53 1.32 0.08 68.44 0.64 0.72 55.48 14.40 100.35
HZ30-1 - 25.87 0.14 0.04 69.07 0.64 0.16 53.51 17.29 97.65 2 - 15.43 0.13 - 78.38 0.43 0.48 43.85 38.37 98.73 3 5.25 4.99 21.03 60.20 0.35 5.09 29.05 34.61 100.37
-= Below detection limit

APPENDIX B.3: MAGNETITE ANALYSES FROM COASTAL SEDIMENTS 336
Recalculated Sample Si02 Ti02 AI203 Cr203 FeO MnO MgO FeO Fe203 Total
HN3-1 0.50 12.40 1.93 0.27 79.80 0.74 0.18 42.54 41.40 99.97 2 0.07 17.74 1.37 0.17 76.59 0.75 0.11 46.97 32.92 100.08 3 18.10 30.22 1.92 0.15 22.64 0.12 0.11 4 0.04 11.75 2.60 0.26 80.59 0.20 0.04 42.15 42.72 99.76 5 1.28 12.01 1.89 0.17 79.52 0.54 0.65 42.76 40.86 100.15 6 4.44 25.69 1.10 0.11 67.87 0.69 0.12 60.44 8.26 100.84 7 0.08 0.06 0.10 91.99 0.12 - 30.78 68.03 99.18 8 1.23 20.71 1.77 0.17 71.02 1.23 0.37 50.08 23.27 98.82 9 1.29 22.08 1.54 0.09 72.11 0.75 0.22 52.56 21.73 100.25 10 0.06 - 90.56 0.07 - 30.16 67.12 97.41 11 0.37 23.89 1.01 - 70.93 1.04 0.66 51.87 21.18 100.02 12 0.43 0.37 0.16 - 91.74 - 31.75 66.67 99.43 13 - 11.45 1.06 0.10 79.06 0.47 0.16 40.10 43.29 96.64 14 - 15.82 0.91 0.21 78.71 0.18 0.87 44.54 37.97 100.50 15 - 14.60 1.91 0.08 78.74 0.26 0.14 44.34 38.22 99.56 16 0.83 1.47 . 91.03 0.03 31.97 65.64 99.98 17 - 18.78 1.44 0.05 74.54 0.28 0.73 47.00 30.60 98.87
HN6-1 0.05 0.40 - 92.37 0.15 - 30.93 68.27 99.84 2 0.06 0.23 92.14 0.07 - 30.77 68.20 99.34 3 0.04 0.22 0.12 91.96 - 30.83 67.94 99.16 4 0.59 21.10 1.39 0.07 72.54 0.57 0.44 47.35 27.99 99.50 5 0.05 0.05 - 91.95 0.12 - 30.65 68.12 99.01 6 0.08 0.06 92.93 0.11 - 30.99 68.83 100.10 7 0.05 0.11 0.06 91.77 . 0.12 - 30.64 67.93 98.90 8 0.35 0.33 0.07 91.29 0.09 0.02 30.90 67.12 98.86 9 0.17 0.06 92.08 0.08 - 30.72 68.19 99.24 10 0.21 0.29 - 91.87 0.09 - 30.90 67.76 99.27 11 0.05 0.06 0.11 91.36 0.08 0.03 30.25 67.90 98.49 12 0.13 0.12 91.79 - 30.69 67.90 98.92 13 0.07 13.34 1.08 0.05 79.84 0.23 0.30 42.42 41.59 99.06 14 0.03 0.07 0.07 0.05 92.09 - 30.69 68.23 99.19 15 0.22 22.28 1.31 0.11 70.90 0.78 0.08 49.70 23.56 98.04 16 0.07 0.17 0.41 0.11 92.32 - 30.99 68.15 99.89 17 0.04 0.05 0.04 92.48 0.17 30.80 68.55 99.65 18 0.80 26.05 1.05 0.10 67.95 1.36 0.40 50.46 19.43 99.66 19 0.05 0.19 0.07 91.85 30.76 67.89 98.96 20 0.06 0.15 92.05 0.07 30.74 68.13 99.15
-= Below detection limit

APPENDIX B.3: MAGNETITE ANALYSES FROM COASTAL SEDIMENTS 337
Recalculated Sample Si02 Ti02 Al203 Cr203 FeO MnO MgO FeO Fe203 Total
HN28-1 - 17.92 0.06 0.04 76.60 0.24 0.10 46.77 33.14 98.28 2 5.36 1.13 0.12 83.67 0.21 2.28 32.00 57.42 98.54 3 0.45 0.18 - 91.73 0.07 0.03 31.13 67.34 99.22 4 0.03 0.50 0.13 - 91.47 0.26 - 30.86 67.35 99.17
HT3-1 0.06 2.04 0.93 0.10 86.76 0.08 - 31.59 61.30 96.12 2 0.49 19.89 1.08 0.07 73.67 0.79 0.19 46.63 30.05 99.19 3 0.14 12.20 1.48 0.06 78.11 0.42 1.55 38.81 43.67 98.33 4 0.82 2.88 0.19 - 87.81 0.20 0.04 30.03 64.21 98.39 5 0.11 4.72 1.50 0.12 83.74 0.18 0.47 30.94 68.26 99.84 6 0.08 19.99 2.01 0.10 71.19 0.80 0.92 47.17 26.70 97.76 7 - 34.28 0.60 - 64.34 0.21 0.61 62.00 2.60 100.33 8 0.08 33.40 0.63 0.06 64.42 1.14 0.04 61.14 3.64 100.13 9 0.21 6.71 0.72 0.13 85.57 0.19 0.04 37.11 53.85 98.95 10 0.10 19.35 1.68 0.14 75.26 0.34 0.06 48.97 29.21 99.85 11 3.82 10.02 3.63 0.11 76.32 0.26 0.14 44.95 34.86 97.79 12 0.31 19.18 1.46 0.15 72.51 0.71 0.03 47.89 27.36 97.08 13 0.20 12.05 3.86 0.17 76.56 0.29 0.06 41.89 38.52 97.05 14 3.03 24.02 2.36 0.10 67.54 0.41 0.40 56.55 12.22 99.09 15 0.13 23.69 0.83 0.09 70.15 0.47 0.15 51.91 20.27 97.55 16 0.13 5.54 1.56 0.13 87.30 0.16 - 36.62 56.32 100.46 17 0.63 2.06 0.62 0.14 89.14 0.08 0.09 33.36 61.98 98.96 18 0.16 20.28 2.08 0.10 74.60 0.36 - 50.19 27.12 100.29 19 0.05 3.87 2.00 0.17 82.58 0.20 1.18 1.23 90.40 99.09 20 0.11 16.12 1.80 0.23 76.64 0.80 0.02 45.41 34.70 99.19
HTI-1 - 11.30 1.85 - 79.90 0.52 0.74 39.82 44.54 98.77 2 - 10.03 0.22 0.34 83.84 0.17 0.02 40.08 48.63 99.51 3 0.11 31.44 0.77 0.11 66.13 0.88 0.04 59.68 7.17 100.20 4 0.09 3.07 4.46 0.12 83.84 0.30 2.06 31.25 58.44 99.80
-= Below detection limit

APPENDIX B.3: MAGNETITE ANALYSES FROM COASTAL SEDIMENTS 338
Recalculated Sample Si02 Ti02 Al203 Cr203 FeO MnO MgO FeO Fe203 Total
HEC5-1 0.07 4.36 1.71 0.07 85.33 0.42 1.76 32.23 59.01 99.63 2 0.1.8 0.51 0.33 0.33 87.48 0.19 0.46 96.70 98.71 3 1.25 1.51 0.60 0.10 88.34 0.26 0.04 33.34 61.12 98.23 4 0.19 0.24 0.11 0.26 88.23 0.12 0.33 97.68 98.94 5 0.45 0.52 0.30 0.08 87.51 0.07 0.07 0.81 96.34 98.64 6 0.24 5.05 1.05 0.06 85.59 0.19 0.02 35.32 55.86 97.79 7 4.50 3.74 1.88 - 82.58 0.16 0.37 39.54 47.83 98.04 8 8.44 11.56 2.93 0.11 70.15 0.46 2.17 49.22 23.26 98.14 9 0.14 3.92 1.94 0.07 85.36 0.50 0.74 33.10 58.07 98.48 10 0.31 0.51 0.17 0.15 90.57 0.10 0.02 31.33 65.83 98.42 11 1.82 1.71 0.90 0.03 86.52 0.11 0.04 3.53 92.22 100.37 12 0.06 12.21 2.92 0.14 79.31 0.24 0.33 42.04 41.42 99.35 13 0.03 25.79 - 70.76 0.71 - 54.07 18.55 99.18 14 0.37 1.12 0.23 0.11 87.96 0.13 0.02 1.29 96.31 99.58 15 0.32 3.33 0.14 0.11 87.31 0.20 0.02 3.13 93.54 100.80 16 0.09 12.68 2.42 0.06 78.63 0.37 1.10 41.16 41.64 99.53 17 0.37 0.89 0.23 0.07 87.12 0.15 1.07 95.63 98.41
HEC6-1 0.16 5.02 1.48 0.05 85.07 0.28 0.83 34.17 56.56 98.56 2 0.03 27.90 0.15 0.06 70.25 0.32 - 56.78 14.97 100.21 3 0.14 7.52 2.03 0.10 81.74 0.58 0.64 36.32 50.48 97.81 4 0.29 5.28 1.33 0.10 84.65 0.57 0.58 34.58 55.64 98.36 5 0.51 18.79 1.57 - 74.51 0.55 0.24 48.26 29.17 99.13 6 0.3.2 20.64 0.16 - 74.64 0.27 0.15 49.86 27.54 98.96
HEC3-1 0.55 11.44 0.80 0.04 82.15 0.17 0.26 41.94 44.69 99.88 2 0.30 29.92 1.33 0.04 64.49 0.72 0.10 57.89 7.34 97.64 3 1.01 12.22 1.42 0.05 78.91 0.67 0.25 42.48 40.48 98.56 4 0.10 14.87 1.37 0.04 77.61 0.83 0.09 43.85 37.52 98.66 5 17.65 22.61 3.35 - 41.93 0.69 0.69 6 0.12 17.00 1.44 0.04 77.34 0.72 0.05 46.50 34.27 100.13 7 6.93 1.86 3.79 - 82.56 0.18 0.12 42.32 44.71 99.94 8 3.13 24.33 1.19 - 67.13 0.72 0.46 56.08 12.28 98.22 9 8.25 0.51 0.12 83.67 0.44 0.07 37.71 51.08 98.19 10 3.91 1.05 0.16 85.96 0.23 0.21 33.49 58.31 97.36 11 5.42 0.35 - 85.64 0.69 2.58 31.68 59.96 100.73
HEC1-1 0.27 29.34 0.76 - 65.23 0.77 0.14 57.02 9.12 97.44
-= Below detection limit

339
APPENDIX C
Analyses of i1menite and magnetite from source rocks

APPENDIX C.l
ILMENITE ANALYSIS FROM SOURCE ROCKS
ANALYSIS NO REFERENCE ROCK TYPE LOCALITY
9
7
8
10
4
3
BHPG IR236
D3+
D7+
D12 (ilm. cone.)
D6A+
D8 +
DB (ilm. cone.)
D4+
D5 (ilm cone.)
D6 (ilm cone.)
D9 (ilm cone.)
DI0 (ilm cone.)
DU (ilm cone.)
724
658
658
670
700
722
662
691
DM/13-6
DM/13-4
DM/13-2
DM/13-5
DM/13-1
DM/13-3
D6-1
D6-2
D6-3
D6-4
D6-5
DM/4-2
DM/4-1
DM/4-3
DM/ll-4
DM/ll-l
DM/ll -3
Groves, et al. (1986) Granophyre
Cawthorn, et al. (1985) Granophyre
ReynQlds, 1978 Granophyre
Reynolds, 1978 Dolerite
. Reynolds, 1983 Dolerite
Meth, 1991 Dolerite
This work Dolerite
Meth,I991 Dolerite
Blank spaces = not reported or below detection limit
lnsizwa
South Africa
eastern Cape
eastern Cape
Rooi Rand
Underberg
RooiRand
340
Ti02 Cr203 FeO Fe203 MgO MnO Si02 A121
52.30
50.80
50.80
52.30
50.60
49.50
49.87
49.42
51.79
50.49
49.65
51.26
50.91
49.37
50.90
49.85
50.60
48.77
49.46
49.92
49.92
48.88
49.32
49.47
49.02
50.10
49.27
48.91
49.71
51.66
48.41
50.22
51.01
47.83
51.08
50.59
48.48
52.42
52.15
48.81
48.30
48.54
50.91
51.45
50.71
0.05 39.60
0.05 41.27
0.05 41.68
0.50 40.14
0.10 39.70
0.05 40.43
0.17 39.70
0.17 38.80
45.59
44.25
0.04 43.90
45.30
45.87
43.51
45.93
44.16
44.24
43.13
43.47
0.04 44.05
42.82
42.15
42.91
43.16
41.84
0.03 43.75
43.30
42.24
0.56 43.52
0.12 45.29
0.56 42.46
0.28 44.17
0.63
0.05
0.03
44.64
41.53
44.62
44.38
44.07
45.55
45.26
41.43
40.99
41 .74
43.97
44.52
43.86
0.00 0.03 7.10
3.70 0.03 4.30
2.69 0.03 3.90
0.85 0.40 6.10
3.44 0.30 5.20
. 5.96 0.30 3.50
5.57 0.59 4.04
5.43 0.63 4.46
0.00 0.70 0.40 0.72
2.05 0.05 1.38 0.21
5.38 0.08 0.60
0.00 0.16 0.41 1.08
0.00 0.20 0.89 1.90
5.43 0.22 0.49
0.00 0.22 0.44 1.26
4.26 0.22 0.27 nr
2.91 0.26 0.79 nr
7.01 0.29 0.21
5.64 0.32 0.43
4.58 0.35 0.21
5.20 0.88 0.50
6.45 0.15 1.52
5.46 0.20 1.07
6.00 0.29 0.80
6.08 0.30 1.68
4.70 0.32 0.72
5.68 0.33 0.41
6.39 0.44 0.95
4.03 0.14 0.92
0.24 0.17 0.85
4.48 0.17 0.76
2.43 0.19 0.64
0.07 0.22 0.83
7.73 0.23
1.50 0.12
2.30 0.18
1.81 0.49
0.00 0.05
1.06
1.69 0.17
1.64 0.18
1.62 0.71
1.66 0.09
o. O.
o. o. O.
o. o. O.
O.
O.
o. O.
2.
O. 1.66 0.04 1.60 0.04 O.
5.05 0.05 2.43
5.61 0.05 2.41
5.13 0.05 1.89
1.38 0.05 1.79
0.75 0.05 1.72
0.71 0.05 1.72

APPENDIX C.l
ILMENITE ANALYSIS FROM SOURCE ROCKS
ANALYSIS NO REFERENCE ROCK TYPE LOCALITY
DM/11-2
DM/5-1
DM/5-5
DM/5-2
DM/5-3
DM/5-4
DM/11-5
DM51
DM52
DM53
DM54
DM55
DM56
DM57
DM251
DM252
DM253
DM254
DM255
DM256
DM257
DM81
DM82
DM86
DM87
DM89
DM817
DM820
DM63
DM64
DM615
DM616
DM620
DM622
HS13
HS14
HS16
HS17
HS18
HS19
HS110
HS41
HS45
HS46
HS49
This work
This work
Dolerite
Basalt
Blank spaces = not reported or below detection limit
Sani Pass
341
Ti02 Cr203 FeO Fe203 MgO MnO Si02 A121
52.81
50.65
51.12
50.98
50.67
50.74
51.56
50.45
49.68
49.82
47.66
49.56
48.82
50.72
52.54
51.98
50.25
51.98
51.05
51.55
51.17
51.26
51.83
51.85
51.41
51.04
52.16
50.88
52.01
50.46
52.10
45.01 0.00 0.05 1.70
43.89 2.76 0.05 1.64
44.31 1.95 0.05 1.64
44.24 2.89 0.05 1.58
44.24 2.34 0.05 1.31
44.30 2.80 0.05 1.31
44.32 O.oI 0.06 1.91
0.06 44.29 3.63 0.35 0.48 0.02 0
0.05
0.03
0.03
0.03
0.03
0.07
0.03
0.03
0.07
0.09
43.49 5.10 0.20 0.82 0.00 O.
43.61 5.01 0.41 0.45 0.00 0
40.37 7.96 0.69 1.56 0.28 0
42.62 4.53 0.02 1.,92 0.02 0
42.87 5.91 0.31 0.49 0.01 0
44.57
46.57
45.89
44.54
46.10
45.11
45.35
45.29
45.15
45.94
45.69
45.29
44.94
46.01
44.76
45.11
43.70
2.63 0.30
0.10 0.06
1.67 0.26
3.81 0.04
1.16 0.08
3.03 0.12
1.71 0.01
2.56 0.05
1.13 0.04
0.34 0.07
0.71 0.16
1.17 0.13
1.36 0.03
0.79 0.09
2.72 0.13
1.51 0.27
2.64 0.00
0.52 0.02
0.63 0.06
0.43 0.03
0.61 0.04
0.52 0.02
0.67 0.08
1.02 0.04
0.72 0.08
0.90 0.04
0.86 0.27
0.68 0.02
0.71 0.02
0.91 0.02
0.76 0.03
0.80 0.04
1.21 0.03
1.72 0.05
o o o o o o o. o. o. O.
O.
o. o. o. O.
o. O.
45.84 1.17 0.06 0.94 0.03 O. 52.34 45.88 0.55 0.10 1.00 0.01 O. 48.33 0.03 42.36
52.68 46.22
49.31
49.57
50.60
52.32
51.98
50.93
0.48 43.23
0.39
0.15
0.17
0.23
43.60
44.51
45.58
45.64
44.71
49.78 0.17 43.65
51.82 44.94
48.29 0.06 42.39
51.38 0.08 45.29
51.93 45.63
7.55 0.01 1.25 0.16 O.
0.12 0.11 0.95 0.01 O.
4.78 0.13 0.90 0.02 O. 5.37 0.13
3.23 0.07
0.19 0.04
1.30 0.11
3.47 0.10
0.76 0.02
0.89 0.03
1.44 0.05
0.93 0.02
0.92 O.oI
O.
o. o. O.
O. 4.98 0.13 0.88 0.01 O.
0.93 0.63 0.54 0.00 0.'
7.43 0.07 0.92 0.01 O.
0.40 0.22 0.77 0.22 0 ..
0.81 0.30 0.53 0.00 0.1
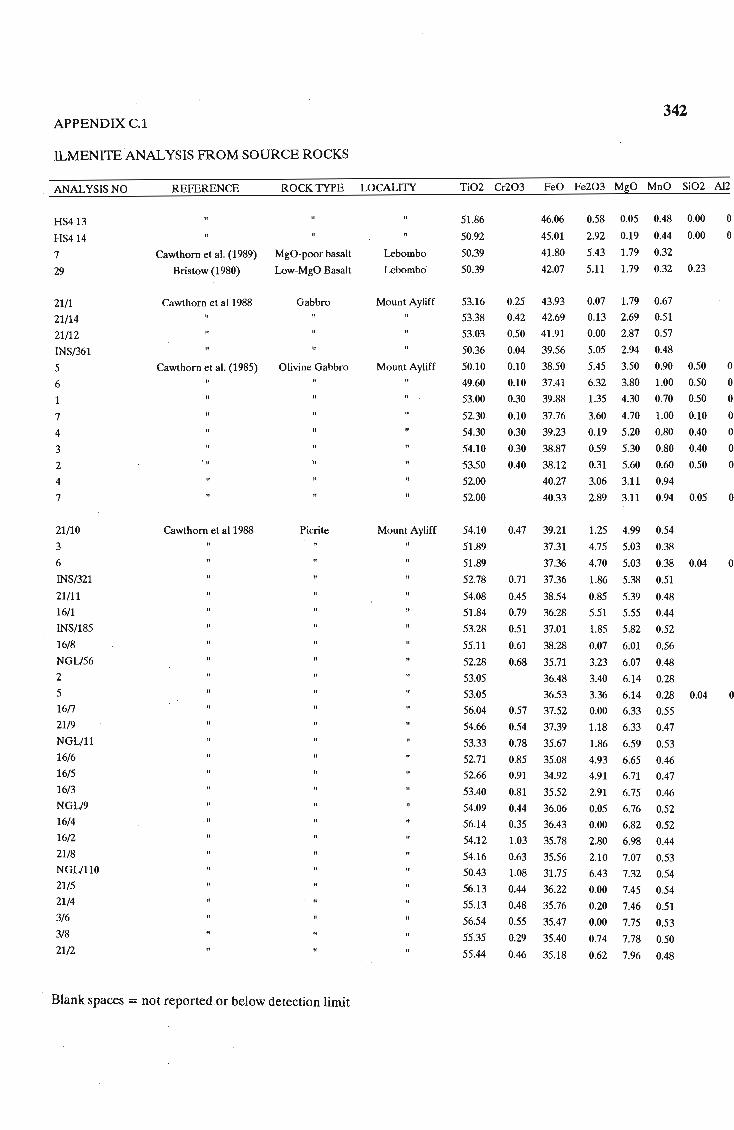
APPENDIX C.l
ILMENlTE ANALYSIS FROM SOURCE ROCKS
ANALYSIS NO REFERENCE ROCK TYPE LOCALITY
HS413
HS414
7
29
21/1
21/14
21/12
INS/361
5
6
1
7
4
3
2
4
7
21/10
3
6
INS/321
21/11
16/1
INS/185
16/8
NGL/56
2
5
16n
21/9
NGL/11
16/6
16/5
16/3
NGL/9
16/4
16/2
21/8
NGL/110
21/5
21/4
3/6
3/8
21/2
Cawthom et al. (1989)
Bristow (1980)
MgO-poor basalt
Low-MgO Basalt
Cawthom et a11988 Gabbro
Cawthorn et al. (1985) Olivine Gabbro
' n
Cawthom et al1988 Picrite
.11
Blank spaces = not reported or below detection limit
Lebombo
Lebombo
Mount Ayliff
Mount Ayliff
Mount Ayliff
342
Ti02 Cr203 FeO Fe203 MgO MnO Si02 Al2
51.86
50.92
50.39
50.39
46.06
45.01
41.80
42.07
53.16 0.25 43.93
53.38 0.42 42.69
53.03 0.50 41.91
50.36 0.04 39.56
0.58 0.05
2.92 0.19
5.43 1.79
5.11 1.79
0.48 0.00
0.44 0.00
0.32
0.32 0.23
0.07 1.79 0.67
0.13 2.69 0.51
0.00 2.87 0.57
5.05 2.94 0.48
o o
50.10 0.10 38.50 5.45 3.50 0.90 0.50 0
0.10
0.30
0.10
0.30
0.30
0.40
37.41
39.88
37.76
39.23
38.87
38.12
6.32 3.80
1.35 4.30
3.60 4.70
0.19 5.20
0.59 5.30
0.31 5.60
1.00 0.50
0.70 0.50
1.00 0.10
0.80 0.40
0.80 0.40
0.60 0.50
40.27 3.06 3.11 0.94
o o o o o o
49.60
53.00
52.30
54.30
54.10
53.50
52.00
52.00 40.33 2.89 3.11 0.94 0.05 O.
54.10
51.89
51.89
0.47 39.21
37.31
37.36
52.78 0.71 37.36
54.08 0.45 38.54
51.84 0.79 36.28
53.28 0.51 37.01
55.11 0.61 38.28
52.28 0.68 35.71
1.25 4.99
4.75 5.03
4.70 5.03
0.54
0.38
0.38 0.04
1.86 5.38 0.51
0,85 5.39 0.48
5.51 5.55 0.44
1.85 5.82 0.52
0.07 6.01 0.56
3.23 6.07 0.48
3.40 6.14 0.28
o.
53.05
53.05
36.48
36.53 3.36 6.14 0.28 0.04 O. 56.04 0.57 37.52 0.00 6.33 0.55
54.66 0.54 37.39 1.18 6.33 0.47
53.33 0.78 35.67 1.86 6.59 0.53
52.71 0.85 35.08
52.66 0.91 34.92
53.40 0.81 35.52
54.09 0.44 36.06
56.14 0.35 36.43
54.12 1.03 35.78
54.16 0.63 35.56
50.43 1.08 31.75
56.13 0.44 36.22
55.13 0.48 35.76
56.54 0.55 35.47
55.35 0.29 35.40
55.44 0.46 35.18
4.93 6.65 0.46
4.91 6.71 0.47
2.91 6.75 0.46
0.05 6.76 0.52
0.00 6.82 0.52
2.80 6.98 0.44
2.10 7.07 0.53
6.43 7.32 0.54
0.00 7.45 0.54
0.20 7.46 0.51
0.00 7.75 0.53
0.74 7.78 0.50
0.62 7.96 0.48

APPENDIX C.l 343
ILMENITE ANALYSIS FROM SOURCE ROCKS
ANALYSIS NO REFERENCE ROCK TYPE LOCALITY Ti02 Cr203 FeO Fe203 MgO MnO Si02 Al21
3/2
3/1
NGL!54
21/3
21/6
3/3
3/7
MB6
MB12
MB28
MB33
MB36
MB39
MB42
MB44
MB46
MB49
MB52
MB55
MB60
MB62
MB65
MB70
VA25
VA22
VA23
VA24
VA26
VA27
VA28
VA210
VA211
VA212
VA213
VA214
VA215
VA218
VA219
VA221
NDF501
NDF502
NDF503
VM31
VM32
Reynolds j 1986b MUBC
This work Amphibolite
This work Amphibolite
Amphibolite-gneiss
Blank spaces = not reported or below detection limit
56.17
55.89
54.41
56.36
56.79
57.43
0.55 35.33
0.58 34.75
0.63 33.35
0.48 34.60
0.43 33.99
0.52 33.19
56.98 0.48 32.39
0.00 8.14 0.48
0.15 8.44 0.46
0.98 8.49 0.44
0.00 8.55 0.47
0.00 8.58 0.47
0.00 9.26 0.43
0.00 10.22 0.40
Mambula Complex 50.37
50.82
51.39
52.09
51.18
52.17
51.38
51.53
52.59
51.86
52.90
52.29
53.03
52.61
51.64
54.09
MgeniRiver
Natal
Eshowe
51.85
52.01
51.89
52.09
51.99
49.57
50.97
48.81
50.89
53.03
52.71
49.63
50.53
53.42
53.44
52.31
51.25
50.03
49.88
50.36
51.36
0.17 41.36 5.83 1.71 0.88
0.17 40.83
0.17 41.99
0.17 40.06
0.17 41.11
0.17 40.89
0.17 41.20
0.17 41.90
0.16 35.38
0.17 38.35
0.17 39.40
0.17 40.28
0.17 39.38
0.17 40.72
0.17 39.97
0.18 36.15
6.39 2.22 0.95
4.07 1.92 0.77
5.43 3.25 0.91
5.59 2.27 0.92
4.47 2.85 0.92
4.39 2.31 0.86
4.31 1.95 0.98
5.03 6.07 1.03
4.39 4.16 0.85
4.83 3.71 0.84
3.59 3.25 0.82
3.35 4.24 0.78
4.15 3.18 0.82
5.59 3.14 0.88
2.63 6.61 0.72
45.44 0.62 0.11 1.00 0.02 O.
0.14
0.10
0.05
0,03
0.11
0.10
0.03
45.40 0.00 0.11 0.97 0.00 O.
45.64 0.77 0.14 0.76 0.00 O.
44.77 0.85 0.03 1.99 0.00 O.
45.21 0.49 0.14 1.28 0.00 O.
42.66 4.70 0.02 1.85 0.00 O.
44.11
42.40
43.94
45.41
45.13
43.63
44.52
44.88
45.07
45.98
45.01
42.82
41.37
42.84
43.74
3.10 0.06
7.88 0.03
3.37 0.02
0.00 0.60
0.00 0.79
5.65 0.03
3.40 0.06
0.00 0.57
0.00 0.36
0.60 0.33
2.37 0.05
4.71 0.29
5.56 0.03
4.16 0.03
1.45 0.04
1.61 0.01
1.47 0.04
1.80 0.04
0.72 0.03
0.47 0.00
0.94 0.01
0.80 0.00
0.89 0.00
0.49 0.00
0.50 0,03
0.99 0.01
1.64 O.oI
3.40 O.oI
2.38 0.01
2.35 0.00
o. 0.'
0.1
0.1
0.1
0.1
0.1
0.1
0.1
0.1 0.(
0,(
0.(
0.(
0.(

APPENDIX C.l 344
ILMENITE ANALYSIS FROM SOURCE ROCKS
ANALYSIS NO REFERENCE ROCK TYPE LOCALITY Ti02 Cr203 FeO Fe203 MgO MnO Si02 Al2C
VM33
VM35
VM36
VM37
VM39
VM311
VA41
VA42
VA44
VA45
VA46
VA48
VA410
NDFI0l
NDFI03
NDFI04
MS17-1
MS17-2
MS17-3
MSI7-4
MS17-5
MS17-6
MS17-7
MSI7-8
MS17-9
MS17-10
MSI7-11
UMG51
UMG52
UMG53
UMG54
UMG55
UMG58
UMG510
UMG512
UMG515
UMG516
UMG517
UMG519
UMG31
2
3
4
5
6
Amphibolite
Biotite schist
This work Granite-gneiss
Granite-gneiss
Blank spaces = not reported or below detection limit
Eshowe
50.03
49.56
51.98
53.17
53.20
52.21
53.46
53.47
52.05
52.79
53.41
53.14
52.79
Mapumulo Suite 52.86
Mgeni Valley
MgeniRiver
53.43
52.38
50.99
49.94
51.92
50.24
50.15
51.86
51.44
51.49
51.38
51.52
49.58
49.50
49.67
50.35
48.78
50.45
52.09
49.87
50.54
51.67
51.57
50.43
52.69
50.65
50.95
50.97
51.65
51.88
52.07
42.25
41.92
45.48
45.07
45.50
45.99
44.75
45.60
45.78
0.03 46.24
44.98
46.20
0.03 44.53
46.12
44.39
46.36
43.25
42.19
43.47
42.70
42.66
44.15
43.32
43.81
42.58
43.64
42.38
0.21 41.33
0.24 39.03
0.21 40.53
0.12 39.62
41.24
44.77
41.07
38.98
42.30
41.69
41.88
0.04 42.76
42.29
42.71
0.10 42.94
0.10 42.61
0.09 42.68
44.76
4.55 0.02 2.67 0.00 O.
5.90 0.04 2.57 0.03 o. 1.10 0.09 1.10 0.00 O.
0.00 0.04 1.32 0.01 O.
0.00 0.07 0.50 0.00 O.
0.83 0.06 0.86 0.02 O.
0.00 0.06 1.13 0.02 O.
0.00 0.04 0.30 0.03 O.
0.05 0.02 1.01 0.03 O.
0.00 0.06 0.93 0.00 O.
0.00 0.10 1.33 0.01 O.
0.00 0.07 0.36 0.02 O.
0.00 0.03 1.33 0.03 O.
0.00 0.04 0.33 0.02 O.
0.00 0.12 1.27 0.02 O.
0.57 0.21 0.37 0.01
1.69 0.04
3.55 0.03
0.61 0.04
2.52 0.03
3.02 0.03
0.38 0.02
2.52 O.oz 2.64 0.00
3.13 O.oI
2.41 0.01
2.37 O.oI
2.43 O.oI
O.
O.
O.
O.
O.
O.
O.
2.41 0.03 2.89 0.03 O.
2.67 0.02 2.43 0.01 O.
2.58 0.03 3.53 0.01 O.
2.48 0.03 2.61 0.01 O.
5.65 0.03 2.16 0.02 O.
4.82 0.05 3.11 0.05 O.
4.75 0.04 5.55 0.05 O.
3.89 0.03 4.69 0.05
5.86 0.03 4.20 0.05
O.
o. 3.88 0.02 4,04 0.00 0.'
0.85 0.03 1.99 0.00 0.'
5.15 0.02 3.69 0.00 0.1
4.10 0.02 6.38 0.02 0.'
1.90 0.03 4.08 0.01 0.'
1.90 0.02 4.62 0.03 0.1
3.45 0.05 3.36 O.oI 0.1
0.00 0.03 3.05 0.00 0.1
3.87 0.01 3.22 0.02 0.1
2.42 0.00 3.10 0.03 0.1
3.21 0.01 2.89 0.03 0.1
1.74 0.00 3.81 0.02 0.1
1.01 O.oI 4.01 0.09 0,(
1.37 0.02 2.01 0.01 0,(

APPENDIX C.l
ILMENITE ANALYSIS FROM SOURCE ROCKS
ANALYSIS NO . REFERENCE ROCK TYPE LOCALITY
7
9
VG11
2
3
4
5
6
7
8
9
10
12
13
15
16
17
18
19
VG41
2
3
4
5
6
7
8
9
11
12
14
15
16
18
20
21
22 23
Granite
Charnockite
Blank spaces = not reported or below detection limit
Kloof End Pluton
Port Edward
345
Ti02 Cr203 FeO Fe203 MgO MnO Si02 Al21
51.69 0.03 44.01
50.66
51.85
50A2
51.17
53.09
51.10
50.62
49.83
49.42
51.00
49.87
50.54
52.11
51.67
51.57
41.64
42.65
41.70
39.38
45.10
43.29
41.59
43.19
41.39
43.05
41.07
38.98
0.03 45.27
42.30
41.69
2.28 0,0} 2.42 0.00 0
3.82 0.07
1.16 0.02
3.85 0.02
2.46 0.02
0.00 0.21
2.70 0.02
3.83 0.01
4.16 0.06
5.17 0.00
1.69 0.00
3.74 0.00
3.92 0.03
3.58 0.01
6.52 0.00
1.45 0.06
2.59 0.00
3.88 0.02
1.50 0.00
3.01 0.00
2.78 0.00
o o o o o. o o. o. o. o
5.15 0.02 3.69 0.00 0
4.10 0.02 6.38 0.02 0
0.11 0.19 1.25 0.01 0
1.90 0.03 4.08 0.01 0
1.90 0.02 4.62 0.03 0
50A3 41.88 3.45 0.05 3.36 0.01 0
53.36 0.08 43.03 0.00 0.02 2.85 0.03 0
52.69 0.04 42.76 0.00 0.03 3.05 0.00 0
52.91 44.55 0.00 0.05 1.58 0.02 0
49.08
50.70
53.33
52.60
39.36 5.40 0.02 4.690.02 0
39.47 3.15 0.01 6.04 0.01 0
43.77 0.00 0,04 1.09 0.16 o. 45.13 0.00 0.02 1.22 0.03 o.
47.57 38.98
50.98 41.31
50.11 43.64
52.32 0.04 45.67
50.74 39.37
50.89 38.21
49.81 0.03 40.15
51.84
51.58
52.44
53.64
52.65
52.77
50.90
0.04
0.03
36.51
44.02
45.16
43.36
45.41
45.49
41.72
7.84 0,0} 4.10 0.30 o. 1.31 0.01 4.50 0.02 o. 4.30 0.08 1.29 0.02 o. 0.80 0.02 1.33 0.01 0
3.39 0.01 6.19 0.02 0
4.03 0.04 7.41 0.02 0
5.42 0.03 4.55 0.02 0
1.13 0.03 9.98 0.03 0
1.06 0.08 2.20 0,0} 0
0.00 0.07 1.18 0.03 0 0.00 0,04
0.00 0.08
0.00 0.08
3.58 0.01
2.84 0.01
1.57 0.01
1.46 0.00
4.00 0.02
0,
0,
0,
o.

APPENDIX C.2
MAGNETITE COMPOSITIONS FROM SOURCE ROCKS
Reference/Sample
Reynolds (1983)
Reynolds (1983)
Reynolds (1983)
Reynolds (1983)
Reynolds (1983)
Reynolds (1983)
Reynolds (1983)
Reynolds (1983)
Reynolds (1983)
Reynolds (1983)
Eales et al. (1980)
Eales et al. (1980)
Armstrong et al. (1984)
Armstrong et al. (1984)
Haggerty (1976b)
Haggerty (1976b)
Haggerty (1976b)
Haggerty (1976b)
Haggerty (1976b)
Haggerty (1976b)
Haggerty (1976b)
SampleD 8
SampleD 8
SampleD 8
SampleD 8
SampleD 8
SampleD 8
SampleD 8
SampleD 8
SampleD 8
SampleD 8
SampleD 8
SampleD 8
SampleD8
SampleD 8
SampleD 8
SampleD 8
SampleD 8
SampleHEC9
SampleHEC9
Rock Type
dolerite
dolerite
dolerite
dolerite
dolerite
dolerite
dolerite
dolerite
dolerite
dolerite
ferrotholeiite
ferrotholeiite
dolerite
dolerite
basalt
basalt
basalt
basalt
gabbro
gabbro
gabbro
dolerite
dolerite
dolerite
dolerite
dolerite
dolerite
dolerite
dolerite
dolerite
dolerite
dolerite
dolerite
dolerite
dolerite
dolerite
dolerite
dolerite
dol. and basalt
dol. and basalt
- = Below detection limit; nd = not reported
Si02 Ti02 A1203 Cr203 MnO MgO
nd 25.01 1.21 0.06 0.37 0.51
nd 21.99 1.45 0.07 0.45 0.38
nd 16.18 1.15 0.01 0.58 0.32
nd 15.70 1.46 0.10 0.59 0.76
od 14.64 1.41 0.17 0.39 0.25
nd 12.32 2.74 0.18 0.36 0.36
od 10.71 0.97 0.13 0.30 0.28
nd 9.74 1.93 0.27 0.29 0.22
nd 8.46 1.98 0.18 0.33 0.14
nd 5.99 2.48 0.17 0.21 0.34
nd 26.13 1.81 0.00 0.50 0.16
nd 7.27 1.76 0.56 0.31 0.26
0.39 12.54 1.21 nd 0.49 0.24
0.34 22.10 0.87 od 0.75 0.26
0.14 26.10 0.02 nd 0.67 0.87
od 23.80 0.03 nd 0.70 3.60
0.22 23.30 0.70 nd 0.46 1.24
nd 24.29 nd nd 0.53 0.19
0.10 3.81 nd nd 0.13 0.40
nd 8.57 0.18 nd 0.36 1.38
nd 8.16 · 0.10 nd 0.24 1.07
n~ O~ Q23
0.23 16.49 0.89 0.69 0.32
15.55 2.25 0.32 0.34 0.50
0.06 8.71 1.16 0.08 0.45 0.24
0.11 15.94 0.75 0.33 1.06 0.19
1.60 9.71 1.72 0.23 0.39 0.56
18.46 1.35 0.19 0.29 0.45
35.52 0.69 0.07
0.10 34.98 0.05 0.16 1.08 0.34
0.09 34.92 0.13 0.21 0.50 1.97
0.04 35.05 0.04 0.18 0.81 1.39
0.05 35.02 0.04 0.17 0.96 0.33
0.04 35.65 0.03 0.14 0.77 0.34
0.14 15.26 1.65 0.17 0.98 0.11
35.62 0.06 0.22 0.48 1.52
0.07 22.12 1.14 0.26 0.61 0.32
0.11 13.98 2.12 0.38 0.61 0.09
0.05 31.06 1.02 0.07 0.52 0.94
0.10 13.63 0.59 0.15 0.28 0.17
346
RECALCULATED
FeO
53.82
50.47
45.09
43.98
43.90
41.76
40.36
39.55
38.62
36.18
38.71
37.28
42.00
50.03
53.20
47.60
51.00
51.80
30.46
32.18
31.21
59.74
45.93
44.25
38.30
44.20
41.49
45.59
63.30
62.19
59.87
60.71
61.96
62.95
44.09
61.05
48.61
42.52
57.77
43.21
Fe203
18.41
24.62
36.40
36.79
38.70
41.45
47.08
47.25
50.11
54.25
32.72
52.33
42.12
24.38
17.30
20.80
20.20
20.27
62.39
54.48
56.93
6.31
36.38
34.98
50.03
35.52
45.08
27.64
0.52
1.40
1.49
1.69
0.69
0.10
36.19
(0.00)
19.87
36.06
7.16
41.25

APPENDIX C.2
MAGNETITE COMPOSITIONS FROM SOURCE ROCKS
Reference/Sample
SampleHEC9
SampleHEC9
SampleHEC9
SampleHEC9
SampleHEC9
SampleHEC9
SampleHEC9
SampleHEC9
SampleHEC9
SampleHEC9
SampleHEC9
SampleHEC9
SampleHEC9
SampleHEC9
SampleHEC9
Sample HEC9
Sample HEC9
SampleHEC9
SampleHEC9
SampleHEC9
SampleHEC9
SampleHEC9
SampleHEC9
Sample DM90-5
Sample DM90-5
Sample DM90-5
Sample DM90-5
Sample DM90-5
Sample DM90-5
Sample DM90-5
Sample DM90-25
Sample DM90-25
Sample DM90-25
Sample DM90-25 ·
Sample DM90-25
Sample DM90-25
Sample DM90-25
Sample DM90-25
Sample DM90-25
Sample DM90-25
Rock Type
dol. and basalt
dol. and basalt
dol. and basalt
dol. and basalt
dol. and basalt
dol. and basalt
dol. and basalt
dol. and basalt
dol. and basalt
dol. and basalt
dol. and basalt
dol. and basalt
dol. and basalt
dol. and basalt
dol. and basalt
dol. and basalt
dol. and basalt
dol. and basalt
dol. and basalt
dol. and basalt
dol. and basalt
dol. and basalt
dol. and basalt
dolerite
dolerite
dolerite
dolerite
dolerite
dolerite
dolerite
dolerite
dolerite
dolerite
dolerite
dolerite
dolerite
dolerite
dolerite
dolerite
dolerite
- = Below detection limit; nd = not reported
Si02 Ti02 A1203 Cr203
0.65 14.55 0.98 0.15
0.10 18.43 0.75 0.06
0.55 10.45 1.01 0.23
1.00 12.29 0.36 0.20
0.30 12.11 0.45 0.11
0.21 19.15 0.82 0.12
0.50 14.25 1.05 0.11
0.11 17.27 0.22 0.12
0.06 12.86 0.56 0.16
0.09 16.48 0.44 0.10
0.44 15.85 0.87 0.14
0.22 21.91 1.45 0.15
0.08 22.30 1.32 0.12
0.07 19.42 0.98 0.14
0.03 14.55 1.54 0.21
0.44 5.96 0.22 0.12
0.23 13.33 0.87
0.53 12.50 0.56
0.70 12.18 1.24 0.19
1.01 14.12 0.94 0.22
0.22 14.41 0.50 0.15
0.65 18.96 0.78 0.20
0.44 18.50 1.56 0.19
0.66 20.22 0.80
0.69 20.29· 1.00
0.38 23.31 0.60 0.04
0.14 29.07 0.77 0.04
0.84 18.06 1.10
1.88 21.69 0.68 0.06
0.45 23.61 0.78 0.09
0.59 6.63 1.89 0.16
0.36 22.18 1.13 0.12
0.30 28.98 2.09 0.13
1.09 5.88 1.02 0.19
0.15 6.69 6.73 0.21
1.58 12.57 3.02 0.14
1.54 9.29 1.42 0.23
0.12 31.45 2.34 0.04
0.67 9.53 2.59 0.23
0.12 5.81 2.55 0.18
MnO MgO
0.57 0.06
0.41 0.55
0.44 0.03
0.53 0.16
0.60 0.10
1.00 0.81
0.25 0.23
0.38 0.29
0.33 0.08
0.23 0.18
0.24 0.25
0.33 0.36
0.86 0.07
0.47 0.52
0.49 0.10
0.18 0.11
0.42 0.12
0.41 0.07
0.83 0.07
0.75 0.04
0.91
0.87 0.44
0.89 0.36
1.48 0.87
1.16 0.92
1.20 0.47
1.18 0.06
1.02 1.13
0.32 0.08
1.27 0.48
0.22 0.08
0.60 0.06
0.71 0.07
0.16 0.12
0.13 0.09
0.21 0.53
0.27 0.23
0.42 0.09
0.23 0.16
0.10 0.06
RECALCULATED
FeO
45.15
46.89
41.00
42.88
41.69
46.64
44.71
46.61
42.06
46.32
46.12
50.78
50.83
47.50
44.03
36.77
42.15
42.06
42.52
45.03
43.61
47.84
48.50
46.99
47.18
50.02
55.72
44.77
52.44
51.14
37.58
51.62
57.25
36.69
37.53
43.24
40.20
59.36
40.11
35.78
Fe203
38.57
31.87
45.70
41.91
43.58
30.01
39.49
35.51
41.77
37.04
36.84
23.86
23.44
28.97
38.43
55.94
39.23
40.97
42.09
38.42
39.31
29.36
32.29
25.62
24.80
19.58
8.52
27.90
19.73
20.40
51.56
23.89
8.24
51.32
45.73
35.15
43.07
3.17
44.35
51.93
347

APPENDIX C.2
MAGNETITE COMPOSITIONS FROM SOURCE ROCKS
Reference/Sample
Sample DM9O-25
Sample DM9O-25
Sample DM9O-25
Sample DM90-25
Sample DM90-25
Sample DM90-8
Sample DM90-8
Sample DM90-8
Sample DM9O-8
Sample DM90-8
Sample DM90-8
Sample DM90-8
Sample DM90-8
Sample DM90-8
Haggerty(1976b)
Haggerty (1976b)
Haggerty (1976b)
Haggerty (1976b)
Haggerty (1976b)
Haggerty (1976b)
Haggerty (1976b)
Haggerty (1976b)
Haggerty (1976b)
Haggerty (1976b)
Haggerty (1976b)
Haggerty (1976b)
Haggerty (1976b)
Haggerty (1976b)
Reynolds (1986d)
Reynolds (1986d)
Reynolds (1986d)
Reynolds (1986d)
Reynolds (1986d)
Reynolds (1984)
Gjelsvik (1957)
Gjelsvik (1957)
Gjelsvik (1957)
Gjelsvik (1957)
Gjelsvik (1957)
Haggerty (1976b)
Rock Type
dolerite
dolerite
dolerite
dolerite
dolerite
dolerite
dolerite
dolerite
dole rite
dolerite
dolerite
dolerite
dolerite
dolerite
basalt
basalt
basalt
basalt
basalt
basalt
basalt
basalt
basalt
trachybasalt
trachybasalt
tholeiite
tholeiite
tholeiite
MUSC
MUSC
MUBC
MUBC
MUBC
MUBC
MUBC
MUSC
MUBC
MUBC
MUBC
granite
- = Below detection limit; nd = not reported
Si02 Ti02 A1203
0.19 26.77 1.94
0.14 32.27 1.17
0.16 9.86 4.08
0.15 6.62 4.94
1.50 10.13 1.19
0.15 4.51 1.86
0.25 27.06 0.96
0.56 4.70 2.68
0.17 4.17 2.29
0.19 19.73 3.11
0.50 6.40 2.22
0.12 3.39 1.95
0.56 6.27 2.53
0.17 3.47 2.21
nd 20.01 1.92
nd 12.96 2.54
nd 19.70 1.56
nd 17.34 1.93
nd 15.01 2.56
nd 21.07 2.09
nd 20.15 1.59
nd 19.12 1.78
nd 20.22 1.45
nd 21.65 0.62
nd 23.52 2.65
nd 17.50 2.90
nd 28.80 1.18
nd 26.98 3.92
nd
nd
0.38 "
0.34
nd 0.21
nd 0.28
nd 0.16
nd 0.27
0.90 1.10
0.10 0.50
3.60 1.90
0.20 1.00
nd 14.60
nd 5.92
0.52
0.61
0.62
1.17
1.87
0.40
nd
nd
nd
nd
nd
0.59
Cr203 MnO MgO
0.11 0.35 0.08
0.08 0.59 0.08
0.15 0.22 0.08
0.25 0.17 0.17
0.15 0.36 0.26
0.18 0.16 0.03
0.10 0.61 0.04
0.25 0.17 0.04
0.28 0.15 0.04
0.16 0.44 0.15
0.11 0.16 0.04
0.15 0.13 0.02
0.17 0.21 0.06
0.24 0.12 0.04
0.06 0.52 1.34
0.07 0.52 0.93
0.05 0.47 0.95
0.15 1.05 0.44
0.13 0.49 0.95
0.67 1.34
0.05 0.58 1.16
0.04 0.43 1.25
0.06 0.83 0.94
0.01 1.29 0.04
0.59 4.31
0.34 0.90
0.82 0.50
0.04 0.87 1.83
0.10
0.10
0.10
0.22
0.14 0.21
0.11 0.07 0.29
0.14 0.37
0.13 0.10
nd nd 0.00
nd nd 0.80
nd 0.10 3.50
nd nd 0.40
nd 0.30 0.00
nd 0.50 0.10
RECALCULATED
FeO
55.40
59.63
40.11
37.17
41.24
34.61
55.97
35.69
33.96
48.67
36.41
33.85
37.06
33.39
47.55
41.34
47.80
45.68
43.23
48.53
47.40
46.68
47.30
49.30
46.39
46.00
56.10
53.40
31.13
30.67
30.66
30.46
30.43
30.99
31.30
26.10
31.40
32.00
41.50
29.55
Fe203
13.06
2.52
43.10
48.37
43.01
55.45
14.85
53.67
54.55
24.88
49.59
58.22
50.86
56.18
28.49
40.55
29.83
33.13
36.84
27.19
28.21
30.47
28.74
24.50
23.35
31.40
10.70
13.88
67.12
66.71
67.08
65.94
65.44
67.87
63.40
71.80
57.40
64.80
44.10
61.33
348

APPENDIX C.2
MAGNETITE COMPOSITIONS FROM SOURCE ROCKS
Reference/Sample
Haggerty (1976b)
Haggerty (1976b) .
Haggerty (1976b)
Haggerty (1976b)
Rollinson (1980)
Rollinson (1980)
Rollinson (1980)
Rollinson (1980)
Rollinson (1980)
Rollinson (1980)
Rollinson (1980)
Rollinson (1980)
Rollinson (1980)
Rollinson (1980)
Rollinson (1980)
Rollinson (1980)
Rollinson (1980)
Rollinson (1980)
Rollinson (1980)
Rollinson (1980)
Rollinson (1980)
Rollinson (1980)
Rollinson (1980) .
Rollinson (1980)
Rollinson (1980)
Rollinson (1980)
Rollinson (1980)
Rollinson (1980)
Rollinson (1980)
Rollinson (1980)
Rollinson (1980)
Rollinson (1980)
Rollinson (1980)
RolIinson (1980)
Rollinson (1980)
Rollinson (1980)
Rollinson (1980)
RolIinson (1980)
Rollinson (1980)
Rollinson (1980)
Rock Type
granite
granite
granodionte
granodionte
metagranite
metagranite
metagranite
metagranite
metagranite
metagranite
metagranite
metagranite
metagranite
metagranite
metagranite
metagranite
metagranite
metagranite
metagranite
metagranite
metagranite
metagranite
metagranite
metagranite
metagranite
metagranite
metagranite
metagranite
metagranite
metagranite
metagranite
metagranite
metagranite
metagranite
metagranite
metagranite
metagranite
metagranite
metagranite
metagranite
- = Below detection limit; nd = not reported
Si02
nd
nd
nd
nd
0.15
0.14
nd
0.11
0.16
0.12
0.16
nd
nd
nd
0.17
0.17
0.16
0.14
nd
nd
nd
nd
nd
nd
nd
nd
nd
nd
nd
nd
nd
nd
nd
nd
nd
nd
nd
nd
nd
nd
Ti02
0.17
7.10
2.13
0.37
14.73
14.63
15.77
14.81
13.20
9.28
9.80
9.30 .
10.07
7.84
7.31
8.82
7.88
8.02
1.02
0.94
1.07
0.89
0.89
1.79
1.56
0.81
0.93
0.56
0.36
2.21
1.10
0.96
1.70
1.46
1.82
2.21
2.16
1.89
2.40
1.95
AI203 Cr203
nd nd
nd nd
0.40 0.03
0.10 nd
0.13 0.08
0.30 0.10
0.12 0.07
0.13 0.11
0.17 0.10
0.16 0.05
0.15 0.11
0.16 0.09
0.15 0.07
0.15 0.09
0.12 0.04
0.16 0.09
0.14 0.07
0.12 0.11
0.23 0.07
0.27 0.04
0.24 . 0.07
0.25 0.06
0.24 0.06
0.22 0.13
0.21 0.11
0.28 0.13
0.25 0.12
0.42 0.12
0.76 0.12
0.70 0.09
0.23 0.11
0.23 0.12
0.22 0.07
0.23 0.12
0.24 0.10
0.70 0.09
0.33 0.11
0.21 0.09
0.29 0.09
0.17 0.07
MnO
0.44
0.50
0.17
0.29
0.14
0.06
1.40
0.02
0.10
0.26
0.04
0.22
0.22
0.34
0.08
0.14
0.02
0.04
0.07
0.10
0.06
0.12
0.10
0.05
0.09
0.01
0.02
0.03
0.02
0.05
0.02
0.01
0.02
0.03
0.04
0.05
0.04
0.04
0.08
0.04
MgO
0.00
0.05
1.85
0.03
nd
0.06
0.03
nd
0.08
nd
nd
0.09
0.02
0.01
nd
nd
nd
0.02
0.02
0.03
0.01
0.02
0.06
nd
0.06
0.14
0.03
1.05
0.50
nd
nd
nd
nd
nd
nd
nd
0.02
0.01
0.04
nd
RECALCULATED
FeO
30.60
36.20
29.89
30.70
43.21
43.28
33.85
43.51
41.91
37.75
38.98
37.46
38.34
36.21
36.44
37.93
37.06
37.12
31.20
31.10
31.07
30.69
30.76
32.14
31.71
30.63
31.34
29.49
30.29
32.65
31.34
31.13
32.02
31.44
32.20
32.65
32.39
32.13
32.56
31.95
Fe203
68.00
53.10
64.59
68.40
36.45
36.81
42.21
36.65
39.71
46.52
46.35
46.58
45.24
49.61
50.88
48.17
49.81
49.61
65.07
65.24
64.51
65.14
64.84
63.91
62.35
64.85
65.60
66.74
66.59
62.66
64.83
64.88
64.01
63.63
63.90
62.66
62.90
63.99
62.56
62.97
349

APPENDIX C.2
MAGNETITE COMPOSITIONS FROM SOURCE ROCKS
Reference/Sample
Rollinson (1980)
SampleUMG1
SampleUMG1
SampleUMG1
SampleUMG1
SampleUMG1
SampleUMG1
SampleUMG1
SampleUMG1
SampleUMG3
SampleUMG3
SampleUMG3
SampleUMG3
SampleUMG3
SampleUMG3
SampleUMG3
SampleUMG3
SampleUMG3
SampleUMG3
SampleUMG3
SampleUMG3
SampleUMG4
SampleUMG4
SampleUMG4
SampleUMG4
SampleUMG4
SampleUMG4
SampleUMG4
SampleUMG4
SampleUMG4
SampleUMG5
SampleUMG5
SampleUMG5
SampleUMG5
SampleUMG5
SampleUMG5
SampleUMG5
Sample MS 17
Sample MS 17
Sample MS 17
Rock Type
metagranite
granitoid
granitoid
granitoid
granitoid
granitoid
granitoid
granitoid
granitoid
granitoid
granitoid
granitoid
granitoid
granitoid
granitoid
granitoid
granitoid
granitoid
granitoid
granitoid
granitoid
granitoid
granitoid
granitoid
granitoid
granitoid
granitoid
granitoid
granitoid
granitoid
granitoid
granitoid
granitoid
granitoid
granitoid
granitoid
granitoid
granitoid-gneiss
granitoid-gneiss
granitoid-gneiss
- = Below detection limit; nd = not reported
Si02 Ti02 A1203 Cr203 MnO MgO
nd 1.35 0.33 0.08 0.04 0.02
0.06
0.11
0.03
0.03
0.04
0.03
0.15
0.04
0.09
0.05
0.04
0.05
0.05
0.05
0.03
0.05
0.22 0.26 0.02
0.04
0.02
0.05
0.17
0.06
0.05
0.09
0.14
0.05
0.45
0.06
0.04
0.08
0.13 ·
0.02
0.09
0.02
0.04
0.40
0.50
1.00
0.08
1.14
0.39
1.33
0.15
1.29
0.20
0.16
0.30
0.14
0.15
0.17
0.21
0.20
0.02
0.04
0.07
0.08
0.07
0.18
0.04
0.24
0.11
0.02
0.10
0.07
0.23
0.19
0.05
0.04
0.33
0.13
0.22
0.11
0.16
0.61
0.35
0.29
0.26
0.32
0.42
0.40
0.43
0.41
0.22
0.09
0.27
0.14
0.16
0.05
0.21
0.10
0.16
0.05
0.11
0.04
0.05
0.04
0.04
0.04
0.04
0.04
0.04
0.52
0.08
0.10
0.10
0.11
0.14
0.13
0.16
0.04
0.25
0.25
0.26
0.33
0.27
0.26
0.24
0.23
0.08
0.09
0.07
0.06
0.14
0.06
0.02
0.01
0.03
0.03
0.03
0.11
0.08
0.11
0.15
0.12
0.21
0.19
0.13
0.12
0.22
0.15
0.19
0.14
0.13
0.13
0.03
0.03
0.02
0.02
0.04
0.03
0.02
0.09
0.04
0.02
0.03
0.03
0.03
0.03
0.03
RECALCULATED
FeO
31.61
31.34
30.60
30.93
30.89
31.20
31.12
30.98
30.89
30.91
30.77
31.22
30.78
31.10
30.76
30.96
30.63
31.02
31.04
30.87
31.38
30.06
30.97
30.59
31.54
30.84
31.89
30.55
32.03
31.10
30.67
30.94
31.08
30.68
30.94
30.89
30.85
29.74
30.43
30.97
Fe203
64.43
68.29
67.83
68.69
68.32
68.61
68.56
68.65
68.38
68.00
68.19
67.54
67.91
68.93
68.09
67.83
67.86
68.23
68.75
68.21
66.70
63.95
64.14
67.23
65.00
66.07
64.94
66.10
65.47
67.54
67.52
67.16
68.08
67.18
68.09
67.53
67.69
65.92
67.56
68.60
350

APPENDIX C.2
MAGNETITE COMPOSITIONS FROM SOURCE ROCKS
Reference/Sample
Sample MS 17
Sample MS 17
Sample MS 17
Sample MS 17
Sample MS 17
Sample MS 17
Sample MS 17
Sample NDF 10
Sample NDF 10
Sample NDF 10
Sample NDF 10
Sample NDF 10
Sample NDF 10
Sample NDF 10
Sample NDF 10
Sample NDF 10
Sample NDF 10
Nowicki (1986)
Nowicki (1986)
Nowicki (1986)
Nowicki (1986)
Grutter (1986)
Grutter (1986)
Grutter (1986)
Russ Nabelek (1989)
Russ Nabelek (1989)
Russ Nabelek (1989)
Oliver (1978)
Oliver (1978)
Oliver (1978)
Oliver (1978)
Oliver (1978)
Oliver (1978)
Oliver (1978)
Oliver (1978)
Oliver (1978)
Oliver (1978)
Oliver (1978)
Oliver (1978)
Oliver (1978)
Rock Type
granitoid-gneiss
granitoid-gneiss
granitoid-gneiss
granitoid·gneiss
granitoid-gneiss
granitoid-gneiss
granitoid-gneiss
gneiss
gneiss
gneiss
gneiss
gneiss
gneiss
gneiss
gneiss
gneiss
gneiss
metapelitic gneiss
metapelitic gneiss
metapelitic gneiss
metapelitic gneiss
cord-qtz-gneiss
bio-opx·gneiss
bio-opx-gneiss
mafic schist
mafic schist
mafic schist
hbl-gt-gneiss
feld-hbl-gneiss
homblendite
anorthosite
hbl-eclogite
hbl-eciogite
feld-hbl-gneiss
gt-hyp·gneiss
gt-hyp-gneiss
hbl·harzburgite
hbl-harzburgite
peridotite
peridotite
- = Below detection limit; nd = not reported
Si02 Ti02 A1203 Cr203 MnO MgO
0.03
0.09
0.03
0.03
0.04
0.05
0.04
0.03
0.03
0.05
0.04
0.07
0.05
0.04
nd
nd
0.05
0.04
0.38
0.01
0.03
0.06
0.03
0.01
0.04
0.04
0.02
0.00
0.03
0.00
0.00
0.00
0.Q1
0.00
0.00
0.46 1.33
nd 0.00
nd nd
nd 0.05
nd nd
0.48 16.10
0.48 2.90
0.96 24.70
0.05 18.16
0.00 17.46
0.00 15.75
0.03 14.87
0.11 12.70
0.06 11.62
0.05 0.09
0.07 0.29
0.05 0.13
0.03 0.46
0.04 0.25
0.16 0.59
0.11 0.12 .
0.15
0.03
0.37
0.02
0.06
0.14
0.13
0.12
0.10
0.13
0.12
0.08
0.06
0.25
0.18
0.07
0.09
0.40
0.12
1.26
0.04
0.12
nd
nd
1.99
1.53
1.12
0.09
0.20
0.19
0.22
0.05
0.06
0.03
0.40
0.41
0.43
1.05
0.00
0.02
0.09
0.23
0.11
0.08
0.15
0.11
0.10
0.11
0.11
0.08
0.07
0.12
0.05
0.14
0.18
0.17
0.12
0.37
0.34
0.27
0.25
0.06
nd
nd
nd
nd
nd
nd
nd
nd
nd
nd
nd
nd
nd
nd
1.24
2.62
2.67
1.10
0.09
0.10
0.15
0.16
0.06
0.09
0.11
0.07
0.09
0.07
0.07
0.12
0.08
0.09
0.08
0.10
0.08
0.15
0.00
nd
nd
nd
0.44
0.17
0.45
0.03
0.03
0.29
0.02
Dd
nd
nd
nd
Dd
0.02
0.04
0.20
0.07
0.03
0.02
0.02
0.38
0.00
nd
Dd
nd
0.03
Dd
0.11
0.07
0.15
0.26
0.20
0.23
0.03
0.13
0.08
0.06
0.28
0.51
0.14
0.10
RECALCULATED
FeO
30.86
30.82
30.93
30.57
30.66
30.52
30.81
30.70
30.81
31.21
30.80
30.82
30.89
30.82
30.90
31.04
30.77
31.07
30.89
32.17
31.22
31.25
31.98
31.98
45.34
34.04
53.87
47.27
46.71
44.07
43.74
41.59
40.40
30.90
31.40
31.21
30.26
30.19
33.49
31.50
Fe203
68.35
68.11
66.41
68.02
67.84
67.47
68.27
67.85
68.01
68.90
68.12
68.39
68.37
67.97
68.09
68.67
68.05
67.89
68.03
63.33
68.31
68.92
68.11
68.01
31.85
59.51
15.59
32.43
34.71
36.84
38.16
42.70
43.33
68.10
68.31
38.56
64.50
61.73
61.72
68.32
351

APPENDIX C.2
MAGNETITE COMPOSITIONS FROM SOURCE ROCKS
Reference/Sample
Bohlen (1980)
Bohlen (1980)
Bohlen (1980)
Bohlen (1980)
Bohlen (1980)
Bohlen (1980)
Bohlen (1980)
Bohlen (1980)
Bohlen (1980)
Bohlen (1980)
Bohlen & Essene (1977)
Bohlen & Essene (1977)
Bohlen & Essene (1977)
Desmarais (1981)
Laird (1980)
Laird (1980)
Braun & Raith (1985)
Braun & Raith (1985)
Braun & Raith (1985)
Braun & Raith (1985)
Braun & Raith (1985)
Braun & Raith (1985)
Braun & Raith (1985)
Braun & Raith (1985)
Braun & Raith (1985)
Braun & Raith (1985)
Braun & Raith (1985)
Braun & Raith (1985)
Braun & Raith (1985)
Braun & Raith (1985)
Braun & Raith (1985)
Braun & Raith (1985)
Braun & Raith (1985)
Braun & Raith (1985)
Braun & Raith (1985)
Braun & Raith (1985)
Braun & Raith (1985)
Rock Type
ortho + paragneiss
ortho + paragneiss
ortho + paragneiss
ortho + paragneiss
ortho + paragneiss
ortho + paragneiss
ortho + paragneiss
ortho + paragneiss
ortho + para gneiss
ortho + para gneiss
ortho + para gneiss
ortho + paragneiss
ortho + paragneiss
meta ultramafic
mafic schist
mafic schist
metabasite
metabasite
metabasite
metabasite
metabasite
metabasite
metabasite
metabasite
metabasite
metabasite
metabasite
metabasite
metabasite
metabasite
metabasite
metabasite
metabasite
metabasite
metabasite
metabasite
metabasite
- = Below detection limit; nd = not reported
Si02 Ti02 A1203
0.10 0.09 0.44
0.09 60.50 0.04
0.20 0.37 0.61
0.16 12.96 · 0.55
0.13 1.25 1.04
0.12 7.94 0.92
0.07 0.23 0.47
0.06 12.39 0.39
0.13 0.53 0.62
0.10 15.72 0.44
nd 10.70 1.04
nd 0.83 0.42
nd 5.60 0.43
nd nd nd
0.25 0.01 nd
0.03 0.04 nd
nd 0.03 0.18
nd 0.01 0.02
nd 0.03 0.27
nd 0.02 0.07
nd 0.03 0.24
nd 0.02 0.10
nd 0.06 0.07
nd 0.06 . 0.08
nd 0.12 0.24
nd 0.16 0.23
nd 0.06 0.41
nd 0.18 0.32
nd 0.55 0.51
nd 0.07 0.09
nd 0.03 0.09
nd 0.04 0.39
nd 0.03 0.11
nd 0.02 0.15
nd 0.04 0.18
nd 0.03 0.09
nd 0.07 0.33
Cr203 MnO MgO
nd nd 0.07
nd 0.78 0.08
nd 0.01 0.02
nd 0.92 0.03
nd 0.09 0.11
nd 0.37 0.11
nd 0.10 0.08
nd 0.90 0.07
nd 0.12 0.04
nd 0.35 0.06
nd 0.03 nd
nd 0.00 0.03
nd 0.14 0.03
nd 0.18 0.52
nd 0.01 0.01
nd 0.01 nd
0.05 0.03 0.16
0.02 0.04 0.23
0.06 0.04 0.15
0.01 0.06 0.02
0.06 0.06 nd
0.01 0.06 nd
0.00 0.01 0.40
0.08 0.02 0.01
0.03 0.05 0.14
0.01 0.01 0.16
0.02 0.05 0.15
0.01 0.04 0.09
0.02 0.06 0.11
0.03 0.03 0.06
0.08 0.06 0.36
0.03 0.02 0.26
0.03 0.00 0.41
0.06 0.01 0.07
0.01 0.03 0.11
0.04 0.04 0.17
0.05 0.07 0.25
RECALCULAJED
FeO
30.89
35.51
31.23
41.62
31.45
37.23
30.88
41.08
31.44
45.14
41.27
31.13
35.96
30.24
30.26
31.32
30.39
30.56
30.55
29.85
30.35
30.61
30.67
30.98
31.03
30.74
31.28
31.31
31.64
30.56
29.97
30.42
30.07
30.47
30.46
30.62
30.69
Fe203
67.31
55.63
65.95
41.11
63.16
50.15
67.07
43.09
66.50
36.39
46.26
67.59
57.49
69.89
67.19
69.39
67.80
68.84
67.98
66.35
67.04
67.92
69.41
68,50
68.74
67.97
69.32
68.80
67.88
67.77
67.83
67.89
68.12
67.65
67.75
68.52
68.50
352

353
APPENDIX D
Modal proportions of heavy minerals in beaches and dunes
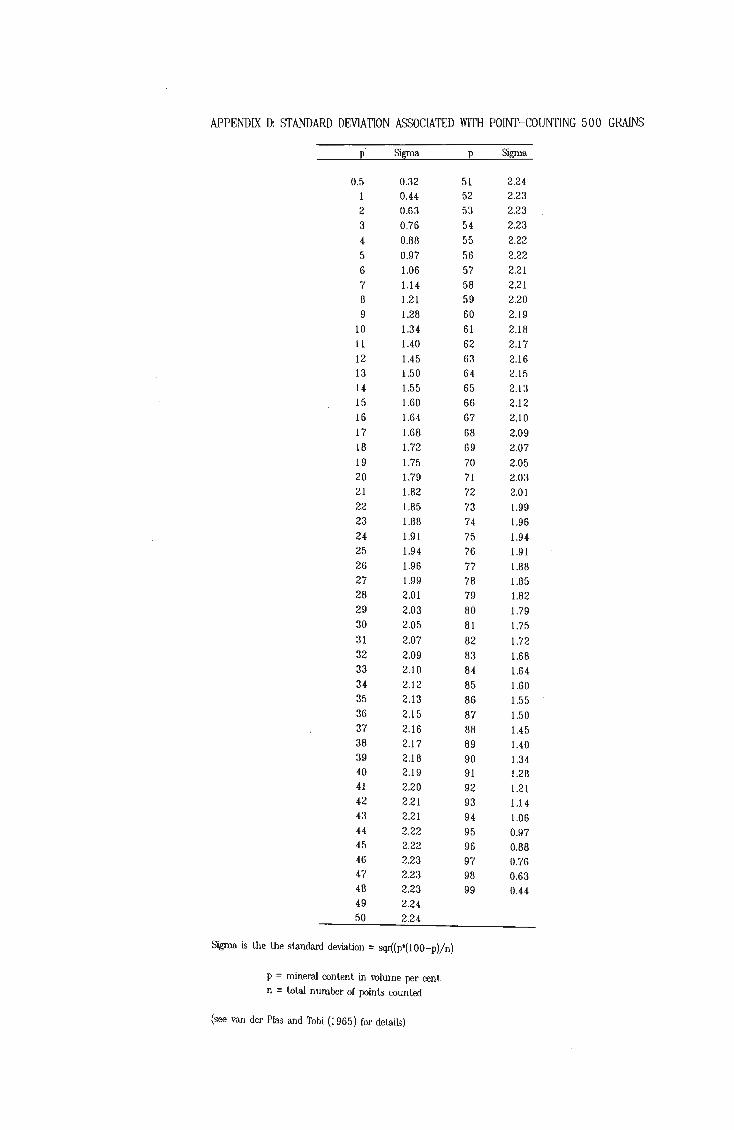
APPENDIX D: STANDARD DEVIATION ASSOCIATED WITH POINT-COUNTING 500 GRAINS
p Sigma p Sigma
0.5 0.32 51 2.2 4-
1 0.4.4- 52 2.23
2 0.63 53 2.23
3 0.76 54- 2.23
4 0.88 55 2.22
5 0.97 56 2.22
6 1.06 57 2.21
7 1.14- 58 2.21
8 1.21 59 2.20
9 1.28 60 2.19 10 1.34- 61 2.18
11 1.4.0 62 2.17
12 1.4-5 63 2.16 13 1.50 64- 2.15 14. 1.55 65 2.13 15 1.60 66 2.12 16 1.64- 67 2.10
17 1.68 68 2.09 18 1.72 69 2.07
19 1.75 70 2.05 20 1.79 71 2.03 21 1.82 72 2.01 22 1.85 73 1.99 23 1.88 74 1.96 24- 1.91 75 1.94-25 1.94- 76 1.91 26 1.96 77 1.88 27 1.99 78 1.85 28 2.01 79 1.82 29 2.03 80 1.79 30 2.05 81 1.75 31 2.07 82 1.72 32 2.09 83 1.68 33 2.10 84- 1.64 34- 2.12 85 1.60 35 2.13 86 1.55 36 2.15 87 1.50 37 2.16 88 1.45 38 2.17 89 1.4.0 39 2.18 90 1.34-4-0 2.19 91 1.28 41 2.20 92 1.21 42 2.21 93 1.14 4-3 2.21 94- 1.06 4.4 2.22 95 0.97 4-5 2.22 96 0.88 4-6 2.23 97 0.76 47 2.23 98 0.63 48 2.23 99 0.44 49 2.24-50 2.24-
Sigma is lhe the standard deviation = sqt{(p'(lOO-p)/ n)
p = mineral contenl in volume per cent
n = total number of points counted
(see van der Plas and Tobi (1965) for details)
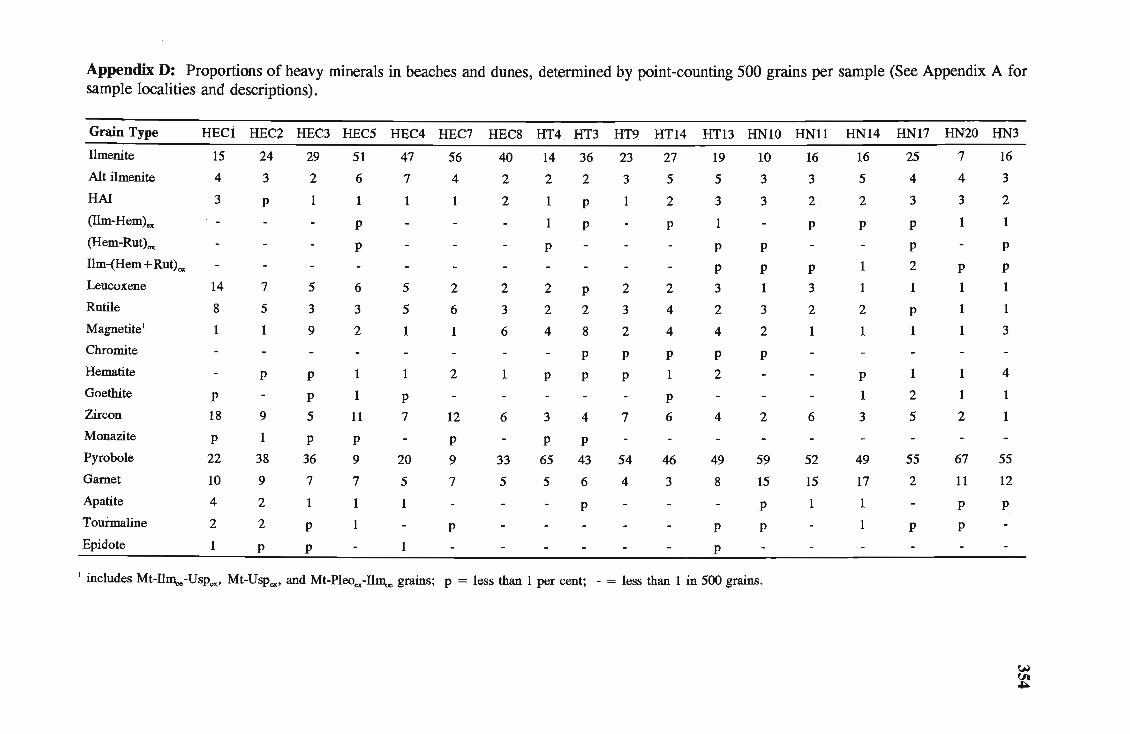
Appendix D: Proportions of heavy minerals in beaches and dunes, determined by point-counting 500 grains per sample (See Appendix A for sample localities and descriptions) .
Grain Type HEC1 HEC2, HEC3 HEC5 HEC4 HEC7 HEC8 HT4 HT3 HT9 HT14 HT13 HNIO RNll HN14 RN17 HN20 HN3
Ilmenite
Alt ilmenite
HA!
(Ilm-Hem)ex
(Hem-Rut)ox
Ilm-(Hem + Rut)ox
Leucoxene
Rutile
Magnetite!
Chromite
Hematite
Goethite
Zircon
Monazite
Pyrobole
Garnet
Apatite
Tourmaline
Epidote
15
4
3
14
8
1
P
18
P
22
10
4
2
1
24
3
P
7
5
1
p
9
1
38
9
2
2
P
29
2
5
3
9
p
P
5
P
36
7
1
P
P
51
6
1
P
P
6
3
2
1
1
11
P 9
7
47
7
1
5
5
1
1
P
7
20
5
1
1
56
4
1
2
6
1
2
12
P
9
7
p
40
2
2
2
3
6
1
6
33
5
14 36
2 2
1 P
1
P
p
2 P
2 2
4 8
P
P P
3 4
P P 65 43
5 6
P
23
3
1
2
3
2
P
P
7
54
4
27
5
2
P
2
4
4
P
1
P
6
46
3
19
5
3
1
P
P 3
2
4
P
2
4
49
8
p
p
10
3
3
p
P
1
3
2
P
2
59
15
P
P
! includes Mt-IllD"e-Uspcx' Mt-Uspcx, and Mt-Pleoe.-IllD"e grains; p = less than 1 per cent; - = less than 1 in 500 grains.
16
3
2
P
P 3
2
1
6
52
15
1
16
5
2
P
1
1
2
1
P
1
3
49
17
1
1
25
4
3
P p
2
1
P
1
1
2
5
55
2
p
7
4
3
1
P
1
1
1
1
1
2
67
11
P
P
16
3
2
1
P
P 1
1
3
4
1
1
55
12
P
~
~

Appendix D (cont.). Proportions of heavy minerals in beaches and dunes, determined by point-counting 500 grains per sample.
Grain Type HN4 HN6 HN8 HN9 HN26 HN29 HN33 HZl HZ3 HZ25 HZ6 HZ8 HZIO HZ32 HZ12
Ilmenite . 21 17 35 21 41 24 11 · 14 5 22 13 25 22 7
Alt ilmenite 8 5 6 5 6 2 2 7 P 5 4 3 4 3
HA! 3 2 1 2 4 3 1 1 P 1 3 1 2 1
(Ilm-Hem)cx 5 1 1 4 3 2 1 1 P 1 P P 1
(Hem-Rut).,. 3 1 1 2 2 3 1 1 P 1 1
Ilm-(Hem + Rut)ox 1 P 1 2 2 1 P P P P P P Leucoxene 1 1 2 3 1 3" 1 2 1 1 3 3 4 4
Rutile 3 1 2 4 3 1 1 2 P 1 2 2 3 P Magnetitel 3 2 2 6 1 8 41 4 5 2 1 2 5 3
Chromite p p p p p p p p p p
Hematite 19 2 4 6 9 5 3 1 1 P 3 P 2 1
Goethite p p p 1 2 1 4 1 P Zircon 5 4 5 7 4 6 3 4 4 6 3 5 8 2
Monazite p p p p P 1 P Pyrobole 21 53 35 32 10 43 28 58 75 56 65 55 44 73
Garnet 8 11 4 6 17 8 5 4 2 4 3 3 4 5
Apatite p p p p p p
Kryptonite
Tourmaline p p p P 2 P P Epidote p p p 2 P P P P
I includes Mt-Ilm.,.-UsPex. Mt-UsPex. and Mt-Pleoex-Ilm.,. grains; p = less than 1 per cent; - = less than 1 in 500 grains.
~ Ut Ut

Appendix D (cont.). Proportions of heavy minerals in beaches and dunes, determined by point-counting 500 grains per sample.
Grain Type HEC12 HECll HEClO HEC6 HEC13 HT2 HT5 HT7 HT8 HTlO HTl5 HTl6 HTl1 HN12 HN15
IImenite 32 33 45 59 38 49 23 65 59 30 35 42 25 21 20
Alt ilmenite 6 4 3 5 2 7 3 10 5 4 4 6 3 21 20
HA! 2 3 3 1 3 P P P 1 2 1 2
(Ilm-Hem)ex p p
(Hem-Rut}ox p p p
IIm-(Hem + Rut)ox p 1
Leucoxene 12 7 6 3 4 2 4 5 3 2 3 2 1 2 1
Rutile 8 4 7 5 3 3 2 4 2 2 3 2 2 1 1
Magnetite1 2 5 4 1 7 7 2 2 4 2 3 5 4 p 2
Chromite p p p
Hematite p p p 1 P 1 1 1 P 1 2 P 1 P Goethite p 9 P p . P 3
Zircon 12 5 7 8 6 lO 8 3 5 5 6 2 5 4 2
Monazite p p p p p
Pyrobole 16 31 22 10 31 15 43 8 19 48 40 35 54 57 51
Garnet 5 8 3 4 6 7 3 2 3 6 3 4 5 8 15
Apatite 2 p P P P
Tourmaline 2 p 1 2 2
Epidote p p p P
1 includes Mt-IlIl\,e-UsPex. Mt-UsPex, and Mt-Pleoex-Illl\,e grains; p = less than 1 per cent; - = less than 1 in 500 grains.
(,H
~

~-
Appendix D (cont.). Proportions of heavy minerals in beaches and dunes, determined by point-counting 500 grains per sample.
Grain Type
Ilmenite
Alt ilmenite
HAJ
(Ilm-Hem)ex
(Hem-Rut)ox
Ilm-(Hem + Rut)ox
Leucoxene
Rutile
Magnetite l
Chromite
Hematite
Goethite
Zircon
Monazite
Pyrobole
Garnet
Apatite
Tourmaline
Epidote
HNI8 HN2I HN! HN2 HN5 HN7 HN27 HN30 HN34 HZ2 HZ26 HZ16 HZ17
30 28 31 40 50 47 52 21 42 35 18 32 28
8 3 5 5 8 12 7 4 4 . 8 4 10 8
2 111141 2 221 1 2
P 111121 2 SlIp 1
p
P 2
2
3
41
7
2
p
p
P 1
1
1
p
P 3
50
6
P
P
p
1
1
2
2
3
P 42
12
P
P p
P
4 2
3
1
P 6
P
29
10
P
1
1
3
1
1
6
P 23
4
p
1 .
1
4
4
4
P
3
8
7
P
2
1
2
3
1
P 8
16
5
P p
2
1
1
2
3
4
1
5
1
49
6
2
2
1
2
6
7
P
3
P
18
6
p
P
1
2
8
P
3
P 7
P
28
4
p
p
p
P
2
2
7
P
2
2
9
P
47
4
p
1
P
4
5
3
P 3
P 8
P
28
2
2
2
5
5
P
2
9
P 33
3
1
1 includes Mt-Ill11oe-USPex> Mt-Uspex, and. Mt-Pleoex-IlIDoe grains; p = less than 1 per cent; - = less than 1 in 500 grains.
HZ35 HZ36 HZ4 HZ7 HZI3
34
5
3
1
1
1
3
3
6
P
4
P 10
P
23
5
P p
1
29 21 28
8 15 11
2 2 5
2 P 1
p
P
4
4
4
P
2
1 3
P
3 6
3 2
2 2
P
1
P 4
1 P 4
12 7 6
3 P 1
27 38 23
4
P
1
3
P
P
1
P
P
P
14
6
1
p
p
4
2
2
P
P p
3
64
4
P
P
w VI ~ .


![FH{[PkP][ÍæÍq;hP;[ki€¦ · Critical illness polyneuropathy Toxins (e.g., alcohol, hea vy metals, ethylene gly col, methanol, or n-hexane) [Hlh]ZliDlY;hÍWl[DkP][Myasthenia gravis](https://img.pdfslide.net/doc/110x75/5f804ad3f015cb0b582cb2c3/fhpkpqhpki-critical-illness-polyneuropathy-toxins-eg-alcohol-hea.jpg)