Embed Size (px)
Citation preview
A STUDY OF WORKFORCE DIVERSITY THAT
AFFECTS EMPLOYEE PERFORMANCE AMONG
THE SECONDARY SCHOOL TEACHERS IN
MALAYSIA
BY
HEW CHIN SAN
KHOR SIAN SHEAN
KING YANN PYNG
LEONG CHAN AI
OOI CHEE SIEN
A research project submitted in partial fulfillment of the
requirement for the degree of
BACHELOR OF BUSINESS ADMINISTRATION
(HONS)
UNIVERSITI TUNKU ABDUL RAHMAN
FACULTY OF BUSINESS AND FINANCE
DEPARTMENT OF BUSINESS
AUGUST 2018
ii
Copyright @ 2018
ALL RIGHTS RESERVED. No parts of this paper may be reproduced, stored in a
retrieval system, or transmitted in any form or by any means, graphic, electronic,
mechanical, photocopying, recording, scanning, or otherwise, without the prior
consent of the authors.
iii
DECLARATION
We hereby declare that:
(1) This undergraduate research project is the end result of our own work
and that due acknowledgement has given in the references to ALL
sources of the information be they printed, electronic, or personal.
(2) No portion of this research project has been submitted in support of any
application for any other degree or qualification of this or any other
university, or other institutes of learning.
(3) Equal contribution has been made by each group member in completing
the research project.
(4) The word count of this research report is 20863 words.
Name of Students: Student ID: Signature:
1. Hew Chin San 15ABB07841
2. Khor Sian Shean 15ABB06932
3. King Yann Pyng 15ABB07766
4. Leong Chan Ai 15ABB07516
5. Ooi Chee Sien 15ABB07805
Date: 17/08/2018
iv
ACKNOWLEDGEMENT
We would like to express our gratitude to everyone who supported us throughout
the progress of this research project. We are grateful and truly appreciate their
kindness in giving us attentive advices, guidance, recommendations and supports
to assist us in completing our research project.
Firstly, our greatest appreciation is to be given to Universiti of Tunku Abdul
Rahman for providing us with the opportunity to learn and conduct our research
project. Through our research, we were able to gain valuable knowledge and
experiences that will be advantageous to our future working life as well as enabling
us to complete our research through interactive teamwork.
Secondly, we would want to give a special warm thanks to our research supervisor,
Mr. Peramjit Singh a/l Balbir Singh for his determined assistance, guidance and
mindful advice throughout the process of completing the research project. We
sincerely appreciate his willingness on sharing his knowledge, truthful suggestions
and views with us in order to guide us throughout completing this research project.
In addition, we would want to externalize our gratitude to all respondents who had
spent their valuable time and efforts in answering and completing our questionnaire.
Their cooperation is important for us in completing our research study successfully.
Lastly, we were grateful to our group members for their effort on kind cooperation,
understanding and tolerance with each other throughout the process of completing
this research projects.
v
DEDICATION
This dissertation is dedicated to:
Our supervisor,
Mr. Peramjit Singh a/l Balbir Singh
For guided us throughout the completion of this research study.
Tertiary educational institution,
Universiti Tunku Abdul Rahman (UTAR)
For given us the chance to conduct this research project.
Families and friends,
For given their motivation and support throughout the completion of this research
project.
vi
TABLE OF CONTENTS
Page
Copyright Page ii
Declaration iii
Acknowledgement iv
Dedication v
Table of Contents vi
List of Tables x
List of Figures xi
List of Appendices xii
List of Abbreviations xiii
Preface xiv
Abstract xv
CHAPTER 1 INTRODUCTION 1
1.0 Introduction 1
1.1 Research Background 1
1.2 Problem Statement 4
1.3 Research Objectives 7
1.4 Research Questions 8
1.5 Hypotheses of the Study 8
1.6 Significance of the Study 9
1.7 Chapter Layout 11
1.8 Conclusion 12
CHAPTER 2 LITERATURE REVIEW 13
2.0 Introduction 13
2.1 Review of the Literature 13
2.1.1 Employee Performance (DV) 13
2.1.2 Gender (IV) 15
2.1.3 Ethnicity 18
vii
2.1.4 Education Level 20
2.1.5 Working Experience 22
2.2 Review of Theoretical Model 24
2.3 Proposed Theoretical or Conceptual Framework 30
2.4 Hypotheses Development 31
2.4.1 The Relationship between Gender and Employee
Performance 31
2.4.2 The Relationship between Ethnicity and Employee
Performance 32
2.4.3 The Relationship between Educational Level and
Employee Performance 34
2.4.4 The Relationship between Working Experience and
Employee Performance 35
2.5 Conclusion 36
CHAPTER 3 RESEARCH METHODOLOGY 37
3.0 Introduction 37
3.1 Research Design 37
3.2 Data Collection Methods 38
3.2.1 Primary Data 38
3.2.2 Secondary Data 39
3.3 Sampling Design 40
3.3.1 Target Population 40
3.3.2 Sampling Frame and Sampling Location 40
3.3.3 Sampling Elements 41
3.3.4 Sampling Technique 42
3.3.5 Sampling Size 43
3.4 Research Instrument 44
3.4.1 Pilot Test 45
3.5 Construct Measurement 46
3.5.1 Scale Definitions 46
3.5.1.1 Nominal Scale 46
viii
3.5.1.2 Ordinal Scale 48
3.5.1.3 Interval Scale 49
3.5.2 Origins of Constructs (Questionnaire) 50
3.6 Data Processing 54
3.6.1 Data checking 54
3.6.2 Data editing 54
3.6.3 Data coding 55
3.6.4 Data Transcribing 56
3.7 Data Analysis 56
3.7.1 Descriptive Analysis 56
3.7.2 Scale Measurement 57
3.7.3 Inferential Analysis 58
3.7.3.1 Outlier Detection 58
3.7.3.2 Normality Analysis 59
3.7.3.3 Multicollinearity Analysis 59
3.7.3.4 Common Method Bias 60
3.8 Conclusion 61
CHAPTER 4 RESEARCH RESULT 62
4.1 Preliminary Analysis 62
4.1.1 Data Processing 62
4.1.2 Outlier Detection 64
4.1.3 Normality Analysis 65
4.1.4 Multicollinearity Analysis 65
4.1.5 Common Method Bias 65
4.1.6 Non Responsive Bias 66
4.1.7 Analysis Demographic Profile Respondents 67
4.1.8 Analysis Descriptive Statistics of Study Variables 69
4.2 Rating Outer Model (Measurement Model) 70
4.3 Measurement Model 72
4.3.1 Testing Outer Model (Measurement Model) 72
4.4 Structural Model 78
ix
4.5 Conclusion 81
CHAPTER 5 DISCUSSION AND CONCLUSION 82
5.0 Introduction 82
5.1 Summary of Statistical Analysis 82
5.1.1 Descriptive Analysis 82
5.1.1.1 Summary of Study Variables 82
5.1.1.2 Summary of Demographic Profiles 83
5.2 Discussion of Major Findings 84
5.2.1 Relationship between good workforce diversity
(Gender) and employee performance 85
5.2.2 Relationship between good workforce diversity
(Ethnicity) and employee performance 86
5.2.3 Relationship between good workforce diversity
(Working Experience) and employee performance 88
5.2.4 Relationship between good workforce diversity
(Educational Level) and employee performance 89
5.3 Implication of the Study 91
5.3.1 Managerial Implications 91
5.4 Limitation of the Study 94
5.4.1 Respondent’s Involvement 94
5.4.2 Time Constraints 94
5.4.3 Cost Constraints 95
5.4.4 Region Constraints 95
5.5 Recommendations for Future Research 96
5.5.1 Multi-Language and simplify questionnaire 96
5.5.2 Coverage in other industries 96
5.5.3 Exploration of different variables 97
5.6 Conclusion 97
References 98
Appendices 112
x
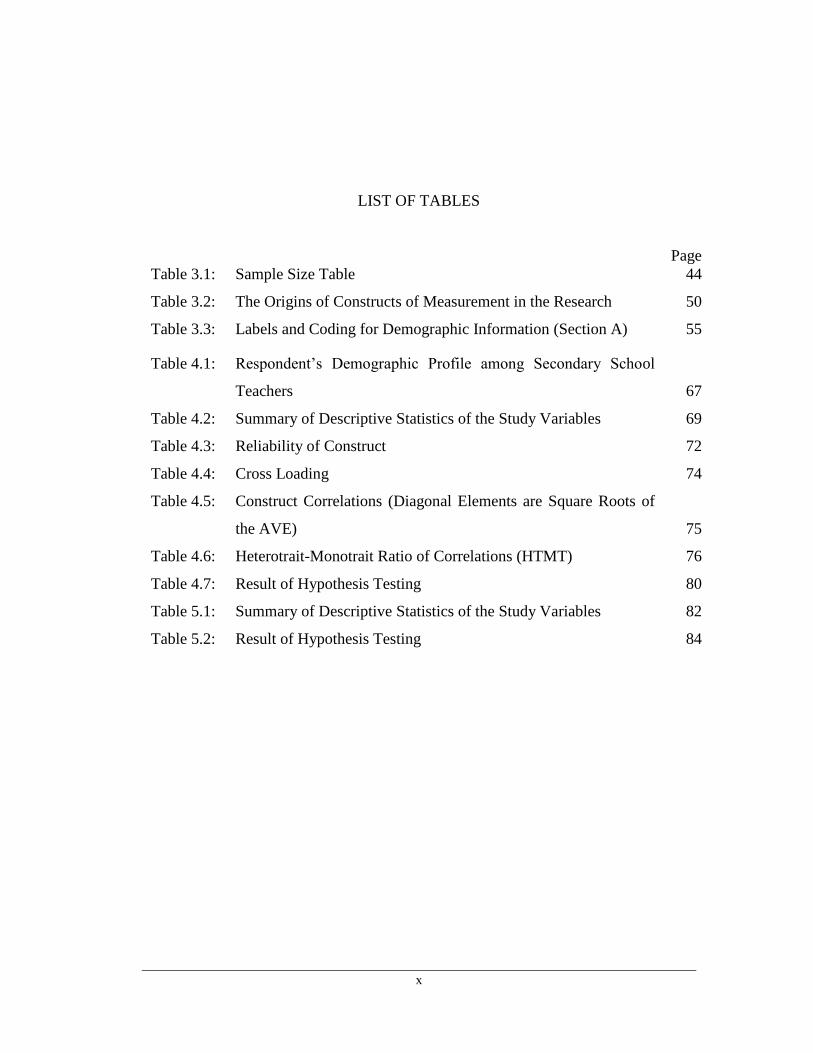
LIST OF TABLES
Page
Table 3.1: Sample Size Table 44
Table 3.2: The Origins of Constructs of Measurement in the Research 50
Table 3.3: Labels and Coding for Demographic Information (Section A) 55
Table 4.1: Respondent’s Demographic Profile among Secondary School
Teachers 67
Table 4.2: Summary of Descriptive Statistics of the Study Variables 69
Table 4.3: Reliability of Construct 72
Table 4.4: Cross Loading 74
Table 4.5: Construct Correlations (Diagonal Elements are Square Roots of
the AVE) 75
Table 4.6: Heterotrait-Monotrait Ratio of Correlations (HTMT) 76
Table 4.7: Result of Hypothesis Testing 80
Table 5.1: Summary of Descriptive Statistics of the Study Variables 82
Table 5.2: Result of Hypothesis Testing 84
xi
LIST OF FIGURES
Page
Figure 2.1: Conceptual Model of Kumudha & Jennet (2018) 24
Figure 2.2: Conceptual Model of Maingi & Maingi (2015) 26
Figure 2.3: Conceptual Model of Munjuri (2012) 27
Figure 2.4: Conceptual Model of Sheth (2017) 28
Figure 2.5: Proposed Theoretical Framework Model 30
Figure 3.1: SPM Result (2014-2016) 39
Figure 3.2: Map of Malaysia 41
Figure 3.3: G Power 46
Figure 4.1: Path Coefficients among the Independent Variables and
Dependent Variable 71
Figure 4.2: T-value among the Dependent Variable and Independent
Variable 78
xii
LIST OF APPENDICES
Page
Appendix A: UTAR Approval Letter (Approval to Conduct Survey) 112
Appendix B: Questionnaire (English Version) 113
Appendix C Questionnaire (Malay Version) 119
Appendix D: Borang DPPDP 2 (A) 125
Appendix E: Ministry of Education Approval Letter 126
Appendix F: Application Letter to Jabatan Pendidikan Perak 127
Appendix G: Application Letter to Jabatan Pendidikan Selangor 129
Appendix H: Approval Letter from Jabatan Pendidikan Perak 131
Appendix I: Approval Letter from Jabatan Pendidikan Selangor 133
Appendix J: Malaysia Educational Statistics 134
Appendix K: Malaysia Map 136
Appendix L: Sample Size Table 137
Appendix M: G Power 138
Appendix N: Scale of Measurement 139
Appendix O: Origins of Constructs (Questionnaire) 140
Appendix P: Labels and Coding for Demographic Information (Section A) 142
Appendix Q: Pilot Study (Reliability Test) 143
Appendix R: Full Study (PLS Result) 149
Appendix 1: Personal Data Protection Statement 165
xiii
LIST OF ABBREVIATIONS
TALIS Teaching and Learning International Survey
NEA National Education Association
IT Informational Technology
MOE Ministry of Education
SPM Sijil Pelajaran Malaysia
VIF Variance Inflation Factor
AVE Average Variance Extracted
HTMT Heterotrait-Monotrait Ratio of Correlations
SRMR Standardized Root Mean Square Residual
LL Lowe Limit
UL Upper Limit
JPN Jabatan Pendidikan Negeri
DV Dependent Variable
IV Independent Variable
SPM Sijil Pelajaran Malaysia
PT3
PMR
Penilaian Tingkatan 3
Penilaian Menengah Rendah
xiv
PREFACE
It is compulsory to carry out a research project in order to accomplish our study which
is Bachelor Degree of Business Administration (Hons). The topic of the research
project is “To examine the relationship between the workforce diversity and employee
performance among the secondary school teachers in Malaysia”. The educational
industry is the important area for the policies development, international cooperation,
and economic run. Teachers play an important role in the educational sector to teach
the students to attain a good result. Because of this, this topic is selected by researchers
as the performance of the teachers will influence the performance of students.
The research project is conducted because of the diverse background of the teachers
will affect their job performance to teach the students. The research project can provide
a guide to the education sector in the secondary school levels to better understand on
the impact of workforce diversity towards the employee performance.
The researchers had concerned about how the elements of the workforce diversity such
as gender, working experience, ethnicity and also educational level will influence the
employee performance among secondary school teachers. This can further provide the
information about the impacts on the employee performance that will incur from the
influences of the workforce diversity.
xv
ABSTRACT
Diversity is now an important factor that brings influences to workforce performance.
Diversity encourages innovation, creativity, problem-solving skills development and
even enhance the strategic planning. This factor has made the diversity always the issue
that every sector concern about including the educational section. Furthermore,
secondary education level or sector plays an important role for country development.
Student performances are highly interrelated with the teacher's performance. Therefore,
it is worth for us to carry out this research in forming hypothesis testing between using
4 separated independent variables which included gender, ethnicity, working
experience and educational level under diversity and the dependent variable which is
employee performance.
The data of this study will be collected from secondary school's teachers in Malaysia.
There is total 384 sets questionnaire are distributed by using convenient sampling
method. The data collected from the respondents are analyzing by using SAS Enterprise
Guide 7.1 in the pilot study and using PLS version 3 in full study. The results will be
demonstrated in tables, charts, and figures.
This study has concluded that there is a significant relationship between gender,
working experience and educational level (IV) to employee performance (DV). Next,
there is no significant relationship between ethnicity (IV) and employee performance
(DV). Moreover, limitation, discussion, and recommendation are discussed at the end
of this research.
A STUDY OF WORKFORCE DIVERSITY THAT AFFECTS EMPLOYEE PERFORMANCE
AMONG THE SECONDARY SCHOOL TEACHERS IN MALAYSIA
Page 1 of 166
CHAPTER 1: INTRODUCTION
1.0 Introduction
According to High Performing Education (2013), there is a majority of teachers
who participate in the TALIS (Teaching & Learning International Survey) study of
secondary schools reported that the school principals evaluated their performance by
every year. It shows the concern about secondary school’s teacher performance in
Malaysia. This study will be identifying the workforce diversity that affects the
employee performance among secondary school’s teacher in Malaysia. Chapter one
consists of research background, problem statement, research objective and research
questions, and the significance and purpose of the study.
1.1 Research Background
The main interest of this research is to examine the factors of workforce diversity
that contribute to employee performance among secondary school teachers in Malaysia.
Besides, this study intended to understand how the diversity of secondary school
teacher will affect their performance. The study also intended to identify the
relationship between employees’ performance with their gender, ethnicity, educational
level, and working experience respectively.
Human resource is an important asset for every organization. Therefore, workforce
diversity is a primary concern for the organization. Employing diversify workforce can
facilitate organization in competing within a global framework as people no longer live
in an insular environment (Saxena, 2014). According to Bedi, Lakra, and Gupta (2014),
any business that tends to succeed has to ensure workforce diversity is conducted in its
day-to-day business since multiple benefits would be enjoyed by the company itself.
A STUDY OF WORKFORCE DIVERSITY THAT AFFECTS EMPLOYEE PERFORMANCE
AMONG THE SECONDARY SCHOOL TEACHERS IN MALAYSIA
Page 2 of 166
Higher productivity will revert as diversity in workplace enables to build a sense of
belongingness to employees towards the organization. This concept is similarly
applicable to the education industry as diversify of teaching workforce able to close the
achievement gap between students (Fallis, 2013).
The employee performance is closely related to organizational performance. The
effective and efficient performance of an employee will positively affect the
organizational performance. The performance is defined as an organizational member
who makes contribution to attaining the goal of organization while the employee
performance refers what an employee is doing or does not doing, it could be output
quantity, output quality, timeliness of output, existence at work and cooperativeness
(Ying, 2012). The teacher performance is the teacher’s impact on the learning of
student which established through achievement test score of students, student surveys
or observed pedagogical practices.
The effective teacher performance is the most critical factor that contributes to
student achievement. They have a strong cumulative effect on the student achievement
and the quality of teacher has a lasting effect on the student learning. The students who
have a high effective teacher for three consecutive years is outperformed than other
students. If the students placed with an ineffective teacher, the negative effect on their
achievement will not be fully remediated in the time up to three years (Storage &
Hindman, 2003).
Many researches showed that better teachers mean better results. Teacher
performance and teaching quality have a strong influence on students schooling
experiences like behaviour, attitudes and achievement outcomes. The teachers with
poor teaching technique may cause the students to have a poor foundation in the
technical subject like mathematics (Ukessays, 2015).
A STUDY OF WORKFORCE DIVERSITY THAT AFFECTS EMPLOYEE PERFORMANCE
AMONG THE SECONDARY SCHOOL TEACHERS IN MALAYSIA
Page 3 of 166
The academic performance of students plays a key role in determining the
performance of the teacher. The study found that the achievement of students
significantly and substantively affects teacher performance in observation-based
measures. The teachers working with students who have higher achievement more
likely to get higher performance ratings (Steinberg & Garrett, 2016). Besides, the
teachers with good performance can help students gain the learning of more than a
grade while the students taught by the teachers with lower performance only can
achieve half a year of learning (Sawchuk, 2015).
According to Akiri and Ugborugbo (2008), the gender has an influence on the
productivity and performance of secondary school teachers. The study showed that
male teachers have the most effective in the first five years while female teachers have
the most effective from six to fifteen years after gain some job experience. Then, male
teachers are significantly more productive than female teachers in rural locations. In
addition, the minority students tend to achieve a better academic performance when
they are placed with own race teachers. The teachers have a better understanding
towards those minority students and thus enhance their performance (Howard, 2010).
Moreover, the teachers with higher degree can perform better to increase the
percentage of students who get higher mark in the subject of communication arts and
mathematics. The degree level of the teacher has an effect on their performance and
student academic performance (Dial, 2008). Then, the teacher experience is correlated
with student academic achievement and an improved in teacher performance associated
with teacher experience. The experienced teachers provide greater learning for their
students (Kini & Podolsky, 2016).
A STUDY OF WORKFORCE DIVERSITY THAT AFFECTS EMPLOYEE PERFORMANCE
AMONG THE SECONDARY SCHOOL TEACHERS IN MALAYSIA
Page 4 of 166
1.2 Problem Statement
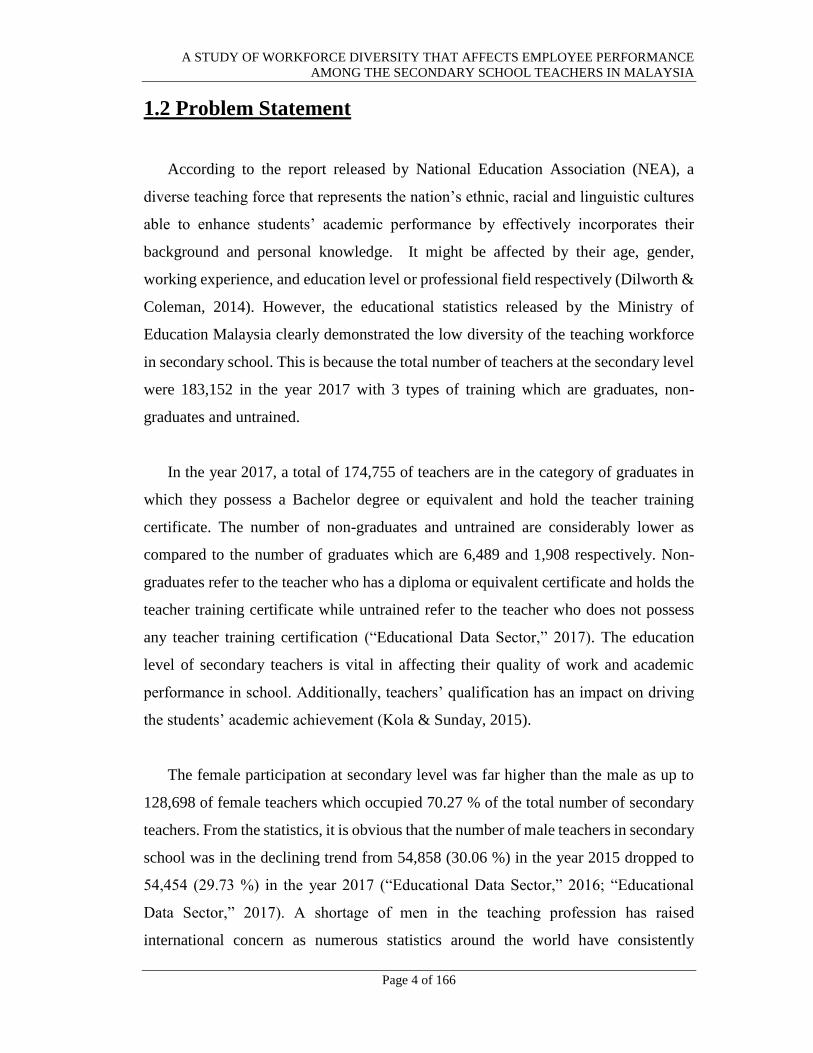
According to the report released by National Education Association (NEA), a
diverse teaching force that represents the nation’s ethnic, racial and linguistic cultures
able to enhance students’ academic performance by effectively incorporates their
background and personal knowledge. It might be affected by their age, gender,
working experience, and education level or professional field respectively (Dilworth &
Coleman, 2014). However, the educational statistics released by the Ministry of
Education Malaysia clearly demonstrated the low diversity of the teaching workforce
in secondary school. This is because the total number of teachers at the secondary level
were 183,152 in the year 2017 with 3 types of training which are graduates, non-
graduates and untrained.
In the year 2017, a total of 174,755 of teachers are in the category of graduates in
which they possess a Bachelor degree or equivalent and hold the teacher training
certificate. The number of non-graduates and untrained are considerably lower as
compared to the number of graduates which are 6,489 and 1,908 respectively. Non-
graduates refer to the teacher who has a diploma or equivalent certificate and holds the
teacher training certificate while untrained refer to the teacher who does not possess
any teacher training certification (“Educational Data Sector,” 2017). The education
level of secondary teachers is vital in affecting their quality of work and academic
performance in school. Additionally, teachers’ qualification has an impact on driving
the students’ academic achievement (Kola & Sunday, 2015).
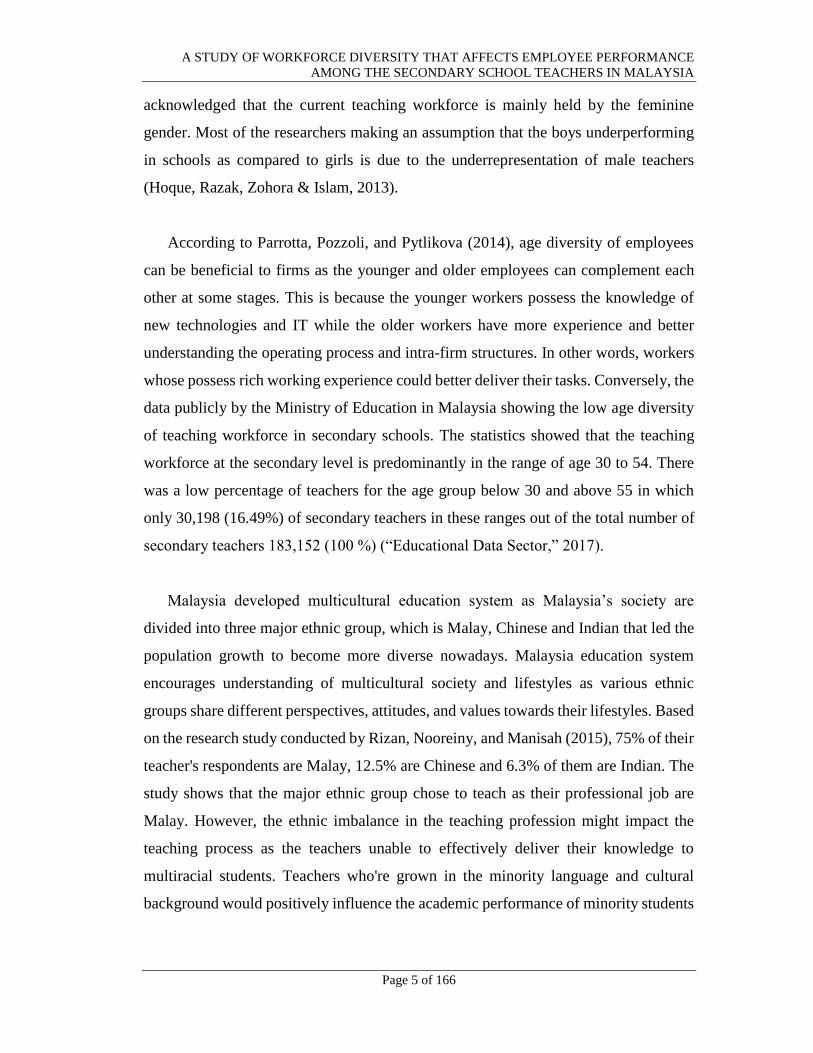
The female participation at secondary level was far higher than the male as up to
128,698 of female teachers which occupied 70.27 % of the total number of secondary
teachers. From the statistics, it is obvious that the number of male teachers in secondary
school was in the declining trend from 54,858 (30.06 %) in the year 2015 dropped to
54,454 (29.73 %) in the year 2017 (“Educational Data Sector,” 2016; “Educational
Data Sector,” 2017). A shortage of men in the teaching profession has raised
international concern as numerous statistics around the world have consistently
A STUDY OF WORKFORCE DIVERSITY THAT AFFECTS EMPLOYEE PERFORMANCE
AMONG THE SECONDARY SCHOOL TEACHERS IN MALAYSIA
Page 5 of 166
acknowledged that the current teaching workforce is mainly held by the feminine
gender. Most of the researchers making an assumption that the boys underperforming
in schools as compared to girls is due to the underrepresentation of male teachers
(Hoque, Razak, Zohora & Islam, 2013).
According to Parrotta, Pozzoli, and Pytlikova (2014), age diversity of employees
can be beneficial to firms as the younger and older employees can complement each
other at some stages. This is because the younger workers possess the knowledge of
new technologies and IT while the older workers have more experience and better
understanding the operating process and intra-firm structures. In other words, workers
whose possess rich working experience could better deliver their tasks. Conversely, the
data publicly by the Ministry of Education in Malaysia showing the low age diversity
of teaching workforce in secondary schools. The statistics showed that the teaching
workforce at the secondary level is predominantly in the range of age 30 to 54. There
was a low percentage of teachers for the age group below 30 and above 55 in which
only 30,198 (16.49%) of secondary teachers in these ranges out of the total number of
secondary teachers 183,152 (100 %) (“Educational Data Sector,” 2017).
Malaysia developed multicultural education system as Malaysia’s society are
divided into three major ethnic group, which is Malay, Chinese and Indian that led the
population growth to become more diverse nowadays. Malaysia education system
encourages understanding of multicultural society and lifestyles as various ethnic
groups share different perspectives, attitudes, and values towards their lifestyles. Based
on the research study conducted by Rizan, Nooreiny, and Manisah (2015), 75% of their
teacher's respondents are Malay, 12.5% are Chinese and 6.3% of them are Indian. The
study shows that the major ethnic group chose to teach as their professional job are
Malay. However, the ethnic imbalance in the teaching profession might impact the
teaching process as the teachers unable to effectively deliver their knowledge to
multiracial students. Teachers who're grown in the minority language and cultural
background would positively influence the academic performance of minority students
A STUDY OF WORKFORCE DIVERSITY THAT AFFECTS EMPLOYEE PERFORMANCE
AMONG THE SECONDARY SCHOOL TEACHERS IN MALAYSIA
Page 6 of 166
and improve their self-esteem as well. A diverse student population has been perceived,
yet the teaching workforce showed a great differs in ethnicity (Howard, 2010).
Basically, Malaysia’s secondary schools are in low teachers diversity that exposed
by the statistics of MOE. The NEA Report reveals that the lacking of teacher diversity
will jeopardize student achievement. In fact, the achievement of Sijil Pelajaran
Malaysia (SPM) or known as Malaysian Certificate of Education that taken by fifth-
year secondary school students is not satisfactory. This is because the passing rate of
SPM was dropped from 85.33 % in the year 2013 to 84.79 % in the year 2016. The
percentage of the candidate will all ‘A’s result a continuously declined from 2.39 % (in
the year 2014) to 2.17 % (in the year 2015) and further dropped to 1.94 % in the year
2016 (“Educational Data Sector,” 2017). Thus, the teachers’ performance and students’
academic achievement will be an amazing area to research the workforce diversity in
the secondary school.
Therefore, in this study, researchers want to examine the workforce diversity that
affects employee performance of secondary school’s teachers in Malaysia.
A STUDY OF WORKFORCE DIVERSITY THAT AFFECTS EMPLOYEE PERFORMANCE
AMONG THE SECONDARY SCHOOL TEACHERS IN MALAYSIA
Page 7 of 166
1.3 Research Objective
The general objective is to identify the relationship of workforce diversity and
employee performance of secondary school’s teachers in Malaysia.
1.3.1 Specific Objective
The specific objectives are as follow:
i. To determine whether there is a significant positive relationship
between good workforce diversity (gender) and employee performance
of secondary school’s teachers in Malaysia.
ii. To determine whether there is a significant positive relationship
between good workforce diversity (ethnicity) and employee
performance of secondary school’s teachers in Malaysia.
iii. To determine whether there is a significant positive relationship
between good workforce diversity (education level) and employee
performance of secondary school’s teachers in Malaysia.
iv. To determine whether there is a significant positive relationship
between good workforce diversity (working experience) and employee
performance of secondary school’s teachers in Malaysia.
A STUDY OF WORKFORCE DIVERSITY THAT AFFECTS EMPLOYEE PERFORMANCE
AMONG THE SECONDARY SCHOOL TEACHERS IN MALAYSIA
Page 8 of 166
1.4 Research Questions
i. Is there a significant positive relationship between good workforce
diversity (gender) and employee performance?
ii. Is there a significant positive relationship between good workforce
diversity (ethnicity) and employee performance?
iii. Is there a significant positive relationship between good workforce
diversity (education level) and employee performance?
iv. Is there a significant positive relationship between good workforce
diversity (working experience) and employee performance?
v. Is there a significant positive relationship between all variables and
employee performance?
1.5 Hypotheses of the Study
Hypothesis 1
H0: There is no significant positive relationship between good workforce
diversity (gender) and employee performance.
H1: There is significant positive relationship between good workforce diversity
(gender) and employee performance.
Hypothesis 2
H0: There is no significant positive relationship between good workforce
diversity (ethnicity) and employee performance.
H1: There is significant positive relationship between good workforce diversity
(ethnicity) and employee performance.
A STUDY OF WORKFORCE DIVERSITY THAT AFFECTS EMPLOYEE PERFORMANCE
AMONG THE SECONDARY SCHOOL TEACHERS IN MALAYSIA
Page 9 of 166
Hypothesis 3
H0: There is no significant positive relationship between good workforce
diversity (education level) and employee performance.
H1: There is significant positive relationship between good workforce diversity
(education level) and employee performance.
Hypothesis 4
H0: There is no significant positive relationship between good workforce
diversity (working experience) and employee performance.
H1: There is significant positive relationship between good workforce diversity
(working experience) and employee performance.
Hypothesis 5
H0: There is no significant positive relationship between four independent
variables and employee performance.
H1: There is significant positive relationship between four independent variables
and employee performance.
1.6 Significance of the Study
Workforce plays an important role in all aspect no matter in business or education.
Teacher as a middleman between knowledge and students, who unreservedly passed
on all the knowledge through lessons and classes to the students. It has significantly
affected the learning outcome of students by a teacher’s job performance. In the nature
of teaching, it is full of challenges which come from the diversity of student’s
background, ethics, gender, attitude and behavior especially in Malaysia. To increase
job performance by overcoming all the challenges, diversity itself is the key to solve
all the obstacles. Therefore, diversity is important to the first-line workforce like
teachers as a key to improve job performance.
A STUDY OF WORKFORCE DIVERSITY THAT AFFECTS EMPLOYEE PERFORMANCE
AMONG THE SECONDARY SCHOOL TEACHERS IN MALAYSIA
Page 10 of 166
This study is significant because it can provide information and data to the Ministry
of Education (MOE) in the aspect of human resource management. During the
recruitment process, MOE can take into consideration of the diversity of workforce
without any gender, ethnicity, working experience and educational level bias. Without
any bias, workforce diversity among teachers can be increased. Thus, performance of
teachers can be improved too.
Next, this research able to increase the awareness of secondary school about the
importance in workforce diversity since they are the one who needed to work in the
diversity environment which consists in variety of cultures, ethnics, thoughts and
learning style. To deal with this heavy diversity workload in daily, the data provided in
this study can help to reduce the burden of secondary schools’ management and it may
adopt as a reference in teaching strategy development. Performance of teachers is able
to increase if the secondary schools handle workforce diversity well.
Furthermore, this research able to help future researchers in the further study on the
workforce diversity in the education industry in Malaysia. This is because there is a
lack of research information based on workforce diversity within education industry in
Malaysia. Researchers believed that this study able to provide inspiration and
motivation to future researchers in doing this topic in Malaysia context. Researchers
also believed that base on this conceptual model, the information provided can be used
as a guide for future researchers in further exploration.
A STUDY OF WORKFORCE DIVERSITY THAT AFFECTS EMPLOYEE PERFORMANCE
AMONG THE SECONDARY SCHOOL TEACHERS IN MALAYSIA
Page 11 of 166
1.7 Chapter Layout
This research project consists of 5 chapters in conducting the studies in the
relationship of workforce diversity in secondary school teachers, as follow:
Chapter 1- Introduction
This chapter contains the introduction of research background and problem
statement. Other than that, it also contains research objectives, research questions, and
the hypothesis of the study. The hypothesis is for quantitative research which will be
carried on in chapter 3 that will be tested for the impact of gender, ethnicity, education
level and working experience toward the workforce diversity.
Chapter 2- Literature Review
Literature review is the information in kind of documentation of a comprehensive
review of the secondary data either in published or unpublished journals of other
researchers. Next, by searching and doing references from other journals articles,
review of relevant theoretical models and proposed conceptual framework will be done.
Then, by supporting from other references, hypotheses will be developed based on both
dependent and independent variables.
Chapter 3- Research Methodology
In this chapter, it consists of several parts which are research design, data collection
methods either in primary or secondary methods, sampling design including target
population, sampling frame and sampling location, sampling elements, sampling
technique and sampling size. Next, it will continue with the research instrument,
construct measurement, data processing by using software and finally data analysis.
A STUDY OF WORKFORCE DIVERSITY THAT AFFECTS EMPLOYEE PERFORMANCE
AMONG THE SECONDARY SCHOOL TEACHERS IN MALAYSIA
Page 12 of 166
Chapter 4- Research Results
This chapter is about the descriptive analysis of the research. It presents the patterns
of the results which answer and explain the research question and hypothesis. Parts
including descriptive analysis which consists of the respondent demographic profile,
scale measurement and inferential analysis which finally provides empirical evidence
for the study.
Chapter 5- Discussion and Conclusion
The summary of the statistical analysis, discussions of major findings and
implications of the study will be stated in this chapter. It will also provide the limitation
and recommendations for future research to lower the error and get improvement in it.
Finally, will be the conclusion of the whole research project.
1.8 Conclusion
In summary, the research background and problem statement are to tell the readers
about the reasons for carrying out this research. This chapter has also provided research
objectives and research questions as the aim to proceed. Then, form the hypothesis of
the study for testing the significance of the relationship among variables. After a basic
understanding of the research purpose, the further process will be the literature review
that provides more information and review that are relevant to this research topic.
A STUDY OF WORKFORCE DIVERSITY THAT AFFECTS EMPLOYEE PERFORMANCE
AMONG THE SECONDARY SCHOOL TEACHERS IN MALAYSIA
Page 13 of 166
CHAPTER 2: LITERATURE REVIEW
2.0 Introduction
This chapter consists of reviews of secondary data that researches have gathered from
books, other journal articles, and primary data. Researches outlined the literature and
relevant theoretical model reviews related to the various variables of workforce
diversity and employee performance within this chapter. The determinant of variables
is compulsory to understand the relationship between independent variables (gender,
ethnicity, education level and working experience) and the dependent variable
(employee performance). The hypothesis will be formulated based on the relationship
between independent variables and dependent variable.
2.1 Review of the Literature
2.1.1 Employee Performance (DV)
Employees are the main component of every organization in any types of
industry. Different employees behave differently based on their perceptions and
mind-set when comes to encountering a different situation (Alghazo & Shaiban,
2016). Employees’ performance can be measured in numerous ways to determine
how well they could complete a given task (Anbazhagan & Kotur, 2014). The
performance of an employee is used to discipline themselves in order to achieve
organizational objectives (Rotundo & Sackett, 2002). Job performance reveals
the productivity and motivation level of employees on the ability of skills and
knowledge being practiced (Anwar, Xiao, Fiaz, Ikram & Younas, 2017). Kayar
and Bulur (2017) alleged that performance is a concept to evaluate the result of
A STUDY OF WORKFORCE DIVERSITY THAT AFFECTS EMPLOYEE PERFORMANCE
AMONG THE SECONDARY SCHOOL TEACHERS IN MALAYSIA
Page 14 of 166
activities done. Elsaid (2012) stated that a few elements that could enhance the
employee performance within the demographic diversity culture of an
organization are team problem-solving skill, innovation, and creativity.
Teachers are employees of an organization which focuses on education. Amin,
Shah, Ayaz, and Atta (2013) mentioned teacher plays an important role in
delivering knowledge and educate learner to become a successful person in the
future. Students’ results are highly related to teacher’s performance in terms of
how well could the teacher perform in leading the educational activities.
Therefore, the teacher’s performance is crucial for a student’s academic
improvement as the performance of teachers affects the education outcome.
Grift, Helms-Lorenz, and Maulana (2014) described the teaching skill of a
teacher is one of the evaluation instrument used to determine teacher’s
performance on their professional development. The creativeness, learning
climate, perspicuity of instruction and strategy of teaching skills practiced by
teachers are affected by their education level, teaching experience, and gender. In
fact, the effort of teacher’s performance could be reflected from student’s
academic achievement results.
A person’s job performance can be improved through self-management skill.
Self-management skill is defined as the ability of a person on handling and
regulating emotions that lead to stress, anger control and determine in solving a
difficult problem. Besides, self-management means ones understand its personal
goals in order to achieve other long-term goals (Palomera, Briones, Gómez-
Linares & Vera, 2017). According to Mohamad and Jais (2015), researchers
conclude that managing emotional intelligence consistently and systematically is
important in order to maintain a person’s good performance.
A STUDY OF WORKFORCE DIVERSITY THAT AFFECTS EMPLOYEE PERFORMANCE
AMONG THE SECONDARY SCHOOL TEACHERS IN MALAYSIA
Page 15 of 166
Teachers need interpersonal skill so as to build a good relationship with
students and the parents. A good relationship between parents and teachers assist
schools to understand the parents’ perceptions towards school’s teaching or
education policies (Opić, 2016). Edger (2012) indicated that communication is
essential when the young teachers (entry-year teacher) face problems on their
teaching method or on the school policy in order to reduce the chances of teachers
resigning from the job. School principal evaluates teachers through their
performance appraisal which assess their motivational, professional and
leadership skills. Interpersonal skill helps communicate concept and idea between
both principle and teachers as to maintain the teacher’s job performance at
principle’s expectation.
2.1.2 Gender (IV)
Kotur and Anbazhagan (2014) asserted that gender is one of the factors that
could affect employee performance due to their physical and psychological
differences. According to Akiri et al. (2008), the gender of teachers considered as
one of the factors that might influence the teachers’ productivity. They further
mentioned that the teachers’ productivity could be measured by teachers’
performance. The assessment of teachers’ performance involves the using of
qualitative tools such as the academic achievement of students. Adebisi, Samuel,
and Oyeniyi (2015) stated that one disturbing phenomenon arose in the school
system is the fact of boys and girls do not exhibit the same level of academic
performance despite the clamour for gender equality treatment. Dee (2006)
mentioned that the differences between the teacher genders might trigger debate
on student performance as female teachers play a significant role in enhancing
female students’ academic performance while boys able to learn more from male
teachers. He further described that having teachers of the opposite gender hurt
students’ academic achievement and the switching up of teachers would narrow
A STUDY OF WORKFORCE DIVERSITY THAT AFFECTS EMPLOYEE PERFORMANCE
AMONG THE SECONDARY SCHOOL TEACHERS IN MALAYSIA
Page 16 of 166
the achievement gaps between boys and girls, yet one gender would gain at the
expense of the other.
Dee (2007) asserted there are two theories which suggested that the students’
performance depended on the gender of teachers. The first theory stated that the
communications between teacher and student were shaped by the teachers’
gender and the second theory is that the teacher acts as a gender-specific role-
model where the students would try to imitate their behavior. Dee further alleged
that the second theory could be explained in such way in which the students were
more engaged, performed better result and behave more appropriately when
taught by a teacher who is having the same-gender with students. However,
Escardíbul and Mora (2013) insisted that the teacher gender is irrelevant to the
students’ results as students taught by a same-gender teacher is not likely to
achieve better results. They agreed on the significant differential of gender
performance in which the female students are more outstanding when the subject
was instructed by female teachers, but they argued that the effect is not causal as
the analysis control for teacher turnover and student mobility is not observed.
In addition, past study such as Andersen (2011) alleged that male teachers
were expected to have lower job satisfaction and self-efficacy as compared to
female teachers. This effect is particularly obvious in school with a high
percentage of women or school with a female principal. Ullah (2016) indicated
that teaching is viewed as a female occupation since the feminization of teaching
has been gradual throughout the years. Therefore, the diminishing presence of
male teachers is one of the global issues that attracting significant social and
political commentary as there is a significantly noticeable difference in the
proportion of males to females within the teaching profession (Christopher,
Anthony & Ekanem, 2012).
A STUDY OF WORKFORCE DIVERSITY THAT AFFECTS EMPLOYEE PERFORMANCE
AMONG THE SECONDARY SCHOOL TEACHERS IN MALAYSIA
Page 17 of 166
Gneezy, Niederle, and Rustichini (2003) claimed that the performance of
male and female might difference because of the discrepancy between their skills,
talent, and beliefs. On the other hand, Green, Jegadeesh, and Tang (2009) argued
that the performance variation between male and female does not exist as they
did not exhibit outstanding performance relative to the opposite gender. In
addition, as advocated by Williams and Bedward (2001), male and female do not
show a different extent of ability in terms of analytical, problem-solving,
motivation, competitive drive, sociability and even the learning ability. Although
they are physical and psychological differences, the gender convergence could
perform better in the tasks.
Mohindra and Azhar (2012) contended that there is a different
communication style between men and women. Men tend to the instrumental
style of communication where the conversation is viewed as to exchange
information. In contrast, women will take the approach of expressive
communication style and avoid using the aggressive and threatening style to
communicate. The collaboration in a gender diverse team can disallow conflicts
to rise and strengthen the working relationship. They further mentioned that the
gender convergence could get jobs done faster and build a hassle-free working
environment.
For this reason, according to Grissom, Kern, and Rodriguez (2015), diverse
teaching force is encouraged in order to meet the needs of the diverse student
population. It does facilitate multiple perspectives and build an inclusive
workplace by having a gender diverse in the teaching profession.
A STUDY OF WORKFORCE DIVERSITY THAT AFFECTS EMPLOYEE PERFORMANCE
AMONG THE SECONDARY SCHOOL TEACHERS IN MALAYSIA
Page 18 of 166
2.1.3 Ethnicity
According to Asif, Fakhra, Tahir, and Shabbir (2016), the teacher
performance is interlinked with the student academic performance. The teacher
quality performance is reflected in the form of a student's achievement score,
from here, it shows that academic achievement is the most important indicator in
the teacher learning process. Dee (2004) said that the parents will try to seek for
the same race of the teachers for their children as they thought that their own
children can get good academic result when their children were taught by the
teachers who had same race as them and from the result, the performance of
students in maths and reading were improved. Teachers’ quality can be affected
in the eyes of students if the race between teacher and student are different. For
example, the quality of White teacher was expected to be low by Black students
and the quality of Black teacher was expected to be low by White students as well.
Dee (2005) said that the student’s expectations and also the teacher’s
perspective will be influenced by ethnicity. Teacher perception is very important
to shape the learning environment of students and the future of students will be
affected in the aspects of educational opportunities. It was found that at least 33
percent of students will lose their focus when they faced the teachers who did not
have the same ethnicity with them and at least 22 percent of students seldom to
complete for their homework. According to Banerjee (2013), the reading level for
a Black student can be increased as he or she was assigned to study under the
guidance of a non-Black teacher. But, it was not a significant difference in the
level of improvement in the aspect of reading in between White students who
were placed under the guidance of non-White teachers. However, it can be seen
that the gap between the Black-White can be reduced by placing Black students
under non-Black teachers in order to improve the reading achievement grade.
A STUDY OF WORKFORCE DIVERSITY THAT AFFECTS EMPLOYEE PERFORMANCE
AMONG THE SECONDARY SCHOOL TEACHERS IN MALAYSIA
Page 19 of 166
In contrast, Cizek (1995) stated that students will feel more comfortable and
more focused on the own race teacher when attending the class without regarding
on teacher’s actual behavior as the same race between teachers and students will
make the teacher be more understood on the student’s needs. Howard (2010) said
that the students that are a different race from the others which are minority
students will achieve a better performance when they are taught by the own race
teachers. Besides, in an environment that having own-raced teachers, the role
played by these teachers are mediators for minority students to face the numerous
situations. McLeod, Lobel, and Cox (1996) addressed that the variety in view was
related with the different characteristics of the group members. In order to
produce high-quality ideas, the variety in view within the group was very
important if the group members were having different ideas and point of views to
handle the task that faced by the group. The research was carried out whereby the
result showed that the diverse group will have better performance than the group
which had the same race among each other in the task that needed the creativity
and different knowledge in cultures.
Cox and Blake (1991) stated that people with diverse ethnic will have
different viewpoints as their experiences were formed with their own ethnic
identity. In addition, the diverse ethnic group will have a broader base of
experience to solve the problem and this can enhance the problem solving and
decision-making process as a diverse group can have an opportunity for critical
thinking and also in the same time the decision was made cohesively within the
group. Appelbaum, Kryvenko, Parada, Soochan, and Shapiro (2015) addressed
that diverse in ethnicity always will come to questions about equal opportunity
and affirmative action. Affirmative action was the process to create an equal
employment opportunity. Stereotyping was another common problem within
diverse ethnic group whereby this problem will hide the organization from the
effectiveness and will rise up the conflicts.
A STUDY OF WORKFORCE DIVERSITY THAT AFFECTS EMPLOYEE PERFORMANCE
AMONG THE SECONDARY SCHOOL TEACHERS IN MALAYSIA
Page 20 of 166
According to Contrada, Ashmore, Gary, Coups, Egeth, Sewell, Ewell, Goyal,
and Chasse (2000), by meeting the expectation of one’s ethnic group and by
trying to behave in a way to fulfill certain ethnic group will create own-group
conformity pressure. It was stated also the members of other ethnic groups,
societal stereotypes and the members of one’s own ethnic group will cause stress
to the people. According to Amaram (2007), managing the work task in an
effective arrangement within the group of cultural diversity was an important
aspect of managerial decision making. He stated ethnic diversity helped the
organization to adopt the changes better and to be more flexible which can help
the organization to be more productive. According to the research done by Joseph
and Selvaraj (2015), the free flow of information can be promoted from ethnic
diversity and the professional relationship within the team will not be affected in
an ethnic diversity group.
2.1.4 Education Level
Based on Hanushek and Woessmann (2007) findings, educational quality is
directly related to school attainment. In other words, the result of job performance
is the outcome of the achievement of school or students which affected by the
education quality delivered by the teachers. In the microeconomic perspectives
which the individual unit such as a person, household, firm or industry, education
increases the labor productivity by increases the human capital inherent in the
workforce. Therefore, enhancement of productivity is the effect of education
which affects the economic growth. There is a large potential power of teacher
education which brings power and influences. Along with teachers’ education and
experience, it brings powerful impact to the achievement on students (Darling-
Hammond, 2009). He further said that teachers are more effective in their
performance if they have qualified criteria and have been certified in the specific
field that they are expert in.

A STUDY OF WORKFORCE DIVERSITY THAT AFFECTS EMPLOYEE PERFORMANCE
AMONG THE SECONDARY SCHOOL TEACHERS IN MALAYSIA
Page 21 of 166
Darling-Hammond (2000) found that student’s achievement is positively
related to the course and education level that taken by a teacher. When teacher
pursued higher education, it has positive effect to the students’ academic
achievement. Moreover, Hill, Rowan, and Ball (2005) said that literature from
the educational production function recommend that teachers’ intellectual
resources like knowledge that they pursue or higher educated is significant affect
student’s learning. Next, core task performance is positively influenced when
education level is also positively related to creativity (Ng & Feldman, 2009).
There is also substantial evidence pointed that individual’s educational
attainments are related with positive outcomes.
Individual educational achievement is no longer one company’s asset or
human capital but it is also a part of society and community core assets. Results
from Ng and Feldman (2009) had suggested that people with higher level of
education has greater capacity of working, attention and also able to handle
complex information. Other than that, person who is high educated has higher
general knowledge too. Therefore, it promotes task performance by providing
useful knowledge in order to complete their task successfully which lead to a
better and higher performance.
According to Sheth (2018), educational level diversity has an impact on
employee performance. Employee who works more than 5 years has less educated
compared to employee who newly joined. Newly joined employee is more
qualified compared to the old employee in terms of educational level, therefore it
leads to conflicts and ego issues among the employees. Therefore, ego issue arises
among employees with different educational level. As the research result done by
Elsaid (2012), there is a significant relationship between educational level and
job performance because employee feels a lack of confidence due to their own
educational level. Next, according to his findings, there are different results in
whether the organization gives equal treatment when it comes to the diversity
education level.
A STUDY OF WORKFORCE DIVERSITY THAT AFFECTS EMPLOYEE PERFORMANCE
AMONG THE SECONDARY SCHOOL TEACHERS IN MALAYSIA
Page 22 of 166
2.1.5 Working experience
According to Darryl and Hunter (2017), work experience can be described as
one of the assessment methods that frequently used for evaluating the eligibility
of applicant for employment. This method is quite similar to the method of
measuring the tenure of an individual in an organization. It was considerably
logical to measure employee experience by this way during the last century
because it was quite common for employees to stay in an organization for a long
time or throughout their entire career.
Based on the early study of Fielder (1968), the experiment involved 240 new
employee and 48 senior petty officers who were appointed as a leader in a group
to determine the relationship between leadership experience and performance.
The questionnaire responses showed that the petty officers are significantly more
ego and motivated to get a good performance in the job given compared to the
new recruits.
According to Dokko, Wilk and Rothbard (2008), the organizations prefer
employees whose past work experience is about the same as the current needs of
the organization as they believe that these employees can increase productivity
immediately with their knowledge. Therefore, the employees with some initial
experience can be better absorb information or knowledge from on-the-job
training.
In ancestral environments, the possession of unique and professional
knowledge was required in some situations such as science, art and politics and
it is more likely to be held by elder or experienced individuals, so experience will
make a person perform better and hence dependable (Vugt, 2006).
Nsubuga (2008) claims that teachers’ education and experience will change
the leadership attitudes and hence performance. With growing experience and age
A STUDY OF WORKFORCE DIVERSITY THAT AFFECTS EMPLOYEE PERFORMANCE
AMONG THE SECONDARY SCHOOL TEACHERS IN MALAYSIA
Page 23 of 166
professional maturity, the teachers are become more democratic than before.
Leadership style can strongly affect the students’ academic performance in a
school. The democratic leadership practices in secondary schools outline
procedures provide an opportunity for teachers’ participation and able to foster
quality education.
Therefore, all teachers are able to express themselves freely and hence feel
that they are involved in the part of the democratic decision-making process
(Nsubuga, 2008). However, a certain organization’s senior employees (who have
been associated in the organization for more than 5 years working experience) are
only involved in the decision-making process (Sheth, 2018).
In conjunction, the meta-analysis by Hunter and Hunter in 1984 found a
correlation between work experience and job performance. The correlation is
higher for employees who has more than 5 years of experience.
According to the Kotur et al. (2014), the study indicates that the employee
performance gradually increases with their experience but the performance is
starting to get lower after serviced for 20 years. As growing of work experience,
the employees learn almost all work-related skills and nothing much to be learned.
The employees keep repeating the same task again and again will give the sense
of boredom and this might negatively affect their performance.
According to Sheth (2018), senior employees are given more importance as
compared to junior employees. Seniority refers to the number of years the
employee worked in the organization. Only senior employees are involved in
most of the decision making since the experienced employees’ seniority is given
more weightage in organization. Therefore, the conflicts often occur between
seniors and juniors. A suitable and healthy working environment have to be
provided to employee who has different work experience to work together. Their
A STUDY OF WORKFORCE DIVERSITY THAT AFFECTS EMPLOYEE PERFORMANCE
AMONG THE SECONDARY SCHOOL TEACHERS IN MALAYSIA
Page 24 of 166
performance is going to be improved when their problems and conflicts are
properly handled.
2.2 Review of Theoretical Model
a. Gender
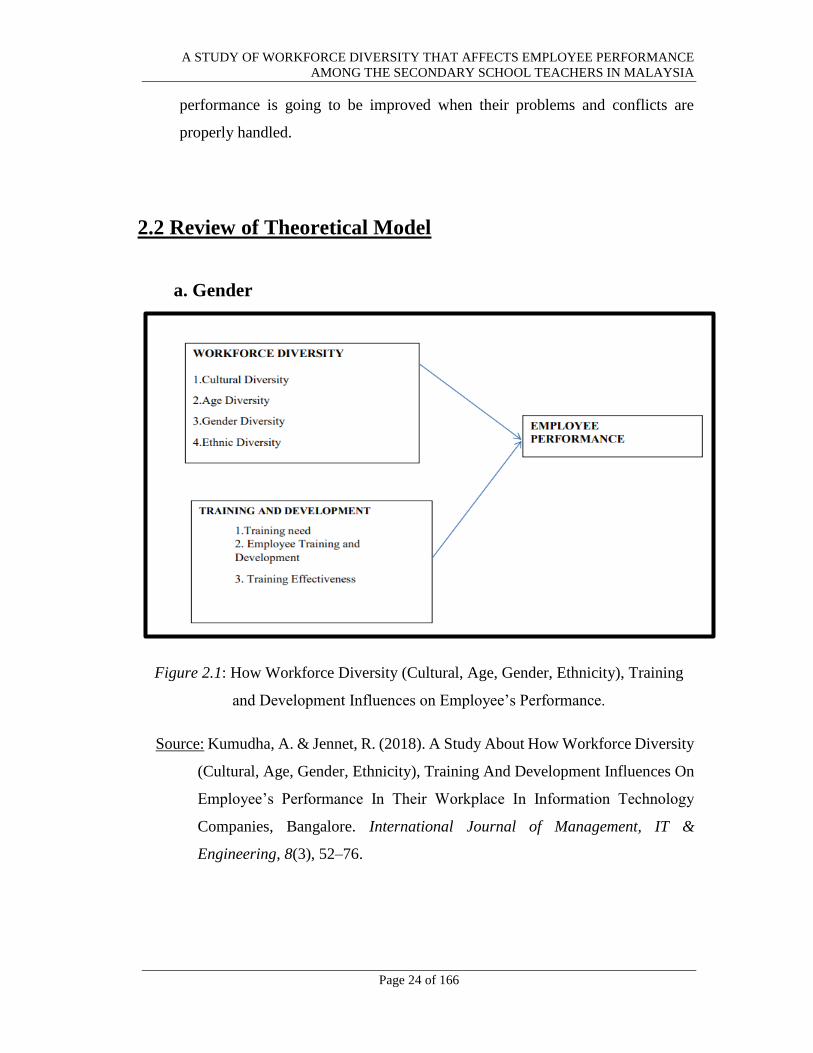
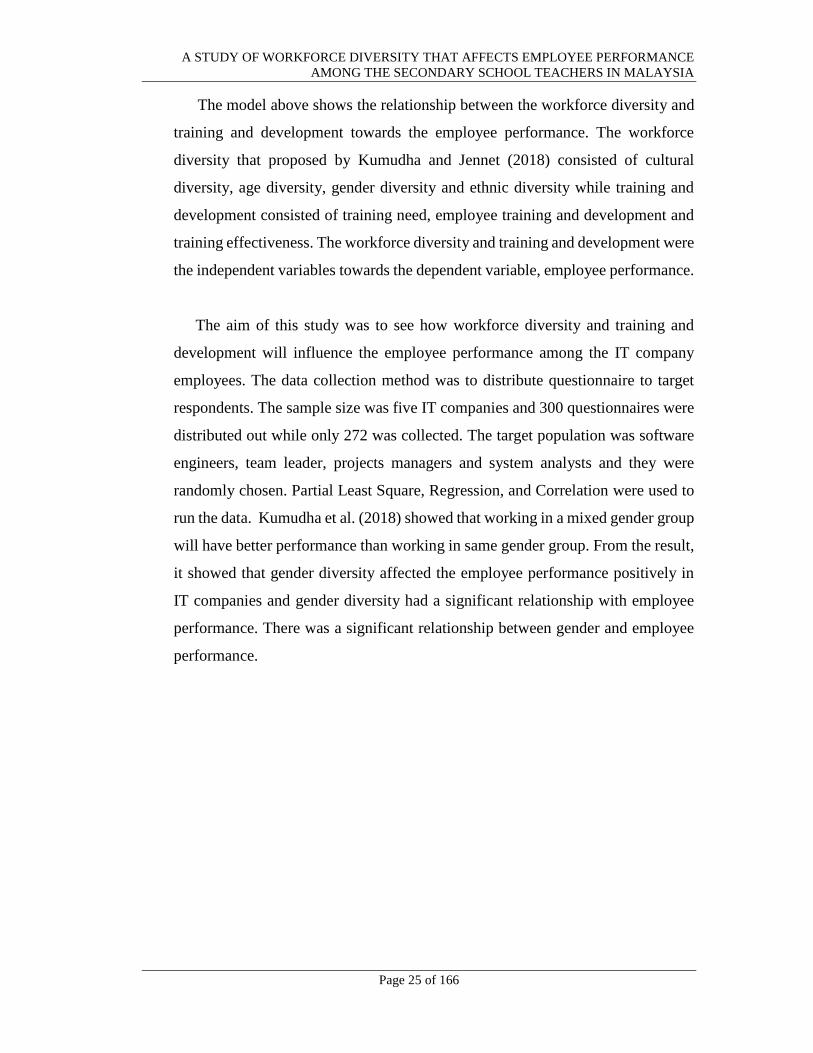
Figure 2.1: How Workforce Diversity (Cultural, Age, Gender, Ethnicity), Training
and Development Influences on Employee’s Performance.
Source: Kumudha, A. & Jennet, R. (2018). A Study About How Workforce Diversity
(Cultural, Age, Gender, Ethnicity), Training And Development Influences On
Employee’s Performance In Their Workplace In Information Technology
Companies, Bangalore. International Journal of Management, IT &
Engineering, 8(3), 52–76.
A STUDY OF WORKFORCE DIVERSITY THAT AFFECTS EMPLOYEE PERFORMANCE
AMONG THE SECONDARY SCHOOL TEACHERS IN MALAYSIA
Page 25 of 166
The model above shows the relationship between the workforce diversity and
training and development towards the employee performance. The workforce
diversity that proposed by Kumudha and Jennet (2018) consisted of cultural
diversity, age diversity, gender diversity and ethnic diversity while training and
development consisted of training need, employee training and development and
training effectiveness. The workforce diversity and training and development were
the independent variables towards the dependent variable, employee performance.
The aim of this study was to see how workforce diversity and training and
development will influence the employee performance among the IT company
employees. The data collection method was to distribute questionnaire to target
respondents. The sample size was five IT companies and 300 questionnaires were
distributed out while only 272 was collected. The target population was software
engineers, team leader, projects managers and system analysts and they were
randomly chosen. Partial Least Square, Regression, and Correlation were used to
run the data. Kumudha et al. (2018) showed that working in a mixed gender group
will have better performance than working in same gender group. From the result,
it showed that gender diversity affected the employee performance positively in
IT companies and gender diversity had a significant relationship with employee
performance. There was a significant relationship between gender and employee
performance.
A STUDY OF WORKFORCE DIVERSITY THAT AFFECTS EMPLOYEE PERFORMANCE
AMONG THE SECONDARY SCHOOL TEACHERS IN MALAYSIA
Page 26 of 166
b. Ethnicity
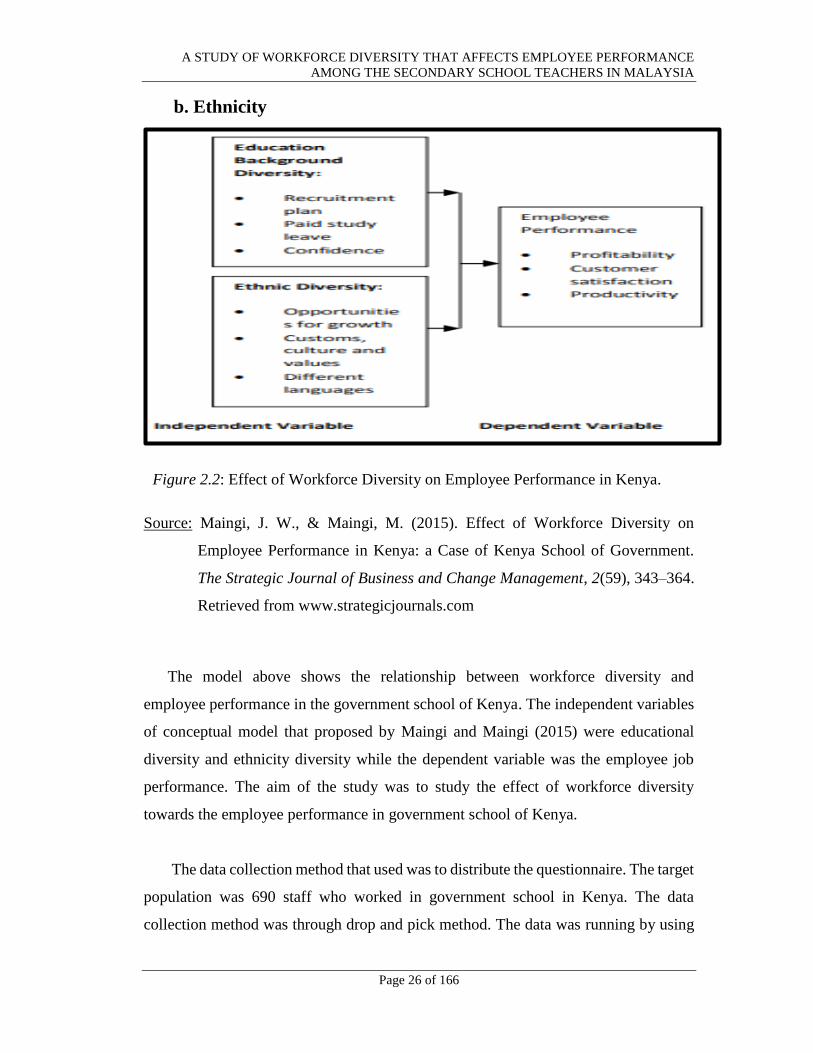
Figure 2.2: Effect of Workforce Diversity on Employee Performance in Kenya.
Source: Maingi, J. W., & Maingi, M. (2015). Effect of Workforce Diversity on
Employee Performance in Kenya: a Case of Kenya School of Government.
The Strategic Journal of Business and Change Management, 2(59), 343–364.
Retrieved from www.strategicjournals.com
The model above shows the relationship between workforce diversity and
employee performance in the government school of Kenya. The independent variables
of conceptual model that proposed by Maingi and Maingi (2015) were educational
diversity and ethnicity diversity while the dependent variable was the employee job
performance. The aim of the study was to study the effect of workforce diversity
towards the employee performance in government school of Kenya.
The data collection method that used was to distribute the questionnaire. The target
population was 690 staff who worked in government school in Kenya. The data
collection method was through drop and pick method. The data was running by using
A STUDY OF WORKFORCE DIVERSITY THAT AFFECTS EMPLOYEE PERFORMANCE
AMONG THE SECONDARY SCHOOL TEACHERS IN MALAYSIA
Page 27 of 166
SPSS system. Maingi et al. (2015) stated that ethnic diversity can help the organization
to develop the creativity and innovation which can help to improve the competitive
position for the organization. From the result, there was a significant relationship
between ethnicity and employee performance.
c. Education level
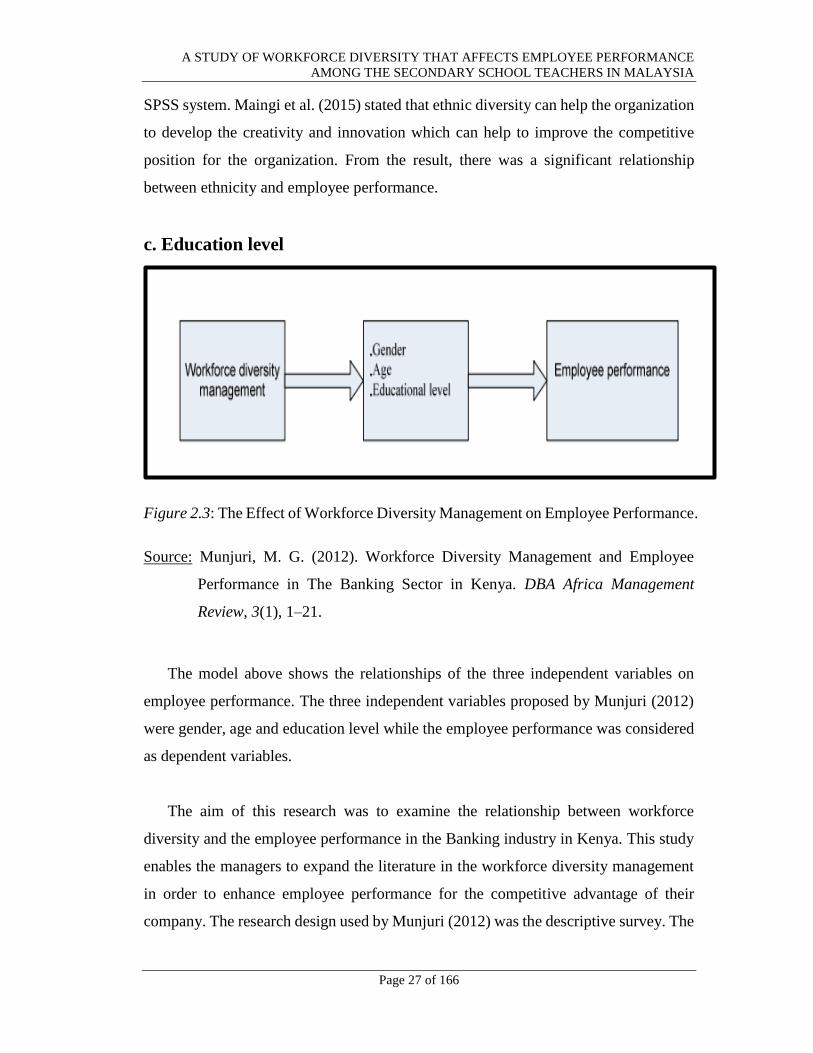
Figure 2.3: The Effect of Workforce Diversity Management on Employee Performance.
Source: Munjuri, M. G. (2012). Workforce Diversity Management and Employee
Performance in The Banking Sector in Kenya. DBA Africa Management
Review, 3(1), 1–21.
The model above shows the relationships of the three independent variables on
employee performance. The three independent variables proposed by Munjuri (2012)
were gender, age and education level while the employee performance was considered
as dependent variables.
The aim of this research was to examine the relationship between workforce
diversity and the employee performance in the Banking industry in Kenya. This study
enables the managers to expand the literature in the workforce diversity management
in order to enhance employee performance for the competitive advantage of their
company. The research design used by Munjuri (2012) was the descriptive survey. The
A STUDY OF WORKFORCE DIVERSITY THAT AFFECTS EMPLOYEE PERFORMANCE
AMONG THE SECONDARY SCHOOL TEACHERS IN MALAYSIA
Page 28 of 166
population size of this research study included 4000 employees of the bank where the
stratified random sampling method was used to selected respondents to involve in the
questionnaire. The questionnaires were construct based on the past studies and it
consisted of six parts.
From the result, it showed a significant level of association between workforce
diversity and employee performance. In other words, gender positively effects on
employee performance, and there is a significant positive relationship between age and
employee performance, besides, there is a significant difference between education and
employee performance.
d. Working experience
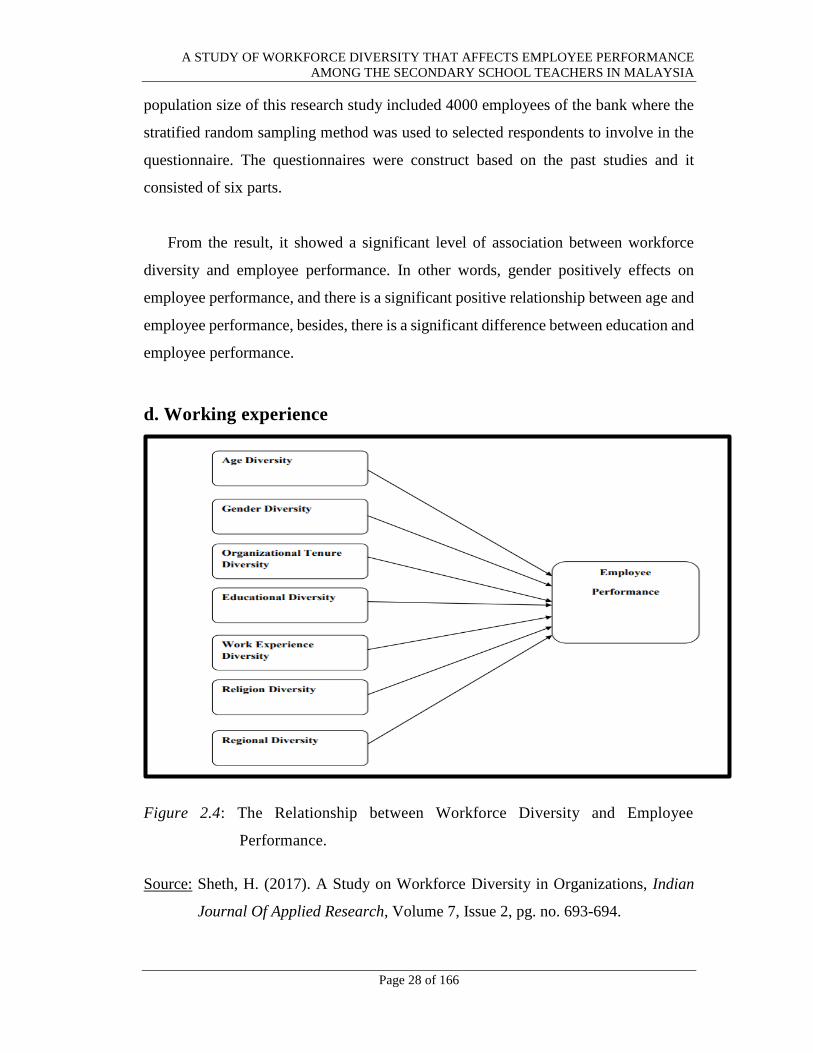
Figure 2.4: The Relationship between Workforce Diversity and Employee
Performance.
Source: Sheth, H. (2017). A Study on Workforce Diversity in Organizations, Indian
Journal Of Applied Research, Volume 7, Issue 2, pg. no. 693-694.
A STUDY OF WORKFORCE DIVERSITY THAT AFFECTS EMPLOYEE PERFORMANCE
AMONG THE SECONDARY SCHOOL TEACHERS IN MALAYSIA
Page 29 of 166
The model above shows the relationships between workforce diversity and
employee performance. There are seven independent variables proposed by Sheth
(2017), which were age, gender, organizational tenure, education, work experience,
religion, and regional diversity. All of the independent variables are to test the effects
on the dependent variable – employee performance.
The purpose of this research was to examine the influence of diversity dimensions
on the employee performance with reference to IT, FMCG and Telecom industry in
Gujarat. The research collected both the primary and secondary data. The sampling
technique of quota sampling and convenience sampling method were used to determine
the sample size in this study, therefore, there are 595 employees from the company of
IT, Telecom and FMCG industry in Ahmedabad, Baroda, Surat, and Rajkot involve as
respondents in this study. The research design for this study was categorized as
exploratory and descriptive research since industry practitioners and academicians
have been contacted by Sheth (2017) under the exploratory research and questionnaire
was distributed to conduct employee survey under the descriptive research.
Based on the findings of the study, the diversity dimensions of age, organizational
tenure, educational level and working experience have significant impact on employee
performance while the gender, religion and regional diversity have no significant
impact on the employee performance.
A STUDY OF WORKFORCE DIVERSITY THAT AFFECTS EMPLOYEE PERFORMANCE
AMONG THE SECONDARY SCHOOL TEACHERS IN MALAYSIA
Page 30 of 166
2.3 Proposed Theoretical or Conceptual Framework
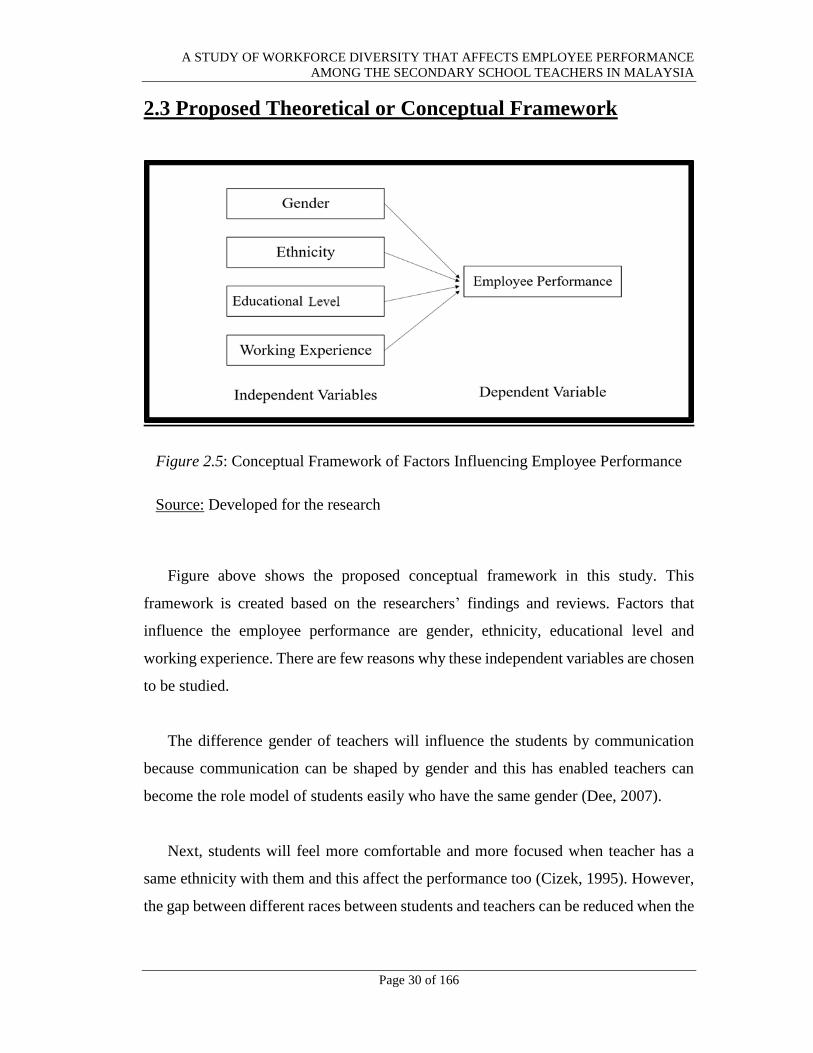
Figure 2.5: Conceptual Framework of Factors Influencing Employee Performance
Source: Developed for the research
Figure above shows the proposed conceptual framework in this study. This
framework is created based on the researchers’ findings and reviews. Factors that
influence the employee performance are gender, ethnicity, educational level and
working experience. There are few reasons why these independent variables are chosen
to be studied.
The difference gender of teachers will influence the students by communication
because communication can be shaped by gender and this has enabled teachers can
become the role model of students easily who have the same gender (Dee, 2007).
Next, students will feel more comfortable and more focused when teacher has a
same ethnicity with them and this affect the performance too (Cizek, 1995). However,
the gap between different races between students and teachers can be reduced when the
A STUDY OF WORKFORCE DIVERSITY THAT AFFECTS EMPLOYEE PERFORMANCE
AMONG THE SECONDARY SCHOOL TEACHERS IN MALAYSIA
Page 31 of 166
student's race is different from the teachers but this could help the students in academic
achievement (Banerjee, 2013).
Moreover, the higher the educational level or learning will have a significant
influence on the quality of learning outcomes of the students (Hanushek & Woessmann,
2007). Teachers who has certified in their own academic area has positively affect the
results of students (Darling-Hammond, 2009). Then, different educational level in one
organizational will lead to conflict which affect the employee performance (Sheth,
2018).
Lastly, the experience of the workers can be helped in handling complex and
diversity working task which they can perform better and more dependable (Vugt,
2006). According to Kotur et al. (2014), they mentioned that employee performance
will be increased with their experience. But the performance will be lower when
employee work more than 20 years, because there is not much new experience can be
gained.
2.4 Hypotheses Development
2.4.1 The Relationship between Gender and Employee
Performance
From the results of the study in Akiri et al. (2008), it concluded that gender is
going to influence the productivity of teachers in secondary school. The location
gives more impact on productivity of female teachers than male teachers. Female
teachers in rural locations have significantly lower productivity than male teachers.
Besides, male teachers that service at the first five years are most productive while
A STUDY OF WORKFORCE DIVERSITY THAT AFFECTS EMPLOYEE PERFORMANCE
AMONG THE SECONDARY SCHOOL TEACHERS IN MALAYSIA
Page 32 of 166
female teachers that service between six to fifteen years are most productive after
getting some experience from the job.
Based on study of Escardíbul et al. (2012), gender of teacher affects the results
of student as the students’ result positively correlated with female teacher. The
results of male student who taught by female teacher is improved in the test by 12
points. It shows the gender of teacher increases results of students with more than
half of the standard deviation.
The study of Christopher et al. (2012) investigated the influence of teachers’
gender on the students’ academic performance. From the study, it shows
significantly different results between the performance of students who are taught
by female teachers and students who are taught by male teachers, the former
performing better than the latter. Teacher gender significantly affects their
performance and academic performance of students.
Therefore, the hypotheses are formed as following:
H0: There is no significant positive relationship between good workforce diversity
(gender) and employee performance.
H1: There is a significant positive relationship between good workforce diversity
(gender) and employee performance.
2.4.2 The Relationship between Ethnicity and Employee
Performance
According to the study by Banerjee (2013), it shows Black and Hispanic
students that taught by their own race teachers does not improve their academic
performance in math and reading. These students even become worse when they
are taught by same-race teachers compared to their peers who are taught by
A STUDY OF WORKFORCE DIVERSITY THAT AFFECTS EMPLOYEE PERFORMANCE
AMONG THE SECONDARY SCHOOL TEACHERS IN MALAYSIA
Page 33 of 166
different race teachers. Besides, assignment of same race teacher not really have a
positive impact in terms of improving the academic achievement of minority
students. There is no significant difference in academic achievement for Hispanic
students who are taught by Hispanic or non-Hispanic teachers depends on the
diversity of the teacher in the school.
Based on the study of Thomas (2004), the achievement of the student was
increasing in years of teaching by own race teachers. The student achievement
increased by about 2 to 3 percentage points in the first year of exposure to teacher
same race. The result can support the assumption which the minority teacher can
improve the achievement of minority students.
According to Cizek (1995), the teachers’ characteristics generally give impact
on their effectiveness in improving the academic achievement of their students.
The minority teachers can address the needs of minority students. Such an
understanding provides a way for enhancing the skills of the teachers who deal with
minority students and hence improve their performance.
The dynamics of race and ethnic between teachers and students have
consistently influence teacher perceptions of student performance. But, the effects
related to race and ethnicity seems to be concentrated among students with low
socioeconomic status (Dee, 2005).
Therefore, the hypotheses are formed as following:
H0: There is no significant positive relationship between good workforce diversity
(ethnicity) and employee performance.
H1: There is a significant positive relationship between good workforce diversity
(ethnicity) and employee performance.
A STUDY OF WORKFORCE DIVERSITY THAT AFFECTS EMPLOYEE PERFORMANCE
AMONG THE SECONDARY SCHOOL TEACHERS IN MALAYSIA
Page 34 of 166
2.4.3 The Relationship between Educational Level and Employee
Performance
Based on the research of Darling-Hammond (2000), quality characteristics of a
teacher like certification status and the degree in the field to be taught are significant.
It has a positive correlation with student learning outcomes. The teachers’
educational level like master's degrees has a positive relationship but weaker
influence with educational achievements.
Research of Ng et al. (2009) stated that the impact of education become stronger
when performance is defined as the absence or workplace aggression. In the study,
they provided evidence that educated employees are going to perform the task,
citizenship, and counterproductive performance more effectively.
The study of Hill et al. (2005) found that mathematical knowledge of teachers
for teaching is positively predicted the mathematics result of the student. The
positive influence on students’ result in the first grade indicates that content
knowledge of teachers plays a big role in teaching the very basic mathematics
content. The knowledge of the teacher can enhance their performance by improving
the results of students.
Therefore, the hypotheses are formed as following:
H0: There is no significant positive relationship between good workforce diversity
(education level) and employee performance.
H1: There is a significant positive relationship between good workforce diversity
(education level) and employee performance.
A STUDY OF WORKFORCE DIVERSITY THAT AFFECTS EMPLOYEE PERFORMANCE
AMONG THE SECONDARY SCHOOL TEACHERS IN MALAYSIA
Page 35 of 166
2.4.4 The Relationship between Working Experience and
Employee Performance
According to Darryl et al. (2017), the job performance outcome is significantly
predicted by prior-related work experience. The employee who has more prior-
related work experience tends to perform better and make a good contribution to
the organization.
Based on the study by Rice (2010), the experience gained can increase the
employees’ skills, knowledge, and productivity, and hence performance improved.
The teacher has the greatest productivity during their first few years of teaching,
and the performance will start to diminish after that.
The study indicated that the employees’ performance gradually improving with
their growing experience and the performance is starting to get lower after serviced
for 20 years. It shows that the employees more likely to have better performance
with the increasing of the work experience (Kotur et al., 2014).
Performance of teacher usually associated with achievement of the student. The
study found that years of teachers’ experience significantly influence the academic
performance of students in several secondary schools. Besides, the experience of
the teacher also has a significant impact on improving academic performance in
secondary education (Ewetan & Ewetan, 2015).
Based on Yusuf and Dada (2016), the study shows a significant difference
between the academic performance of students who taught by teachers with one to
five years of teaching experience and students taught by teachers with six to fifteen
years of experience. Latter is performed better than former. The teachers’
experience is a major factor that can affect their performance and hence improve
the academic performance of the student.
A STUDY OF WORKFORCE DIVERSITY THAT AFFECTS EMPLOYEE PERFORMANCE
AMONG THE SECONDARY SCHOOL TEACHERS IN MALAYSIA
Page 36 of 166
Therefore, the hypotheses are formed as following:
H0: There is no significant positive relationship between good workforce diversity
(working experience) and employee performance.
H1: There is a significant positive relationship between good workforce diversity
(working experience) and employee performance.
2.5 Conclusion
Literature reviews of relevant theoretical models and various approaches to
employee’s performance provides a conceptual background to strengthen the argument
of this research. For the most important, the formulation of hypothesis allows
quantitative and qualitative testing to proceed. Research methods for this study will be
discussed in detail in the next chapter.
A STUDY OF WORKFORCE DIVERSITY THAT AFFECTS EMPLOYEE PERFORMANCE
AMONG THE SECONDARY SCHOOL TEACHERS IN MALAYSIA
Page 37 of 166
CHAPTER 3: RESEARCH METHODOLOGY
3.0 Introduction
This chapter discusses the method that researchers adopted in order to study the
research topic. It also stated clearly on the procedures in running a research from the
very beginning step until the end of the research for collecting accurate data and
evidence and therefore support the study and to achieve the ultimate objective of the
research. Topics involved in this chapter are research design, data collection methods,
sampling design, research instruments, constructs measurement, data processing and
data analysis.
3.1 Research Design
Research design is a kind of blueprint and conceptual structure when conducting a
research for collection, measurement and data analysis. There are three types of
research approach which are qualitative approach, quantitative approaches, and mixed
method. Quantitative is more formal, rigid fashion, scientific and credible. Qualitative
approach is more subjective and contextual. Mixed method is the combination of
qualitative and quantitative approach. Researchers had adopted quantitative approach
since a large number of respondents need to study in this research. Quantitative
approach is relatively suitable for this research study in order to reduce time-consuming
in data analysis since this research covers a wide range of respondents in Malaysia
(Trochim, 2002).
A STUDY OF WORKFORCE DIVERSITY THAT AFFECTS EMPLOYEE PERFORMANCE
AMONG THE SECONDARY SCHOOL TEACHERS IN MALAYSIA
Page 38 of 166
Researchers have chosen causal research in studying this topic because of the desire
to understand the cause-effect relationship between variables. In the most business
surveys, causal research or analysis is considered as an important experiment because
it helps in better understanding and controlling the relationship between variables by
effects and cause. It helps to determine how an independent variable change will affect
the dependent variables. When events happened (cause), different results (effect) may
occur. To study more details in the relationship between the variables, causal research
is chosen as the research method (Trochim, 2002).
3.2 Data Collection Methods
Data can be classified into two categories which are primary data and secondary
data. Each type of data consists of qualitative and quantitative data. Primary data can
be considered as qualitative data when it is collected by using interview session or
open-ended question as it is very subjective (Hox & Boeijie, 2005). When it comes to
a standard questionnaire, then the primary data is considered quantitative. This is the
same when goes to secondary data. Data collection methods are important because it
will be used to answer the hypothesis and the description of the research questions.
3.2.1 Primary Data
Primary data refers to the first-hand data gathered by the researcher. Primary
data usually can be collected by using experiment, social survey, interview and
observation. By collecting the primary data, it takes a longer time for researcher
to collect. It is time-consuming but it has a higher validity compare to secondary
data because it is a real-time data. In this research, researchers choose to distribute
survey questionnaire as the primary data collection method to collect the primary
data from secondary school’s teachers in Malaysia for researchers’ research topic.
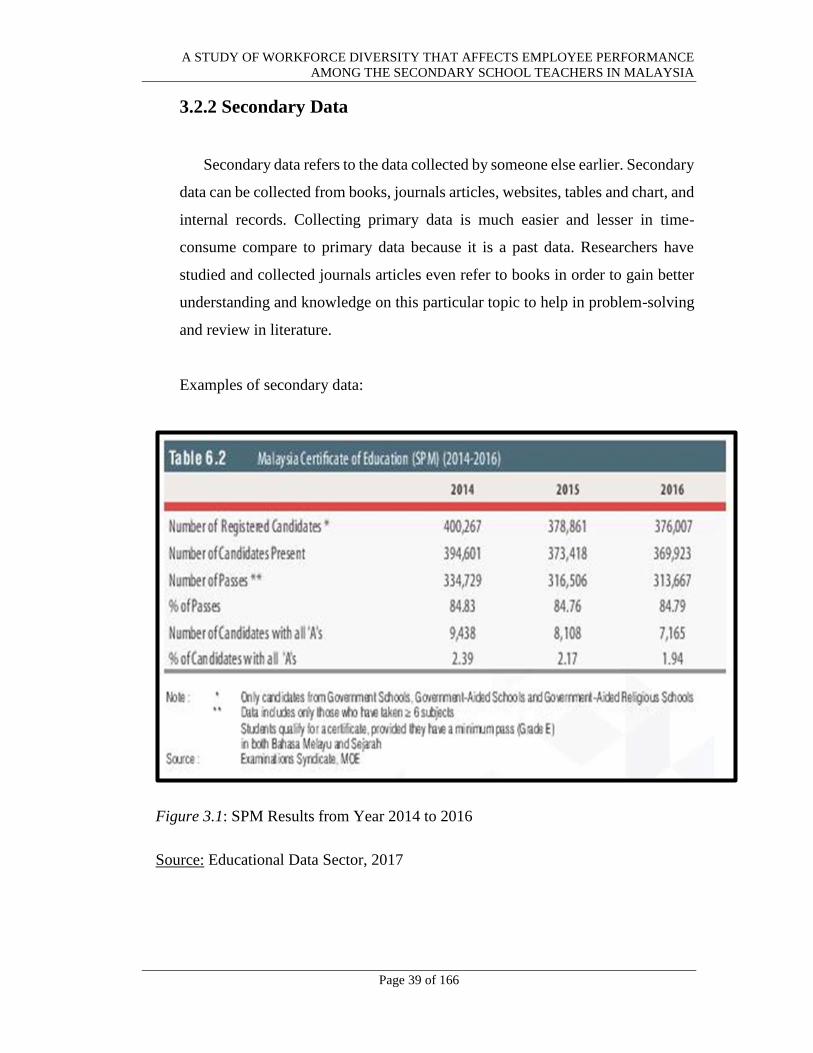
A STUDY OF WORKFORCE DIVERSITY THAT AFFECTS EMPLOYEE PERFORMANCE
AMONG THE SECONDARY SCHOOL TEACHERS IN MALAYSIA
Page 39 of 166
3.2.2 Secondary Data
Secondary data refers to the data collected by someone else earlier. Secondary
data can be collected from books, journals articles, websites, tables and chart, and
internal records. Collecting primary data is much easier and lesser in time-
consume compare to primary data because it is a past data. Researchers have
studied and collected journals articles even refer to books in order to gain better
understanding and knowledge on this particular topic to help in problem-solving
and review in literature.
Examples of secondary data:
Figure 3.1: SPM Results from Year 2014 to 2016
Source: Educational Data Sector, 2017
A STUDY OF WORKFORCE DIVERSITY THAT AFFECTS EMPLOYEE PERFORMANCE
AMONG THE SECONDARY SCHOOL TEACHERS IN MALAYSIA
Page 40 of 166
3.3 Sampling Design
Sampling is known as the process of choosing the right individual or unit as the
entire population representatives (Sekaran & Bougie, 2013).
3.3.1 Target Population
Target population is the member who has the particular criterion are targeted
to be investigated in the research. The teachers who work in secondary school
Malaysia are the target population in this study. Based on the data released by
Ministry of Education Malaysia, researchers knew that there are 183,152 teachers
who work in secondary schools in Malaysia (“Educational Data Sector,” 2017).
3.3.2 Sampling Frame and Sampling Location
The sampling frame is a list of all people or unit in the population that a
sample can be drawn (Greener, 2008). Researchers unable to access the sampling
frame for the secondary school teachers in Malaysia due to the privacy issues.
However, researchers able to get the lists of secondary schools in Malaysia as
there are total 2411 of secondary schools as at 31 December 2017. According to
Aslam and Hassan (2003), Malaysia consists of five main regions which are
Central Region (Selangor, Negeri Sembilan and Melaka), Northern Region
(Perak, Pulau Pinang, Perlis and Kedah), Southern Region (Johor), Eastern
Region (Terengganu, Kelantan and Pahang) and East Malaysia (Sabah and
Sarawak).
Hence, the targeted secondary schools and target respondents are chosen
based on the five main regions with the list of all secondary schools in Malaysia.
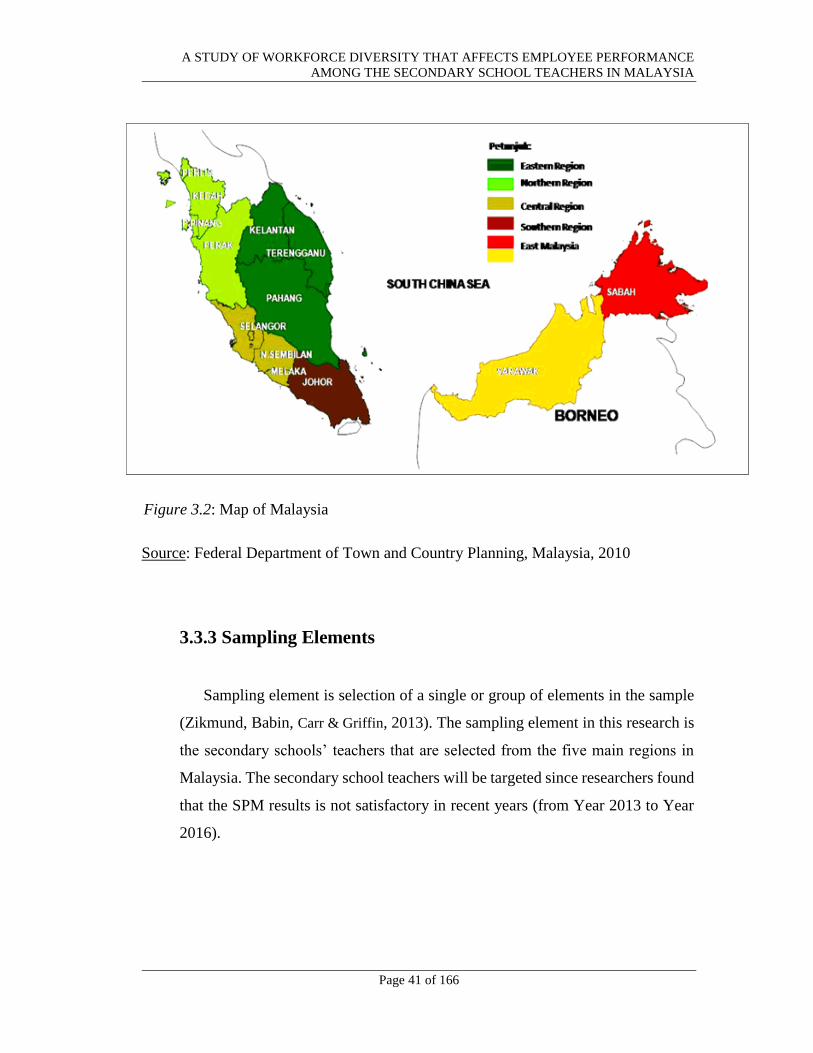
A STUDY OF WORKFORCE DIVERSITY THAT AFFECTS EMPLOYEE PERFORMANCE
AMONG THE SECONDARY SCHOOL TEACHERS IN MALAYSIA
Page 41 of 166
Figure 3.2: Map of Malaysia
Source: Federal Department of Town and Country Planning, Malaysia, 2010
3.3.3 Sampling Elements
Sampling element is selection of a single or group of elements in the sample
(Zikmund, Babin, Carr & Griffin, 2013). The sampling element in this research is
the secondary schools’ teachers that are selected from the five main regions in
Malaysia. The secondary school teachers will be targeted since researchers found
that the SPM results is not satisfactory in recent years (from Year 2013 to Year
2016).
A STUDY OF WORKFORCE DIVERSITY THAT AFFECTS EMPLOYEE PERFORMANCE
AMONG THE SECONDARY SCHOOL TEACHERS IN MALAYSIA
Page 42 of 166
3.3.4 Sampling Technique
There are two categories of sampling methods which are probability sampling
and nonprobability sampling. Probability sampling is a sampling technique that
every people of the population has a known and the selection is non-zero
probability, while nonprobability sampling is the sample are being chosen based
on personal judgement or convenience (Zikmund et al., 2013).
The sampling technique for this research study is non-probability sampling
since researchers unable to get the sampling frame. This study has adopted two
sampling technique which is the combination of convenience sampling and
snowball sampling. Convenience sampling obtains the unit or people who are
most conveniently available while snowball sampling is a sampling method that
the initial respondents are randomly chosen and obtain additional respondents
from those initial respondents’ information (Sekaran et al., 2013).
The researchers conveniently choose the target secondary school based on the
five main regions in order to avoid bias generated from the convenient sampling
method. After that, researchers randomly choose one state from each region and
distribute the questionnaire to the respective secondary schools. Due to the
privacy issues, researchers personally met with the selected schools’ principal and
pass the questionnaire to him or her rather than directly distribute to the secondary
teachers. The principals then pass down the questionnaire to the target
respondents which is teachers and this distribution method was continuously from
principal to all related respondents in school. This is known as snowball sampling
method.
The researchers choosing convenient and snowball sampling technique
because it involves low cost and less time-consuming for the large geographical
areas. It produces lower field cost as define the cluster geographically and makes
the probability sampling in a large population is possible (Zikmund et al., 2013).
A STUDY OF WORKFORCE DIVERSITY THAT AFFECTS EMPLOYEE PERFORMANCE
AMONG THE SECONDARY SCHOOL TEACHERS IN MALAYSIA
Page 43 of 166
3.3.5 Sampling Size
Sample size is the subset or subgroup of the population (Sekaran et al., 2013).
The larger sample size can cause the analysis more sensitive towards statistical
significance and increase the exactness (Greener, 2008). Based on the data
released by Ministry of Education Malaysia, there are 183,152 secondary school
teachers in Malaysia and it was the population of the study. The sample size was
determined based on the target population and the sample size was obtained by
adapting the Sekaran and Bougie’s table of sample size for a given population
size. According to the Table 3.1, the research required to collect data with 384
sample size from the target population.
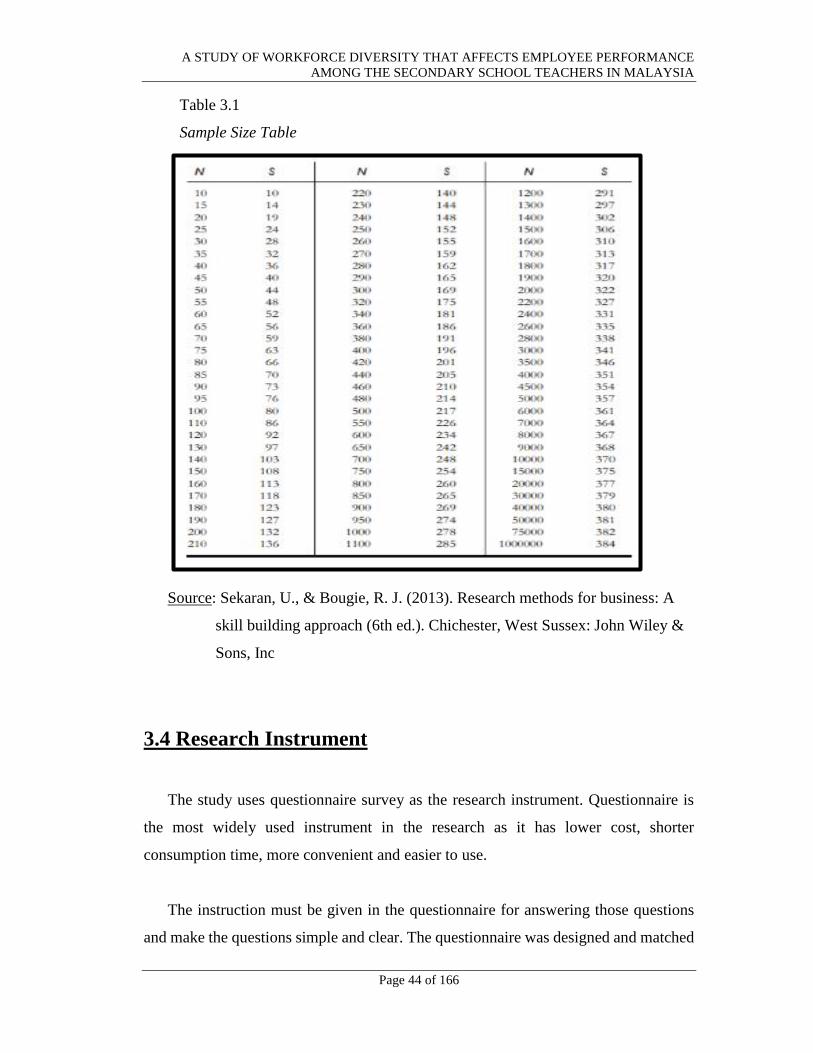
A STUDY OF WORKFORCE DIVERSITY THAT AFFECTS EMPLOYEE PERFORMANCE
AMONG THE SECONDARY SCHOOL TEACHERS IN MALAYSIA
Page 44 of 166
Table 3.1
Sample Size Table
Source: Sekaran, U., & Bougie, R. J. (2013). Research methods for business: A
skill building approach (6th ed.). Chichester, West Sussex: John Wiley &
Sons, Inc
3.4 Research Instrument
The study uses questionnaire survey as the research instrument. Questionnaire is
the most widely used instrument in the research as it has lower cost, shorter
consumption time, more convenient and easier to use.
The instruction must be given in the questionnaire for answering those questions
and make the questions simple and clear. The questionnaire was designed and matched
A STUDY OF WORKFORCE DIVERSITY THAT AFFECTS EMPLOYEE PERFORMANCE
AMONG THE SECONDARY SCHOOL TEACHERS IN MALAYSIA
Page 45 of 166
with the literature review of dependent and independent variables. Then, the
questionnaire can be collected from the respondent through the paper and electronic
form.
3.4.1 Pilot Test
Pilot study is a small-scale study that collects data to test the feasibility of the
research protocols, instruments of data collection, sample recruitment strategies
and other techniques used in research for preparing a larger study (Hassan &
Schattner, 2006). The pilot test is a guide for a larger study and it can reduce the
risk which the full study may face (Zikmund et al., 2013).
There are 30 sets of questionnaires were used in pilot study. The pilot test was
conducted in Kampar Perak since the researchers conduct the test by using
convenient method. This method was widely used and involved a very low cost.
Based on Malaysia Education Blueprint 2013-2025, the performance in Perak for
SPM 2011 is the third lowest in Peninsular Malaysia. Besides, the SPM 2016 has
707 candidates in Perak scored straight-A which showed a small decline
compared to 890 students scored straight-A in 2015 (Arif, 2017). Therefore, it
may increase the reliability of the data.
As image shown below, researchers know that the minimum sample size is
85 that need to be distributed to respondents. This result is generated based on the
number of predictors (IV) which is four IV in the researchers’ study.
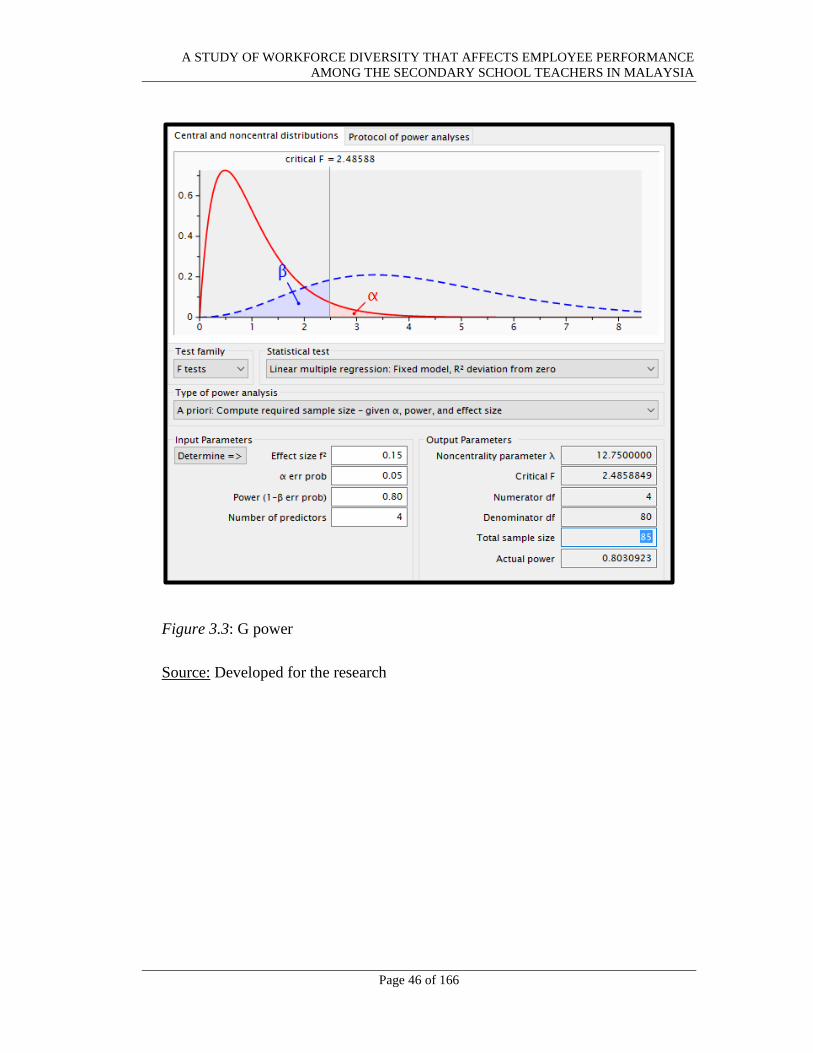
A STUDY OF WORKFORCE DIVERSITY THAT AFFECTS EMPLOYEE PERFORMANCE
AMONG THE SECONDARY SCHOOL TEACHERS IN MALAYSIA
Page 46 of 166
Figure 3.3: G power
Source: Developed for the research
A STUDY OF WORKFORCE DIVERSITY THAT AFFECTS EMPLOYEE PERFORMANCE
AMONG THE SECONDARY SCHOOL TEACHERS IN MALAYSIA
Page 47 of 166
3.5 Construct Measurement
According to Sekaran et al. (2013), the scale is defined as one tool to differentiate
the variables from one to another in the study.
3.5.1 Scale Definitions
3.5.1.1 Nominal Scale
Sekaran et al. (2013) stated that nominal scale is a scale to categorize the
subjects in certain groups or categories. The respondents are assigned with code
number 1 and 2 to show the obvious impact of choosing the different number in
that option. The numbers itself are served as simple and convenient labels without
any intrinsic value. For example, the number (or code) can use to differentiate the
gender of respondents.
The researchers provided two categories for gender which are male and
female. Therefore, male and female are categorized into code number 1 and 2
respectively. By using the nominal scale, the individuals or objects can be
classified into mutually exclusive and collectively exhaustive groups. It can be
further categorized the information on the variable of interest where the data
information gathered from nominal scaling is calculated by using percentage
basic. There are some questions are designed by using the nominal scale in
Section A: question 1 (Gender) and question 3 (Ethnicity).
A STUDY OF WORKFORCE DIVERSITY THAT AFFECTS EMPLOYEE PERFORMANCE
AMONG THE SECONDARY SCHOOL TEACHERS IN MALAYSIA
Page 48 of 166
Example of nominal scale:
1. Gender
[ ] Male
[ ] Female
Source: Developed for the research
3.5.1.2 Ordinal Scale
According to Sekaran et al. (2013), ordinal scale is the scale which has
two uses whereby it is not only can be used to categorize the variables and
denotes the differences among the various categories but can be used to rank-
orders the categories in a significant way. In order to make the ranking among
the categories, the categories of the group will be divided into meaningful
way. For example: the difference in preference and levels can be seen through
the choices of the categories from respondents in the group where it can be
ranked from first to last or best to worst.
The researcher can be helped with the used of ordinal scale in the way of
determining the percentage of respondents who consider interaction with
others. Ordinal scale can provide more information compared to nominal
scale whereby ordinal scale can help the researcher to see how the respondent
will rank-ordering the categories to show the difference of responses from
respondents towards the groups. But, ordinal scale does not provide the
dimension of differences among the ranks. The questions in Section A like
question 2 (Age), question 4 (Educational Level) and question 5 (Working
Experience) are measured in ordinal scale.
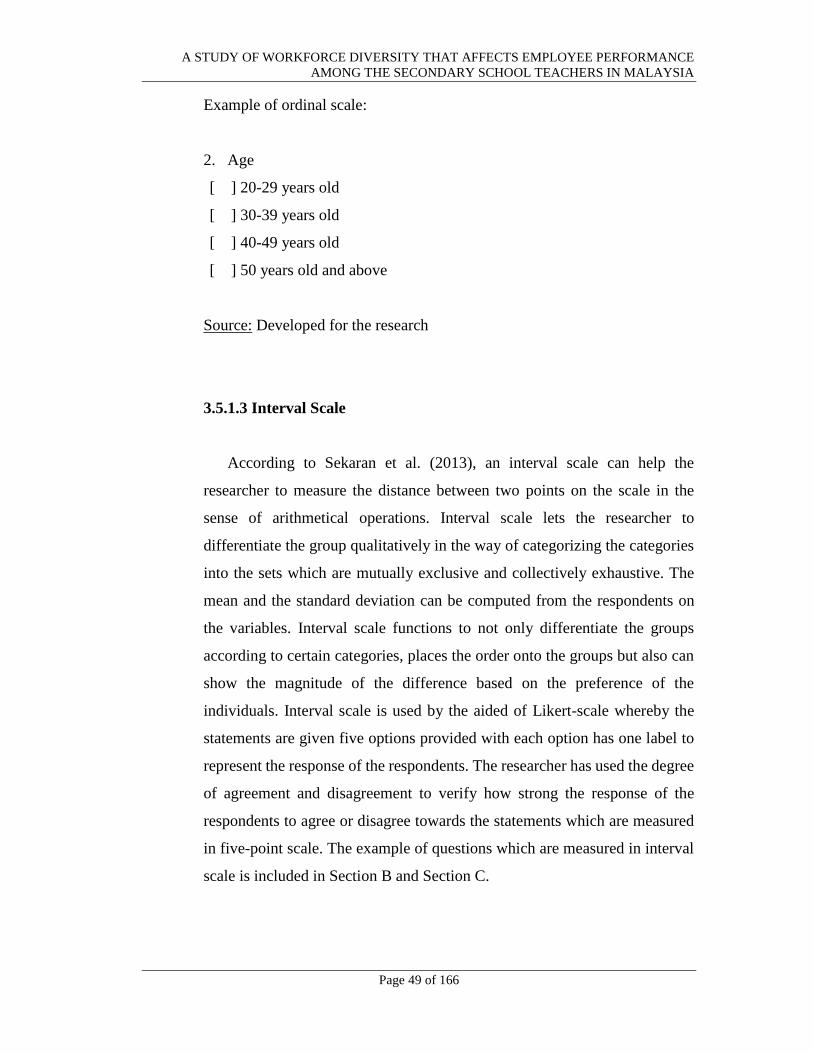
A STUDY OF WORKFORCE DIVERSITY THAT AFFECTS EMPLOYEE PERFORMANCE
AMONG THE SECONDARY SCHOOL TEACHERS IN MALAYSIA
Page 49 of 166
Example of ordinal scale:
2. Age
[ ] 20-29 years old
[ ] 30-39 years old
[ ] 40-49 years old
[ ] 50 years old and above
Source: Developed for the research
3.5.1.3 Interval Scale
According to Sekaran et al. (2013), an interval scale can help the
researcher to measure the distance between two points on the scale in the
sense of arithmetical operations. Interval scale lets the researcher to
differentiate the group qualitatively in the way of categorizing the categories
into the sets which are mutually exclusive and collectively exhaustive. The
mean and the standard deviation can be computed from the respondents on
the variables. Interval scale functions to not only differentiate the groups
according to certain categories, places the order onto the groups but also can
show the magnitude of the difference based on the preference of the
individuals. Interval scale is used by the aided of Likert-scale whereby the
statements are given five options provided with each option has one label to
represent the response of the respondents. The researcher has used the degree
of agreement and disagreement to verify how strong the response of the
respondents to agree or disagree towards the statements which are measured
in five-point scale. The example of questions which are measured in interval
scale is included in Section B and Section C.
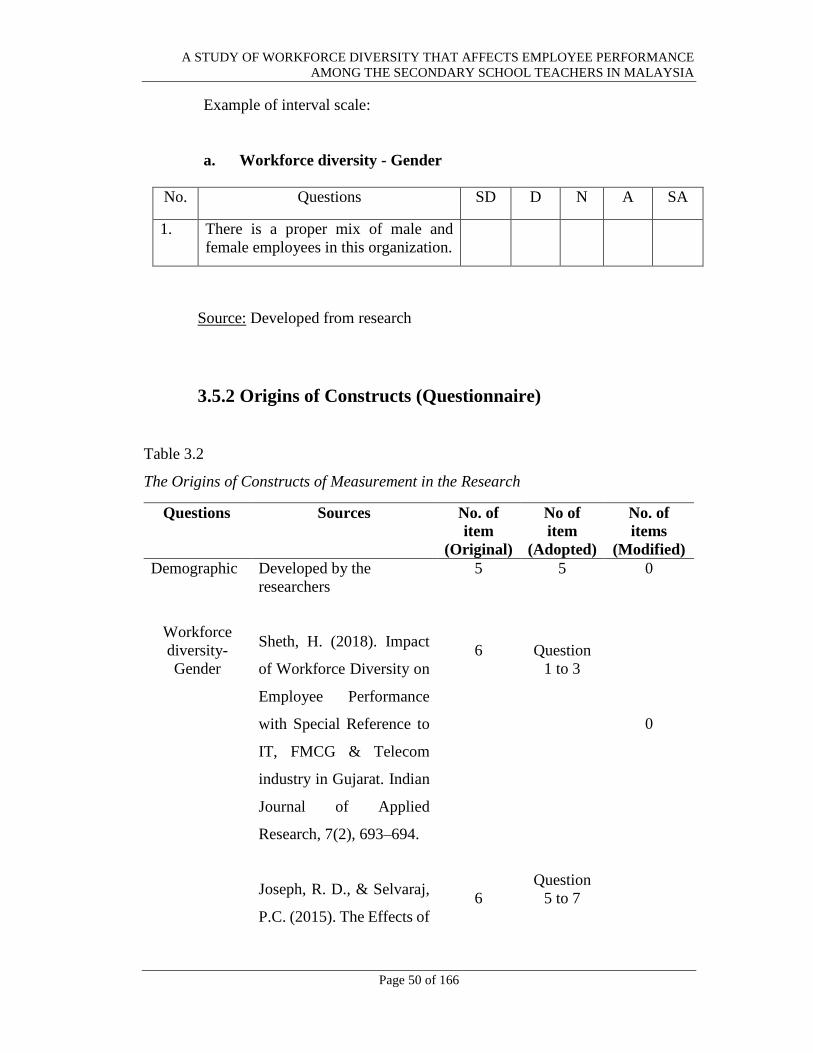
A STUDY OF WORKFORCE DIVERSITY THAT AFFECTS EMPLOYEE PERFORMANCE
AMONG THE SECONDARY SCHOOL TEACHERS IN MALAYSIA
Page 50 of 166
Example of interval scale:
a. Workforce diversity - Gender
Source: Developed from research
3.5.2 Origins of Constructs (Questionnaire)
Table 3.2
The Origins of Constructs of Measurement in the Research
No. Questions SD D N A SA
1. There is a proper mix of male and
female employees in this organization.
Questions Sources No. of
item
(Original)
No of
item
(Adopted)
No. of
items
(Modified)
Demographic Developed by the
researchers
5 5 0
Workforce
diversity-
Gender
Sheth, H. (2018). Impact
of Workforce Diversity on
Employee Performance
with Special Reference to
IT, FMCG & Telecom
industry in Gujarat. Indian
Journal of Applied
Research, 7(2), 693–694.
6
Question
1 to 3
0
Joseph, R. D., & Selvaraj,
P.C. (2015). The Effects of
6
Question
5 to 7
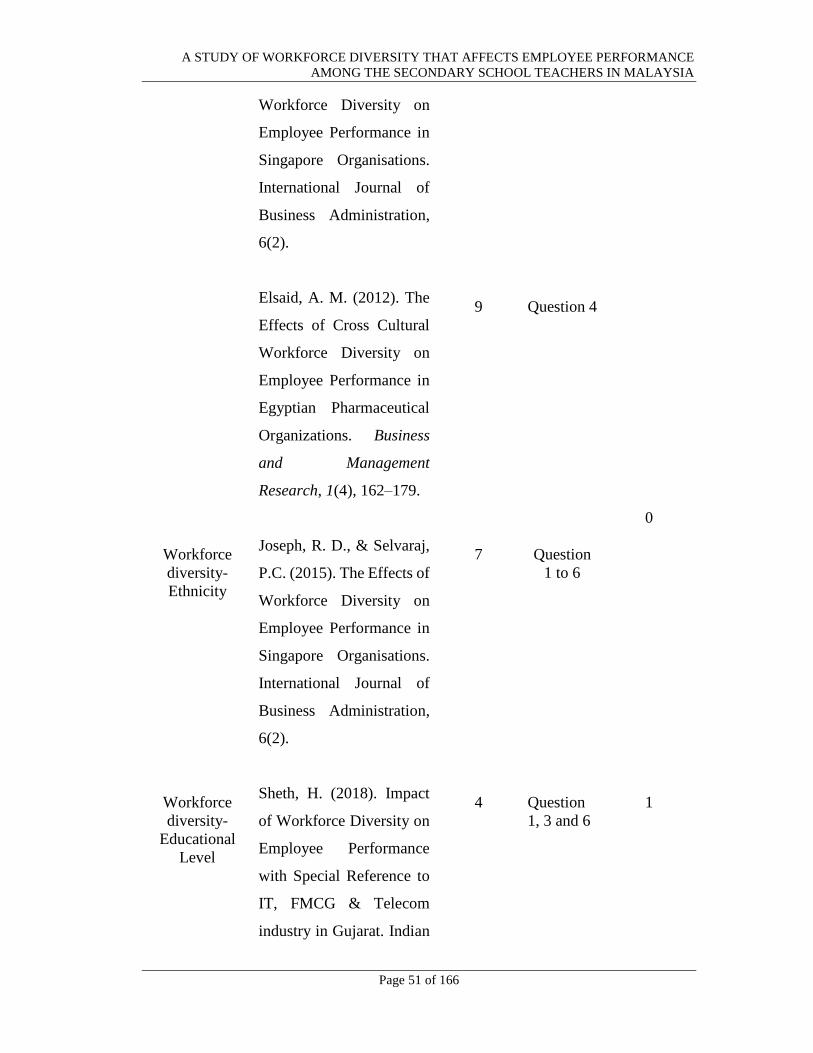
A STUDY OF WORKFORCE DIVERSITY THAT AFFECTS EMPLOYEE PERFORMANCE
AMONG THE SECONDARY SCHOOL TEACHERS IN MALAYSIA
Page 51 of 166
Workforce Diversity on
Employee Performance in
Singapore Organisations.
International Journal of
Business Administration,
6(2).
Elsaid, A. M. (2012). The
Effects of Cross Cultural
Workforce Diversity on
Employee Performance in
Egyptian Pharmaceutical
Organizations. Business
and Management
Research, 1(4), 162–179.
9
Question 4
Workforce
diversity-
Ethnicity
Joseph, R. D., & Selvaraj,
P.C. (2015). The Effects of
Workforce Diversity on
Employee Performance in
Singapore Organisations.
International Journal of
Business Administration,
6(2).
7
Question
1 to 6
0
Workforce
diversity-
Educational
Level
Sheth, H. (2018). Impact
of Workforce Diversity on
Employee Performance
with Special Reference to
IT, FMCG & Telecom
industry in Gujarat. Indian
4
Question
1, 3 and 6
1
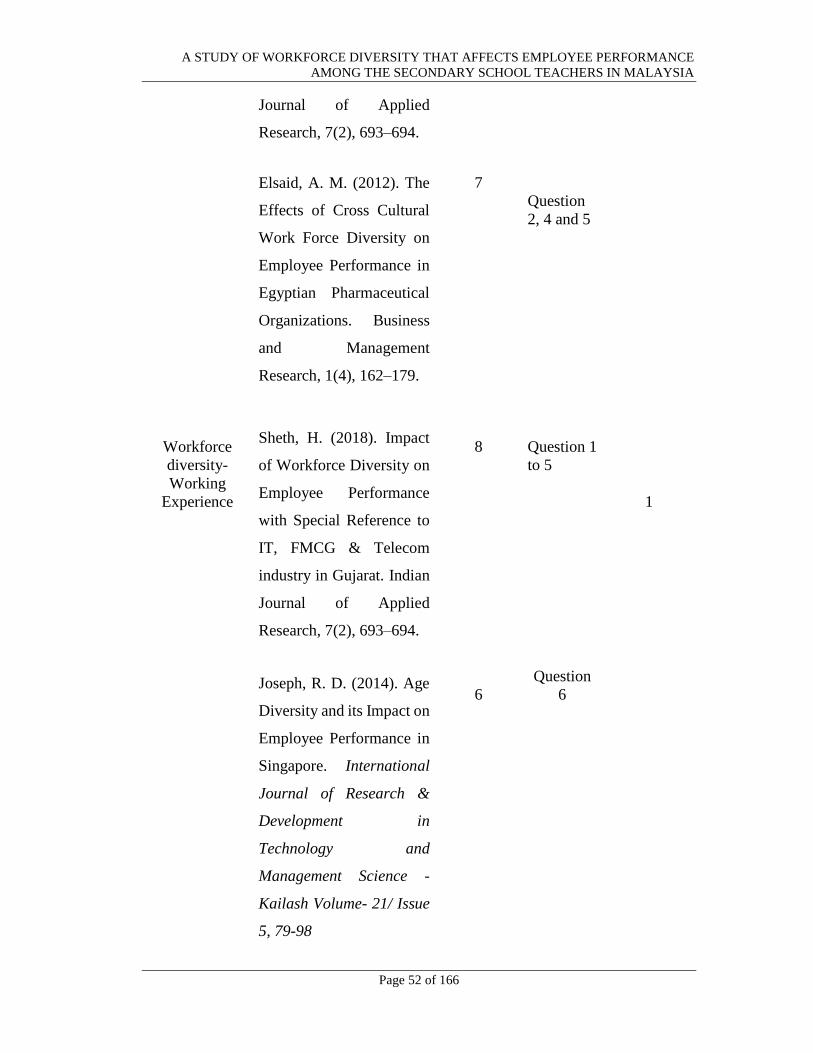
A STUDY OF WORKFORCE DIVERSITY THAT AFFECTS EMPLOYEE PERFORMANCE
AMONG THE SECONDARY SCHOOL TEACHERS IN MALAYSIA
Page 52 of 166
Journal of Applied
Research, 7(2), 693–694.
Elsaid, A. M. (2012). The
Effects of Cross Cultural
Work Force Diversity on
Employee Performance in
Egyptian Pharmaceutical
Organizations. Business
and Management
Research, 1(4), 162–179.
7
Question
2, 4 and 5
Workforce
diversity-
Working
Experience
Sheth, H. (2018). Impact
of Workforce Diversity on
Employee Performance
with Special Reference to
IT, FMCG & Telecom
industry in Gujarat. Indian
Journal of Applied
Research, 7(2), 693–694.
8
Question 1
to 5
1
Joseph, R. D. (2014). Age
Diversity and its Impact on
Employee Performance in
Singapore. International
Journal of Research &
Development in
Technology and
Management Science -
Kailash Volume- 21/ Issue
5, 79-98
6
Question
6
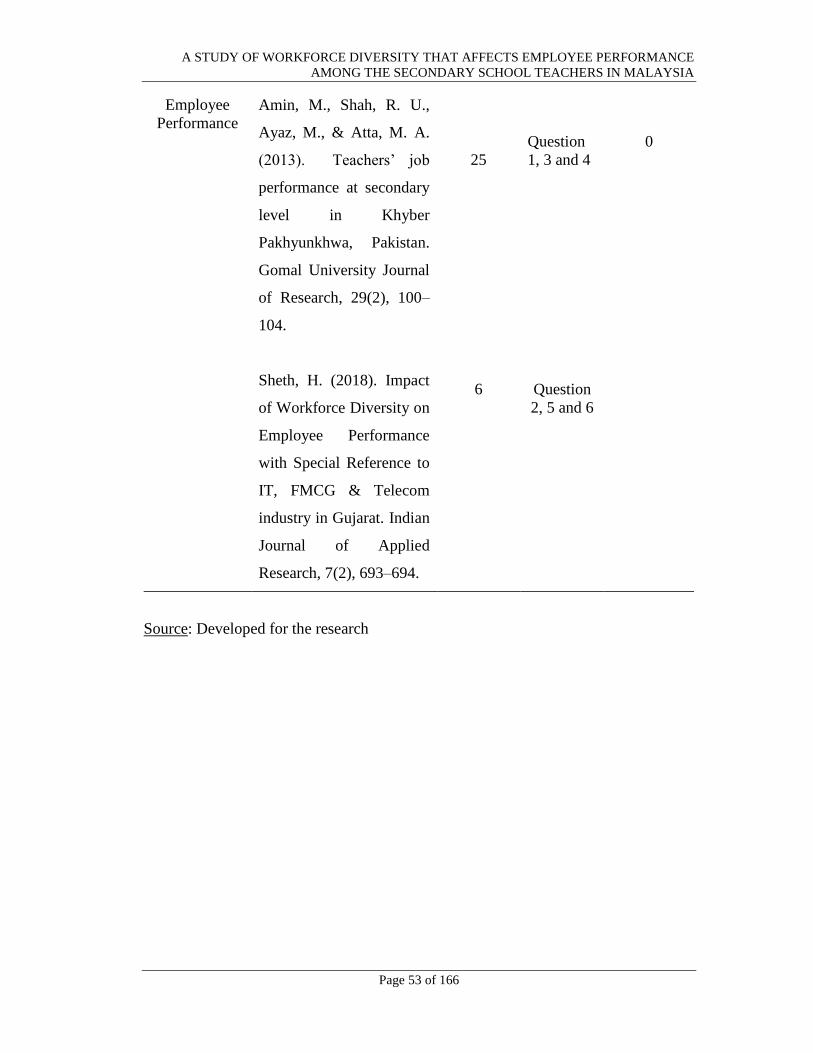
A STUDY OF WORKFORCE DIVERSITY THAT AFFECTS EMPLOYEE PERFORMANCE
AMONG THE SECONDARY SCHOOL TEACHERS IN MALAYSIA
Page 53 of 166
Source: Developed for the research
Employee
Performance
Amin, M., Shah, R. U.,
Ayaz, M., & Atta, M. A.
(2013). Teachers’ job
performance at secondary
level in Khyber
Pakhyunkhwa, Pakistan.
Gomal University Journal
of Research, 29(2), 100–
104.
25
Question
1, 3 and 4
0
Sheth, H. (2018). Impact
of Workforce Diversity on
Employee Performance
with Special Reference to
IT, FMCG & Telecom
industry in Gujarat. Indian
Journal of Applied
Research, 7(2), 693–694.
6
Question
2, 5 and 6
A STUDY OF WORKFORCE DIVERSITY THAT AFFECTS EMPLOYEE PERFORMANCE
AMONG THE SECONDARY SCHOOL TEACHERS IN MALAYSIA
Page 54 of 166
3.6 Data Processing
Data processing is a class of computer process that converts data into information.
After the researchers collected the questionnaire that have been answered by
respondents, researchers processed the raw data into useful information. There are few
procedures that involved in this stage such as the data editing, data checking, data
transcribing, data coding and data cleaning.
3.6.1 Data checking
The first step in data processing is the data checking. After collecting back all
the questionnaires, researchers have to perform data checking in order to ensure
there is no any illogical codes, illogical responses, omission and inconsistent data.
The data checking considered as early detection that enables us to discover the
problems and ultimately increase the reliability of the overall result.
3.6.2 Data Editing
Data editing is help to make sure that the information provided by respondent
is complete, accurate and consistent. When the questionnaires respond by the
respondents are incomplete, researchers will make some reasonable adjustment and
edit the illogical answers based on the respondents’ answering pattern in order to
produce a reliable and accurate data.
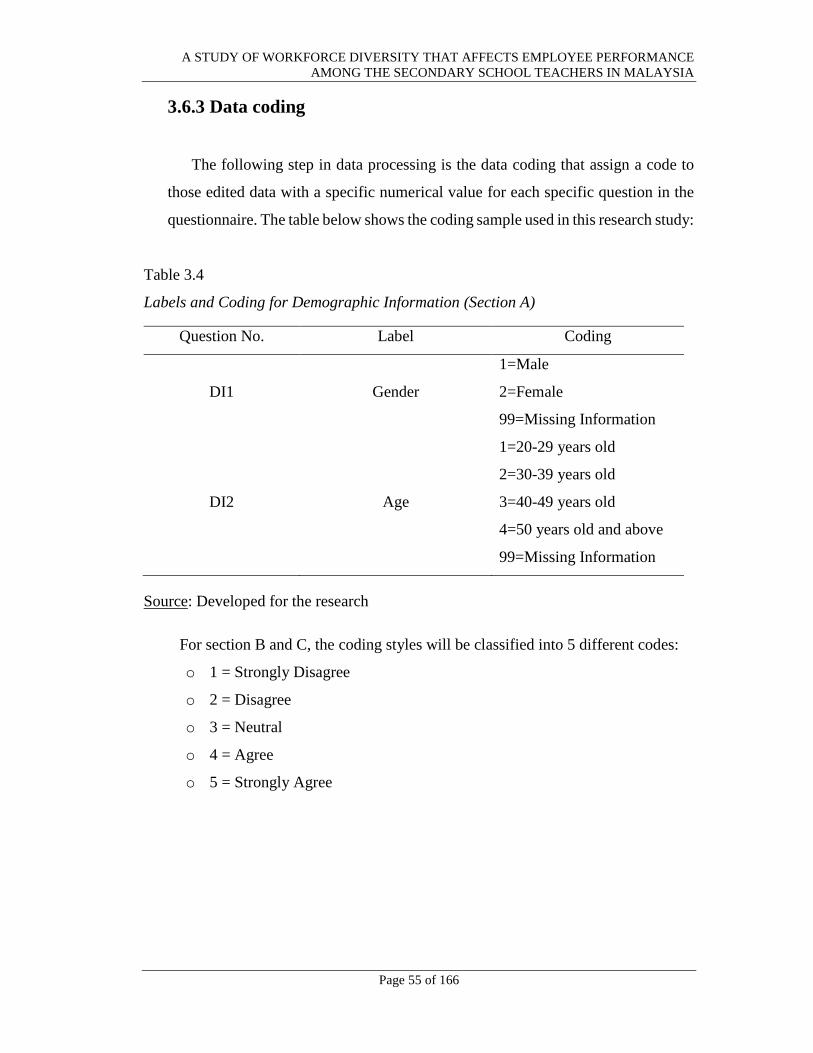
A STUDY OF WORKFORCE DIVERSITY THAT AFFECTS EMPLOYEE PERFORMANCE
AMONG THE SECONDARY SCHOOL TEACHERS IN MALAYSIA
Page 55 of 166
3.6.3 Data coding
The following step in data processing is the data coding that assign a code to
those edited data with a specific numerical value for each specific question in the
questionnaire. The table below shows the coding sample used in this research study:
Table 3.4
Labels and Coding for Demographic Information (Section A)
Source: Developed for the research
For section B and C, the coding styles will be classified into 5 different codes:
o 1 = Strongly Disagree
o 2 = Disagree
o 3 = Neutral
o 4 = Agree
o 5 = Strongly Agree
Question No. Label Coding
DI1 Gender
1=Male
2=Female
99=Missing Information
DI2
Age
1=20-29 years old
2=30-39 years old
3=40-49 years old
4=50 years old and above
99=Missing Information
A STUDY OF WORKFORCE DIVERSITY THAT AFFECTS EMPLOYEE PERFORMANCE
AMONG THE SECONDARY SCHOOL TEACHERS IN MALAYSIA
Page 56 of 166
3.6.4 Data Transcribing
The final step is transcribing the coded data. Statistical analysis system (SAS)
Enterprise Guide 7.1 will be used to analyze and transferred the coded data in pilot
study. After data coding, all of the data will be entered directly into the system.
Next, researchers will have to ensure the negative form questions are reversed.
After that, the SAS Enterprise Guide will perform analysis and therefore show us
the result.
3.7 Data Analysis
Data analysis involve understanding, summarizing those related information
discovered in the research and defining the pattern of the collected data. Data to be used
for analysis study can be collected through survey or questionnaire (Zikmund, Babin,
Carr & Griffin, 2009). Researchers used the Statistical Package for Social Science
(SPSS) version 23 and SMART PLS 3.0 for full study. For pilot study, the researchers
used the Statistical Analysis System (SAS) Enterprise Guide 7.1 to analyse the data
collected through questionnaires. SAS Enterprise Guide is a menu-driven and point-
and-click tool that allow users to analyse data quickly and publish results in the form
of bar chart, summary table or pie chart.
3.7.1 Descriptive Analysis
The descriptive analysis is generally used to summarize and interpret a given
data set which can be used to represent the entire population or a sample of
interest. Data collected can describes the basic characteristic such as distribution,
variability, and central tendency after using this analysis that transform data into
mean, standard deviation, range and mode. The common types of descriptive
A STUDY OF WORKFORCE DIVERSITY THAT AFFECTS EMPLOYEE PERFORMANCE
AMONG THE SECONDARY SCHOOL TEACHERS IN MALAYSIA
Page 57 of 166
analysis used by researchers are frequency distribution and percentage
distribution. Frequency distribution summarizes the statistical data that shows the
number of the occurrence of the values of a variable. Percentage distribution can
be used to arrange frequency distribution into table and summarized percentage
value (Burns, Veeck & Bush, 2016).
In this research, descriptive analysis was used to analyze the demographic
detail such as gender, age, ethnicity, education level and working experience of
researchers’ respondents. The information analyzed will be presented in the form
of tables and pie charts to ease the researchers to understand the data collected
for this research.
3.7.2 Scale Measurement
Sekaran et al. (2013) mentioned that the indicator of a measure’s internal
consistency is reliability. Reliability of a measure indicates the extent to which it
is without error and hence ensures consistent measurement across time and across
the various items in the instrument. Coefficient alpha (α) is applied to estimate
the reliability of multiple item scales. Coefficient alpha was range in value from
0 (not consistency) to 1 (complete consistency). Scales with alpha (α) less than
0.60 is considered to have poor reliability. Scales with alpha (α) between 0.60
and 0.70 are measured to have fair reliability and alpha (α) value between 0.70
and 0.80 are measured to have good reliability. When the coefficient alpha of
scales is between 0.80 and 0.95, it has very good reliability (Zikmund et al., 2009).
A STUDY OF WORKFORCE DIVERSITY THAT AFFECTS EMPLOYEE PERFORMANCE
AMONG THE SECONDARY SCHOOL TEACHERS IN MALAYSIA
Page 58 of 166
3.7.3 Inferential Analysis
The inferential analysis used in SPSS software for full study is Outlier
Detection and Multicollinearity Analysis. The inferential analysis used in PLS
software for full study include Normality Analysis and Common Method Bias.
3.7.3.1 Outlier Detection
Outlier Detection also knows as anomaly detection. The function of
Outlier Detection is to identify the unusual patterns that do not correspond
with the expected behavior or action. Patterns that do not tally with the
expected performance is called an outlier (Choudhary, 2017). Outlier is a
value that is numerically different from the majority of the other data points
in a set of data. Outliers happen may be caused by either inconsistent with the
measurement or error occurs in the research or experiment. It often shows
either measurement error or the population has a heavy-tailed distribution
when it happens. Therefore, the researcher should check for the data either
remove or re-encode the outliers before analyzing.
A univariate outlier is a data point that consists of an extreme value in
only one variable. When looking for univariate outliers, standardized values
(z score) can be used. Next, multivariate outlier is a combination of unusual
score on multiple variables. Multivariate can be identified by using a
technique called Mahalanobis D2 distance ("Univariate & Multivariate
Outliers," 2015). The extreme observations may include the sample
maximum and sample minimum or both to determine whether they are
extremely high or low.
A STUDY OF WORKFORCE DIVERSITY THAT AFFECTS EMPLOYEE PERFORMANCE
AMONG THE SECONDARY SCHOOL TEACHERS IN MALAYSIA
Page 59 of 166
3.7.3.2 Normality Analysis
There are several ways in statistical tests for normality, but researchers
had chosen two of them which are Kolmogorov-Smirnov test and Shapiro-
Wilk test to get the assumption for data normality. Data that certainly does
not meet the assumption of normality will give a poor result. Kolmogorov-
Smirnov test compares the result with a known distribution or normal
distribution; Shapiro-Wilk test will tell if a random sample came from a
distribution (Stephanie, 2016). Based on the result, researchers able to justify
the test if the outcome is not significant (p> 0.05), which shows that the
distribution is normal. However, if the outcome is significant (p <0.05), will
direct that the distribution of the question is abnormal.
Hence, skewness and kurtosis statistics are beneficial for determining the
normal distribution. Skewness is a measure of symmetry or the lack of
symmetry whether the symmetry looks the same to the right and left of the
center point. Kurtosis is a measure of whether the data are peaked or flat
relative to a normal distribution (Sharp, 2016).
3.7.3.3 Multicollinearity Analysis
Researchers had used the PLS-SEM 3.2.7 software to run the
multicollinearity analysis. From the multicollinearity analysis, researchers
will able to calculate the correlation matric for the entire variable to receive
the Variance Inflation Factor (VIF) values which indicate it occurs when there
are high relationships between two or more independent variables, and one
independent variable can be used to predict the other one.
A STUDY OF WORKFORCE DIVERSITY THAT AFFECTS EMPLOYEE PERFORMANCE
AMONG THE SECONDARY SCHOOL TEACHERS IN MALAYSIA
Page 60 of 166
3.7.3.4 Common Method Bias
The journal authors claimed that the strategies similar bias might occur
when the data linked to the criterion variables together with the two predictors
from the data provided by the participants during the time researcher conduct
studies (Podsakoff, MacKenzie, Lee & Podsakoff, 2003). In order to decrease
the bias, the respondent's responses should be used to stay in unidentified
condition where the responses from the respondent should be converted to let
the respondents know to understand that there are no customary answers. This
is to ensure that the question can be answered by them more freely and to
make sure that the answers that provided by them will be as honest as they
can (Dinev & Hart, 2006; Podsakoff et al., 2003).
Researchers have the responsibility to protect the privacy of respondents
on providing the answers for the questionnaires will be protected and in
confidential. This is because this action will increase encouragement for the
respondents in order to participate in the survey and provide the unbiased and
significant answers to the researchers. Once researchers have collected the
info, Harman single issue checking is going to be conducted. This is because
a number of the potential effects-of the-usual-methods of weight can be
worked out where can facilitate the researchers to do it so (Harman, 1967).
According to Malhotra, Kim and Patil (2006), the checking on identical
variance within the style research strategies can be additionally facilitated for
the researchers. The researchers can be assisted by this checking where it
points out whether or not one issue will have appeared from the analysis of
the factors. Once one factor happens, this implies their area unit majority of
the variance of dependent likewise as freelance variables (Aulakh & Kotabe,
1997; Pavlou & Gefen, 2005; Podsakoff & Organ, 1986).
A STUDY OF WORKFORCE DIVERSITY THAT AFFECTS EMPLOYEE PERFORMANCE
AMONG THE SECONDARY SCHOOL TEACHERS IN MALAYSIA
Page 61 of 166
3.8 Conclusion
This chapter mainly focuses on the methodology used in primary and secondary
data collection, target population and the instrument used to run the test by using the
software SAS enterprise guide 7.1 in order to run the data through the process of
identification, collection, organization, and process of analysis. It also provides
different analysis results and meaningful information by using different statistical
techniques in order to test the hypothesis generated to achieve the objective of this
study. The findings and further discussion will be carried out in details in the next
chapter.
A STUDY OF WORKFORCE DIVERSITY THAT AFFECTS EMPLOYEE PERFORMANCE
AMONG THE SECONDARY SCHOOL TEACHERS IN MALAYSIA
Page 62 of 166
CHAPTER 4: RESEARCH RESULT
4.0 Introduction
Researcher has completed identifying the research methods that needed to be used in
this full study by running a pilot study from the previous chapter. Moreover, data
processing and data analysis had also been done by the researcher in the pilot study. In
Chapter 4, the output analysis will be generated from the collected data that had been
verified in the previous chapter by approached the respondent. Research hypotheses
and problems will be explained in depth in the output analysis by carrying out
preliminary analysis hypothesis analysis and et cetera by using PLS regression.
4.1 Preliminary Analysis
Researchers have done data processing and missing data checking, normality
analysis, multicollinearity analysis and outliers’ detection in the previous chapter. Next,
analysts will discuss regarding the results for the common method and non-responsive
bias for this research study.
4.1.1 Data Processing
Data processing is a series of steps applied to collected data to verify, organize,
transform, integrate and extract data in a proper form for further usage. Moreover,
it is followed by data checking, editing, coding and data transcribing (Sekaran et
al., 2015). Researchers will specify special data in the data processing step before
taking the process of analysis.
A STUDY OF WORKFORCE DIVERSITY THAT AFFECTS EMPLOYEE PERFORMANCE
AMONG THE SECONDARY SCHOOL TEACHERS IN MALAYSIA
Page 63 of 166
Firstly, data checking plays a vital role in the research study. It enables
researches to double check the data from questionnaire, to make sure all the
questionnaire data is adequate, relevant and complete without any missing or
erroneous data.
The next step after data checking is data editing which involves the adjustment
and review of the collected data. The purpose of editing and carry out some
modification on the data is to correct incomplete, inconsistent and ambiguous
answer and make it more consistency and legibility.
Sauro (2015) mentioned that respondent might miss out some questions while
answering those lengthy, confusing, and boring questionnaires. Respondent might
feel unwilling to answer the questionnaire when they think the question is sensitive
to them or being affected by the question. To overcome this problem, there are some
ways of handling missing data:
1. Recover the values: Researcher or data collector can contact the participants
for help in complete all the missing data or values or checking for the missing
data before the respondent leave.
2. Listwise Deletion: Delete those data whichever is incomplete. Before doing
this, researchers have to make sure that the sample size is large enough to
drop out those incomplete data without any substantial loss of statistical
power.
3. Educated Guessing: Fill up all the missing data by assuming the missing
value is likely similar to the data presented in a matrix. If a majority of the
participant responds with ‘4s' or ‘5s', then assume the missing data to either
‘4' or ‘5'
A STUDY OF WORKFORCE DIVERSITY THAT AFFECTS EMPLOYEE PERFORMANCE
AMONG THE SECONDARY SCHOOL TEACHERS IN MALAYSIA
Page 64 of 166
Researchers had adopted the educated guessing method to handle those missing
data. The sample size of this research is 384 sets which 224 sets are collected from
Google Form and the remaining 160 sets are distributed through questionnaire form.
Researchers have used google form to collect data initially but the responses are
not enough to cover the sample size. Therefore, researchers continued collecting
data by distributing questionnaire.
The third step in data processing is data coding. Coding typically assigns alpha,
numeric codes, values, percentage to draw inferences in the evaluation of data. This
step allows statistical techniques to be applied.
The last step is transcribing data. This step is taken to make accessible to people
or users for further processing.
4.1.2 Outlier Detection
Researchers apply the multivariate outlier detection to further the data analysis
and research. In order to obtain the Mahalanobis D2 distances, researchers used the
SPSS Regressions with a code as the dependent variable and the rest of the non-
demographic measure are categories as independent variable in. A potential
multivariate outliner will come with a higher D2 value (>3.5). There is no outlier
was detected based on the analysis, as refer to Table 4.2 below. All 384 sets of data
were fully used in this analysis.
A STUDY OF WORKFORCE DIVERSITY THAT AFFECTS EMPLOYEE PERFORMANCE
AMONG THE SECONDARY SCHOOL TEACHERS IN MALAYSIA
Page 65 of 166
4.1.3 Normality Analysis
Researchers had attached the statistical results of skewness and kurtosis in the
Appendix R. Based on Appendix R, it shows most of the questions are normal but
yet there are also consists of abnormal data. However, there is no affection to the
analysis although the distribution is not normal because researchers had used PLS
based SEM. Therefore, there is unnecessary to make any changes to the data since
our research does not have the abnormal distribution.
4.1.4 Multicollinearity Analysis
By referring to Table 4.3, the VIF result shows that there was insufficient
evidence of multicollinearity because VIF values of all the indicators for each
variables have achieved the minimum threshold which are the value of lower than
5 (Hair, Hult, Ringle & Sarstedt, 2016). Therefore, discriminant validity existed in
this research.
4.1.5 Common Method Bias
The researchers should conduct the analysis by using one issue which can
acquire from the big quantity of things so that the variance within the knowledge
can be clarified and the common methodology bias can own a robust proof. The
robust proof supports the common methodology bias. In order to run an associate
preliminary correlational analysis to be used as a hypothesis, all the variables for a
model are inserted by the researchers. The researchers have to embrace to the
variations in variables and this can be helped by the unrotated factors in the way
that the number of things which need the researchers to compel can be outlined.
Based on the outcomes, it indicated that the unrotated factor analysis was 56.502 %
A STUDY OF WORKFORCE DIVERSITY THAT AFFECTS EMPLOYEE PERFORMANCE
AMONG THE SECONDARY SCHOOL TEACHERS IN MALAYSIA
Page 66 of 166
of the total variance. (Refer to Appendix R). In conclusion, the results that were not
influenced by the responses of the respondents will be outlined by the researchers.
4.1.6 Non-Responsive Bias
When the respondents disagree in meaningful ways from non-respondents, the
bias is known as the non-responsive bias which is "Bias in Survey" (Podsakoff,
MacKenzie & Podsakoff, 2012). The bias occurred due to some respondents might
be not willing or cannot participate in this survey and this case happens frequently
due to the response rate through the mail surveys are really low. Besides, the
respondents will also try to neglect or refuse to answer the questions which can
make them feel embarrassed. So, the validity of the survey can be threatened if the
survey contains non-response bias.
Most of the respondents are gotten from the Google Doc and survey form type
as this can enable the respondents to answer the questions through the website or
filling form method which can easily accessible. The researchers try to collect all
the information from the respondents within a few weeks. So, the non-responsive
bias situation did not occur throughout the analysis study.
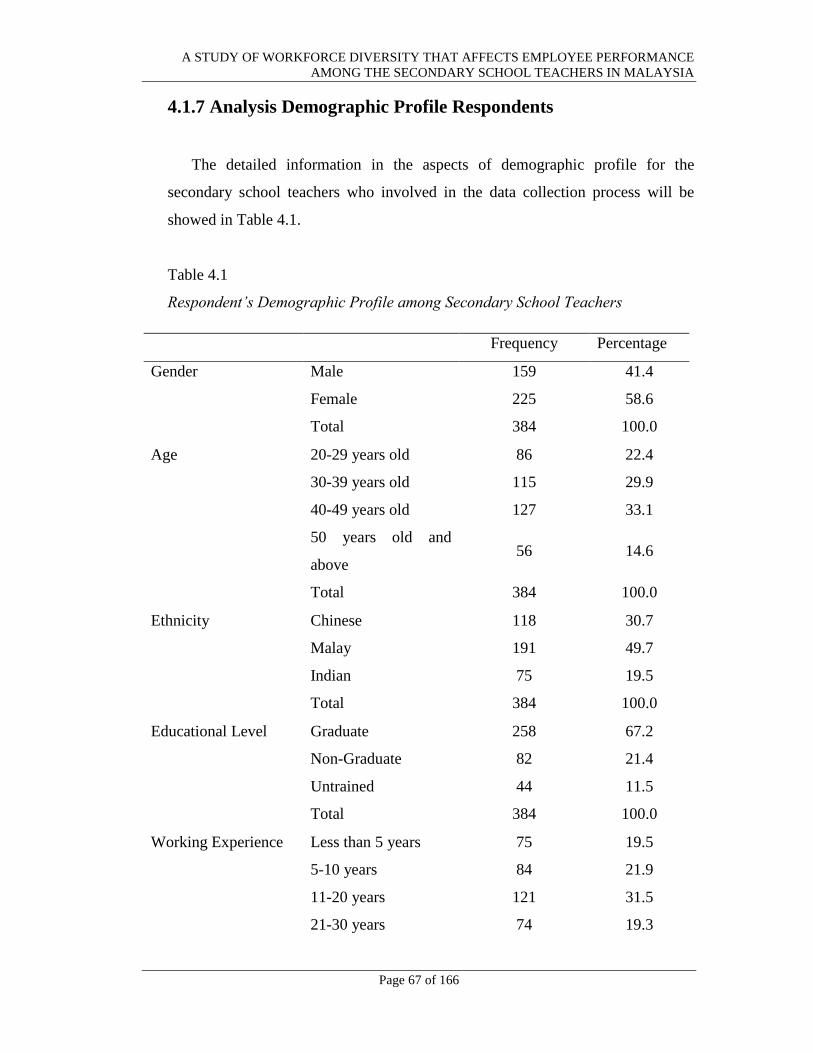
A STUDY OF WORKFORCE DIVERSITY THAT AFFECTS EMPLOYEE PERFORMANCE
AMONG THE SECONDARY SCHOOL TEACHERS IN MALAYSIA
Page 67 of 166
4.1.7 Analysis Demographic Profile Respondents
The detailed information in the aspects of demographic profile for the
secondary school teachers who involved in the data collection process will be
showed in Table 4.1.
Table 4.1
Respondent’s Demographic Profile among Secondary School Teachers
Frequency Percentage
Gender Male 159 41.4
Female 225 58.6
Total 384 100.0
Age 20-29 years old 86 22.4
30-39 years old 115 29.9
40-49 years old 127 33.1
50 years old and
above 56 14.6
Total 384 100.0
Ethnicity Chinese 118 30.7
Malay 191 49.7
Indian 75 19.5
Total 384 100.0
Educational Level Graduate 258 67.2
Non-Graduate 82 21.4
Untrained 44 11.5
Total 384 100.0
Working Experience Less than 5 years 75 19.5
5-10 years 84 21.9
11-20 years 121 31.5
21-30 years 74 19.3
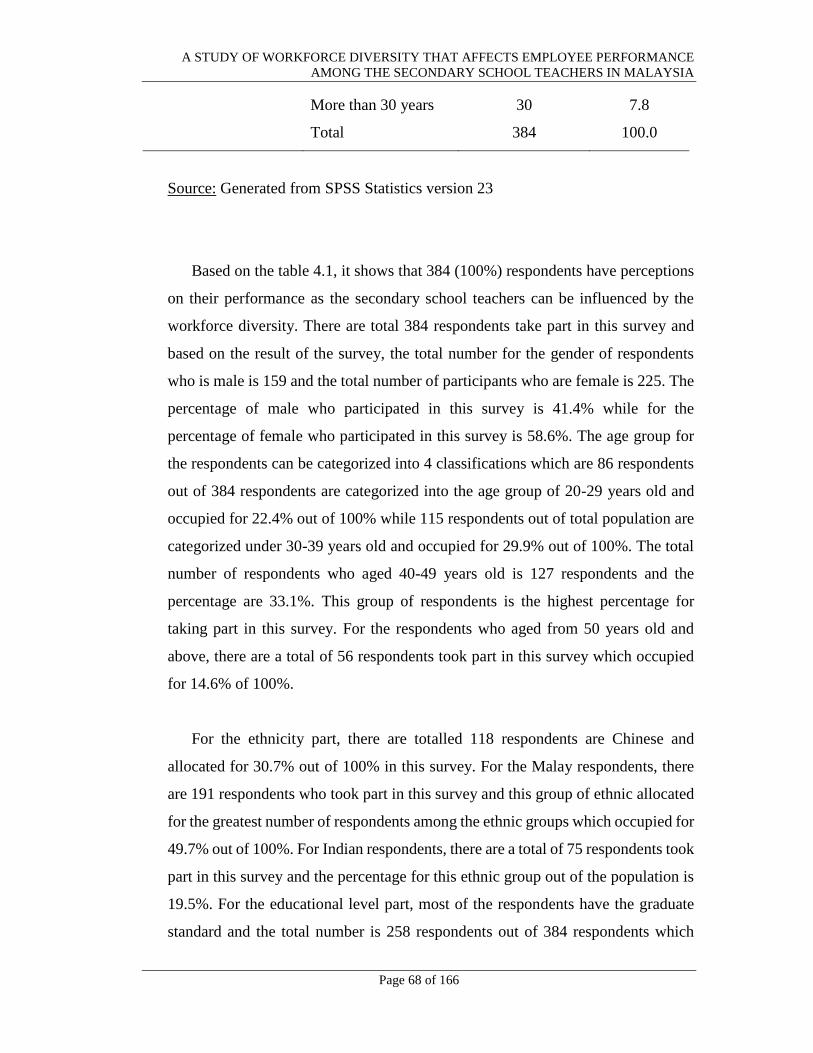
A STUDY OF WORKFORCE DIVERSITY THAT AFFECTS EMPLOYEE PERFORMANCE
AMONG THE SECONDARY SCHOOL TEACHERS IN MALAYSIA
Page 68 of 166
Source: Generated from SPSS Statistics version 23
Based on the table 4.1, it shows that 384 (100%) respondents have perceptions
on their performance as the secondary school teachers can be influenced by the
workforce diversity. There are total 384 respondents take part in this survey and
based on the result of the survey, the total number for the gender of respondents
who is male is 159 and the total number of participants who are female is 225. The
percentage of male who participated in this survey is 41.4% while for the
percentage of female who participated in this survey is 58.6%. The age group for
the respondents can be categorized into 4 classifications which are 86 respondents
out of 384 respondents are categorized into the age group of 20-29 years old and
occupied for 22.4% out of 100% while 115 respondents out of total population are
categorized under 30-39 years old and occupied for 29.9% out of 100%. The total
number of respondents who aged 40-49 years old is 127 respondents and the
percentage are 33.1%. This group of respondents is the highest percentage for
taking part in this survey. For the respondents who aged from 50 years old and
above, there are a total of 56 respondents took part in this survey which occupied
for 14.6% of 100%.
For the ethnicity part, there are totalled 118 respondents are Chinese and
allocated for 30.7% out of 100% in this survey. For the Malay respondents, there
are 191 respondents who took part in this survey and this group of ethnic allocated
for the greatest number of respondents among the ethnic groups which occupied for
49.7% out of 100%. For Indian respondents, there are a total of 75 respondents took
part in this survey and the percentage for this ethnic group out of the population is
19.5%. For the educational level part, most of the respondents have the graduate
standard and the total number is 258 respondents out of 384 respondents which
More than 30 years 30 7.8
Total 384 100.0
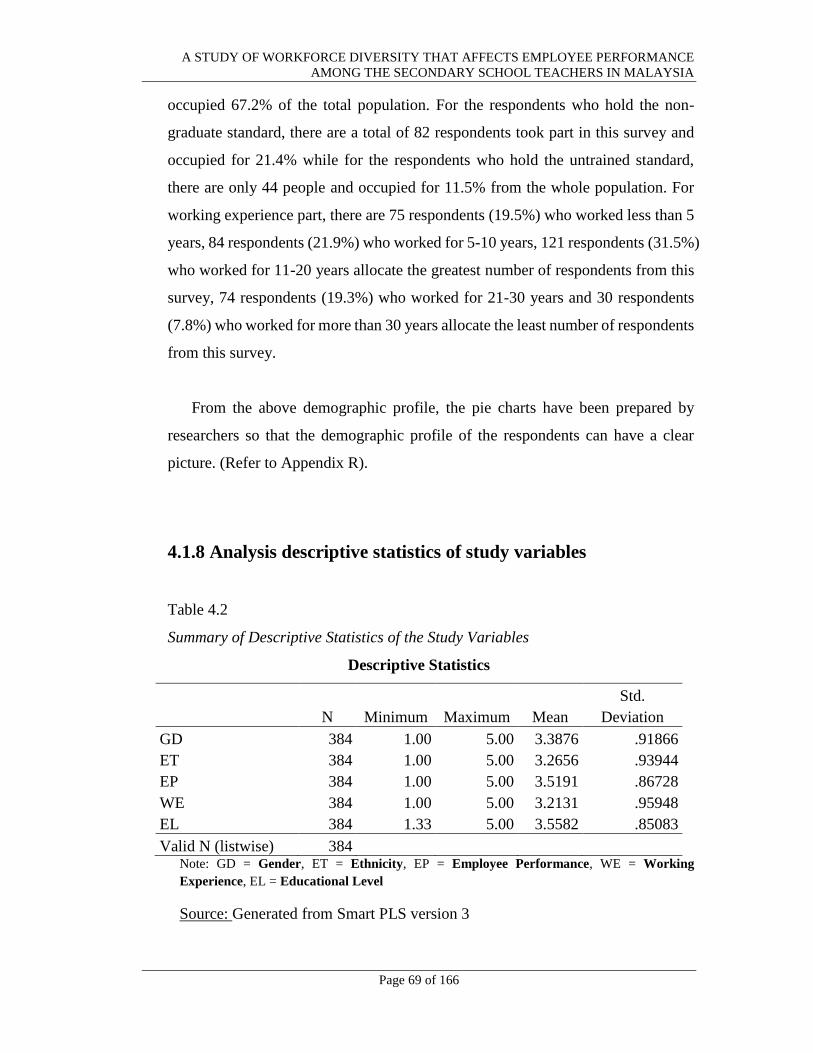
A STUDY OF WORKFORCE DIVERSITY THAT AFFECTS EMPLOYEE PERFORMANCE
AMONG THE SECONDARY SCHOOL TEACHERS IN MALAYSIA
Page 69 of 166
occupied 67.2% of the total population. For the respondents who hold the non-
graduate standard, there are a total of 82 respondents took part in this survey and
occupied for 21.4% while for the respondents who hold the untrained standard,
there are only 44 people and occupied for 11.5% from the whole population. For
working experience part, there are 75 respondents (19.5%) who worked less than 5
years, 84 respondents (21.9%) who worked for 5-10 years, 121 respondents (31.5%)
who worked for 11-20 years allocate the greatest number of respondents from this
survey, 74 respondents (19.3%) who worked for 21-30 years and 30 respondents
(7.8%) who worked for more than 30 years allocate the least number of respondents
from this survey.
From the above demographic profile, the pie charts have been prepared by
researchers so that the demographic profile of the respondents can have a clear
picture. (Refer to Appendix R).
4.1.8 Analysis descriptive statistics of study variables
Table 4.2
Summary of Descriptive Statistics of the Study Variables
Descriptive Statistics
N Minimum Maximum Mean
Std.
Deviation
GD 384 1.00 5.00 3.3876 .91866
ET 384 1.00 5.00 3.2656 .93944
EP 384 1.00 5.00 3.5191 .86728
WE 384 1.00 5.00 3.2131 .95948
EL 384 1.33 5.00 3.5582 .85083
Valid N (listwise) 384
Note: GD = Gender, ET = Ethnicity, EP = Employee Performance, WE = Working
Experience, EL = Educational Level
Source: Generated from Smart PLS version 3
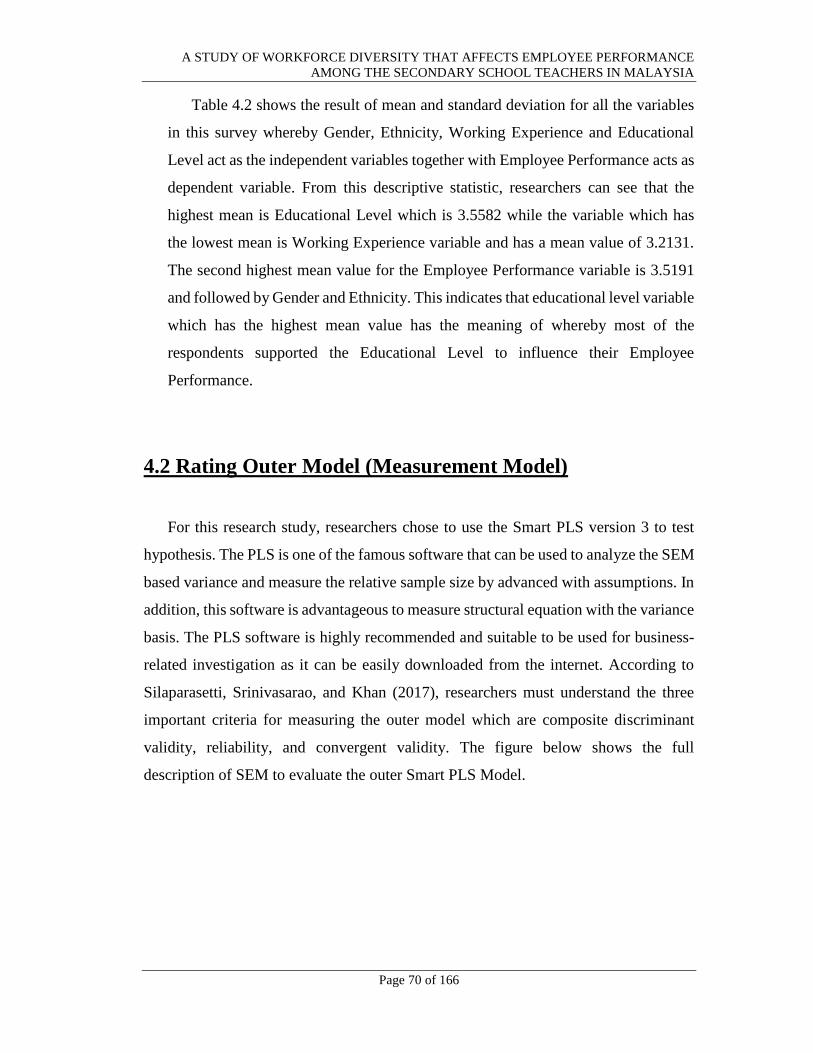
A STUDY OF WORKFORCE DIVERSITY THAT AFFECTS EMPLOYEE PERFORMANCE
AMONG THE SECONDARY SCHOOL TEACHERS IN MALAYSIA
Page 70 of 166
Table 4.2 shows the result of mean and standard deviation for all the variables
in this survey whereby Gender, Ethnicity, Working Experience and Educational
Level act as the independent variables together with Employee Performance acts as
dependent variable. From this descriptive statistic, researchers can see that the
highest mean is Educational Level which is 3.5582 while the variable which has
the lowest mean is Working Experience variable and has a mean value of 3.2131.
The second highest mean value for the Employee Performance variable is 3.5191
and followed by Gender and Ethnicity. This indicates that educational level variable
which has the highest mean value has the meaning of whereby most of the
respondents supported the Educational Level to influence their Employee
Performance.
4.2 Rating Outer Model (Measurement Model)
For this research study, researchers chose to use the Smart PLS version 3 to test
hypothesis. The PLS is one of the famous software that can be used to analyze the SEM
based variance and measure the relative sample size by advanced with assumptions. In
addition, this software is advantageous to measure structural equation with the variance
basis. The PLS software is highly recommended and suitable to be used for business-
related investigation as it can be easily downloaded from the internet. According to
Silaparasetti, Srinivasarao, and Khan (2017), researchers must understand the three
important criteria for measuring the outer model which are composite discriminant
validity, reliability, and convergent validity. The figure below shows the full
description of SEM to evaluate the outer Smart PLS Model.
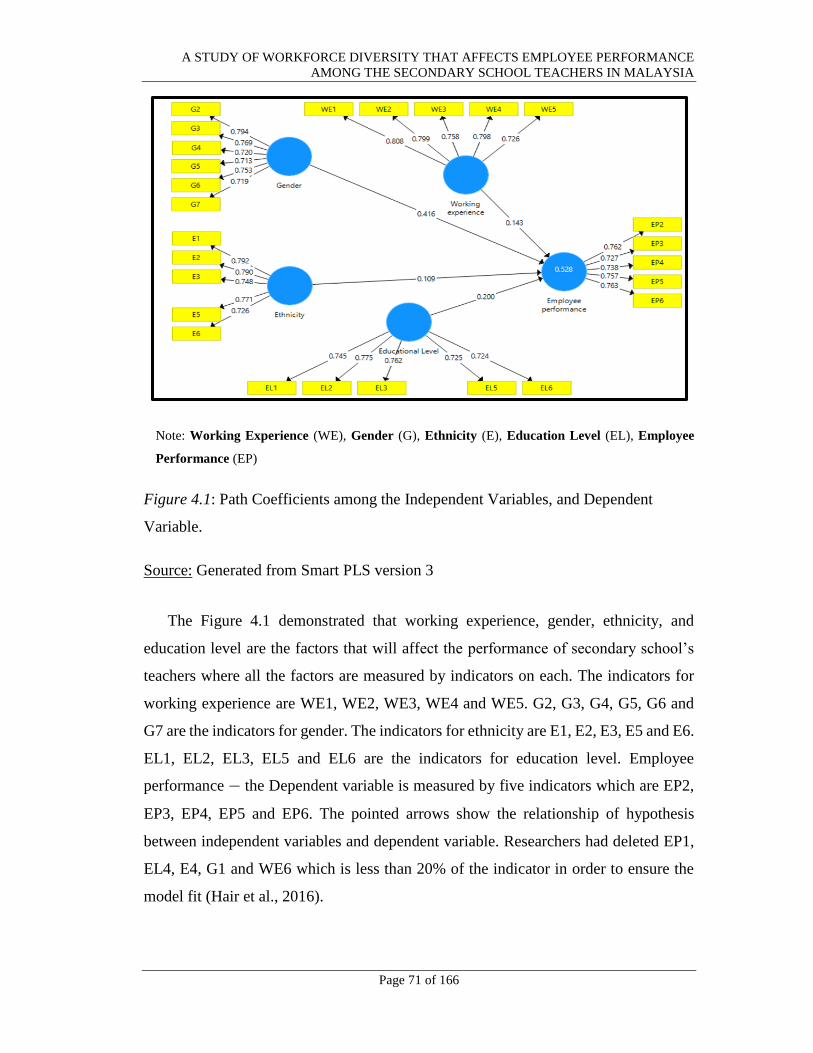
A STUDY OF WORKFORCE DIVERSITY THAT AFFECTS EMPLOYEE PERFORMANCE
AMONG THE SECONDARY SCHOOL TEACHERS IN MALAYSIA
Page 71 of 166
Note: Working Experience (WE), Gender (G), Ethnicity (E), Education Level (EL), Employee
Performance (EP)
Figure 4.1: Path Coefficients among the Independent Variables, and Dependent
Variable.
Source: Generated from Smart PLS version 3
The Figure 4.1 demonstrated that working experience, gender, ethnicity, and
education level are the factors that will affect the performance of secondary school’s
teachers where all the factors are measured by indicators on each. The indicators for
working experience are WE1, WE2, WE3, WE4 and WE5. G2, G3, G4, G5, G6 and
G7 are the indicators for gender. The indicators for ethnicity are E1, E2, E3, E5 and E6.
EL1, EL2, EL3, EL5 and EL6 are the indicators for education level. Employee
performance — the Dependent variable is measured by five indicators which are EP2,
EP3, EP4, EP5 and EP6. The pointed arrows show the relationship of hypothesis
between independent variables and dependent variable. Researchers had deleted EP1,
EL4, E4, G1 and WE6 which is less than 20% of the indicator in order to ensure the
model fit (Hair et al., 2016).
A STUDY OF WORKFORCE DIVERSITY THAT AFFECTS EMPLOYEE PERFORMANCE
AMONG THE SECONDARY SCHOOL TEACHERS IN MALAYSIA
Page 72 of 166
4.3 Measurement Model
To ensure that the measurement model is appropriate for the research, it is
necessary to check on the measurement model before running the hypothesis test. This
helps researchers in enhancing the reliability and accuracy on the results produced by
the measurement model. Validity and precision if the result is the major reason that
researchers need measurement model analysis, which brings influence directly to the
fundamental theoretical constructs.
4.3.1 Testing Outer Model (Measurement Model)
The Outer Assessment Model includes three more measurements which are
Convergent Validity, Discriminant Validity and Composite Reliability (Latan,
Hengky, Ramli & Nur Ainna, 2013). From the Figure 4.1, it shows the full
structural equation model to assess outer Smart PLS models by using version 3.
Table 4.3
Reliability of Construct
No Items Loadings rho_A Composite
Reliability
Average
Variance
Extracted (AVE)
VIF
1 E1 0.792 0.824 0.876 0.586 1.763
2 E2 0.79 1.785
3 E3 0.747 1.561
4 E5 0.771 1.706
5 E6 0.726 1.522
6 EL1 0.745 0.804 0.863 0.557 1.587
7 EL2 0.775 1.596
8 EL3 0.762 1.661
9 EL5 0.725 1.533
10 EL6 0.725 1.496
11 EP4 0.738 0.806 0.865 0.562 1.529
12 EP5 0.757 1.618
13 EP6 0.763 1.591
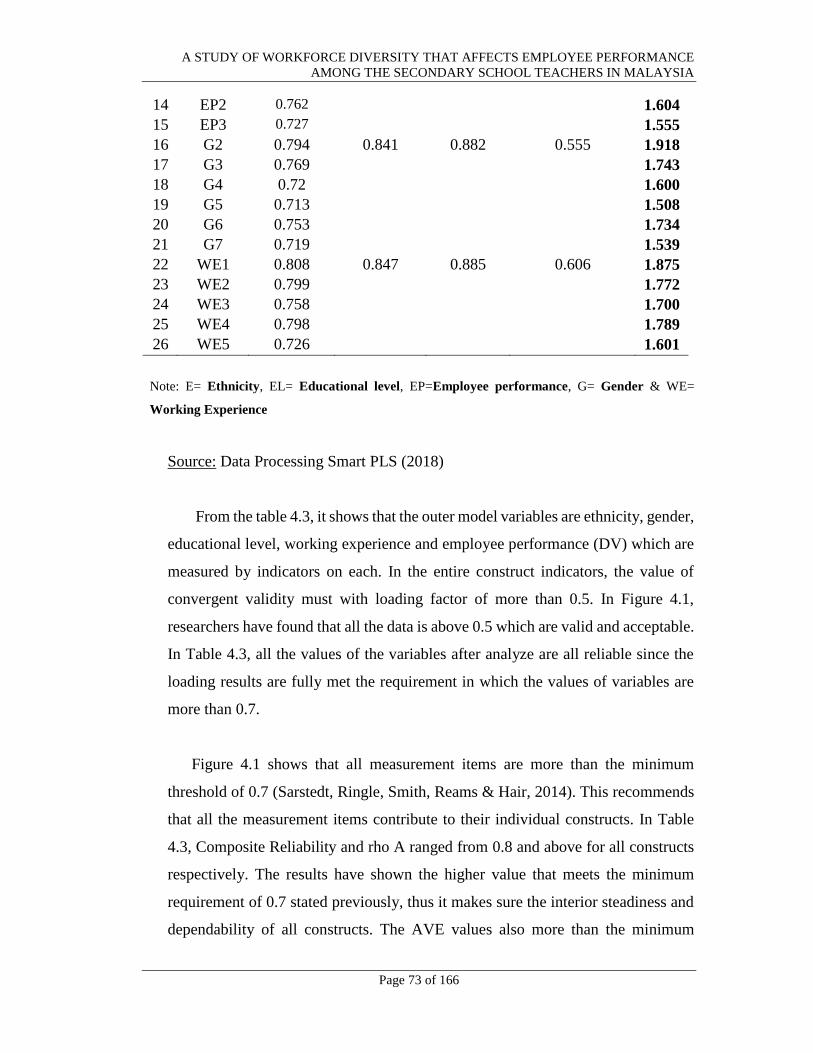
A STUDY OF WORKFORCE DIVERSITY THAT AFFECTS EMPLOYEE PERFORMANCE
AMONG THE SECONDARY SCHOOL TEACHERS IN MALAYSIA
Page 73 of 166
14 EP2 0.762 1.604
15 EP3 0.727 1.555
16 G2 0.794 0.841 0.882 0.555 1.918
17 G3 0.769 1.743
18 G4 0.72 1.600
19 G5 0.713 1.508
20 G6 0.753 1.734
21 G7 0.719 1.539
22 WE1 0.808 0.847 0.885 0.606 1.875
23 WE2 0.799 1.772
24 WE3 0.758 1.700
25 WE4 0.798 1.789
26 WE5 0.726 1.601
Note: E= Ethnicity, EL= Educational level, EP=Employee performance, G= Gender & WE=
Working Experience
Source: Data Processing Smart PLS (2018)
From the table 4.3, it shows that the outer model variables are ethnicity, gender,
educational level, working experience and employee performance (DV) which are
measured by indicators on each. In the entire construct indicators, the value of
convergent validity must with loading factor of more than 0.5. In Figure 4.1,
researchers have found that all the data is above 0.5 which are valid and acceptable.
In Table 4.3, all the values of the variables after analyze are all reliable since the
loading results are fully met the requirement in which the values of variables are
more than 0.7.
Figure 4.1 shows that all measurement items are more than the minimum
threshold of 0.7 (Sarstedt, Ringle, Smith, Reams & Hair, 2014). This recommends
that all the measurement items contribute to their individual constructs. In Table
4.3, Composite Reliability and rho A ranged from 0.8 and above for all constructs
respectively. The results have shown the higher value that meets the minimum
requirement of 0.7 stated previously, thus it makes sure the interior steadiness and
dependability of all constructs. The AVE values also more than the minimum
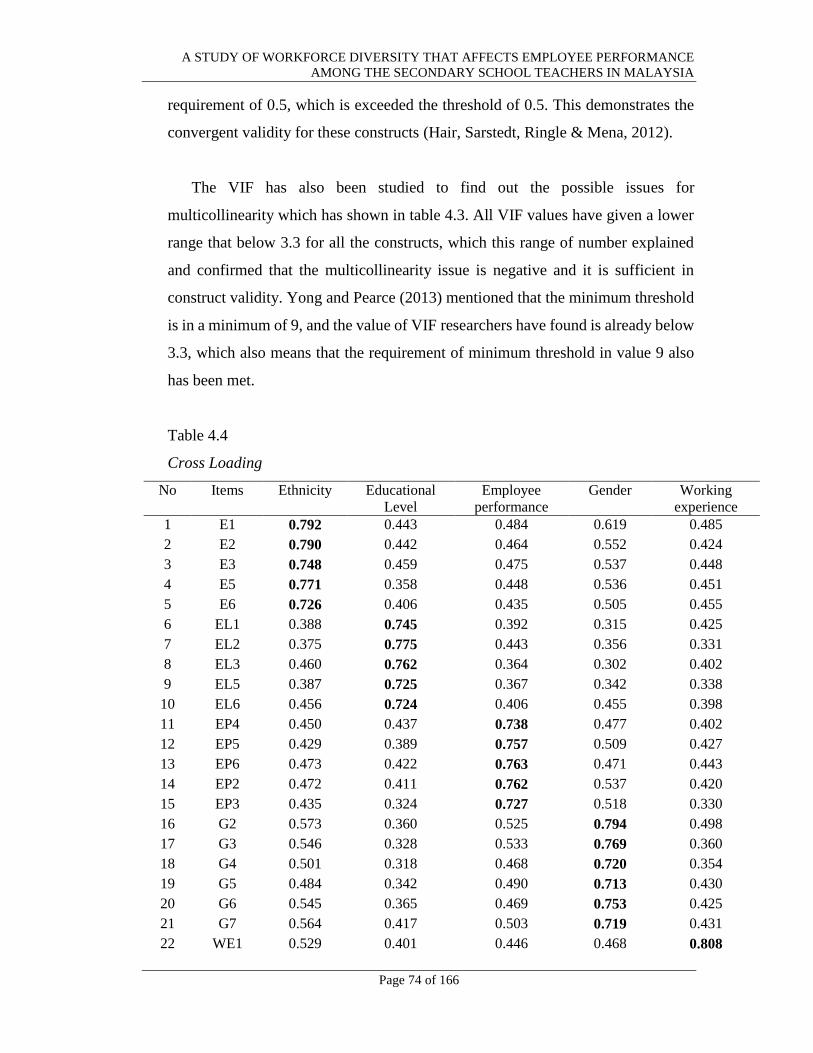
A STUDY OF WORKFORCE DIVERSITY THAT AFFECTS EMPLOYEE PERFORMANCE
AMONG THE SECONDARY SCHOOL TEACHERS IN MALAYSIA
Page 74 of 166
requirement of 0.5, which is exceeded the threshold of 0.5. This demonstrates the
convergent validity for these constructs (Hair, Sarstedt, Ringle & Mena, 2012).
The VIF has also been studied to find out the possible issues for
multicollinearity which has shown in table 4.3. All VIF values have given a lower
range that below 3.3 for all the constructs, which this range of number explained
and confirmed that the multicollinearity issue is negative and it is sufficient in
construct validity. Yong and Pearce (2013) mentioned that the minimum threshold
is in a minimum of 9, and the value of VIF researchers have found is already below
3.3, which also means that the requirement of minimum threshold in value 9 also
has been met.
Table 4.4
Cross Loading
No Items Ethnicity Educational
Level
Employee
performance
Gender Working
experience
1 E1 0.792 0.443 0.484 0.619 0.485
2 E2 0.790 0.442 0.464 0.552 0.424
3 E3 0.748 0.459 0.475 0.537 0.448
4 E5 0.771 0.358 0.448 0.536 0.451
5 E6 0.726 0.406 0.435 0.505 0.455
6 EL1 0.388 0.745 0.392 0.315 0.425
7 EL2 0.375 0.775 0.443 0.356 0.331
8 EL3 0.460 0.762 0.364 0.302 0.402
9 EL5 0.387 0.725 0.367 0.342 0.338
10 EL6 0.456 0.724 0.406 0.455 0.398
11 EP4 0.450 0.437 0.738 0.477 0.402
12 EP5 0.429 0.389 0.757 0.509 0.427
13 EP6 0.473 0.422 0.763 0.471 0.443
14 EP2 0.472 0.411 0.762 0.537 0.420
15 EP3 0.435 0.324 0.727 0.518 0.330
16 G2 0.573 0.360 0.525 0.794 0.498
17 G3 0.546 0.328 0.533 0.769 0.360
18 G4 0.501 0.318 0.468 0.720 0.354
19 G5 0.484 0.342 0.490 0.713 0.430
20 G6 0.545 0.365 0.469 0.753 0.425
21 G7 0.564 0.417 0.503 0.719 0.431
22 WE1 0.529 0.401 0.446 0.468 0.808
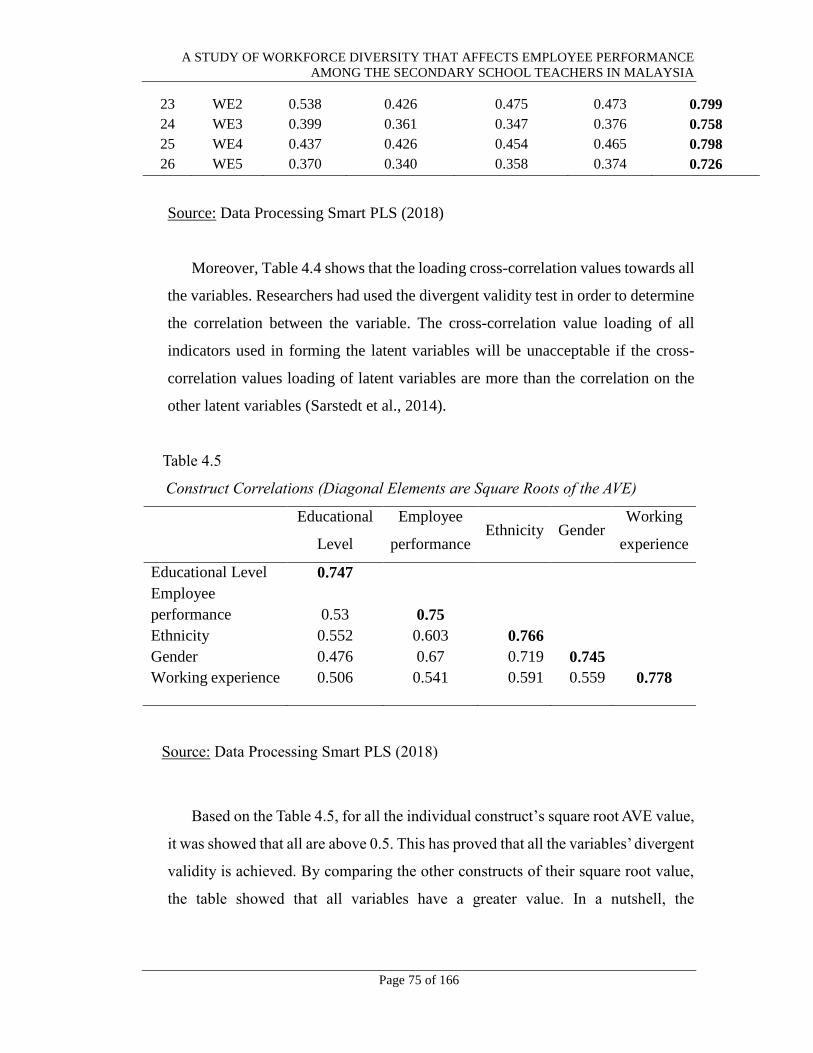
A STUDY OF WORKFORCE DIVERSITY THAT AFFECTS EMPLOYEE PERFORMANCE
AMONG THE SECONDARY SCHOOL TEACHERS IN MALAYSIA
Page 75 of 166
23 WE2 0.538 0.426 0.475 0.473 0.799
24 WE3 0.399 0.361 0.347 0.376 0.758
25 WE4 0.437 0.426 0.454 0.465 0.798
26 WE5 0.370 0.340 0.358 0.374 0.726
Source: Data Processing Smart PLS (2018)
Moreover, Table 4.4 shows that the loading cross-correlation values towards all
the variables. Researchers had used the divergent validity test in order to determine
the correlation between the variable. The cross-correlation value loading of all
indicators used in forming the latent variables will be unacceptable if the cross-
correlation values loading of latent variables are more than the correlation on the
other latent variables (Sarstedt et al., 2014).
Table 4.5
Construct Correlations (Diagonal Elements are Square Roots of the AVE)
Educational
Level
Employee
performance Ethnicity Gender
Working
experience
Educational Level 0.747
Employee
performance 0.53 0.75
Ethnicity 0.552 0.603 0.766
Gender 0.476 0.67 0.719 0.745
Working experience 0.506 0.541 0.591 0.559 0.778
Source: Data Processing Smart PLS (2018)
Based on the Table 4.5, for all the individual construct’s square root AVE value,
it was showed that all are above 0.5. This has proved that all the variables’ divergent
validity is achieved. By comparing the other constructs of their square root value,
the table showed that all variables have a greater value. In a nutshell, the
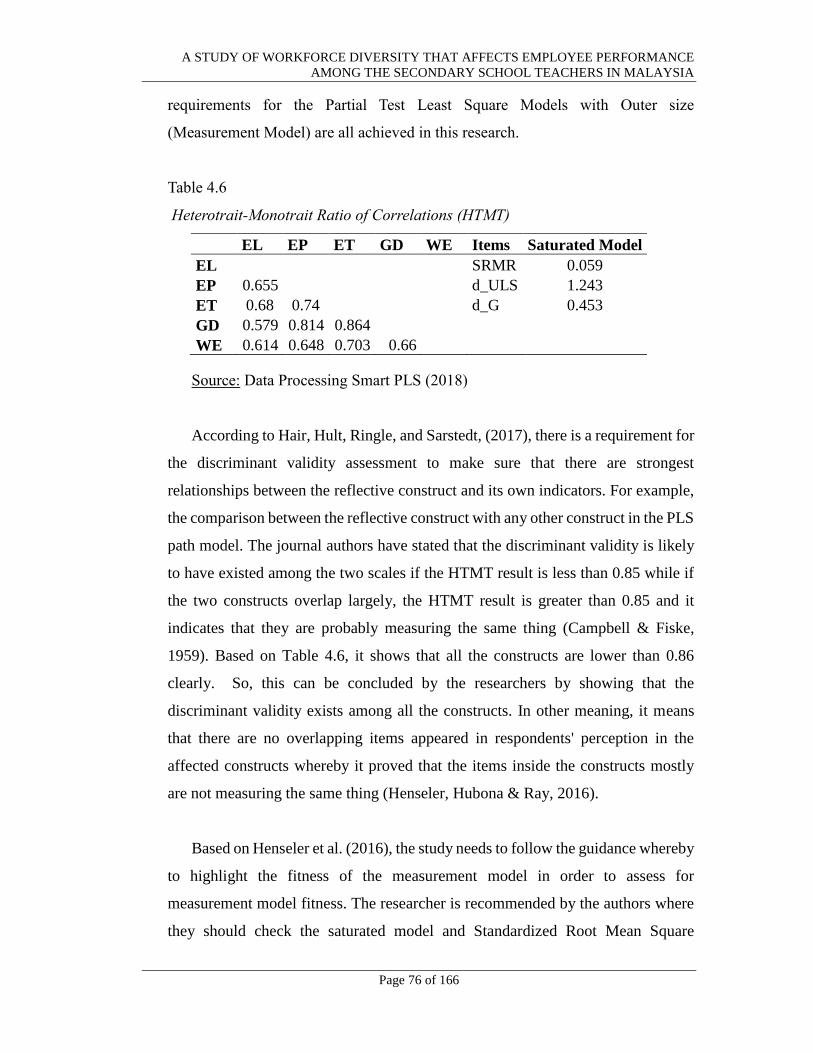
A STUDY OF WORKFORCE DIVERSITY THAT AFFECTS EMPLOYEE PERFORMANCE
AMONG THE SECONDARY SCHOOL TEACHERS IN MALAYSIA
Page 76 of 166
requirements for the Partial Test Least Square Models with Outer size
(Measurement Model) are all achieved in this research.
Table 4.6
Heterotrait-Monotrait Ratio of Correlations (HTMT)
EL EP ET GD WE Items Saturated Model
EL SRMR 0.059
EP 0.655 d_ULS 1.243
ET 0.68 0.74 d_G 0.453
GD 0.579 0.814 0.864
WE 0.614 0.648 0.703 0.66
Source: Data Processing Smart PLS (2018)
According to Hair, Hult, Ringle, and Sarstedt, (2017), there is a requirement for
the discriminant validity assessment to make sure that there are strongest
relationships between the reflective construct and its own indicators. For example,
the comparison between the reflective construct with any other construct in the PLS
path model. The journal authors have stated that the discriminant validity is likely
to have existed among the two scales if the HTMT result is less than 0.85 while if
the two constructs overlap largely, the HTMT result is greater than 0.85 and it
indicates that they are probably measuring the same thing (Campbell & Fiske,
1959). Based on Table 4.6, it shows that all the constructs are lower than 0.86
clearly. So, this can be concluded by the researchers by showing that the
discriminant validity exists among all the constructs. In other meaning, it means
that there are no overlapping items appeared in respondents' perception in the
affected constructs whereby it proved that the items inside the constructs mostly
are not measuring the same thing (Henseler, Hubona & Ray, 2016).
Based on Henseler et al. (2016), the study needs to follow the guidance whereby
to highlight the fitness of the measurement model in order to assess for
measurement model fitness. The researcher is recommended by the authors where
they should check the saturated model and Standardized Root Mean Square
A STUDY OF WORKFORCE DIVERSITY THAT AFFECTS EMPLOYEE PERFORMANCE
AMONG THE SECONDARY SCHOOL TEACHERS IN MALAYSIA
Page 77 of 166
Residual (SRMR) to make it's under 95% bootstrap quantile. SRMR was advocated
by the authors also whereby it is the most appropriate approximate model fit
criterion in order to be applied in PLS path modelling. In addition, based on Dijkstra
and Henseler (2015), they stated that it's more than one way to quantify the
discrepancy between two matrices whereby to relate to the dG and the dULS which
are the distance measures and these two measures also have been accentuated in
order to contribute to model fitness index in PLS (Henseler et al., 2016). The dG
and the dULS were showed in Table 4.6 where the numbers are 0.453 and 1.243
respectively. From here, researchers can see that there's an indication to show it's a
well-fitting measurement model (Dijkstra et al., 2015). In addition, the SRMR is
0.059 where it follows to the theory that stated by (Hu & Bentler, 1999) which is
SRMR is below the cut-off of 0.08 and implied that the measurement model fits
this study.
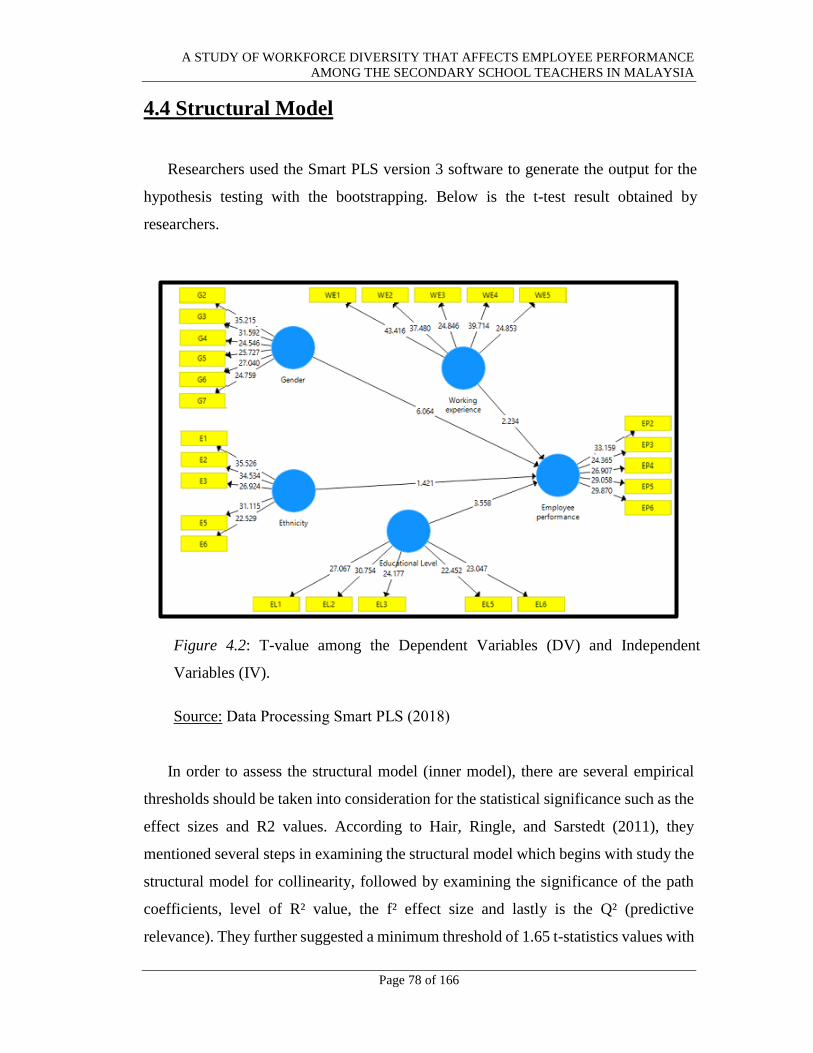
A STUDY OF WORKFORCE DIVERSITY THAT AFFECTS EMPLOYEE PERFORMANCE
AMONG THE SECONDARY SCHOOL TEACHERS IN MALAYSIA
Page 78 of 166
4.4 Structural Model
Researchers used the Smart PLS version 3 software to generate the output for the
hypothesis testing with the bootstrapping. Below is the t-test result obtained by
researchers.
Figure 4.2: T-value among the Dependent Variables (DV) and Independent
Variables (IV).
Source: Data Processing Smart PLS (2018)
In order to assess the structural model (inner model), there are several empirical
thresholds should be taken into consideration for the statistical significance such as the
effect sizes and R2 values. According to Hair, Ringle, and Sarstedt (2011), they
mentioned several steps in examining the structural model which begins with study the
structural model for collinearity, followed by examining the significance of the path
coefficients, level of R² value, the f² effect size and lastly is the Q² (predictive
relevance). They further suggested a minimum threshold of 1.65 t-statistics values with
A STUDY OF WORKFORCE DIVERSITY THAT AFFECTS EMPLOYEE PERFORMANCE
AMONG THE SECONDARY SCHOOL TEACHERS IN MALAYSIA
Page 79 of 166
a p ≤ 0.1 of confidence interval.
As stated by Henseler and Fassott (2010), the interpretation of effect sizes values
is 0.02 (small), 0.15 (medium) and 0.35 (large) respectively which is based on the
benchmarks recommended by Cohen (1988). Hair, Hult, Ringle, and Sarstedt (2014)
also stated that as a relative measure of predictive relevance, the small, medium and
large predictive relevance are indicated by 0.02, 0.15 and 0.35 respectively. Based on
the result, researchers have generated the value of 0.276 for Q²,
indicating moderate prediction power.
R-squared (R²) is a statistic that indicates the number of variances accounted for
within the relationship between two or more variables and it also used to identify the
coefficient for determination in the dependent constructs. Therefore, according to Ali,
Sun, and Ali (2017), they emphasized that R² values for the endogenous constructs can
be read as 0.75 (substantial), 0.50 (moderate) and 0.25 (weak). However, Chin (1998)
said that R² value of 0.67 is substantial, 0.33 is moderate and 0.19 is weak.
Hair et al. (2014) asserted that the consistent PLS bootstrapping option was initiated
to use 5000 subsamples in order to achieve the significance levels. Thus, based on these
studies, the R² for researchers' study is moderate (0.528) as per Table 4.7. It indicated
a substantial model where the R² value of 0.528 is greater than 0.26 as suggested by
Cohen (1988). Next, researchers ought to understand on the F square (Effect size) so
as to know about the power of this model as it would determine a good model for the
researchers. By referring to the table below, researchers could identify that secondary
school teachers in Malaysia have a medium effect size. In short, researchers' model had
met the requirement of the Structural Model by referring to the measurement
requirement of Structural Model.
Table 4.7 shows all the hypothesis explicit down from H1 to H4, and within the
table, it conjointly contains the T-statistics value for every hypothesis. When the
hypothesis is significant, the t-value is more than 1.645 at p<0.05, t-value more than
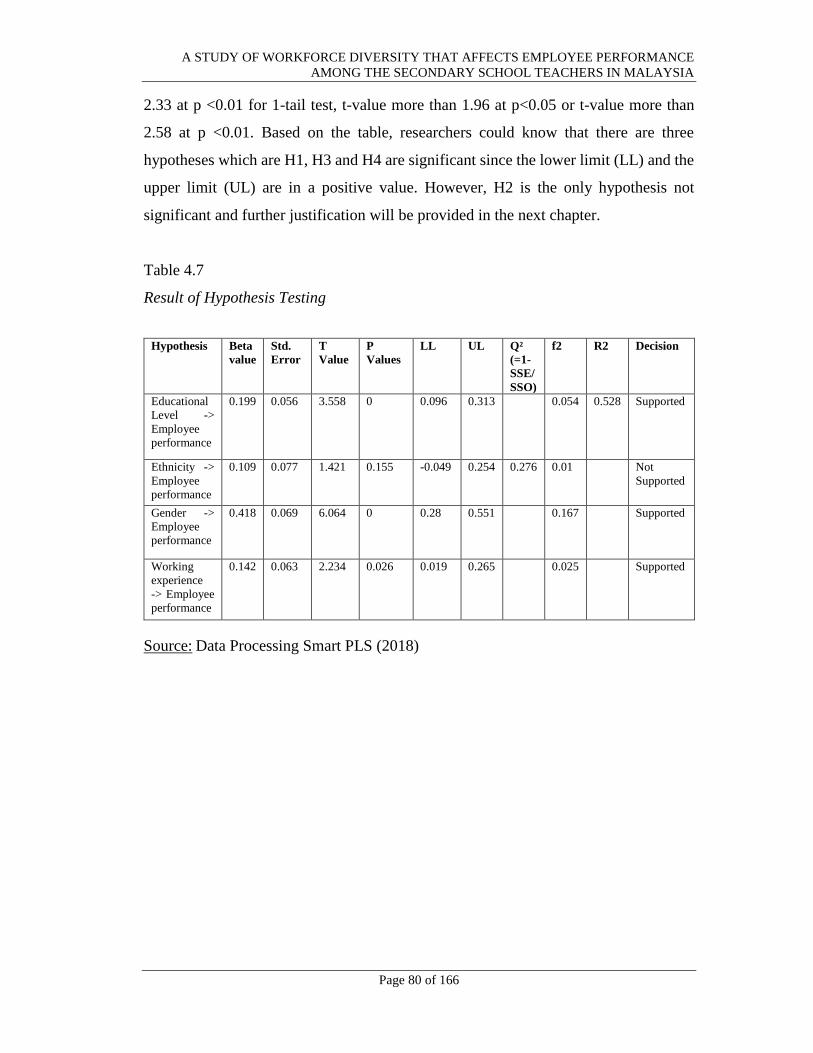
A STUDY OF WORKFORCE DIVERSITY THAT AFFECTS EMPLOYEE PERFORMANCE
AMONG THE SECONDARY SCHOOL TEACHERS IN MALAYSIA
Page 80 of 166
2.33 at p <0.01 for 1-tail test, t-value more than 1.96 at p<0.05 or t-value more than
2.58 at p <0.01. Based on the table, researchers could know that there are three
hypotheses which are H1, H3 and H4 are significant since the lower limit (LL) and the
upper limit (UL) are in a positive value. However, H2 is the only hypothesis not
significant and further justification will be provided in the next chapter.
Table 4.7
Result of Hypothesis Testing
Source: Data Processing Smart PLS (2018)
Hypothesis Beta
value
Std.
Error
T
Value
P
Values
LL UL Q²
(=1-
SSE/
SSO)
f2 R2 Decision
Educational
Level ->
Employee
performance
0.199 0.056 3.558 0 0.096 0.313 0.054 0.528 Supported
Ethnicity ->
Employee
performance
0.109 0.077 1.421 0.155 -0.049 0.254 0.276 0.01 Not
Supported
Gender ->
Employee
performance
0.418 0.069 6.064 0 0.28 0.551 0.167 Supported
Working
experience
-> Employee
performance
0.142 0.063 2.234 0.026 0.019 0.265 0.025 Supported
A STUDY OF WORKFORCE DIVERSITY THAT AFFECTS EMPLOYEE PERFORMANCE
AMONG THE SECONDARY SCHOOL TEACHERS IN MALAYSIA
Page 81 of 166
4.5 Conclusion
In this chapter, researchers had used several types of analysis and test such as
Normality and Multicollinearity analysis for this research study in order to observe the
collected data from questionnaire. By referring to the results done in this chapter,
researchers had determined there are three supported hypotheses which are H1, H3 and
H4, and two hypotheses are not supported which are H2 and H5. Therefore, researchers
can have a further discussion in view of the analysis outcome and the result
interpretation in this research study. For the next chapter, researchers will discuss the
limitation of this research study, provide some recommendation and make a conclusion
on this study.
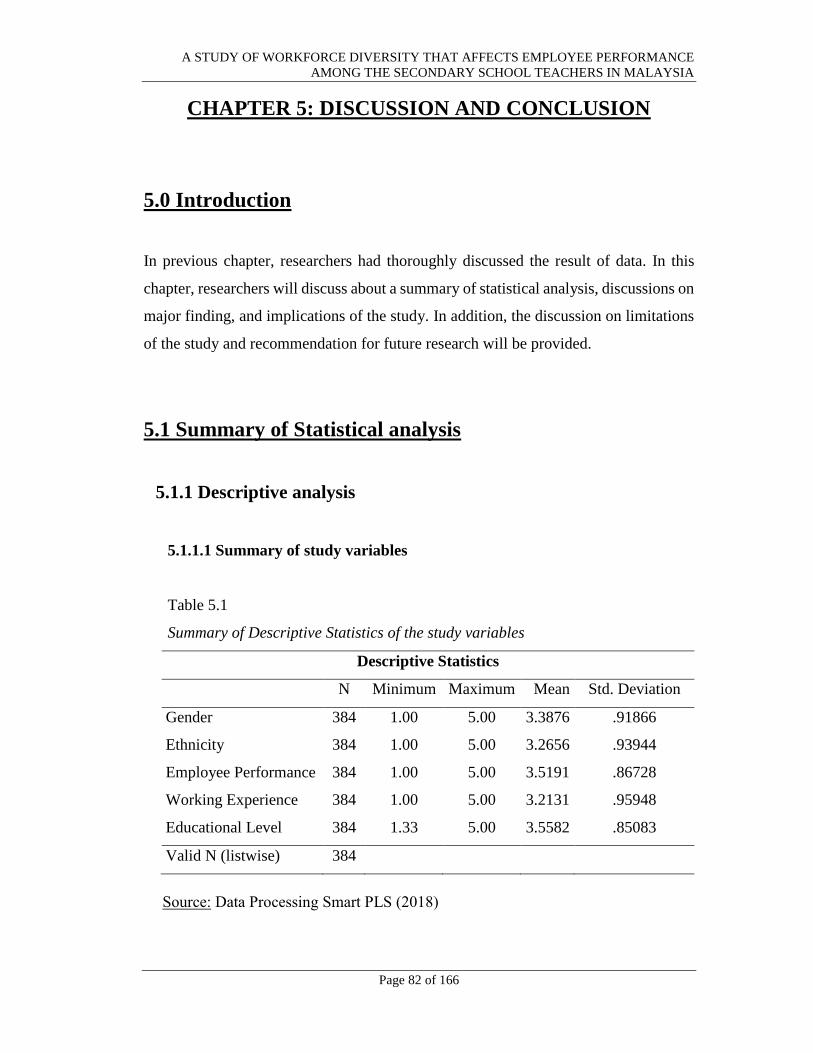
A STUDY OF WORKFORCE DIVERSITY THAT AFFECTS EMPLOYEE PERFORMANCE
AMONG THE SECONDARY SCHOOL TEACHERS IN MALAYSIA
Page 82 of 166
CHAPTER 5: DISCUSSION AND CONCLUSION
5.0 Introduction
In previous chapter, researchers had thoroughly discussed the result of data. In this
chapter, researchers will discuss about a summary of statistical analysis, discussions on
major finding, and implications of the study. In addition, the discussion on limitations
of the study and recommendation for future research will be provided.
5.1 Summary of Statistical analysis
5.1.1 Descriptive analysis
5.1.1.1 Summary of study variables
Table 5.1
Summary of Descriptive Statistics of the study variables
Descriptive Statistics
N Minimum Maximum Mean Std. Deviation
Gender 384 1.00 5.00 3.3876 .91866
Ethnicity 384 1.00 5.00 3.2656 .93944
Employee Performance 384 1.00 5.00 3.5191 .86728
Working Experience 384 1.00 5.00 3.2131 .95948
Educational Level 384 1.33 5.00 3.5582 .85083
Valid N (listwise) 384
Source: Data Processing Smart PLS (2018)
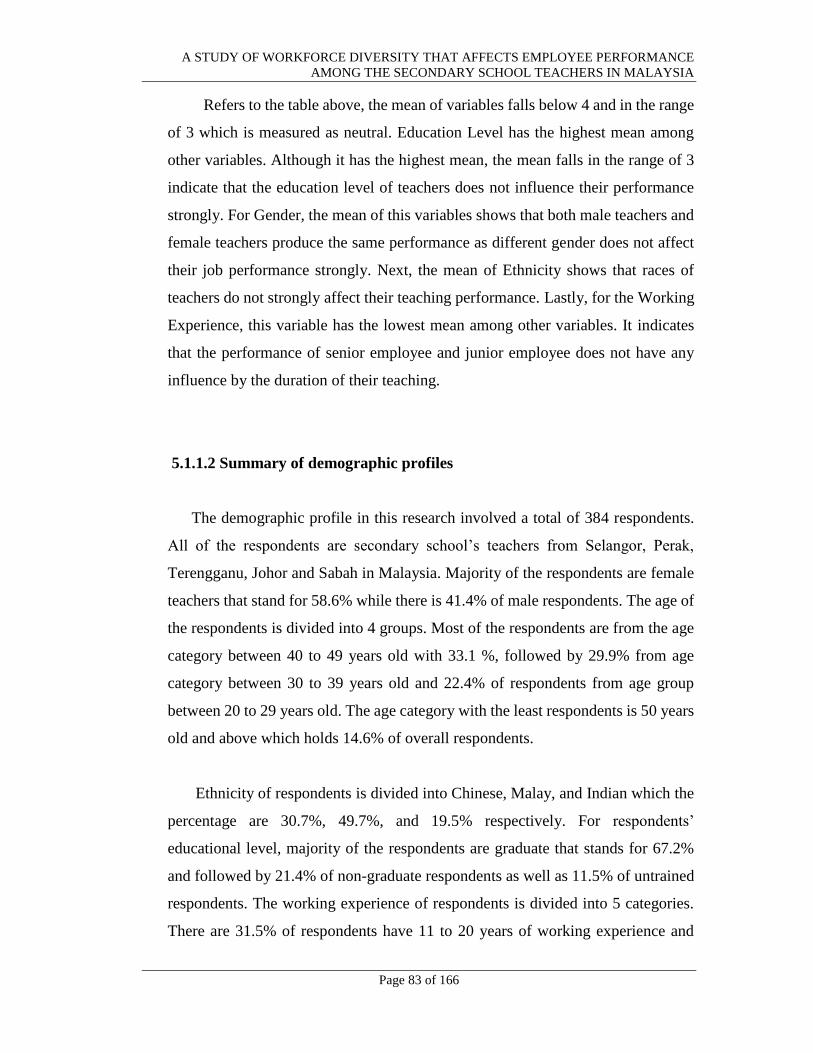
A STUDY OF WORKFORCE DIVERSITY THAT AFFECTS EMPLOYEE PERFORMANCE
AMONG THE SECONDARY SCHOOL TEACHERS IN MALAYSIA
Page 83 of 166
Refers to the table above, the mean of variables falls below 4 and in the range
of 3 which is measured as neutral. Education Level has the highest mean among
other variables. Although it has the highest mean, the mean falls in the range of 3
indicate that the education level of teachers does not influence their performance
strongly. For Gender, the mean of this variables shows that both male teachers and
female teachers produce the same performance as different gender does not affect
their job performance strongly. Next, the mean of Ethnicity shows that races of
teachers do not strongly affect their teaching performance. Lastly, for the Working
Experience, this variable has the lowest mean among other variables. It indicates
that the performance of senior employee and junior employee does not have any
influence by the duration of their teaching.
5.1.1.2 Summary of demographic profiles
The demographic profile in this research involved a total of 384 respondents.
All of the respondents are secondary school’s teachers from Selangor, Perak,
Terengganu, Johor and Sabah in Malaysia. Majority of the respondents are female
teachers that stand for 58.6% while there is 41.4% of male respondents. The age of
the respondents is divided into 4 groups. Most of the respondents are from the age
category between 40 to 49 years old with 33.1 %, followed by 29.9% from age
category between 30 to 39 years old and 22.4% of respondents from age group
between 20 to 29 years old. The age category with the least respondents is 50 years
old and above which holds 14.6% of overall respondents.
Ethnicity of respondents is divided into Chinese, Malay, and Indian which the
percentage are 30.7%, 49.7%, and 19.5% respectively. For respondents’
educational level, majority of the respondents are graduate that stands for 67.2%
and followed by 21.4% of non-graduate respondents as well as 11.5% of untrained
respondents. The working experience of respondents is divided into 5 categories.
There are 31.5% of respondents have 11 to 20 years of working experience and
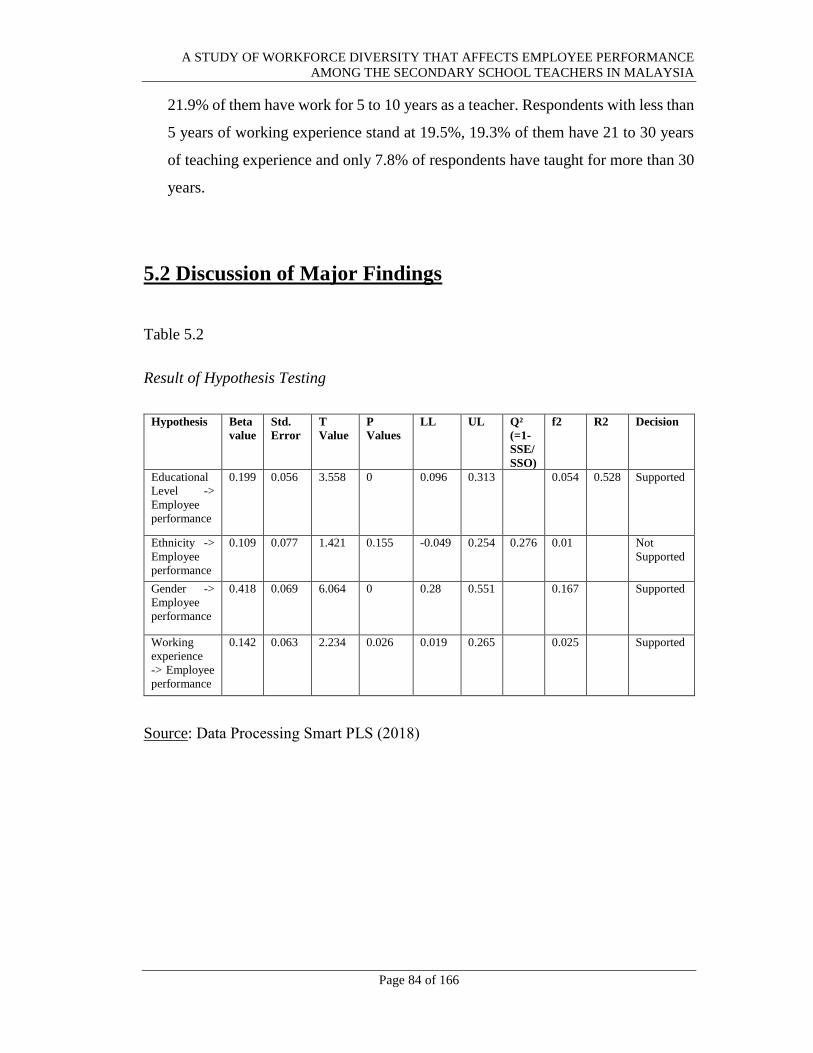
A STUDY OF WORKFORCE DIVERSITY THAT AFFECTS EMPLOYEE PERFORMANCE
AMONG THE SECONDARY SCHOOL TEACHERS IN MALAYSIA
Page 84 of 166
21.9% of them have work for 5 to 10 years as a teacher. Respondents with less than
5 years of working experience stand at 19.5%, 19.3% of them have 21 to 30 years
of teaching experience and only 7.8% of respondents have taught for more than 30
years.
5.2 Discussion of Major Findings
Table 5.2
Result of Hypothesis Testing
Source: Data Processing Smart PLS (2018)
Hypothesis Beta
value
Std.
Error
T
Value
P
Values
LL UL Q²
(=1-
SSE/
SSO)
f2 R2 Decision
Educational
Level ->
Employee
performance
0.199 0.056 3.558 0 0.096 0.313 0.054 0.528 Supported
Ethnicity ->
Employee
performance
0.109 0.077 1.421 0.155 -0.049 0.254 0.276 0.01 Not
Supported
Gender ->
Employee
performance
0.418 0.069 6.064 0 0.28 0.551 0.167 Supported
Working
experience
-> Employee
performance
0.142 0.063 2.234 0.026 0.019 0.265 0.025 Supported
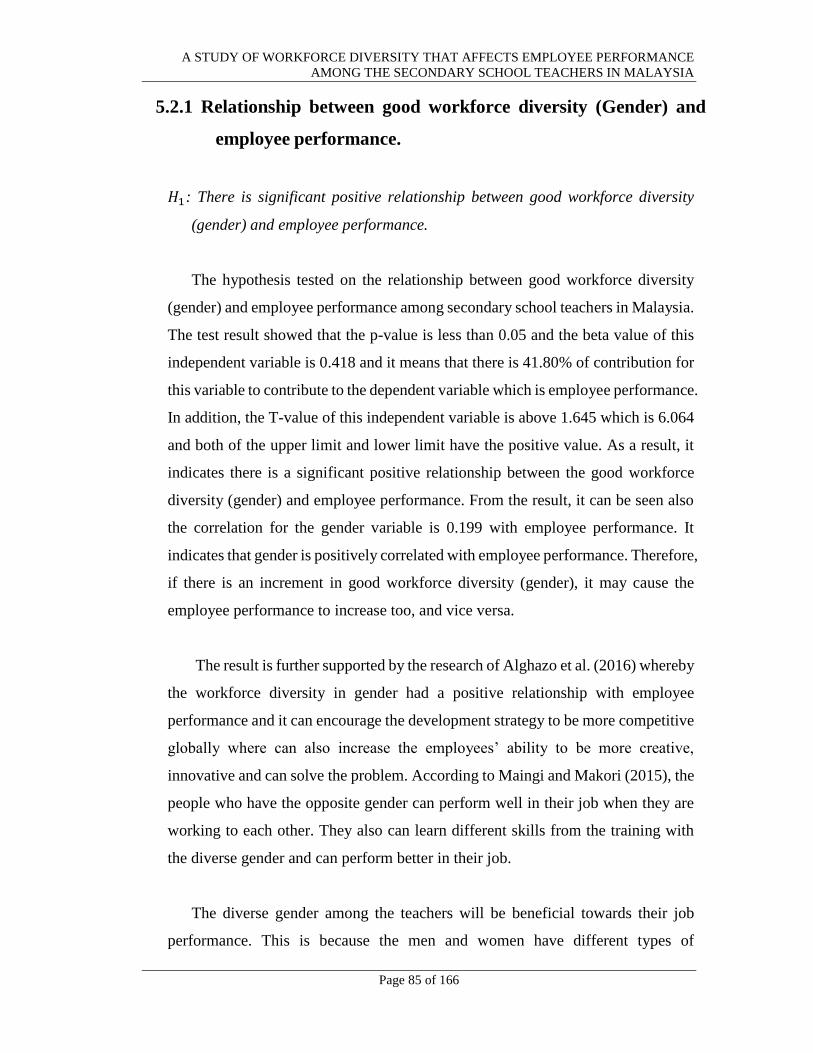
A STUDY OF WORKFORCE DIVERSITY THAT AFFECTS EMPLOYEE PERFORMANCE
AMONG THE SECONDARY SCHOOL TEACHERS IN MALAYSIA
Page 85 of 166
5.2.1 Relationship between good workforce diversity (Gender) and
employee performance.
𝐻1: There is significant positive relationship between good workforce diversity
(gender) and employee performance.
The hypothesis tested on the relationship between good workforce diversity
(gender) and employee performance among secondary school teachers in Malaysia.
The test result showed that the p-value is less than 0.05 and the beta value of this
independent variable is 0.418 and it means that there is 41.80% of contribution for
this variable to contribute to the dependent variable which is employee performance.
In addition, the T-value of this independent variable is above 1.645 which is 6.064
and both of the upper limit and lower limit have the positive value. As a result, it
indicates there is a significant positive relationship between the good workforce
diversity (gender) and employee performance. From the result, it can be seen also
the correlation for the gender variable is 0.199 with employee performance. It
indicates that gender is positively correlated with employee performance. Therefore,
if there is an increment in good workforce diversity (gender), it may cause the
employee performance to increase too, and vice versa.
The result is further supported by the research of Alghazo et al. (2016) whereby
the workforce diversity in gender had a positive relationship with employee
performance and it can encourage the development strategy to be more competitive
globally where can also increase the employees’ ability to be more creative,
innovative and can solve the problem. According to Maingi and Makori (2015), the
people who have the opposite gender can perform well in their job when they are
working to each other. They also can learn different skills from the training with
the diverse gender and can perform better in their job.
The diverse gender among the teachers will be beneficial towards their job
performance. This is because the men and women have different types of
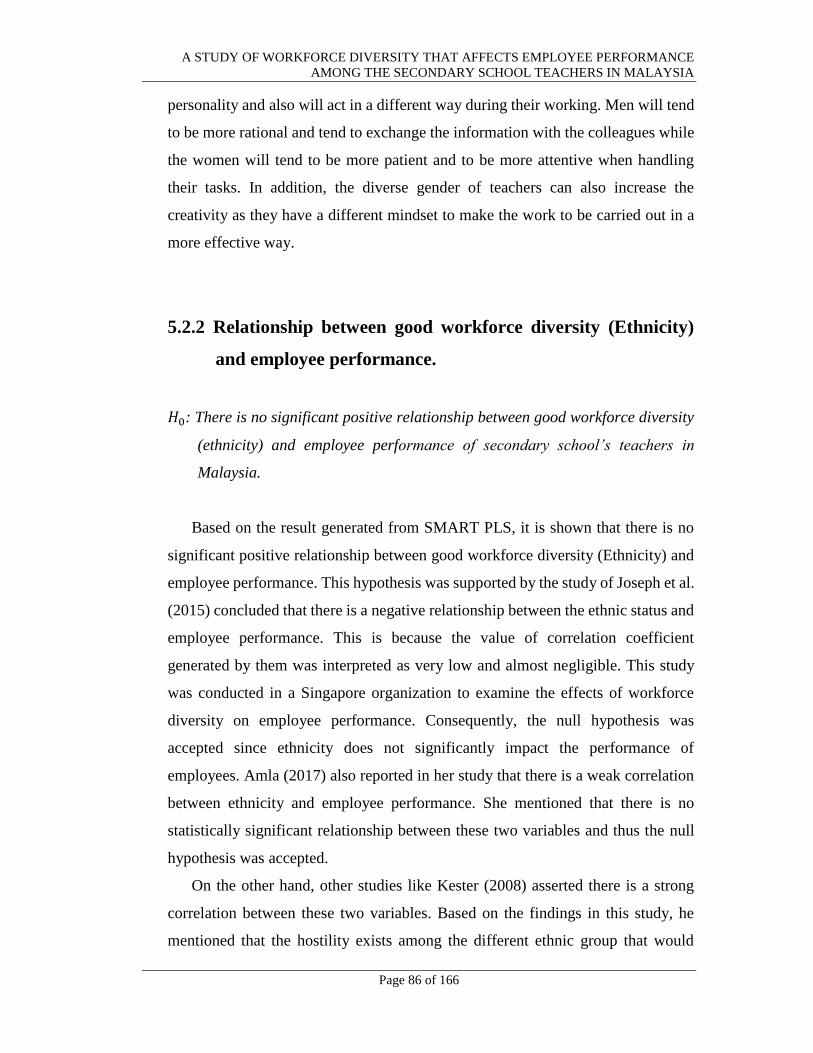
A STUDY OF WORKFORCE DIVERSITY THAT AFFECTS EMPLOYEE PERFORMANCE
AMONG THE SECONDARY SCHOOL TEACHERS IN MALAYSIA
Page 86 of 166
personality and also will act in a different way during their working. Men will tend
to be more rational and tend to exchange the information with the colleagues while
the women will tend to be more patient and to be more attentive when handling
their tasks. In addition, the diverse gender of teachers can also increase the
creativity as they have a different mindset to make the work to be carried out in a
more effective way.
5.2.2 Relationship between good workforce diversity (Ethnicity)
and employee performance.
𝐻0: There is no significant positive relationship between good workforce diversity
(ethnicity) and employee performance of secondary school’s teachers in
Malaysia.
Based on the result generated from SMART PLS, it is shown that there is no
significant positive relationship between good workforce diversity (Ethnicity) and
employee performance. This hypothesis was supported by the study of Joseph et al.
(2015) concluded that there is a negative relationship between the ethnic status and
employee performance. This is because the value of correlation coefficient
generated by them was interpreted as very low and almost negligible. This study
was conducted in a Singapore organization to examine the effects of workforce
diversity on employee performance. Consequently, the null hypothesis was
accepted since ethnicity does not significantly impact the performance of
employees. Amla (2017) also reported in her study that there is a weak correlation
between ethnicity and employee performance. She mentioned that there is no
statistically significant relationship between these two variables and thus the null
hypothesis was accepted.
On the other hand, other studies like Kester (2008) asserted there is a strong
correlation between these two variables. Based on the findings in this study, he
mentioned that the hostility exists among the different ethnic group that would
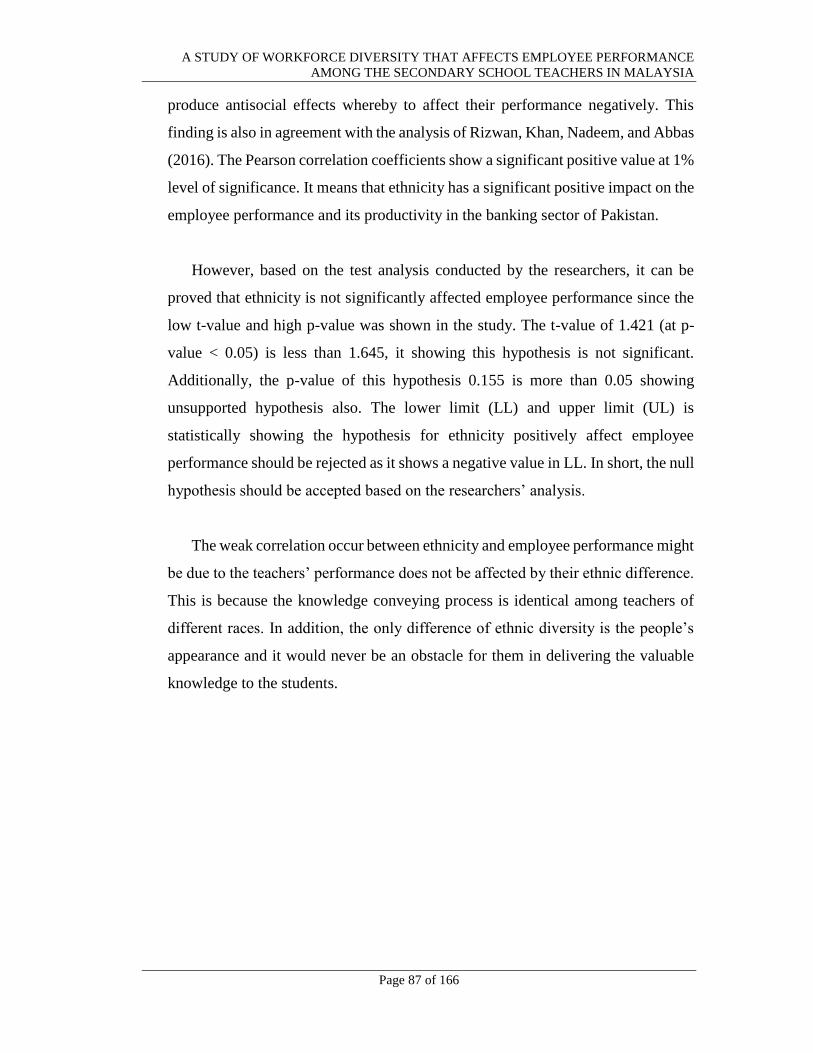
A STUDY OF WORKFORCE DIVERSITY THAT AFFECTS EMPLOYEE PERFORMANCE
AMONG THE SECONDARY SCHOOL TEACHERS IN MALAYSIA
Page 87 of 166
produce antisocial effects whereby to affect their performance negatively. This
finding is also in agreement with the analysis of Rizwan, Khan, Nadeem, and Abbas
(2016). The Pearson correlation coefficients show a significant positive value at 1%
level of significance. It means that ethnicity has a significant positive impact on the
employee performance and its productivity in the banking sector of Pakistan.
However, based on the test analysis conducted by the researchers, it can be
proved that ethnicity is not significantly affected employee performance since the
low t-value and high p-value was shown in the study. The t-value of 1.421 (at p-
value < 0.05) is less than 1.645, it showing this hypothesis is not significant.
Additionally, the p-value of this hypothesis 0.155 is more than 0.05 showing
unsupported hypothesis also. The lower limit (LL) and upper limit (UL) is
statistically showing the hypothesis for ethnicity positively affect employee
performance should be rejected as it shows a negative value in LL. In short, the null
hypothesis should be accepted based on the researchers’ analysis.
The weak correlation occur between ethnicity and employee performance might
be due to the teachers’ performance does not be affected by their ethnic difference.
This is because the knowledge conveying process is identical among teachers of
different races. In addition, the only difference of ethnic diversity is the people’s
appearance and it would never be an obstacle for them in delivering the valuable
knowledge to the students.
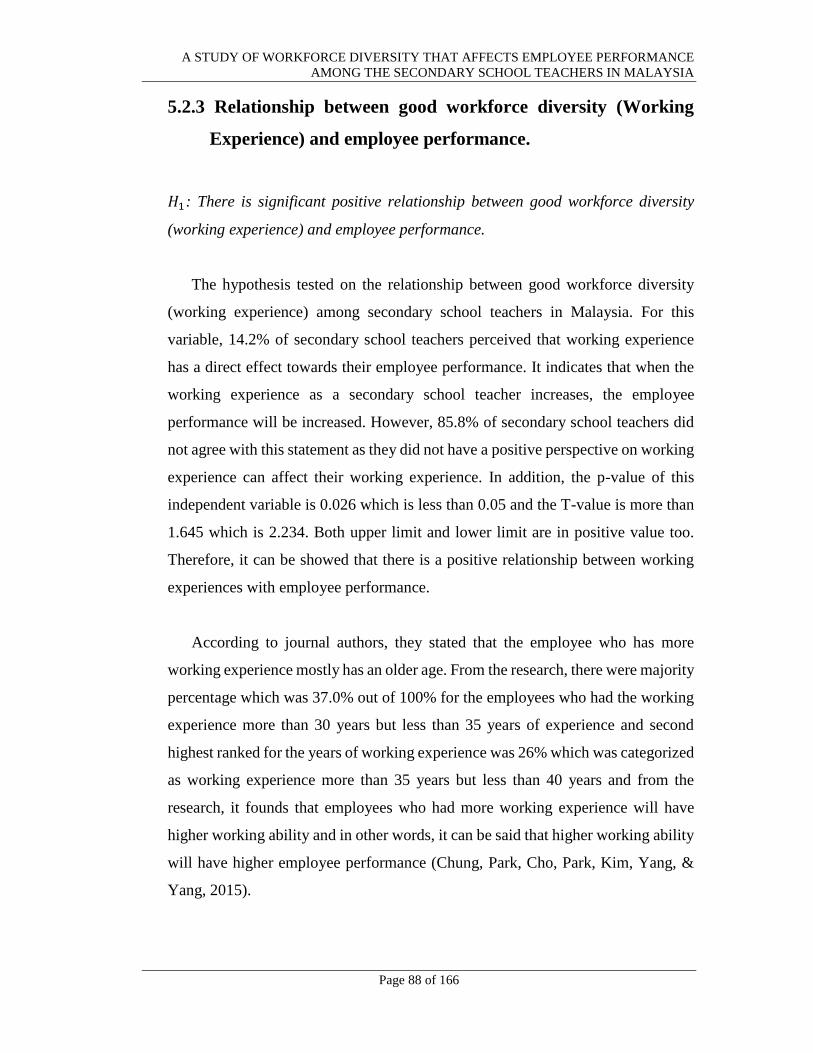
A STUDY OF WORKFORCE DIVERSITY THAT AFFECTS EMPLOYEE PERFORMANCE
AMONG THE SECONDARY SCHOOL TEACHERS IN MALAYSIA
Page 88 of 166
5.2.3 Relationship between good workforce diversity (Working
Experience) and employee performance.
𝐻1: There is significant positive relationship between good workforce diversity
(working experience) and employee performance.
The hypothesis tested on the relationship between good workforce diversity
(working experience) among secondary school teachers in Malaysia. For this
variable, 14.2% of secondary school teachers perceived that working experience
has a direct effect towards their employee performance. It indicates that when the
working experience as a secondary school teacher increases, the employee
performance will be increased. However, 85.8% of secondary school teachers did
not agree with this statement as they did not have a positive perspective on working
experience can affect their working experience. In addition, the p-value of this
independent variable is 0.026 which is less than 0.05 and the T-value is more than
1.645 which is 2.234. Both upper limit and lower limit are in positive value too.
Therefore, it can be showed that there is a positive relationship between working
experiences with employee performance.
According to journal authors, they stated that the employee who has more
working experience mostly has an older age. From the research, there were majority
percentage which was 37.0% out of 100% for the employees who had the working
experience more than 30 years but less than 35 years of experience and second
highest ranked for the years of working experience was 26% which was categorized
as working experience more than 35 years but less than 40 years and from the
research, it founds that employees who had more working experience will have
higher working ability and in other words, it can be said that higher working ability
will have higher employee performance (Chung, Park, Cho, Park, Kim, Yang, &
Yang, 2015).
A STUDY OF WORKFORCE DIVERSITY THAT AFFECTS EMPLOYEE PERFORMANCE
AMONG THE SECONDARY SCHOOL TEACHERS IN MALAYSIA
Page 89 of 166
According to Kotur et al. (2014), the study has shown the richer the working
experience will increase the employee performance. Where for the first 20 years of
working lifetime, the employee performance increases gradually. However, after
20 years of working experience, the employee performance decreases as it can be
caused by the boredom of doing the same routine and lack of new task content and
challenges throughout the years. But, this study still proved that higher working
experience will promote better employee performance. Hence, from the previous
study, it can be strengthened more that 𝐻1 is supported whereby there is a
significant positive relationship between working experience and employee
performance.
The working experience for a teacher’s teaching life is very important. This is
because the more experience gained by the teacher, the more skilful the teacher can
handle his or her job. The teachers always need to attend the courses and training
in order to update themselves with the latest information from time to time such as
giving the training to teach the PT3 (Penilaian Tingkatan 3) and SPM students
especially PT3 is a newly introduced system to replace the PMR (Penilaian
Menengah Rendah). So, the experienced teachers are very important in order to
adapt to the changes in a faster way and use their experience of teaching skills to
guide the newly entered teachers.
5.2.4 Relationship between good workforce diversity (Educational
Level) and employee performance.
𝐻1: There is significant positive relationship between good workforce diversity
(educational level) and employee performance.
The result shows that the workforce diversity of educational level has positive
relationship towards employee performance. According to the result of research
carried out by researchers, the hypothesis p-values 0.026 is less than the 0.05 which
A STUDY OF WORKFORCE DIVERSITY THAT AFFECTS EMPLOYEE PERFORMANCE
AMONG THE SECONDARY SCHOOL TEACHERS IN MALAYSIA
Page 90 of 166
explain that this hypothesis is supported. Next, Beta value is at 0.199 represent the
contribution of educational level towards employee performance. Other than this,
T-value is higher than the minimum threshold at 3.558 which explain the supportive
to the hypothesis. Moreover, the lower limit (LL) and upper limit (UL) show
positive value at 0.019 and 0.265 respectively which also strengthened that the
𝐻1 is fully supported.
Based on the finding, educational level is supported in this study because the
educational level is important in the academic aspect and teaching field. The
educational level might not contribute much to other industry. Yet, in the education
industry, knowledge and educational level is the basic requirement for the
workforce as their role is to teach and deliver knowledge to the students. The
workforce who has diverse knowledge and educational level are capable of
providing extra knowledge and suitable theory examples without just focus only in
textbooks context.
Diverse knowledge enhances the creativity in teaching skills by making the
lessons more vivid and interesting towards the students since they have a deeper
understanding in the academic. Other than that, diversity of education level and
knowledge brings the variety of thoughts, which helps teachers to have a better
digestion in the secondary school’s academic content. This helps the teachers have
a different perspective and variety of ways to deliver knowledge to the students
which avoid students learning rigidly from the textbooks. Therefore, educational
level has significant relationship towards the teacher’s performance which it helps
in performance improvement for teachers and also students.
According to Goldhaber and Hansen (2010), the educationally significant effect
on the distribution of teacher workforce quality and performance. Based on Ng et
al. (2009) researched, they found support through the study towards education level
is positively related to task performance. Which explained that the better the
educational level, the better the job performance. Highly educated workers are
A STUDY OF WORKFORCE DIVERSITY THAT AFFECTS EMPLOYEE PERFORMANCE
AMONG THE SECONDARY SCHOOL TEACHERS IN MALAYSIA
Page 91 of 166
likely to contribute more effective work. Moreover, educational level can enhance
cognitive ability, higher-order thinking and relevant knowledge which all of these
factors improve and strengthen the job performance.
Ololube, Major, and Kpolovie (2006) said that training and education is a need
to offer teachers a better chance to develop themselves to become more effective
which could result in a better job performance. The respondent in Ololube’s
research supported that education is important in job’s effectiveness and job
performance. Next, in order to perform well, education development for workers
are needed. In the researcher findings, teachers with higher academic qualification
are more effective than teachers who have lower education qualification. Higher
academic qualification is a part of improves work production.
5.3 Implication of the Study
Implication of the study is the management implications of the independent
variables and dependent variable.
5.3.1 Managerial Implications
The managerial implication highlights the relationship between the dependent
variable (job performance) with all the independent variables which are gender,
ethnicity, education level and working experience.
First, gender is one of the factors that can influence the job performance of
teachers due to their physical and psychological differences. The difference
between the genders of teachers may affect the student academic performance
because the female teachers play a significant role in enhancing the performance of
female student while male teachers can enhance the performance of male students.
A STUDY OF WORKFORCE DIVERSITY THAT AFFECTS EMPLOYEE PERFORMANCE
AMONG THE SECONDARY SCHOOL TEACHERS IN MALAYSIA
Page 92 of 166
The communication between student and teacher was shaped by the gender of
teacher and the teachers are the gender role model where the students would try to
imitate their behaviour. The performance of male and female employee might
difference because of the discrepancy between their skills, talent, and beliefs. Thus,
the gender of teachers will improve the student performance.
Next, educational quality is related to the secondary school attainment. The
secondary school should concern on the education level of teachers. The teacher
job performance is the outcome of the achievement of the school which affected by
education quality delivered by the teachers. The education of teachers has powerful
impact on the student achievement. The teacher has more effective performance
when they have qualified criteria and has been certified in the specific field that
they are expert in. The teacher who pursues higher education has positively
improved their performance and student achievement. There is a significant
relationship between educational level and job performance because the teacher
who is higher graduated has higher level of confidence to perform their job well.
Moreover, secondary school should concern the working experience of teacher
since the work experience is significant to the job performance. The senior
employees are more motivated to get a good performance compare to the new
recruits. The employee who has work experience was preferred because they can
perform better with their knowledge and experience. The elder or experienced
individuals possess the unique and professional knowledge, and this experience
will make the person perform better. There is a correlation between work
experience and job performance in which the correlation is higher for the teacher
who has more than 5 years of experience.
Therefore, the independent variables which are gender, educational level, and
working experience have a significant correlation with job performance in
secondary school of Malaysia. The high level of job performance can be attained
by the workforce diversity in gender, educational level, and working experience.
A STUDY OF WORKFORCE DIVERSITY THAT AFFECTS EMPLOYEE PERFORMANCE
AMONG THE SECONDARY SCHOOL TEACHERS IN MALAYSIA
Page 93 of 166
So that, the secondary school in Malaysia should increase their effort to ensure the
workforce diversity in the aspect of gender, educational level, and working
experience to improve job performance among teachers. The result refers
significant implication to secondary school to become better in the future where
high level of performance among teachers of secondary schools is being placed.
The result of working experience was the highest among four variables. The
practitioners and policymakers need to pay more attention and focus on it.
Based on the job performance of the employee, the practitioners or
policymakers can provide recognition and rewards to the employees who make
more contributions. The rewards can be financial or non-financial like bonus or
offer more holidays in order to increase their motivation. Thus, the employees are
more motivated to perform better their job and task.
According to Malaysia Employment Act 1955, the heavy penalty can be
charged to any organizations if the unfairness has occurred. The unfairness included
unfair distribution of wages among employees and did not reach the minimal labour
laws on salary (“Malaysia Employment Act 1955”, 2012). All of the unfairness can
negatively affect the job performance of the employee.
In addition, the secondary school can introduce the training program for
employees to enhance their performance. The training program should be related
to the job scope of the employee. It can increase the employees’ capabilities and
confidence to perform their task. The secondary school should place the right
person in the right position. They should make sure the particular employee has the
ability and competency to complete the task assigned.
Lastly, the career opportunity like promotion should be provided to the
employees. When the employees got an opportunity to work at a higher position
and get a higher salary, it can motivate them to improve their job performance.
A STUDY OF WORKFORCE DIVERSITY THAT AFFECTS EMPLOYEE PERFORMANCE
AMONG THE SECONDARY SCHOOL TEACHERS IN MALAYSIA
Page 94 of 166
5.4 Limitation of the Study
There are a few of problems faced by the researchers during conducting this
research. Those limitations have causes researches to spend extra time completing the
research study. Furthermore, researches have to exert more efforts on examining the
study to prevent the result of the study get affected.
5.4.1 Respondents’ Involvement
This limitation affects the result of this research study significantly. Due to
some respondents are too busy with their teaching and administration activities,
they might not be providing the accurate answers for this research study as the
survey does not bring any benefits to them and they just wanted to complete the
questionnaire quickly to continue their works.
Besides, the willingness of the respondent to complete the questionnaire survey
is low. Some of the questionnaires distributed to secondary schools were unable to
retrieve as some respondents were refused to answer the questionnaire due to the
anxiety if their information provided would be exposed easily and misused.
5.4.2 Time Constraints
Researchers used additional time to complete this study due to researchers need
to apply an approval letter from the Ministry of Education Malaysia (MOE) before
the questionnaire survey is able to be conducted in secondary school. Researchers
still need to apply approval letter from Jabatan Pendidikan Negeri (JPN) Selangor
and Perak after received the approval letter from MOE. Every researcher who
wishes to conduct a survey in government schools are require to go through this
A STUDY OF WORKFORCE DIVERSITY THAT AFFECTS EMPLOYEE PERFORMANCE
AMONG THE SECONDARY SCHOOL TEACHERS IN MALAYSIA
Page 95 of 166
process because the Ministry of Education wants to ensure the research study and
questionnaire that are going to be conducted did not discuss any sensitive issues.
In addition, researchers only have 22 weeks to carry through this research study.
This is a big obstacle for researchers since extra time is needed to analyze the data
in order to obtain a more accurate data. As researchers are unfamiliar with using
SPSS and PLS software, researchers require to spend additional time learning to
function both software from professional.
5.4.3 Cost Constraints
This is another limitation that faced by researchers where the SPSS and PLS
software needed to run and analyze data are costly. Users are required to pay and
buy the software in order use the software. As researchers only use SPSS and PLS
software for this study, researchers seek for help from another lecturer who is expert
in using this two software to borrow the software in order to run the analysis on
data. Moreover, the researchers also had to undertake all the printing and other
administrative fees by own.
5.4.4 Region Constraints
This limitation has become the major problem encountered by researchers in
this study. Due to the airfare to East Malaysia is expensive, researchers could not
afford the cost of airfare to distribute the questionnaire to respondents in Sabah and
Sarawak. In addition, the cost of traveling to every state in Peninsular Malaysia for
questionnaire conducting is costly and time-consuming. Therefore, researchers
have only chosen to conduct questionnaire survey in two nearby states which is
Perak and Selangor as the education policy of the secondary school is the same in
every state.
A STUDY OF WORKFORCE DIVERSITY THAT AFFECTS EMPLOYEE PERFORMANCE
AMONG THE SECONDARY SCHOOL TEACHERS IN MALAYSIA
Page 96 of 166
5.5 Recommendations for Future Research
Based on this study, the hypothesis was to study the effect of workforce diversity
that affects employee performance among the secondary school teachers in Malaysia.
However, there are a few recommendations for the future research related to this study.
5.5.1 Multi-Language and simplify questionnaire
The limitations of the study mentioned that the involvement of respondent to
take part in questionnaire survey is less. There are some of the respondents might
not understand well the questions in the questionnaire as there are different races
of respondents. Researchers only designed English and Malay version of
questionnaire for this research study. Thus, multiple languages such as Tamil and
Chinese can be consisted in the questionnaire to ease the respondents from different
races in understanding the questions. In addition, future researchers are
recommended to simplify the questions in the questionnaire. The questions should
not be too complicated or profound to prevent any misunderstanding. This could
improve the reliability of the result as the respondents can fully understand the
question and provide a more accurate answer.
5.5.2 Coverage in other industries
Researchers conducted this research to study the relationship between
workforce diversity and employee performance. Hence, researchers can carry out
the effect of workforce diversity affecting employee performance in the other
industries in the future. The researches that carry out in diverse industry areas could
provide distinct responses. This could help other researchers to collect a more
precise and reliable data.
A STUDY OF WORKFORCE DIVERSITY THAT AFFECTS EMPLOYEE PERFORMANCE
AMONG THE SECONDARY SCHOOL TEACHERS IN MALAYSIA
Page 97 of 166
5.5.3 Exploration of different variables
The variables used in this research study were gender, ethnicity, education level
and working experience. Researchers can select the other variables that are suitable
and relevant to their area or industries of research rather than using the stated
variables in this study. Hence, the research conducted is able to obtain a more
reliable and accurate data.
5.6 Conclusion
From this study, there is a better understanding of the workforce diversity that
influences the job performance among secondary school teachers in Malaysia.
According to the Multiple Linear Regression Analysis, gender has the highest
contribution to job performance while ethnicity has the lowest contribution within the
four independent variables. All the independent variables are significant except the
ethnicity which is not significant. In conclusion, the limitation and recommendation
discussed in this study provide a guideline for future researchers to conduct a similar
research.
A STUDY OF WORKFORCE DIVERSITY THAT AFFECTS EMPLOYEE PERFORMANCE
AMONG THE SECONDARY SCHOOL TEACHERS IN MALAYSIA
Page 98 of 166
REFERENCES
Adebisi, O., Samuel, A., & Oyeniyi, J. D. (2015). Influence of Teacher’s Gender on
Secondary School Students’ Performance in Physics in Ekiti State, Nigeria.
International Journal of Innovative Research & Development, 4(1), 72–77.
Retrieved from www.ijird.com
Akiri, A. A., & Ugborugbo, N. M. (2008). An Examination of Gender’s Influence on
Teachers’ Productivity. Gender and Teachers' productivity, 185-190.
Alghazo, A. M., & Shaiban, H. M. Al. (2016). The Effects of Workforce Diversity on
Employee Performance at an Oil and The Effects of Workforce Diversity on
Employee Performance at an Oil and Gas Company. American Journal of
Business and Society, 1(January), 148–153. Retrieved from
https://www.researchgate.net/publication/310585592_The_Effects_of_Workf
orce_Diversity_on_Employee_Performance_at_an_Oil_and_Gas_Company
Ali, Z., Sun, H., & Ali, M. (2017). The Impact of Managerial and Adaptive Capabilities
to Stimulate Organizational Innovation in SMEs : A Complementary PLS –
SEM Approach. https://doi.org/10.3390/su9122157
Amaram, D. I. (2007). Cultural Diversity: Implications For Workplace Management.
Journal of Diversity Management – Fourth Quarter 2007, 2(4), 341–352.
Retrieved from
file:///C:/Users/asus/Downloads/Cultural_Diversity_Implications_For_Workpl
ace_Mana.pdf
Amin, M., Shah, R. U., Ayaz, M., & Atta, M. A. (2013). Teachers’ Job Performance at
Secondary Level In Khyber Pakhyunkhwa, Pakistan. Gomal University Journal
of Research, 29(2), 100-104. Retrieved from
http://www.gu.edu.pk/new/GUJR/PDF/Dec-2013/13-
Rahmat%20Ullah%20Shah.pdf
Amla, M. (2017). Workforce Diversity and Its Impact on Employee Performance: A
Study on Textile Industry. Imperial Journal of Interdisciplinary Research
(IJIR), 3(1), 1443–1449.
Anbazhagan, S., & Kotur, B. R. (2014). Worker Productivity, Leadership Style
Relationship. IOSR Journal of Business and Management, 16(8), iv, 62-70.
doi:10.9790/487x-16846270
A STUDY OF WORKFORCE DIVERSITY THAT AFFECTS EMPLOYEE PERFORMANCE
AMONG THE SECONDARY SCHOOL TEACHERS IN MALAYSIA
Page 99 of 166
Andersen, L. (2011). Teacher diversity: Do male and female teachers have different
self-efficacy and job satisfaction. 33rd EGPA Conference in Bucharest,
(September 2011), 1–17. Retrieved from
http://soc.kuleuven.be/io/egpa/HRM/bucharest/Andersen2011.pdf
Anwar, B., Xiao, Z., Fiaz, M., Ikram, A., & Younas, M. (2017). Are Leaders’
Personality Traits Imperative For Employees’ Job Performance? The Context
Of An Emerging Economy. Journal of Applied Business Research
(JABR), 33(5), 1013. doi:10.19030/jabr.v33i5.10023
Appelbaum, S. H., Kryvenko, O., Rodriguez Parada, M., Soochan, M. R., & Shapiro,
B. T. (2015). Racial-ethnic diversity in Canada: competitive edge or corporate
encumbrance? Part One. Industrial and Commercial Training, 47(6), 302–309.
https://doi.org/10.1108/ICT-03-2014-0012
Arif, Z. M. (2017 , March 16). SPM 2016: 707 Perak Candidates Score Straight As,
Down from 2015. Retrieved from New Straits Times:
https://www.nst.com.my/news/2017/03/221269/spm-2016-707-perak-
candidates-score-straight-down-2015
Asif, I., Fakhra, A., Tahir, F., & Shabbir, A. (2016). Relationship between Teachers’
Job Satisfaction and Students’ Academic Performance. Eurasian Journal of
Educational Research, (65), 335–344. Retrieved from
http://dx.doi.org/10.14689/ejer.2016.65.19
Aslam, M., & Hassan, A. A. (2003). Development Planning and Regional Imbalances
In Malaysia. FEA Working Paper, 1-5.
Atikah, Q. (2018, February 21). No truth to 17,000 failing SPM history subject.
Retrieved from New Straits Times:
https://www.nst.com.my/news/nation/2018/02/337614/no-truth-17000-failing-
spm-history-subject
Aulakh, S.P. & Kotabe, M. (1997). Antecedents And Performance Implications Of
Channel Integration In Foreign Markets. Journal of International Business
Studies, 28(1), 145–175.
https://doi.org/https://doi.org/10.1057/palgrave.jibs.8490096
Banerjee, N. (2013). Effects of teacher diversity and student-teacher racial/ethnic
matching in elementary schools on educational outcomes. Retrieved from
http://libres.uncg.edu/ir/uncc/f/Banerjee_uncc_0694D_10499.pdf
A STUDY OF WORKFORCE DIVERSITY THAT AFFECTS EMPLOYEE PERFORMANCE
AMONG THE SECONDARY SCHOOL TEACHERS IN MALAYSIA
Page 100 of 166
Bedi, P., Lakra, P., & Gupta, E. (2014). Workforce Diversity Management: Biggest
Challenge or Opportunity For 21st Century Organizations. IOSR Journal of
Business and Management Ver. III, 16(4), 102–107.
https://doi.org/10.9790/487x-1643102107
Burns, A. C., Veeck, A. F., & Bush, R. F. (2016). Marketing Research, Eighth Edition.
Pearson.
Campbell, D. T., Fiske, D. W. (1959). Convergent And Discriminant Validation By
The Multitrait-Multimethod Matrix. Psychological Bulletin, 56(2), 81–105.
https://doi.org/http://psycnet.apa.org/doi/10.1037/h0046016
Chin, W. W. (1998). The partial least squares approach for structural equation
modeling. In G. A. Marcoulides (Ed.), Methodology for business and
management. Modern methods for business research (pp. 295-336). Mahwah,
NJ, US: Lawrence Erlbaum Associates Publishers.
Choudhary, P. (2017, February 14). Introduction to Anomaly Detection. Retrieved from
https://www.datascience.com/blog/python-anomaly-detection
Christopher, C., Anthony, N., & Ekanem, I. E. (2012). Teacher Gender and the
Academic Performance of Children in Primary Schools in Uyo Metropolis,
Akwa Ibom State, Nigeria. Journal of Educational and Social Research, 2(1),
267–274. https://doi.org/10.5901/jesr.2012.02.01.267
Chung, J.C., Park, J.Y., Cho, M.L., Park, Y.H., Kim, D.J., Yang, D.J. & Yang, Y. G.
(2015). A study on the relationships between age, work experience, cognition,
and work ability in older employees working in heavy industry. Journal of
Physical Theoretical Science, 27, 155–157.
https://doi.org/https://dx.doi.org/10.1589%2Fjpts.27.155
Cizek, G. J. (1995). On the Limited Presence of African American Teachers: An
Assessment of Research, Synthesis, and Policy Implications. Review of
Educational Research, 65(1), 78–92.
https://doi.org/10.3102/00346543065001078
Cohen, J. (1988), Statistical Power Analysis for the Behavioral Sciences, Lawrence
Erlbaum Associates, Hillsdale, NJ.
A STUDY OF WORKFORCE DIVERSITY THAT AFFECTS EMPLOYEE PERFORMANCE
AMONG THE SECONDARY SCHOOL TEACHERS IN MALAYSIA
Page 101 of 166
Contrada, R. J., Ashmore, R. D., Gary, M. L., Coups, E., Egeth, J. D., Sewell, A.,
Chasse, V. (2000). Ethnicity Related Sources of Stress and Their Effect on
Well-being. Current Directions in Psychological Science, 9(4), 136–139.
https://doi.org/doi/abs/10.1111/1467-8721.00078
Cox, T. H., & Blake, S. (1991). Managing cultural diversity: implications for
competitiveness organizational. The Executive (Academy of Management), 5(3),
45–56. https://doi.org/10.5465/AME.1991.4274465
Darling-Hammond, L. (2000). Teacher Quality and Student Achievement. Education
Policy Analysis Archives, 8, 1. doi:10.14507/epaa.v8n1.2000
Darling-Hammond, L. (2009). Teacher Education and the American Future. Journal of
Teacher Education, 61(1-2), 35-47. doi:10.1177/0022487109348024
Darryl, L., & Hunter, J. (2017). Using Work Experience To Predict Job Performance:
Do More. Psychology: Industrial/Organizational Psychology, 1-27.
Dee, T. (2006, August 27). Study Shows Teacher's Gender Affects Students'
Performance. Retrieved March 08, 2018, from
http://www.foxnews.com/story/2006/08/27/study-shows-teacher-gender-
affects-students-performance.html
Dee, T. S. (2004). Teachers, race, and student achievement in a randomized experiment.
Review of Economics and Statistics, 86(1), 195–210. Retrieved from
http://faculty.smu.edu/millimet/classes/eco7321/papers/dee01.pdf
Dee, T. S. (2005). A teacher like me: Does race, ethnicity, or gender matter? AEA
Papers and Proceeding, 95(2), 158–165. Retrieved from
file:///C:/Users/asus/Downloads/Journal Right.pdf
Dee, T. S. (2007). Teachers and the Gender Gaps in Student Achievement. Journal of
Human Resources, 42(3), 528–554. https://doi.org/10.1.1.597.5392
Dial, J. C. (2008). The Effect of Teacher Experience and Teacher Degree Levels On
Student Achievement In Mathematics And Communication Arts. Doctor of
Education in Educational Leadership, 1-108.
A STUDY OF WORKFORCE DIVERSITY THAT AFFECTS EMPLOYEE PERFORMANCE
AMONG THE SECONDARY SCHOOL TEACHERS IN MALAYSIA
Page 102 of 166
Dijkstra, T. K. &, & Henseler, J. (2015). Consistent and asymptotically normal PLS
estimators for linear structural equations. Computational Statistics and Data
Analysis, 81, 10–23. https://doi.org/10.1016/j.csda.2014.07.008
Dilworth, M. E., & Coleman, M. J. (2014). Time for a Change: Diversity in Teaching
Revisited. Retrieved from
http://www.nea.org/assets/docs/Time_for_a_Change_Diversity_in_Teaching_
Revisited (web).pdf?_ga=2.15520310.1076798694.1518350333-
648562983.1518022657
Dinev, T., & Hart, P. (2006). An Extended Privacy Calculus Model for. Information
Systems Research, 17(1), 61–80. https://doi.org/10.1287/isre.1060.0080
Dokko, G., Wilk, S. L., & Rothbard, N. P. (2008). Unpacking Prior Experience: How
Career History Affects Job Performance. Organization Science, 20(1), 51-68.
doi:10.1287/orsc.1080.0357
Edgar, S. (2012). Communication of Expectations between Principals and Entry-Year
Instrumental Music Teachers: Implications for Music Teacher
Assessment. Arts Education Policy Review, 113(4), 136-146.
doi:10.1080/10632913.2012.719426
Educational Data Sector. (2016). Quick Facts Malaysia Educational Statistics.
Retrieved from http://www.moe.gov.my
Educational Data Sector. (2017). Quick Facts 2017 Malaysia Educational Statistics,
51. Retrieved from https://www.moe.gov.my/images/Terbitan/Buku-
informasi/QUICK-FACTS-2017/20170809_QUICK-
FACTS_2017_FINAL5_interactive.pdf
Effect of diversity in workplace on employee performance in the banking industry in
kenya. jedidah mwikali kalani kyalo. (2015). Journal of Business & Change
Management, Vol .2(53), 145–181. Retrieved from
http://www.strategicjournals.com/index.php/journal/article/viewFile/124/130
Elsaid, A. M. (2012). The Effects of Cross Cultural Work Force Diversity on Employee
Performance in Egyptian Pharmaceutical Organizations. Business and
Management Research, 1, 4th ser., 162-179. doi:10.5430/bmr.v1n4p162
A STUDY OF WORKFORCE DIVERSITY THAT AFFECTS EMPLOYEE PERFORMANCE
AMONG THE SECONDARY SCHOOL TEACHERS IN MALAYSIA
Page 103 of 166
Escardíbul, J.-O., & Mora, T. (2013). Teacher Gender and Student Performance in
Mathematics. Evidence from Catalonia (Spain). Journal of Education and
Training Studies, 1(1), 39–46. https://doi.org/10.11114/jets.v1i1.22
Ewetan, T. O., & Ewetan, O. O. (2015). Teachers’ Teaching Experience and Academic
Performance in Mathematics and English Language in Public Secondary
Schools in Ogun State, Nigeria. International Journal of Humanities Social
Sciences and Education, Volume 2, Issue 2, 123-132.
Fallis, A. (2013). The State of Racial Diversity In the Educator Workforce. US
Department of Education, 53(9), 1689–1699.
https://doi.org/10.1017/CBO9781107415324.004
Federal Department of Town and Country Planning. (2010). Nationa Physical Plan - 2.
Fiedler, F. E. (1968). Leadership experience and leader performance—another
hypothesis shot to hell. Organizational Behavior and Human Performance,
5(1), 1-14. doi:10.1016/0030-5073(70)90002-4
Gneezy, U., Niederle, M., & Rustichini, A. (2003). Performance in Competitive
Environments: Gender Differences. The Quarterly Journal of Economics,
118(3), 1049–1074. https://doi.org/10.1162/00335530360698496
Goldhaber, D., & Hansen, M. (2010). Assessing the Potential of Using Value-Added
Estimates of Teacher Job Performance for Making Tenure Decisions.
PsycEXTRA Dataset. doi:10.1037/e722262011-001
Green, C. T., Jegadeesh, N., & Tang, Y. (2009). Gender and Job Performance:
Evidence from Wall Street. Financial Analysts Journal, 65(6), 65–78.
https://doi.org/10.2469/faj.v65.n6.1
Greener, S. (2008). Business Research Methods. London: Ventus Publishing.
Grift, W. V., Helms-Lorenz, M., & Maulana, R. (2014). Teaching skills of student
teachers: Calibration of an evaluation instrument and its value in predicting
student academic engagement. Studies in Educational Evaluation, 43, 150-159.
doi:10.1016/j.stueduc.2014.09.003
A STUDY OF WORKFORCE DIVERSITY THAT AFFECTS EMPLOYEE PERFORMANCE
AMONG THE SECONDARY SCHOOL TEACHERS IN MALAYSIA
Page 104 of 166
Grissom, J. A., Kern, E. C., & Rodriguez, L. A. (2015). The “Representative
Bureaucracy” in Education. Educational Researcher, 44(3), 185-192.
doi:10.3102/0013189x15580102
Hair Jr, J. F., Hult, G. T. M., Ringle, C., & Sarstedt, M. (2016). A primer on partial
least squares structural equation modeling (PLS-SEM). Sage
Publications.Harman, T. C. (1967). Thermoelectric and thermomagnetic effects
and applications. Lincoln Laboratory Publication. New York: McGraw-Hill.
Hair, J. F., Sarstedt, M., Ringle, C., & Mena, J. A. (2012). An assessment of the use of
partial least squares structural equation modeling in marketing research.
Journal of the Academy of Marketing Science, 40(3), 414-433.
Hair, J.F., Hult, G.T., Ringle, C., Sarstedt, M. (2014) A primer on partial least squares
structural equation modeling (PLS-SEM).
Hair, J.F., Hult, T.M., Ringle, C.M.& Sarstedt, M. (2017). A Primer on Partial Least
Squares Structural Equation Modeling (PLS-SEM). (Gillian Dickens, Ed.) (2nd
ed.). London: SAGE. Retrieved from https://uk.sagepub.com/en-gb/asi/a-
primer-on-partial-least-squares-structural-equation-modeling-pls-
sem/book244583
Hair, J.F., Ringle, C.M., Sarstedt, M. (2011). PLS-SEM: indeed a silver bullet. Journal
of Marketing Theory and Practice 19 (2), 139e151
Hanushek, E. A., & Woessmann, L. (2007). The Role of Education Quality For
Economic Growth. Policy Research Working Papers. doi:10.1596/1813-
9450-4122
Harman, T. C. (1967). Thermoelectric and thermomagnetic effects and applications.
Lincoln Laboratory Publication. New York: McGraw-Hill.
Hassan, Z. A., & Schattner, P. (2006). Doing A Pilot Study: Why Is It Essential?
Malaysian Family Physician; Volume 1, Number 2&3, 70-73.
Henseler, J. and Fassott, G. (2010), “Testing moderating effects in PLS path models:
An illustration of available procedures”, Handbook of Partial Least Squares,
Springer, Heidelberg, Berlin, pp. 713-735.
A STUDY OF WORKFORCE DIVERSITY THAT AFFECTS EMPLOYEE PERFORMANCE
AMONG THE SECONDARY SCHOOL TEACHERS IN MALAYSIA
Page 105 of 166
Henseler, J., Hubona, G., & Ray, P. A. (2016). Using PLS path modeling in new
technology research: updated guidelines. Industrial Management & Data
Systems, 116(1), 2-20. doi:10.1108/IMDS-09-2015-0382
Hill, H. C., Rowan, B., & Ball, D. L. (2005). Effects of Teachers’ Mathematical
Knowledge for Teaching on Student Achievement. American Educational
Research Journal, 42(2), 371-406. doi:10.3102/00028312042002371
Hoque, K. E., Razak, A. Z., Zohora, M. F., & Islam, R. (2013). Impact of Teacher-
Gender on Primary Students’ Achievement: A Study at Malaysian
Standpoint. Journal of Sociological Research, 4(1). doi:10.5296/jsr.v4i1.3295
Howard, J. M. (2010). The Value of Ethnic Diversity in the Teaching Profession : A
New Zealand Case Study. International Journal of Education, 2(1), 1–22.
Retrieved from https://www.saylor.org/site/wp-content/uploads/2013/09/The-
Value-of-Ethnic-Diversity.pdf
Hox, J. J., & Boeije, H. R. (2005). Data Collection, Primary vs. Secondary.
Encyclopedia of Social Measurement, 593-599. doi:10.1016/b0-12-369398-
5/00041-4
https://www.townplan.gov.my/download/National%20Physical%20Plan%28kecik%2
9.pdf
Hu, L., & Bentler, P. M. (1999). Structural Equation Modeling : Cutoff criteria for fit
indexes in covariance structure analysis : Conventional criteria versus new
alternatives, 6(1), 1–55. https://doi.org/10.1080/10705519909540118
Hunter, J. E. & Hunter, R. F. (1984). Validity and utility of alternative predictors of job
performance. Psychological Bulletin, 96 (1), 72-98. Doi:10.1037/0033-
2909.96.1.72
Joseph R., D., & Selvaraj, P. C. (2015). The Effects of Work Force Diversity on
Employee Performance in Singapore Organisations. International Journal of
Business Administration, 6(2). https://doi.org/10.5430/ijba.v6n2p17
Kayar, M., & Bulur, Ö C. (2017). Study on Importance of Employee Performance
Assesment and Lost Productive Time Rate Determination in Garment
Assembly Lines. Fibres and Textiles in Eastern Europe, 25(0), 119-126.
doi:10.5604/01.3001.0010.4638
A STUDY OF WORKFORCE DIVERSITY THAT AFFECTS EMPLOYEE PERFORMANCE
AMONG THE SECONDARY SCHOOL TEACHERS IN MALAYSIA
Page 106 of 166
Kester, K. O. (2008). Ethnic Factors as Correlates of Employees ’ Performance in
Selected Federal Bureaucracies in Ibadan Metropolis , Oyo State , Nigeria,
16(3), 227–234.
Kini, T., & Podolsky, A. (2016). Does Teaching Experience Increase Teacher
Effectiveness? Washington: Learning Policy Institute.
Kola, A. J., & Sunday, O. S. (2015). A Review of Teachers’ Qualifications and Its
Implication on Students’ Academic Achievement in Nigerian Schools.
International Journal of Educational Research and Information Science, 2(2),
10–15. https://doi.org/10.1119/1.16395
Kotur, B. R., & Anbazhagan, S. (2014). Influence of Age and Gender on the
Performance. Journal of Business and Management, 16(5), 97–103. Retrieved
from http://iosrjournals.org/iosr-jbm/papers/Vol16-issue5/Version-
3/O0165397103.pdf
Kumudha, A & Jennet, R. (2018). A Study About How Workforce Diversity (Cultural,
Age, Gender, Ethnicity), Training And Development Influences On
Employee’s Performance In Their Workplace In Information Technology
Companies, Bangalore. International Journal of Management, IT &
Engineering, 8(3), 52–76.
Latan, Hengky, Ramli & Nur Ainna. (2013). The Results of Partial Least Squares-
Structural Equation Modelling Analyses (PLS-SEM). SSRN Electronic Journal.
10.2139/ssrn.2364191.
Maingi, J. W., & Maingi, M. (2015). Effect of Workforce Diversity on Employee
Performance in Kenya: a Case of Kenya School of Government. The Strategic
Journal of Business and Change Management, 2(59), 343–364. Retrieved from
www.strategicjournals.com
Maingi,J. & Makori, M. (2015). Effect of Workforce Diversity on Employee
Performance in Kenya: a Case of Kenya School of Government. The Strategic
Journal of Business and Change Management, 2(59), 343–364. Retrieved from
www.strategicjournals.com
Malaysia Education Blueprint 2013-2025. Preschool to Post-Secondary Education.
Kementerian Pendidikan Malaysia.
A STUDY OF WORKFORCE DIVERSITY THAT AFFECTS EMPLOYEE PERFORMANCE
AMONG THE SECONDARY SCHOOL TEACHERS IN MALAYSIA
Page 107 of 166
Malaysia Employment Act 1955. (2012). Retrieved June 21, 2018, from
http://www.ilo.org/dyn/natlex/docs/WEBTEXT/48055/66265/E55mys01.htm
Malhotra, N.K., Kim, S.S. & Patil, A. (2006). Common Method Variance in IS
Research: A Comparison of Alternative Approaches and a Reanalysis of Past
Research. Management Science, 52(12), 1865–1883.
https://doi.org/10.1287/mnsc.1060.0597
McLeod, P. L., Lobel, S. A., & Cox, T. H. (1996). Ethnic Diversity and Creativity in
Small Groups. Small Group Research, 27(2), 248–264.
https://doi.org/10.1177/1046496496272003
Mohamad, M., & Jais, J. (2015). Emotional Intelligence and Job Performance: A Study
among Malaysian Teachers. Procedia Economics and Finance, 35, 674-682.
doi:10.1016/s2212-5671(16)00083-6
Mohindra, P. V., & Azhar, S. (2012). Gender Communication: A Comparative Analysis
of Communicational Approaches of Men and Women at Workplaces, 2(1), 18–
27.
Munjuri, M. G. (2012). Workforce Diversity Management and Employee Performance
in The Banking Sector in Kenya. DBA Africa Management Review, 3(1), 1–21.
Ng, T. W., & Feldman, D. C. (2009). How Broadly Does Education Contribute To Job
Performance? Personnel Psychology, 62(1), 89-134. doi:10.1111/j.1744-
6570.2008.01130.xAdministration, 6(2). https://doi.org/10.5430/ijba.v6n2p17
Nsubuga, Y. K. (2008). Analysis Of Leadership Styles And School Performance Of
Secondary Schools In Uganda. In the Faculty of Education at the Nelson
Mandela Metropolitan University, 1-217.
Nsubuga, Y. K. (2008). Analysis Of Leadership Styles And School Performance Of
Secondary Schools In Uganda. In the Faculty of Education at the Nelson
Mandela Metropolitan University, 1-27
Ololube, N. P., Major, N. B., & Kpolovie, P. J. (2006). Current Economic and Political
Dispensation and Teacher Education Programs in Niger Delta Region. Teacher
Education, 1424-1437. doi:10.4018/978-1-5225-0164-0.ch069
A STUDY OF WORKFORCE DIVERSITY THAT AFFECTS EMPLOYEE PERFORMANCE
AMONG THE SECONDARY SCHOOL TEACHERS IN MALAYSIA
Page 108 of 166
Opić, D. (2016). Interpersonal Relations In School. International Journal of Cognitive
Research in Science, Engineering and Education (IJCRSEE), 4, 2nd ser., 9-22.
doi:10.5937/IJCRSEE1602009O
Palomera, R., Briones, E., Gómez-Linares, A., & Vera, J. (2017). Filling the Gap:
Improving the Social and Emotional Skills of Pre-Service Teachers. Revista de
Psicodidáctica (English ed.), 22(2), 142-149.
doi:10.1016/j.psicoe.2017.05.005
Parrotta, P., Pozzoli, D., & Pytlikova, M. (2014). Labor diversity and firm
productivity. European Economic Review,66, 144-179.
doi:10.1016/j.euroecorev.2013.12.002
Pavlou, P. A., & Gefen, D. (2005). Psychological Contract Violation in Online
Marketplaces: Antecedents , Consequences , and Moderating Role
Psychological Contract Violation in Online Marketplaces : Antecedents ,
Consequences , and Moderating Role. Information Systems Research,
16(February 2015), 372–399. https://doi.org/10.1287/isre.1050.0065
Podsakoff, M. P., & Organ, D. W. (1986). Self-Reports in Organization
Research:Problems and Prospects. Journal of Management, 12(October), 531–
544. https://doi.org/10.1177/014920638601200408
Podsakoff, P. M., Mackenzie, S. B., & Podsakoff, N. P. (2012). Sources of Method
Bias in Social Science Research and Recommendations on How to Control It.
Annual Review of Psychology, 63, 539–569. https://doi.org/10.1146/annurev-
psych-120710-100452
Podsakoff, P. M., Mackenzie, S. B., Lee, J., & Podsakoff, N. P. (2003). Common
Method Biases in Behavioral Research : A Critical Review of the Literature and
Recommended Remedies. Journal of Applied Psychology, 88(5), 879–903.
https://doi.org/10.1037/0021-9010.88.5.879
Rice, J. K. (2010). National Center for Analysis of Longitudinal Data in Education
Research. The Impact of Teacher Experience Examining the Evidence and
Policy Implications, 1-6.
Rizan, T. M. M. T. N., Maarof, N., & Mohd Ali, M. (2015). Addressing Learner
Diversity By Culturally Responsive Pedagogy. Journal of Social Science and
Humanities, 1(1), 138–150.

A STUDY OF WORKFORCE DIVERSITY THAT AFFECTS EMPLOYEE PERFORMANCE
AMONG THE SECONDARY SCHOOL TEACHERS IN MALAYSIA
Page 109 of 166
Rizwan, M., Khan, M. N., Nadeem, B., & Abbas, Q. (2016). The Impact of Workforce
Diversity Towards Employee Performance : Evidence from Banking Sector of
Pakistan. American Journal of Marketing Research, 2(2), 53–60.
Rotundo, M. & Sackett, P. R. (2002). The relative importance of task, citizenship, and
counterproductive performance to global ratings of job performance: A policy-
capturing approach. Journal of Applied Psychology, 87(1), 66-80.
doi:10.1037/0021-9010.87.1.66
Sarstedt, M., Ringle, C. M., Smith, D., Reams, R., & Hair, J. F. (2014). Partial least
squares structural equation modeling (PLS-SEM): A useful tool for family
business researchers. Journal of Family Business Strategy, 5, 105–115.
doi:10.1016/j.jfbs.2014.01.002
Sauro, J. (2015, June 2). 7 Ways to Handle Missing Data. Retrieved from
https://measuringu.com/handle-missing-data/
Sawchuk, S. (2015, September 3). Teacher Evaluation: An issue Overview. Retrieved
from Education Week:
https://www.edweek.org/ew/section/multimedia/teacher-performance-
evaluation-issue-overview.html
Saxena, A. (2014). Workforce Diversity: A Key to Improve Productivity. Procedia
Economics and Finance, 11, 76-85. doi:10.1016/s2212-5671(14)00178-6
Sekaran, U. (2005). Research methods for business: A skill-building approach. Fourth
edition. United State of America: John Wiley & Sons.
Sekaran, U., & Bougie, R. (2013). Research methods for business: A skill-building
approach (6th ed.). Chichester, West Sussex: John Wiley & Sons, Inc.
Sharp, B. (2016). Descriptive Statistics & the Normal Distribution. Retrieved from
http://slideplayer.com/slide/9396998/
Sheth, H. (2017). A Study on Workforce Diversity in Organizations, Indian Journal Of
Applied Research, Volume 7, Issue 2, pg. no. 693-694.
A STUDY OF WORKFORCE DIVERSITY THAT AFFECTS EMPLOYEE PERFORMANCE
AMONG THE SECONDARY SCHOOL TEACHERS IN MALAYSIA
Page 110 of 166
Sheth, H. (2018). Impact Of Workforce Diversity On Employee Performance With
Special Reference To It, Fmcg & Telecom Industry In Gujarat. A thesis
submitted to Gujarat Technological University , 1-123.
Silaparasetti, V., Srinivasarao, G. & Khan, F. R. (2017). Structural Equation Modeling
Analysis Using Smart PLS To Assess The Occupational Health And Safety
(Ohs) Factors On Workers’ Behavior. Humanities & Social Sciences Reviews,
5(2), 88-97. Doi: 10.18510/hssr.2017.524
Steinberg, M. P., & Garrett, R. (2016). Classroom Composition and Measured Teacher
Performance: What Do Teacher Observation Scores Really Measure?
Educational Evaluation and Policy Analysis, 293-315. Retrieved from
Educational Evaluation and Policy Analysis.
Stephanie. (2016, March 7). Assumption of Normality / Normality Test. Retrieved from
http://www.statisticshowto.com/assumption-of-normality-test/
Storage, J. H., & Hindman, J. L. (2003). Hiring the Best Teachers. Keeping Good
Teachers, 48-52.
The World Bank (2013). Malaysia Economic Monitor: High-Performing Education.
Thomas S. Dee. (2004). Teachers, race, and student achievement in a randomized
experiment. Review of Economics and Statistics, 86(1), 195–210. Retrieved
from http://faculty.smu.edu/millimet/classes/eco7321/papers/dee01.pdf
Trochim, W. M. (2002). Research methods knowledge base. Retrieved April 3, 2018,
from
https://www.researchgate.net/profile/William_Trochim/publication/24378360
9_The_Research_Methods_Knowledge_Base/links/55db837008aed6a199ac62
46.pdf
Ukessays, (2015, March 23). Impacts of Poor Teaching Methods. Retrieved from
UKESSAYS: https://www.ukessays.com/essays/education/poor-teaching-
methods-have-lifelong-impacts-education-essay.php
Ullah, H. (2016). School Teaching As a Feminine Profession: the Legitimization and
Naturalization Discourses in Pakistani Context. University of Birmingham,
122–130.
A STUDY OF WORKFORCE DIVERSITY THAT AFFECTS EMPLOYEE PERFORMANCE
AMONG THE SECONDARY SCHOOL TEACHERS IN MALAYSIA
Page 111 of 166
Univariate and Multivariate Outliers. (2015, June 02). Retrieved from
http://www.statisticssolutions.com/univariate-and-multivariate-outliers/
Vugt, M. V. (2006). Evolutionary Origins of Leadership and Followership. Personality
and Social Psychology Review, 10(4), 354-371.
doi:10.1207/s15327957pspr1004_5
Williams, A., & Bedward, J. (2001). Gender, Culture and the Generation Gap: Student
and Teacher Perceptions of Aspects of National Curriculum Physical Education.
Sport, Education and Society, 6(1), 53–66. https://doi.org/10.1080/713696037
Ying, Z. Y. (2012). The Impact of Performance Management System on Employee
Performance. Workplace Employment Relations Survey, 1-48.
Yong, G. A., & Pearce, S. (2013). A Beginner’s Guide to Factor Analysis: Focusing on
Exploratory Factor Analysis. Tutorials in Quantitative Methods for Psychology,
9(2), 79-94.
Yusuf, H. O., & Dada, A. A. (2016). Impact of Teachers’ Qualification and Experience
on Performance of Students In Colleges Of Education In Kaduna State, Nigeria.
The Online Journal of Quality in Higher Education, Volume 3, Issue 2, 52-59.
Zikmund, W. G., Babin, B. J., Carr, J. C., & Griffin, M. (2009). Business Research
Methods (Eighth ed.). South-Western, Cengage Learning.
Zikmund, W. G., Babin, B. J., Carr, J. C., & Griffin, M. (2013). Business research
methods (9th ed.). New York: South-Western/Cengage Learning.
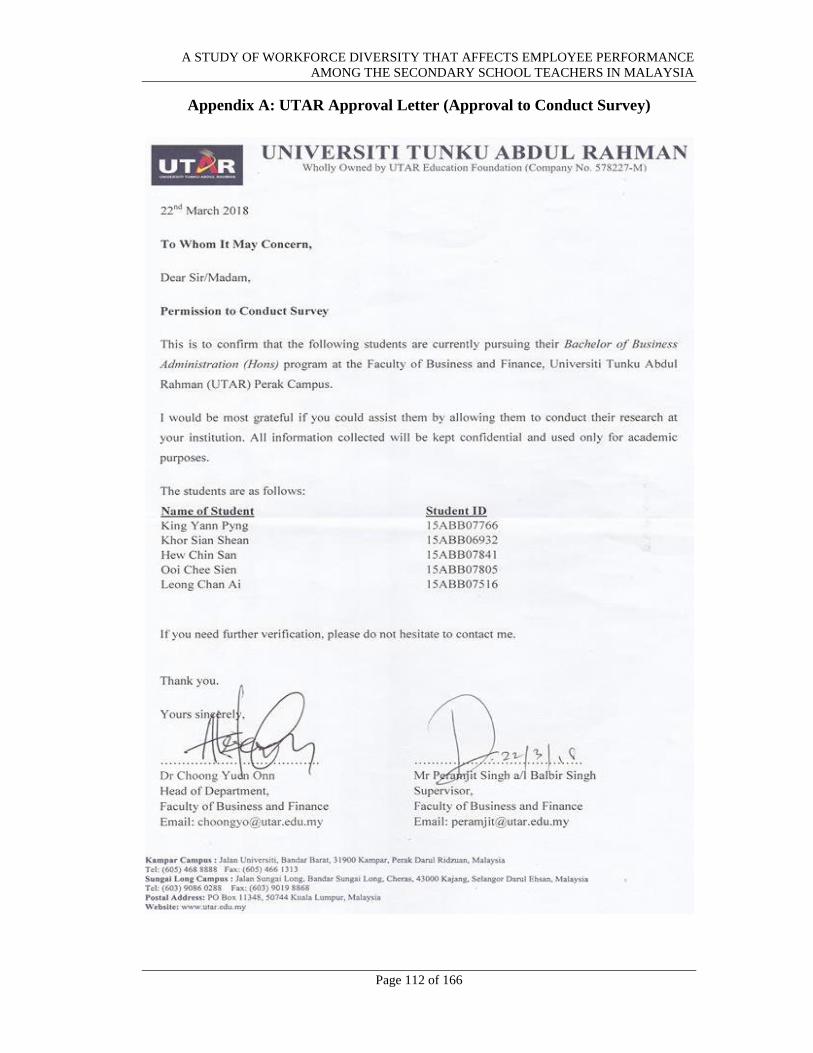
A STUDY OF WORKFORCE DIVERSITY THAT AFFECTS EMPLOYEE PERFORMANCE
AMONG THE SECONDARY SCHOOL TEACHERS IN MALAYSIA
Page 112 of 166
Appendix A: UTAR Approval Letter (Approval to Conduct Survey)
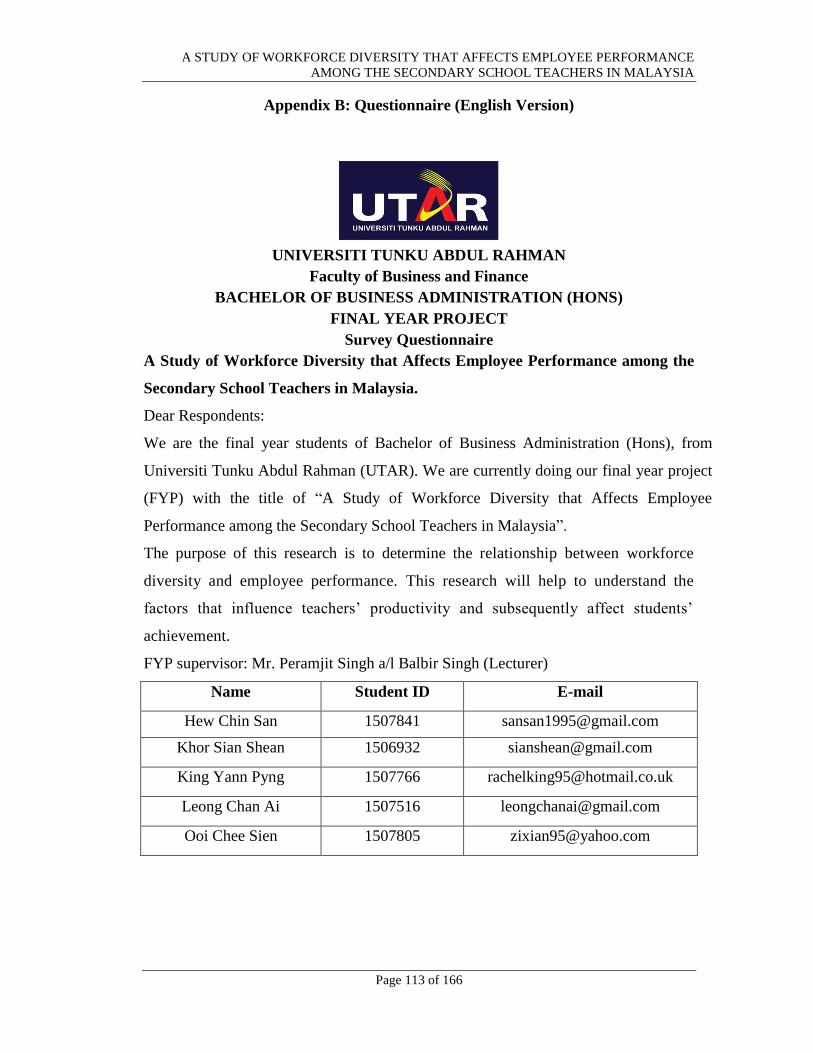
A STUDY OF WORKFORCE DIVERSITY THAT AFFECTS EMPLOYEE PERFORMANCE
AMONG THE SECONDARY SCHOOL TEACHERS IN MALAYSIA
Page 113 of 166
Appendix B: Questionnaire (English Version)
UNIVERSITI TUNKU ABDUL RAHMAN
Faculty of Business and Finance
BACHELOR OF BUSINESS ADMINISTRATION (HONS)
FINAL YEAR PROJECT
Survey Questionnaire
A Study of Workforce Diversity that Affects Employee Performance among the
Secondary School Teachers in Malaysia.
Dear Respondents:
We are the final year students of Bachelor of Business Administration (Hons), from
Universiti Tunku Abdul Rahman (UTAR). We are currently doing our final year project
(FYP) with the title of “A Study of Workforce Diversity that Affects Employee
Performance among the Secondary School Teachers in Malaysia”.
The purpose of this research is to determine the relationship between workforce
diversity and employee performance. This research will help to understand the
factors that influence teachers’ productivity and subsequently affect students’
achievement.
FYP supervisor: Mr. Peramjit Singh a/l Balbir Singh (Lecturer)
Name Student ID E-mail
Hew Chin San 1507841 [email protected]
Khor Sian Shean 1506932 [email protected]
King Yann Pyng 1507766 [email protected]
Leong Chan Ai 1507516 [email protected]
Ooi Chee Sien 1507805 [email protected]
A STUDY OF WORKFORCE DIVERSITY THAT AFFECTS EMPLOYEE PERFORMANCE
AMONG THE SECONDARY SCHOOL TEACHERS IN MALAYSIA
Page 114 of 166
Instructions:
1) This questionnaire consists of THREE (3) sections. Please answer ALL
questions in ALL sections.
2) This questionnaire will take approximately 10 to 15 minutes to complete.
3) Please feel free to share your comment in the space provided. The
contents of this questionnaire will be kept strictly confidential.
4) Please be informed that in accordance with Personal Data Protection Act
2010 (“PDPA”) which came into force on 15 November 2013, Universiti
Tunku Abdul Rahman (“UTAR”) is hereby bound to make notice and
require consent in relation to collection, recording, storage, usage and
retention of personal information. Your cooperation in completing this
questionnaire will be kept PRIVATE and CONFIDENTIAL and be used
solely for academic purposes.
Acknowledgment of Notice
[ ] I have been notified by you and that I hereby understood, consented
and agreed per UTAR notice (refer to Appendix I).
[ ] I disagree, my personal data will not be processed.
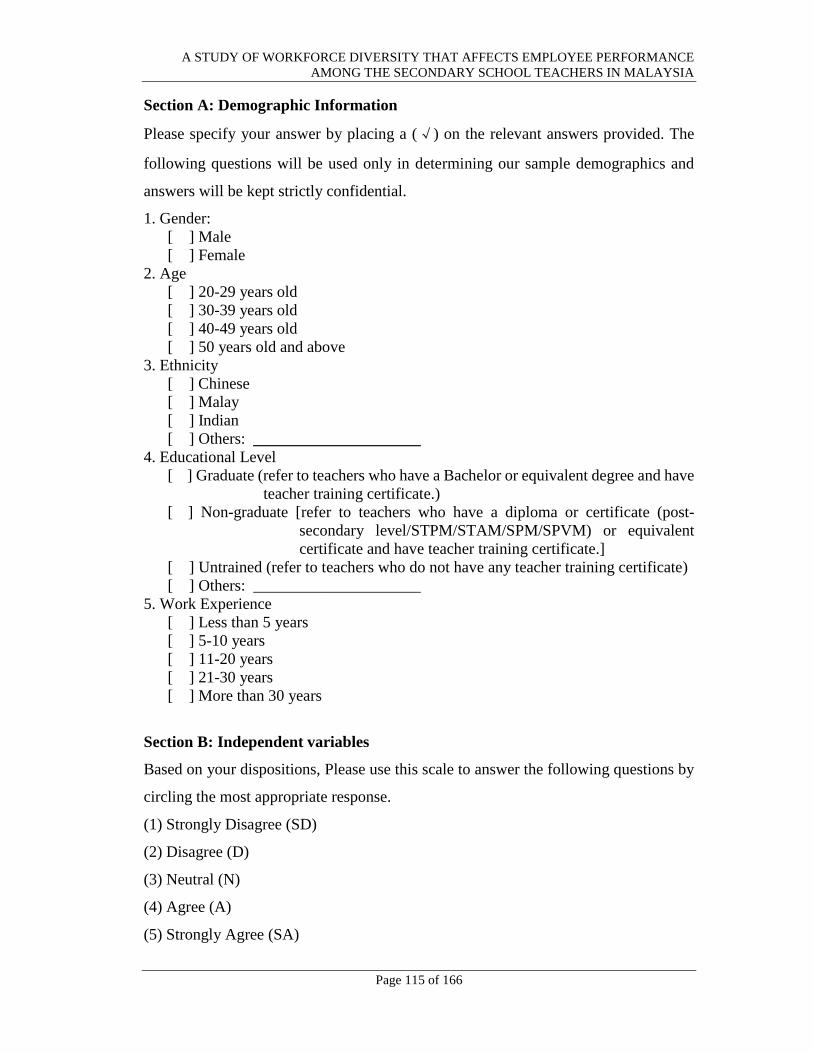
A STUDY OF WORKFORCE DIVERSITY THAT AFFECTS EMPLOYEE PERFORMANCE
AMONG THE SECONDARY SCHOOL TEACHERS IN MALAYSIA
Page 115 of 166
Section A: Demographic Information
Please specify your answer by placing a (√) on the relevant answers provided. The
following questions will be used only in determining our sample demographics and
answers will be kept strictly confidential.
1. Gender:
[ ] Male
[ ] Female
2. Age
[ ] 20-29 years old
[ ] 30-39 years old
[ ] 40-49 years old
[ ] 50 years old and above
3. Ethnicity
[ ] Chinese
[ ] Malay
[ ] Indian
[ ] Others: _____________________
4. Educational Level
[ ] Graduate (refer to teachers who have a Bachelor or equivalent degree and have
teacher training certificate.)
[ ] Non-graduate [refer to teachers who have a diploma or certificate (post-
secondary level/STPM/STAM/SPM/SPVM) or equivalent
certificate and have teacher training certificate.]
[ ] Untrained (refer to teachers who do not have any teacher training certificate)
[ ] Others: _____________________
5. Work Experience
[ ] Less than 5 years
[ ] 5-10 years
[ ] 11-20 years
[ ] 21-30 years
[ ] More than 30 years
Section B: Independent variables
Based on your dispositions, Please use this scale to answer the following questions by
circling the most appropriate response.
(1) Strongly Disagree (SD)
(2) Disagree (D)
(3) Neutral (N)
(4) Agree (A)
(5) Strongly Agree (SA)
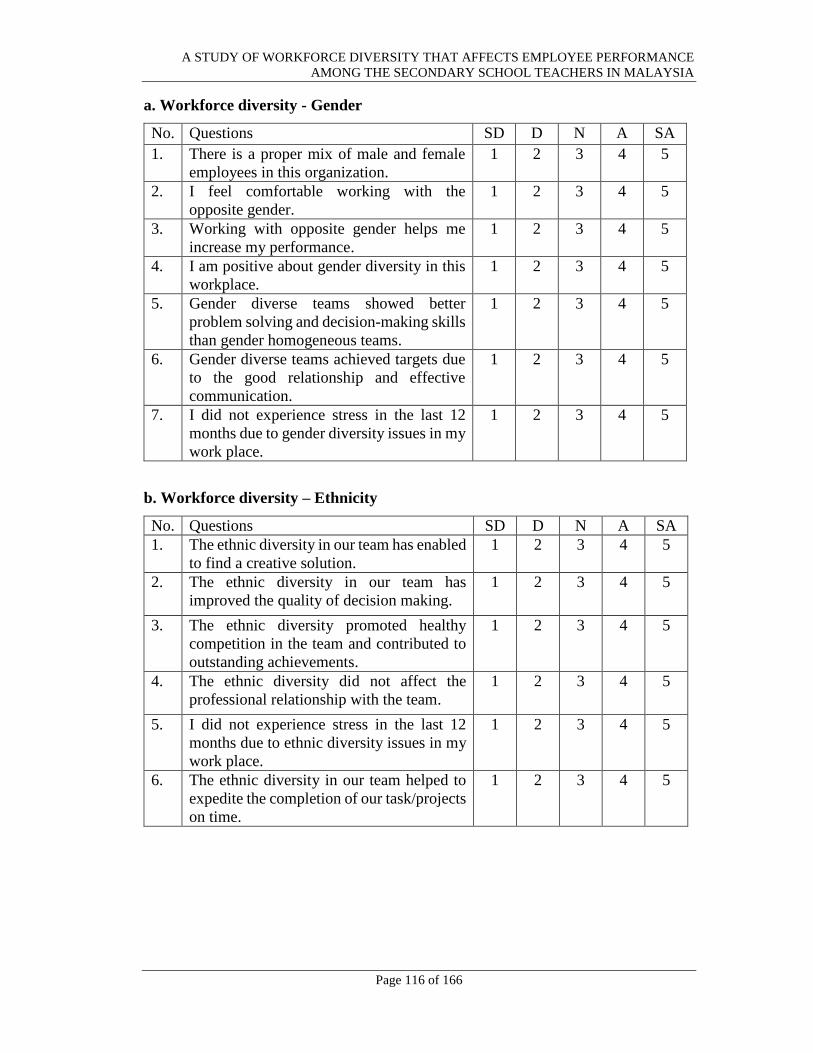
A STUDY OF WORKFORCE DIVERSITY THAT AFFECTS EMPLOYEE PERFORMANCE
AMONG THE SECONDARY SCHOOL TEACHERS IN MALAYSIA
Page 116 of 166
a. Workforce diversity - Gender
No. Questions SD D N A SA
1. There is a proper mix of male and female
employees in this organization.
1 2 3 4 5
2. I feel comfortable working with the
opposite gender.
1 2 3 4 5
3. Working with opposite gender helps me
increase my performance.
1 2 3 4 5
4. I am positive about gender diversity in this
workplace.
1 2 3 4 5
5. Gender diverse teams showed better
problem solving and decision-making skills
than gender homogeneous teams.
1 2 3 4 5
6. Gender diverse teams achieved targets due
to the good relationship and effective
communication.
1 2 3 4 5
7. I did not experience stress in the last 12
months due to gender diversity issues in my
work place.
1 2 3 4 5
b. Workforce diversity – Ethnicity
No. Questions SD D N A SA
1. The ethnic diversity in our team has enabled
to find a creative solution.
1 2 3 4 5
2. The ethnic diversity in our team has
improved the quality of decision making.
1 2 3 4 5
3. The ethnic diversity promoted healthy
competition in the team and contributed to
outstanding achievements.
1 2 3 4 5
4. The ethnic diversity did not affect the
professional relationship with the team.
1 2 3 4 5
5. I did not experience stress in the last 12
months due to ethnic diversity issues in my
work place.
1 2 3 4 5
6. The ethnic diversity in our team helped to
expedite the completion of our task/projects
on time.
1 2 3 4 5
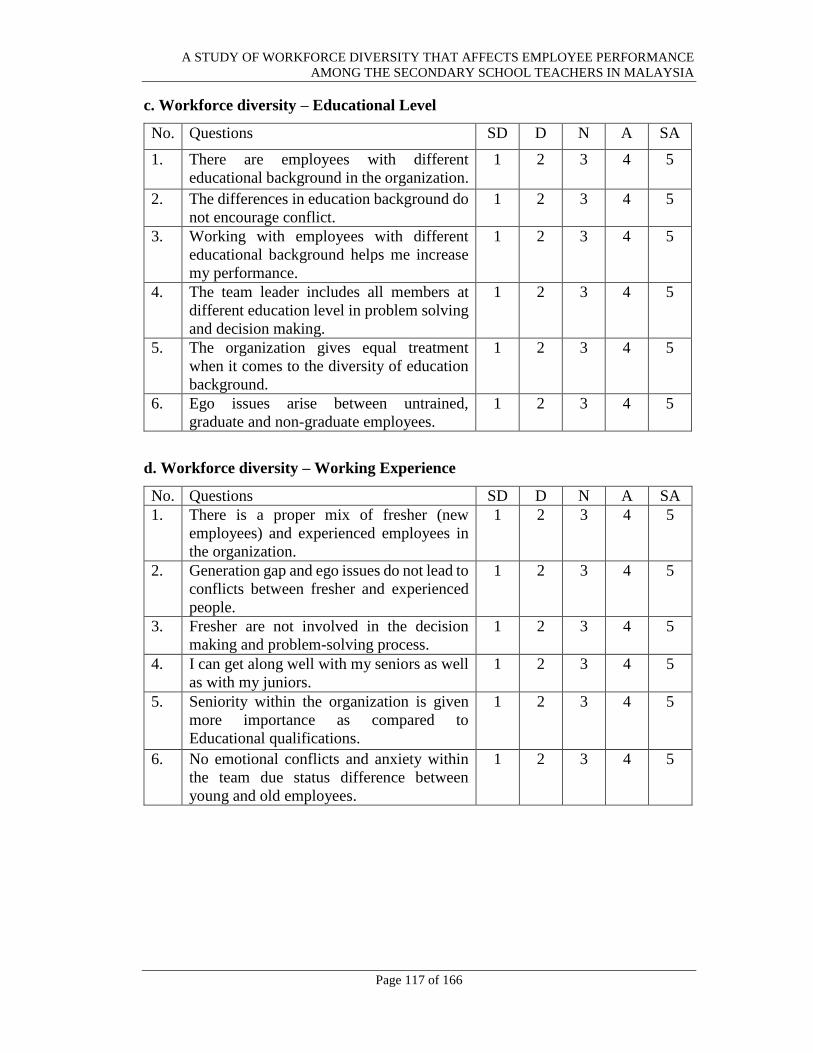
A STUDY OF WORKFORCE DIVERSITY THAT AFFECTS EMPLOYEE PERFORMANCE
AMONG THE SECONDARY SCHOOL TEACHERS IN MALAYSIA
Page 117 of 166
c. Workforce diversity – Educational Level
No. Questions SD D N A SA
1. There are employees with different
educational background in the organization.
1 2 3 4 5
2. The differences in education background do
not encourage conflict.
1 2 3 4 5
3. Working with employees with different
educational background helps me increase
my performance.
1 2 3 4 5
4. The team leader includes all members at
different education level in problem solving
and decision making.
1 2 3 4 5
5. The organization gives equal treatment
when it comes to the diversity of education
background.
1 2 3 4 5
6. Ego issues arise between untrained,
graduate and non-graduate employees.
1 2 3 4 5
d. Workforce diversity – Working Experience
No. Questions SD D N A SA
1. There is a proper mix of fresher (new
employees) and experienced employees in
the organization.
1 2 3 4 5
2. Generation gap and ego issues do not lead to
conflicts between fresher and experienced
people.
1 2 3 4 5
3. Fresher are not involved in the decision
making and problem-solving process.
1 2 3 4 5
4. I can get along well with my seniors as well
as with my juniors.
1 2 3 4 5
5. Seniority within the organization is given
more importance as compared to
Educational qualifications.
1 2 3 4 5
6. No emotional conflicts and anxiety within
the team due status difference between
young and old employees.
1 2 3 4 5
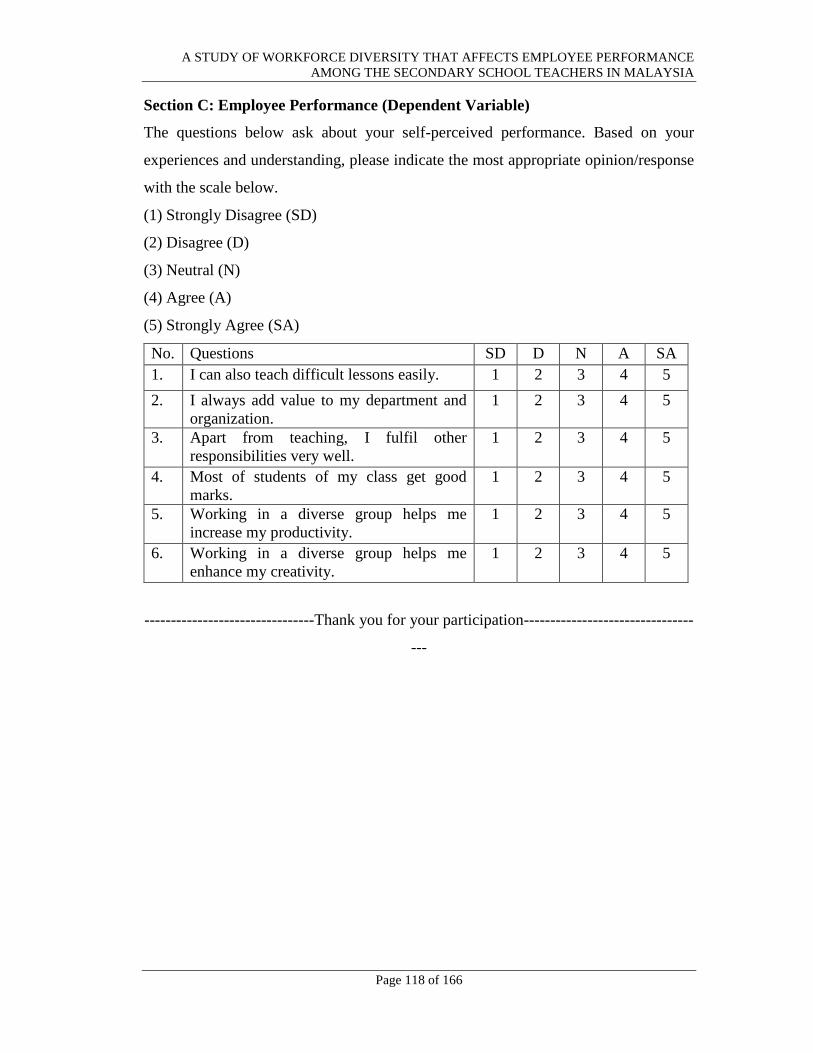
A STUDY OF WORKFORCE DIVERSITY THAT AFFECTS EMPLOYEE PERFORMANCE
AMONG THE SECONDARY SCHOOL TEACHERS IN MALAYSIA
Page 118 of 166
Section C: Employee Performance (Dependent Variable)
The questions below ask about your self-perceived performance. Based on your
experiences and understanding, please indicate the most appropriate opinion/response
with the scale below.
(1) Strongly Disagree (SD)
(2) Disagree (D)
(3) Neutral (N)
(4) Agree (A)
(5) Strongly Agree (SA)
No. Questions SD D N A SA
1. I can also teach difficult lessons easily. 1 2 3 4 5
2. I always add value to my department and
organization.
1 2 3 4 5
3. Apart from teaching, I fulfil other
responsibilities very well.
1 2 3 4 5
4. Most of students of my class get good
marks.
1 2 3 4 5
5. Working in a diverse group helps me
increase my productivity.
1 2 3 4 5
6. Working in a diverse group helps me
enhance my creativity.
1 2 3 4 5
--------------------------------Thank you for your participation--------------------------------
---
A STUDY OF WORKFORCE DIVERSITY THAT AFFECTS EMPLOYEE PERFORMANCE
AMONG THE SECONDARY SCHOOL TEACHERS IN MALAYSIA
Page 119 of 166
Appendix C: Questionnaire (Malay Version)
UNIVERSITI TUNKU ABDUL RAHMAN
Faculty of Business and Finance
BACHELOR OF BUSINESS ADMINISTRATION (HONS)
FINAL YEAR PROJECT
Soal Selidik
Kajian Kepelbagaian Tenaga Kerja yang Mempengaruhi Prestasi Pekerja di
kalangan Guru Sekolah Menengah di Malaysia.
Responden yang dihormati:
Kami adalah pelajar tahun akhir Sarjana Pentadbiran Perniagaan (Kepujian), dari
Universiti Tunku Abdul Rahman (UTAR). Kami sedang melakukan projek akhir
tahun (FYP) dengan tajuk "Kajian Kepelbagaian Tenaga Kerja yang
Mempengaruhi Prestasi Pekerja di kalangan Guru Sekolah Menengah di Malaysia".
Tujuan kajian ini adalah untuk mengenalpasti hubungan antara kepelbagaian
tenaga kerja dan prestasi pekerja. Kajian ini akan membantu memahami faktor-
faktor yang mempengaruhi produktiviti guru dan seterusnya mempengaruhi
pencapaian pelajar.
Penyelia FYP: Encik Peramjit Singh a / l Balbir Singh (Pensyarah)
Nama Nombor Identiti Murid E-mel
Hew Chin San 1507841 [email protected]
Khor Sian Shean 1506932 [email protected]
King Yann Pyng 1507766 [email protected]
Leong Chan Ai 1507516 [email protected]
Ooi Chee Sien 1507805 [email protected]
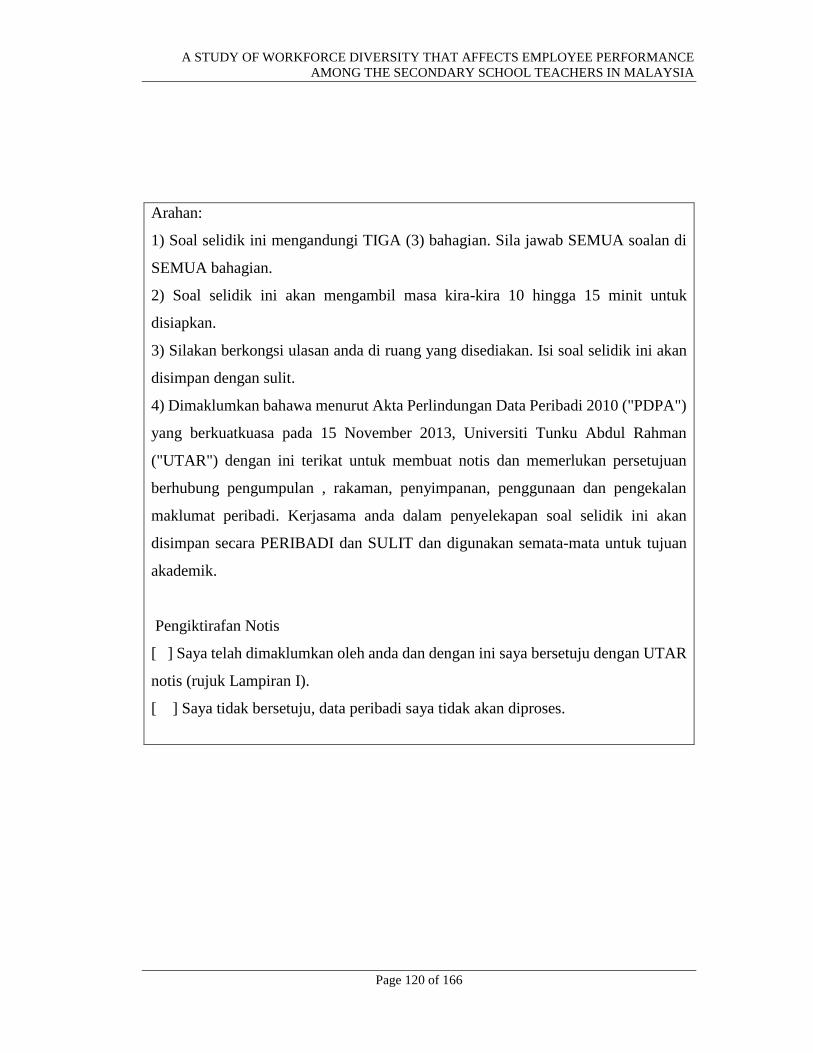
A STUDY OF WORKFORCE DIVERSITY THAT AFFECTS EMPLOYEE PERFORMANCE
AMONG THE SECONDARY SCHOOL TEACHERS IN MALAYSIA
Page 120 of 166
Arahan:
1) Soal selidik ini mengandungi TIGA (3) bahagian. Sila jawab SEMUA soalan di
SEMUA bahagian.
2) Soal selidik ini akan mengambil masa kira-kira 10 hingga 15 minit untuk
disiapkan.
3) Silakan berkongsi ulasan anda di ruang yang disediakan. Isi soal selidik ini akan
disimpan dengan sulit.
4) Dimaklumkan bahawa menurut Akta Perlindungan Data Peribadi 2010 ("PDPA")
yang berkuatkuasa pada 15 November 2013, Universiti Tunku Abdul Rahman
("UTAR") dengan ini terikat untuk membuat notis dan memerlukan persetujuan
berhubung pengumpulan , rakaman, penyimpanan, penggunaan dan pengekalan
maklumat peribadi. Kerjasama anda dalam penyelekapan soal selidik ini akan
disimpan secara PERIBADI dan SULIT dan digunakan semata-mata untuk tujuan
akademik.
Pengiktirafan Notis
[ ] Saya telah dimaklumkan oleh anda dan dengan ini saya bersetuju dengan UTAR
notis (rujuk Lampiran I).
[ ] Saya tidak bersetuju, data peribadi saya tidak akan diproses.
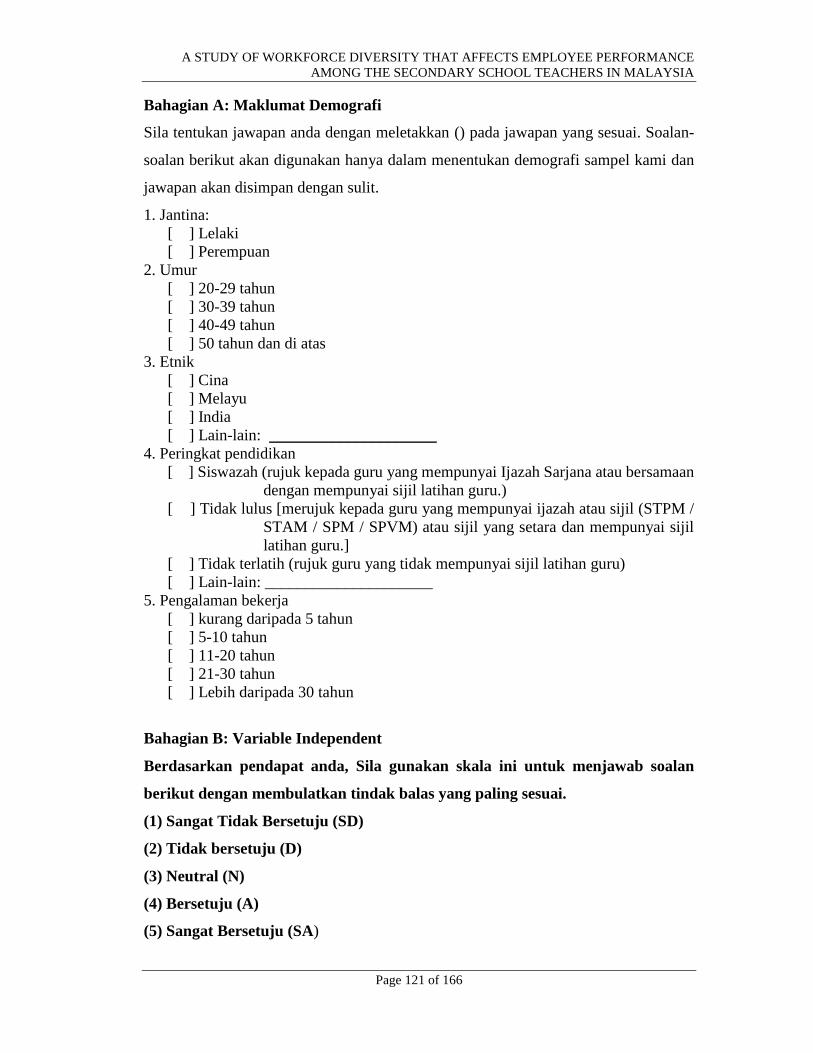
A STUDY OF WORKFORCE DIVERSITY THAT AFFECTS EMPLOYEE PERFORMANCE
AMONG THE SECONDARY SCHOOL TEACHERS IN MALAYSIA
Page 121 of 166
Bahagian A: Maklumat Demografi
Sila tentukan jawapan anda dengan meletakkan () pada jawapan yang sesuai. Soalan-
soalan berikut akan digunakan hanya dalam menentukan demografi sampel kami dan
jawapan akan disimpan dengan sulit.
1. Jantina:
[ ] Lelaki
[ ] Perempuan
2. Umur
[ ] 20-29 tahun
[ ] 30-39 tahun
[ ] 40-49 tahun
[ ] 50 tahun dan di atas
3. Etnik
[ ] Cina
[ ] Melayu
[ ] India
[ ] Lain-lain: _____________________
4. Peringkat pendidikan
[ ] Siswazah (rujuk kepada guru yang mempunyai Ijazah Sarjana atau bersamaan
dengan mempunyai sijil latihan guru.)
[ ] Tidak lulus [merujuk kepada guru yang mempunyai ijazah atau sijil (STPM /
STAM / SPM / SPVM) atau sijil yang setara dan mempunyai sijil
latihan guru.]
[ ] Tidak terlatih (rujuk guru yang tidak mempunyai sijil latihan guru)
[ ] Lain-lain: _____________________
5. Pengalaman bekerja
[ ] kurang daripada 5 tahun
[ ] 5-10 tahun
[ ] 11-20 tahun
[ ] 21-30 tahun
[ ] Lebih daripada 30 tahun
Bahagian B: Variable Independent
Berdasarkan pendapat anda, Sila gunakan skala ini untuk menjawab soalan
berikut dengan membulatkan tindak balas yang paling sesuai.
(1) Sangat Tidak Bersetuju (SD)
(2) Tidak bersetuju (D)
(3) Neutral (N)
(4) Bersetuju (A)
(5) Sangat Bersetuju (SA)
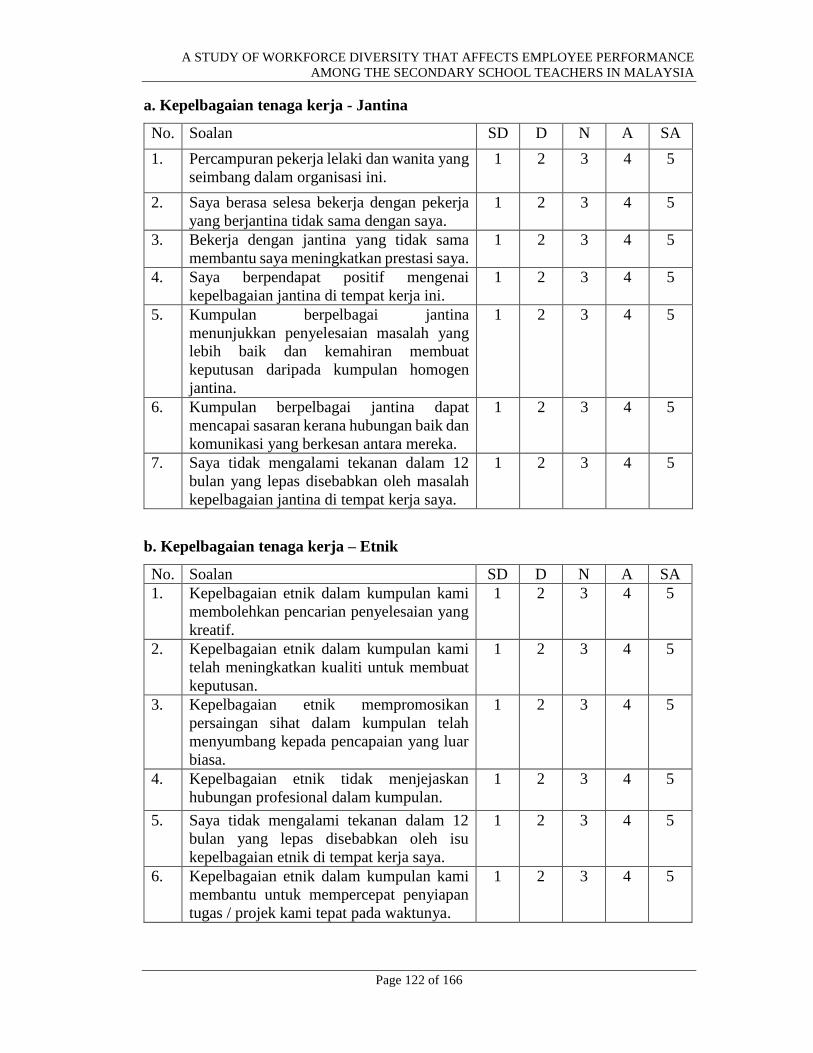
A STUDY OF WORKFORCE DIVERSITY THAT AFFECTS EMPLOYEE PERFORMANCE
AMONG THE SECONDARY SCHOOL TEACHERS IN MALAYSIA
Page 122 of 166
a. Kepelbagaian tenaga kerja - Jantina
No. Soalan SD D N A SA
1. Percampuran pekerja lelaki dan wanita yang
seimbang dalam organisasi ini.
1 2 3 4 5
2. Saya berasa selesa bekerja dengan pekerja
yang berjantina tidak sama dengan saya.
1 2 3 4 5
3. Bekerja dengan jantina yang tidak sama
membantu saya meningkatkan prestasi saya.
1 2 3 4 5
4. Saya berpendapat positif mengenai
kepelbagaian jantina di tempat kerja ini.
1 2 3 4 5
5. Kumpulan berpelbagai jantina
menunjukkan penyelesaian masalah yang
lebih baik dan kemahiran membuat
keputusan daripada kumpulan homogen
jantina.
1 2 3 4 5
6. Kumpulan berpelbagai jantina dapat
mencapai sasaran kerana hubungan baik dan
komunikasi yang berkesan antara mereka.
1 2 3 4 5
7. Saya tidak mengalami tekanan dalam 12
bulan yang lepas disebabkan oleh masalah
kepelbagaian jantina di tempat kerja saya.
1 2 3 4 5
b. Kepelbagaian tenaga kerja – Etnik
No. Soalan SD D N A SA
1. Kepelbagaian etnik dalam kumpulan kami
membolehkan pencarian penyelesaian yang
kreatif.
1 2 3 4 5
2. Kepelbagaian etnik dalam kumpulan kami
telah meningkatkan kualiti untuk membuat
keputusan.
1 2 3 4 5
3. Kepelbagaian etnik mempromosikan
persaingan sihat dalam kumpulan telah
menyumbang kepada pencapaian yang luar
biasa.
1 2 3 4 5
4. Kepelbagaian etnik tidak menjejaskan
hubungan profesional dalam kumpulan.
1 2 3 4 5
5. Saya tidak mengalami tekanan dalam 12
bulan yang lepas disebabkan oleh isu
kepelbagaian etnik di tempat kerja saya.
1 2 3 4 5
6. Kepelbagaian etnik dalam kumpulan kami
membantu untuk mempercepat penyiapan
tugas / projek kami tepat pada waktunya.
1 2 3 4 5
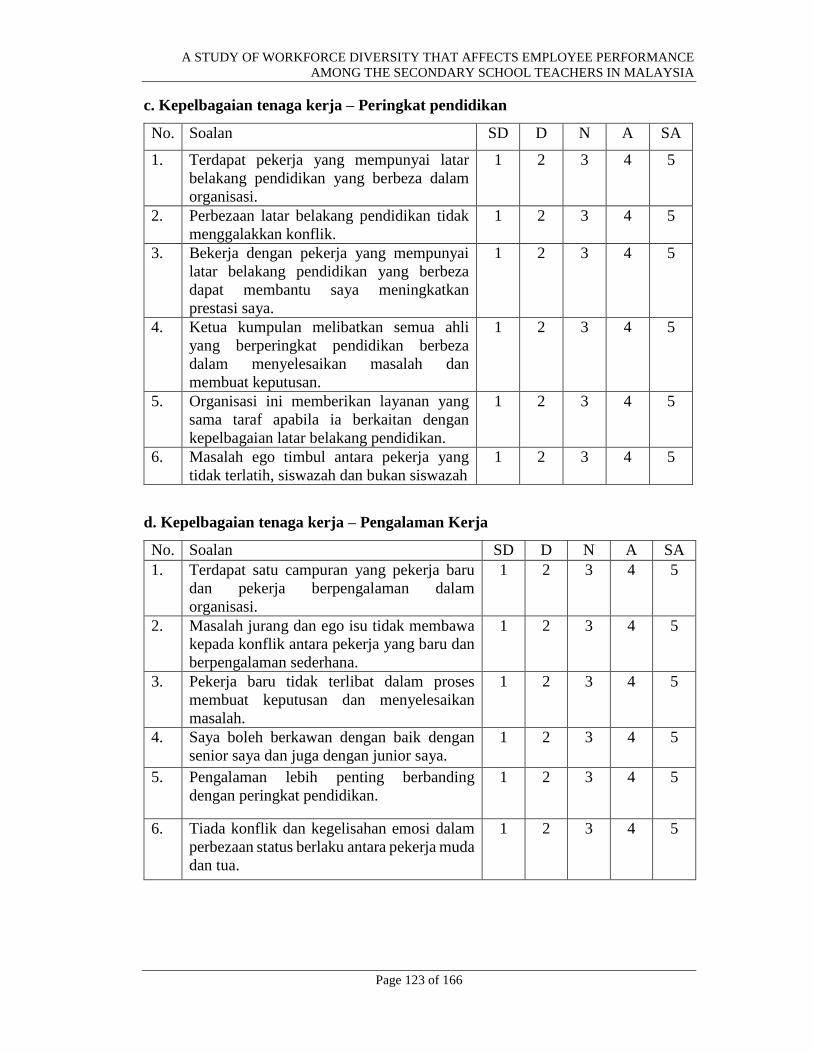
A STUDY OF WORKFORCE DIVERSITY THAT AFFECTS EMPLOYEE PERFORMANCE
AMONG THE SECONDARY SCHOOL TEACHERS IN MALAYSIA
Page 123 of 166
c. Kepelbagaian tenaga kerja – Peringkat pendidikan
No. Soalan SD D N A SA
1. Terdapat pekerja yang mempunyai latar
belakang pendidikan yang berbeza dalam
organisasi.
1 2 3 4 5
2. Perbezaan latar belakang pendidikan tidak
menggalakkan konflik.
1 2 3 4 5
3. Bekerja dengan pekerja yang mempunyai
latar belakang pendidikan yang berbeza
dapat membantu saya meningkatkan
prestasi saya.
1 2 3 4 5
4. Ketua kumpulan melibatkan semua ahli
yang berperingkat pendidikan berbeza
dalam menyelesaikan masalah dan
membuat keputusan.
1 2 3 4 5
5. Organisasi ini memberikan layanan yang
sama taraf apabila ia berkaitan dengan
kepelbagaian latar belakang pendidikan.
1 2 3 4 5
6. Masalah ego timbul antara pekerja yang
tidak terlatih, siswazah dan bukan siswazah
1 2 3 4 5
d. Kepelbagaian tenaga kerja – Pengalaman Kerja
No. Soalan SD D N A SA
1. Terdapat satu campuran yang pekerja baru
dan pekerja berpengalaman dalam
organisasi.
1 2 3 4 5
2. Masalah jurang dan ego isu tidak membawa
kepada konflik antara pekerja yang baru dan
berpengalaman sederhana.
1 2 3 4 5
3. Pekerja baru tidak terlibat dalam proses
membuat keputusan dan menyelesaikan
masalah.
1 2 3 4 5
4. Saya boleh berkawan dengan baik dengan
senior saya dan juga dengan junior saya.
1 2 3 4 5
5. Pengalaman lebih penting berbanding
dengan peringkat pendidikan.
1 2 3 4 5
6. Tiada konflik dan kegelisahan emosi dalam
perbezaan status berlaku antara pekerja muda
dan tua.
1 2 3 4 5
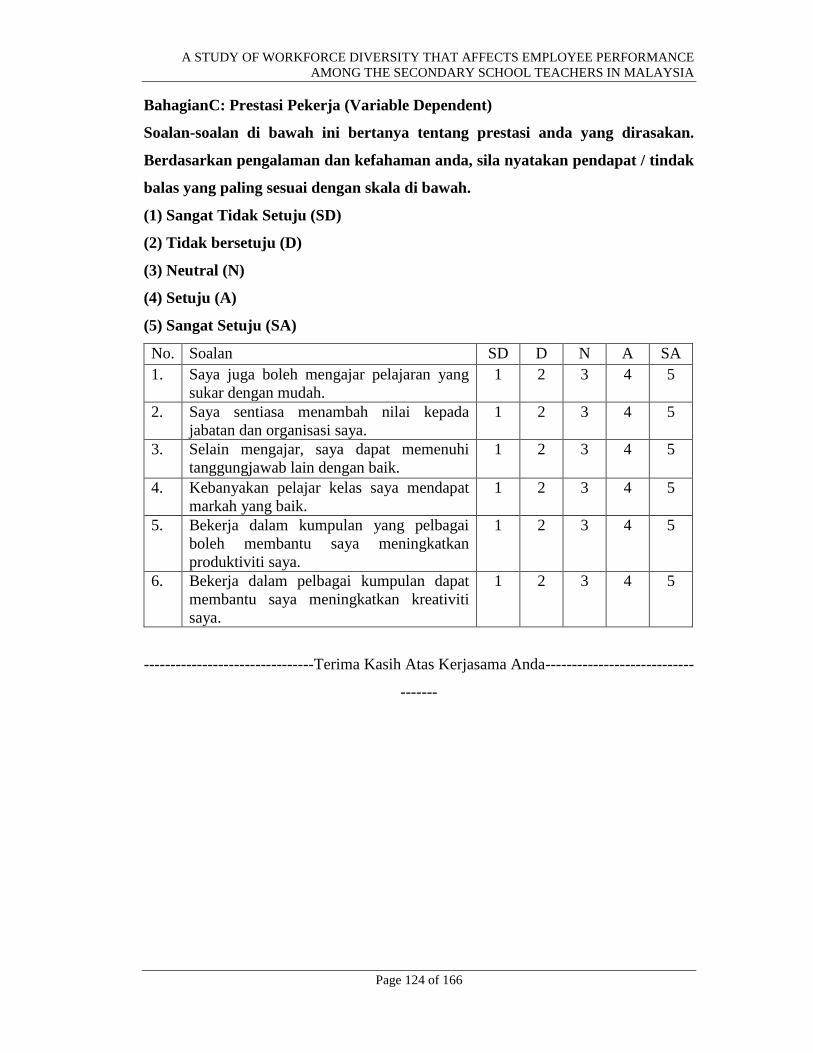
A STUDY OF WORKFORCE DIVERSITY THAT AFFECTS EMPLOYEE PERFORMANCE
AMONG THE SECONDARY SCHOOL TEACHERS IN MALAYSIA
Page 124 of 166
BahagianC: Prestasi Pekerja (Variable Dependent)
Soalan-soalan di bawah ini bertanya tentang prestasi anda yang dirasakan.
Berdasarkan pengalaman dan kefahaman anda, sila nyatakan pendapat / tindak
balas yang paling sesuai dengan skala di bawah.
(1) Sangat Tidak Setuju (SD)
(2) Tidak bersetuju (D)
(3) Neutral (N)
(4) Setuju (A)
(5) Sangat Setuju (SA)
No. Soalan SD D N A SA
1. Saya juga boleh mengajar pelajaran yang
sukar dengan mudah.
1 2 3 4 5
2. Saya sentiasa menambah nilai kepada
jabatan dan organisasi saya.
1 2 3 4 5
3. Selain mengajar, saya dapat memenuhi
tanggungjawab lain dengan baik.
1 2 3 4 5
4. Kebanyakan pelajar kelas saya mendapat
markah yang baik.
1 2 3 4 5
5. Bekerja dalam kumpulan yang pelbagai
boleh membantu saya meningkatkan
produktiviti saya.
1 2 3 4 5
6. Bekerja dalam pelbagai kumpulan dapat
membantu saya meningkatkan kreativiti
saya.
1 2 3 4 5
--------------------------------Terima Kasih Atas Kerjasama Anda----------------------------
-------
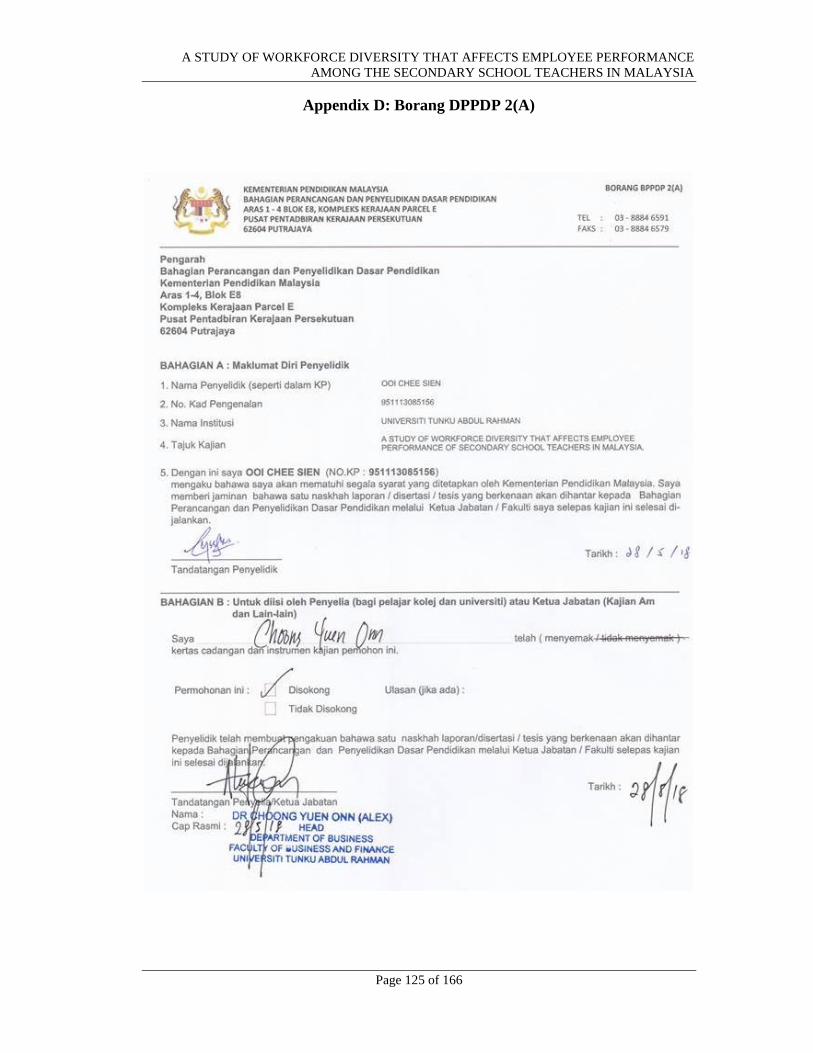
A STUDY OF WORKFORCE DIVERSITY THAT AFFECTS EMPLOYEE PERFORMANCE
AMONG THE SECONDARY SCHOOL TEACHERS IN MALAYSIA
Page 125 of 166
Appendix D: Borang DPPDP 2(A)
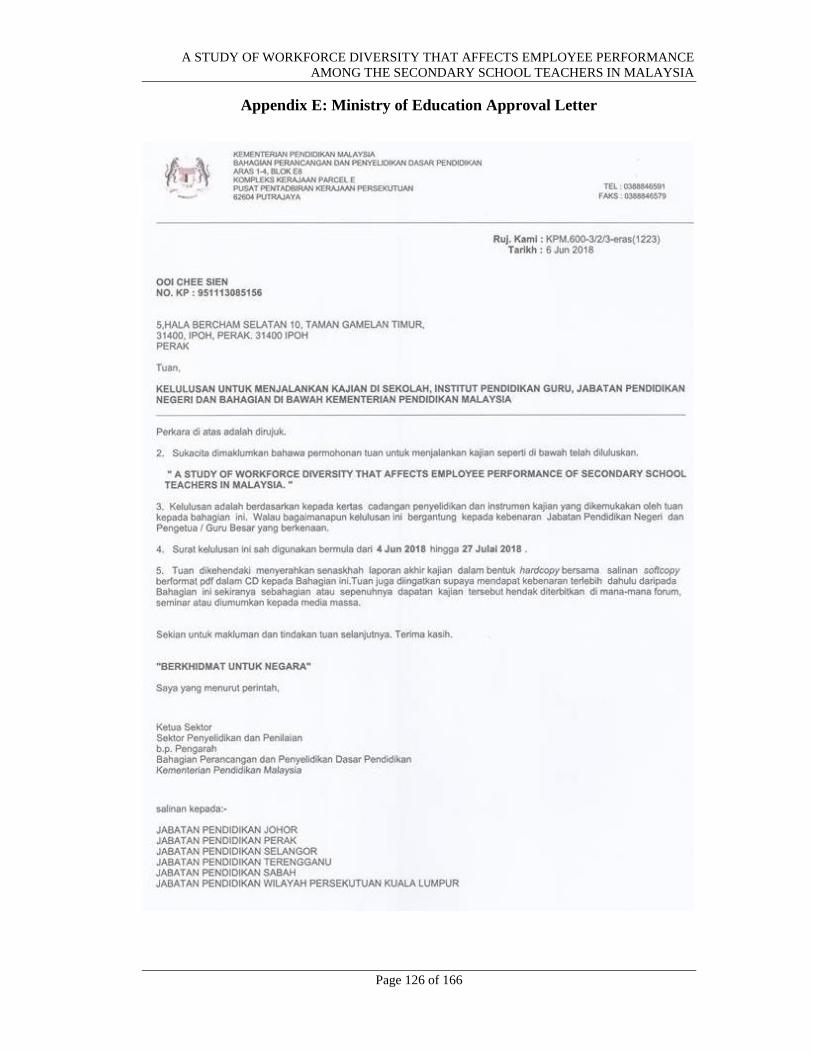
A STUDY OF WORKFORCE DIVERSITY THAT AFFECTS EMPLOYEE PERFORMANCE
AMONG THE SECONDARY SCHOOL TEACHERS IN MALAYSIA
Page 126 of 166
Appendix E: Ministry of Education Approval Letter
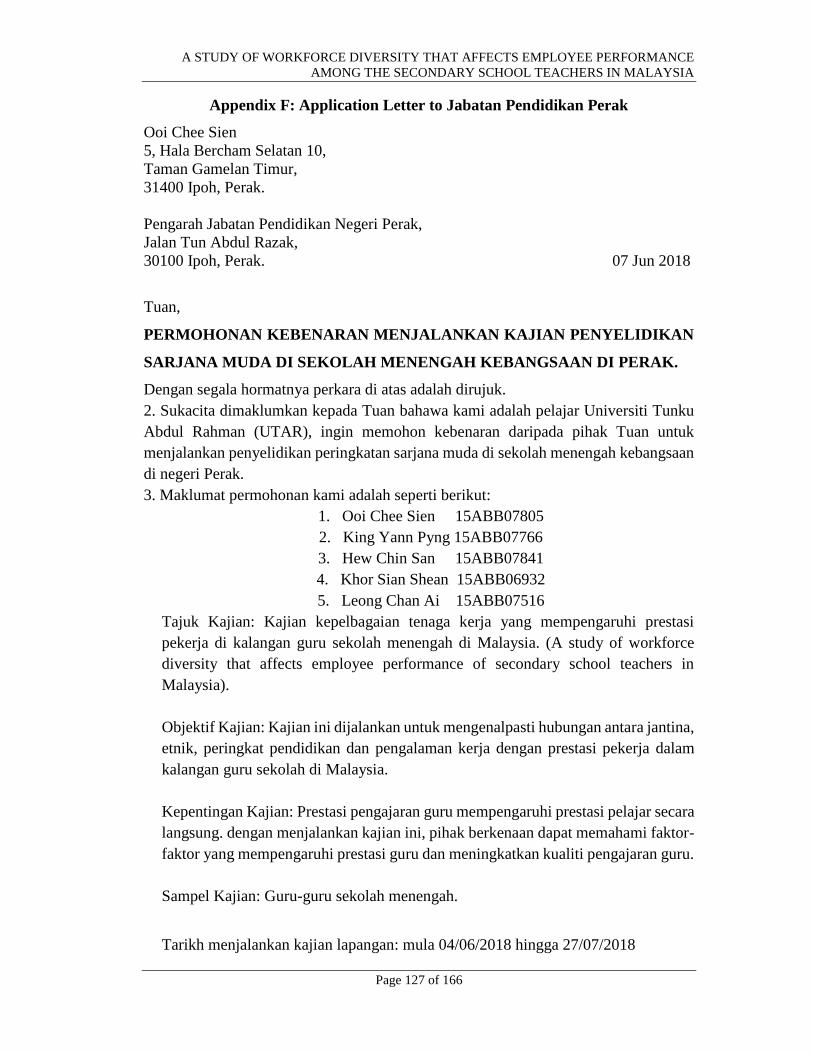
A STUDY OF WORKFORCE DIVERSITY THAT AFFECTS EMPLOYEE PERFORMANCE
AMONG THE SECONDARY SCHOOL TEACHERS IN MALAYSIA
Page 127 of 166
Appendix F: Application Letter to Jabatan Pendidikan Perak
Ooi Chee Sien
5, Hala Bercham Selatan 10,
Taman Gamelan Timur,
31400 Ipoh, Perak.
Pengarah Jabatan Pendidikan Negeri Perak,
Jalan Tun Abdul Razak,
30100 Ipoh, Perak. 07 Jun 2018
Tuan,
PERMOHONAN KEBENARAN MENJALANKAN KAJIAN PENYELIDIKAN
SARJANA MUDA DI SEKOLAH MENENGAH KEBANGSAAN DI PERAK.
Dengan segala hormatnya perkara di atas adalah dirujuk.
2. Sukacita dimaklumkan kepada Tuan bahawa kami adalah pelajar Universiti Tunku
Abdul Rahman (UTAR), ingin memohon kebenaran daripada pihak Tuan untuk
menjalankan penyelidikan peringkatan sarjana muda di sekolah menengah kebangsaan
di negeri Perak.
3. Maklumat permohonan kami adalah seperti berikut:
1. Ooi Chee Sien 15ABB07805
2. King Yann Pyng 15ABB07766
3. Hew Chin San 15ABB07841
4. Khor Sian Shean 15ABB06932
5. Leong Chan Ai 15ABB07516
Tajuk Kajian: Kajian kepelbagaian tenaga kerja yang mempengaruhi prestasi
pekerja di kalangan guru sekolah menengah di Malaysia. (A study of workforce
diversity that affects employee performance of secondary school teachers in
Malaysia).
Objektif Kajian: Kajian ini dijalankan untuk mengenalpasti hubungan antara jantina,
etnik, peringkat pendidikan dan pengalaman kerja dengan prestasi pekerja dalam
kalangan guru sekolah di Malaysia.
Kepentingan Kajian: Prestasi pengajaran guru mempengaruhi prestasi pelajar secara
langsung. dengan menjalankan kajian ini, pihak berkenaan dapat memahami faktor-
faktor yang mempengaruhi prestasi guru dan meningkatkan kualiti pengajaran guru.
Sampel Kajian: Guru-guru sekolah menengah.
Tarikh menjalankan kajian lapangan: mula 04/06/2018 hingga 27/07/2018
A STUDY OF WORKFORCE DIVERSITY THAT AFFECTS EMPLOYEE PERFORMANCE
AMONG THE SECONDARY SCHOOL TEACHERS IN MALAYSIA
Page 128 of 166
4. Bersama-sama surat ini kami sertakan surat kebenaran menjalankan penyelidikan
dari Kementerian Pendidikan Malaysia, Bahagian Perancangan dan Penyelidikan
Dasar Pedidikan untuk rujukan tuan.
5. Sehubungan dengan itu, kami memohon kepada Tuan agar kami memperoleh
kebenaran untuk menjalankan penyelidikan demi mendapatkan data sokongan yang
tepat serta benar untuk kajian kami.
Sekian, Terima Kasih.
Yang Benar,
Ooi Chee Sien
951113-08-5156
015-5158009
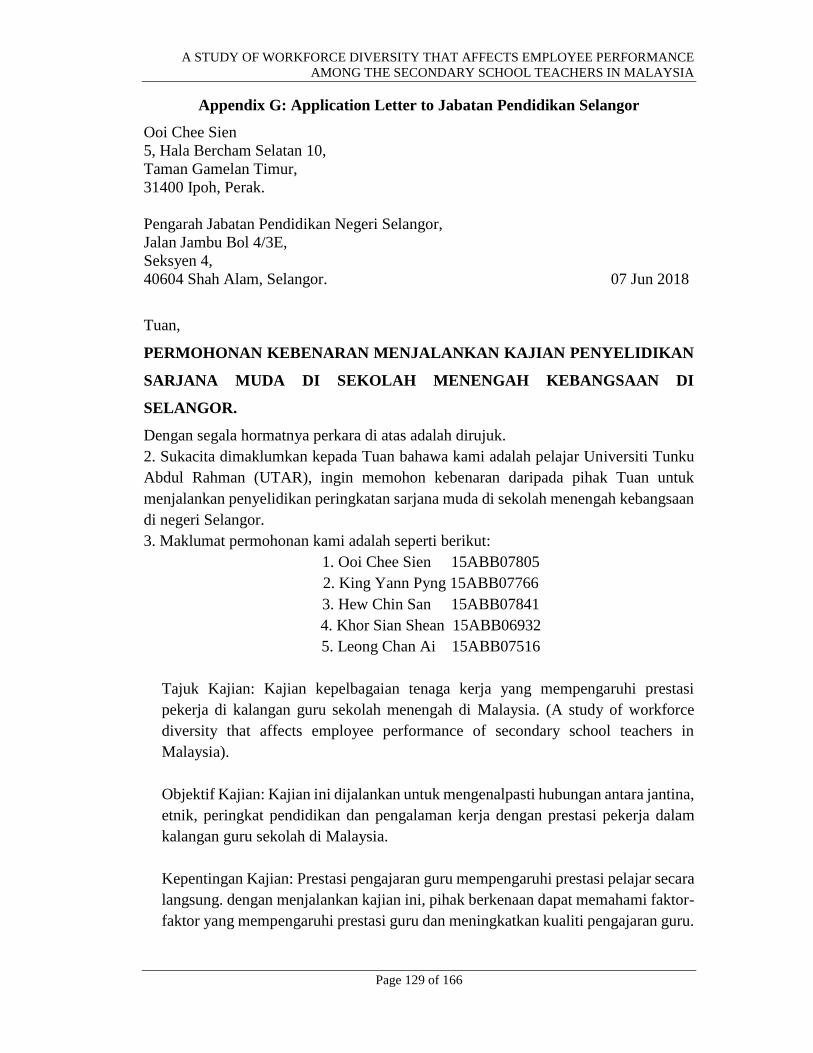
A STUDY OF WORKFORCE DIVERSITY THAT AFFECTS EMPLOYEE PERFORMANCE
AMONG THE SECONDARY SCHOOL TEACHERS IN MALAYSIA
Page 129 of 166
Appendix G: Application Letter to Jabatan Pendidikan Selangor
Ooi Chee Sien
5, Hala Bercham Selatan 10,
Taman Gamelan Timur,
31400 Ipoh, Perak.
Pengarah Jabatan Pendidikan Negeri Selangor,
Jalan Jambu Bol 4/3E,
Seksyen 4,
40604 Shah Alam, Selangor. 07 Jun 2018
Tuan,
PERMOHONAN KEBENARAN MENJALANKAN KAJIAN PENYELIDIKAN
SARJANA MUDA DI SEKOLAH MENENGAH KEBANGSAAN DI
SELANGOR.
Dengan segala hormatnya perkara di atas adalah dirujuk.
2. Sukacita dimaklumkan kepada Tuan bahawa kami adalah pelajar Universiti Tunku
Abdul Rahman (UTAR), ingin memohon kebenaran daripada pihak Tuan untuk
menjalankan penyelidikan peringkatan sarjana muda di sekolah menengah kebangsaan
di negeri Selangor.
3. Maklumat permohonan kami adalah seperti berikut:
1. Ooi Chee Sien 15ABB07805
2. King Yann Pyng 15ABB07766
3. Hew Chin San 15ABB07841
4. Khor Sian Shean 15ABB06932
5. Leong Chan Ai 15ABB07516
Tajuk Kajian: Kajian kepelbagaian tenaga kerja yang mempengaruhi prestasi
pekerja di kalangan guru sekolah menengah di Malaysia. (A study of workforce
diversity that affects employee performance of secondary school teachers in
Malaysia).
Objektif Kajian: Kajian ini dijalankan untuk mengenalpasti hubungan antara jantina,
etnik, peringkat pendidikan dan pengalaman kerja dengan prestasi pekerja dalam
kalangan guru sekolah di Malaysia.
Kepentingan Kajian: Prestasi pengajaran guru mempengaruhi prestasi pelajar secara
langsung. dengan menjalankan kajian ini, pihak berkenaan dapat memahami faktor-
faktor yang mempengaruhi prestasi guru dan meningkatkan kualiti pengajaran guru.
A STUDY OF WORKFORCE DIVERSITY THAT AFFECTS EMPLOYEE PERFORMANCE
AMONG THE SECONDARY SCHOOL TEACHERS IN MALAYSIA
Page 130 of 166
Sampel Kajian: Guru-guru yang berada di:
1) Sekolah Menengah Kebangsaan Bukit Rahman Putra
2) Sekolah Menengah Kebangsaan Bandar Baru Sungai Buloh
3) Sekolah Menengah KebangsaanTaman Ehsan
4) Sekolah Menengah Kebangsaan Sierramas
5) Sekolah Menengah Kebangsaan Kepong
6) Sekolah Menengah Kebangsaan Bukit Gading
Tarikh menjalankan kajian lapangan: mula 04/06/2018 hingga 27/07/2018
4. Bersama-sama surat ini kami sertakan surat kebenaran menjalankan penyelidikan
dari Kementerian Pendidikan Malaysia, Bahagian Perancangan dan Penyelidikan
Dasar Pedidikan untuk rujukan tuan.
5. Sehubungan dengan itu, kami memohon kepada Tuan agar kami memperoleh
kebenaran untuk menjalankan penyelidikan demi mendapatkan data sokongan yang
tepat serta benar untuk kajian kami.
Sekian, Terima Kasih.
Yang Benar,
Ooi Chee Sien
951113-08-5156
015-5158009
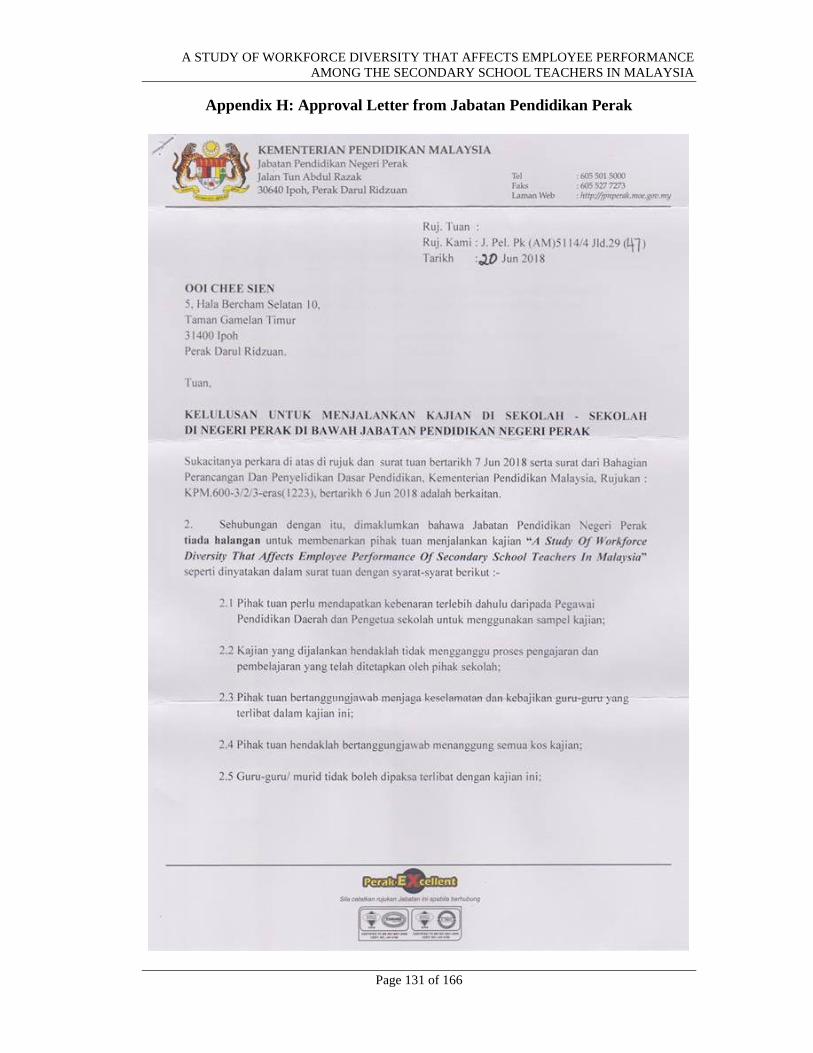
A STUDY OF WORKFORCE DIVERSITY THAT AFFECTS EMPLOYEE PERFORMANCE
AMONG THE SECONDARY SCHOOL TEACHERS IN MALAYSIA
Page 131 of 166
Appendix H: Approval Letter from Jabatan Pendidikan Perak
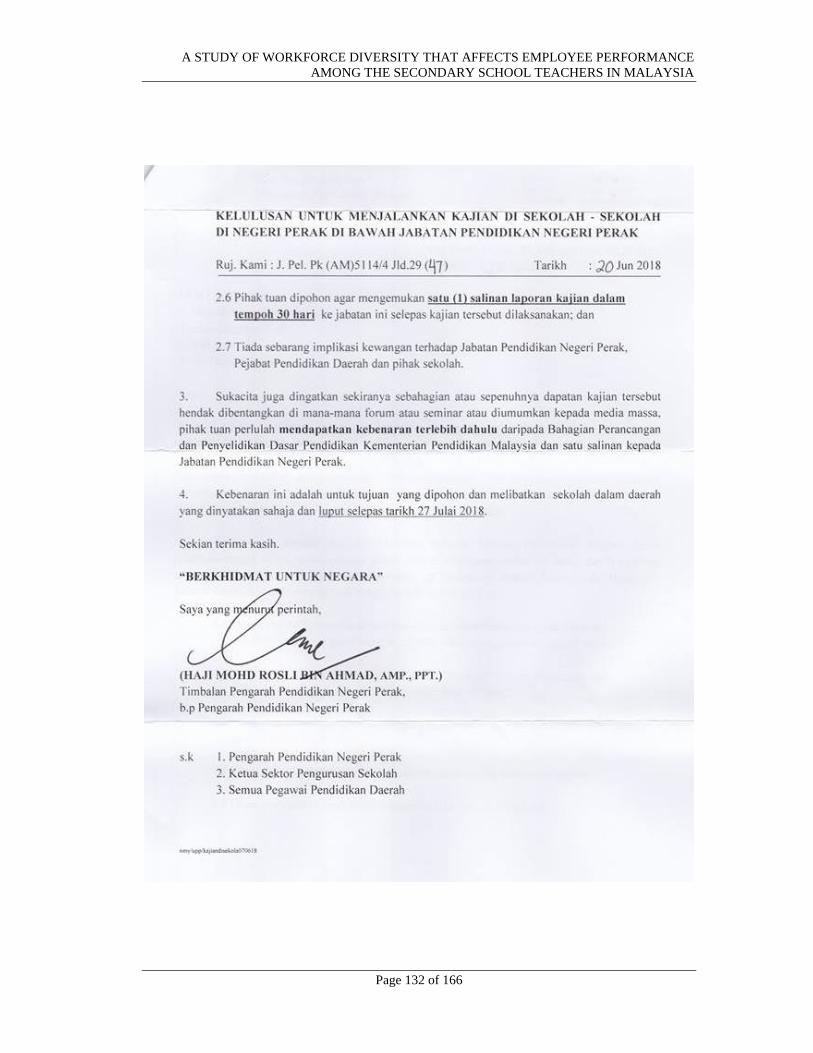
A STUDY OF WORKFORCE DIVERSITY THAT AFFECTS EMPLOYEE PERFORMANCE
AMONG THE SECONDARY SCHOOL TEACHERS IN MALAYSIA
Page 132 of 166
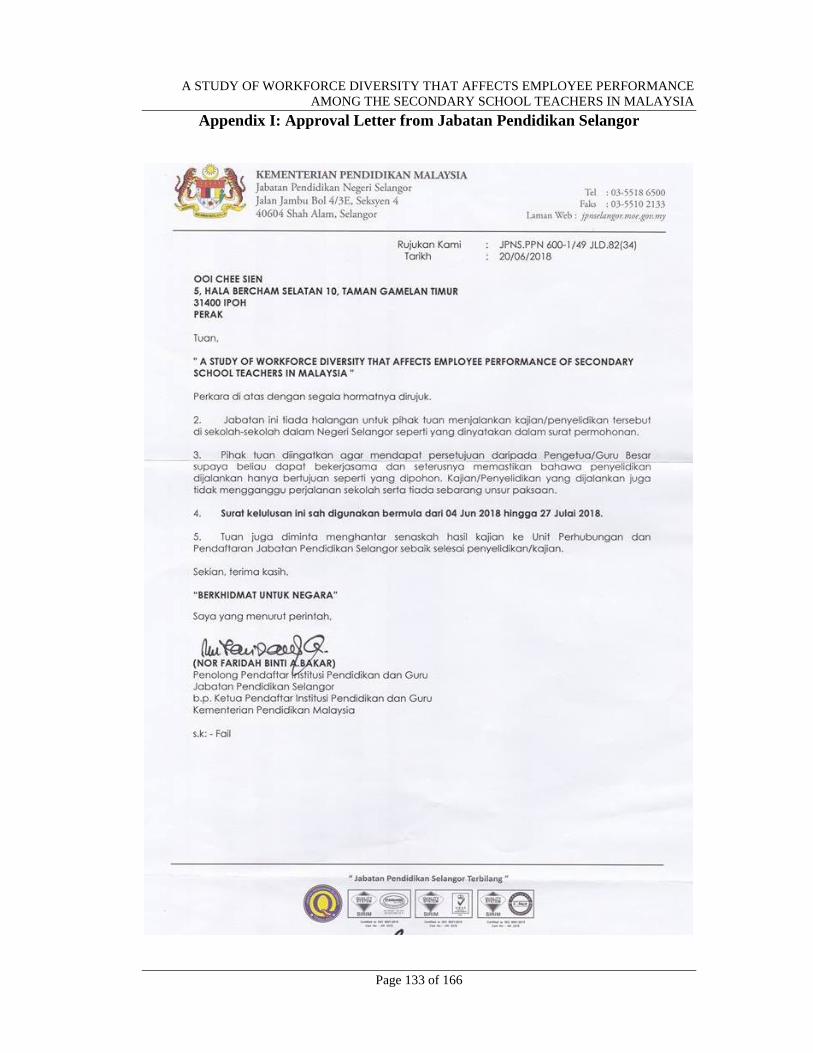
A STUDY OF WORKFORCE DIVERSITY THAT AFFECTS EMPLOYEE PERFORMANCE
AMONG THE SECONDARY SCHOOL TEACHERS IN MALAYSIA
Page 133 of 166
Appendix I: Approval Letter from Jabatan Pendidikan Selangor
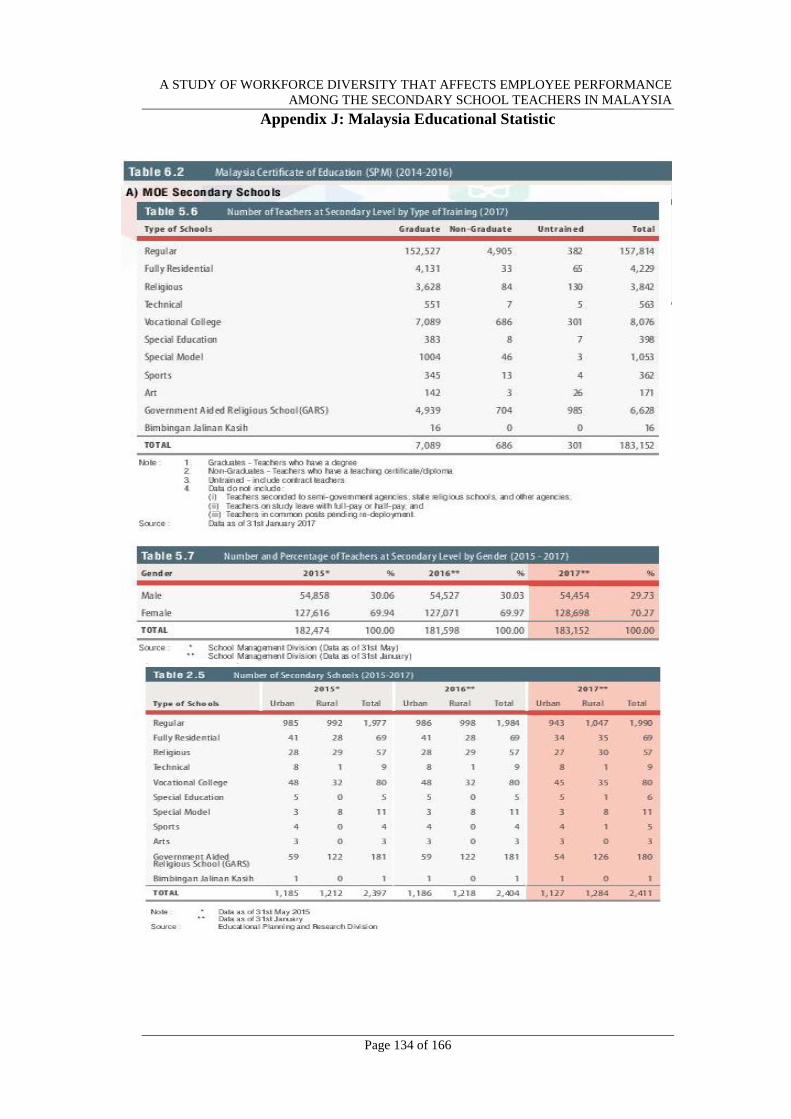
A STUDY OF WORKFORCE DIVERSITY THAT AFFECTS EMPLOYEE PERFORMANCE
AMONG THE SECONDARY SCHOOL TEACHERS IN MALAYSIA
Page 134 of 166
Appendix J: Malaysia Educational Statistic
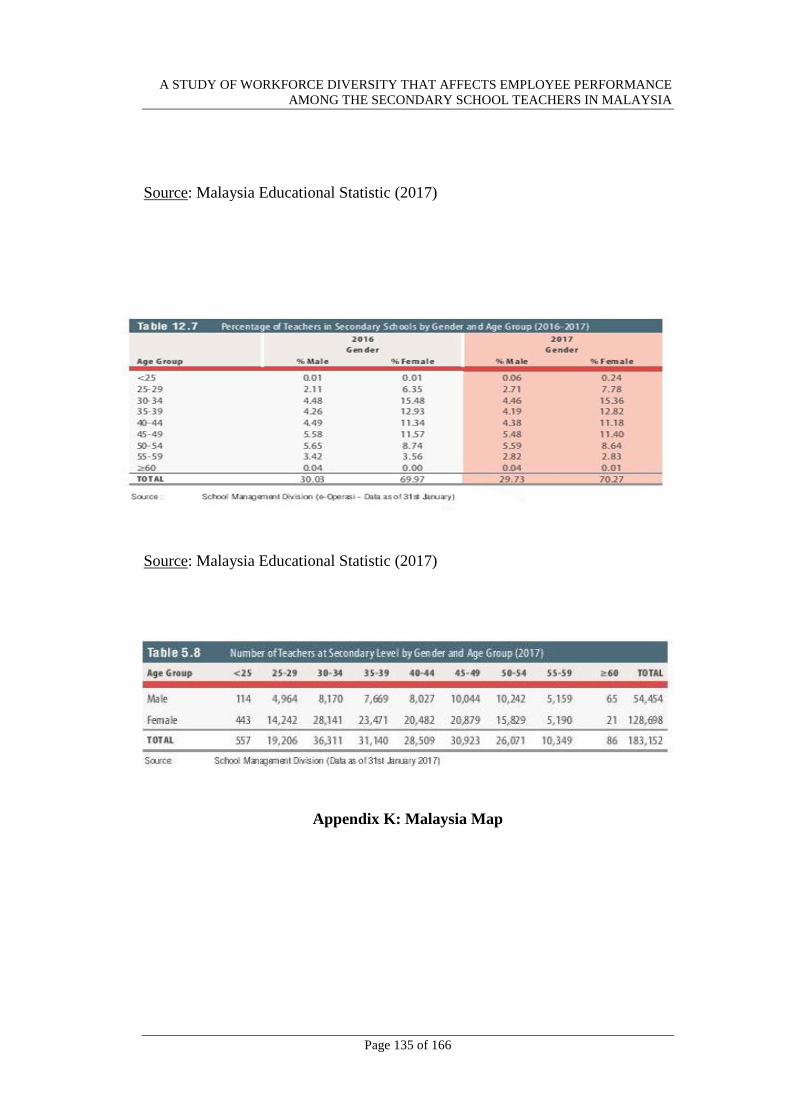
A STUDY OF WORKFORCE DIVERSITY THAT AFFECTS EMPLOYEE PERFORMANCE
AMONG THE SECONDARY SCHOOL TEACHERS IN MALAYSIA
Page 135 of 166
Source: Malaysia Educational Statistic (2017)
Source: Malaysia Educational Statistic (2017)
Appendix K: Malaysia Map
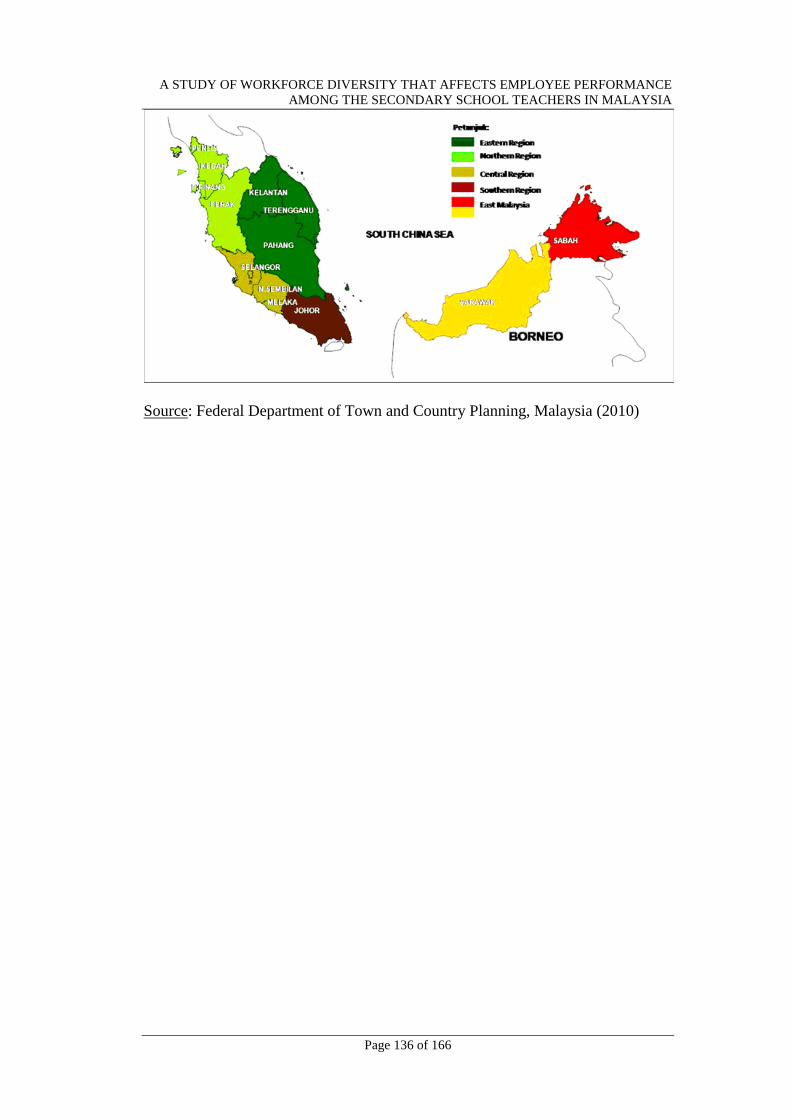
A STUDY OF WORKFORCE DIVERSITY THAT AFFECTS EMPLOYEE PERFORMANCE
AMONG THE SECONDARY SCHOOL TEACHERS IN MALAYSIA
Page 136 of 166
Source: Federal Department of Town and Country Planning, Malaysia (2010)
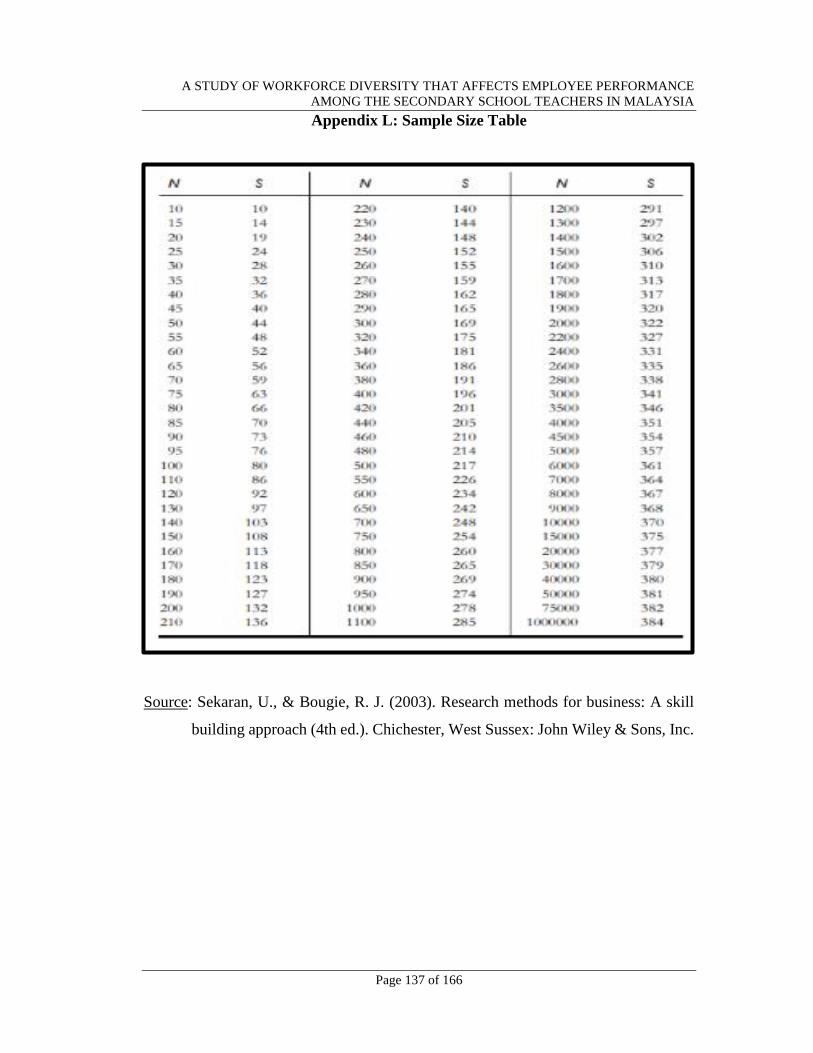
A STUDY OF WORKFORCE DIVERSITY THAT AFFECTS EMPLOYEE PERFORMANCE
AMONG THE SECONDARY SCHOOL TEACHERS IN MALAYSIA
Page 137 of 166
Appendix L: Sample Size Table
Source: Sekaran, U., & Bougie, R. J. (2003). Research methods for business: A skill
building approach (4th ed.). Chichester, West Sussex: John Wiley & Sons, Inc.
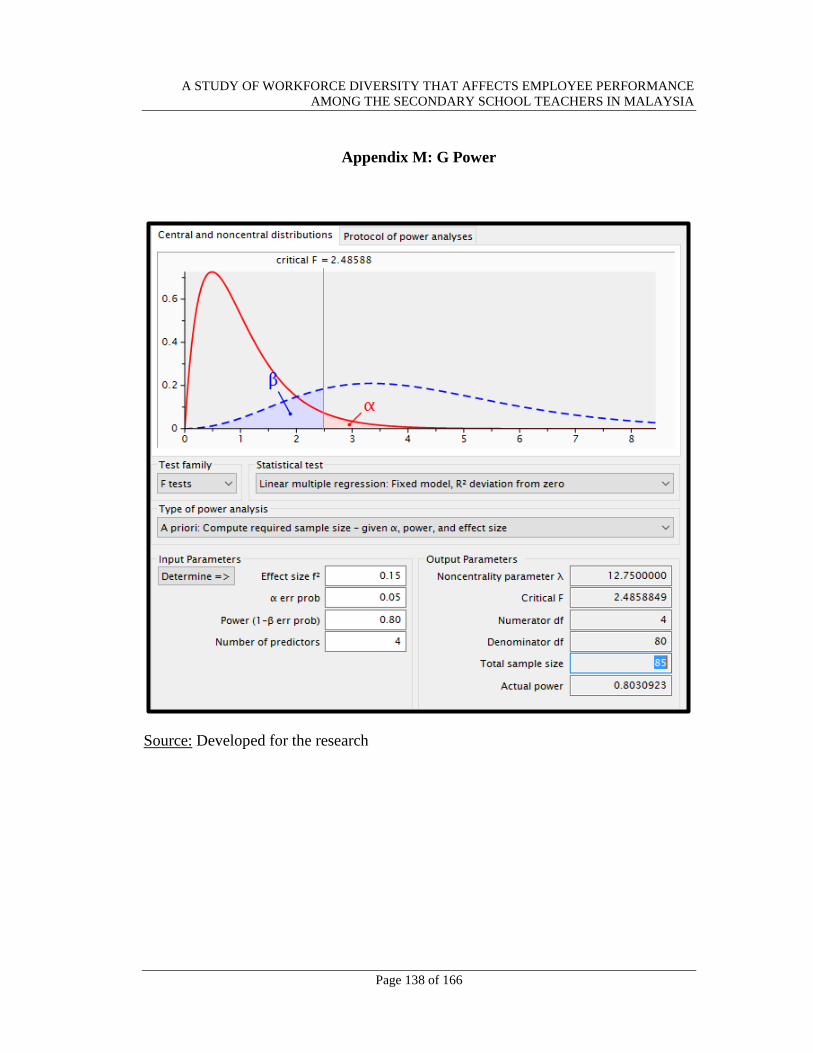
A STUDY OF WORKFORCE DIVERSITY THAT AFFECTS EMPLOYEE PERFORMANCE
AMONG THE SECONDARY SCHOOL TEACHERS IN MALAYSIA
Page 138 of 166
Appendix M: G Power
Source: Developed for the research
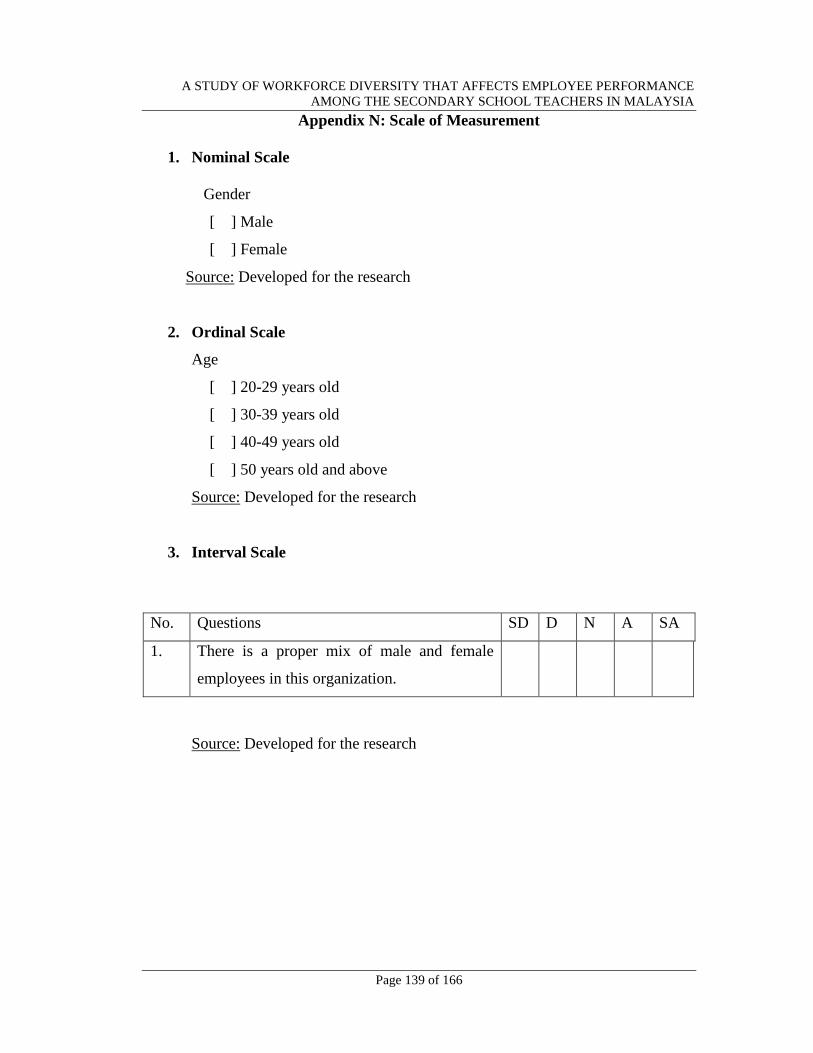
A STUDY OF WORKFORCE DIVERSITY THAT AFFECTS EMPLOYEE PERFORMANCE
AMONG THE SECONDARY SCHOOL TEACHERS IN MALAYSIA
Page 139 of 166
Appendix N: Scale of Measurement
1. Nominal Scale
Gender
[ ] Male
[ ] Female
Source: Developed for the research
2. Ordinal Scale
Age
[ ] 20-29 years old
[ ] 30-39 years old
[ ] 40-49 years old
[ ] 50 years old and above
Source: Developed for the research
3. Interval Scale
Source: Developed for the research
No. Questions SD D N A SA
1. There is a proper mix of male and female
employees in this organization.
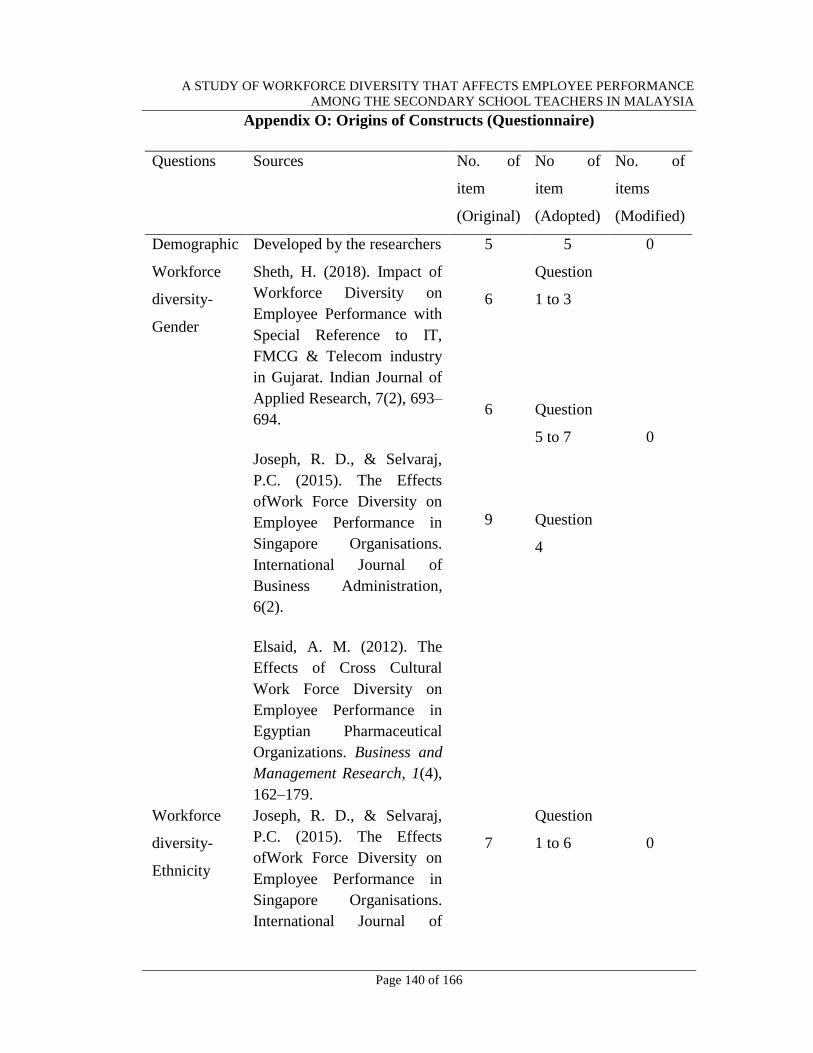
A STUDY OF WORKFORCE DIVERSITY THAT AFFECTS EMPLOYEE PERFORMANCE
AMONG THE SECONDARY SCHOOL TEACHERS IN MALAYSIA
Page 140 of 166
Appendix O: Origins of Constructs (Questionnaire)
Questions Sources No. of
item
(Original)
No of
item
(Adopted)
No. of
items
(Modified)
Demographic Developed by the researchers 5 5 0
Workforce
diversity-
Gender
Sheth, H. (2018). Impact of
Workforce Diversity on
Employee Performance with
Special Reference to IT,
FMCG & Telecom industry
in Gujarat. Indian Journal of
Applied Research, 7(2), 693–
694.
Joseph, R. D., & Selvaraj,
P.C. (2015). The Effects
ofWork Force Diversity on
Employee Performance in
Singapore Organisations.
International Journal of
Business Administration,
6(2).
Elsaid, A. M. (2012). The
Effects of Cross Cultural
Work Force Diversity on
Employee Performance in
Egyptian Pharmaceutical
Organizations. Business and
Management Research, 1(4),
162–179.
6
6
9
Question
1 to 3
Question
5 to 7
Question
4
0
Workforce
diversity-
Ethnicity
Joseph, R. D., & Selvaraj,
P.C. (2015). The Effects
ofWork Force Diversity on
Employee Performance in
Singapore Organisations.
International Journal of
7
Question
1 to 6
0
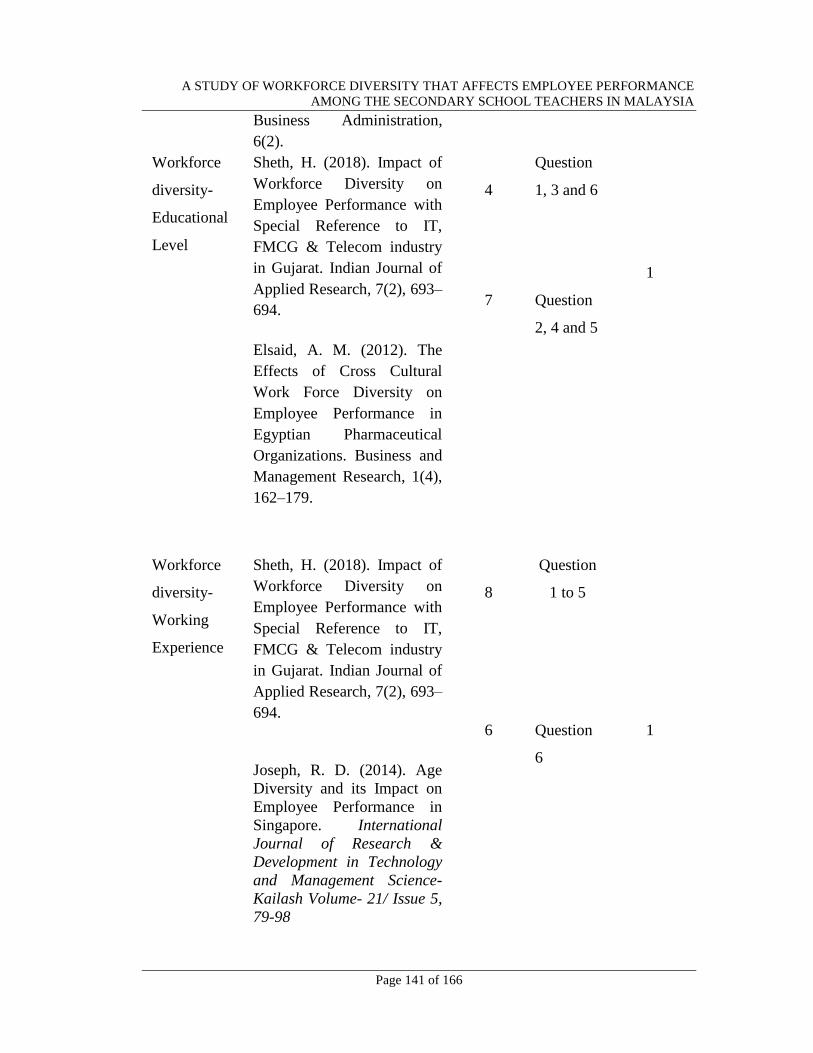
A STUDY OF WORKFORCE DIVERSITY THAT AFFECTS EMPLOYEE PERFORMANCE
AMONG THE SECONDARY SCHOOL TEACHERS IN MALAYSIA
Page 141 of 166
Business Administration,
6(2).
Workforce
diversity-
Educational
Level
Sheth, H. (2018). Impact of
Workforce Diversity on
Employee Performance with
Special Reference to IT,
FMCG & Telecom industry
in Gujarat. Indian Journal of
Applied Research, 7(2), 693–
694.
Elsaid, A. M. (2012). The
Effects of Cross Cultural
Work Force Diversity on
Employee Performance in
Egyptian Pharmaceutical
Organizations. Business and
Management Research, 1(4),
162–179.
4
7
Question
1, 3 and 6
Question
2, 4 and 5
1
Workforce
diversity-
Working
Experience
Sheth, H. (2018). Impact of
Workforce Diversity on
Employee Performance with
Special Reference to IT,
FMCG & Telecom industry
in Gujarat. Indian Journal of
Applied Research, 7(2), 693–
694.
Joseph, R. D. (2014). Age
Diversity and its Impact on
Employee Performance in
Singapore. International
Journal of Research &
Development in Technology
and Management Science-
Kailash Volume- 21/ Issue 5,
79-98
8
6
Question
1 to 5
Question
6
1
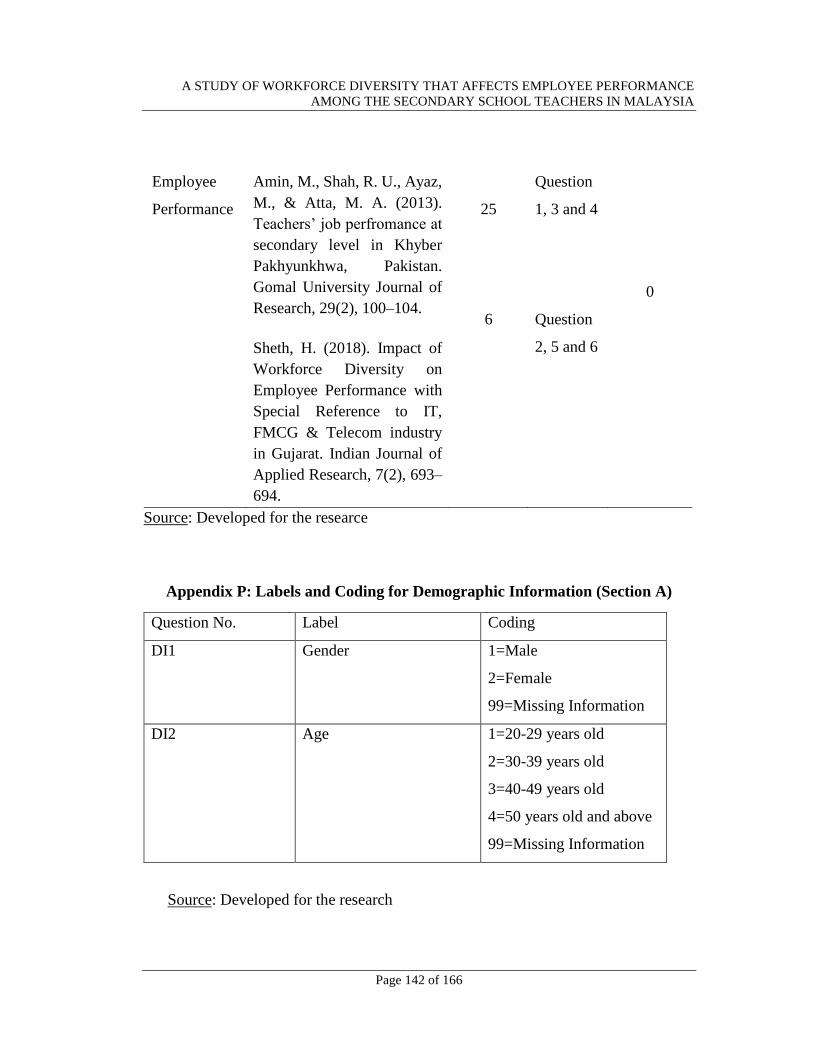
A STUDY OF WORKFORCE DIVERSITY THAT AFFECTS EMPLOYEE PERFORMANCE
AMONG THE SECONDARY SCHOOL TEACHERS IN MALAYSIA
Page 142 of 166
Source: Developed for the researce
Appendix P: Labels and Coding for Demographic Information (Section A)
Source: Developed for the research
Employee
Performance
Amin, M., Shah, R. U., Ayaz,
M., & Atta, M. A. (2013).
Teachers’ job perfromance at
secondary level in Khyber
Pakhyunkhwa, Pakistan.
Gomal University Journal of
Research, 29(2), 100–104.
Sheth, H. (2018). Impact of
Workforce Diversity on
Employee Performance with
Special Reference to IT,
FMCG & Telecom industry
in Gujarat. Indian Journal of
Applied Research, 7(2), 693–
694.
25
6
Question
1, 3 and 4
Question
2, 5 and 6
0
Question No. Label Coding
DI1 Gender 1=Male
2=Female
99=Missing Information
DI2 Age 1=20-29 years old
2=30-39 years old
3=40-49 years old
4=50 years old and above
99=Missing Information
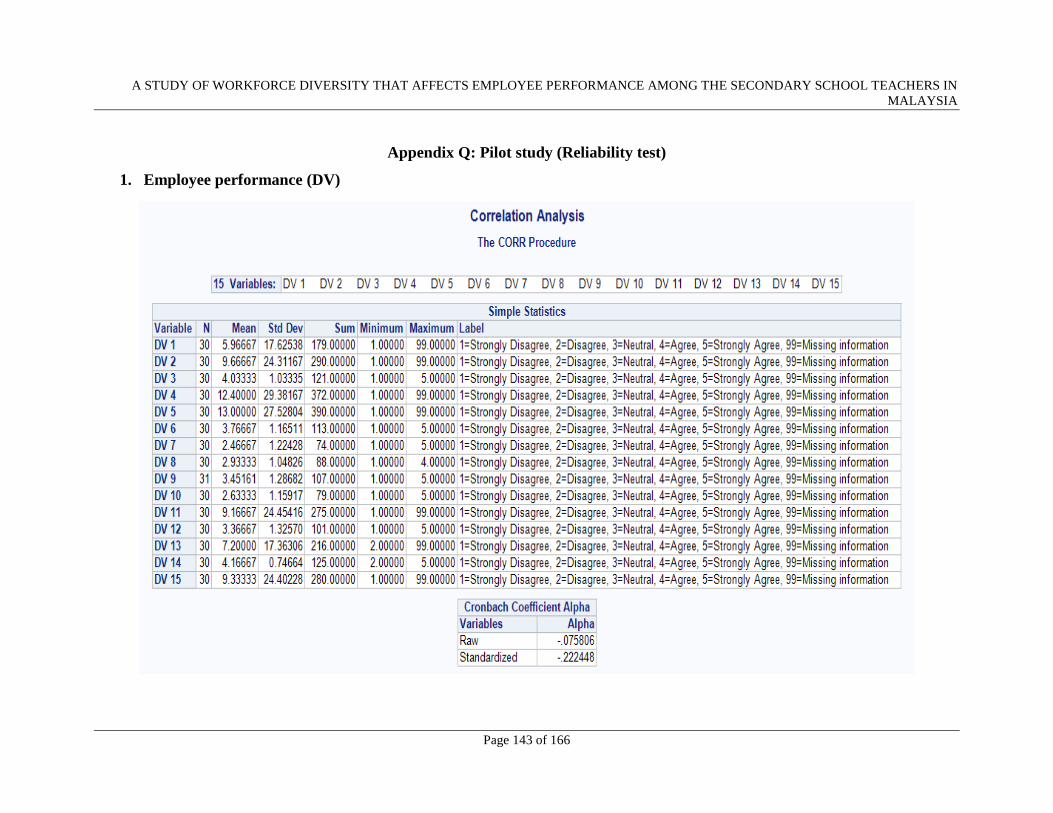
A STUDY OF WORKFORCE DIVERSITY THAT AFFECTS EMPLOYEE PERFORMANCE AMONG THE SECONDARY SCHOOL TEACHERS IN
MALAYSIA
Page 143 of 166
Appendix Q: Pilot study (Reliability test)
1. Employee performance (DV)
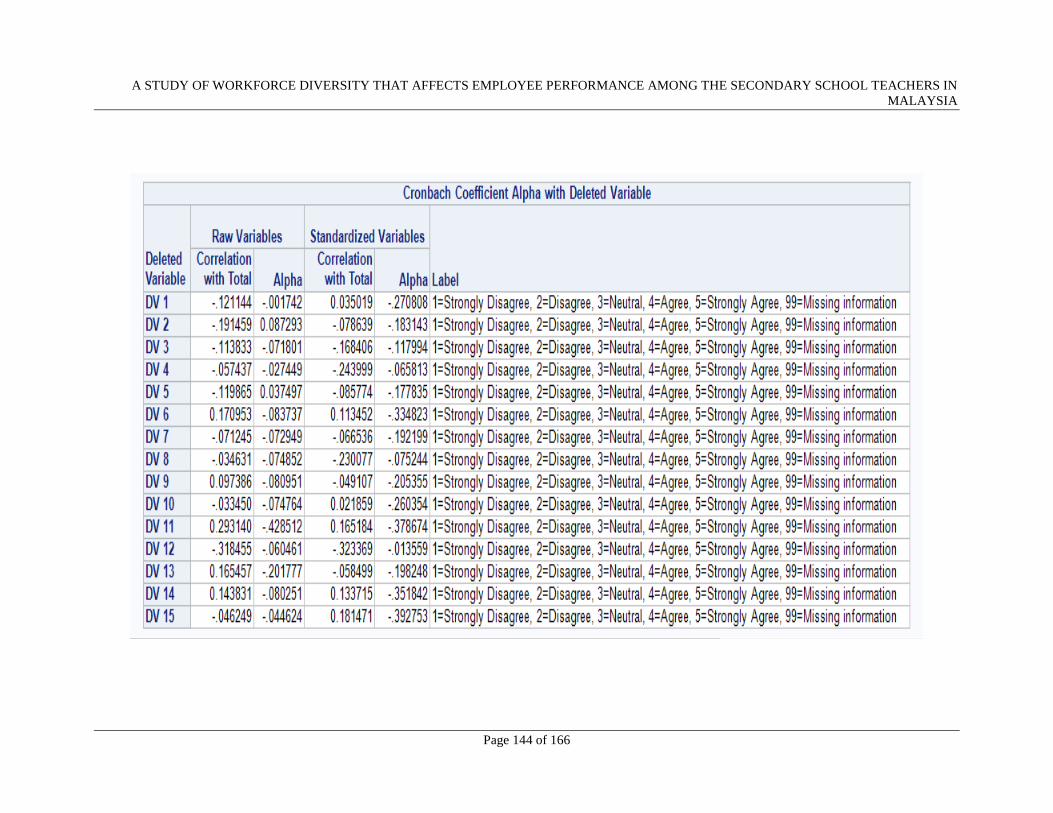
A STUDY OF WORKFORCE DIVERSITY THAT AFFECTS EMPLOYEE PERFORMANCE AMONG THE SECONDARY SCHOOL TEACHERS IN
MALAYSIA
Page 144 of 166
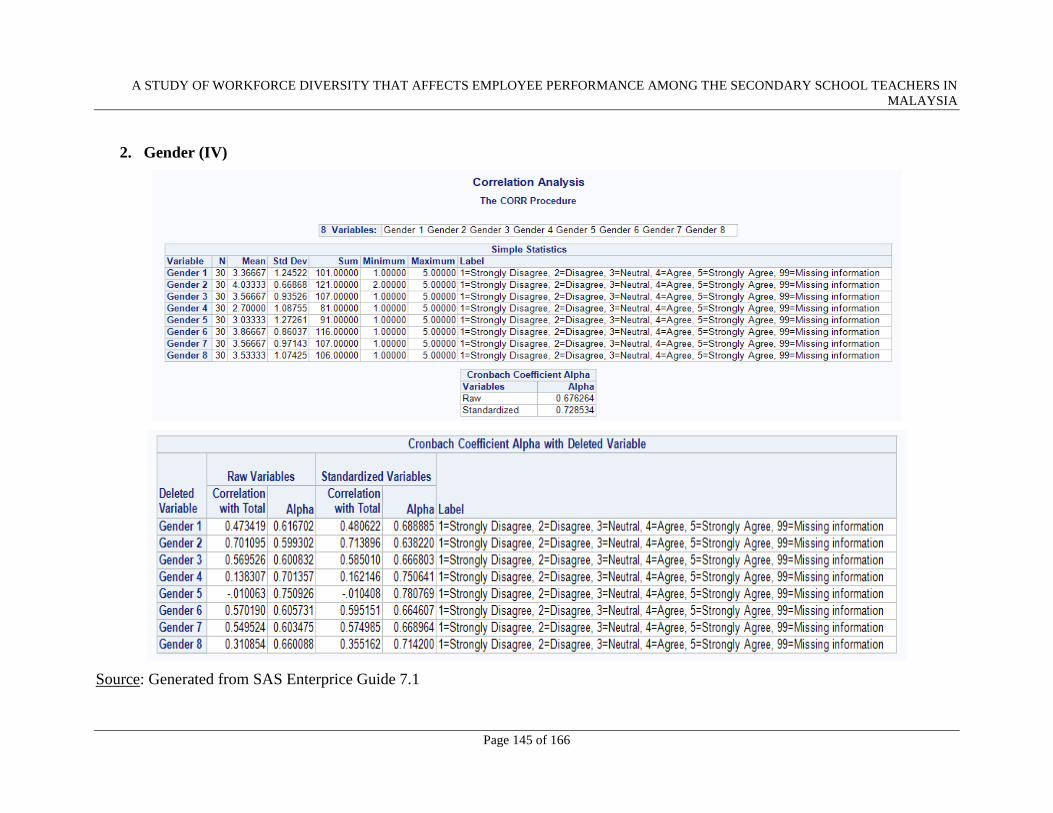
A STUDY OF WORKFORCE DIVERSITY THAT AFFECTS EMPLOYEE PERFORMANCE AMONG THE SECONDARY SCHOOL TEACHERS IN
MALAYSIA
Page 145 of 166
2. Gender (IV)
Source: Generated from SAS Enterprice Guide 7.1
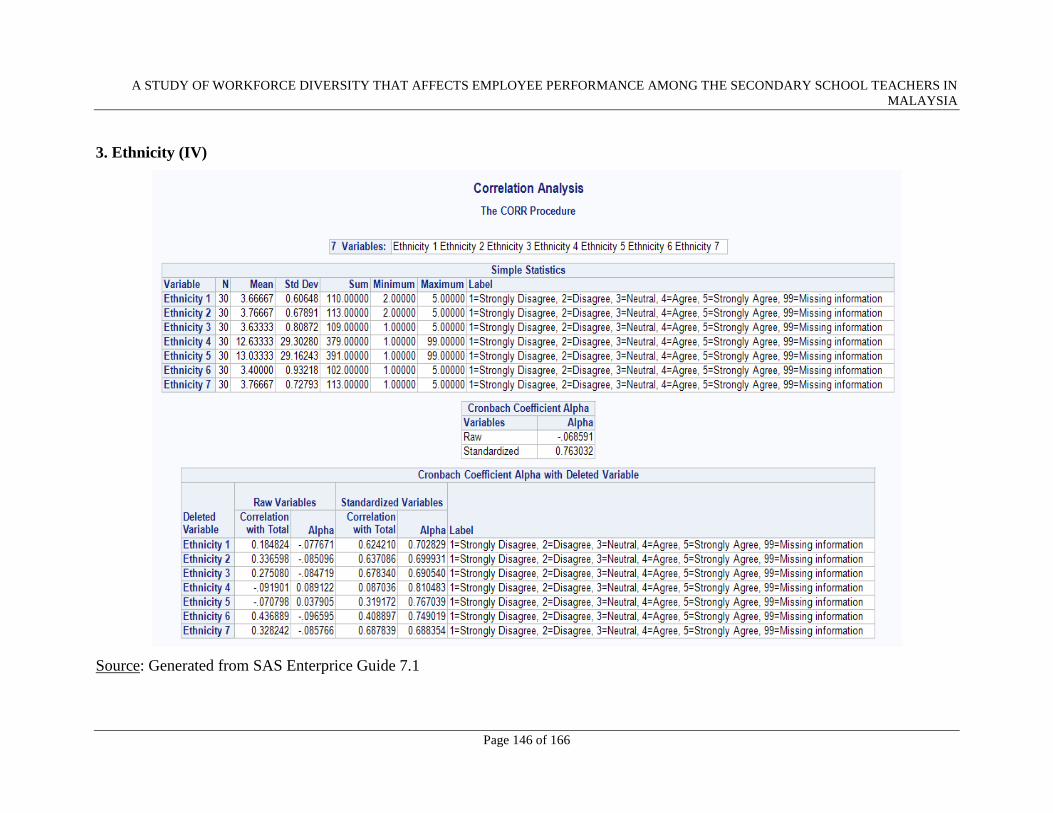
A STUDY OF WORKFORCE DIVERSITY THAT AFFECTS EMPLOYEE PERFORMANCE AMONG THE SECONDARY SCHOOL TEACHERS IN
MALAYSIA
Page 146 of 166
3. Ethnicity (IV)
Source: Generated from SAS Enterprice Guide 7.1
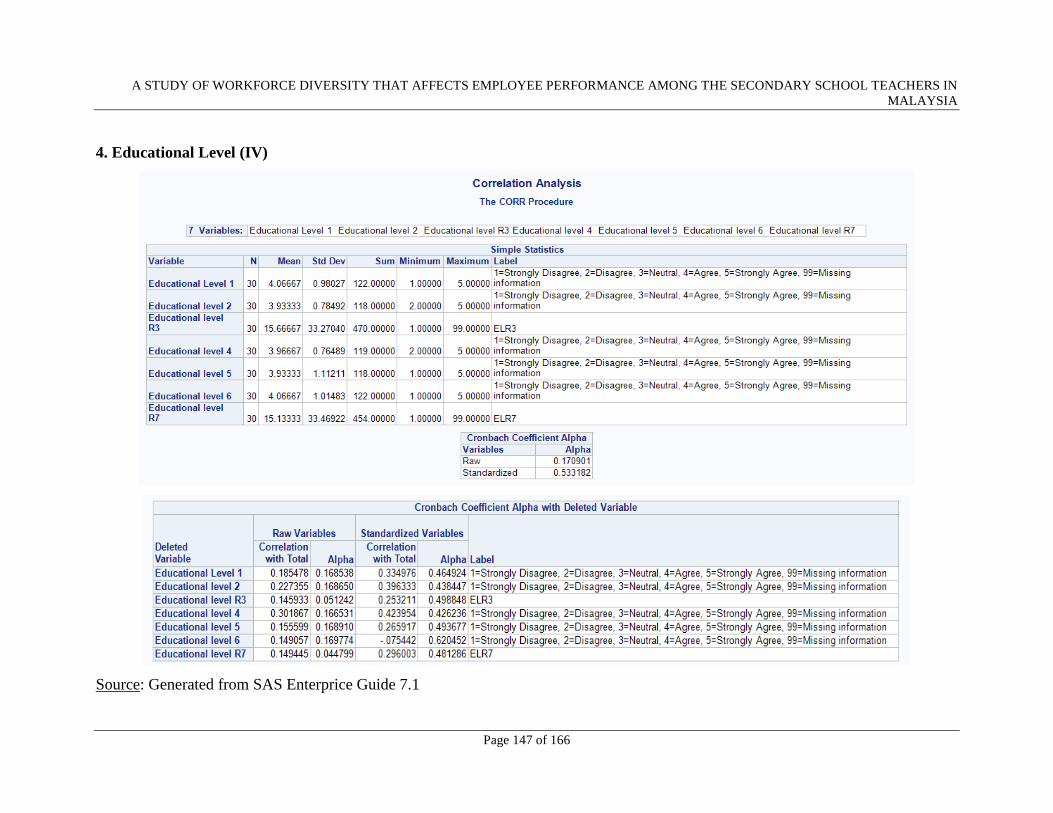
A STUDY OF WORKFORCE DIVERSITY THAT AFFECTS EMPLOYEE PERFORMANCE AMONG THE SECONDARY SCHOOL TEACHERS IN
MALAYSIA
Page 147 of 166
4. Educational Level (IV)
Source: Generated from SAS Enterprice Guide 7.1
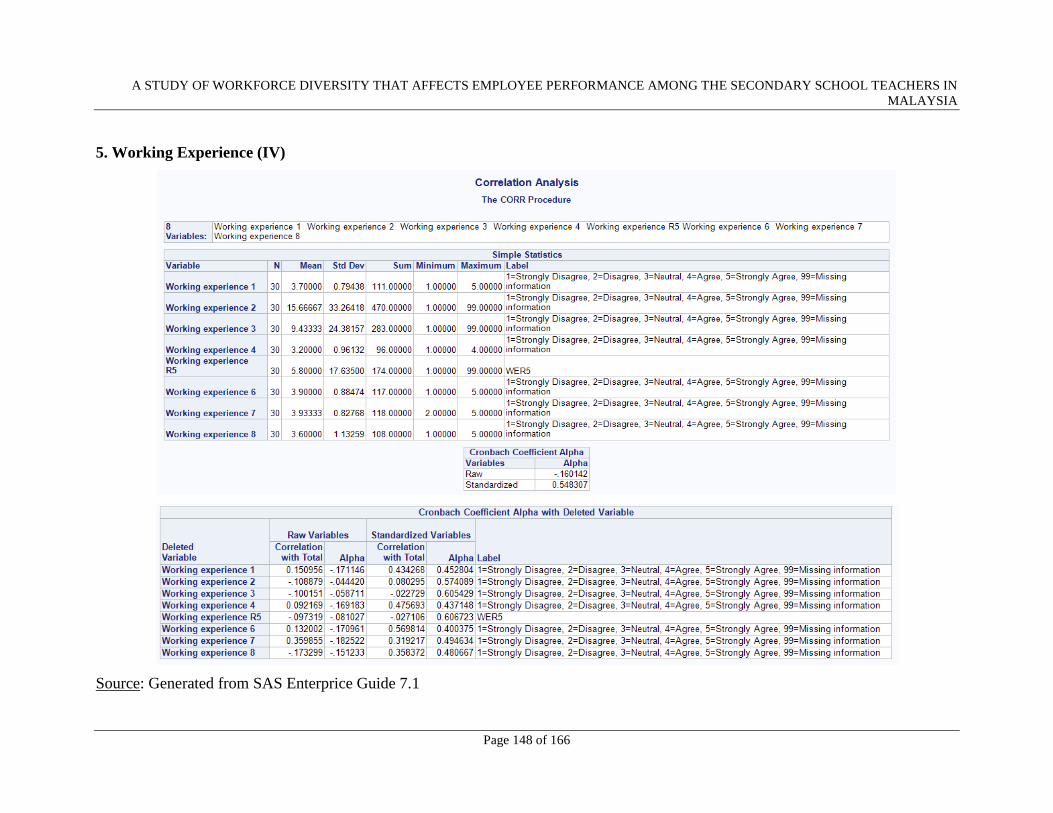
A STUDY OF WORKFORCE DIVERSITY THAT AFFECTS EMPLOYEE PERFORMANCE AMONG THE SECONDARY SCHOOL TEACHERS IN
MALAYSIA
Page 148 of 166
5. Working Experience (IV)
Source: Generated from SAS Enterprice Guide 7.1
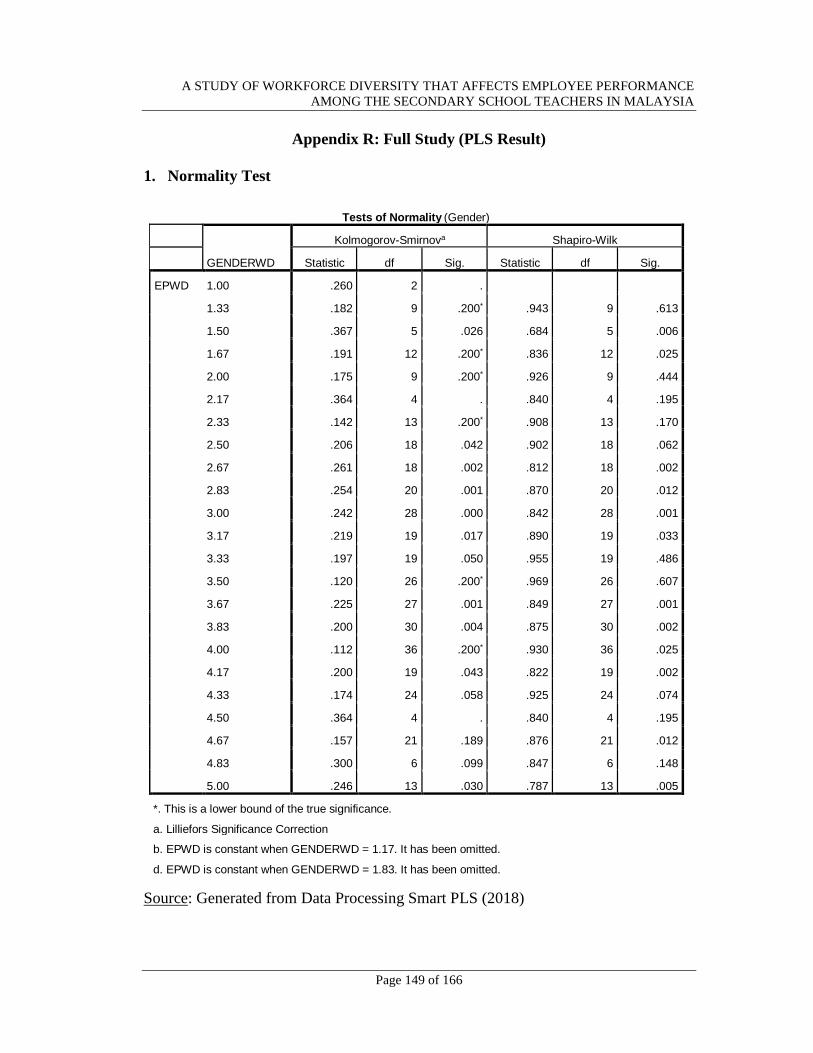
A STUDY OF WORKFORCE DIVERSITY THAT AFFECTS EMPLOYEE PERFORMANCE
AMONG THE SECONDARY SCHOOL TEACHERS IN MALAYSIA
Page 149 of 166
Appendix R: Full Study (PLS Result)
1. Normality Test
Source: Generated from Data Processing Smart PLS (2018)
Tests of Normality (Gender)
GENDERWD
Kolmogorov-Smirnova Shapiro-Wilk
Statistic df Sig. Statistic df Sig.
EPWD 1.00 .260 2 .
1.33 .182 9 .200* .943 9 .613
1.50 .367 5 .026 .684 5 .006
1.67 .191 12 .200* .836 12 .025
2.00 .175 9 .200* .926 9 .444
2.17 .364 4 . .840 4 .195
2.33 .142 13 .200* .908 13 .170
2.50 .206 18 .042 .902 18 .062
2.67 .261 18 .002 .812 18 .002
2.83 .254 20 .001 .870 20 .012
3.00 .242 28 .000 .842 28 .001
3.17 .219 19 .017 .890 19 .033
3.33 .197 19 .050 .955 19 .486
3.50 .120 26 .200* .969 26 .607
3.67 .225 27 .001 .849 27 .001
3.83 .200 30 .004 .875 30 .002
4.00 .112 36 .200* .930 36 .025
4.17 .200 19 .043 .822 19 .002
4.33 .174 24 .058 .925 24 .074
4.50 .364 4 . .840 4 .195
4.67 .157 21 .189 .876 21 .012
4.83 .300 6 .099 .847 6 .148
5.00 .246 13 .030 .787 13 .005
*. This is a lower bound of the true significance.
a. Lilliefors Significance Correction
b. EPWD is constant when GENDERWD = 1.17. It has been omitted.
d. EPWD is constant when GENDERWD = 1.83. It has been omitted.
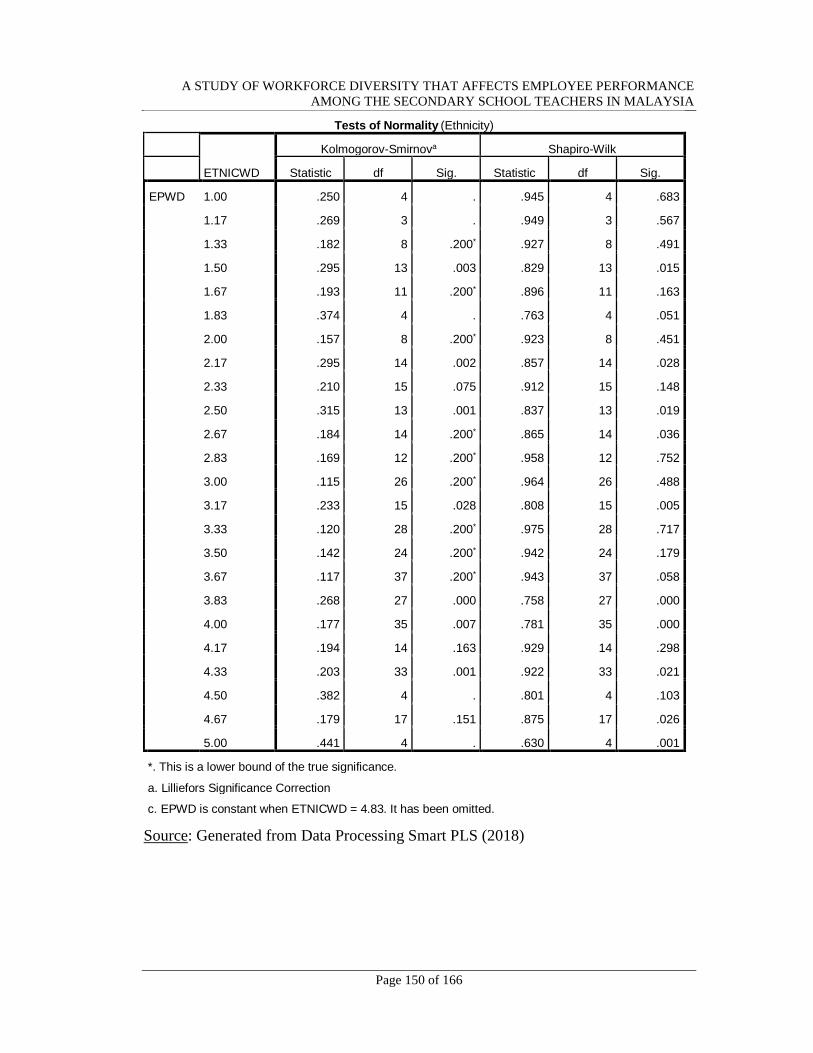
A STUDY OF WORKFORCE DIVERSITY THAT AFFECTS EMPLOYEE PERFORMANCE
AMONG THE SECONDARY SCHOOL TEACHERS IN MALAYSIA
Page 150 of 166
Source: Generated from Data Processing Smart PLS (2018)
Tests of Normality (Ethnicity)
ETNICWD
Kolmogorov-Smirnova Shapiro-Wilk
Statistic df Sig. Statistic df Sig.
EPWD 1.00 .250 4 . .945 4 .683
1.17 .269 3 . .949 3 .567
1.33 .182 8 .200* .927 8 .491
1.50 .295 13 .003 .829 13 .015
1.67 .193 11 .200* .896 11 .163
1.83 .374 4 . .763 4 .051
2.00 .157 8 .200* .923 8 .451
2.17 .295 14 .002 .857 14 .028
2.33 .210 15 .075 .912 15 .148
2.50 .315 13 .001 .837 13 .019
2.67 .184 14 .200* .865 14 .036
2.83 .169 12 .200* .958 12 .752
3.00 .115 26 .200* .964 26 .488
3.17 .233 15 .028 .808 15 .005
3.33 .120 28 .200* .975 28 .717
3.50 .142 24 .200* .942 24 .179
3.67 .117 37 .200* .943 37 .058
3.83 .268 27 .000 .758 27 .000
4.00 .177 35 .007 .781 35 .000
4.17 .194 14 .163 .929 14 .298
4.33 .203 33 .001 .922 33 .021
4.50 .382 4 . .801 4 .103
4.67 .179 17 .151 .875 17 .026
5.00 .441 4 . .630 4 .001
*. This is a lower bound of the true significance.
a. Lilliefors Significance Correction
c. EPWD is constant when ETNICWD = 4.83. It has been omitted.
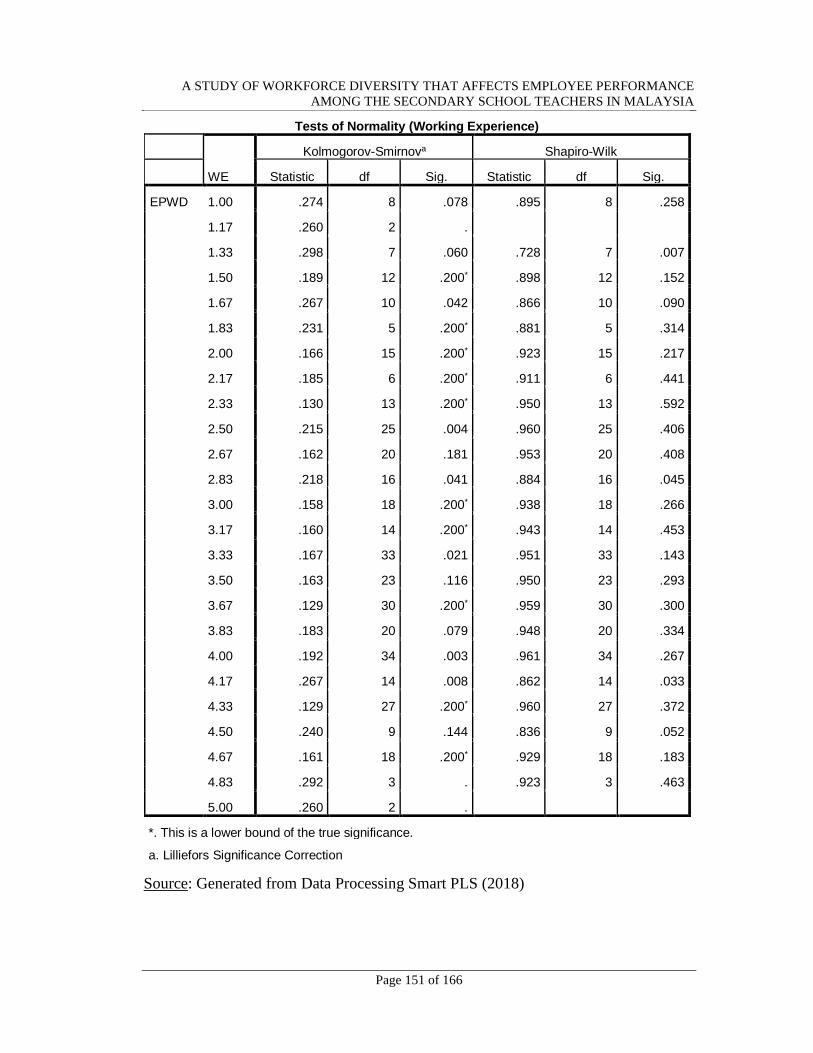
A STUDY OF WORKFORCE DIVERSITY THAT AFFECTS EMPLOYEE PERFORMANCE
AMONG THE SECONDARY SCHOOL TEACHERS IN MALAYSIA
Page 151 of 166
Source: Generated from Data Processing Smart PLS (2018)
Tests of Normality (Working Experience)
WE
Kolmogorov-Smirnova Shapiro-Wilk
Statistic df Sig. Statistic df Sig.
EPWD 1.00 .274 8 .078 .895 8 .258
1.17 .260 2 .
1.33 .298 7 .060 .728 7 .007
1.50 .189 12 .200* .898 12 .152
1.67 .267 10 .042 .866 10 .090
1.83 .231 5 .200* .881 5 .314
2.00 .166 15 .200* .923 15 .217
2.17 .185 6 .200* .911 6 .441
2.33 .130 13 .200* .950 13 .592
2.50 .215 25 .004 .960 25 .406
2.67 .162 20 .181 .953 20 .408
2.83 .218 16 .041 .884 16 .045
3.00 .158 18 .200* .938 18 .266
3.17 .160 14 .200* .943 14 .453
3.33 .167 33 .021 .951 33 .143
3.50 .163 23 .116 .950 23 .293
3.67 .129 30 .200* .959 30 .300
3.83 .183 20 .079 .948 20 .334
4.00 .192 34 .003 .961 34 .267
4.17 .267 14 .008 .862 14 .033
4.33 .129 27 .200* .960 27 .372
4.50 .240 9 .144 .836 9 .052
4.67 .161 18 .200* .929 18 .183
4.83 .292 3 . .923 3 .463
5.00 .260 2 .
*. This is a lower bound of the true significance.
a. Lilliefors Significance Correction
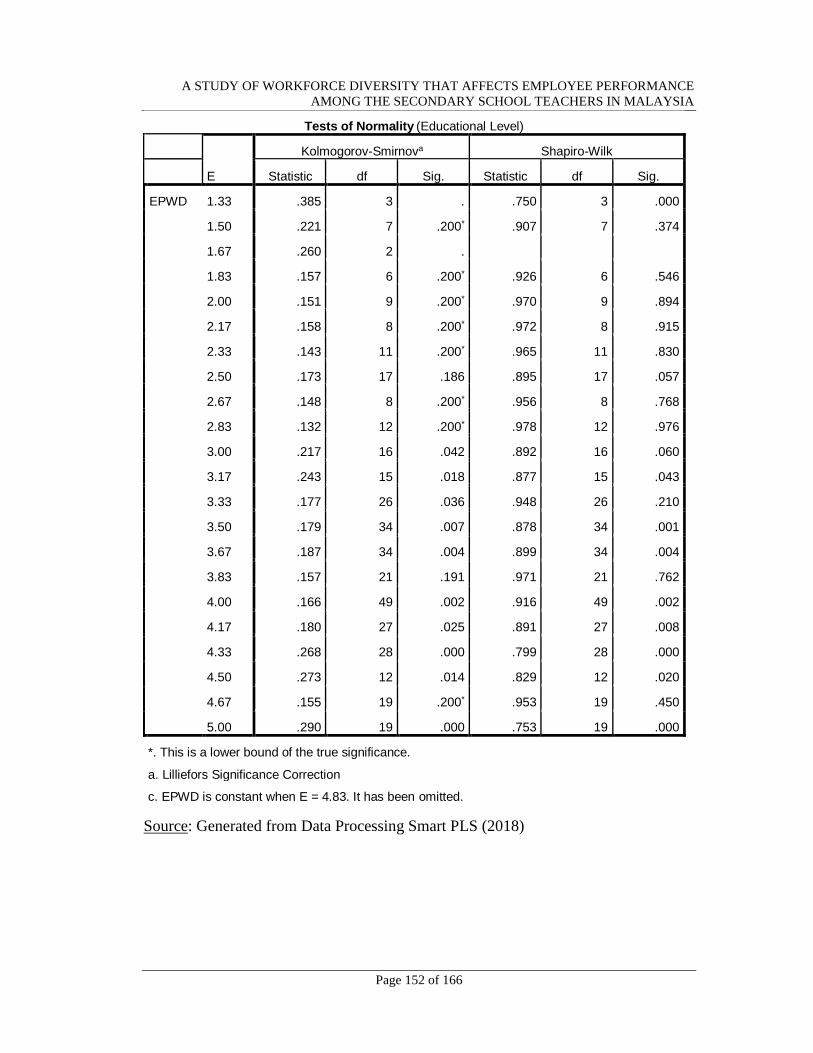
A STUDY OF WORKFORCE DIVERSITY THAT AFFECTS EMPLOYEE PERFORMANCE
AMONG THE SECONDARY SCHOOL TEACHERS IN MALAYSIA
Page 152 of 166
Source: Generated from Data Processing Smart PLS (2018)
Tests of Normality (Educational Level)
E
Kolmogorov-Smirnova Shapiro-Wilk
Statistic df Sig. Statistic df Sig.
EPWD 1.33 .385 3 . .750 3 .000
1.50 .221 7 .200* .907 7 .374
1.67 .260 2 .
1.83 .157 6 .200* .926 6 .546
2.00 .151 9 .200* .970 9 .894
2.17 .158 8 .200* .972 8 .915
2.33 .143 11 .200* .965 11 .830
2.50 .173 17 .186 .895 17 .057
2.67 .148 8 .200* .956 8 .768
2.83 .132 12 .200* .978 12 .976
3.00 .217 16 .042 .892 16 .060
3.17 .243 15 .018 .877 15 .043
3.33 .177 26 .036 .948 26 .210
3.50 .179 34 .007 .878 34 .001
3.67 .187 34 .004 .899 34 .004
3.83 .157 21 .191 .971 21 .762
4.00 .166 49 .002 .916 49 .002
4.17 .180 27 .025 .891 27 .008
4.33 .268 28 .000 .799 28 .000
4.50 .273 12 .014 .829 12 .020
4.67 .155 19 .200* .953 19 .450
5.00 .290 19 .000 .753 19 .000
*. This is a lower bound of the true significance.
a. Lilliefors Significance Correction
c. EPWD is constant when E = 4.83. It has been omitted.
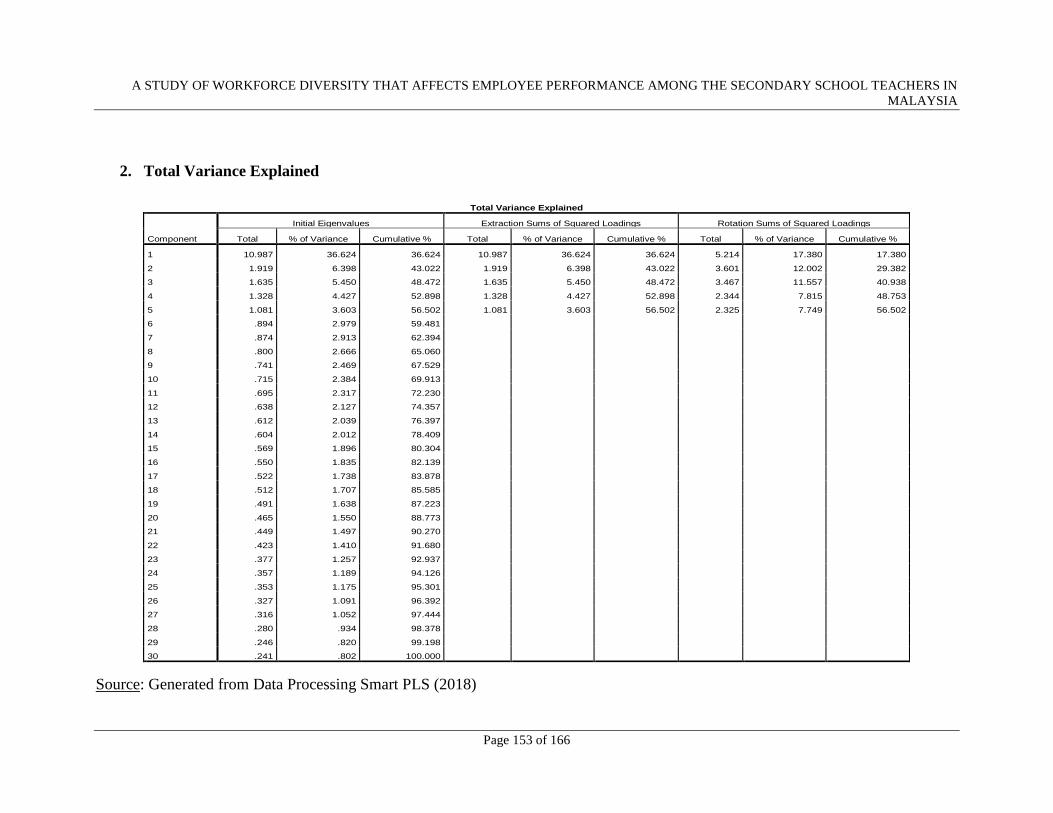
A STUDY OF WORKFORCE DIVERSITY THAT AFFECTS EMPLOYEE PERFORMANCE AMONG THE SECONDARY SCHOOL TEACHERS IN
MALAYSIA
Page 153 of 166
2. Total Variance Explained
Source: Generated from Data Processing Smart PLS (2018)
Total Variance Explained
Component
Initial Eigenvalues Extraction Sums of Squared Loadings Rotation Sums of Squared Loadings
Total % of Variance Cumulative % Total % of Variance Cumulative % Total % of Variance Cumulative %
1 10.987 36.624 36.624 10.987 36.624 36.624 5.214 17.380 17.380
2 1.919 6.398 43.022 1.919 6.398 43.022 3.601 12.002 29.382
3 1.635 5.450 48.472 1.635 5.450 48.472 3.467 11.557 40.938
4 1.328 4.427 52.898 1.328 4.427 52.898 2.344 7.815 48.753
5 1.081 3.603 56.502 1.081 3.603 56.502 2.325 7.749 56.502
6 .894 2.979 59.481
7 .874 2.913 62.394
8 .800 2.666 65.060
9 .741 2.469 67.529
10 .715 2.384 69.913
11 .695 2.317 72.230
12 .638 2.127 74.357
13 .612 2.039 76.397
14 .604 2.012 78.409
15 .569 1.896 80.304
16 .550 1.835 82.139
17 .522 1.738 83.878
18 .512 1.707 85.585
19 .491 1.638 87.223
20 .465 1.550 88.773
21 .449 1.497 90.270
22 .423 1.410 91.680
23 .377 1.257 92.937
24 .357 1.189 94.126
25 .353 1.175 95.301
26 .327 1.091 96.392
27 .316 1.052 97.444
28 .280 .934 98.378
29 .246 .820 99.198
30 .241 .802 100.000
Extraction Method: Principal Component Analysis.
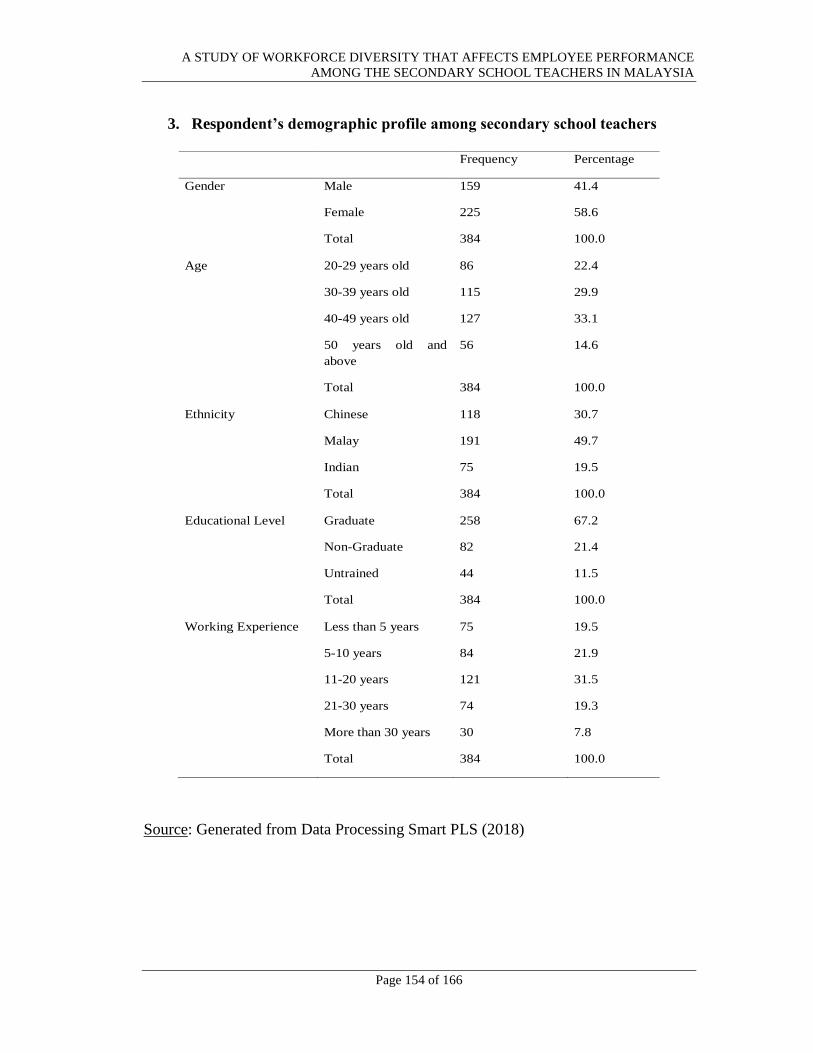
A STUDY OF WORKFORCE DIVERSITY THAT AFFECTS EMPLOYEE PERFORMANCE
AMONG THE SECONDARY SCHOOL TEACHERS IN MALAYSIA
Page 154 of 166
3. Respondent’s demographic profile among secondary school teachers
Source: Generated from Data Processing Smart PLS (2018)
Frequency Percentage
Gender Male 159 41.4
Female 225 58.6
Total 384 100.0
Age 20-29 years old 86 22.4
30-39 years old 115 29.9
40-49 years old 127 33.1
50 years old and
above
56 14.6
Total 384 100.0
Ethnicity Chinese 118 30.7
Malay 191 49.7
Indian 75 19.5
Total 384 100.0
Educational Level Graduate 258 67.2
Non-Graduate 82 21.4
Untrained 44 11.5
Total 384 100.0
Working Experience Less than 5 years 75 19.5
5-10 years 84 21.9
11-20 years 121 31.5
21-30 years 74 19.3
More than 30 years 30 7.8
Total 384 100.0
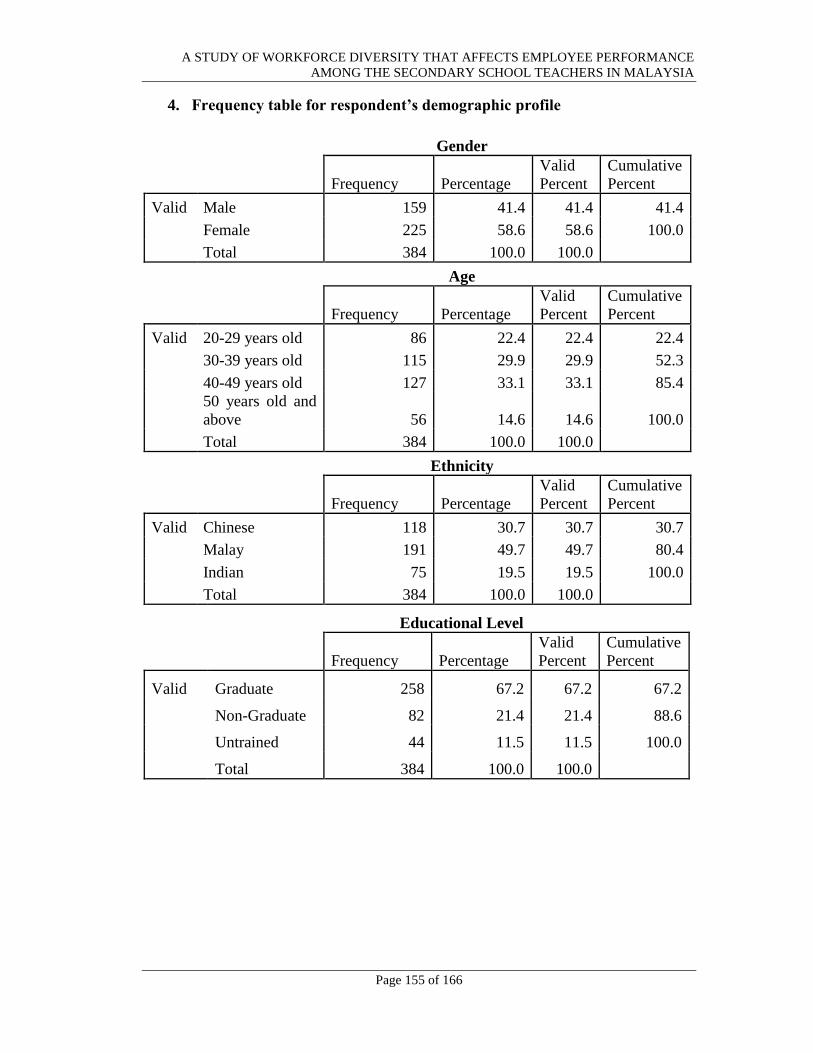
A STUDY OF WORKFORCE DIVERSITY THAT AFFECTS EMPLOYEE PERFORMANCE
AMONG THE SECONDARY SCHOOL TEACHERS IN MALAYSIA
Page 155 of 166
4. Frequency table for respondent’s demographic profile
Gender
Frequency Percentage
Valid
Percent
Cumulative
Percent
Valid Male 159 41.4 41.4 41.4
Female 225 58.6 58.6 100.0
Total 384 100.0 100.0
Age
Frequency Percentage
Valid
Percent
Cumulative
Percent
Valid 20-29 years old 86 22.4 22.4 22.4
30-39 years old 115 29.9 29.9 52.3
40-49 years old 127 33.1 33.1 85.4
50 years old and
above 56 14.6 14.6 100.0
Total 384 100.0 100.0
Ethnicity
Frequency Percentage
Valid
Percent
Cumulative
Percent
Valid Chinese 118 30.7 30.7 30.7
Malay 191 49.7 49.7 80.4
Indian 75 19.5 19.5 100.0
Total 384 100.0 100.0
Educational Level
Frequency Percentage
Valid
Percent
Cumulative
Percent
Valid Graduate 258 67.2 67.2 67.2
Non-Graduate 82 21.4 21.4 88.6
Untrained 44 11.5 11.5 100.0
Total 384 100.0 100.0
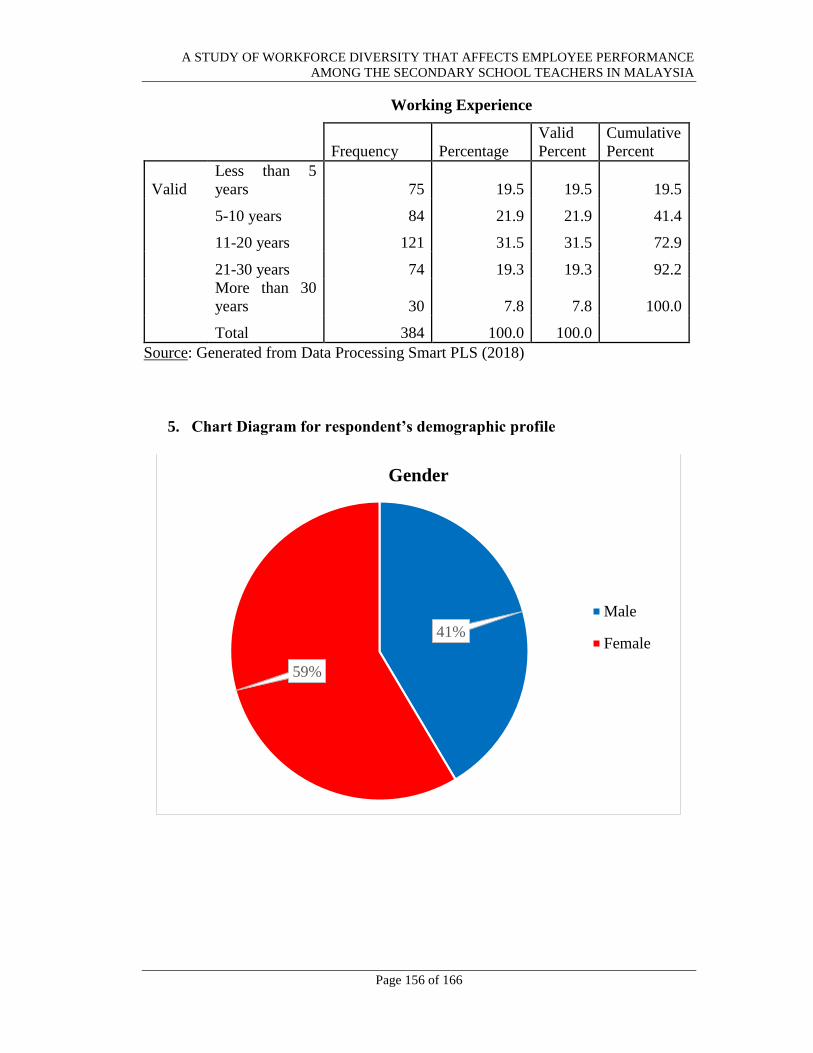
A STUDY OF WORKFORCE DIVERSITY THAT AFFECTS EMPLOYEE PERFORMANCE
AMONG THE SECONDARY SCHOOL TEACHERS IN MALAYSIA
Page 156 of 166
Working Experience
Frequency Percentage
Valid
Percent
Cumulative
Percent
Valid
Less than 5
years 75 19.5 19.5 19.5
5-10 years 84 21.9 21.9 41.4
11-20 years 121 31.5 31.5 72.9
21-30 years 74 19.3 19.3 92.2
More than 30
years 30 7.8 7.8 100.0
Total 384 100.0 100.0
Source: Generated from Data Processing Smart PLS (2018)
5. Chart Diagram for respondent’s demographic profile
41%
59%
Gender
Male
Female
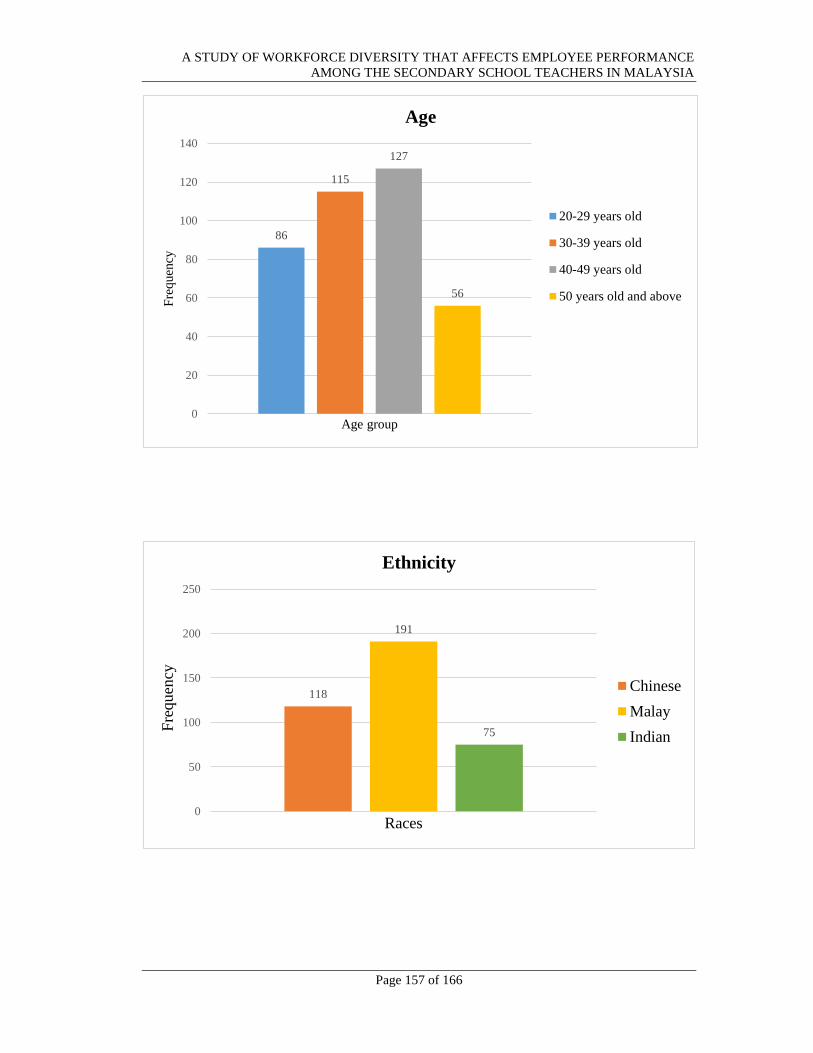
A STUDY OF WORKFORCE DIVERSITY THAT AFFECTS EMPLOYEE PERFORMANCE
AMONG THE SECONDARY SCHOOL TEACHERS IN MALAYSIA
Page 157 of 166
86
115
127
56
0
20
40
60
80
100
120
140
Fre
quen
cy
Age group
Age
20-29 years old
30-39 years old
40-49 years old
50 years old and above
118
191
75
0
50
100
150
200
250
Fre
quen
cy
Races
Ethnicity
Chinese
Malay
Indian
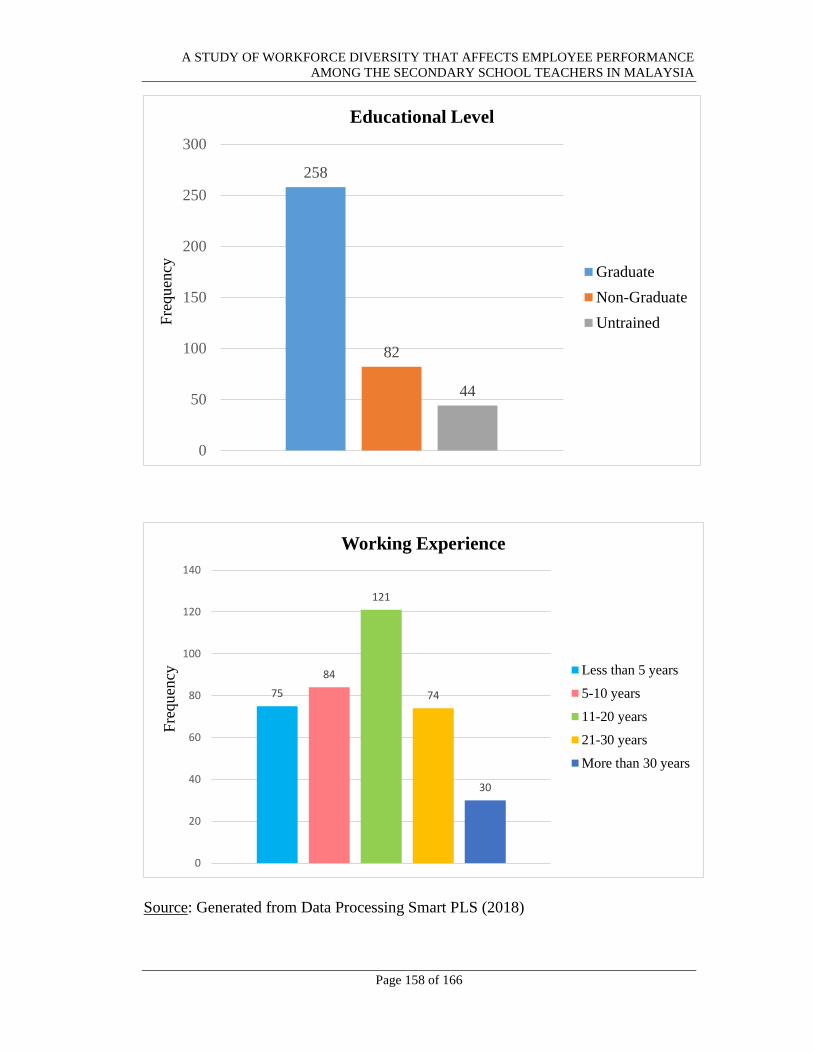
A STUDY OF WORKFORCE DIVERSITY THAT AFFECTS EMPLOYEE PERFORMANCE
AMONG THE SECONDARY SCHOOL TEACHERS IN MALAYSIA
Page 158 of 166
Source: Generated from Data Processing Smart PLS (2018)
258
82
44
0
50
100
150
200
250
300
Fre
qu
ency
Educational Level
Graduate
Non-Graduate
Untrained
75
84
121
74
30
0
20
40
60
80
100
120
140
Fre
quen
cy
Working Experience
Less than 5 years
5-10 years
11-20 years
21-30 years
More than 30 years
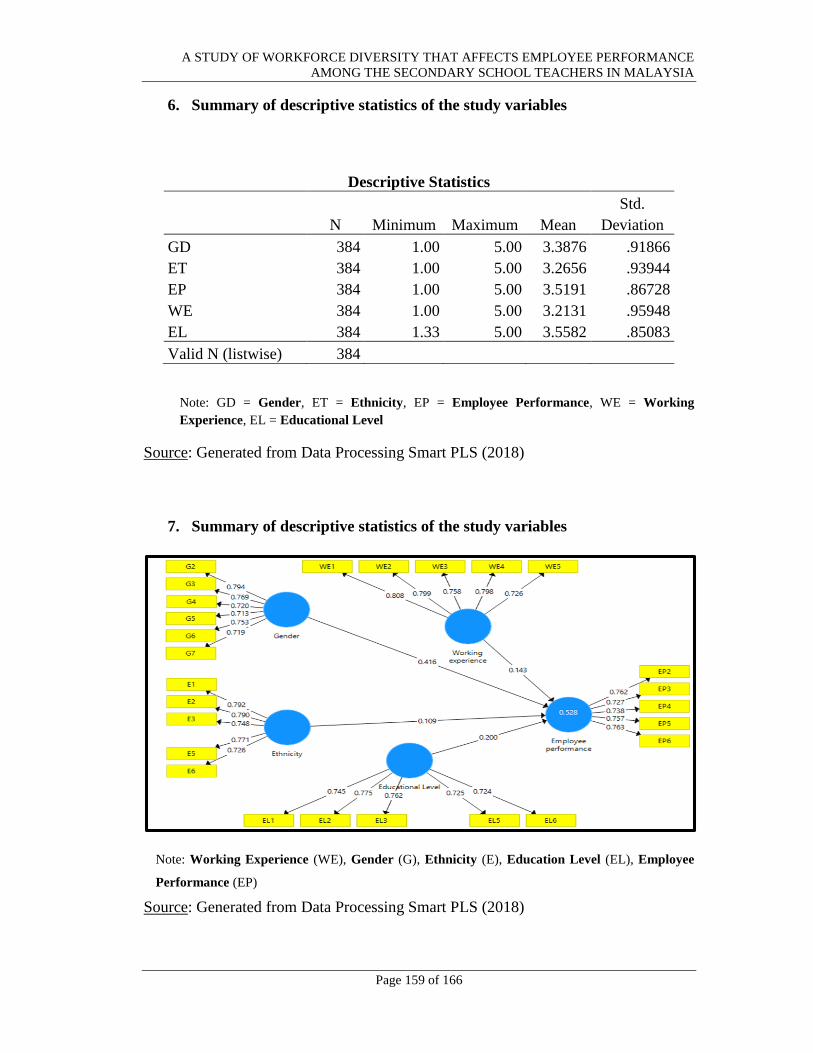
A STUDY OF WORKFORCE DIVERSITY THAT AFFECTS EMPLOYEE PERFORMANCE
AMONG THE SECONDARY SCHOOL TEACHERS IN MALAYSIA
Page 159 of 166
6. Summary of descriptive statistics of the study variables
Descriptive Statistics
N Minimum Maximum Mean
Std.
Deviation
GD 384 1.00 5.00 3.3876 .91866
ET 384 1.00 5.00 3.2656 .93944
EP 384 1.00 5.00 3.5191 .86728
WE 384 1.00 5.00 3.2131 .95948
EL 384 1.33 5.00 3.5582 .85083
Valid N (listwise) 384
Note: GD = Gender, ET = Ethnicity, EP = Employee Performance, WE = Working
Experience, EL = Educational Level
Source: Generated from Data Processing Smart PLS (2018)
7. Summary of descriptive statistics of the study variables
Note: Working Experience (WE), Gender (G), Ethnicity (E), Education Level (EL), Employee
Performance (EP)
Source: Generated from Data Processing Smart PLS (2018)
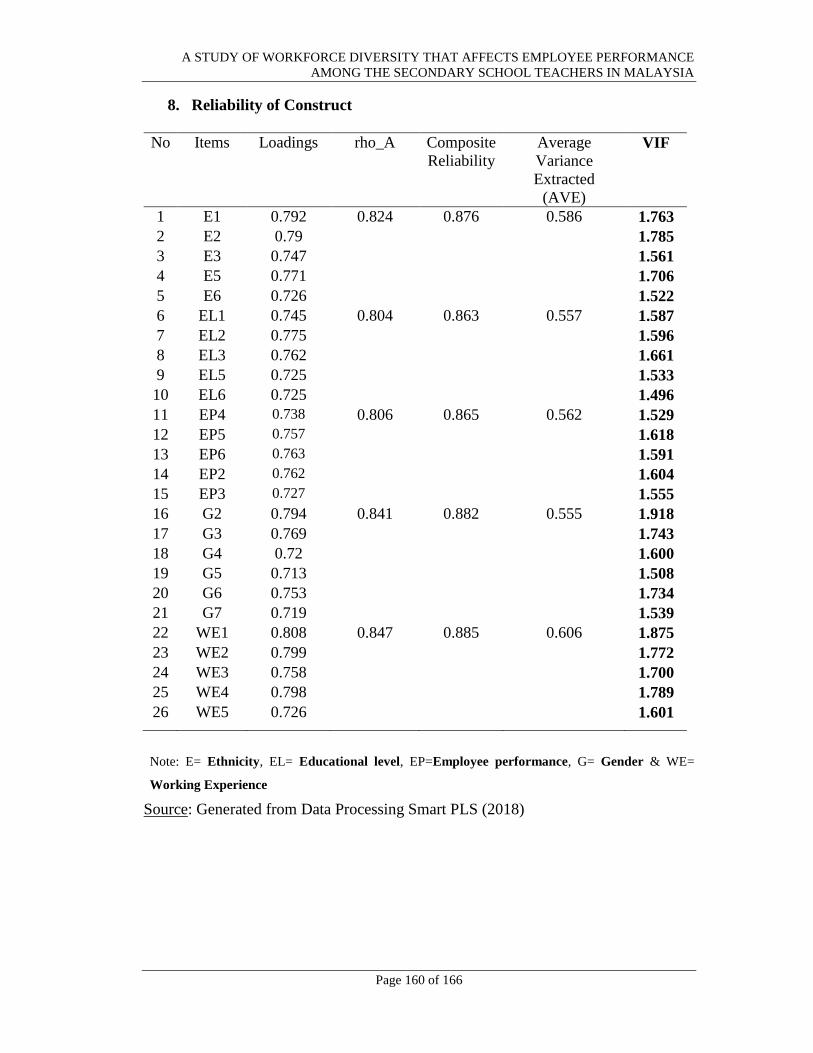
A STUDY OF WORKFORCE DIVERSITY THAT AFFECTS EMPLOYEE PERFORMANCE
AMONG THE SECONDARY SCHOOL TEACHERS IN MALAYSIA
Page 160 of 166
8. Reliability of Construct
No Items Loadings rho_A Composite
Reliability
Average
Variance
Extracted
(AVE)
VIF
1 E1 0.792 0.824 0.876 0.586 1.763
2 E2 0.79 1.785
3 E3 0.747 1.561
4 E5 0.771 1.706
5 E6 0.726 1.522
6 EL1 0.745 0.804 0.863 0.557 1.587
7 EL2 0.775 1.596
8 EL3 0.762 1.661
9 EL5 0.725 1.533
10 EL6 0.725 1.496
11 EP4 0.738 0.806 0.865 0.562 1.529
12 EP5 0.757 1.618
13 EP6 0.763 1.591
14 EP2 0.762 1.604
15 EP3 0.727 1.555
16 G2 0.794 0.841 0.882 0.555 1.918
17 G3 0.769 1.743
18 G4 0.72 1.600
19 G5 0.713 1.508
20 G6 0.753 1.734
21 G7 0.719 1.539
22 WE1 0.808 0.847 0.885 0.606 1.875
23 WE2 0.799 1.772
24 WE3 0.758 1.700
25 WE4 0.798 1.789
26 WE5 0.726 1.601
Note: E= Ethnicity, EL= Educational level, EP=Employee performance, G= Gender & WE=
Working Experience
Source: Generated from Data Processing Smart PLS (2018)
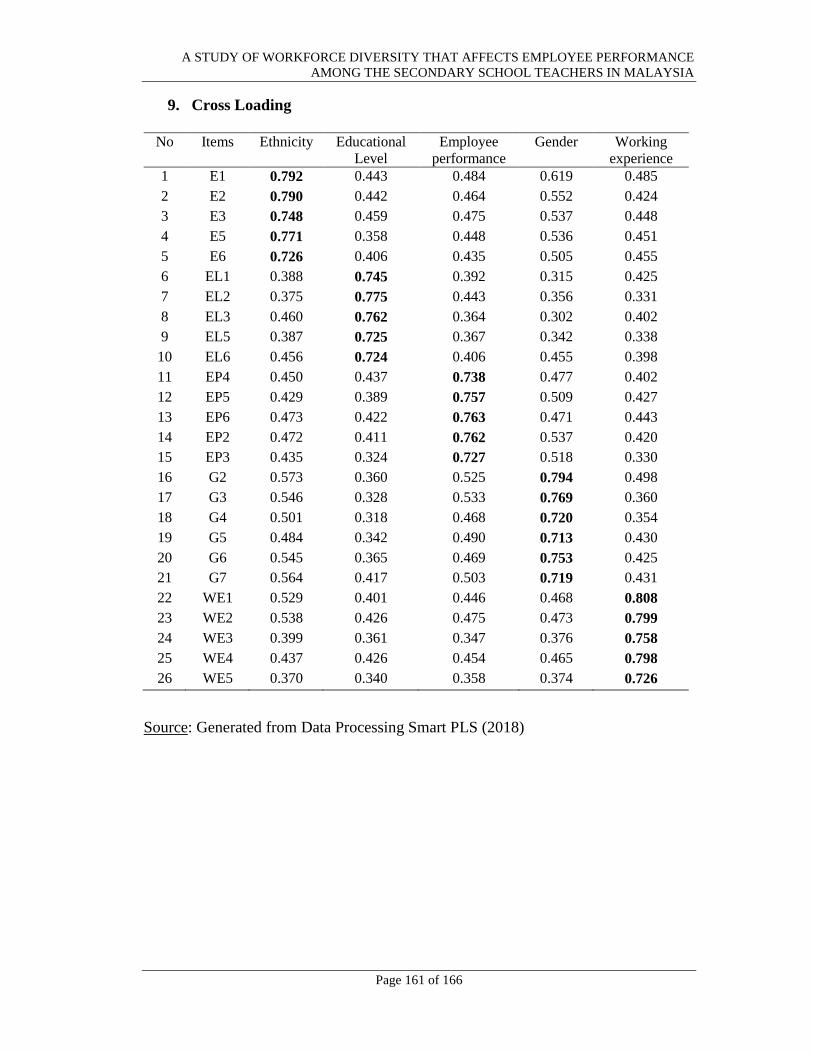
A STUDY OF WORKFORCE DIVERSITY THAT AFFECTS EMPLOYEE PERFORMANCE
AMONG THE SECONDARY SCHOOL TEACHERS IN MALAYSIA
Page 161 of 166
9. Cross Loading
No Items Ethnicity Educational
Level
Employee
performance
Gender Working
experience
1 E1 0.792 0.443 0.484 0.619 0.485
2 E2 0.790 0.442 0.464 0.552 0.424
3 E3 0.748 0.459 0.475 0.537 0.448
4 E5 0.771 0.358 0.448 0.536 0.451
5 E6 0.726 0.406 0.435 0.505 0.455
6 EL1 0.388 0.745 0.392 0.315 0.425
7 EL2 0.375 0.775 0.443 0.356 0.331
8 EL3 0.460 0.762 0.364 0.302 0.402
9 EL5 0.387 0.725 0.367 0.342 0.338
10 EL6 0.456 0.724 0.406 0.455 0.398
11 EP4 0.450 0.437 0.738 0.477 0.402
12 EP5 0.429 0.389 0.757 0.509 0.427
13 EP6 0.473 0.422 0.763 0.471 0.443
14 EP2 0.472 0.411 0.762 0.537 0.420
15 EP3 0.435 0.324 0.727 0.518 0.330
16 G2 0.573 0.360 0.525 0.794 0.498
17 G3 0.546 0.328 0.533 0.769 0.360
18 G4 0.501 0.318 0.468 0.720 0.354
19 G5 0.484 0.342 0.490 0.713 0.430
20 G6 0.545 0.365 0.469 0.753 0.425
21 G7 0.564 0.417 0.503 0.719 0.431
22 WE1 0.529 0.401 0.446 0.468 0.808
23 WE2 0.538 0.426 0.475 0.473 0.799
24 WE3 0.399 0.361 0.347 0.376 0.758
25 WE4 0.437 0.426 0.454 0.465 0.798
26 WE5 0.370 0.340 0.358 0.374 0.726
Source: Generated from Data Processing Smart PLS (2018)
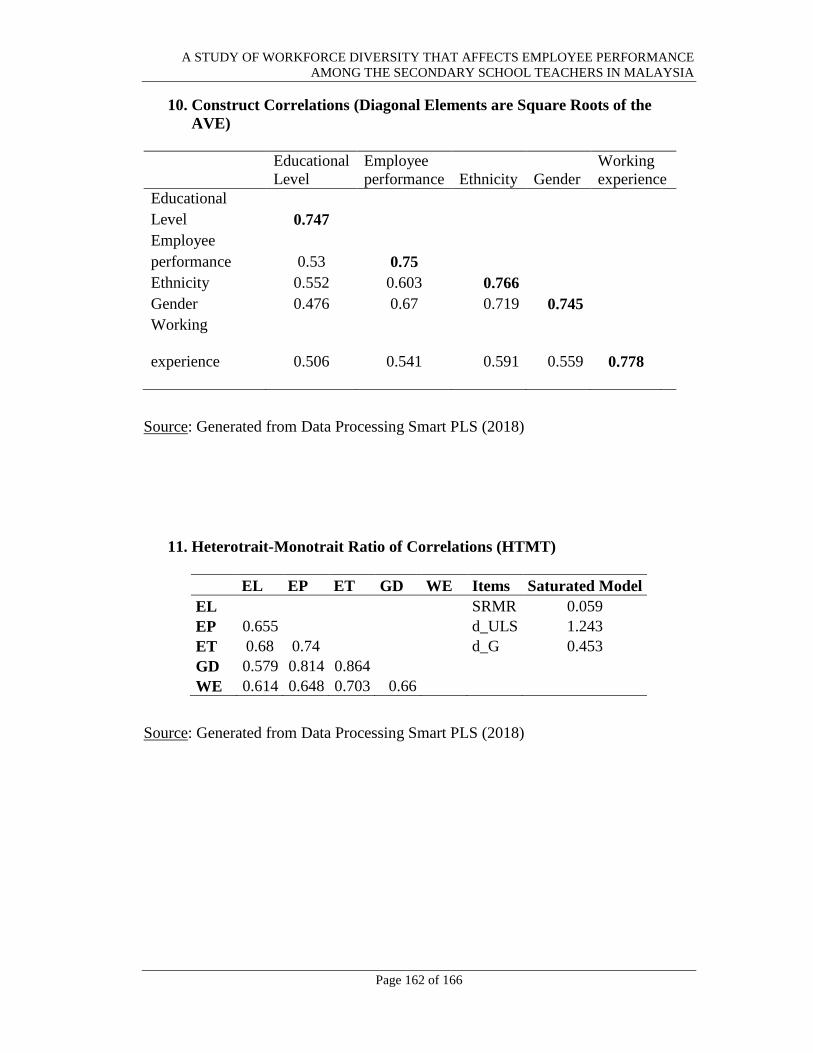
A STUDY OF WORKFORCE DIVERSITY THAT AFFECTS EMPLOYEE PERFORMANCE
AMONG THE SECONDARY SCHOOL TEACHERS IN MALAYSIA
Page 162 of 166
10. Construct Correlations (Diagonal Elements are Square Roots of the
AVE)
Educational
Level
Employee
performance Ethnicity Gender
Working
experience
Educational
Level 0.747
Employee
performance 0.53 0.75
Ethnicity 0.552 0.603 0.766
Gender 0.476 0.67 0.719 0.745
Working
experience 0.506 0.541 0.591 0.559 0.778
Source: Generated from Data Processing Smart PLS (2018)
11. Heterotrait-Monotrait Ratio of Correlations (HTMT)
EL EP ET GD WE Items Saturated Model
EL SRMR 0.059
EP 0.655 d_ULS 1.243
ET 0.68 0.74 d_G 0.453
GD 0.579 0.814 0.864
WE 0.614 0.648 0.703 0.66
Source: Generated from Data Processing Smart PLS (2018)
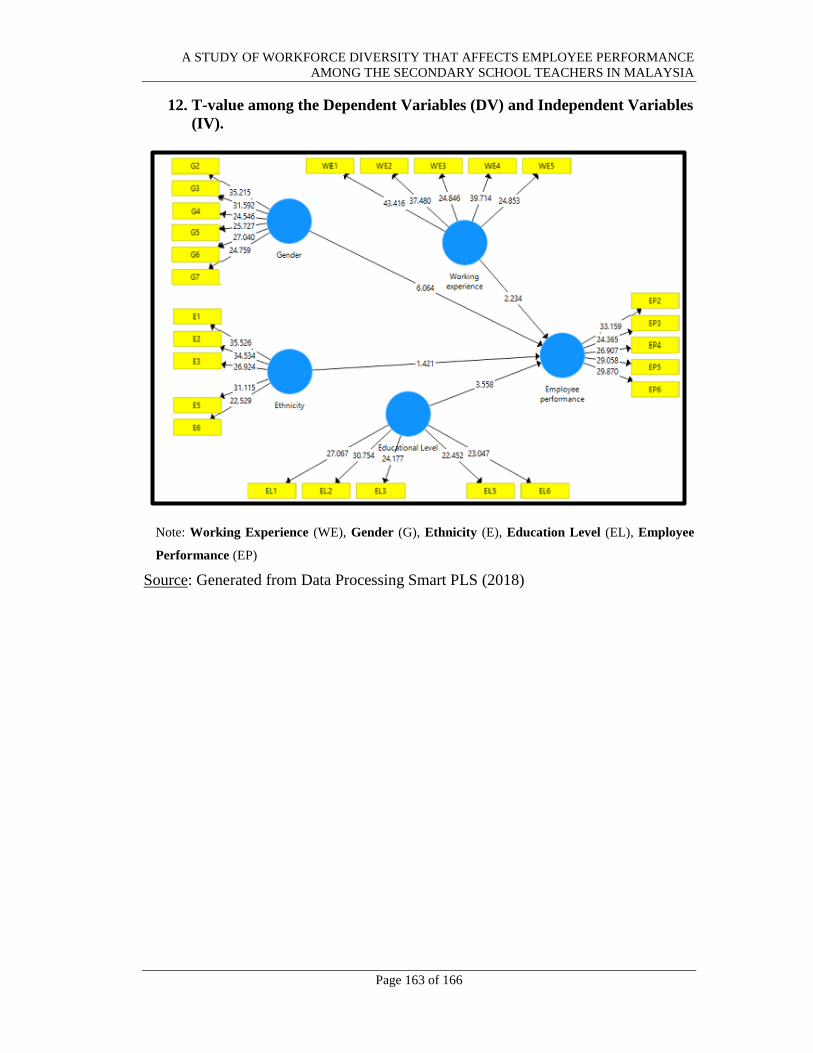
A STUDY OF WORKFORCE DIVERSITY THAT AFFECTS EMPLOYEE PERFORMANCE
AMONG THE SECONDARY SCHOOL TEACHERS IN MALAYSIA
Page 163 of 166
12. T-value among the Dependent Variables (DV) and Independent Variables
(IV).
Note: Working Experience (WE), Gender (G), Ethnicity (E), Education Level (EL), Employee
Performance (EP)
Source: Generated from Data Processing Smart PLS (2018)
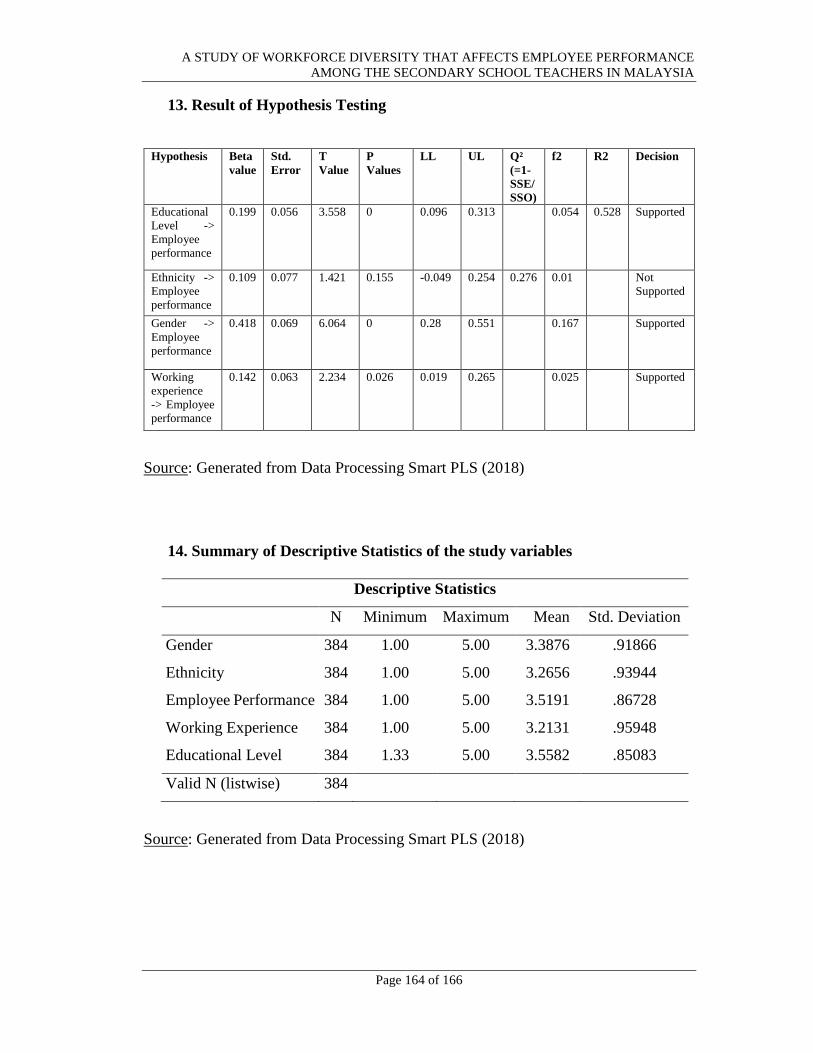
A STUDY OF WORKFORCE DIVERSITY THAT AFFECTS EMPLOYEE PERFORMANCE
AMONG THE SECONDARY SCHOOL TEACHERS IN MALAYSIA
Page 164 of 166
13. Result of Hypothesis Testing
Source: Generated from Data Processing Smart PLS (2018)
14. Summary of Descriptive Statistics of the study variables
Descriptive Statistics
N Minimum Maximum Mean Std. Deviation
Gender 384 1.00 5.00 3.3876 .91866
Ethnicity 384 1.00 5.00 3.2656 .93944
Employee Performance 384 1.00 5.00 3.5191 .86728
Working Experience 384 1.00 5.00 3.2131 .95948
Educational Level 384 1.33 5.00 3.5582 .85083
Valid N (listwise) 384
Source: Generated from Data Processing Smart PLS (2018)
Hypothesis Beta
value
Std.
Error
T
Value
P
Values
LL UL Q²
(=1-
SSE/
SSO)
f2 R2 Decision
Educational
Level ->
Employee
performance
0.199 0.056 3.558 0 0.096 0.313 0.054 0.528 Supported
Ethnicity ->
Employee
performance
0.109 0.077 1.421 0.155 -0.049 0.254 0.276 0.01 Not
Supported
Gender ->
Employee
performance
0.418 0.069 6.064 0 0.28 0.551 0.167 Supported
Working
experience
-> Employee
performance
0.142 0.063 2.234 0.026 0.019 0.265 0.025 Supported
A STUDY OF WORKFORCE DIVERSITY THAT AFFECTS EMPLOYEE PERFORMANCE
AMONG THE SECONDARY SCHOOL TEACHERS IN MALAYSIA
Page 165 of 166
Appendix I
PERSONAL DATA PROTECTION STATEMENT
Please be informed that in accordance with Personal Data Protection Act 2010
(“PDPA”) which came into force on 15 November 2013, Universiti Tunku Abdul
Rahman (“UTAR”) is hereby bound to make notice and require consent in relation to
collection, recording, storage, usage and retention of personal information.
Notice:
1. The purposes for which your personal data may be used are inclusive but not limited
to:-
• For assessment of any application to UTAR
• For processing any benefits and services
• For communication purposes
• For advertorial and news
• For general administration and record purposes
• For enhancing the value of education
• For educational and related purposes consequential to UTAR
• For the purpose of our corporate governance
• For consideration as a guarantor for UTAR staff/ student applying for his/her
scholarship/ study loan
2. Your personal data may be transferred and/or disclosed to third party and/or UTAR
collaborative partners including but not limited to the respective and appointed
outsourcing agents for purpose of fulfilling our obligations to you in respect of the
purposes and all such other purposes that are related to the purposes and also in
providing integrated services, maintaining and storing records. Your data may be
A STUDY OF WORKFORCE DIVERSITY THAT AFFECTS EMPLOYEE PERFORMANCE
AMONG THE SECONDARY SCHOOL TEACHERS IN MALAYSIA
Page 166 of 166
shared when required by laws and when disclosure is necessary to comply with
applicable laws.
3. Any personal information retained by UTAR shall be destroyed and/or deleted in
accordance with our retention policy applicable for us in the event such information is
no longer required.
4. UTAR is committed in ensuring the confidentiality, protection, security and accuracy
of your personal information made available to us and it has been our ongoing strict
policy to ensure that your personal information is accurate, complete, not misleading
and updated. UTAR would also ensure that your personal data shall not be used for
political and commercial purposes.
Consent:
1. By submitting this form you hereby authorise and consent to us processing (including
disclosing) your personal data and any updates of your information, for the purposes
and/or for any other purposes related to the purpose.
2. If you do not consent or subsequently withdraw your consent to the processing and
disclosure of your personal data, UTAR will not be able to fulfill our obligations or to
contact you or to assist you in respect of the purposes and/or for any other purposes
related to the purpose.
3. You may access and update your personal data by writing to us at
Thank you for your time, opinion and comments.
~ The End ~