Embed Size (px)
Citation preview
BUDAPEST BUSINESS UNIVERSITY
University of Applied Sciences
College of Commerce, Catering and Tourism
Faculty of Tourism and Hotel Management
A Study on Attendees’ Motivation for Events in Budapest
Academic supervisor: Author:
Katalin Ujbányai PhD. Ahmet Uzun
Associate professor MA in Tourism Management
Spa Tourism and Regional Development
Full-time course
2016
2

3
DECLARATION
I declare that the dissertation hereby submitted in partial fulfilment of the requirements
for the degree of Master of Arts in Tourism Management at the Budapest Business
School has not previously been submitted by me for a degree at this or any other
institution. This dissertation and the work presented in it are my own and have been
generated by me as the result of my own original research; it is my work in design and
in execution, and that all material contained therein has been duly acknowledged. I
understand that my thesis may be made available to the public.
Budapest, 29.11.2016
….................................
Student signature

4
Abstract
Nowadays, event participants have formed a crucial segmentation in the tourism
market all over the world. Understanding the social, economical and cultural benefits of
events leads the cities aim to have a better market share. The individuals have become
the essential parts of events in the manner of this target and the necessity of knowing
their reasons for participation and their motivation. Thus, the attendees’ motivation for
various events in the lively Hungarian capital, Budapest is aimed to be specified in this
dissertation.
In this frame, after an extensive literature review on the events researches and
theoretical background of motivation, an online questionnaire was realized as the
primary research instrument, in which data was collected and analyzed with the help of
Google Forms, Google Spreadsheet and Microsoft Excel. The survey was conducted on
visitors, locals, internationals, expats and basically people who have attended at least
one event in the city Budapest to investigate their perception, willingness, tendency and
motivation for attending various events in the city.
In this thesis, attendees’ demographics and participant motivations were
examined. The data was analyzed by cross examinations. Findings of the data gathered
from 120 participants indicate that slightly more than half of them are female and mostly
belong to 18 – 26 age group. Also it was found that “Entertainment” is the main reason
for participants to attend an event, while “Socialization” best defines their motivation in
general. There was also an open-ended question on what kind of events participants
want to see more in Budapest in the future and the most common answers were recorded
as “Cultural” and “Concerts”.
In addition, the reason for attending, satisfaction and motivation levels were also
examined. These levels illustrated the relationship between demographic characteristics
and motivation in order to learn about the tendency and profile of the participants. As a
result of the analysis, a significant relationship has been identified with the help of cross
examination between levels of age group, motivation and reason for attending events.
To conclude, an interpretation of all these results was realized with the recommendation
for future promotional activities and for the market.

5
Acknowledgements
I would like to thank my supervisor, Mrs. Katalin Ujbányai, for her great
guidance, helpful attitude and cheerful mood. During the research process, she was
incredibly supportive and also very friendly. I also would like to thank to the library
lady in Budapest Business University Tourism Library. She patiently answered all my
questions about books and journals in a very helpful way. Also, I am deeply thankful to
my family and friends who support me during all my studies in every manner. I am
appreciated and grateful to have them all in my life.
6
Table of Contents
Chapter 1: Introduction .................................................................................................... 10
Chapter 2: Literature review ........................................................................................... 12
Introduction ....................................................................................................................... 12
Definition of events .......................................................................................................... 13
Type of events ................................................................................................................... 14
Business events and tourism ..................................................................................... 16
Sport events and tourism ........................................................................................... 16
Festivals and other cultural celebrations .................................................................. 17
Event tourism .................................................................................................................... 17
Event tourism in Budapest ............................................................................................... 18
Motivation of event attendance ....................................................................................... 22
Motivation process and leisure time ......................................................................... 23
Definition and theories of motivation ....................................................................... 24
Chapter 3: Research Methodology .................................................................................. 29
Introduction ....................................................................................................................... 29
Data Collection ................................................................................................................. 30
Secondary Research ................................................................................................... 30
Primary Research ....................................................................................................... 30
Data Analysis Method ...................................................................................................... 31
Chapter 4: Research Analysis and Results..................................................................... 32
Introduction ....................................................................................................................... 32
Analysis of Online Survey ............................................................................................... 33
Attendants’ Characteristics .............................................................................................. 33
Perception of Events and Attendance Frequency ........................................................... 40
Experience and Motivation of Attendants ...................................................................... 42

7
Summary ........................................................................................................................... 51
Chapter 5: Conclusion and Recommendation ............................................................... 55
Conclusion ........................................................................................................................ 55
Recommendation .............................................................................................................. 56
Appendices ........................................................................................................................... 57
References ............................................................................................................................ 62

8
Table of Figures Table 1: Number and expenditure of tourists in Hungary ................................................. 19
Table 2: Most visited Hungarian Settlements..................................................................... 20
Table 3: Conferences in Hungary ........................................................................................ 20
Table 4: Main characteristics of international conferences in Hungary .......................... 21
Figure 1: Number of conferences in Budapest ................................................................... 22
Figure 2: Gender data of online survey participants .......................................................... 33
Figure 3: Age data of online survey participants ............................................................... 34
Figure 4: Nationality of online survey participants ............................................................ 35
Figure 5: City of residence of survey participants ............................................................. 36
Figure 6: Occupation of survey participants ....................................................................... 37
Figure 7: Education level of survey participants ................................................................ 38
Figure 8: Marital status of survey participants ................................................................... 39
Figure 9: Monthly income / Salary of survey participants ................................................ 39
Figure 10: Data for Q2 "How often do you participate events in Budapest?" ................. 40
Figure 11: Data for Q3 "What is the most important factor for you to choose an event?"
............................................................................................................................................... 41
Figure 12: Data for Q4 "Do you think events in Budapest are affordable?" .................... 42
Figure 13: Data for Q5 "What kind of events have you participated in Budapest?" ....... 43
Figure 14: Data for Q6 "How did you attend the event?".................................................. 44
Figure 15: Data for Q7 "What was the size of the event?" ................................................ 44
Figure 16: Data for Q8 "How did you hear about the event?" .......................................... 45
Figure 17: Data for Q9 "How would you define your experience?" ................................. 46
Figure 18: Data for Q10 "What was the key factor which satisfied you?" ....................... 47
Figure 19: Data for Q11 "Would you like to participate an event you have attended
before in Budapest?" ............................................................................................................ 47
Figure 20: Data for Q12 "Please choose 3 reasons why you have participated events in
Budapest" .............................................................................................................................. 48
Figure 21: Data for Q13 "Which one of the following best defines your motivation in
general?" ............................................................................................................................... 49

9
Figure 22: Data for Q14 "What kind of events would you like to see more in Budapest in
the future?"............................................................................................................................ 50
Figure 23: General motivation of survey participants by age group ................................. 52
Figure 24: Comparison of main purpose and motivation for attendance by age group ... 53

10
Chapter 1: Introduction
Today, events are located in the centre of our culture and daily life as never
before. Growth in discretional income, spending and leisure time have multiplied the
number of events, festivals, celebrations and entertainment activities. Events are also
thrilling topic for businesses and corporations to market their strategies and to promote
the image of the companies.
According to their size and impact, there are various types of events such as
special events, mega events, hallmark events and major events. Events are also
categorized by their type and sector, such as public, cultural, creative, festivals, sporting,
tourism and corporate events. The business events sector, including meetings,
incentives, conventions and exhibitions, is one of the fastest growing areas of events.
Thanks to vastly increasing corporate involvement, events are now seen as an industry
with considerable economic and job opportunities.
In the past decade, events and event tourism have been one of the most
important sections in leisure industry and numerous academic studies have been realized
about them. The attention for motivation of event attendance has an increasing trend
among researchers. Apart from the common topics such as economic impact, marketing
strategies of mega events, and festival management, there is a growing focus on the
motivations of attendees. It has been agreed that understanding motivations opens the
way for better planning and marketing of events, and better segmentation of participants
as well. Researches on attendees’ motivation are ways to monitor satisfaction and a tool
for understanding the decision-making processes. They are also crucially important in
the terms of realizing the future analysis.
In this manner, this work investigates perception, willingness, tendency and
motivation for attending various creative events in the vibrant Hungarian capital,
Budapest. After a wide literature review on the events researches and theoretical
background of motivation, a survey type research, in which data was collected via an
online questionnaire, was conducted as primary research instrument, on participants of
various events in Budapest.

11
With this framework, the aim of the dissertation is to investigate of visitors’
motivation to participate in events, to categorize their demographic characteristics and to
classify their participation motives.
Hypothesis of the this paper is that Budapest has been a popular destination for
both international and national young people in 18 – 26 age group who preferred to
attend events within the city for socialization and entertainment purposes.
The main research questions of this work are;
What are the reasons for attending different types of events in the city
of Budapest?
What are the demographic characteristics of attendees?
What is the motivation behind individuals’ decision?
The main objectives of the thesis are:
1. To give a general theoretical background on event studies
2. To investigate motivation process and theories of motivation
3. To define the importance of motivation researches on event planning
and marketing in upper extent.
4. To realize an online questionnaire as a primary research on
participants’ motivation for events in Budapest.
5. To collect the data about participants’ of questionnaire to analyze
their demographic characteristics, motives and willingness.
6. To merge the data from secondary and primary researches to make a
conclusion and recommendation.
12
Chapter 2: Literature review
Introduction
Events and event tourism have been important key elements of tourism in
general which has rapidly developed and diversified in recent years. In tourism
literature, there has recenly been an increase in the number of researches on events and
event tourism. Getz, 1997, 2000, 2008; Harris et al. 2001, Gnoth & Anwar, 2000;
Raltson & Hamilton, 1992; Ritchie, 1984 and Sherwood, 2007 are international
researches on the subject particularly, indicating that understanding motives of the
attendees plays crucially important role in event management and open the way for
better planning and marketing of events.
Various international researches have been carried out on the topic of attendees’
motivation. In most of these studies, a specific type of event or activity has been
discussed and the motivation of the participants in this event has been examined. In
some of the questionnaires, event venues, as attraction centers where event is organized
are also included.
In this context, two remarkable researches on the topic which were found and
deeply analyzed during secondary research for this dissertation work are “Visitor
Profiles and Motivations for Visiting an Australian Wine Festival” conducted by Weiler
et al. 2004 and "Why Do People Attend Events: A Comparative Analysis of Visitor
Motivations at Four South Island Events" realized by Nicholson and Pearce 2001.
In the following chapter, definitions and types of events are examined. After
that, a comprehensive research in the literature is made on motivation for event
attendance. Also the link between motivation process and leisure time is studied in
details. And finally literature review is completed with definition and theories of
motivation which are given in the end of the chapter.

13
Definition of Events
There are numerous kinds of definition of events; Getz defines event as “a
notable happening in special conditions, time and place” (Getz, 1991) while Shone and
Parry explain it as “all the activities other than every day routine” (Shone and Parry,
2004) Events are not the occasions that happen every day. According to Tassiopoulos,
events are temporary happenings and every event has different time, form, management
process and uniqueness. (Tassiopoulos, 2005) Also Silvers defined that events are
unique experience that intentionally designed to create an influence on people. (Silvers,
2004)
Events are uniquely designed happenings which have specific time; form and
management process. Events have widely roles such as team building, urban
transformation, cultural happenings and so on. Events are mostly used as a tool for
reaching the defined company or business goals, cultural gatherings, socializing and
many more. For instance, with the help of popular events, people comes together and
social integration and perception of community belonging are strengthened (Babacan
and Göztaş, 2011)
Events also help to make marketing and promotion campaigns of a product,
service, idea, destination and public figure. What make events exist, is attendants;
message or experience can be shared, sent and produced only if there are attendants to
events. (Wood, 2009)
The main event-related professional associations dated back to 1885. In 1885,
the International Association of Fairs and Expositions (IAFE) began with a half dozen
fairs, while the International Association for Exhibition Management was organized in
1928 as the National Association of Exposition Managers to represent the interests of
tradeshow and exposition managers. The International Festivals and Events Association
celebrated its 50th year in 2005, and its orientation appeals to community festivals and
other celebrations. (Getz, 2007)
Established in 1972, Meeting Professionals International (MPI) is the (self-
proclaimed) leading global community committed to shaping and defining the future of
the meeting and event industry. The International Special Events Society (ISES) was
14
founded in 1987 and embraces both event designers/producers and their numerous
suppliers. As well, there are associations for carnivals, and many arts and sports-specific
associations that deal with events, and they organize at local, national and international
levels. (Getz, 2007)
Event tourism was not considered as a real professional sector in 1960’s and
1970’s. After 1980’s, many researchers worked on this topic. In 2000’s, there were
numerous events and celebrations designed as professional occasions. It is obvious that,
events sector is a fast growing professional field which is an also important motivator
for tourism since it creates numerous job opportunities. (Getz, 2007)
Type of events
Events are divided and searched in different categories. While some researchers
classify the events by their content, others focus on their size. Getz provides a typology
of the main categories of planned events based primarily on their form which have
obvious differences in their purpose and program. Some are for public celebration (this
category includes so-called “community festivals” which typically contain a large
variety in their programming and aim to foster civic pride and cohesion), while others
are planned for purposes of competition, fun, entertainment, business or socializing.
Often they require special-purpose facilities, and the managers of those facilities (like
convention centers and sport arenas) target specific types of events. Professional
associations and career paths have traditionally been linked to these event types. (Getz,
2007)
CULTURAL CELEBRATIONS
- Festivals
- Carnivals
- Commemorations
- Religious events
POLITICAL AND STATE

15
- Summits
- Royal occasions
- Political events
- VIP visits
ARTS AND ENTERTAINMENT
- Concerts
- Award ceremonies
BUSINESS AND TRADE
- Meetings, conventions
- Consumer and trade shows
- Fairs, markets
EDUCATIONAL AND SCIENTIFIC
- Conferences
- Seminars
- Clinics
SPORT COMPETITION
- Amateur/professional
- Specator/particpant
RECREATIONAL
- Sport or games for fun
PRIVATE EVENTS
- Weddings

16
- Parties
- Socials
Business events and tourism
Interest in the tourism value of business events, including meetings, conventions,
and exhibitions (both trade and consumer shows) has been intense for so long that
almost all major cities now possess impressive convention and exhibition facilities,
along with agencies devoted to selling the space and bidding on events. The first
convention bureau in the USA was established as far back as 1896 (Spiller, 2002) and
the International Association of Convention Bureaus was founded in 1914. (Getz, 2007)
A defining element in business event tourism is the dominance of extrinsic
motivators in explaining travel—it is necessitated to do business, to advance one’s
career, or because it is required by one’s job. On the other hand, business events and
pleasure travel do mix, and the connection has been examined by Davidson (2003).
(Getz, 2007)
Sport events and tourism
Sports as ‘big business’ is an enduring theme can generate a civic turnaround.
Sports Business Market Research Inc. (2000, p. 167) observed that in the 1980s and
1990s American cities put heavy emphasis on sports, entertainment and tourism as a
source of revenue for the cities. Gratton and Kokolakakis (1997) believed that in the UK
sports events had become the main platform for economic regeneration in many cities.
Carlsen and Taylor (2003) looked at the ways in which Manchester used the
Commonwealth Games to heighten the city’s profile, give impetus to urban renewal
through sport and commercial developments, and create a social legacy through cultural
and educational programming. Across North America almost every city now has a sport
tourism initiative, often with dedicated personnel and agencies, and global competition
to bid on events and attract the sport event tourist is fierce. (Getz, 2007)

17
Festivals and other cultural celebrations
Cultural celebrations, including festivals, carnivals, religious events and the arts
and entertainment in general (mainly concerts and theatrical productions) are often
subsumed in the literature on cultural tourism.
Festivals in particular have been examined in the context of place marketing,
urban development, tourism and more recently social change. Design and art based
creative cultural events as attractions and activities within the city have a great
importance for modern cities and communities nowadays. (Getz, 2007)
Event Tourism
Event management is the applied field of study and area of professional practice
devoted to the design, production and management of planned events, encompassing
festivals and other celebrations, entertainment, recreation, political and state, scientific,
sport and arts events, those in the domain of business and corporate affairs (including
meetings, conventions, fairs, and exhibitions), and those in the private domain
(including rites of passage such as weddings and parties, and social events for affinity
groups).
The main goal of event tourism is to attract more people in the low season to the
destinations which suffer seasonality during the year. There are four different important
aims of event tourism:
- Creating a positive image for destination
- Expand the tourism season
- Balance the tourism demand equally in destination
- Attract local and international tourist to destination
Event tourism also includes event services, pull and push factors, development
of infrastructure and marketing plans. Additionally, it aims to keep the negative effect of
big events to locals minimum, while maximizing the experience of visitors.
(Tassiopoulos, 2005)
The term “event(s) tourism” was not widely used before; An article by Getz in
1989 in Tourism Management (“Special Events: Defining the Product”) developed a

18
framework for planning “events tourism”. Prior to this it was normal to speak of special
events, hallmark events, mega events and specific types of events. Now “event tourism”
is generally recognized as being inclusive of all planned events in an integrated
approach to development and marketing. (Getz, 1989)
As with all forms of special-interest travel, event tourism can be viewed from
both demand and supply sides. A consumer perspective requires determining who
travels for events and why, and also who attends events while traveling. It is also
crucially important to know what “event tourists” do and spend. Included in this
demand-side approach is assessment of the value of events in promoting a positive
destination image, place marketing in general, and co-branding with destinations. (Getz,
2007)
On the supply side, destinations develop, facilitate and promote events of all
kinds to meet multiple goals:
To attract tourists (especially in the off-peak seasons)
To serve as a catalyst (for urban renewal, and for increasing the infrastructure
and tourism capacity of the destination)
To foster a positive destination image and contribute
To general place marketing (including contributions to fostering a better place in
which to live, work and invest)
To animate specific attractions or areas
Event tourism is not usually recognized as a separate professional field. Mostly it
is seen as an application of, or specialty within national tourism offices (NTOs) and
destination marketing/management organizations (DMOs). Event development agencies
(as opposed to agencies focused on protocol, arts and culture which also deal with
planned events) embody event tourism completely, and there are a growing number of
associated career paths or technical jobs. (Getz, 2007)
Event Tourism in Budapest
Budapest offers year-round entertainment, activities and happenings in the form
of festivals, cultural events, concerts, exhibitions, fairs, sporting events, conferences and

19
national celebrations notably, Budapest Spring Festival, Sziget Festival, and Budapest
International Wine Festival. The lively capital of Hungary is now a top destination not
only among young travelers of Europe but also among the event attendees from all over
the world. There has been an upward trend in importance of the city because of the
increasing prosperity that comes as a result of the successful organizations of
international congresses, conferences, symposiums, fairs, exhibitions and tradeshows.
Table 1: Number and expenditure of tourists in Hungary
According to “Tourism in Hungary 2015” booklet which was published by the
Hungarian Tourism Ltd., the number and the expenditure of tourists in last 2 years
showed an increasing trend. Table 1 shows the main data on Hungarian tourism. The
proportion of inbound tourists showed 18.2% increase, whereas the percentage of
outbound tourists hit 11.4. In parallel, the ratio of the expenditure of inbound tourists
climbed 17.2%, while the percentage of the expenditure of outbound tourists grew 14.5.
(URL – 1, 2016)
20
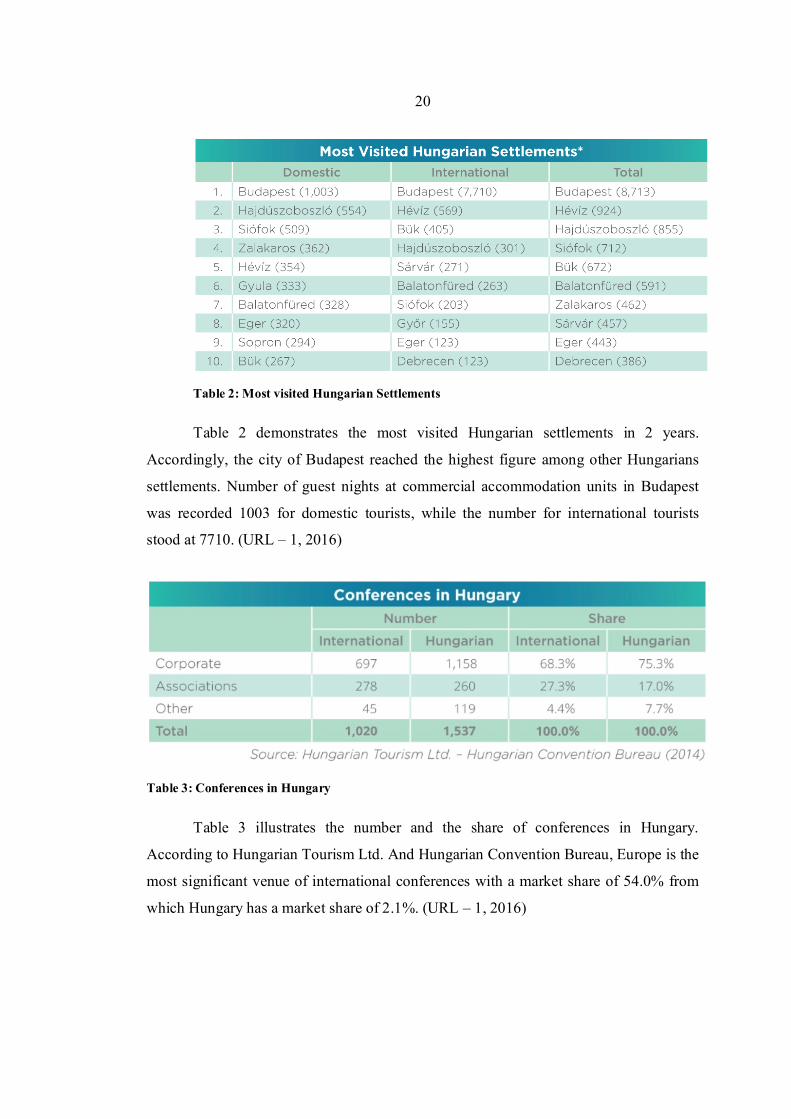
Table 2: Most visited Hungarian Settlements
Table 2 demonstrates the most visited Hungarian settlements in 2 years.
Accordingly, the city of Budapest reached the highest figure among other Hungarians
settlements. Number of guest nights at commercial accommodation units in Budapest
was recorded 1003 for domestic tourists, while the number for international tourists
stood at 7710. (URL – 1, 2016)
Table 3: Conferences in Hungary
Table 3 illustrates the number and the share of conferences in Hungary.
According to Hungarian Tourism Ltd. And Hungarian Convention Bureau, Europe is the
most significant venue of international conferences with a market share of 54.0% from
which Hungary has a market share of 2.1%. (URL – 1, 2016)

21
Table 4: Main characteristics of international conferences in Hungary
Table 4 illustrates the main characteristics of international conferences in
Hungary. There were 1020 conferences organized with 149 average number of
participants in 3.5 days average length of stay. Budapest hosted 77 percent of all
conferences, whereas only 23 percent of conferences were held in countryside. The most
important conference themes were recorded as medical science with 56.9%, economics
with 14.6%, pharmacy with 10.8%, information technology with 10.8% and academic
with 6.9%. (URL – 1, 2016)

22
Figure 1: Number of conferences in Budapest
Figure 1 shows the rank of Budapest in the terms of the number of conferences in years
between 2006 and 2014. According to ICCA, Hungarian Tourism Ltd. And Hungarian
Convention Bureau, Budapest maintained its position as the number 17 destination for
association congresses and outranked such important conference venues like Stockholm
(19.), Sydney (25.), Munich (26.) or Warsaw (39.) Also, more than 1.2 million persons
arrived with MICE tourism purpose (conference, congress, and business trip, exhibition,
fair) to Hungary in 2014; they spent altogether 4.0 million days in the country. Their
total spending reached 131.4 billion HUF. (URL – 1, 2016)
Motivation of Event Attendance
It is important to understand the event tourism experience holistically, from the
needs, motivations, attitudes and expectations brought to the event, through the actual
living experience (the “doing”, or “being there”) all the way to reflections on the event
including meanings attached to it and influences on future behavior. Experiences are
conceptualized and studied in terms of three internal dimensions:
What people are doing, or behavior (the “conative” dimension),
Their emotions, moods, or attitudes (the “affective” dimension),
Cognition (awareness, perception, understanding). (Getz, 2007)

23
Motivation theories are the ways to better understand the motivation of event
attendees. Before the various definitions and theories of motivation, the relationship
between motivation process and leisure time is examined in the following part.
Motivation Process and Leisure Time
All individuals have various needs and an inner behavior which tends to satisfy
them occurs most of the time. Motivation process is defined as this behavior process
which is created by inner motives to satisfy the individuals’ needs. Individuals need to
have leisure time to get away from everyday life and relax; and the motivation in that
way occurs. This behavior is also deeply related to participate in leisure and relaxation
activities.
There are many definitions of leisure time. According to definition in Webster’s
Third New International Dictionary leisure is defined:
freedom or spare time provided by the cessation of activities;
free time as a result of temporary exemption from work or duties;
a time at one's own command that is free of engagements or responsibilities;
a period of unemployed time;
opportunity provided by free time.
Charles (1960) defined that leisure, is a block of unoccupied time, spare time, or free
time when we are free to rest or do what we choose. Leisure is time beyond that which
is required for existence, the things which we must do, biologically, to stay, alive (that
is, eat, sleep, eliminate, medicate, and so on): and subsistence, the things we must do to
make a living as in work, or prepare to make a living as in school, or pay for what we
want done if we do not do it ourselves. Leisure is time in which our feelings of
compulsion should be minimal It is discretionary time, the time to be used according to
our own judgement or choice. (Charles, 1960)
Leisure is largely discretionary time, to be used as one chooses. It excludes existence
and subsistence time, time spent in socially or group determined activities in which the
individual would prefer not to participate. (Clawson and Knetsch, 1974) Leisure consists
of a number of occupations in which the individual may indulge of his own free will -

24
either to rest, to amuse himself, to add to his knowledge or improve his skills
disinterestedly or to increase his voluntary participation in the life of the community
after discharging his professional, family and social duties. (Dumazedier, 1960) Leisure
is activity - apart from the obligations of work, family, and society - to which the
individual turns at will, for either relaxation, diversion, or broadening his knowledge
and his spontaneous social participation, the free exercise of his creative capacity. .
(Dumazedier, 1974)
Participation in leisure activities also requires a motivation process. It is expected
from individual to have two main motives for participation; one of them is the desire to
move away from the current location, so called pushing motivation and the other is
called the wish to see different places, as pulling motivation.
The events organized in different subjects and styles provide a platform to
individuals to socialize and to share common interests and excitements. According to
Yılmaz (2015) the reason why individuals are interested in leisure activities and events
can be explained by the desire to have a healthy life, psychological relief, active social
life and developed personal skills. Attending such events contributes the individuals’
happiness, physical and mental development. (Yılmaz, 2015)
Definition and Theories of Motivation
Crompton and McKay (1997) stated that there are three reasons for the event
participants to better understand their motivation:
The first reason is that events offer such experience which is designed and
personalized for the participants. In this case, participants do not buy products but they
purchase the service and the benefits to satisfy their expectations from an event. It is
crucially important to define participants’ expectations correctly and to determine their
motive.
The second reason is that there is close link between motivation and satisfaction
of the participants. Motivation occurs before the experience and it comes after
satisfaction. If expectations are met, it will become apparent satisfaction. Therefore; to
be able to keep track of satisfaction is necessary to know the needs of event participants.

25
The third and final reason, the way to understand the decision-making process of
the participants is to identify and give priority to incentive motivation.
Iso-Ahola (1980) defines the concept of motive as an internal factor which
integrates individual's behavior to take an action and to be directed. According to
Crompton and McKay (1997) the motives are specified as the starting point of the
decision making process.
There is a non-random goal of every human behavior. The behaviors that led
individuals to the goal can be explained by the presence of a driving force. This is what
is called the driving force and motivation, indicating long relationship and their
interactions with each other. Motivation is an internal process of formation and an inner
pre-decision process (Rızaoglu, 2012).
According to Çakıcı (2009) motivation is called the individuals' urge to perform
an activity and it exists as long as the needs of individuals are satisfied. Because each
individual's needs are different, the motivational situation varies from person to person.
Motivation is emphasizing the individuals' behavior and psychological / biological
needs and wants so that it integrates individuals' acts and behaviors.
Individuals may be motivated by three different ways; Sometimes the need arises
but it do not turn into the behavior, sometimes the need arises unintentionally and
unplanned, decision making process happens spontaneously and lastly in some cases,
the needs arises and it turns into the planned behavior. It is a key point to see how the
individuals' motives play an important role in turning the needs to the behaviors.
(Odabaşı and Barış, 2002)
According to Crompton and McKay (1997) the pre-condition of planning and
promotion of the event to participants and tourists is to understand and to identify the
motives of participants. Also analyzing the effectiveness of motivation can be a
powerful marketing tool for event managers and this creates to the opportunity to
identify the strengths and opportunities of each market. Events and the competition of
the various destinations increased the importance of analyzing the motivations of event
attendees.
26
Getz (1991) classified the basic needs satisfied by festivals into: physical,
interpersonal or social, and personal. Moreover, Crompton (1979) developed a
framework which includes seven major motives in their study:
1. Novelty: visitors are motivated by the desire of seeking new experiences
2. Socialization: visitors are motivated by the interaction with other visitors
3. Prestige/Status: desire of positioning oneself in the eyes of others as attending special
events
4. Rest and Relaxation: motive of escaping from the daily life stress and refreshing the
mentality
5. Education Value/Intellectual Enrichment: motive of expanding gaining new
knowledge through attending a festival
6. Enhancing Kinship and Relations/Family Togetherness: enhancing kinship and the
desire to engage and enhance the family relationship
7. Regression: visitor’s attendance to prompt memories of childhood
Since the late 1980’s, several studies have been conducted on festival and event
motivation (Uysal et al. 1993, Mohr et al. 1993, Scott 1996, Schneider & Backman
1996, Lee 2000, and Lee et al. 2004). Most of the researches that have been done on the
event and festival attendance motivation include similar motivation scales as proposed
by Crompton’s (1979) framework with similar factors, more or less, according to the
event type. The major common aspect among them is the systematic presence of some
factors, such as Escape, Family Togetherness, and Socialization. There are some slight
differences concerning Event Novelty and Excitement and some specific motivational
factors depending on the type of event studied, such as curiosity (Scott 1996), festival
attributes (Schneider and Backman 1996) or event attractions (Lee 2000).
Moreover, Funk et al. (2009) developed the “SPEED - Facets of motivation”
which included five motivational contents: Socialization, Performance, Excitement,
Esteem, and Diversion. The SPEED scale was derived from previous researches

27
discussing the motives of sports events attendance, and it was applied on an Australian
Rules Football game, and validated later on.
Unlike the authors discussed previously, Nicholson and Pearce (2001) adopted a
different perspective by analyzing the attendees’ motivations in four different festivals
at the same time. It was sought to give more generality and a broader examination to the
motivation characteristics, which may also be applied on individual events. The four
examined festivals were: Marlborough Wine, Food and Music Festival; Hokitika
Wildfoods Festival; Warbirds over Wanaka; and New Zealand Gold Guitar Awards. The
selected events were meant to be different, to generate the different motives for festivals
attendance in general, and compile the common ones. The surveys used in the research
included “self-expressed” open questions like, “Why did you come to this event?”; and
motivational statements like – “to see the entertainment”, “because it is stimulating and
exciting”, and “to be with people who enjoy the same things I do”. After the factor
analysis, the different events resulted in similar factors, where the New Zealand Gold
Guitar Awards included the most factors which appeared in the other events. These
attendance motivation factors included: Specifics/entertainment; escape; variety
novelty/uniqueness; escape; family; and socialization. As a consequence, it seems clear
that even if slight differences can be detected, the main motivational factors to attend to
a cultural event and a festival in particular, have been defined. (Bacellar, 2012)
A starting point can be the classical work of anthropologists van Gennep (1909)
and Turner (1969, 1974, and 1982) who advanced the concept of “liminality”. This has
been found to be relevant to both travel and event experiences. In terms of one’s
involvement in rituals this state is characterized by humility, seclusion, tests, sexual
ambiguity and “communitas” (everyone becoming the same). “Liminoid” described the
same state but in profane rather than sacred terms, so that it might apply to carnivals and
festivals, emphasizing the notion of separation, loss of identity and social status, and
role reversals. In this state people are more relaxed, uninhibited, and open to new ideas.
(Getz, 2007)
Jafar Jarai’s model of “tourist culture” is based on socio-anthropological theory
concerning liminality, plus Falassi’s (1987) notion of festivity as a time that is ‘out of

28
ordinary time’. Essentially, people willingly travel to, or enter into an event-specific
place for defined periods of time, to engage in activities that are out of the ordinary and
to have experiences that transcend the ordinary experiences only available to the traveler
or the event-goer. As well, Csikszentmihalyi (1990) and Csikszentmihalyi and
Csikszentmihalyi’s (1988) concept of ‘flow’ or peak experiences, from leisure studies,
fits well into this model. Facilitating “flow” might be something the event designer
wants to achieve, for maximum engagement, and something the highly “involved”
might be more inclined to experience because of their predispositions. (Getz, 2007)
Research supports the existence and importance of “communitas” at events.
Hannam and Halewood (2006) in a study of participants in Viking festivals concluded
that group identity was fostered, even to the point of establishing a “neo-tribal”
community. Green and Chalip’s (1998) study of women athletes determined that the
event was a celebration of sub-cultural values. Fairley and Gammon (2006) identified
the importance of sport fan communities, while Pitts (1999) studied lesbian and gay
sports tourism niche markets. (Getz, 2007)
Meanings are given to events by social groups, communities and society as a
whole. Individuals are affected by these meanings, but are also able to make their own
interpretations of events. Event types or forms, as previously discussed, are to a large
extent “social constructs”, with collectively assigned and generally recognized
meanings. (Getz, 2007)
Roche (2000) saw events, like the global Millennium celebrations, acting as
“important elements in the orientation of national societies to international or global
society.” In this manner, many countries have used mega events to gain legitimacy and
prestige, draw attention to their accomplishments, foster trade and tourism, or to help
open their countries to global influences. This is much more than place marketing - it is
more like national identity building. Countries and cities compete for mega sport events
to demonstrate their “modernity and economic dynamism”. (Getz, 2007)
29
Chapter 3: Research Methodology
Introduction
This chapter concentrates on the way of data collection and methodology to
investigate event tourism, theories of events and motivation, the relation between
motivation process and leisure time and individuals’ motivation for attending various
types of events. In this manner, secondary and primary researches were realized. The
secondary research for this dissertation was based on a wide literature review of
previous academic works.
A questionnaire was defined to be the most appropriate means of collecting the
necessary data. In this manner, an online questionnaire was preferred to conduct as the
primary research method, with the help of a famous online survey product, Google
Forms since it is considered as a helpful tool for reaching wide-ranging segments with
ease. This study aims to demonstrate that the data which was derived from the survey on
participants’ demographic characteristics, motives, tendency and willingness to attend
events in Budapest is collected to make a comprehensive analyze.
Another focus point of this chapter is to make a justification of the reason why
specific method and topic were chosen and the types of researches were realized. The
reason why the topic is defined as “A study on attendees’ motivation for events in
Budapest” is to find out what the different types of events in Budapest mean for locals,
foreign tourists and expats. The motivation behind their decision is the main focus of
this paper.
The city of Budapest was selected as a study to work on since it has been
incredibly flourished in all aspects and gathers attention in increasing trend by both
locals and internationals. The research questions were discussed, the objectives were
defined and the hypothesis was proposed. Literature review and the theoretical part of
the thesis work were carried out by the use of different sources such as academic books,
articles, tourism magazines and other forms of electronic sources. Afterwards, the data
that was collected from the results of online questionnaire was analyzed in the terms of
attendants’ characteristics and motivation of attendants. Eventually, conclusion of this
work and future recommendations were made in the end of the thesis.

30
Data Collection
Secondary Research
Investigational study was completed to set up the basis of the dissertation
which aims to give comprehensive information on the academic background of the
topic. The study and the literature review were determined by the objectives and
research questions. Thanks to several books, tourism magazines, previous dissertations,
articles, journals, also the access for online sources in Budapest Business University
Tourism Library (Idegenforgalmi Szakkönyvtár), investigational process was completed
successfully without the extra need of any other sources. The literature research was
realized mostly in English; additionally there are number of academic works in Turkish
that were translated and included to this work.
In the first part of literature review, events and types of events were examined.
After a general explanation on event tourism, the city of Budapest was examined
particularly in the terms of event tourism. In the second part of the chapter, motivation
and its theories, the relation between motivation process and leisure time, motivation for
event attendance were given.
Primary Research
In this study, an online questionnaire was preferred to collect the necessary
data. Drafted questionnaire was prepared according to previous researches and scales
which were determined by various researchers.
The online questionnaire consists of three different parts; in the first part, it is
aimed to find out participants’ perception of events in Budapest and their frequency to
participate different kind of events. The second part of the survey focuses on
participants’ event experience, satisfaction and motivation. They were asked what kind
of events they have participated. Finally, the third part is related to demographic
characteristics and general information of participants such as gender, age, occupation,
education etc.
The online questionnaire was carried out on Google Forms and was distributed
in different English speaking groups on Facebook, Couchsurfing and Google Groups.
31
Participation to the survey was voluntary and the questionnaire was anonymous. It
consists of 22 questions in total. Survey was semi-structured: it involved both open-
ended and close-ended questions. Data was gathered in one week period, and the
questionnaire took approximately from 5 minutes to complete. As a result, 120
participants fulfilled the survey.
Data Analysis Method
The primary research was conducted using quantitative methods. The major
information was gathered from respondents is numeric and text based, and the minor –
their own demographic information on the types of sources, their experience and
motivation. All collected data was presented in the following chapter as pie charts, bar
charts, word cloud and tables with detailed descriptive information and interpretation.
32
Chapter 4: Research Analysis and Results
Introduction
This chapter concentrates on the results of the online questionnaire which was
carried out on Google Forms and was distributed in various English speaking groups on
Facebook, Couchsurfing and Google Groups. 120 different participants answered 22
questions related to their previous event experiences in Budapest in one week. The
questionnaire consisted of 3 sections; in the entrance section, participants were asked 4
questions on their frequency, motive and perception about attending events in Budapest.
In the second section, 10 event experience and motivation related questions were asked
and finally in the last section, there were 8 questions about personal life and
demographic characteristics.
Before answering the survey questions, respondents were requested to read
through the description and explanation which contained short information on my
personal data (name and surname), educational background (name of the university and
the major) and purpose of the survey. Respondents were also requested to think about a
specific event they have attended before in Budapest. Information about ethics such as
anonymity was also given in the introduction part of the survey.
As it was mentioned before, online questionnaire was created as Google Forms
which consists of “Yes or No”, “Multiple Choice”, “Checkboxes” and open-ended text
box questions with the possibility to select more than one answer. In the second part of
the survey, the answers of the questions which related to event experience and
motivation were created with the help of the information gathered in literature review in
the terms of events classification. In addition, Crompton’s (1979) framework which
indicates seven major motives such as novelty, socialization, prestige, relaxation,
education value, relations and regression was presented to participants as multiple
choice answers to investigate their motivation in general.
In the following sections, the personal information gathered in the third part of
the online survey about attendance characteristics such as gender, age, nationality, city
of residence, education level, occupation, type of family and monthly income were
presented as pie and bar charts. After, the data collected from the first part of the

33
questionnaire which was related to attendants’ perception of events and their frequency
for attending events in Budapest were examined in details with the help of pie and bar
charts created during this dissertation work. And last but not least, the results gathered in
the second part of the survey which investigated experience and motivation of attendants
were demonstrated in pie and bar charts as well. Also explanations on the charts that
were created during this study were realized to give a general insight about the results.
Analysis of Online Survey
Attendants’ Characteristics
The number of women who participated the online questionnaire is slightly
higher than men; the survey was filled out by 57 men while the number of female
participants is 63. In other words, 52.5% of participants are female and 47.5% of them
are male. (Figure 2)
.
Figure 2: Gender data of online survey participants
The question regarding the age was multiple choice; participants chose their age
group between seven groups such as 18-26, 27-34, 35-44, 45-54, 55-64, 65-74 and 75+
34
.
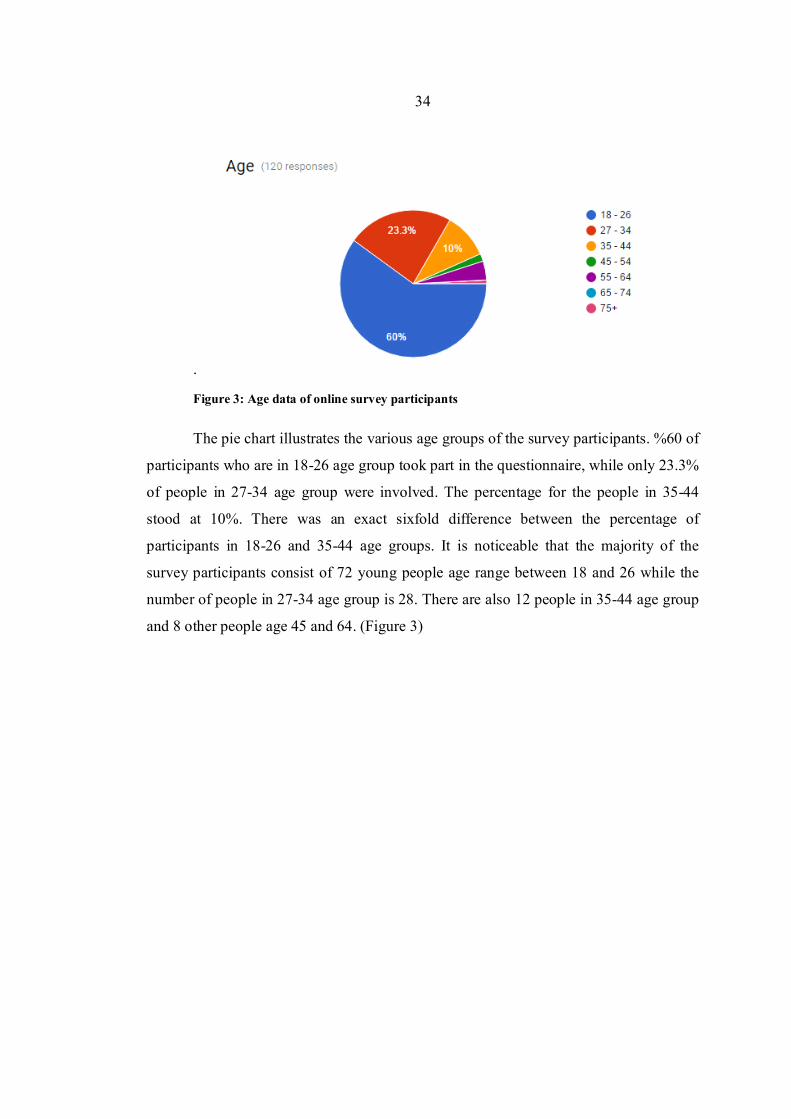
Figure 3: Age data of online survey participants
The pie chart illustrates the various age groups of the survey participants. %60 of
participants who are in 18-26 age group took part in the questionnaire, while only 23.3%
of people in 27-34 age group were involved. The percentage for the people in 35-44
stood at 10%. There was an exact sixfold difference between the percentage of
participants in 18-26 and 35-44 age groups. It is noticeable that the majority of the
survey participants consist of 72 young people age range between 18 and 26 while the
number of people in 27-34 age group is 28. There are also 12 people in 35-44 age group
and 8 other people age 45 and 64. (Figure 3)

35
Figure 4: Nationality of online survey participants
The respondents were asked about their nationality and city of residence. There
were many different participants from all over the world. Majority of them were
Hungarians. There were also a notable number of Turkish, French and German people
who participated the survey. Figure 4 provides information that, 27.1 percent of
Hungarians joined the survey while, 20.3 percent of Turkish people participated. Also,
11.9 percent of French and 5.9 percent of German people answered the survey.

36
Figure 5: City of residence of survey participants
Figure 5 points out that most of the survey participants are based in Budapest.
All other participants who have been at least one event in Budapest, are living in
different cities such as Istanbul (Turkey), Le Havre (France), Chambery (France),
Madrid (Spain), Debrecen (Hungary) and Athens (Greece). The percentage of people
who is living in Budapest was significantly greater than any other with 63.2% while the
percentage of Istanbul stood at 6.8% and the percentage of Le Havre at 2.6%. Also
Athens, Debrecen, Madrid and Chambery share the percentage of 1.7.

37
Figure 6: Occupation of survey participants
As the most dominant age group is between 18 to 26 years old, it is expected that
most of the participants’ occupation is student. There is also number of workers,
entrepreneurs, officers, teachers/academicians, unemployed and self-employed people.
Figure 6 illustrates that 56.7% of survey participants are student, while 11.7% of them
are worker, 7.5% of them are self employed and 5% of them are entrepreneur. The
percentage of unemployed people and teacher / academicians reached the similar point
at 5.8%.
38
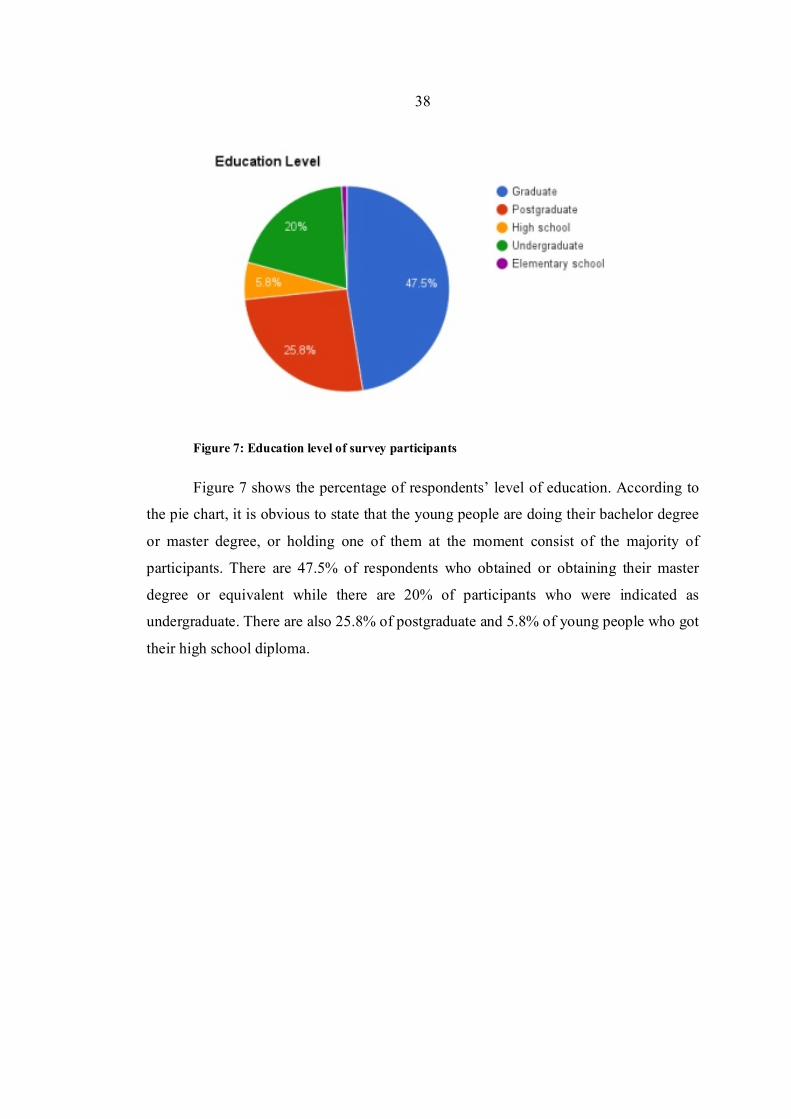
Figure 7: Education level of survey participants
Figure 7 shows the percentage of respondents’ level of education. According to
the pie chart, it is obvious to state that the young people are doing their bachelor degree
or master degree, or holding one of them at the moment consist of the majority of
participants. There are 47.5% of respondents who obtained or obtaining their master
degree or equivalent while there are 20% of participants who were indicated as
undergraduate. There are also 25.8% of postgraduate and 5.8% of young people who got
their high school diploma.

39
Figure 8: Marital status of survey participants
The pie chart illustrates the figure for marital status of survey attendants.
Accordingly, a large majory of participants are single with the percentage of 51.7, while
35 percent of them are in a relationship. People who are married with children and
without children remained at the same percentage of 5.8. (Figure 8)
Figure 9: Monthly income / Salary of survey participants

40
Figure 9 demonstrates the proportion of survey respondents’ monthly income or
salary. As the majority of people are between 18 to 26 years old, it is understandable
that the percentage of 70.000 HUF and below took the greatest value in the chart. It
stood at 25.8% while others have respectively close to each other. It can be easily
indicated that monthly income and salary of participants were quite diversified.
Perception of Events and Attendance Frequency
This section focuses on the result of first part of the online questionnaire which
is related to attendants’ perception of events and their frequency for attending events in
Budapest. In this frame, the answers of general questions such as “How often do you
participate events in Budapest?”, “What is the most important factor for you to choose
an event?” and “Do you think events in Budapest are affordable?” were examined and
results were recorded in the form of pie and bar charts.
Figure 10: Data for Q2 "How often do you participate events in Budapest?"
The bar chart illustrates the number of attendants who answered the question
about their frequency to attend events in the city of Budapest. Accordingly, more people
selected “once a week” than any other options. The number of people who attended an
event once a week stood at 30, while the number of people who participated an event

41
couple times a year reached 23. Total number of answers for other options was recorded
relatively close to each other; The number of the people who indicated that they
attended events three or more times a week and once a month stood at same value at 16.
Also, 15 people replied that they attended events two or more times a month while there
were only 12 people who participated events once a year. The number of survey
attendants who participated events in Budapest twice a week was 8. (Figure 10)
Figure 11: Data for Q3 "What is the most important factor for you to choose an event?"
The participants of the online questionnaire were asked what the most important
factor was for them to choose an event and majority of them selected the program of the
event as the most important criteria to choose an event. The number of people who
chose program stood at 42, while the second biggest important factor, friends followed it
with 36. There were also 18 people who thought the feeling as the most important
factor, whereas the number of people who choose price, place and organization was
relatively close to each other. 10 people chose organization as the most important factor.
The number of people who marked the answer as price was 8, while the number of
participants who indicated that place is the most important stood at 6. (Figure 11)

42
Figure 12: Data for Q4 "Do you think events in Budapest are affordable?"
The participants were also asked whether they think events in Budapest are
affordable or not. An overwhelming majority of participants answered “Yes”. The
number of people who thinks that events are affordable in Budapest was 113, while only
7 people indicated that events in Budapest are not affordable. The ratio of yes answers
stood 94.2%, whereas the ratio for “No” answers was only 5.8%. (Figure 12)
Experience and Motivation of Attendants
This section concentrates on the main part of the online questionnaire which
included 10 questions on experience, satisfaction and motivation of attendants.
Participants were asked to think about an event that they have attended in Budapest
before and to answer the questions accordingly. The results of the survey formed the
main part of this dissertation study since it pointed out precious data to be able to prove
or to disprove the hypothesis which was given in the beginning. In this manner,
questions such as “What kind of events have you participated in Budapest?”, “How did
you attend the event?”, “What was the size of the event?”, “How did you hear about the
event?”, “How would you define your experience?”, ”What was the key factor which
satisfied/dissatisfied you?”, “Would you like to participate an event you have attended
in Budapest?”, “Please choose 3 reasons why you have participated events in
Budapest?”, “Which one of the following best defines your motivation in general?” and
as an open-ended question, “What kind of events would you like to see more in the

43
future in Budapest?” were asked to participants. The results were created in the form of
pie and bar charts.
Figure 13: Data for Q5 "What kind of events have you participated in Budapest?"
The question “What kind of events have you participated in Budapest?” was
multiple choice. So participants could choose as many options as they wish to. This bar
chart above illustrates various types of events that participants have attended before in
Budapest. Accordingly, the percentage of survey responders who indicated that they
have attended cultural events such as festivals, carnivals, gastronomy events etc. hit to
77.5% with the number of 93 answers, whereas the number of participants who chose
public events such as parties, community celebrations etc. remained 82, with the
percentage of 68.3% as the second highest figure. As the third highest value, arts and
design events such as concerts, design meet-ups, workshops, exhibitions, debates etc.
stood at 49.2% with the number of 59 participants, while people who chose educational
events like seminars, conferences etc noted 34.2% with the number of 41 participants.
Also, the ratio of people who attended recreational events such as sports, outdoor
gatherings etc. saw 28.3% with the number of 34 participants, whereas the percentage of
people who have attended business events such as fairs, trade shows, meetings,
conventions, exhibitions etc. reached 20.8% with the number of 25 participants. And so,
the percentage of participants who attended private events like weddings recorded as the
lowest figure as 17.5% with the number of 21 participants. (Figure 13)
44
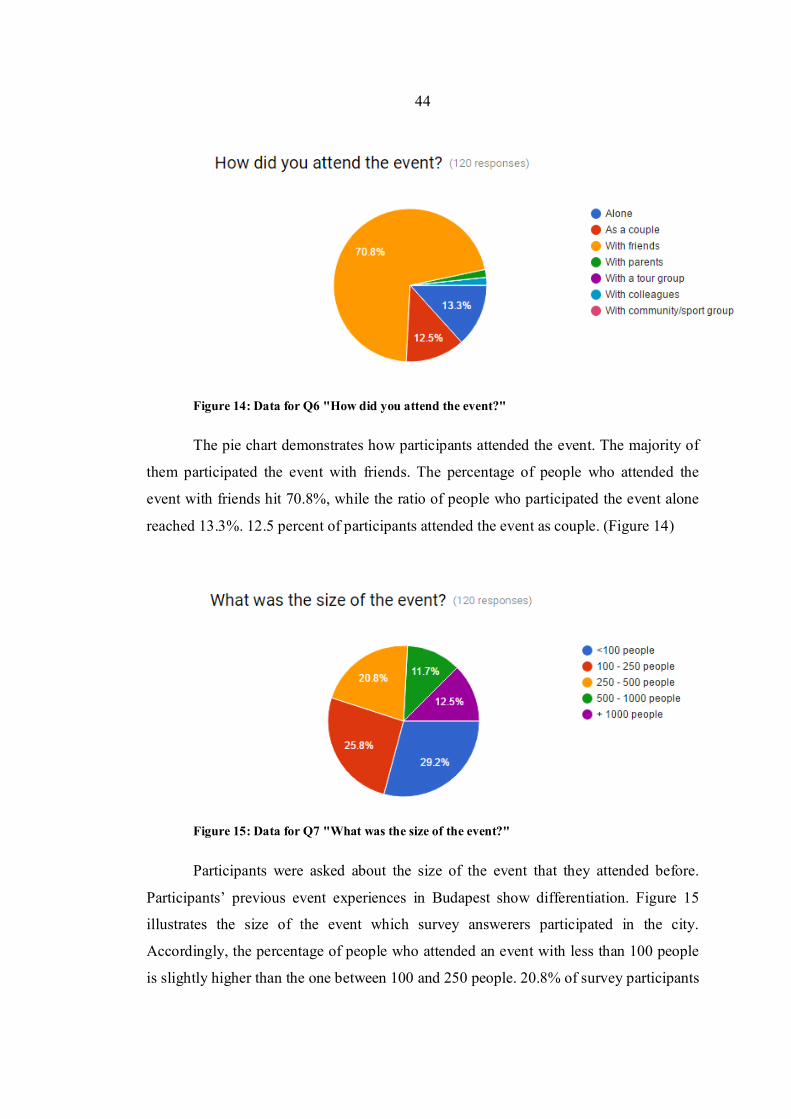
Figure 14: Data for Q6 "How did you attend the event?"
The pie chart demonstrates how participants attended the event. The majority of
them participated the event with friends. The percentage of people who attended the
event with friends hit 70.8%, while the ratio of people who participated the event alone
reached 13.3%. 12.5 percent of participants attended the event as couple. (Figure 14)
Figure 15: Data for Q7 "What was the size of the event?"
Participants were asked about the size of the event that they attended before.
Participants’ previous event experiences in Budapest show differentiation. Figure 15
illustrates the size of the event which survey answerers participated in the city.
Accordingly, the percentage of people who attended an event with less than 100 people
is slightly higher than the one between 100 and 250 people. 20.8% of survey participants

45
attended an event of 250 – 500 people. Also, the percentage of participants who attended
an event of 500 – 1000 people remained 11.7, while the percentage of participants who
attended an event of more than 1000 people saw 12.5.
Figure 16: Data for Q8 "How did you hear about the event?"
The pie chart demonstrates participants’ source of information on the event. As
most of the participants of online survey aged between 18 and 26, commonly used -
especially by young people- social media platform, Facebook, was chosen as the
primary source of information about the event. The ratio for Facebook hit %65, while
19.2% of participants selected “friends” as the source of information. There were also
9.2% of participants who heard the event from word of mouth. (Figure 16)
46
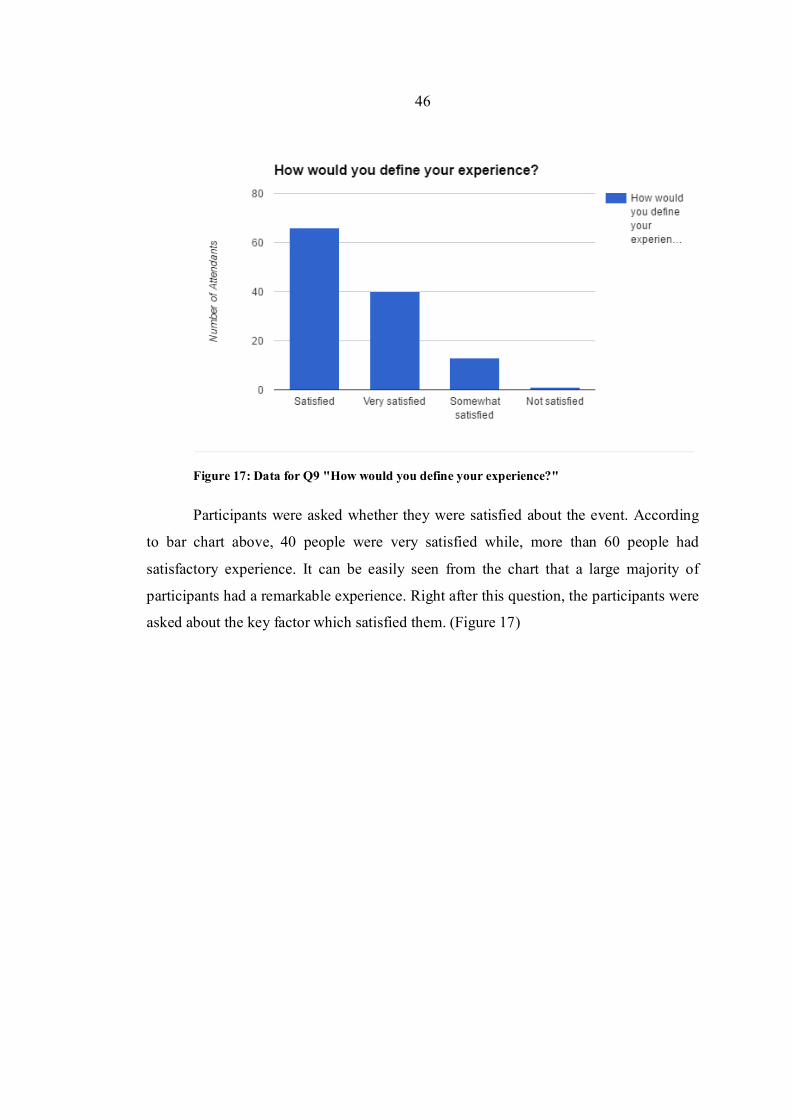
Figure 17: Data for Q9 "How would you define your experience?"
Participants were asked whether they were satisfied about the event. According
to bar chart above, 40 people were very satisfied while, more than 60 people had
satisfactory experience. It can be easily seen from the chart that a large majority of
participants had a remarkable experience. Right after this question, the participants were
asked about the key factor which satisfied them. (Figure 17)

47
Figure 18: Data for Q10 "What was the key factor which satisfied you?"
According to Figure 18, 50 participants indicated that originality and type of
event was the key factor for them, whereas the number of people who answered that the
quality was the key factor remained 33. Also, 29 participants selected “Program” as the
key factor which satisfied them, while only 6 people said that venue was the key factor.
Figure 19: Data for Q11 "Would you like to participate an event you have attended before
in Budapest?"
Participants were asked whether they would like to participate an event they
have attended before in Budapest to search their motivation to attend repeated events.

48
Figure 19 demonstrates that a great majority of participants were willing to attend an
event that they have attended before in Budapest with the percentage of 95.2 and only
4.2% people indicated that they would not attend any event in Budapest.
Figure 20: Data for Q12 "Please choose 3 reasons why you have participated events in
Budapest"
The twelfth and the thirteenth questions were prepared to search participants’
reasons and motivation for attending events in Budapest. These questions also
constituted the base for proving or disproving the hypothesis of this dissertation study
since they provided crucially important data for the conclusion and helped me to realize
a future recommendation accordingly.
In the twelfth question, participants were asked to choose at least 3 reasons why
they have participated events in Budapest. The bar chart above illustrates the number of
answers that were given to each option. Accordingly, the number for the answer
“Entertainment” recorded as the highest figure with 89 times, whereas the number of the
answer “Friends” followed this with 86 times. “Curiosity” reached 48 times, while
“General atmosphere” remained at 38. Also, “Community” was chosen 33 times by
participants, whereas “Gastronomy” hit 29 times. Participants’ “Past experience”
reached 17 times, while “Break away” followed it with 16 times. Also, “Unusualness”
stood at 14 times. (Figure 20)
49
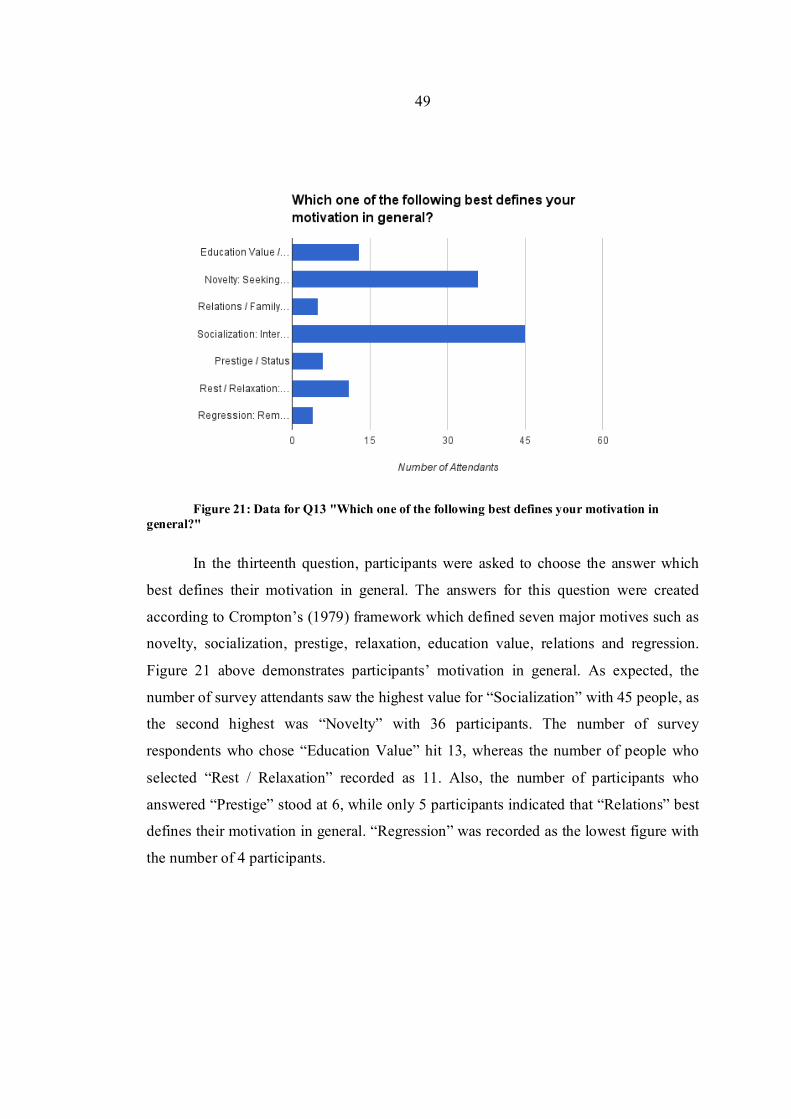
Figure 21: Data for Q13 "Which one of the following best defines your motivation in
general?"
In the thirteenth question, participants were asked to choose the answer which
best defines their motivation in general. The answers for this question were created
according to Crompton’s (1979) framework which defined seven major motives such as
novelty, socialization, prestige, relaxation, education value, relations and regression.
Figure 21 above demonstrates participants’ motivation in general. As expected, the
number of survey attendants saw the highest value for “Socialization” with 45 people, as
the second highest was “Novelty” with 36 participants. The number of survey
respondents who chose “Education Value” hit 13, whereas the number of people who
selected “Rest / Relaxation” recorded as 11. Also, the number of participants who
answered “Prestige” stood at 6, while only 5 participants indicated that “Relations” best
defines their motivation in general. “Regression” was recorded as the lowest figure with
the number of 4 participants.

50
Figure 22: Data for Q14 "What kind of events would you like to see more in Budapest in
the future?"
The last question of the second part of the online questionnaire was open-ended
to give respondents a free space to think and reflect their own wish and ideas. The
participants were asked what kind of events they would like to see more in Budapest in
the future and notably common and unique answers were recorded and illustrated as bar
chart. According to Figure 22, the majority of participants answered that they wish to
experience more “Cultural” and “Concert” events, while the second highest respond was
“Gastronomy”. There were also a pack of people who like to see more “Party” and
“Festivals”. Additionally, the answers like “Gambling” and “Private Adult” were
recorded as the lowest figure.
The proportion of participants who responded that they would like to see more
“Cultural” and “Concert” events stood at the same value at 14, whereas the figure for
people who want more “Gastronomy” events reached 13. The number of participants
who denoted “Party” and the number of respondents who pointed out “Festivals” met at
51
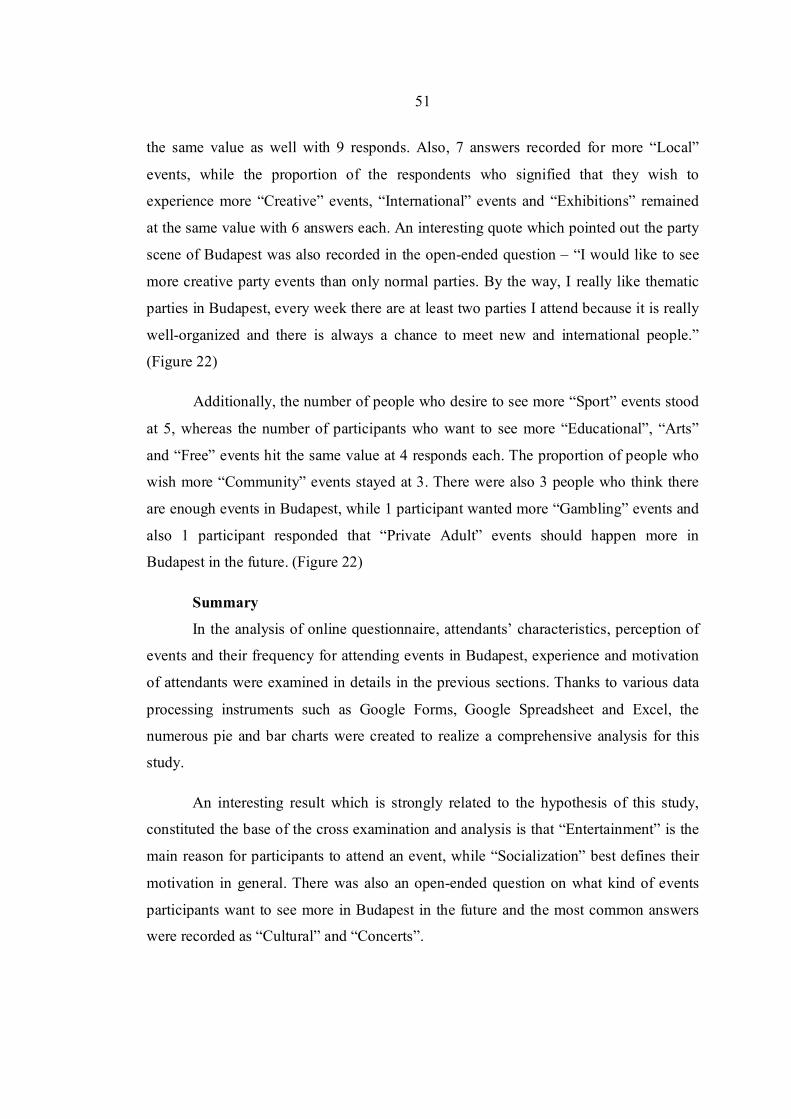
the same value as well with 9 responds. Also, 7 answers recorded for more “Local”
events, while the proportion of the respondents who signified that they wish to
experience more “Creative” events, “International” events and “Exhibitions” remained
at the same value with 6 answers each. An interesting quote which pointed out the party
scene of Budapest was also recorded in the open-ended question – “I would like to see
more creative party events than only normal parties. By the way, I really like thematic
parties in Budapest, every week there are at least two parties I attend because it is really
well-organized and there is always a chance to meet new and international people.”
(Figure 22)
Additionally, the number of people who desire to see more “Sport” events stood
at 5, whereas the number of participants who want to see more “Educational”, “Arts”
and “Free” events hit the same value at 4 responds each. The proportion of people who
wish more “Community” events stayed at 3. There were also 3 people who think there
are enough events in Budapest, while 1 participant wanted more “Gambling” events and
also 1 participant responded that “Private Adult” events should happen more in
Budapest in the future. (Figure 22)
Summary
In the analysis of online questionnaire, attendants’ characteristics, perception of
events and their frequency for attending events in Budapest, experience and motivation
of attendants were examined in details in the previous sections. Thanks to various data
processing instruments such as Google Forms, Google Spreadsheet and Excel, the
numerous pie and bar charts were created to realize a comprehensive analysis for this
study.
An interesting result which is strongly related to the hypothesis of this study,
constituted the base of the cross examination and analysis is that “Entertainment” is the
main reason for participants to attend an event, while “Socialization” best defines their
motivation in general. There was also an open-ended question on what kind of events
participants want to see more in Budapest in the future and the most common answers
were recorded as “Cultural” and “Concerts”.

52
Especially, the twelfth and the thirteenth questions in the online questionnaire
formed the main core of this study. They were prepared to search participants’ reasons
and motivation for attending events in Budapest. These questions also formed the main
source of data for proving or disproving the hypothesis of the dissertation since they
provided crucially important results to create a comprehensive conclusion. Particularly,
in the thirteenth question, participants were asked to choose the answer which best
defines their motivation in general. The answers for this question were created
according to Crompton’s (1979) framework which defined seven major motives such as
novelty, socialization, prestige, relaxation, education value, relations and regression.
Thanks to cross analysis which was created with the help of Microsoft Excel,
general motivation by age was recorded and examined. The relationship between
motivation and age groups was illustrated as bar chart. Also, an ultimate comparison of
main purpose for attending and motivation for attendance by age groups were also
demonstrated in the form of bar chart to realize an interpretation accordingly.
Figure 23: General motivation of survey participants by age group
Figure 23 illustrates the general motivation of participants’ for attending events
in Budapest by age groups which were asked in thirteenth and sixteenth questions in the
online survey form. Accordingly, “Socialization” was recorded as the highest figure

53
among 18 – 16 age group. More people in 27 – 34 age group than participants in 35 – 44
age group chose “Socialization”. Also, “Novelty” was chosen by more 18 – 26 age
group than 27 – 34 and others as the second highest answer. Also, the least popular
answer among all the age groups was recorded as “Regression”.
It can be easily observed from the bar chart that people who are in 18 – 26 age
group mostly motivated by socialization purposes when they are attending an event in
Budapest, while the second highest source of motivation was novelty.
As it was examined in the previous bar chart, Figure 23, socialization was
recorded as the most important aspect of the motivation for attendance. After that, the
cross analysis which aimed to investigate the proportion of participants and their age
group that both chose “Socialization” in the thirteen question and “Entertainment” in
twelfth question was created and formed as a bar chart.
Figure 24: Comparison of main purpose and motivation for attendance by age group
Figure 24 demonstrates the comparison of the data for the main purpose and
motivation for attendance by age which were asked in twelfth, thirteenth and sixteenth

54
questions in the questionnaire. It can be interpreted that there are considerably more
participants in 18 – 26 age group who chose both “Socialization” and “Entertainment” at
the same time than any other age groups. Only “Entertainment” and only “Socialization”
have also chosen by the significant number of participants in 18 – 26 age group, whereas
the value for other age groups remained relatively low compared to the first age group.
By observing the bar chart given above, it can be concluded that survey
participants in 18 -26 age group were motivated by socialization and interaction with
others, while their main purpose was recorded as entertainment and excitement in the
events that they have participated. (Figure 24)
In the following chapter, an interpretation of all these results was noted with the
recommendation for future promotional activities and for the market. Conclusions and
critical evaluation of the overall topic were realized and prove or disprove of the
hypothesis were discussed. Then recommendations for practical use of the data and
suggestions for further research were carried out.

55
Chapter 5: Conclusion and Recommendation
Conclusion
The data which was derived from attendees’ demographics and participants’
motivations was analyzed by cross examinations. Findings of the data gathered from
120 participants indicate that slightly more than half of them are female and mostly
belong to 18 – 26 age group. It was also found that they are mostly single Hungarian
university students who have 70.000 HUF and below monthly income and based in
Budapest. Another finding is that the most of the participants attended at least one event
once a week and the most important factor for them to choose an event is “Program”.
An overwhelming majority of participants think that events in Budapest are affordable
for them.
Additionally, it was found that the majority of participants attended cultural
events such as festivals, carnivals, gastronomy events etc. with their friends and they
mostly heard about the event thanks to commonly used social media platform,
Facebook. Participants were greatly satisfied about the events they have attended so that
the majority of them think that originality / type of events is the key factor which
satisfied them and that is the reason why they have a dominant tendency to participate
an event that they have attended before in Budapest.
As it was indicated in the introduction part of this study, the hypothesis of the
this paper is that Budapest has been a popular destination for both international and
national young people in 18 – 26 age group who preferred to attend events within the
city for socialization and entertainment purposes. With the help of all these findings and
interpretations explained above, it can be summed up that the hypothesis for this study
has been proven since the results of this study pointed out young people in 18 – 26 age
group have mostly participated events in Budapest for socialization, interaction with
others, entertainment and excitement purposes.

56
Recommendation
It can be indicated that the motivation factors which were determined in analysis
and conclusion parts matched with motivational theories that were examined during the
literature review. Accordingly, it was explained before that the motives and behaviors of
participants were deeply influenced by external factors. It is a general fact that in the
case of satisfaction of participants, there is most likely re-participation to events,
whereas in the case of dissatisfaction, it is not possible to attract people to attend and to
repeat the participation. Thus, it should be aimed to alter the participants’ external
factors to influence their choice and behavior for participating events.
The findings and analysis provided crucially important data for the future
recommendation. After the motives of event attendants were examined, it was noted that
the search for socialization and interaction with others were constituted the motivational
dimension as the most important aspect. Besides, the main purpose of attendants for
participating various events in Budapest was recorded as entertainment and excitement.
For this reason, it may be useful to increase the number of events and activities which
were designed specifically for ensuring the satisfaction of participants, experience,
interaction and regaining the participants for repeated events in the terms of
socialization, diversity and entertainment to realize successful and remarkable events in
the market.
As a result, event managers should prepare an effective event schedule that
matches the expectations of the participants. If the event managers improve the content
of the events, the form of the participants' expectations, the form of implementation and
the number of participation may also increase in the future.
57
Appendices
The online questionnaire that was carried out via Google Forms
Hello! I am Ahmet Uzun, master student in Tourism Management at Budapest Business
University. I am writing my thesis on attendees’ motivation for various events in
Budapest. If you have ever attended any kind of events such as festivals, parties, food
events, art/design events, sports/cultural events, community/networking events etc. in
Budapest before, feel free to fill the survey to contribute my work about your experience
and motivation.
It is an anonymous questionnaire and it will roughly take less than 5 minutes. Please
think about an event you have attended in Budapest before answering the
following questions.
Many thanks for your help in advance.
I – Entrance questions
1 - Have you participated an event in Budapest before?
Yes / No
2 - How often do you participate events in Budapest?
Once a week / Twice a week / Three or more times a week / Once a month / Two or
more times a month / Once a year / Couple times a year
3- What is the most important for you to choose an event?
Program / Friends / Organization / Prices / Feeling / Place
4- Do you think events in Budapest are affordable?
Yes / No
II – Event Experience and Motivation related questions
58
5- What kind of events have you participated in Budapest?
Cultural: Festival, Carnival, Gastronomy events
Arts and Design: Concerts, Design Meetups, Workshops, Exhibitions, Debates
Public: Parties, Community celebrations
Recreational: Sports, Outdoor gathering
Educational: Seminars, Conferences
Private: Weddings
Business: Fairs, Trade Shows, Meetings, Conventions, Exhibitions
6- How did you attend the event?
Alone / As a couple / With friends / With parents / With a tour group / With colleagues /
With community / Sport group
7- What was the size of the event?
<100 / 100-250 / 250-500 / 500-1000 / + 1000 people
8- How did you hear about the event?
Facebook / Twitter / Instagram / TV / Newspaper – Magazine / Billboards / Friends /
Tourist Office / Word of mouth
9- How would you define your experience?
Very satisfied / Satisfied / Somewhat satisfied / Not satisfied / Very dissatisfied
10- What was the key factor which made you give the previous answer?
Originality / Type of Event
Duration
Quality

59
Program
Venue
Number of participants
11- Would you like to participate an event you have attended before in Budapest?
Yes / No
12- Please choose 3 reasons why you have participated events in Budapest?
Entertainment / Excitement
Friends / Socialization
Community / Networking
Curiosity
Unusualness / Uniqueness
General atmosphere
Gastronomy / Food
Organization
Past experience
Break away / Holiday
Other
13- Which one of the following best defines your motivation in general?
Novelty: seeking new experiences
Socialization: interaction with others
Prestige/ Status
Rest / Relaxation: Escape from daily life stress

60
Education Value / Intellectual Enrichment
Relations/Family Togetherness
Regression: remembering old memories
14- What kind of events would you like to see more in Budapest in the future?
The open-ended question
III – Personal / Demographic questions
15- Gender
Male / Female
16- Age
18-26 / 27-34 / 35-44 / 45-54 / 55-64 / 65-74 / 75+
17- Nationality
18- Place/City of Residence
19- Education Level
Elementary school / Senior high school / Undergraduate / Graduate / Postgraduate /
Other (Please Define)
20- Occupation
Student / Self-employed / Executive / Officer / Teacher-Academician / Entrepreneur /
Unemployed / Pensioner-Retired / Other
21- Type of Family (Marital Status)
Single / In a relationship / Married, no children / Married, with children / Divorced, with
children / Other (Please Define)

61
22- Monthly income/salary
70.000 HUF and below / 70.000 – 100.000 HUF / 100.000 – 150.000 HUF / 150.000 –
200.000 HUF / 200.000 – 300.000 HUF / More than 300.000 HUF
Thank you for your participation!
62
References
1. Babacan, E. and Göztaş, A. (2011), Event Management, Seckin Publishing,
(Turkish Source)
2. Bacellar, C 2012, 'Motivation to attend to a cultural event: Profiling Deauville
Asian Film Festival attendees',British Academy of Management 2012, British
Academy of Management, Cardiff, Royaume-Uni, 11-13 September 2012
3. Çakıcı, A. (2009). Kişisel gelişim eğitimleri başvuru kaynakları. Motivasyon
içinde (ss.200-236). Mersin: Mersin Üniversitesi. (Turkish Source)
4. Carlsen, J., & Taylor, A. (2003). Mega-events and urban renewal: The case of
the Manchester 2002 Commonwealth Games. Event Management, p. 15–22.
5. Charles K. Brightbill (1960) The Challenge of Leisure. Englewood Cliffs, NJ,
PrenticeHall, p. 4.
6. Crompton, J. L. ve McKay, S. G. (1997). Motives of visitors attending festival
events. Annuals of Tourism Research, 24 (2), 425-439.
7. Crompton, J. L., 1979. Motivations for Pleasure Vacation. Annals of Tourism
Research, 6(4), pp.408-424.
8. Davidson, R. (2003). Adding pleasure to business: Conventions and tourism.
Journal of Convention and Exhibition Management, p. 29–39.
9. Funk, D. C., Filo, K., Beaton, A. A. and Pritchard, M., 2009. Measuring the
Motives of Sport Event Attendance: Bridging the Academic-Practitioner Divide
to Understanding Behavior, Sport Marketing Quarterly, p.126-138.
10. Getz, D. (1989). Special events: Defining the product. Tourism Management,
10(2), p. 135–137.
11. Getz, D. (1991). Festivals, special events, and tourism. Van Nostrand Reinhold,
USA.
12. Getz, D. (2007). Event tourism: definition, evolution, and research. Tourism
Management, 29, p. 403-428.
13. Gratton, C., & Kokolakakis, T. (1997). Economic impact of sport in England
1995. London: The Sports Council.
14. Iso-Ahola, S. E. (1980), The Social Psychology of Leisure and Recreation, p.
230

63
15. Joffre Dumazedier (1960) Current problems of the sociology of leisure.
International Social Science Journal, p. 522-531.
16. Joffre Dumazedier (1974) Leisure and the social system. In J. F.Murphy (ed.)
Concepts of Leisure. Englewood Cliffs, NJ, Prentice-Hall, p 133.
17. Lee, C., 2000. A comparative study of Caucasian and Asian visitors to a cultural
Expo in an Asian setting. Tourism Management, 21(2), pp.169–176
18. Lee, C., Lee, Y. and Wicks, B. E., 2004. Segmentation of festival motivation by
nationality and satisfaction. Tourism Management, 25(1), pp.61–70.
19. Marion Clawson & Jack L. Knetsch (1974) Leisure in modern America. In J. F.
Murphy (ed.) Concepts of Leisure. Englewood Cliffs, NJ, Prentice-Hall, p. 78.
20. Nicholson, R. E. and Pearce, D. G., 2001. Why Do People Attend Events: A
Comparative Analysis of Visitor Motivations at Four South Island Events.
Journal of Travel Research, p.449-460.
21. Nicholson, R., & Pearce, D. G. (2001). Why Do People Attend Events: A
Comparative Analysis of Visitor Motivations at Four South Island Events.
Journal of Travel Research
22. Odabaşı, Y. ve Barış, G. (2002). Tüketici davranışı. İstanbul: Media Cat
Yayınları, 103 (Turkish Source)
23. Rızaoğlu, B. (2012). Turizm davranışı. Ankara: Detay Yayıncılık, 53 (Turkish
Source)
24. Roche, M. (2000). Mega-events and modernity: Olympics and expos in the
growth of global culture. London: Routledge, p. 7
25. Schneider, I. E.; and Backman, S. J., 1996. Cross-cultural equivalence of festival
motivations: A study in Jordan. Festival Management and Event Tourism,
p.139–144.
26. Scott, D., 1996. A comparison of visitors’ motivations to attend three urban
festivals. Festival Management & Event Tourism, 3, p.121–128
27. Shone and Parry (2004), Successful Event Management: A Practical Handbook
2004, p. 4
28. Silvers, J. R. (2004), Professional Event Coordination, p. 34

64
29. Spiller, J. (2002). History of convention tourism. In K. Weber, & K. Chon
(Eds.), Convention tourism: International research and industry perspectives, p.
3–20
30. Sports Business Market Research Handbook (2000–2006). Sports Business
Market Research Inc.
31. Tassiopoulos, D. (2005), Event management: A Professional and Developmental
Approach, p. 4-11
32. URL – 1, www.uk.gotohungary.com/tourism-in-hungary-20152016, access date:
24.11.2016.
33. Uysal, M., Gahan, L. and Martin, B., 1993. An examination of event
motivations: A case study. Festival Management and Event Tourism, p.10
34. Veal. A. J., (2004), Definitions of Leisure and Recreation, University of
Technology Sydney, School of Leisure, Sport and Tourism, Working Paper
No.4, p. 2 - 4
35. Weiler, B., Truong, M. & Griffiths, M. (2004). Visitor Profiles and Motivations
for Visiting an Australian Wine Festival. Paper presented at the International
Wine Tourism Conference. Margaret River, Australia, 2-5 May 2004.
36. Wood, E.H. (2009). Evaluating event marketing: Experience or outcome?,
Journal of Promotion Management, p. 247-268.
37. Yılmaz B. E. (2015), Bireylerin Kültürel Etkinliklere Katılım Motivasyonları:
Mersin Uluslararası Müzik Festivali 2013 Katılımcıları Üzerinde Bir Araştırma,
Mersin Üniversitesi, Sosyal Bilimler Enstitüsü, Turizm İşletmeciliği Anabilim
Dalı Yüksek Lisans Tezi, p.27 (Turkish Source)