Embed Size (px)
Citation preview

A Study on Brand Preference and Customer Satisfaction of Selected Durables
among Post Graduate Students studying in The Maharaja Sayajirao University of
Baroda
Ms. Deepa Bhatia - Assistant Professor and Research Scholar Department of Commerce and Business Management, Faculty of Commerce
The Maharaja Sayajirao University of Baroda, Vadodara, Gujarat India
Dr. Kalpesh D. Naik - Assistant Professor Department of Commerce and Business Management, Faculty of Commerce
The Maharaja Sayajirao University of Baroda, Vadodara, Gujarat India
ABSTRACT
In this research study an attempt has been made to study various aspects of consumer behavior for selected three products viz. laptop,
mobile phone and two wheeler among post graduate and diploma students enrolled in the Faculty of Commerce, in The Maharaja
Sayajirao University of Baroda, Vadodara Gujarat. Primary data was collected through structured questionnaire which was administered
to 100 respondents who owned and used laptop, mobile phone and two wheeler. The purpose of this study was to understand brand
preference, customer satisfaction, factors influencing purchase of selected durables and reasons for preferring selected durables by
respondents. The survey was conducted in Vadodara city in Gujarat. Research design used was descriptive in nature and primary data was
collected from only those students who possessed and used these three durables. The collected primary data was analyzed through
statistical software SPSS. Percentage frequency distribution was used to present the demographic profile of respondents. Descriptive
statistics like mean and standard was used to analyze the data. Chi square test used to test the hypothesis. Factor analysis was conducted
to know most important factor influencing respondents in purchase of durables. The results of the study indicated that, respondents owned
well known brands of durables. Brand name, company image, technology, after sales service and easier availability were the most
important factors considered by respondents while purchasing selected durables.
Keywords: Brand image, Brand Preference, Consumer Behavior, Consumer Durables, Customer Satisfaction.
Mukt Shabd Journal
Volume IX, Issue V, MAY/2020
ISSN NO : 2347-3150
Page No : 3127

1. INTRODUCTION
According to Philip Kotler Marketing is defined as “a social and managerial process, by which individuals and groups
obtain what they need and want through creating and exchanging value with others” (Kotler, 1998, p.9). Customers have
various expectations from the product which they want to purchase and they go through various stages in buying process
before deciding to purchase the product. A customer goes through five stages, when they decide to buy the product (Kotler,
1998, p.192). These five stages are need recognition, information search, evaluation of alternatives, purchase decision and
post purchase behavior. When a customer has a need for a product, he searches for information from advertisements in
television, newspapers, websites etc. There are various brands of products available in the market. So, customer evaluates
various various brands in terms of price, quality, features, style, design and technology and finally selects one best
alternative out of available alternatives in the market. It is very interesting for the marketers to know that how consumers
make purchase decision and why they prefer to purchase a particular brand as compared to similar other brands available in
the market and also their post purchase behaviour.
Consumer Behaviour
Consumer behavior is defined as “the behavior that a consumer displays in searching for purchasing, using, evaluating and
disposing of goods and services that they expect will satisfy their needs and wants.” (Schiffman and Kanuk, 2008). It is very
difficult to understand and predict and understand buying behavior.
Consumer behaviour is a study of how individuals, groups and organizations select, purchase use and dispose of goods and
services, ideas or experiences to satisfy their needs and desires. (Kotler, 1998, p.171).
Marketers study consumer behavior to know how consumers make purchase decisions and how they are influenced to buy
various types of goods. Due to severe competition prevailing in the market, they make choice and select best product out of
available alternatives in the market. The study of consumer behavior helps companies to understand how consumers select
goods and services of their choice and also to understand reasons behind purchase of a particular brand of a product.
A consumer is influenced by various factors viz. cultural, social, personal and psychological.
1) Cultural Factors:
A person's culture influences buying behaviour. Culture is sum Culture consists of sub culture and social class. Subculture
provides more specific identification of buyers. Sub culture consists of nationalities, religions, racial groups and
geographical regions. For example, food habits of north indian family is different as compared to south indian family.
Indian society is divided into three different social classes viz. upper class, middle class and lower class. A person
belonging to a particular social classes will have different product and brand preferences compared to a person of another
social class.
2) Social Factors
Buying behaviour is influenced by social factors like reference groups, family and role and status. A person's reference
groups consists of all those groups that have a direct or indirect influence on a person's behaviour. Reference groups may
affect a person's product decision and brand choice in many product categories. A study on involvement of husband and
wife in decision making in family was conducted for purchasing a house, which found out that, sex role play and important
role in decision making in families. [1]
3) Personal Factors:
Consumer behaviour is influenced by personal factors like age, occupation, income, life style and personality. A buyer has
different requirements in different age groups. Consumption pattern also changes when a person passes from one stage of
his life cycle to another stage. Occupation influences buying behaviour. Product choice is influenced by income of a person
and their attitude towards spending and saving. Lifestyle is defined “a person's pattern of living in the world as expressed in
the person's activities, interests and opinions."(Kotler, 1998, p.180). Personality types are studied by marketers to
understand relationship between brand choices and personality types.
4) Psychological Factors:
Buying behaviour is influenced by four psychological factors viz. motivation, perception, learning and beliefs and attitudes.
According to Abraham Maslow's theory of motivation, a person has various needs, and he satisfies his needs in order of
importance or priority. People perceive the same situation differently. Due to this reason each consumer is distinct from
other consumer. Consumers learn about products from past experience with it. A person consumes or buys products only
after learning that the product will satisfy his need.
Mukt Shabd Journal
Volume IX, Issue V, MAY/2020
ISSN NO : 2347-3150
Page No : 3128

Consumer Buying Process
A consumer go through the below mentioned five stages before purchasing any product.
Figure 1. Consumer Buying Decision Process Source: Philip Kotler, Marketing Management, Prentice Hall of India Pvt. Ltd., 1998, New Delhi p.192.
1) Need Recognition:
Consumer buying process starts when customer recognizes a need. A need is a state in which a person feels deprived of
something. Needs are of two types biological and psychological. A need can be aroused by internal or external stimuli.
Marketers study the various types of stimuli that triggers a particular type of need.
2) Information Search:
When a customer, recognizes a need then after he collects information about product, price, brand related to his need.
Information can be collected from various sources like personal, commercial, public and experiential sources. A consumer
receives most of the information from commercial sources i.e. advertisements in television, newspapers and magazines.
3) Evaluation of Alternatives:
After collecting information about products and brands, a consumer will then evaluate various brands on the basis of
benefits and utility that the product will provide him. Then the buyer will consider to buy the products that best suits his
needs.
4) Purchase Decision:
The consumer then makes decision to purchase the product. His purchase decision is influenced by two factors viz. attitude
of others, and unanticipated situational factors.
5) Post purchase Behaviour:
After purchasing the product, the consumer will experience some level of satisfaction or dissatisfaction from the product.
Marketers also try to find out the reason why the consumer is dissatisfied from the product. Buyer's satisfaction is the
function of the closeness between the buyer's product expectations and the product's perceived performance. If the product's
performance is less than expectations, the customer is dissatisfied. If the performance meets expectations, the customer is
happy. If performance exceeds expectations, then the customer is delighted. If customer is happy then, he can make repeat
purchases in future. Customer satisfaction is defined as "a person's feelings of pleasure or disappointment resulting from
comparing a product's perceived performance in relation to his or her expectations." (Kotler, 1998, p.40).
Concept of Branding
According to American Marketing Association, brand is defined as “a name, term, sign, symbol or combination of them,
intended to identify goods and services of one seller and to distinguish them from those of others.” (Kotler, 1998, p.443)
A brand is thus a product or service whose dimensions differentiate it in some way from other products or services designed
to satisfy same need. These differences may be functional, rational or tangible. (Kotler and Keller, Koshy & Jha, p. 261-
262).
Need Recognition
Information Search
Evaluation of Alternatives
Purchase Decision
Post Purchase Behaviour
Mukt Shabd Journal
Volume IX, Issue V, MAY/2020
ISSN NO : 2347-3150
Page No : 3129
Evolution of Brands
The world 'brand' is derived from old norse word 'brandr' which means to burn. (Harsh Varma, p.31). In earlier times, the
farmers used to burn a mark or a symbol on the animals to identify their livestock. This is practiced even today. Branding
was a practice, in which humans were stamped with hot iron to identify wrongdoers and also hot iron was used for
identification of animals. (Kirti Dutta, p.6)
Branding is practiced since the beginning of human civilization. Business was done during the time of Indus valley
civilization, around 2250 to 2000 BC. During those times, craftsmen used to put a mark on their products with seals and
then sold to merchants. These seals were used to identify the supplier of the products. These seals were the 'earliest known
examples of branding. These seals also provided information about the quality, origin and function of the brand. (Kirti
Dutta, p.5)
The earlier signs of branding were seen during medieval period when craftsmen used to put a trademark on their products to
protect themselves, to identify their products and to protect consumers against inferior quality products. Today, hardly we
see any unbranded products in the market. (Kotler, 1998, p.445)
Brand Preference
Brand Preference is the degree to which consumers prefer one brand over another [2]. In short preference means desirability
or choice among alternatives [3]. Brand Preference is choice of a particular company's product among other companies'
products available in the market. Brand preference represents that which brand is most preferred by consumers. Brand
preference is defined as “desire to use a particular product or service even when there are equally priced and equally
available alternatives [4].
Scope of the Study
This study had selected three durables to understand consumer buying behavior of selected post graduate and diploma
students studying in the Maharaja Sayajirao University of Baroda, Vadodara. These durables are Laptop, mobile phone and
two wheeler. Only those students were included in the sample who owned and used these three durables. The study has
selected these three durables because, it is very common among college going students. Students use laptop for their
educational purpose. This study has selected only one University and in that only post graduate and diploma students of
only commerce faculty were selected to do the survey.
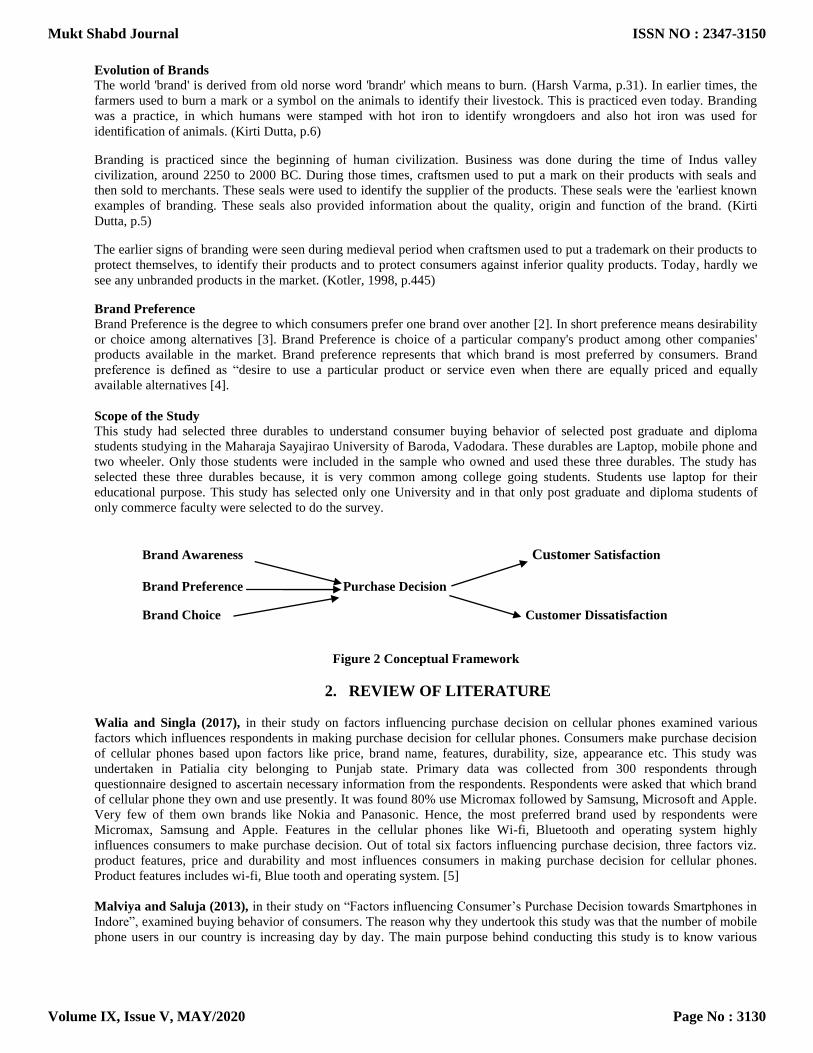
Brand Awareness Customer Satisfaction
Brand Preference Purchase Decision
Brand Choice Customer Dissatisfaction
Figure 2 Conceptual Framework
2. REVIEW OF LITERATURE
Walia and Singla (2017), in their study on factors influencing purchase decision on cellular phones examined various
factors which influences respondents in making purchase decision for cellular phones. Consumers make purchase decision
of cellular phones based upon factors like price, brand name, features, durability, size, appearance etc. This study was
undertaken in Patialia city belonging to Punjab state. Primary data was collected from 300 respondents through
questionnaire designed to ascertain necessary information from the respondents. Respondents were asked that which brand
of cellular phone they own and use presently. It was found 80% use Micromax followed by Samsung, Microsoft and Apple.
Very few of them own brands like Nokia and Panasonic. Hence, the most preferred brand used by respondents were
Micromax, Samsung and Apple. Features in the cellular phones like Wi-fi, Bluetooth and operating system highly
influences consumers to make purchase decision. Out of total six factors influencing purchase decision, three factors viz.
product features, price and durability and most influences consumers in making purchase decision for cellular phones.
Product features includes wi-fi, Blue tooth and operating system. [5]
Malviya and Saluja (2013), in their study on “Factors influencing Consumer’s Purchase Decision towards Smartphones in
Indore”, examined buying behavior of consumers. The reason why they undertook this study was that the number of mobile
phone users in our country is increasing day by day. The main purpose behind conducting this study is to know various
Mukt Shabd Journal
Volume IX, Issue V, MAY/2020
ISSN NO : 2347-3150
Page No : 3130

factors motivating consumers to purchase smartphones in Indore. According to a report by a research firm Canalys, India is
the second largest smartphone market in the world after china. The objectives of this research study is to find out the
relationship between four independent and influencing factors viz. price, brand name, features and social influence and
consumer’s purchase decision towards smartphone. Primary data was collected from 250 respondents through convenient
sampling method. As respondents did not filled completely 62 questionnaires, they were excluded from the sample and
sample size was reduced to 188 respondents. Through factor analysis it was found that out of all four factors which are
price, brand name, features and social influence, in influencing respondents for making purchase decision of smartphone,
price is not considered as a major factors in influencing respondents in purchasing smartphone. Hence it is concluded that
consumers in Indore purchase smartphone irrespective of it’s prices. Other features like brand name, technology, social
image and durability are considered by respondents in purchasing a smart phone.[6]
Vijayalakshmi and Manimozy (2015) in their study on brand preference of smartphone users undertaken in Thiruvaurur
district belonging to Tamil Nadu state examined brand preference of smart phone users and also examined factors
influencing brand preference of consumers of smart phones in Thiruvarur city. Primary data was collected through
structured questionnaire which was administered to 150 respondents. The objectives of their study are to know the brand
preference of smart phone, to identify factors influencing purchase of smartphone by respondents to examine satisfaction
level of respondents from the smart phone which they use and to understand the impact of demographic variables on brand
preference of smart phones. Respondents were asked that which brand of smart phone they use currently and it was revealed
that majority i.e. 26% use Samsung, followed by Nokia (19%) and Micromax (17%). Others used brands like HTC and
Sony. The various factors influencing purchase of smart phones by respondents were quality followed by brand image,
service and appearance. Hypothesis was tested to find out significant difference between demographic variables and brand
preference of smart phones. Chi square test was applied to test the hypothesis and null hypothesis was not rejected and it is
concluded that demographic variables like age and income does not affect the purchase decision regarding brand of smart
phone used by respondents. [7]
Saranya an Yoganandan (2019) undertook a study on brand preference of smart phones among college going students in
Coimbatore city. They carried out this study because the demand for smart phone is going on increasing among students and
they use smart phone for calling, internet and for their educational purposes. Hence, smart phone is very useful for students.
The respondents were students studying in Arts and Science colleges in Coimbatore. Sample of size 100 was selected
through non probability convenience sampling method from five different colleges. Hypothesis was framed to test the
association between demographic factors and brand preference of smart phones among these students. Anova test was
applied to test the hypothesis and no significant differences was found between age and education on brand preference of
smart phones. Significant differences were found among brand appearance and repurchase intention with respect to age and
education of respondents. [8]
Brahmbhatt and Acharya (2015), in their study on different factors influencing consumer’s pre purchase buying behavior
towards Laptop, examined laptop buying behavior among 232 respondents belonging to Ahemadabad city and Gandhinagar
city of Gujarat region. Laptops of use by people of all age groups and by both males and females. The objectives of their
study was to examine factors influencing buying behavior of consumers towards branded laptops. Respondents were given a
list of 16 factors and they were asked to give their opinion on a five point rating scale to know which factors were most
important for them in purchasing laptop. Out of sixteen factors, through factor analysis, it was found that four factors
influence laptop purchase decision by respondents. These four factors are technical specifications, design, purchase
convenience and affordability. [9]
Afrin at. el. (2015), conducted a study entitled “Impact of the Influential factors on Laptop Buying Decision: A Study of
Students of Bangladesh”, examined factors affecting students’ buying decision towards Laptop. The objectives of their
study were to find out most influencing factor considered by students before purchasing Laptop, to examine current laptop
brands used by students and to find out relationship between factors influencing purchase of laptop by students and buying
decision making of laptop. To conduct this study 100 respondents were selected from college through convenience sampling
method. Respondents own popular brands of laptop. They possessed various brands like apple (19%), samsung (18%), Asus
(16%), Dell (9%) and Acer (8%) and remaining others owned Compaq, Toshiba, HP and Lenovo. Further, it was found out
that the most influential factor considered by respondents while purchasing laptop was physical features. Further, regression
analysis was used to find out relationship between factors influencing purchase of laptop and buying decision of laptop.
Significant relationship was found between various factors like price, technical feature, physical feature, quality, brand
image and buying decision of laptop. [10]
S. Namasivayam et. al. (2016) undertook a study entitled “A Study on Brand awareness and consumer buying behavior
towards laptops with reference to Coimbatore City”, examined buying behavior of respondents in Coimbatore city. The
main objectives of their study are to find out brand awareness of laptops among respondents, to identify various factors
Mukt Shabd Journal
Volume IX, Issue V, MAY/2020
ISSN NO : 2347-3150
Page No : 3131

influencing purchase of laptops by respondents and to find out satisfaction level of respondents towards laptops used by
them. Primary data was collected from 250 respondents residing in various areas of Coimbatore city. All respondents own
Laptops and all of them were aware of various brands of laptops available in the market. Respondents own well-known
brands of Laptops like Dell (32%), Acer (15%), HP (11%) and remaining others own Lenovo, Sony and Toshiba. 82% of
respondents prefer purchasing Laptop from showroom, 21% agreed that they prefer to purchase to do online shopping for
laptop, while 79% said that, they don’t prefer purchasing laptop online. Respondents were asked that out of various factors,
which factor is most influential during purchase of laptop. They were asked to give ranks to various factors which most
influenced them to purchase laptop, to which they assigned 1st rank to latest technology, 2nd rank to reasonable price and 3rd
rank to warranty and service. Respondents were satisfied with software support, display and battery life of laptop which
they currently use. [11]
Riya Malla (2016), in her study on factors affecting brand preference of scooters among women consumers in Kathmandu
conducted a survey among 200 female users of Scooters to identify and analyze brand preference, factors influencing and
customer satisfaction from use of two wheeler scooters among female users. This study was conducted in Kathmandu as
large number of women drive scooters in this city. 200 respondents were selected from population through convenient
sampling method which consisted of only females. These females were students, housewives, government employees,
business person and unemployed females and are above 16 years of age and belonging to different age groups, income
groups, educational groups and occupation. From data analysis, it was found that 56.5% own Honda, 8% own Hero scooter,
8.5% own Mahindra and others own Yamaha, TVS and Suzuki. Hence, it can be said that the most preferred brand of
scooter by females were Honda, Hero and Mahindra. The reasons for choosing their preferred brand of scooter was design
(57%), comfort (53%) and durability (47%). Price does not play any role in selecting brand of scooter by respondents. A
significant but weak relationship was found between brand preference of scooters and all independent factors like price,
mileage, colour, comfort, design and durability of scooters. No significant relationship was found between demographic
variables like age, occupation, education, income and brand preference of scooters among female respondents. The main
factors influencing purchase of two wheeler is comfort followed by mileage and design. [12]
Padmasani et. al. (2014) undertook a study on brand preference towards scooters among women consumers in Coimbatore
City.” Automobile manufactures realized the demand for two wheeler among females, and due to demand of two wheelers
among females, they have brought in the market two wheelers which is gearless, less in weight and easier for females to
ride. Various models of two are available like TVS Scooty, Vespa, Jupiter, Access, Activa etc. Brand preference means
consumers favour and would like to purchase a particular brand even though other brands are available in the market. The
objectives of this study is to examine brand preference of scooters and to examine factors influencing purchase of scooters
among women in Coimbatore city. A sample of 235 respondents was selected from population through random sampling
method. Only those female respondents were included in the sample who own and drive two wheeler regularly. It was found
that out of 18 factors, the most important factor influencing the brand preference of scooter was comfort, efficiency,
affordability, familiarity and service quality. Hypothesis was framed to test the significant difference between demographic
factors of respondents and factors influencing brand preference of scooters. Anova test was used to test this hypothesis. It
was found that age group has influence on affordability, occupation has a significant influence on comfort, efficiency,
affordability and familiarity and education of women has a significant influence on comfort, efficiency, affordability and
quality. Hence it can be concluded that women prefer to purchase scooters which are affordable, provide good service
quality provide comfort and is familiar among their groups. [13]
Mohammed Akbar Ali Khan and Datrika Venkata Madhusudan Rao (2018), undertook a study entitled “Two
wheeler’s behavior towards Customer Satisfaction” in Hyderabad. According to a Report on Automobiles published by
India Brand Equity Foundation, Feb.2019, India is the 2nd largest two wheeler market in the world. In Automobile Industry,
two wheeler market is the largest market in India which consists of 81% of total Auto Industry. It consists of electric two
wheelers, mopeds, motor vehicles and scooters. Two wheeler market in India is dominated by Honda, Bajaj, Hero and TVS.
A sample of 600 users of two wheelers were selected from various areas of Hyderabad through random sampling method.
This study was conducted on only four brands of two wheelers viz. Hero, Bajaj, Honda and TVS and only those consumers
were included who owned either of these four brands of two wheelers. This study did not include consumers who own other
than these four brands of two wheelers. The objectives of their study is to examine the impact of demographic variables
independent variables on customer satisfaction. It was observed that there was no influence of independent variables like
safety, features, technology and brand on customer satisfaction of respondents. Second hypothesis tested was influence of
demographic variables on customer satisfaction. It was found that gender, age, education, occupation, marital status and
economical status has no impact on customer satisfaction of respondents. [14]
Mukt Shabd Journal
Volume IX, Issue V, MAY/2020
ISSN NO : 2347-3150
Page No : 3132

3. RESEARCH METHODOLOGY
Objectives of the study
1) To study the brand preference of selected durables among postgraduate and diploma students studying in M.S.
University, Baroda.
2) To identify factors influencing purchase of selected durables among post graduate students.
3) To examine reasons for purchasing and using selected durables by students.
4) To measure satisfaction level of students from selected durables which they own and use.
Hypotheses
Ho1: There is no significant relationship between monthly income and expenditure on purchase of selected durables by
respondents.
Ho2: There is no significant relationship between gender, income, course enrolled and type of family of respondents and
brands of selected durables possessed by them.
Ho3: There is no significant association between satisfaction level and brands of durables possessed by respondents.
Ho4: The ranks assigned by respondents to reasons for using selected durables on selected criteria do not differ.
Research Design
Descriptive research design was used in this study.
Sources of Data
Secondary Data
Various journals were referred for framing review of literature and various books on marketing and consumer behavior were
also referred. Latest information about durables were collected from consumer durable reports, which were available online.
Primary Data
A structured non-disguised questionnaire was framed to ascertain relevant information from the respondents.
Sampling Decisions
Population
Population consists all students enrolled in post graduate and diploma courses offered by faculty of commerce, The
Maharaja Sayajirao University of Baroda.
Sampling Frame
Post graduate and Diploma students enrolled in faculty of commerce and only those students who own and use all these
three durables.
Sampling Unit
A student of Faculty of Commerce, enrolled in post graduate or diploma course who is use all three durables and is
regularly attending classes.
Sample Size
Sample size consists of 100 students.
Sampling Method
Non-probability convenience sampling method was used to select sample from the population.
Statistical tools used in the study
The collected data was coded in MS Excel and SPSS software version 20 was used to analyze the data. Descriptive
statistics, Chi –square test, friedman’s test and factor analysis was carried out to analyze the data.
Mukt Shabd Journal
Volume IX, Issue V, MAY/2020
ISSN NO : 2347-3150
Page No : 3133
4. DATA ANALYSIS AND INTREPRETATIONS
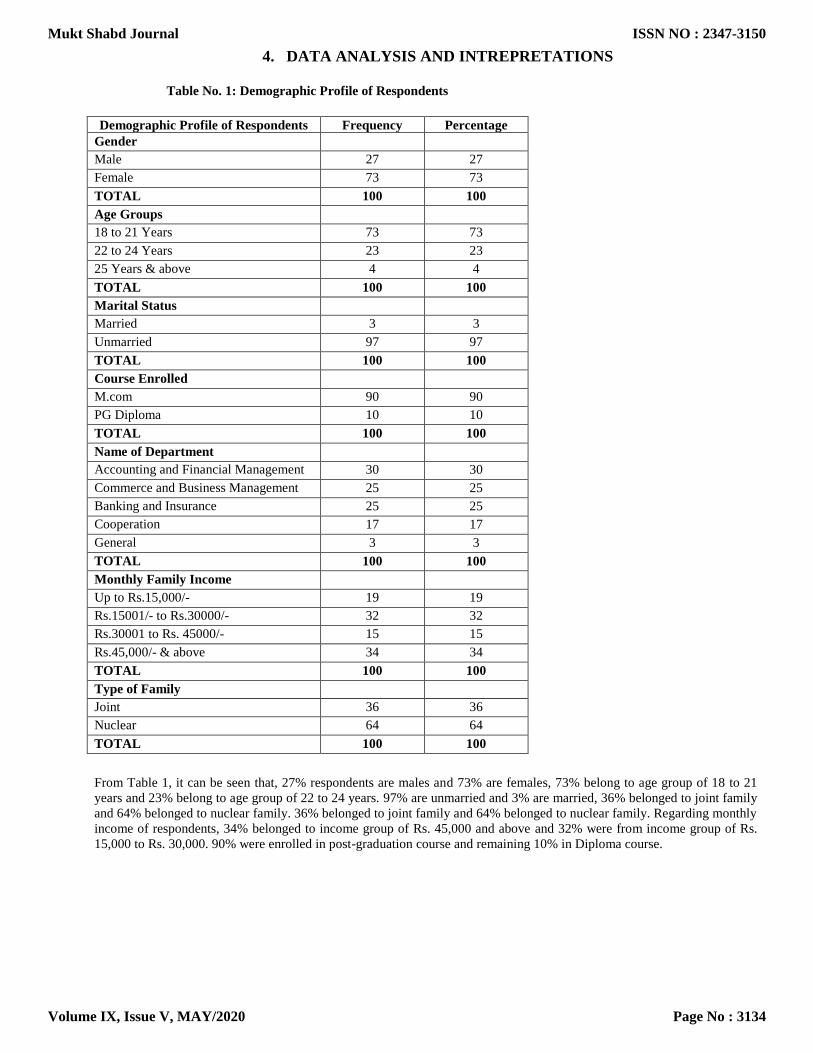
Table No. 1: Demographic Profile of Respondents
Demographic Profile of Respondents Frequency Percentage
Gender
Male 27 27
Female 73 73
TOTAL 100 100
Age Groups
18 to 21 Years 73 73
22 to 24 Years 23 23
25 Years & above 4 4
TOTAL 100 100
Marital Status
Married 3 3
Unmarried 97 97
TOTAL 100 100
Course Enrolled
M.com 90 90
PG Diploma 10 10
TOTAL 100 100
Name of Department
Accounting and Financial Management 30 30
Commerce and Business Management 25 25
Banking and Insurance 25 25
Cooperation 17 17
General 3 3
TOTAL 100 100
Monthly Family Income
Up to Rs.15,000/- 19 19
Rs.15001/- to Rs.30000/- 32 32
Rs.30001 to Rs. 45000/- 15 15
Rs.45,000/- & above 34 34
TOTAL 100 100
Type of Family
Joint 36 36
Nuclear 64 64
TOTAL 100 100
From Table 1, it can be seen that, 27% respondents are males and 73% are females, 73% belong to age group of 18 to 21
years and 23% belong to age group of 22 to 24 years. 97% are unmarried and 3% are married, 36% belonged to joint family
and 64% belonged to nuclear family. 36% belonged to joint family and 64% belonged to nuclear family. Regarding monthly
income of respondents, 34% belonged to income group of Rs. 45,000 and above and 32% were from income group of Rs.
15,000 to Rs. 30,000. 90% were enrolled in post-graduation course and remaining 10% in Diploma course.
Mukt Shabd Journal
Volume IX, Issue V, MAY/2020
ISSN NO : 2347-3150
Page No : 3134

Table No. 2: Brand Preference of Selected Durables possessed by Respondents
Mobile Phone Laptop Two Wheeler
Frequency Percentage Frequency Percentage Frequency Percentage
Nokia 2 2 Dell 25 25 Jupiter 9 9
Samsung 30 30 Acer 9 9 Access 12 12
Apple 4 4 Lenovo 31 31 Activa 48 48
Vivo 13 13 HP 22 22 Honda Bike 7 7
Oneplus6 7 7 Sony 5 5 Royal Enfield 1 1
Redmi 18 18 Toshiba 0 0 TVS 5 5
Redpro 1 1 Compaq 0 0 Suzuki 0 0
Sony 0 0 HCL 0 0 Hero 11 11
Micromax 2 2 Asus 4 4 Yamaha 2 2
HTC 2 2 Apple 4 4 Bajaj 2 2
Oppo 9 9 Samsung 0 0 Vespa 2 2
Others 12 12 Others 0 0 Others 1 1
TOTAL 100 100 TOTAL 100 100 TOTAL 100 100
Table 2 indicates the brand preference of laptop, mobile phone and two wheeler currently owned and used by respondents.
It can be seen that the most popular brand of mobile phone is Samsung (30%), followed by Redmi (18%) and Vivo (13%).
Remaining others use brands like one plus 6, HTC, apple and Nokia. With respect to laptop brand most of the respondents
use Lenovo (31%) followed by Dell (25%) and HP (22%). Regarding two wheeler brand, the most popular brand among
respondents is Activa (48%) followed by Access (12%) and Hero (11%) while others use two wheeler brands like Jupiter,
Yamaha and Bajaj.
Table No. 3: Amount Spent in Purchase of Selected Durables
Mobile Phone Laptop Two Wheeler
Amount Spent
(In Rupees)
Freq
uency
Percen
tage
Amount Spent
(In Rupees)
Freq
uency
Perce
ntage
Amount Spent
(In Rupees)
Freq
uency
Percen
tage
Up to 10000 34 34 Up to 20000 2 2 Up to 30000 4 4
10000 to 25000 60 60 20000 to 40000 44 44 30000 to 50000 11 11
25000 to 50000 5 5 40000 to 60000 46 46 50000 to 70000 73 73
50000 & above 1 1 60000 & above 8 8 70000 & above 12 12
TOTAL 100 100 TOTAL 100 100 TOTAL 100 100
As per table 3, 60% respondents spent Rs.10000/- to Rs.25,000/- in purchase of mobile phones. This indicates that they own
mobile phone which is of reasonable price, and is not very costly. 46% had purchased laptop within price range of Rs.
40,000/- to Rs. 60,000/- and 44% purchased within price range of Rs. 20000/- to Rs. 40000/-. 73% had purchased two
wheeler within Rs.50000/- to Rs.70000/-.
Table No. 4: Place of Purchase of these Durables
Place of Purchase Mobile Phone Laptop Two Wheeler
Frequency Percentage Freque
ncy
Percenta
ge
Frequency Percentage
Online 44 44 18 18 0 0
Authorized Dealer 24 24 38 38 46 46
Shopping Mall 7 7 9 9 1 1
Appliances Showroom 25 25 35 35 53 53
TOTAL 100 100 100 100 100 100
Mukt Shabd Journal
Volume IX, Issue V, MAY/2020
ISSN NO : 2347-3150
Page No : 3135
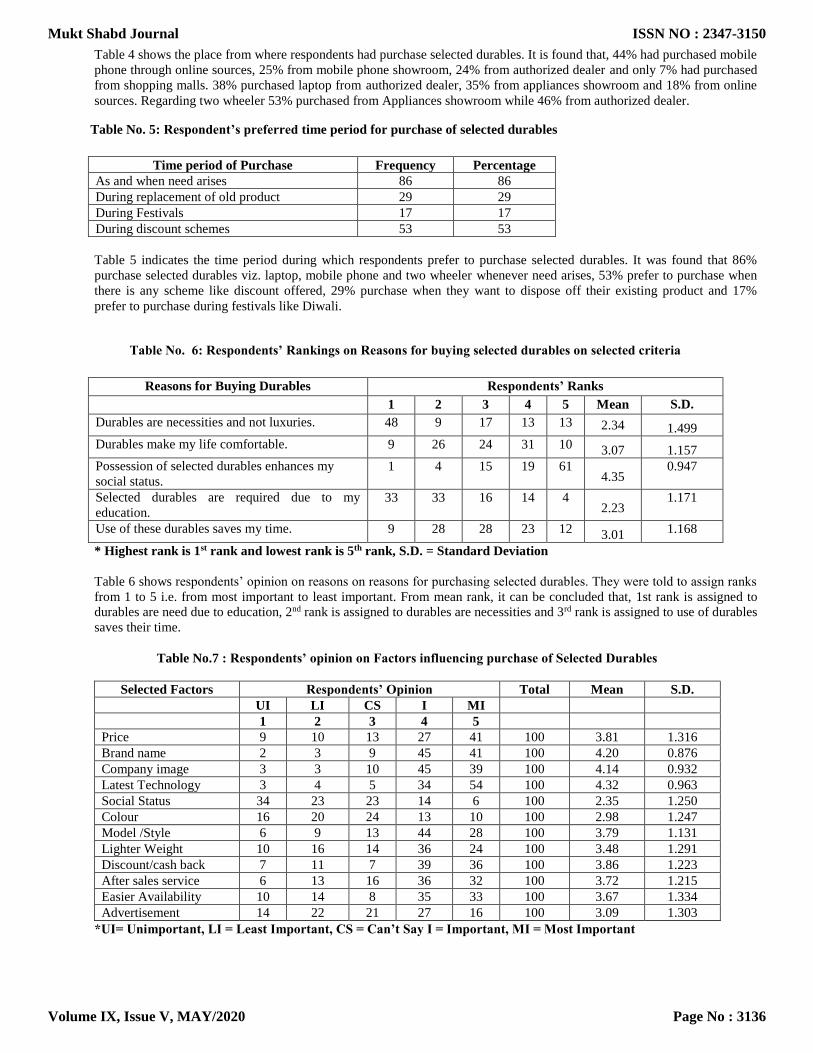
Table 4 shows the place from where respondents had purchase selected durables. It is found that, 44% had purchased mobile
phone through online sources, 25% from mobile phone showroom, 24% from authorized dealer and only 7% had purchased
from shopping malls. 38% purchased laptop from authorized dealer, 35% from appliances showroom and 18% from online sources. Regarding two wheeler 53% purchased from Appliances showroom while 46% from authorized dealer.
Table No. 5: Respondent’s preferred time period for purchase of selected durables
Time period of Purchase Frequency Percentage
As and when need arises 86 86
During replacement of old product 29 29
During Festivals 17 17
During discount schemes 53 53
Table 5 indicates the time period during which respondents prefer to purchase selected durables. It was found that 86%
purchase selected durables viz. laptop, mobile phone and two wheeler whenever need arises, 53% prefer to purchase when
there is any scheme like discount offered, 29% purchase when they want to dispose off their existing product and 17%
prefer to purchase during festivals like Diwali.
Table No. 6: Respondents’ Rankings on Reasons for buying selected durables on selected criteria
Reasons for Buying Durables Respondents’ Ranks
1 2 3 4 5 Mean S.D.
Durables are necessities and not luxuries. 48 9 17 13 13 2.34 1.499
Durables make my life comfortable. 9 26 24 31 10 3.07 1.157
Possession of selected durables enhances my
social status.
1 4 15 19 61 4.35
0.947
Selected durables are required due to my
education.
33 33 16 14 4 2.23
1.171
Use of these durables saves my time. 9 28 28 23 12 3.01 1.168
* Highest rank is 1st rank and lowest rank is 5th rank, S.D. = Standard Deviation
Table 6 shows respondents’ opinion on reasons on reasons for purchasing selected durables. They were told to assign ranks
from 1 to 5 i.e. from most important to least important. From mean rank, it can be concluded that, 1st rank is assigned to
durables are need due to education, 2nd rank is assigned to durables are necessities and 3rd rank is assigned to use of durables
saves their time.
Table No.7 : Respondents’ opinion on Factors influencing purchase of Selected Durables
Selected Factors Respondents’ Opinion Total Mean S.D.
UI LI CS I MI
1 2 3 4 5
Price 9 10 13 27 41 100 3.81 1.316
Brand name 2 3 9 45 41 100 4.20 0.876
Company image 3 3 10 45 39 100 4.14 0.932
Latest Technology 3 4 5 34 54 100 4.32 0.963
Social Status 34 23 23 14 6 100 2.35 1.250
Colour 16 20 24 13 10 100 2.98 1.247
Model /Style 6 9 13 44 28 100 3.79 1.131
Lighter Weight 10 16 14 36 24 100 3.48 1.291
Discount/cash back 7 11 7 39 36 100 3.86 1.223
After sales service 6 13 16 36 32 100 3.72 1.215
Easier Availability 10 14 8 35 33 100 3.67 1.334
Advertisement 14 22 21 27 16 100 3.09 1.303
*UI= Unimportant, LI = Least Important, CS = Can’t Say I = Important, MI = Most Important
Mukt Shabd Journal
Volume IX, Issue V, MAY/2020
ISSN NO : 2347-3150
Page No : 3136
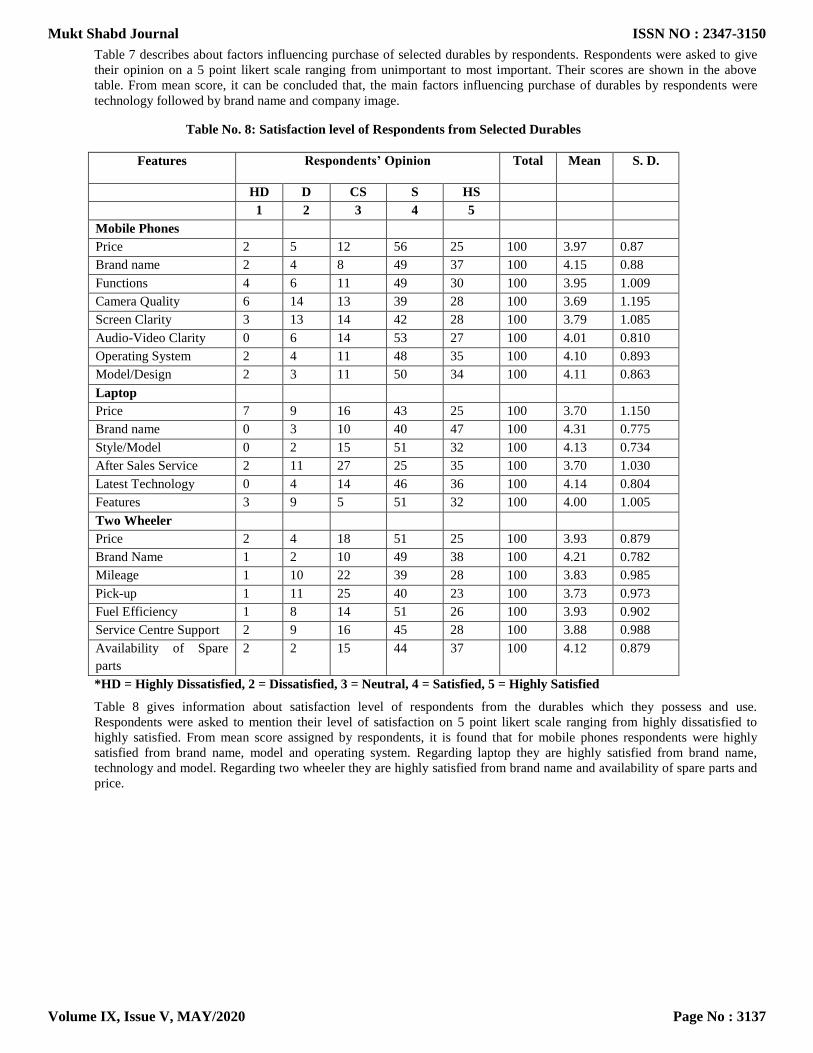
Table 7 describes about factors influencing purchase of selected durables by respondents. Respondents were asked to give
their opinion on a 5 point likert scale ranging from unimportant to most important. Their scores are shown in the above
table. From mean score, it can be concluded that, the main factors influencing purchase of durables by respondents were
technology followed by brand name and company image.
Table No. 8: Satisfaction level of Respondents from Selected Durables
Features Respondents’ Opinion Total Mean
S. D.
HD D CS S HS
1 2 3 4 5
Mobile Phones
Price 2 5 12 56 25 100 3.97 0.87
Brand name 2 4 8 49 37 100 4.15 0.88
Functions 4 6 11 49 30 100 3.95 1.009
Camera Quality 6 14 13 39 28 100 3.69 1.195
Screen Clarity 3 13 14 42 28 100 3.79 1.085
Audio-Video Clarity 0 6 14 53 27 100 4.01 0.810
Operating System 2 4 11 48 35 100 4.10 0.893
Model/Design 2 3 11 50 34 100 4.11 0.863
Laptop
Price 7 9 16 43 25 100 3.70 1.150
Brand name 0 3 10 40 47 100 4.31 0.775
Style/Model 0 2 15 51 32 100 4.13 0.734
After Sales Service 2 11 27 25 35 100 3.70 1.030
Latest Technology 0 4 14 46 36 100 4.14 0.804
Features 3 9 5 51 32 100 4.00 1.005
Two Wheeler
Price 2 4 18 51 25 100 3.93 0.879
Brand Name 1 2 10 49 38 100 4.21 0.782
Mileage 1 10 22 39 28 100 3.83 0.985
Pick-up 1 11 25 40 23 100 3.73 0.973
Fuel Efficiency 1 8 14 51 26 100 3.93 0.902
Service Centre Support 2 9 16 45 28 100 3.88 0.988
Availability of Spare
parts
2 2 15 44 37 100 4.12 0.879
*HD = Highly Dissatisfied, 2 = Dissatisfied, 3 = Neutral, 4 = Satisfied, 5 = Highly Satisfied
Table 8 gives information about satisfaction level of respondents from the durables which they possess and use.
Respondents were asked to mention their level of satisfaction on 5 point likert scale ranging from highly dissatisfied to
highly satisfied. From mean score assigned by respondents, it is found that for mobile phones respondents were highly
satisfied from brand name, model and operating system. Regarding laptop they are highly satisfied from brand name,
technology and model. Regarding two wheeler they are highly satisfied from brand name and availability of spare parts and
price.
Mukt Shabd Journal
Volume IX, Issue V, MAY/2020
ISSN NO : 2347-3150
Page No : 3137

Table No. 9: Reliability Score for Scale Items
Variables Cronbach’s Alpha Number of Items
Factors influencing purchase of selected durables by
Respondents
0.772 12
Satisfaction level from Mobile Phones 0.78 8
Satisfaction level from Laptop 0.69 6
Satisfaction level from Two Wheeler 0.68 7
Table 9 shows cronbach’s alpha’s value which are greater than 0.6. Hence, the data is considered as reliable.
Table No. 10: Testing of Hypothesis and Results of Chi Square Tests for Selected Durables
Hypothesis C.V of
Chi
Square
p-value d.f. Result
1) Influence of monthly family income on expenditure done on purchase of selected
durables possessed by respondents.
Ho1 There is no significant influence of monthly family income of the respondents on
expenditure incurred in purchase of mobile Phone.
16.957 .049 9 Rejected
Ho2 There is no significant influence of monthly family income of the respondents on
expenditure incurred in purchase of Laptop.
3.63 0.934 9 Accepted
Ho3 There is no significant influence of monthly family income of the respondents on
expenditure incurred in purchase of two wheeler
4.914 0.842 9 Accepted
2) Influence of demographic variables on mobile phone brands possessed by
respondents.
Ho4 There is no significant relationship between mobile phone brands possessed by
respondents and their gender.
15.422 0.117 10 Accepted
Ho5 There is no significant relationship between mobile phone brands possessed by
respondents and course in which they are enrolled.
20.741 0.023 10 Rejected
Ho6 There is no significant relationship between mobile phone brands possessed by
respondents an various groups of monthly family income.
40.907 0.088 30 Accepted
Ho7. There is no significant relationship between mobile phone brands possessed by
respondents and type of family to which they belong.
13.519 0.196 10 Accepted
3) Influence of demographic variables on Laptop brands possessed by respondents.
Ho8 There is no significant relationship between Laptop brands possessed by
respondents and their gender.
11.761 0.068 6 Accepted
Ho9 There is no significant relationship between Laptop brands possessed by
respondents and course in which they are enrolled.
7.963 0.241 6 Accepted
Ho10 There is no significant relationship between Laptop brands possessed by
respondents and various groups of monthly family income.
10.393 0.918 18 Accepted
Ho11 There is no significant relationship between Laptop brands possessed by
respondents and type of family to which they belong.
2.366 0.883 6 Accepted
4) Influence of demographic variables on two wheeler brands possessed by
Respondents.
Ho12 There is no significant relationship between two wheeler brands possessed by
respondents and their gender.
28.660 0.001 10 Rejected
Ho13 There is no significant relationship between two wheeler brands possessed by
respondents and course in which they are enrolled.
3.755 0.958 10 Accepted
Ho14 There is no significant relationship between two wheeler brands possessed by
respondents and various groups of monthly family income.
50.201 0.012 30 Rejected
Ho15 There is no significant relationship between two wheeler brands possessed by
respondents and type of family to which they belong.
6.359 0.784 10 Accepted
*Sig. Level is 0.05, d.f. = degrees of freedom, C.V. = Calculated Value of Chi-Square
In table 10, chi square test is used to test the hypothesis and to find out significant association between demographic
Mukt Shabd Journal
Volume IX, Issue V, MAY/2020
ISSN NO : 2347-3150
Page No : 3138
variables of the respondents and durable brands possessed by them. Hypothesis 1 states that there is association between
income of the respondents and amount spent in purchasing mobile phone. Higher the income of respondents, more amount
they spent on mobile phone. Significant relationships was not found between durable brands possessed by respondents and
their gender, income and type of family. Significant relationships was found between gender and two wheeler brands
possessed by respondents. This is because bikes like splender and Hero are meant for males and active, access are meant for
females. Also, income influences the purchase of two wheeler brand.
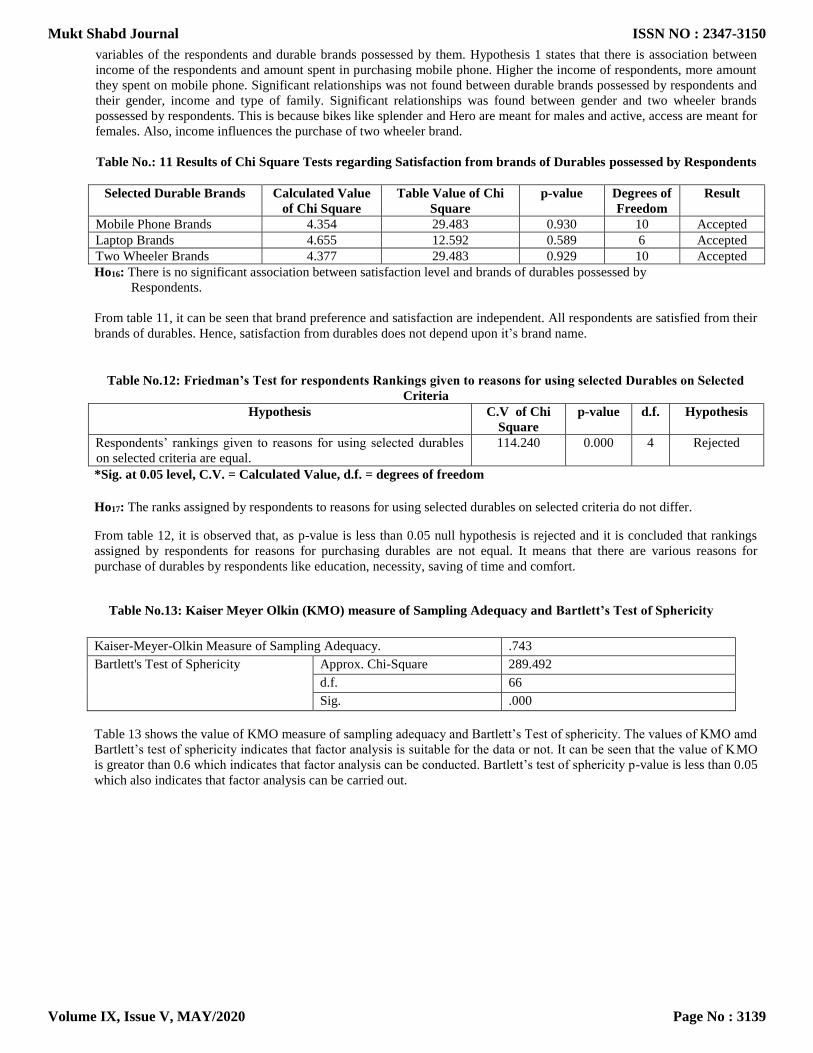
Table No.: 11 Results of Chi Square Tests regarding Satisfaction from brands of Durables possessed by Respondents
Selected Durable Brands Calculated Value
of Chi Square
Table Value of Chi
Square
p-value Degrees of
Freedom
Result
Mobile Phone Brands 4.354 29.483 0.930 10 Accepted
Laptop Brands 4.655 12.592 0.589 6 Accepted
Two Wheeler Brands 4.377 29.483 0.929 10 Accepted
Ho16: There is no significant association between satisfaction level and brands of durables possessed by
Respondents.
From table 11, it can be seen that brand preference and satisfaction are independent. All respondents are satisfied from their
brands of durables. Hence, satisfaction from durables does not depend upon it’s brand name.
Table No.12: Friedman’s Test for respondents Rankings given to reasons for using selected Durables on Selected
Criteria
Hypothesis C.V of Chi
Square
p-value d.f. Hypothesis
Respondents’ rankings given to reasons for using selected durables
on selected criteria are equal.
114.240 0.000 4 Rejected
*Sig. at 0.05 level, C.V. = Calculated Value, d.f. = degrees of freedom
Ho17: The ranks assigned by respondents to reasons for using selected durables on selected criteria do not differ.
From table 12, it is observed that, as p-value is less than 0.05 null hypothesis is rejected and it is concluded that rankings
assigned by respondents for reasons for purchasing durables are not equal. It means that there are various reasons for
purchase of durables by respondents like education, necessity, saving of time and comfort.
Table No.13: Kaiser Meyer Olkin (KMO) measure of Sampling Adequacy and Bartlett’s Test of Sphericity
Kaiser-Meyer-Olkin Measure of Sampling Adequacy. .743
Bartlett's Test of Sphericity Approx. Chi-Square 289.492
d.f. 66
Sig. .000
Table 13 shows the value of KMO measure of sampling adequacy and Bartlett’s Test of sphericity. The values of KMO amd
Bartlett’s test of sphericity indicates that factor analysis is suitable for the data or not. It can be seen that the value of KMO
is greator than 0.6 which indicates that factor analysis can be conducted. Bartlett’s test of sphericity p-value is less than 0.05
which also indicates that factor analysis can be carried out.
Mukt Shabd Journal
Volume IX, Issue V, MAY/2020
ISSN NO : 2347-3150
Page No : 3139
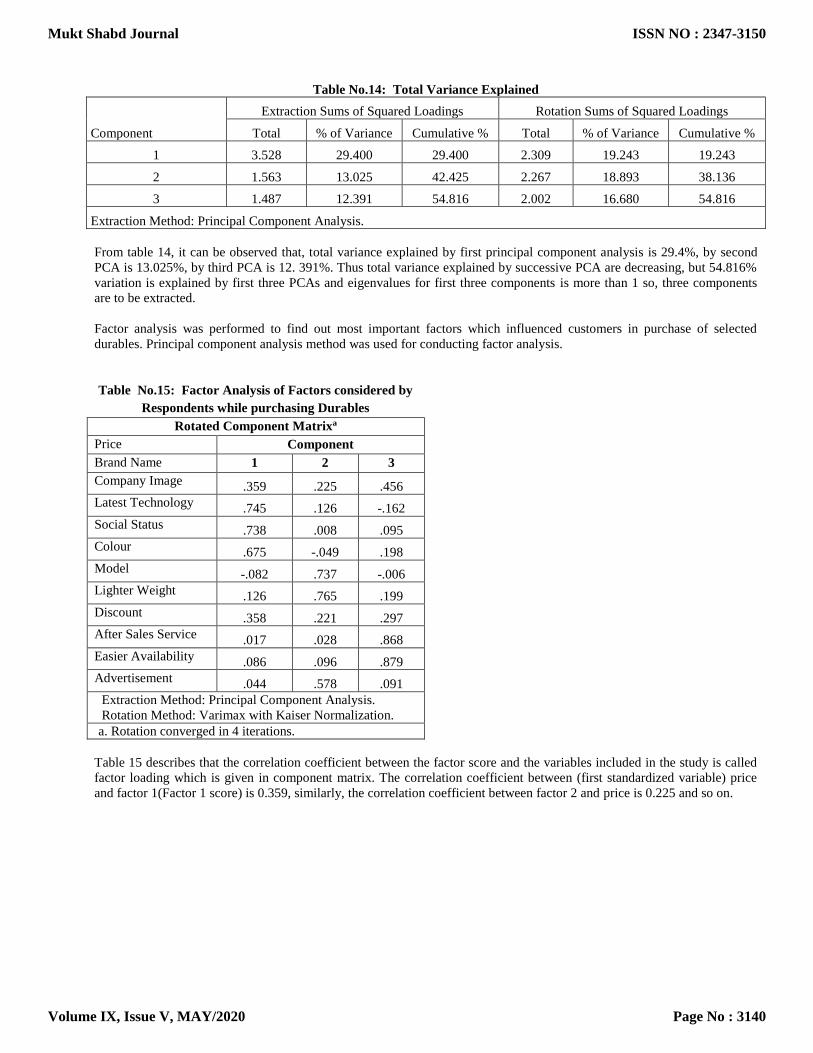
Table No.14: Total Variance Explained
Component
Extraction Sums of Squared Loadings Rotation Sums of Squared Loadings
Total % of Variance Cumulative % Total % of Variance Cumulative %
1 3.528 29.400 29.400 2.309 19.243 19.243
2 1.563 13.025 42.425 2.267 18.893 38.136
3 1.487 12.391 54.816 2.002 16.680 54.816
Extraction Method: Principal Component Analysis.
From table 14, it can be observed that, total variance explained by first principal component analysis is 29.4%, by second
PCA is 13.025%, by third PCA is 12. 391%. Thus total variance explained by successive PCA are decreasing, but 54.816%
variation is explained by first three PCAs and eigenvalues for first three components is more than 1 so, three components
are to be extracted.
Factor analysis was performed to find out most important factors which influenced customers in purchase of selected
durables. Principal component analysis method was used for conducting factor analysis.
Table No.15: Factor Analysis of Factors considered by
Respondents while purchasing Durables
Rotated Component Matrixa
Price Component
Brand Name 1 2 3
Company Image .359 .225 .456
Latest Technology .745 .126 -.162
Social Status .738 .008 .095
Colour .675 -.049 .198
Model -.082 .737 -.006
Lighter Weight .126 .765 .199
Discount .358 .221 .297
After Sales Service .017 .028 .868
Easier Availability .086 .096 .879
Advertisement .044 .578 .091
Extraction Method: Principal Component Analysis.
Rotation Method: Varimax with Kaiser Normalization.
a. Rotation converged in 4 iterations.
Table 15 describes that the correlation coefficient between the factor score and the variables included in the study is called
factor loading which is given in component matrix. The correlation coefficient between (first standardized variable) price
and factor 1(Factor 1 score) is 0.359, similarly, the correlation coefficient between factor 2 and price is 0.225 and so on.
Mukt Shabd Journal
Volume IX, Issue V, MAY/2020
ISSN NO : 2347-3150
Page No : 3140
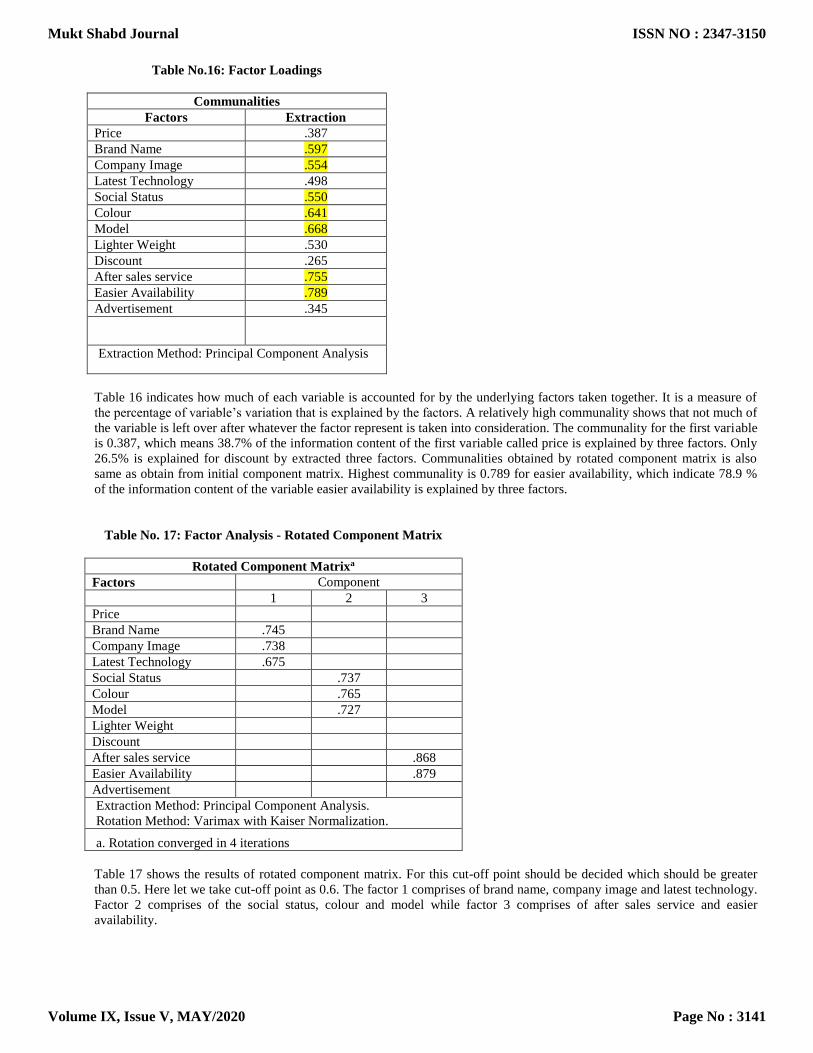
Table No.16: Factor Loadings
Communalities
Factors Extraction
Price .387
Brand Name .597
Company Image .554
Latest Technology .498
Social Status .550
Colour .641
Model .668
Lighter Weight .530
Discount .265
After sales service .755
Easier Availability .789
Advertisement .345
Extraction Method: Principal Component Analysis
Table 16 indicates how much of each variable is accounted for by the underlying factors taken together. It is a measure of
the percentage of variable’s variation that is explained by the factors. A relatively high communality shows that not much of
the variable is left over after whatever the factor represent is taken into consideration. The communality for the first variable
is 0.387, which means 38.7% of the information content of the first variable called price is explained by three factors. Only
26.5% is explained for discount by extracted three factors. Communalities obtained by rotated component matrix is also
same as obtain from initial component matrix. Highest communality is 0.789 for easier availability, which indicate 78.9 %
of the information content of the variable easier availability is explained by three factors.
Table No. 17: Factor Analysis - Rotated Component Matrix
Rotated Component Matrixa
Factors Component
1 2 3
Price
Brand Name .745
Company Image .738
Latest Technology .675
Social Status .737
Colour .765
Model .727
Lighter Weight
Discount
After sales service .868
Easier Availability .879
Advertisement
Extraction Method: Principal Component Analysis.
Rotation Method: Varimax with Kaiser Normalization.
a. Rotation converged in 4 iterations
Table 17 shows the results of rotated component matrix. For this cut-off point should be decided which should be greater
than 0.5. Here let we take cut-off point as 0.6. The factor 1 comprises of brand name, company image and latest technology.
Factor 2 comprises of the social status, colour and model while factor 3 comprises of after sales service and easier
availability.
Mukt Shabd Journal
Volume IX, Issue V, MAY/2020
ISSN NO : 2347-3150
Page No : 3141
This shows that the most important factors influencing the purchase of selected durables are brand name, technology, after
sales service and easier availability.
5. FINDINGS OF THE RESEARCH STUDY
Out of total 100 respondents, 27% were males and73% were females, 97% were unmarried and 3% were unmarried.
73% belonged to age group of 18 to 21 years. 90 % were post graduate students and remaining 10% were studying
Diploma course. 32% had monthly family income between Rs. 15000/- to Rs.30000/- and 34% belonged to income
group of Rs. 45000/- and above. 64% were from joint family and rest 36% belonged to nuclear family.
Respondents had high level of awareness towards various brands of selected durables available in the market. The
most popular brand of mobile phone owned by respondents were Samsung, Redmi and Vivo. The most preferred
laptop brands were Lenovo, Dell and HP. Two wheeler brands owned by respondents were Activa followed by Access
and Hero. Respondents consider these durables as necessities and not luxuries. 60% respondents had spent Rs.10000/-
to Rs.25000/- for purchasing mobile phone. 46% had spent RS. 40000 to Rs.60000/- on purchasing Laptop and 73%
had spent Rs.50000/- to Rs.70000/- for purchasing two wheeler.
44% had purchased mobile phone and 18% had purchased Laptop online through Amazon and Flipkart websites. 38%
purchased laptop and 46% purchased two wheeler from Authorized dealer showroom. They preferred to make
payment either in cash or used debit card.
54% were influenced by parents and 38% took their own decision for purchasing these products. 86% said that they
prefer to purchase these durables as and when need arises.
The main reason for purchase of selected durables were educational purpose (mean rank 2.23) followed by necessity
(mean rank 2.34), and saving of time (mean rank 3.01).
From mean comparison of score assigned by respondents to factors influencing purchase of durables, the most
important factor considered by respondents was technology (4.32), followed by brand name (4.20) and company
image (4.14). Respondents were satisfied from the durables which they own and use.
No significant association was found between income of the respondents and their expenditure towards laptop and two
wheeler. Association was found between income and expenditure towards mobile phone.
No significant relationships were found between gender, course enrolled, income and type of family with brands of
durables possessed by respondents. Significant relationships was found between gender and two wheeler brands
possessed by respondents.
Results of chi square test shows that respondents were satisfied from the brand of durables which they own. Hence, it
can be concluded that brand preference and satisfaction are independent.
The results of friedman’s test reveals that the ranks assigned to reasons for using durables differ among respondents.
Hence, different respondents have given different reasons for purchase of selected durables. The most important
reason for purchasing durables was education, necessity and saving of time.
The results of factor analysis reveals that the factors which most influenced respondents in purchasing selected
durables were brand name, technology, after sales service and easier availability.
6. CONCLUSIONS AND SUGGESTIONS
The study of consumer behaviour helps us in understanding how consumers make purchase decision and what are the factor
influencing them during purchase of products. This study was carried out among students to understand their buying
behaviour. This study had selected only three durables viz. laptop, mobile phone and two wheeler to understand buying
behaviour of consumers. Hence, the results of this study cannot be generalized for population. This study has been carried
on students, because all these three durables are easily available with students and they use them in their daily routine.
Vadodara has a very big market for two wheelers. The results of this study revealed that, respondents are brand conscious,
they possessed popular brand of durables and most of them were satisfied from the brand of durables which they own and
use. The most influencing factor considered by them in purchase of durables were brand name, technology, after sales
service and easier availability. The demand for these durables is going on increasing. It is found that respondents purchase
Mukt Shabd Journal
Volume IX, Issue V, MAY/2020
ISSN NO : 2347-3150
Page No : 3142
durables as and when need arises and during replacement of old technology product. Hence, companies should innovate and
develop latest technology products.
7. LIMITATIONS OF THE RESEARCH STUDY
1) This study was confined to only post graduate and diploma students studying in only Faculty of Commerce, The
Maharaja Sayajirao University of Baroda.
2) This study has selected only three durables to examine buying behavior of students. This study has not included other
durables which students use like personal computer, notepad etc.
8. REFERENCES
Journals / Bibliography / Webliography
1) William J. Qualls (1984), “Sex Roles, Husband Wife Influence, and Family Decision Behaviour”, Advances in
Consumer Research, Vol. 11, pp.270-275.
2) Ingavale Deepa, Kedar Vijay Marulkar, Anil Suryavanshi(2012), “An Empirical Study of Brand Preference for Mobile
Phones, Jan. 2012, Conference Paper: International Marketing Conference 2012 on Envisage 2020: Emerging Business
Practices at Mumbai, p.1.
3) Oliver R.L. and Swan J.E. (1989), “Consumer Perceptions of Interpersonal equity and Satisfaction in Transactions: A
Field Survey Approach”, Journal of Marketing, Vol. 53, April 1989, pp.21-35.
4) Nagananthi & Mahalaxmi (2016), Consumers’ Brand Preference and Buying behaviour of cosmetics products at
Coimbatore city, Intercontinental Journal of Marketing research review, Vol. 4, Issue 1, Jan.2016, p. 12.
5) Walia Punit and Lalit Singla (2017), “Analysis of Factors influencing Consumer Purchase Decision of Cellular Phones,
International Journal of Scientific Research and Management, Vol.5, No.7, July 2017, pp.2321-3418.
6) Malviya and Saluja (2013), “Factors influencing Consumer’s Purchase Decision towards smartphones in Indore”,
International Journal of Advance Research in Computer Science and Management Studies, Vol.1, No.6, Nov. 2013,
pp.14-21.
7) Vijayalakshmi and Manimozy (2015), “A Study on Brand preference towards smart phone users in Thiruvarur
District”, International Journal of Advanced Scientific Research and Development (IJASRD), pp.163-168.
8) Saranya G. and G Yoganandan (2019), “Brand Preference towards Smart phones among college students in Coimbatore
City”, International Journal of recent Technology and Engineering (IJRTE), Vol. 8, No. 4, Dec. 2019, pp.809-811.
9) Brahmbhatt A.C. and Sejal Acharya (2015), “A Study on Different Factors influencing Consumers’ Pre-purchase
Buying Behaviour towards Laptop” , PARIPEX, Indian Journal of Research, Vol.4, Issue 8, August 2015, pp.248 –
250.
10) Afrin Farhana, Fatima Khan and Md. Rabiul Islam (2015), “Impact of Influential factors on Laptop Buying Decision: A
Study on Students of Bangladesh”, Asian Journal of Research in Social Sciences and Humanities, Vol.5, No.7, July
2015, pp.116-124.
11) S. Namasivayam, M. Prakash, MS Ranjithkumar, M. Gunasekaran, S. Ashwini (2016), “A Study on Brand Awareness
and Consumer Buying Behaviour towards Laptops with reference to Coimbatore City”, International Journal of
Mulitdisciplinary Research and Development, Vol. 3, No 2, Feb. 2016, pp.243-247.
12) Malla Riya (2016), “Factors affecting Brand Preference of Scooters among Women Consumers in Kathmandu Valley”,
Journal of Business and Social Sciences Research (JBSSR), Vol.1 No.2, pp.185-200.
13) Padmasani, Remiya V., M. Ishwarya (2014), “Brand Preference towards Scooters among women Consumers in
Coimbatore city.” International Journal in Management and Social Science, Vol.2, No.12, (Dec.2014), pp.247-256.
Mukt Shabd Journal
Volume IX, Issue V, MAY/2020
ISSN NO : 2347-3150
Page No : 3143
14) Mohammed Akbar Ali Khan and Datrika Venkata Madhusudan Rao (2018), “Two Wheeler Consumer’s Behaviour
towards Customer Satisfaction”, International Journal of Research-Granthaalayah, Vol.6, No.2, Feb. 2018, pp.13-31.
15) Kotler Philip (1998), Marketing Management, Prentice Hall of India Pvt. Ltd., 1998, New Delhi, p. 9, 40, 171, 172,
180, 192, 443.
16) Schiffman and Kanuk (2008), Consumer Behaviour, Pearson Education, 9th Edition, New Delhi, p.3.
17) Kotler, Keller, Koshy and Jha, Marketing Management, Pearson Education, 2014, p. 261-262.
18) Verma Harsh, Brand Management, Excel Publications, 2004 p. 31.
19) Dutta Kirti, Brand Management, Oxford University Press, 1st Edition, 2012, p.5-6
20) Chawla Deepak and Neena Sondhi (2014), Research Methodology, Vikas Publishing House Pvt. Ltd., Noida.
21) Kothari C.R., Research Methodology, New Age International Publishers
22) www.canalys.com
23) www.ibef.org India Brand Equity Foundation, A Report on Automobile Sector in India, February 2019
Mukt Shabd Journal
Volume IX, Issue V, MAY/2020
ISSN NO : 2347-3150
Page No : 3144