Embed Size (px)
Citation preview

ORIGINAL ARTICLE
A study on groundwater geochemistry and water qualityin layered aquifers system of Pondicherry region, southeast India
R. Thilagavathi • S. Chidambaram •
M. V. Prasanna • C. Thivya • C. Singaraja
Received: 28 January 2012 / Accepted: 22 April 2012 / Published online: 24 May 2012
� The Author(s) 2012. This article is published with open access at Springerlink.com
Abstract Geochemical signatures of groundwater in the
Pondicherry region, south India, were determined. The
coastal aquifers are fragile and this situation becomes more
intense in layered aquifer systems like that of the Pondi-
cherry region. In this region, groundwater occurs in allu-
vium, Lower Cuddalore, Upper Cuddalore, Tertiary,
Cretaceous and mixed aquifers. The geochemical signature
of groundwater in these formations was studied by col-
lecting 93 groundwater samples. The collected samples
from specific formations were analysed for physical
parameters, such as electrical conductivity (EC), pH and
major ion concentrations, such as Ca, Mg, Na, K, Cl,
HCO3, PO4 and SO4. The results of the analysis were
interpreted with geology; the ionic concentrations in the
groundwater vary spatially and temporally. The abundance
of these ions are in the following order: Na [ Ca [Mg [ K = Cl [ HCO3 [ SO4. Interpretation of analytical
data shows that Ca–Na and Cl–SO4–HCO3 is the dominant
facies in all the formations. Groundwater in the area is
generally hard and fresh-brackish in most of the formations
and brackish in nature in alluvium formation. The sodium
absorption ratio shows that most of the samples are
grouped under excellent category to good category in all
the formations. The residual sodium carbonate also are in
good category in all the formations. Chloro-alkaline indices
reveal that the majority of samples show negative values in
all the litho units indicating the exchange of Na and K in
groundwater with Mg or Ca in rock. Scholler classification
of water indicates that longer residence time of water with
more prominent base exchange. High EC and TDS values
in certain locations of alluvial, Upper Cuddalore and
Cretaceous formations prove to be unsuitable for drinking
and irrigation purposes.
Keywords Groundwater � Aquifers � Geochemistry �Water quality � Pondicherry
Introduction
The emerging global freshwater crisis in terms of water
quality and quantity is already felt in India. The over-
drafting of groundwater in India due to the lack of surface
waters during summer season has urged the need to
undertake a detailed study on the quality and quantity of
groundwater in different parts of India. Water quality gets
modified along the course of movement of water through
the hydrological cycle and through the operation of the
following processes: evaporation, transpiration, selective
uptake by vegetation, oxidation/reduction, cation
exchange, dissociation of minerals, precipitation of sec-
ondary minerals, mixing of waters, leaching of fertilizers
and manure, pollution and biological processes (Appelo
and Postma 1999). The quality of water is of vital concern
for mankind, since it is directly linked with human wel-
fare. Poor quality of water adversely affects the plant
growth and human health (Wilcox 1984; Thorne and
Peterson 1954; US Salinity Laboratory Staff 1954; Holden
1971; Todd 1980; ISI 1983; WHO 1984; Hem 1991;
Karanth 1997). Groundwater quality data give important
clues to the geologic history of rocks and indications of
R. Thilagavathi � S. Chidambaram � C. Thivya � C. Singaraja
Department of Earth Sciences, Annamalai University,
Annamalai Nagar, Chidambaram 608002, India
M. V. Prasanna (&)
Department of Applied Geology, School of Engineering and
Science, Curtin University, Sarawak Campus, CDT 250,
98009 Miri, Sarawak, Malaysia
e-mail: [email protected]
123
Appl Water Sci (2012) 2:253–269
DOI 10.1007/s13201-012-0045-2
groundwater recharge, movement and storage (Walton
1970). The knowledge of hydrochemistry is essential to
determine the origin of chemical composition of ground-
water (Zaporozec 1972). The hydrology and geochemistry
of waters have been further discussed in the classic works
of Stumm and Morgan (1996), Hem (1991), Drever (1988)
and Domenico and Schwartz (1998). Determination of
physical, chemical and bacteriological quality of water is
essential for assessing its suitability for various purposes
like drinking, domestic, agricultural and industrial uses. A
number of studies on groundwater quality with respect to
drinking and irrigation purposes have been carried out in
different parts of India (Durvey et al. 1997; Agarwal and
Jagetia 1997; Niranjan Babu et al. 1997; Subba Rao et al.
1999; Majumdar and Gupta 2000; Dasgupta and Purohit
2001; Khurshid et al. 2002; Sujatha and Reddy 2003;
Pulle et al. 2005; Hussain et al. 2005; Sunitha et al. 2005;
Subba Rao 2006). The study area is predominantly an
agricultural zone with dense agricultural activities and
also located near the coastal region. The majority of the
people in this region depend on agriculture (i.e. cultivators
and agricultural labourers). Both for drinking and irriga-
tion purposes, substantial amount of groundwater is used
in this area. Hence, this study forms the baseline attempt
on the geochemistry of sub-surface water, impact of salt
water intrusion and suitability for drinking and agricul-
tural purposes in the study area.
Physiography and geomorphology of the study area
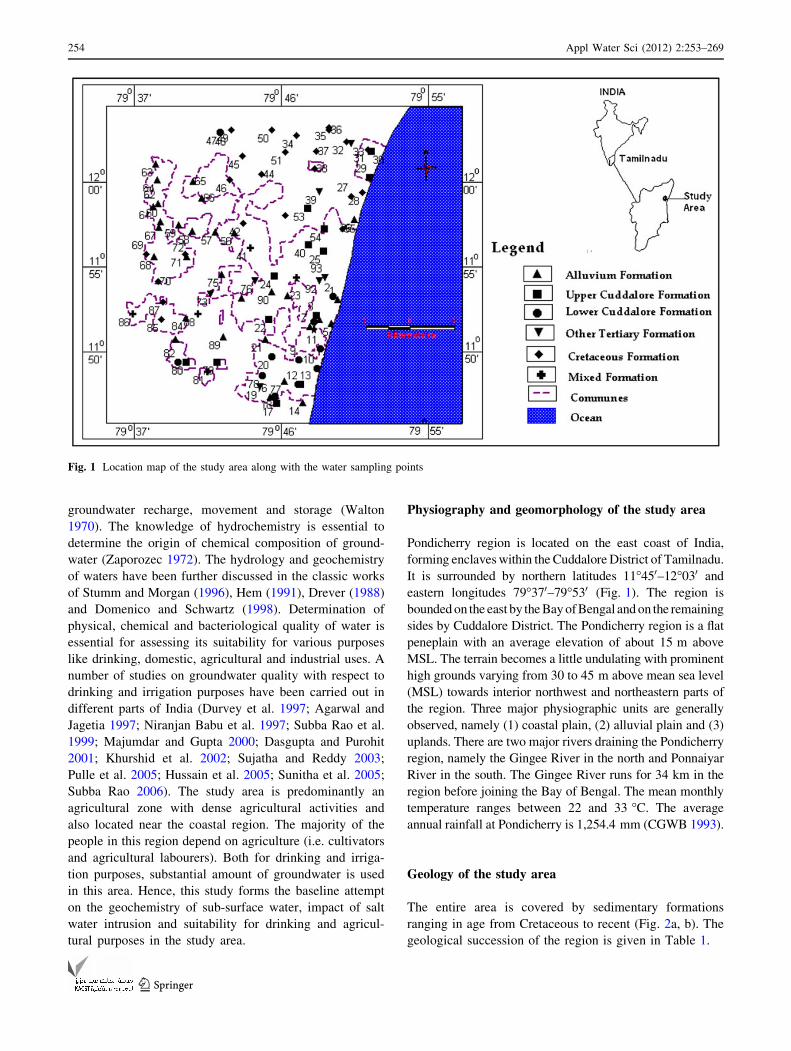
Pondicherry region is located on the east coast of India,
forming enclaves within the Cuddalore District of Tamilnadu.
It is surrounded by northern latitudes 11�450–12�030 and
eastern longitudes 79�370–79�530 (Fig. 1). The region is
bounded on the east by the Bay of Bengal and on the remaining
sides by Cuddalore District. The Pondicherry region is a flat
peneplain with an average elevation of about 15 m above
MSL. The terrain becomes a little undulating with prominent
high grounds varying from 30 to 45 m above mean sea level
(MSL) towards interior northwest and northeastern parts of
the region. Three major physiographic units are generally
observed, namely (1) coastal plain, (2) alluvial plain and (3)
uplands. There are two major rivers draining the Pondicherry
region, namely the Gingee River in the north and Ponnaiyar
River in the south. The Gingee River runs for 34 km in the
region before joining the Bay of Bengal. The mean monthly
temperature ranges between 22 and 33 �C. The average
annual rainfall at Pondicherry is 1,254.4 mm (CGWB 1993).
Geology of the study area
The entire area is covered by sedimentary formations
ranging in age from Cretaceous to recent (Fig. 2a, b). The
geological succession of the region is given in Table 1.
Fig. 1 Location map of the study area along with the water sampling points
254 Appl Water Sci (2012) 2:253–269
123

Cretaceous aquifers
a) Ramanathapuram and Vanur aquifers
They occur in the northwestern part of the Pondicherry region
and are encountered in boreholes drilled in the major part of
the region. The aquifers of this formation include sands and
calcareous sandstones. They are coarse grained in the western
part and graded into finer facies towards east and northeast.
The thickness of these aquifers ranges between 38 and 92 m.
Groundwater occurs under confined conditions, and the
piezometric head at present is about 20 to 60 m bgl. The depth
of the tube wells tapping these aquifers ranges between 65 m
in the NW and 300 m in the NE of Pondicherry region. The
yield of the tube wells tapping these aquifers ranges between
120 and 700 lpm. The investigation carried out reveals that the
transmissivity value of these aquifers ranges between 92 and
1,925 m2/day. The storage coefficient value ranges between
2.93 9 10-5 and 1.36 9 10-4.
Fig. 2 a Geology map of the
study area (after Pethaperumal
2010). b Cross section along the
line AB in a (after Pethaperumal
2010)
Appl Water Sci (2012) 2:253–269 255
123

b) Ottai aquifers
The Upper Cretaceous Ottai Formations are constituted
mainly by clay stone. The water-bearing property of Ottai
aquifers is chiefly dependent on the few bands of fine-
grained sandstone and limestone occurring locally at dee-
per depths and, as a result, yields meagre to moderate
quantity of water. The thickness of this aquifer varies from
42 to 56 m and the yield of the wells ranges between 120
and 600 lpm with drawdown varying from 6.6 to 25 m.
Tertiary aquifers
a) The Manaveli Formation of Palaeocene is mainly an
aquitard and the localized granular zones do not pro-
vide any appreciable yield. Another unit of this group,
namely the Kadapperikuppam Formation, contains
some productive aquifers. The thickness of this aquifer
shows wide lateral and vertical variations. Amongst
Tertiary aquifers, the Cuddalore sandstones of Mio-
Pliocene age constitute the most potential aquifers.
b) Kadapperikkuppam Aquifers
The aquifers of this group are constituted by fine-grained
sandstones and give moderate to good yield as seen around
Sedarapet, Pillaiyarkuppam and further northeast. The
thickness of aquifer ranges between 52 and 90 m in the
areas south of Gingee River, whereas in the areas the north
of Gingee River, it is between 13 and 37 m. Groundwater
occurs under un-confined condition. The investigation
carried out reveals a field permeability of 3 m/day in the
areas to the south of Gingee River, whereas towards north
of Gingee River it is around 0.8 m/day.
c) Cuddalore sandstone aquifers
The Cuddalore Sandstones (Upper Tertiary), compris-
ing sandstones and gravels, occupy an extensive area in
the region. The thickness of this aquifer in Ozhukarai that
communes with the north of Gingee River ranges between
20 and 66 m, and the maximum thickness of 245 m is
encountered in Bahour commune in the southern part of
the region. The yield of the tube wells tapping this aquifer
ranges between 200 and 3,000 lpm with drawdown
varying from 5 to 10 m. The piezometric level in this
aquifer ranges between 10 and 25 m bgl. The investiga-
tion carried out reveals that the average transmissivity
values of these aquifers are around 2,000 m2/day. The
storage coefficient value ranges between 9.583 9 10-5
and 8.9 9 10-4.
Alluvial aquifer
Sands and gravels constitute the alluvial aquifer. Alluvial
deposits occupy nearly three-fourths of the study area.
These aquifers form the most potential shallow aquifer
system of the study area, with thickness ranging between 5
and 34 m. Thick alluvial aquifers occur in the area bor-
dered by Thirukanji, Odiyampet, Thavalakuppam, Villia-
nur, Mangalam and Sathamangalam. Groundwater occurs
Table 1 Geological succession
of the study area (CGWB 1993)Era Period Formation Lithology
Quarternary Recent Alluvium Sands, clays, silts, kankar, and gravels
Tertiary Mio-
Pliocene
Cuddalore Sandstone, pebbly and gravelly and coarse grained with
minor clays and silt stones and thin seams of lignite
Unconformity
Tertiary Palaeocene Manaveli Yellow and yellowish brown, gray calcareous siltstone
and claystone, and shale with thin bands of limestone
Tertiary Palaeocene Kadapepperikuppam Yellowish white to dirty white, sandy, hard fossiliferous
limestone, calcareous sandstone and clay
Unconformity
Mesozoic Upper
Cretaceous
Turuvai limestone Highly fossiliferous limestone, conglomeritic at places,
calcareous sandstone, and clays
Mesozoic Upper
Cretaceous
Ottai claystone Greyish to greyish green claystones, siltstone with thin
bands of sandy limestone and fine-grained calcareous
sandstone.
Mesozoic Upper
Cretaceous
Vanur sandstone Quartzose sandstone, hard coarse grained, occasionally
felspathic or calcareous with minor clays
Mesozoic Lower
Cretaceous
Ramanathapuram
(unexposed)
Black carbonaceous, silty clays and fine- to medium-
grained sands with bands of lignite and sandstone,
medium to coarse grained
Unconformity
Archaeans Eastern Ghats
complex
Charnockite and biotite hornblende gneisses
256 Appl Water Sci (2012) 2:253–269
123

in this aquifer under un-confined to semi-confined condi-
tion. The depth of the tube wells tapping this aquifer ranges
between 25 and 50 m bgl. The average annual fluctuation is
around 7.50 m. The studies (CGWB 1993) indicate that the
transmissivity values of the aquifers in the west are
275.4 m2/day at Madukarai and 770 m2/day at Thirukanji
in the east.
Hydrogeology
As mentioned earlier, the sedimentary formations occur in
almost the entire region and are represented by Cretaceous,
Palaeocene, Mio-Pliocene and Quaternary formations.
Groundwater occurs in these formations both under water
table as well as under confined conditions and is developed
by means of dug wells, dug cum borewells and tube wells.
Methodology
From borewells, 93 groundwater samples were collected in
order to cover different litho units in the study area [allu-
vium (31), Tertiary (Upper Cuddalore sandstone) (15),
Tertiary (Lower Cuddalore sandstone) (15), Other Tertiary
(7), Cretaceous (25) and mixed (5)] (Fig. 1). The samples
were analysed using standard procedures (APHA 1998).
Major cations such as Ca and Mg were analysed by titri-
metry, Na and K by flame photometer (Elico CL 378),
major anions Cl and HCO3 by titrimetry, and SO4, PO4 and
H4SiO4 by spectrophotometer (SL 171 minispec). EC and
pH were determined in the field itself using electrode
(Thermo). The total cation (Tz?) and total anion (Tz-)
balance (Domenico and Schwartz 1998; Freeze and Cherry,
1979) is considered to show the ionic balance error per-
centage. The error percentage in the samples ranged from
±1 to ±10 %.
Results and discussion
Maximum and minimum values for the chemical compo-
sition of groundwater is given in Table 2, compared with
WHO standards. The abundance of ions is in the following
order: Na [ Ca [ Mg [ K = Cl [ HCO3 [ SO4.
Hydrochemical facies
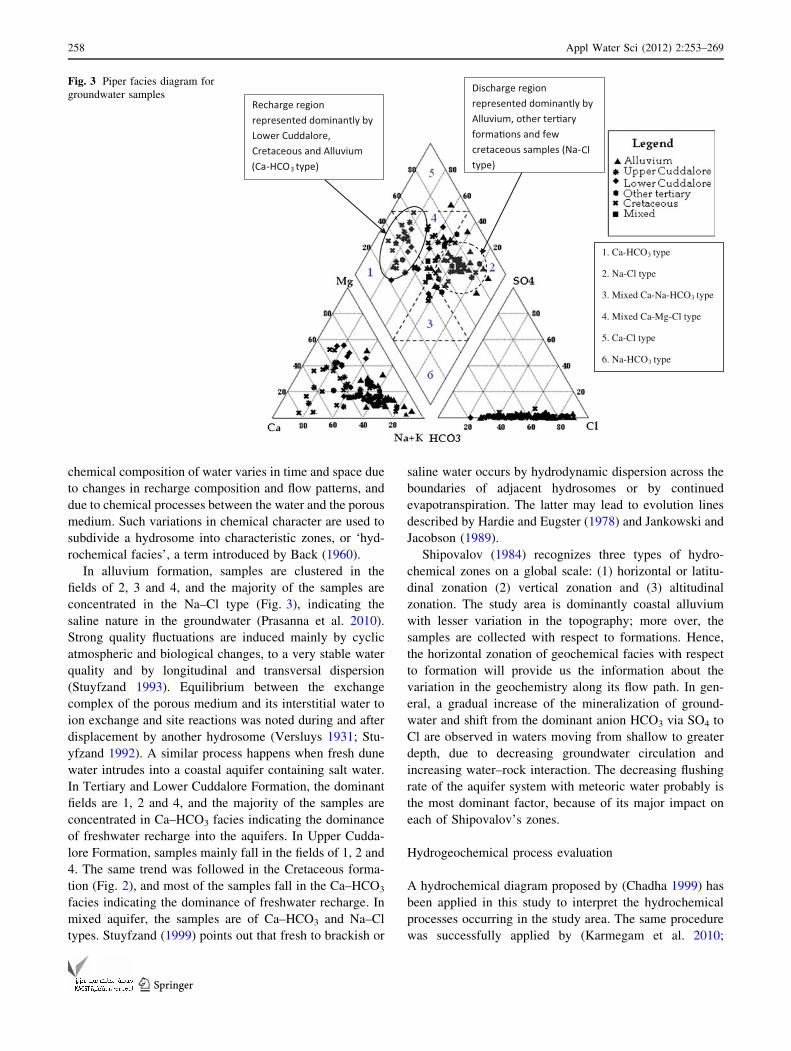
Piper diagrams (Piper 1953) are drawn by plotting the
proportions (in equivalents) of the major cations (Ca2?,
Mg2?, Na??K?) on one triangular diagram, the propor-
tions of the major anions (CO3- ? HCO3
-, Cl-, SO42-) on
another, and combining the information from the two tri-
angles on a quadrilateral. The position of this plotting
indicates the relative composition of groundwater in terms
of the cation–anion pairs that correspond to four vertices of
the field. The geochemical evolution can be understood
from the Piper plot (Fig. 3), which has been divided into six
sub-fields, viz. 1 (Ca–HCO3 type); 2 (Na–Cl type); 3 (mixed
Ca–Na–HCO3 type); 4 (mixed Ca–Mg–Cl type); 5 (Ca–Cl
type) and 6 (Na–HCO3 type). The groundwater samples
were collected from different formations like, Cretaceous,
Tertiary and alluvium. Hence, it is presumed that the sam-
ples reveal the characters of the same term ‘hydrosome’
which is analogous to the stratigraphic concept ‘lithosome’
(Krumbein and Sloss 1963). Within a given hydrosome, the
Table 2 Maximum and minimum values of the chemical composition of groundwater samples
Parameters Alluvium
(n = 31)
Tertiary Cretaceous
(n = 25)
Mixed
(n = 5)
WHO
2004Lower Cuddalore
(n = 13)
Upper Cuddalore
(n = 13)
Other Tertiary
(n = 7)
EC 334–3,310 (19) 321–3,250 (1) 270–1,432 (2) 562–1,571 (1) 340–3,127 (7) 810–2,795(1) 1,400
pH 6.6–7.8 6.6–7.82 6.22–7.65 6.77–7.71 6.24–7.84 7.02–7.65 6.5–8.5
TDS 241–2,250 (18) 205–2,190 (3) 211–993 444–1,054 (1) 234–2,376 (4) 518–1,905 (3) 500–1,000
Ca 12–104 (1) 28–88 16–112 (1) 32–72 20–172 (3) 28–64 100
Mg 7.2–62.4 (1) 0–33 7.2–48 12–28.8 2.4–45 14–26 50
Na 20–517 (12) 7–567 (1) 12–146 27–389 (1) 6.8–550 (3) 67–176 200
K 0.1–47 (2) 0–18 0–8 0.2–4.8 0.1–16.9 0–11 20
HCO3 73.2–1,475.8 (4) 73–402.6 (1) 85.4–268.4 109–305 73–366 170–268 125–350
SO4 0–28 0–11 0–4 0.04–9.2 0.4–44 2.4–13.6 250
Cl 35–797 (23) 53–744 (3) 26–389 (2) 70–602 (2) 53–904 (7) 88–390 (2) 250
All the values are in mg/L except pH and EC in ls/cm; numbers within the bracket represent the number of samples beyond the WHO limit
Appl Water Sci (2012) 2:253–269 257
123
chemical composition of water varies in time and space due
to changes in recharge composition and flow patterns, and
due to chemical processes between the water and the porous
medium. Such variations in chemical character are used to
subdivide a hydrosome into characteristic zones, or ‘hyd-
rochemical facies’, a term introduced by Back (1960).
In alluvium formation, samples are clustered in the
fields of 2, 3 and 4, and the majority of the samples are
concentrated in the Na–Cl type (Fig. 3), indicating the
saline nature in the groundwater (Prasanna et al. 2010).
Strong quality fluctuations are induced mainly by cyclic
atmospheric and biological changes, to a very stable water
quality and by longitudinal and transversal dispersion
(Stuyfzand 1993). Equilibrium between the exchange
complex of the porous medium and its interstitial water to
ion exchange and site reactions was noted during and after
displacement by another hydrosome (Versluys 1931; Stu-
yfzand 1992). A similar process happens when fresh dune
water intrudes into a coastal aquifer containing salt water.
In Tertiary and Lower Cuddalore Formation, the dominant
fields are 1, 2 and 4, and the majority of the samples are
concentrated in Ca–HCO3 facies indicating the dominance
of freshwater recharge into the aquifers. In Upper Cudda-
lore Formation, samples mainly fall in the fields of 1, 2 and
4. The same trend was followed in the Cretaceous forma-
tion (Fig. 2), and most of the samples fall in the Ca–HCO3
facies indicating the dominance of freshwater recharge. In
mixed aquifer, the samples are of Ca–HCO3 and Na–Cl
types. Stuyfzand (1999) points out that fresh to brackish or
saline water occurs by hydrodynamic dispersion across the
boundaries of adjacent hydrosomes or by continued
evapotranspiration. The latter may lead to evolution lines
described by Hardie and Eugster (1978) and Jankowski and
Jacobson (1989).
Shipovalov (1984) recognizes three types of hydro-
chemical zones on a global scale: (1) horizontal or latitu-
dinal zonation (2) vertical zonation and (3) altitudinal
zonation. The study area is dominantly coastal alluvium
with lesser variation in the topography; more over, the
samples are collected with respect to formations. Hence,
the horizontal zonation of geochemical facies with respect
to formation will provide us the information about the
variation in the geochemistry along its flow path. In gen-
eral, a gradual increase of the mineralization of ground-
water and shift from the dominant anion HCO3 via SO4 to
Cl are observed in waters moving from shallow to greater
depth, due to decreasing groundwater circulation and
increasing water–rock interaction. The decreasing flushing
rate of the aquifer system with meteoric water probably is
the most dominant factor, because of its major impact on
each of Shipovalov’s zones.
Hydrogeochemical process evaluation
A hydrochemical diagram proposed by (Chadha 1999) has
been applied in this study to interpret the hydrochemical
processes occurring in the study area. The same procedure
was successfully applied by (Karmegam et al. 2010;
Fig. 3 Piper facies diagram for
groundwater samples
258 Appl Water Sci (2012) 2:253–269
123

Vandenbohede et al. 2010) in a coastal aquifer to determine
the evolution of two different hydrogeochemical processes.
Data were converted to percentage reaction values (milli-
equivalent percentages) and expressed as the difference
between alkaline earths (Ca ? Mg) and alkali metals
(Na ? K) for cations, and the difference between weak
acidic anions (HCO3 ? CO3) and strong acidic anions
(Cl ? SO4). The hydrochemical processes suggested by
Chadha (1999) are indicated in each of the four quadrants
of the graph. These are broadly summarized as:
Field 1: Ca–HCO3 type of recharging waters
Field 2: Ca–Mg–Cl type of reverse ion-exchange waters
Field 3: Na–Cl type of end-member waters (seawater)
Field 4: Na–HCO3 type of base ion-exchange waters
The resultant diagram is shown in Fig. 4 and the
majority of alluvium samples fall in Field 3 (Na–Cl) sug-
gesting that the waters show typical seawater mixing and
are mostly constrained to the coastal areas. Most of the
Upper and Lower Cuddalore and Cretaceous samples are in
Field 1 (recharging water). When water enters into the
ground from the surface, it carries dissolved carbonate in
the form of HCO3 and the geochemically mobile Ca. Few
samples in all the formations fall in Field 2 (reverse ion
exchange), revealing that the waters are less easily defined
and less common, but represent groundwater where
Ca ? Mg is in excess to Na ? K either due to the pref-
erential release of Ca and Mg from mineral weathering of
exposed bedrock or possibly reverse base cation-exchange
reactions of Ca ? Mg into solution and subsequent
adsorption of Na into mineral surfaces (Karmegam et al.
2010). Field 4 (Na–HCO3) waters, which is less prominent
in the study area.
Seawater has distinct ionic ratios, as presented in
Table 3 (Vengosh et al. 2002; Vengosh and Rosenthal
1994). Relatively, 29 % of alluvium and Other Tertiary
samples show the high Na?/Cl- and Ca2?/
(HCO3- ? SO4
2-) ratios (greater than unity) (Vengosh
Fig. 4 Chadda’s geochemical
process evolution plot
Table 3 Comparative ionic ratio of potential salinization sources with present groundwater compositions
Parameter Seawater
intrusion
Alluvium
(n = 31) (%)
Tertiary Upper
Cuddalore
(n = 13) (%)
Tertiary Lower
Cuddalore
(n = 13) (%)
Other Tertiary
(n = 7) (%)
Cretaceous
(n = 25) (%)
Mixed
(n = 5) (%)
Na?/Cl- 0.86–1a 29 7.6 7.6 28.5 20 20
SO42-/Cl- 0.05a,c – – – – 8 –
K?/Cl- 0.019 – – – – – –
Mg2?/Ca2? [5b – – – – – –
Ca2?/(HCO3- ? SO4
2-) 0.35–1 35.4 69.2 30.7 42.8 68 60
a Vengosh and Rosenthal (1994)b Vengosh and Ben-Zvi (1994)c Vengosh et al. (1994)
Appl Water Sci (2012) 2:253–269 259
123

et al. 2002). Each probable source of salinization is char-
acterized by a distinguishable chemistry and well-known
ionic ratios. For example, if seawater intrusion is expected to
be the only source of salinization, then the Mg2?/Ca2? ionic
ratio will be greater than 5. The Mg2?/Ca2? ionic ratio
greater than 5 is a direct indicator of seawater contamination
(Metcafe and Eddy 2000). Likewise, seawater and seawater
diluted with freshwater have distinguished geochemical
characteristics (Metcafe and Eddy 2000). The value of these
ratios in the study area is greater than unity and may be due
to deep saline upconing or ion-exchange process.
Modification of the geochemical characteristics of these
saline waters is caused by water–rock interaction in which
three possible mechanisms may be involved: (1) base-
exchange reactions with clay minerals (Vengosh et al.
1994); (2) adsorption onto clay minerals; and (3) carbonate
dissolution–precipitation (Vengosh et al. 1994; Ghabayen
et al. 2006).
The improper treatment and disposal of domestic waste-
water could be one of the major sources of salinization in the
coastal aquifers (Metcafe and Eddy 2000). The chemical
character of polluted water with urban wastewater or from
the reuse of treated wastewater is very distinguishable.
Sewage effluent has a relatively high Na?/Cl- ratio (greater
than unity) and comparatively high SO42-/Cl- ratio (0.09)
(Ghabayen et al. 2006). These ratios are attributed to appli-
cations of Na–Cl salts and domestic wastewater character-
istics. Agriculture return flows have a distinctive chemical
composition relative to other salinization sources. This water
is characterized by high SO42-/Cl- ratios, and 8 % in Cre-
taceous shows much greater than 0.05 (Vengosh et al. 2002).
A high SO42-/Cl- ratio is attributed to the application of
gypsum fertilizers (Vengosh et al. 2002). Lesser values of
K/Cl and SO4/Cl- are noted in the deeper aquifers, indicating
relatively lesser anthropogenic impact.
The comparison of the Na?/Cl- ratio shows that fresh-
water mixing with seawater is responsible for high salinity in
the area (Table 3). Migration of anthropogenic impact or
dissolution and leaching of precipitated salts is also evident
by the high SO42-/Cl- ratio in Cretaceous aquifers, which
substantiate that there is some impact from agriculture return
flows. It is also true in the background that salt patches can be
easily observed in the area at the time of high evapotrans-
piration. Nevertheless, this temporary phase has been
released and once again inland salinity seems to be the
governing factor. K? seems to be contributed from anthro-
pogenic sources; this finding gets strengthened by the com-
parison of K?/Cl- ratio that was found to be quite higher and
equivalent to wastewater infiltration. Ca2?/(HCO3- ?
SO42-) ratio depicts that the seawater intrusion process is
mostly responsible (Kumar et al. 2006).
Figure 5 shows the relationship of pH to (Ca2??
Mg2?)/HCO3- ratio. pH determines the nature of carbonate
present in water as H2CO3-, HCO3
-, and CO3-, in acidic
to alkaline pH conditions. The pH of the study area ranges
from acidic to alkaline condition. The gradual increase of
pH might be due to the higher amount of H? availability in
all the aquifers. This may be due to nonavailability of
neutralizing ions or strong ion-exchange complex by cation
with clay minerals. This process also helps us to evaluate
the H? ions circulation in the groundwater. Higher con-
centration of H? ions available in alluvial aquifers is
neutralized by the process of weathering and dissolution.
Further, in Lower Cuddalore, the pH decreases due to the
exchange of cations in clay/rock matrix with H? ions in
groundwater or the availability of neutralizing ions. The
groundwater from the study area mostly show the
[Ca2??Mg2?]/[HCO3-] ratios below 1 in all the forma-
tions, and only few samples in alluvium show ratios above
1. Samples with lower ratios indicate additional HCO3-
input from albite mineral weathering, rather than from
Ca2? and Mg2? production reactions alone.
The (mCa2? ? mMg2? - mSO42-) versus (mNa? ?
mK? - mCI-) relationship provides information on the
geological sources of Ca2? and Mg2? in the aquifer. To
account for meteoric Ca2? from the dissolution of evapo-
rate gypsum (CaSO4-), an amount of Ca2? equal to the
concentration of SO42- is subtracted from the sum of Ca2?
and Mg2? ions. Calculation of Na? values depletion caused
by cation exchange was done by assuming that all meteoric
Na? inputs are from Na?Cl-. Since all Cl- ions are
meteoric in origin, subtracting Cl- from the total Na?
determines the meteoric Na? contribution. There are four
fields demarcated in Fig. 6. It is to be noted that the ‘Y’ axis
crosses the ‘X’ axis at 1, i.e. the line along which
(Ca ? Mg)*/HCO3 is equal to unity. Field 1 has higher
ratio of (Na ? K)*/HCO3 and (Ca ? Mg)*/HCO3, with
Na? ? K?–Ca2? ? Mg2?–HCO3- water type. Field 2
shows the dominance of excess (Ca2??Mg2?)* and higher
Fig. 5 Relationship of (Ca ? Mg)/HCO3 ratio to pH
260 Appl Water Sci (2012) 2:253–269
123

(Na??K)*. This shows that the field has dominance of
excess (Ca2??Mg2?)* and (Na??K)*, with no significant
indications of influencing anions due to contamination. Field
3 has the dominance of excess anion Cl- over Na ? K and
higher (Ca2??Mg2?)*, which may be due to ion exchange
with Ca–Mg–Cl water type. Field 4 represents the Ca–Mg–
HCO3–Cl water type. Most of the groundwater samples in
the study area are in Field 4, representing Ca–Mg–HCO3–Cl
water type, and few of them are represented in Field 1
(Fig. 6). This suggests that weathering of silicate minerals or
saline intrusions are the significant contributors to the water
chemistry of this region.
Ionic strength
Ionic strength is a measure of total concentration of ions,
which emphasizes increased contribution of species with
charges greater than one to solution non-ideality (Dome-
nico and Schwartz 1998).
I ¼ 0:5X
m1z21
where m1 is the atomic/molecular weight and z1 is the
valance of the respective ion. Ionic strength of freshwater is
less than 0.005 (Hem 1959). In the study area, higher ionic
strength was noted in alluvium and Tertiary formations,
indicating lesser inflow of freshwater into the system. Low
ionic strength was noted in Cretaceous formation indicating
higher inflow of freshwater/recharge (Prasanna et al. 2006).
Partial pressure of carbon dioxide (pCO2)
The partial pressure of CO2 (pCO2) in rivers is commonly
out of equilibrium with the atmosphere. The log pCO2 for
each sample is determined to study its relation to recharge.
The atmospheric log pCO2 value is around -3.75 (Ray-
mahashay 1986). Water with high pCO2 of around -1.5
results due to deep circulation of groundwaters, with lesser
atmospheric interaction or due to higher saturation of car-
bonates, resulting from the interaction with the host rock of
the material through which it flows (Chidambaram et al.
2011).
In mixed water, pCO2 tends to decreases to the atmo-
spheric value and this causes increase in saturation, sug-
gesting that the mixing zone is an open system
(Raymahashay 1986). The composition of freshwater is
controlled by dissolution and precipitation processes and
by degassing of CO2. The logpCO2 values range from -2.5
to -1. The samples from Tertiary, Lower and Upper
Cuddalore Formations and few samples of alluvium show
nearly the same value (Fig. 7). Lower values of pCO2 were
noted in the alluvial and Cretaceous aquifers and also in
few Lower Cuddalore sandstone samples, indicating
recharge effect. Some samples from Cretaceous formation
show higher pCO2 value, suggesting that the additional
CO2 has been acquired from the soils during the process of
infiltration towards the zone of saturation (Prasanna et al.
2006).
Water quality
Domestic water quality
The physicochemical properties related to the salinity of
water can be appreciated by the measurements of the
following parameters: chloride concentration, electric
Fig. 6 The ratio between the
(Ca ? Mg)*/HCO3 and
(Na ? K)*/HCO3
Appl Water Sci (2012) 2:253–269 261
123

conductivity, and total dissolved solids. Desjardin (Desjar-
dins 1988) classified the typology of water according to the
TDS content. Table 4 clearly reveals that the higher repre-
sentations of the samples in alluvium, Tertiary, Cretaceous,
and mixed aquifers are noted in moderately fresh-brackish
and in slightly brackish water types. The suitability of
groundwater for irrigation purpose is mainly based upon the
estimation of parameters such as sodium absorption ratio
(SAR), Na% and residual sodium carbonate (RSC).
Sodium absorption ratio (SAR)
Salinity of groundwater and SAR determines its utility for
agricultural purposes. Salinity originates in groundwater due
to weathering of rocks and leaching from topsoil, anthro-
pogenic sources along with minor influence on climate
(Prasanna et al. 2011). The level of Na and HCO3 in irriga-
tion groundwater affects permeability of soil and drainage of
the area (Kelly 1976; Tijani 1994). SAR is an estimate of the
extent to which sodium ion present in the water would be
absorbed by the soil and is expressed as follows: SAR = Na/
(HCa ? Mg/2), where the concentrations are expressed in
equivalent per million (epm). The distribution of SAR was
plotted using Richard (1954) classification. It was found that
90 % of samples in alluvium formation fall under excellent
categories, 7 % fall in good class and the remaining 3 % fall
under the permissible category (Table 5). The samples from
mixed and Lower Cuddalore Formations fall in excellent
category; 92 % of samples in Upper Cuddalore Formation
are in excellent category and 8 % are in good category. In
Tertiary formation, 86 % of samples fall in excellent cate-
gory and 14 % under good category. In Cretaceous, 96 % of
the samples fall under excellent category and 4 in good
category.
Sodium percentage (Na%)
Na is an important cation, which in excess deteriorates the
soil structure and reduces crop yield (Srinivasamoorthy
et al. 2005). Na concentration is important in classifying
water for irrigation purposes (Wilcox 1955). As much as
45 % of samples in alluvial formation are in the doubtful
range of about (60–80) of Na %, and 10 % of samples are
unsuitable ([80) for irrigation purpose (Table 5). In Lower
Cuddalore, 15 % of the samples are in excellent and 69 %
of the samples under good category. In Upper Cuddalore,
Fig. 7 The ratio between pH
and logpCO2
Table 4 Typology of water according to their content of TDS (Desjardins 1988)
Water type Range
(ppm)
Alluvium
(n = 31) (%)
Tertiary Cretaceous
(n = 25) (%)
Mixed
(n = 5) (%)Upper Cuddalore
(n = 13) (%)
Lower Cuddalore
(n = 13) (%)
Other Tertiary
(n = 7) (%)
Freshwater \500 12.90 69.20 84.60 42.80 40 20
Moderately fresh-
brackish water
500–1,000 58 23 15.30 42.80 44 60
Slightly brackish
water
1,000–5,000 29 7.60 – 14.20 16 20
262 Appl Water Sci (2012) 2:253–269
123

Ta
ble
5S
um
mar
yo
fg
eoch
emic
alcl
assi
fica
tio
nb
yW
AT
CL
AS
Tp
rog
ram
Cat
ego
ryG
rad
eM
iC
rO
TL
CU
CA
lC
ateg
ory
Gra
de
Mi
Cr
OT
LC
UC
Al
Na%
(Wil
cox
19
55
)in
%S
AR
(Ric
har
ds
19
54)
in%
Ex
cell
ent
0–
20
0.0
24
.00
.01
5.4
30
.80
.0E
xce
llen
t0
–1
01
00
.09
6.0
85
.71
00
.09
2.3
90
.3
Go
od
20
–4
00
.03
6.0
28
.66
9.2
7.7
9.7
Go
od
10
–1
8–
4.0
14
.3–
7.7
6.5
Per
mis
sib
le4
0–
60
60
.02
8.0
28
.67
.74
6.2
35
.5F
air
18
–2
6–
––
––
3.2
Do
ub
tfu
l6
0–
80
40
.01
2.0
42
.97
.71
5.4
45
.2E
C(W
ilco
x1
95
5)
in%
Un
suit
able
[8
0–
––
––
9.7
Ex
cell
ent
\2
50
–4
.00
––
7.6
9–
RS
C(R
ich
ard
s1
95
4)
Go
od
25
0–
75
02
0.0
03
6.0
02
8.5
78
4.6
24
6.1
51
6.1
3
Go
od
\1
.25
10
01
00
85
.71
10
0.0
01
00
.00
90
.32
Per
mis
sib
le7
50
–2
,25
08
0.0
06
0.0
07
1.4
31
5.3
83
8.4
67
4.1
9
Med
ium
1.2
5–
2.5
––
14
.29
––
6.4
5D
ou
btf
ul
2,2
50
–5
,00
0–
––
–7
.69
9.6
8
Bad
[2
.5–
––
––
3.2
3In
dic
eso
fb
ase
exch
ang
e(I
BE
)S
cho
ller
(19
65
)in
%
US
GS
har
dn
ess
(Han
da
19
64)
(Na
?K
)ro
ck?
(Ca/
Mg
)g
.w2
0.0
16
.02
8.6
23
.13
8.5
19
.4
Sli
gh
tly
har
d7
5–
15
02
0.0
16
.01
4.3
30
.83
8.5
9.7
(Na
?K
)g.w
.?
(Ca/
Mg
)ro
ck8
0.0
84
.07
1.4
76
.96
1.5
80
.6
Mo
der
atel
yh
ard
15
0–
30
08
0.0
52
.08
5.7
61
.55
3.8
67
.7C
orr
osi
vit
yra
tio
(Ran
gar
ajan
and
Bal
asu
bra
man
ian
19
90
)in
%
Ver
yh
ard
[3
00
–3
2.0
–7
.77
.72
2.6
Co
rro
siv
ity
rati
o[
16
0.0
48
.05
7.1
30
.84
6.2
80
.6
Ch
lori
de
clas
sifi
cati
on
(Stu
yfz
and
19
89
)in
%C
orr
osi
vit
yra
tio
\1
40
.05
2.0
42
.96
9.2
53
.81
9.4
Ver
yfr
esh
0.1
4–
0.8
4–
––
7.7
––
Fre
sh0
.84
–4
.23
40
.05
6.0
28
.67
6.9
61
.51
9.4
Fre
shb
rack
ish
4.2
3–
8.4
62
0.0
24
.04
2.9
–3
0.8
16
.1
Bra
ckis
h8
.46
–2
8.2
04
0.0
20
.02
8.6
15
.47
.76
4.5
Mi
mix
ed,
Cr
Cre
tace
ou
s,O
TO
ther
Ter
tiar
y,
LC
Lo
wer
Cu
dd
alo
re,
UC
Up
per
Cu
dd
alo
re,
Al
allu
viu
m
Appl Water Sci (2012) 2:253–269 263
123

31 % of the samples are in excellent, 8 % in good category,
46 % in permissible and 15 % in the doubtful range. In
Other Tertiary formations, 43 % of samples are in the
doubtful range and 60 % of the samples in the permissible
range. In mixed formation, 60 % of the samples fall under
permissible range and 40 % are grouped in the doubtful
range. In Cretaceous, 24 % of the samples are in excellent
and 36 % are under good category, while 12 % of samples
are in the doubtful category. Sodium percentage is calcu-
lated against major cations and expressed in terms of SAR.
SAR values in all the major litho units range from excellent
to good category and the majority of samples fall in the
excellent category.
In Wilcox (1955) classification of electrical conductiv-
ity, 16 % of samples in alluvium fall in good category,
74 % are in the permissible range and a minor represen-
tation of 9.6 % in the doubtful category (Table 5). About
46.2 % of samples in Upper Cuddalore fall in the good
category, 38.4 % in permissible limit and only 7.6 % in
excellent category. Most of the samples fall in good to
permissible range in Other Tertiary, Lower Cuddalore,
Cretaceous and mixed formation.
Hardness
Hardness is defined as the sum of concentration of their ions
expressed in mg/L of CaCO3. Hardness increases from
metallic ions dissolved in water. Hardness is used as an
indicator of the rate of scale formation in hot water heaters
in low-pressure boilers. USGS hardness (Handa 1964)
shows four categories of hardness: soft, slightly hard,
moderately hard and very hard. Scaling and deposition
problems in air-conditioning plants are associated with the
total hardness of water. Total hardness of more than 180 mg
CaCO3/L can be treated as very hard water and can lead to
scaling problems in air-conditioning plants (Hem 1970).
The moderately hard water is represented in 68 % of the
samples and 22 % of very hard category in alluvium for-
mation (Table 5). In Upper Cuddalore, 39 % of samples
are slightly hard, 54 % fall under moderately hard and 7 %
are in the very hard category. The same trend was followed
in Lower Cuddalore. In Other Tertiary formations, 86 % of
samples are slightly hard and 14 % in the moderately hard
range. In Cretaceous, 16 % of the samples are in the
slightly hard category, 52 % in the moderately hard and
32 % in the very hard category. In mixed formation, 20 %
of samples fall under the slightly hard category and 80 %
in the moderately hard category.
Residual sodium carbonate
Water having excess of carbonate and bicarbonate cover
the alkaline earth; mainly Ca and Mg in excess of the
allowable limits affect agriculture unfavourably (Richards
1954).
RSC ¼ (CO3 þ HCO3Þ � (Ca þ Mg)
All values expressed in epm.
The tendency of alkaline earth influences the suitability
of water for irrigation purposes. Water with Ca and Mg
gets more precipitated and as a result Na in water gets
increased in the form of sodium carbonate. The variation in
RSC was drawn using (Richards 1954) good, medium and
bad categories; 90 % of the samples in alluvium fall in the
good category, 6.4 % in the medium category and 3.2 % in
the bad category (Table 5). Good category is found in all
other formations except in Other Tertiary, where 86 % are
in good and 14 % in medium category.
Index of base exchange (IBE)
Scholler (1965) proposed a measure called ‘‘index of base
exchange’’ (IBE) to describe the geochemical reactions
taking place in groundwater. There are substances which
absorb and exchange their cations with cations present in
groundwater. Those substances are called permutolites, e.g.
clay minerals like kaolinite, illite, chlorite, halloysite,
glauconite, zeolites and organic substances. Kaolinite,
illite, chlorite and halloysite are the clay minerals in which
ions are held at edges and their ionic exchange capacity is
low. This case is reverse in montmorillonite and vermic-
ulite; the exchange capacity is higher when the number of
ions held on the surface is more. Chloro-alkaline indices,
CAI1 and CAI2, are used to measure the extent of base
exchange during rock–water interaction. Where there is an
exchange of Na? and K? in groundwater with Mg2? or
Ca2? in rock/alluvium, both the indices are positive and
vice versa. All ionic concentration is expressed in epm. The
indices to base exchange indicate that there is a significant
exchange of Na ? K in groundwater into the Ca ? Mg in
rock from the matrix, whereas the reverse is more promi-
nent and the exchange of Na ? K in rock to the Ca ? Mg
in groundwater is less notable (Chidambaram 2000). More
than 60 % of samples fall in (Na ? K) groundwa-
ter ? Mg/Ca rock and few of the samples are in (Na ? K)
rock ? Mg/Ca. The Styfzands classification of chloride
shows that 19 % of samples are in the fresh range, 16 %
are under the fresh-brackish range and 65 % are brackish in
nature in alluvium (Table 5). In Lower Cuddalore, 61 % of
samples are fresh in nature, 31 % fresh-brackish and 8 %
brackish. In Other Tertiary, 28.6 % of the samples are
under fresh and 43 % of the samples are under the fresh-
brackish categories, while 29 % of the samples are
brackish in nature. In Cretaceous, 56 % of the samples are
in the fresh category, 24 % in the fresh-brackish range and
20 % in brackish nature. In mixed formation, 40 % of
264 Appl Water Sci (2012) 2:253–269
123

samples are under fresh category, 20 % in fresh-brackish
and 40 % under brackish category.
Corrosivity ratio
Corrosivity ratio is [1 in most of the samples in all for-
mations (Table 5). In alluvium, 19 % of samples fall under
corrosivity ratio \1, 54 % in Upper Cuddalore, 70 % in
Lower Cuddalore, 43 % in Other Tertiary, 52 % in Cre-
taceous and 40 % in mixed formation having the ratio\1.
Permeability index
Permeability index is an important factor, which influences
quality of irrigation water in relation to soil for develop-
ment in agriculture. Based on permeability index, (Table 6)
Doneen (1948) classified the groundwater as Class I, Class
II and Class III to find out the suitability of groundwater for
irrigation purposes. The majority of samples in all the
formations fall in Class I and Class II, indicating that the
water is moderate to good for irrigation purposes with
minor indication in poor irrigation quality.
Correlation
Correlation coefficient is commonly used to measure the
relationship between two variables. It is simply a measure
to exhibit how well one variable predicts the behaviour of
the other. Correlation analysis was performed individually
in all the formations (Table 7).
Alluvium
In alluvium, good correlation exists between Cl–Na,
HCO3–Ca, HCO3–Na, HCO3–Cl, SO4–Ca, Ca–NO3, Mg–
Na, Mg–Ca, Mg–Cl and Mg–SO4. Poor correlation exists
between SO4, PO4 and H4SiO4 with all other ions. Cl shows
good correlation with Na indicating leaching of secondary
salts; a significant correlation of HCO3 with Ca, Na and Cl
indicates chemical weathering (Table 7). Poor positive
correlation of SO4, PO4 and H4SiO4 shows the lesser pos-
sibility of anthropogenic influence into the system.
Tertiary Lower Cuddalore
Good correlation exhibits between Na–Ca, Cl–Ca, Cl–Na,
HCO3–Na, Na–SO4, NO3–Ca, NO3–Na, NO3–Cl, NO3–
HCO3, SO4–Ca, SO4–Cl, SO4–HCO3 and SO4–NO3, indi-
cating the leaching of secondary salts along with anthro-
pogenic impact. Poor correlation exists between Mg and
PO4 with other ions indicating lesser influence of magne-
sium during this season. SO4 shows good positive corre-
lation with Na, indicating the leaching of marcasite present
in this region (Sivalingam 2006). Good correlation between
HCO3, Na and H4SiO4 indicates albite weathering. H4SiO4
is well correlated with Ca and Mg, indicating intensive
weathering reaction that enhances H4SiO4. Cl shows good
correlation with Ca and Na, indicating leaching of salts.
Tertiary Upper Cuddalore
Good correlation exists between Na–Ca, Na–Mg, K–Ca,
K–Mg, K–Na, Cl–Ca, Cl–Mg, Cl–Na, Cl–K, SO4–Ca SO4–
Mg, SO4–Na, SO4–K, SO4–Cl, NO3–PO4 and SO4–Mg,
indicating the leaching of secondary salts along with
anthropogenic activities. Cl shows good correlation with Ca,
Mg, Na and K, indicating secondary leaching of salts. HCO3
is well correlated with Na, indicating weathering of sodic
feldspar from the source rock. Good to poor positive corre-
lation of HCO3, Na, K and H4SiO4 indicates albite weath-
ering from the source rock. Cl shows good correlation with
Ca, Na and K, indicating secondary leaching of salts.
Other Tertiary formations
Good correlation exists between Cl–Na, NO3–Na, NO3–Cl,
SO4–Cl and SO4–NO3, indicating the leaching of secondary
salts along with anthropogenic impact. Poor correlation
exists between Mg and PO4 with other ions indicating the
influence of agriculture input into the aquifers. Cl shows
good correlation with Ca and Na, indicating leaching of salts.
Cretaceous and mixed
Good correlation exists between Cl–Na, HCO3–Ca, HCO3–
Na, HCO3–Cl and SO4–Ca indicating the leaching of
Table 6 The permeability index of the samples
Permeability
index range
Alluvium
(n = 31) (%)
Tertiary Cretaceous
(n = 25) (%)
Mixed
(n = 5) (%)Upper Cuddalore
(n = 13) (%)
Lower Cuddalore
(n = 13) (%)
Other Tertiary
(n = 7) (%)
40–60 6.45 23.08 38.46 28.57 44 0
60–80 48.39 53.85 53.85 28.57 44 80
80–100 45.16 23.08 7.69 42.86 12 20
Appl Water Sci (2012) 2:253–269 265
123

Table 7 Correlation analysis for groundwater samples
Ca Mg Na K Cl HCO3 NO3 PO4 SO4 SiO2 pH EC
Al
Ca 1.00
Mg -0.05 1.00
Na 0.18 -0.12 1.00
K 0.41 0.24 0.12 1.00
Cl 0.33 0.06 0.92 0.19 1.00
HCO3 0.30 -0.12 0.37 0.36 0.29 1.00
NO3 -0.05 -0.17 0.08 -0.13 0.04 0.34 1.00
PO4 0.24 0.24 -0.06 0.43 -0.01 0.32 0.32 1.00
SO4 0.50 0.14 0.16 0.43 0.17 0.07 -0.03 0.39 1.00
SiO2 0.22 -0.10 -0.04 -0.19 -0.01 0.07 0.26 -0.30 -0.03 1.00
pH -0.11 0.12 0.35 0.24 0.26 0.51 0.13 0.11 0.13 0.04 1.00
EC 0.62 0.09 0.75 0.53 0.81 0.50 0.06 0.29 0.45 0.07 0.41 1.00
LC
Ca 1.00
Mg 0.36 1.00
Na 0.78 0.10 1.00
K -0.03 0.31 -0.05 1.00
Cl 0.93 0.26 0.89 -0.02 1.00
HCO3 0.45 0.34 0.73 0.05 0.49 1.00
NO3 0.78 0.30 0.90 -0.08 0.78 0.77 1.00 .
PO4 0.00 0.00 0.00 0.00 0.00 0.00 0.00 1.00
SO4 0.65 0.12 0.86 -0.03 0.79 0.71 0.77 0.00 1.00
SiO2 0.75 0.04 0.98 -0.12 0.86 0.72 0.86 0.00 0.82 1.00
pH 0.51 0.55 0.51 -0.09 0.49 0.57 0.65 0.00 0.50 0.40 1.00
EC 0.75 0.25 0.95 -0.02 0.80 0.85 0.94 0.00 0.79 0.94 0.59 1.00
Cr
Ca 1.00
Mg 0.31 1.00
Na 0.36 0.14 1.00
K 0.37 0.03 -0.01 1.00
Cl 0.45 0.30 0.95 0.06 1.00
HCO3 0.54 0.47 0.55 0.02 0.53 1.00
NO3 0.30 0.44 0.26 -0.07 0.30 0.43 1.00
PO4 0.39 0.29 0.16 0.36 0.31 0.14 -0.25 1.00
SO4 0.74 0.18 0.23 0.40 0.26 0.30 0.28 0.08 1.00
SiO2 0.29 0.00 0.48 -0.04 0.44 0.37 0.53 -0.31 0.27 1.00
pH 0.41 0.06 0.04 -0.08 -0.03 0.59 0.09 0.00 0.24 0.27 1.00
EC 0.58 0.45 0.84 0.01 0.86 0.65 0.52 0.18 0.46 0.51 0.14 1.00
Ca Mg Na K Cl HCO3 NO3 PO4 SO4 SiO2 pH EC
UC
Ca 1.00
Mg 0.13 1.00
Na 0.69 0.59 1.00
K 0.74 0.52 0.71 1.00
Cl 0.78 0.53 0.97 0.80 1.00
HCO3 0.77 0.36 0.85 0.49 0.84 1.00
NO3 0.01 -0.18 -0.16 -0.08 -0.14 -0.01 1.00
266 Appl Water Sci (2012) 2:253–269
123

secondary salts. Poor correlation exists between Na with
other ions. The same trend was found in mixed formations.
Conclusions
The cation dominance is in the following order:
Na? [ Ca2? [ Mg2? [ K? and that of anions is
Cl- [ HCO3- [ SO4
2-. The study area forms a part of the
coastal aquifer, and the higher EC extends from the
southeastern part influenced by salt water intrusion. Higher
EC is also observed in the central and western parts due to
the leaching of ions. Most of the groundwater samples
range from soft to moderately hard category. The Styfzands
classification shows that all the samples fall in fresh to
fresh-brackish category in all the aquifers. The Piper dia-
gram shows that Na–Cl is the dominant facies in all the
aquifers with few representations of Ca–HCO3 showing the
recharge. Chadda’s plot shows that saltwater intrusion and
ion exchange are more common in alluvium, which has
more representations of saltwater contaminated samples.
The ionic strength for few of the samples is almost
equivalent to freshwater. In general, the dilution effect is
evident from the low ionic strength. Lower values of pCO2
were noted in the alluvial and Cretaceous aquifers and also
in few Lower Cuddalore sandstone samples, indicating
recharge effect. TDS is higher and exceeds the standard
limits for drinking water in all the aquifers except in Upper
Cuddalore. Few groundwater samples of the study area are
unsuitable for domestic and drinking purposes.
Table 7 continued
Ca Mg Na K Cl HCO3 NO3 PO4 SO4 SiO2 pH EC
PO4 0.27 0.33 0.55 0.28 0.47 0.35 -0.36 1.00
SO4 0.75 0.55 0.64 0.78 0.70 0.59 -0.18 0.14 1.00
SiO2 0.03 -0.27 0.06 -0.33 0.05 0.40 0.36 -0.15 -0.31 1.00
pH 0.26 0.07 0.34 -0.18 0.24 0.60 0.01 0.34 0.22 0.32 1.00
EC 0.80 0.55 0.97 0.78 0.98 0.86 -0.21 0.55 0.73 -0.03 0.34 1.00
OT
Ca 1.00
Mg -0.16 1.00
Na 0.32 -0.02 1.00
K 0.10 0.05 -0.68 1.00
Cl 0.41 0.24 0.93 -0.69 1.00
HCO3 0.03 -0.66 -0.08 0.31 -0.36 1.00
NO3 0.29 -0.41 0.76 -0.81 0.67 0.17 1.00
PO4 -0.28 0.39 -0.38 0.76 -0.43 0.08 -0.83 1.00
SO4 0.07 -0.09 0.87 -0.81 0.81 -0.05 0.80 -0.54 1.00
SiO2 -0.03 -0.29 0.81 -0.83 0.65 -0.04 0.81 -0.53 0.73 1.00
pH -0.58 -0.04 0.18 0.07 -0.10 0.31 -0.14 0.57 0.08 0.30 1.00
EC 0.30 0.17 0.90 -0.71 0.91 -0.10 0.78 -0.46 0.79 0.71 0.02 1.00
Mi
Ca 1.00
Mg -0.11 1.00
Na 0.38 0.41 1.00
K 0.30 0.89 0.53 1.00
Cl 0.55 0.42 0.95 0.57 1.00
HCO3 0.59 0.46 0.83 0.75 0.79 1.00
NO3 0.45 0.72 0.22 0.80 0.44 0.40 1.00
PO4 0.00 0.00 0.00 0.00 0.00 0.00 0.00 1.00
SO4 0.44 0.04 0.93 0.20 0.87 0.69 -0.06 0.00 1.00
SiO2 -0.37 0.70 0.52 0.40 0.51 0.13 0.30 0.00 0.31 1.00
pH -0.67 0.45 -0.08 0.01 -0.04 -0.46 0.15 0.00 -0.23 0.80 1.00
EC 0.28 0.86 0.77 0.94 0.78 0.82 0.68 0.00 0.49 0.59 0.09 1.00
Al alluvium, UC Upper Cuddalore, LC Lower Cuddalore, OT Other Tertiary, Cr Cretaceous, Mi mixed
Appl Water Sci (2012) 2:253–269 267
123
Open Access This article is distributed under the terms of the
Creative Commons Attribution License which permits any use, dis-
tribution, and reproduction in any medium, provided the original
author(s) and the source are credited.
References
Agarwal V, Jagetia MM (1997) Hydrogeochemical assessment of
groundwater quality in Udaipur City, Rajasthan, India. In:
Proceedings of national conference on ‘‘Dimensions of Envi-
ronmental stress in India’’, Department of Geology, MS
University, Baroda, pp 151–154
APHA (1998) Standard methods for the examination of water and
wastewater, 19th edn. APHA, Washington, DC
Appelo CA, Postma D (1999) Geochemistry, groundwater and
pollution. Balkema, Rotterdam
Back W (1960) Origin of hydrochemical facies of groundwater in the
Atlantic Coastal plain. In: 21st international geological congress,
Copenhagen 1960, Rept pt. 1, pp 87–95
CGWB (1993) Ground water resources and development prospects in
Pondicherry region, Union Territory of Pondicherry
Chadha DK (1999) A proposed new diagram for geochemical
classification of natural waters and interpretation of chemical
data. Hydrogeol J 7(5):431–439
Chidambaram S (2000) Hydrogeochemical studies of groundwater in
Periyar District, Tamilnadu, India. Ph.D. Thesis, Annamalai
University
Chidambaram S, Prasanna MV, Karmegam U, Singaraja C, Petha-
perumal S, Manivannan R, Anandhan P, Tirumalesh (2011)
Significance of pCO2 values in determining carbonate chemistry
in groundwater of Pondicherry region, India. Front Earth Sci
5(2):197–206
Dasgupta AM, Purohit KM (2001) Status of surface and groundwater
quality of Mandiakadar—part II: agricultural utilities. Pollut Res
20(2):219–225
Desjardins R (1988) Le traitement des eaux. Edition II revue. Edition
de l’Ecole Polytechnique de Montreal, Montreal
Domenico PA, Schwartz W (1998) Physical and chemical hydroge-
ology, 2nd edn. Wiley, New York, p 506
Doneen LD (1948) The quality of irrigation water, vol 4. California
Agriculture Dept, pp 6–14.
Drever JI (1988) The geochemistry of natural waters, 2nd edn.
Prentice-Hall, New York
Durvey VS, Sharma LL, Saini VP, Sharma BK (1997) Handbook on
the methodology of water quality assessment. Rajasthan Agri-
cultural University, India
Freeze AR, Cherry JA (1979) Groundwater. Prentice-Hall Inc,
Englewood cliffs, p 604
Ghabayen MS, McKee Mac, Kemblowski Mariush (2006) Ionic and
isotopic ratios for identification of salinity sources and missing
data in the Gaza aquifer. J Hydrol 318:360–373
Handa BK (1964) Modified classification procedure for rating
irrigation waters. Soil Sci 98(2):264–269
Hardie LA, Eugster HP (1978) The evolution of closed-basin brines.
Min Soc Am Spec Publ 3:273–290
Hem JD (1959) Geochemistry of water calculation and use of ion
activity. USGS water supply, 1935 C
Hem JD (1970) Study and interpretation of the chemical character-
istics of natural water, 2nd edn. USGS Water Supply, 1473,
p 363
Hem JD (1991) Study and interpretation of the chemical character-
istics of natural waters, 3rd edn, Book 2254. Scientific Publish-
ers, Jodhpur
Holden WS (1971) Water treatment and examination. Churchill, London
Hussain I, Hussain J, Dhinsa SS (2005) Groundwater quality variation
in Bhilwara District, Rajasthan. Pollut Res 24(3):723–725
ISI (1983) Indian standard specification for drinking water. IS: 10500.
Indian Standard Institute, India
Jankowski J, Jacobson G (1989) Hydrochemical evolution of regional
groundwaters to playa brines in Central Australia. J Hydrol 108:
123–173
Karanth KR (1997) Groundwater assessment, development and
management. Tata McGraw-Hill, New Delhi
Karmegam U, Chidambaram S, Sasidhar P, Manivannan R,
Manikandan S, Anandhan P (2010) Geochemical characteriza-
tion of groundwaters of shallow coastal aquifer in and around
Kalpakkam, South India. Res J Environ Earth Sci 2(4):170–
177
Kelly WE (1976) Geoelectric sounding for delineating groundwater
contamination. Ground Water 14(1):6–11
Khurshid SH, Hasan N, Zaheeruddin (2002) Water quality status and
environmental hazards in parts of Yamuna–Karwan sub-basin of
Aligarh–Mathura District, Uttar Pradesh, India. J Appl Hydrol
14(4):30–37
Krumbein WC, Sloss LL (1963) Stratigraphy and sedimentation, 2nd
edn. Freeman, San Francisco
Kumar M, Ramanathan AL, Rao MS, Kumar B (2006) Identification
and evaluation of hydrogeochemical process in the groundwater
environment of Delhi, India. Environ Geol 50:1025–1039
Majumdar D, Gupta N (2000) Nitrate pollution of groundwater and
associated human health disorders, India. J Environ Health
42(1):28–39
Metcafe, Eddy (2000) Integrated aquifer management plan: final
report. Gaza Coastal Aquifer Management Program, USAID
Contract No. 294-C-00-99-00038-00
Niranjan Babu P, Subba Rao N, Chandra Rao P, Prakesh Rao J (1997)
Groundwater quality and its importance in the land develop-
mental programmes, India. J Geol 69(4):305–312
Pethaperumal S (2010) Study on groundwater chemistry in the
Pondicherry region. Ph.D. thesis, Annamalai University, India
Piper AM (1953) A graphic procedure I the geo-chemical interpre-
tation of water analysis, USGS Groundwater Note no, 12
Prasanna MV, Chidambaram S, Srinivasamoorthy K, Anandhan P,
John Peter A (2006) A study on hydrogeochemisty along the
groundwater flow path is different litho units in Gadilam river
basin, Tamilnadu (India). J Ultra Chem 2:2157–17210
Prasanna MV, Chidambaram S, Shahul Hameed A, Srinivasamoorthy
K (2010) Study of evaluation of groundwater in Gadilam basin
using hydrogeochemical and isotope data. Environ Monit Assess
168:63–90
Prasanna MV, Chidambaram S, Gireesh TV, Jabir Ali TV (2011) A
study on hydrochemical characteristics of surface and sub-
surface water in and around Perumal Lake, Cuddalore District,
Tamil Nadu, South India. Environ Earth Sci 64(5):1419–
1431
Pulle JS, Khan AM, Ambore NE, Kadam DD, Pawar SK (2005)
Assessment of groundwater quality of Nanded City. Pollut Res
24(3):657–660
Rangarajan R, Balasubramanian A (1990) Corrosion and scale
formation characteristic of ground water in and around Nangav-
alli, Salem district, Tamilnadu. J Appl Hydrol 2:15–22
Raymahashay BC (1986) Geochemistry of bicarbonate in river water.
J Geol Soc India 27:114–118
Richards LA (1954) Diagnosis and improvement of saline and alkali
soils agriculture handbook 60. Department of Agricultural,
Washington, DC, p 160
Scholler H (1965) Hydrodynamic Dam Lekar Collogue Doboronik 1,
pp 3–20
Shipovalov GV (1984) Altitudinal hydrochemical zonations of
groundwaters. Water Resour:261–265
268 Appl Water Sci (2012) 2:253–269
123

Sivalingam C (2006) Geochemistry of marcasite associated of
Neyveli area, Tamil Nadu, South India. Ph.D., Published thesis,
Annamalai University
Srinivasamoorthy K, Chidambaram S, Anandhan P, Vasudevan S
(2005) Application of statistical analysis of the hydrogeochem-
ical study of groundwater in hard rock terrain, Salem District,
Tamilnadu. J Geochem 20:181–190
Stumm W, Morgan JJ (1996) Aquatic chemistry. Wiley Interscience,
New York, pp 349–424
Stuyfzand PJ (1989) Non point sources of trace elements in potable
groundwater in the Netherlands. In: Proceedings 18th TWSA
water workings. Testing and Research Institute, KIWA
Stuyfzand PJ (1992) Behaviour of major and trace constituents in
fresh and salt intrusion waters, in the western Netherlands. In:
Custodio E (ed) Study and modelling of salt water intrusion into
aquifers. In: Proceedings of the 12th salt water intrusion
meeting, Barcelona. CIHS-CIMNE, Barcelona, pp 143–160
Stuyfzand PJ (1993) Hydrochemistry and hydrology of the coastal
dune area of the Western Netherlands. Ph.D. Free University of
Amsterdam. Kiwa Ltd, Research and Consultancy, Nieuwegein.
IBSN 90-74741-01-0
Stuyfzand PJ (1999) Patterns in groundwater chemistry resulting from
groundwater flow. Hydrol J 7:15–27
Subba Rao N (2006) Seasonal variation of groundwater quality in a
part of Guntur district, Andhra Pradesh, India. Environ Geol
49:413–429
Subba Rao N, Srinivasa Rao G, Venkateswara Rao S, Madhusudhana
Reddy P, John Devadas D (1999) Environmental control of
groundwater quality in a tribal region of Andhra Pradesh, India.
J Geol 71(4):299–304
Sujatha D, Reddy RB (2003) Quality characterization of groundwater
in the south-eastern part of the Ranja Reddy District, Andhra
Pradesh, India. Environ Geol 44(5):579–586
Sunitha V, Sudarsha V, Rajeswara Reddy B (2005) Hydrogeochem-
istry of groundwater, Gooty area, Anantapur District, Andhra
Pradesh, India. Pollut Res 24(1):217–224
Thorne DW, Peterson HB (1954) Irrigated soils. Constable and
Company, London
Tijani J (1994) Hydrochemical assessment of groundwater in Moro
area, Kwara state, Nigeria. Environ Geol 24:194–202
Todd DK (1980) Groundwater hydrology. Wiley, New York
US Salinity Laboratory Staff (1954) Diagnosis and improvement of
saline and alkali soils. US Department of Agricultural soils. US
Department of Agricultural Hand Book 60, Washington
Vandenbohede A, Courtens C, William de Breuck L (2010) Fresh–
salt water distribution in the central Belgian coastal plain: an
update. Geol Belg 11(3):163–172
Vengosh A, Ben-Zvi A (1994) Formation of a salt plume in the
coastal plain aquifer of Israel: the Be’er Toviyya region.
J Hydrol 160:21–52
Vengosh A, Rosenthal E (1994) Saline groundwater in Israel: its
bearing on the water crisis in the country. J Hydrol 156:389–430
Vengosh A, Heumann KG, Juraski S, Kasher R (1994) Boron isotope
application for tracing sources of contamination in groundwater.
Environ Sci Technol 28(11):1968–1974
Vengosh A, Gill J, Davisson ML, Hudson GB (2002) A multiisotope
(B, Sr, O, H, and C) and age dating study of groundwater from
Salinas Valley, California: hydrochemistry, dynamics, and
contamination process. Water Resour Res 38(1):1–17
Versluys J (1931) Subterranean water conditions in the coastal
regions of the Netherlands. Econ Geol 26:65–95
Walton WC (1970) Groundwater resources evaluation. McGraw Hill
Book Co., New York
WHO (1984) Guidelines for drinking water quality. World Health
Organization, Geneva
Wilcox LV (1955) Classification and use of irrigation water. US
Department of Agriculture, Washington, p 969
Wilcox LV (1984) The quality of water for irrigation uses.
US Department of Agricultural Technical Bulletin 1962,
Washington
Zaporozec A (1972) Graphical interpretation of water quality data.
Ground Water 10(2):32–43
Appl Water Sci (2012) 2:253–269 269
123